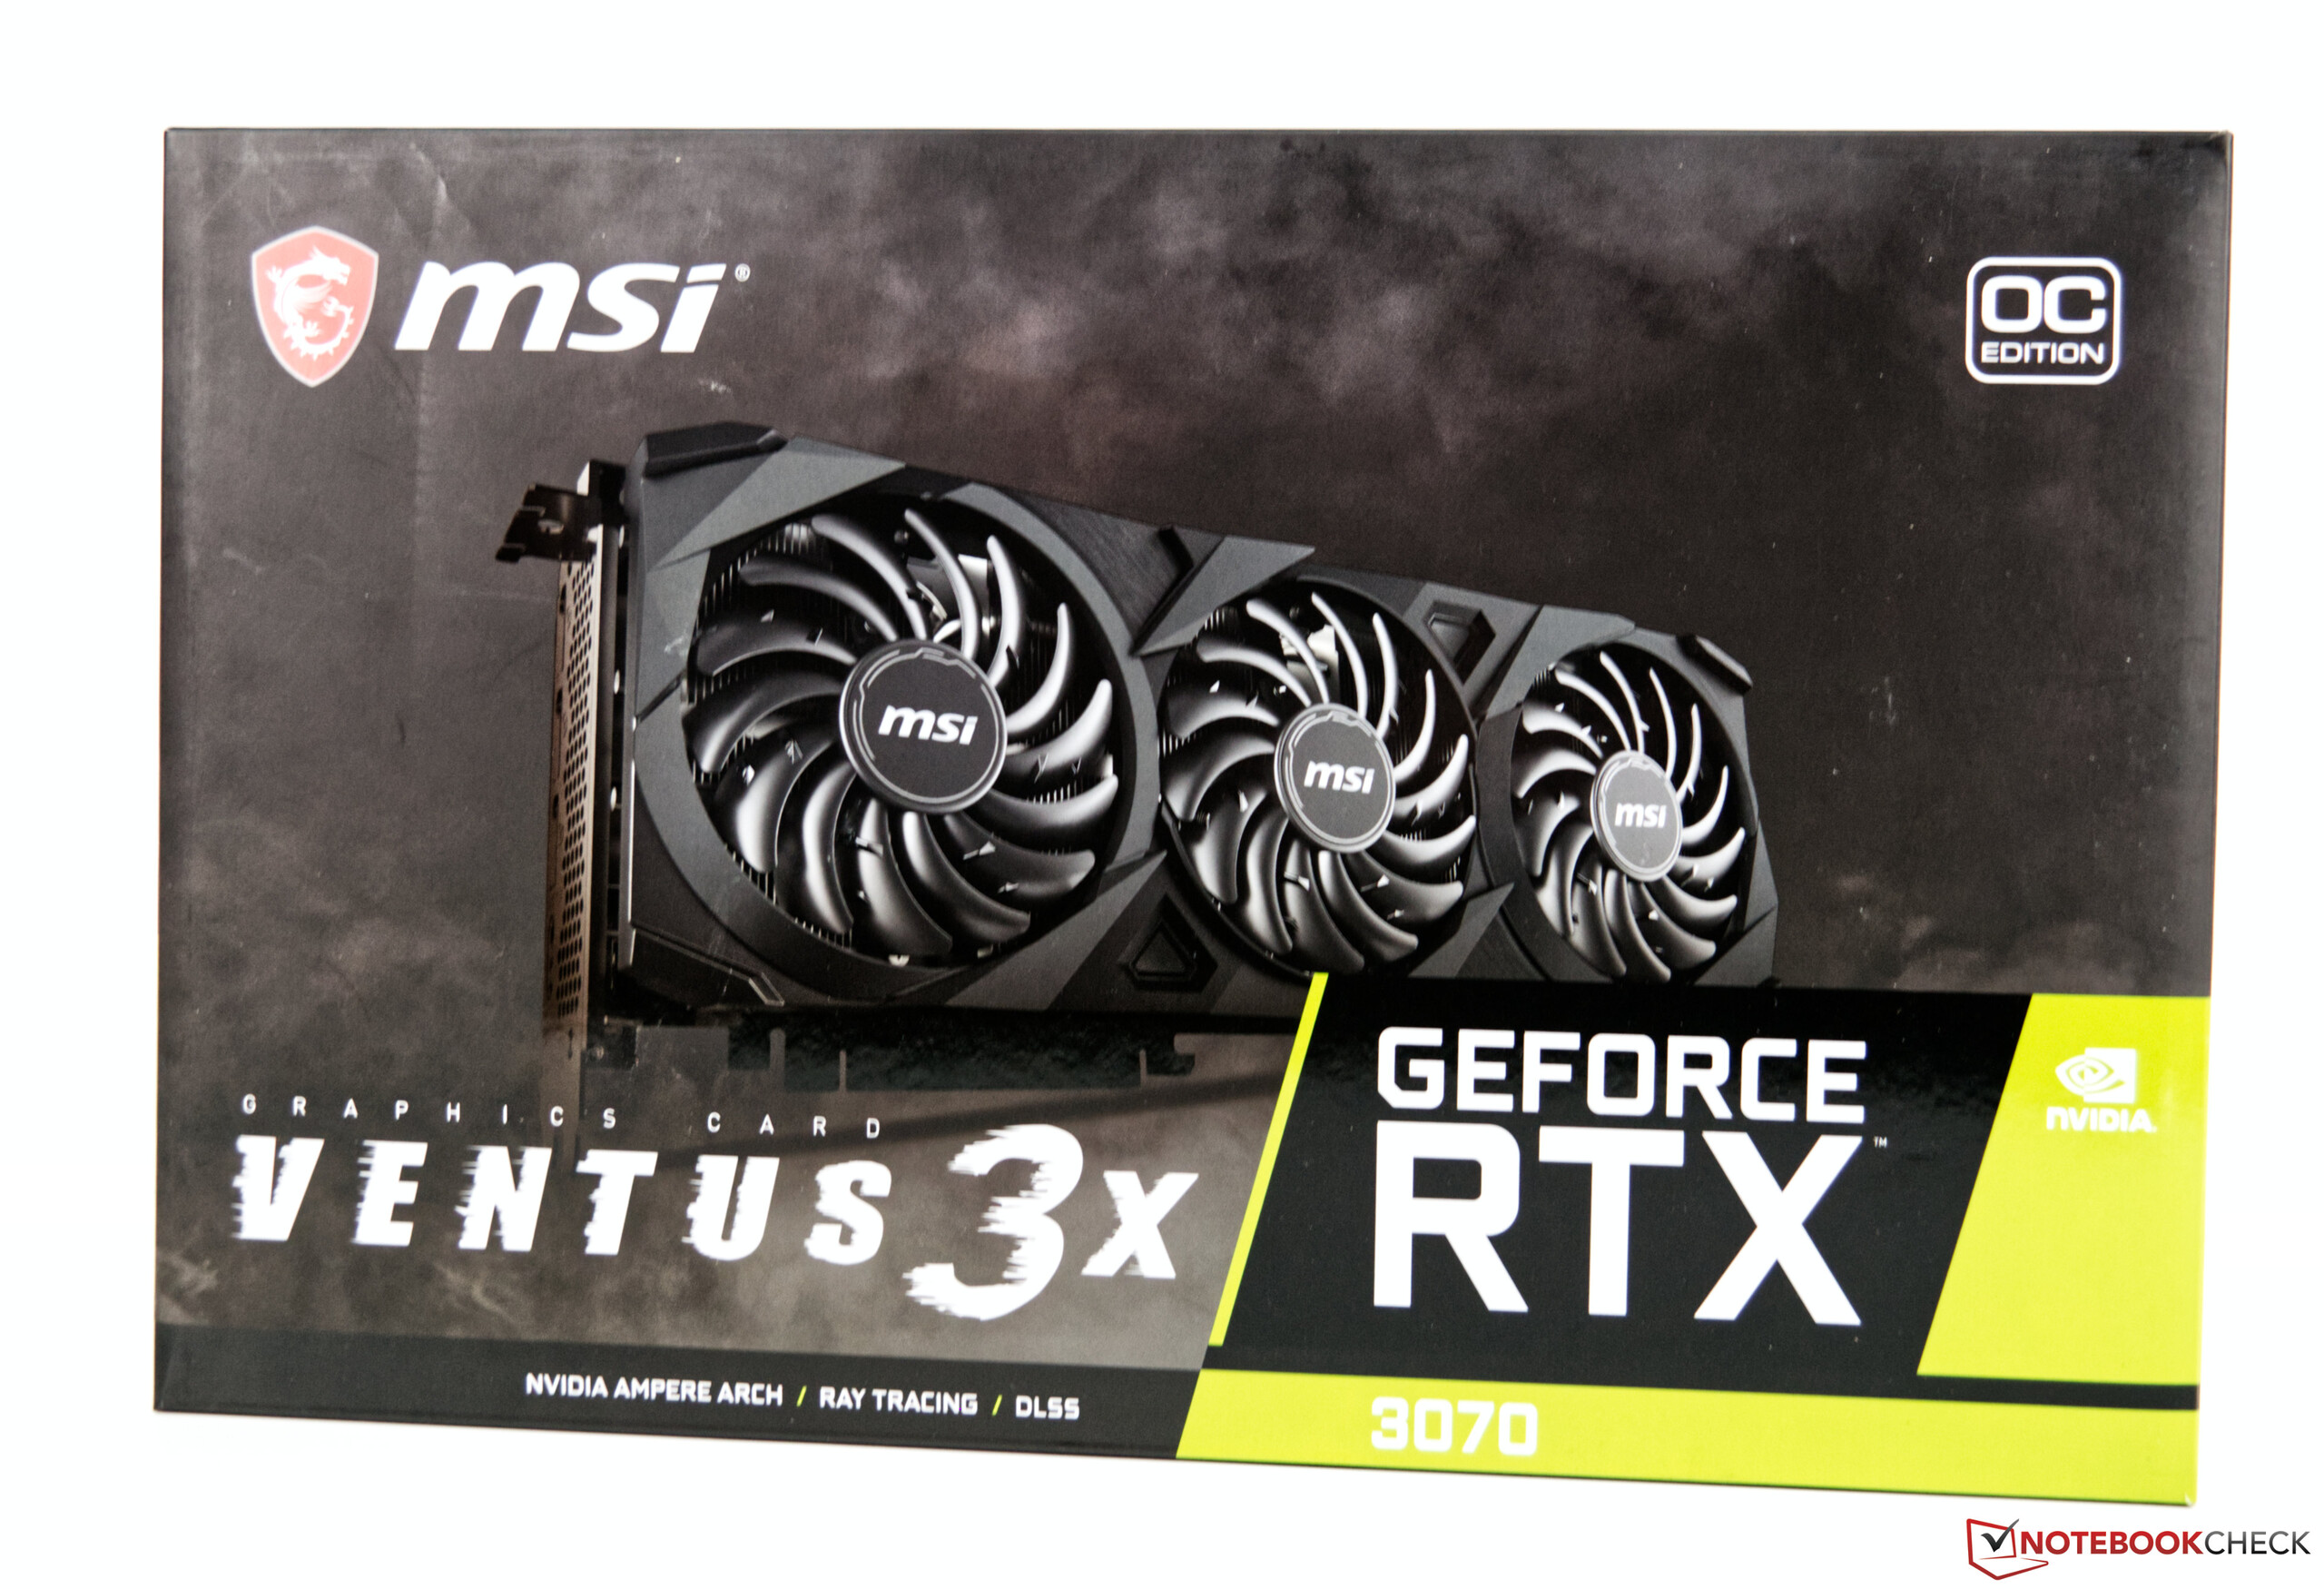
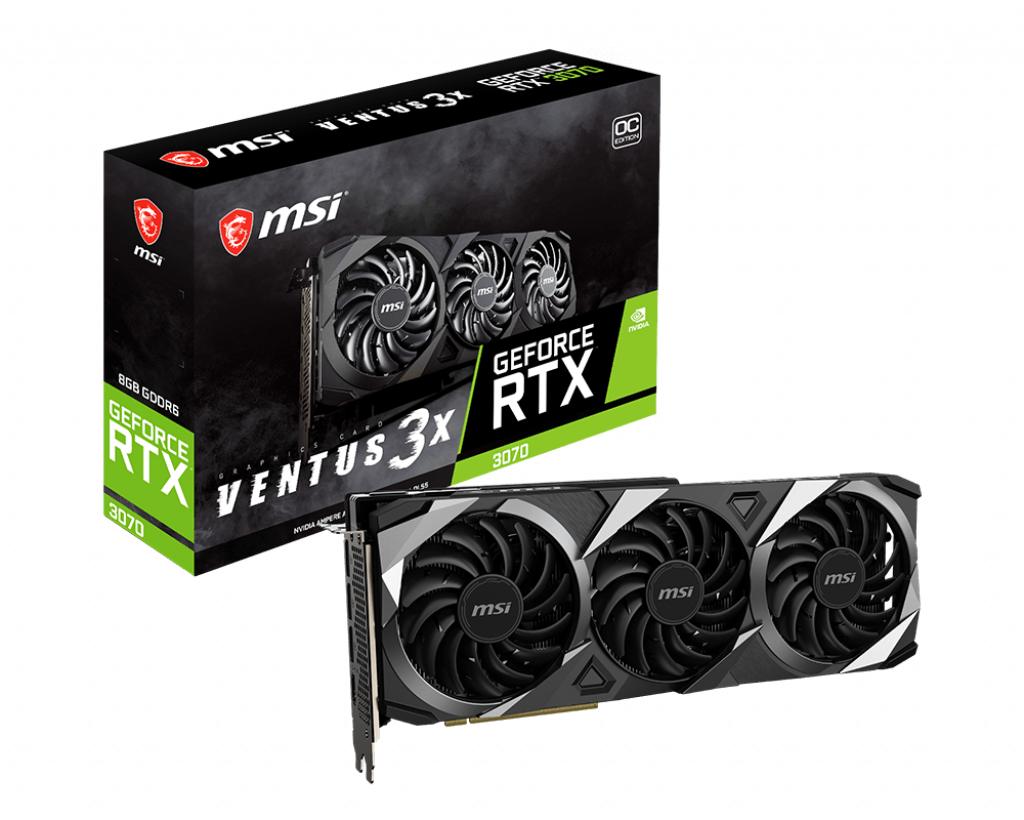
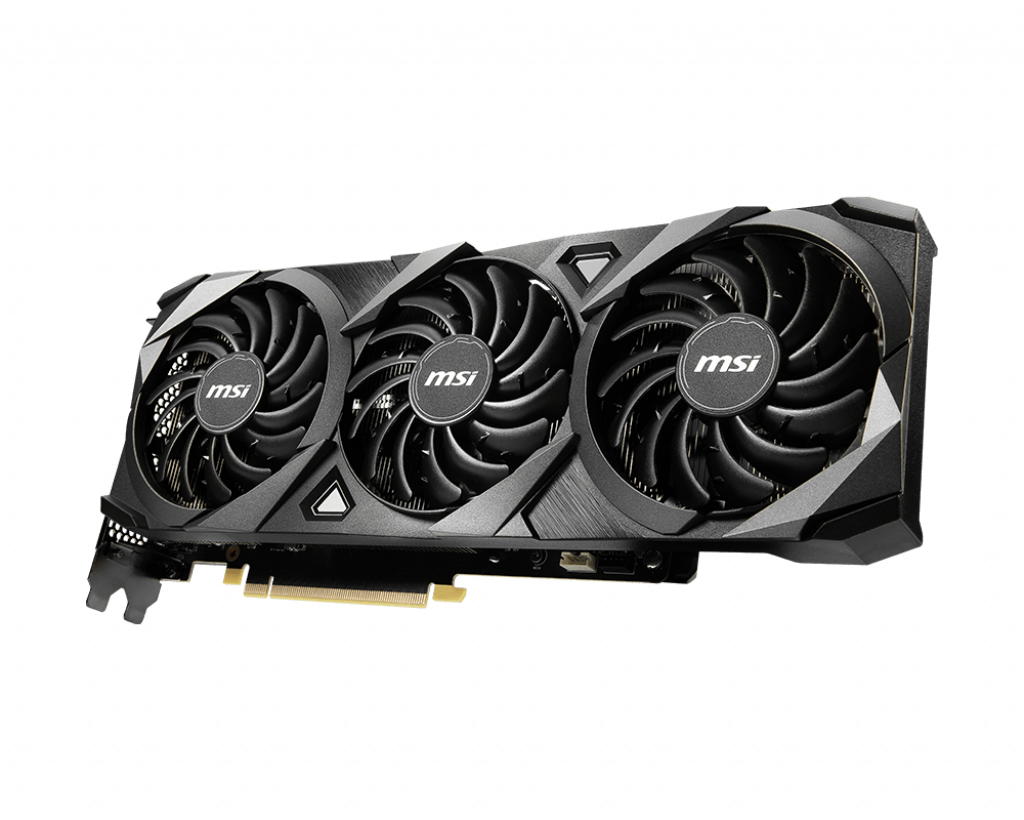
MSI GeForce RTX 3070 Ventus 3X OC desktop graphics card in review


We have already tested the new RTX 3000 graphics cards extensively. However, with the MSI GeForce RTX 3070 Ventus 3X OC, we now had a comparatively inexpensive representative of the new Ampere series in our test. With an MSRP of only 529 Euros (~$642), the custom model is not much more expensive than Nvidia's reference model (499 Euros/~$606). However, the tense situation on the market still ensures a very low availability and thus also drives the purchase price extremely high, so that prices starting at 800 Euros (~$971) are called for stock models at the time of testing. This is a very frustrating situation if you currently want to buy a new gaming system to play new blockbusters like Cyberpunk 2077
.
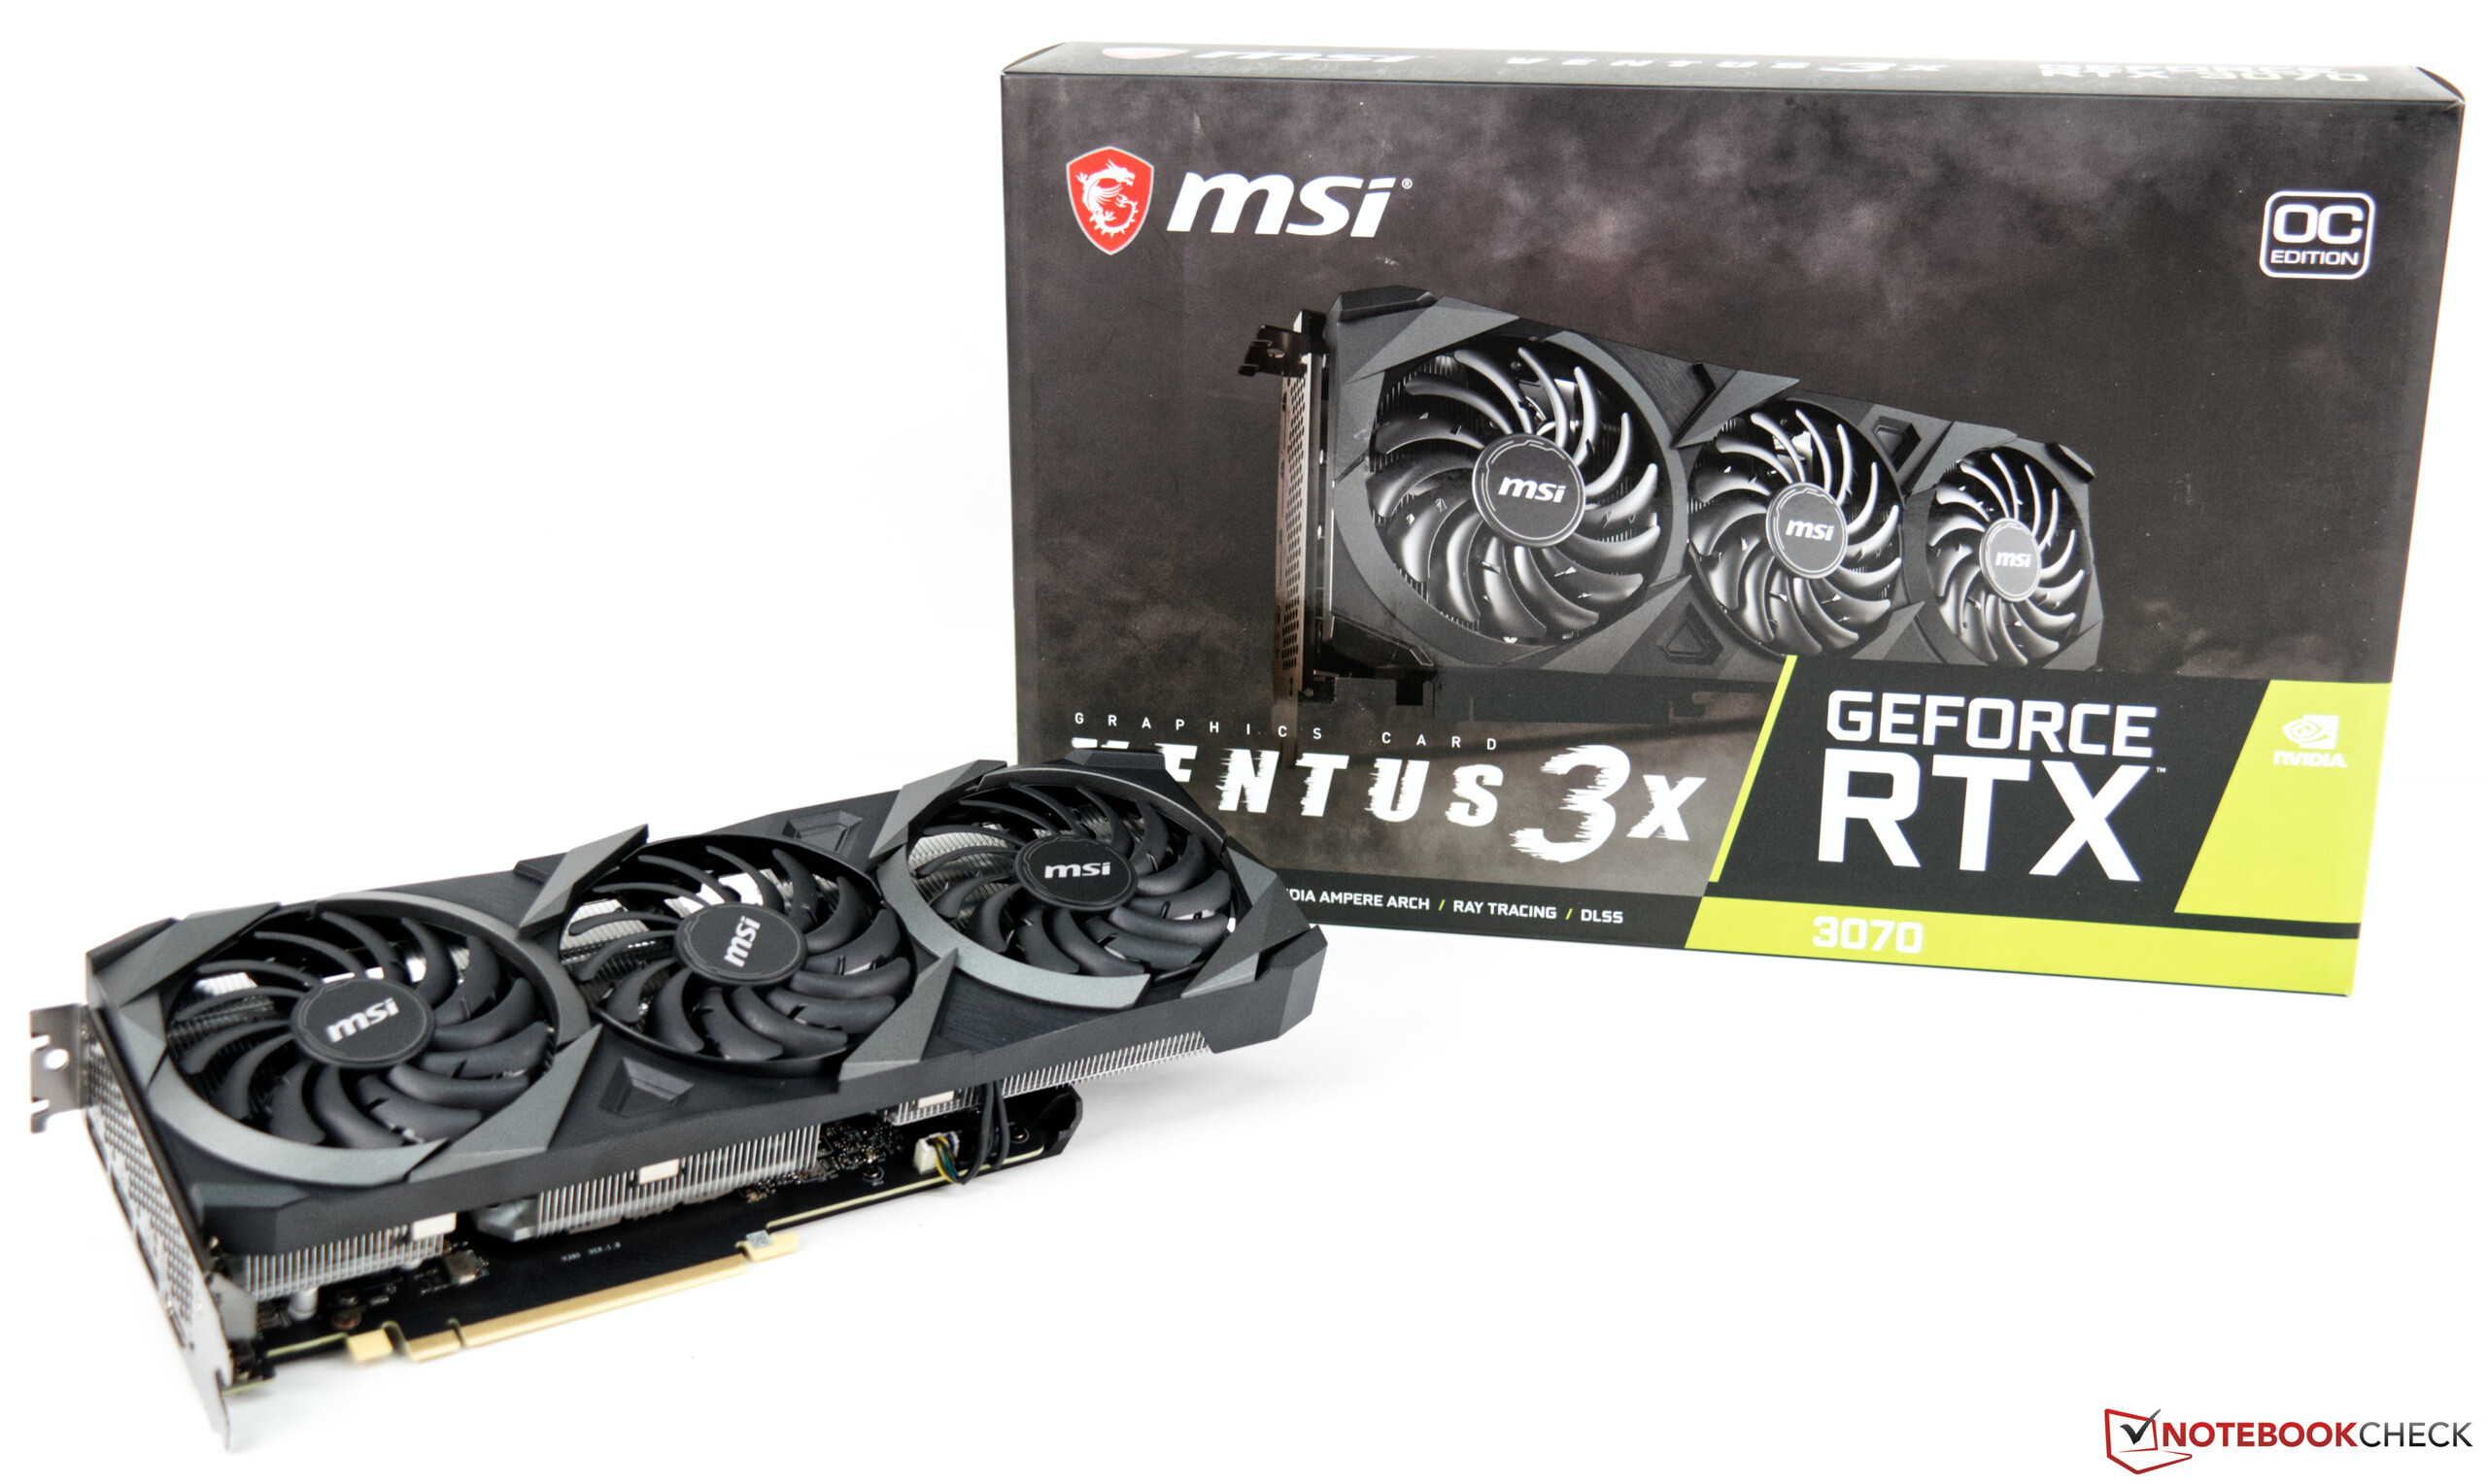
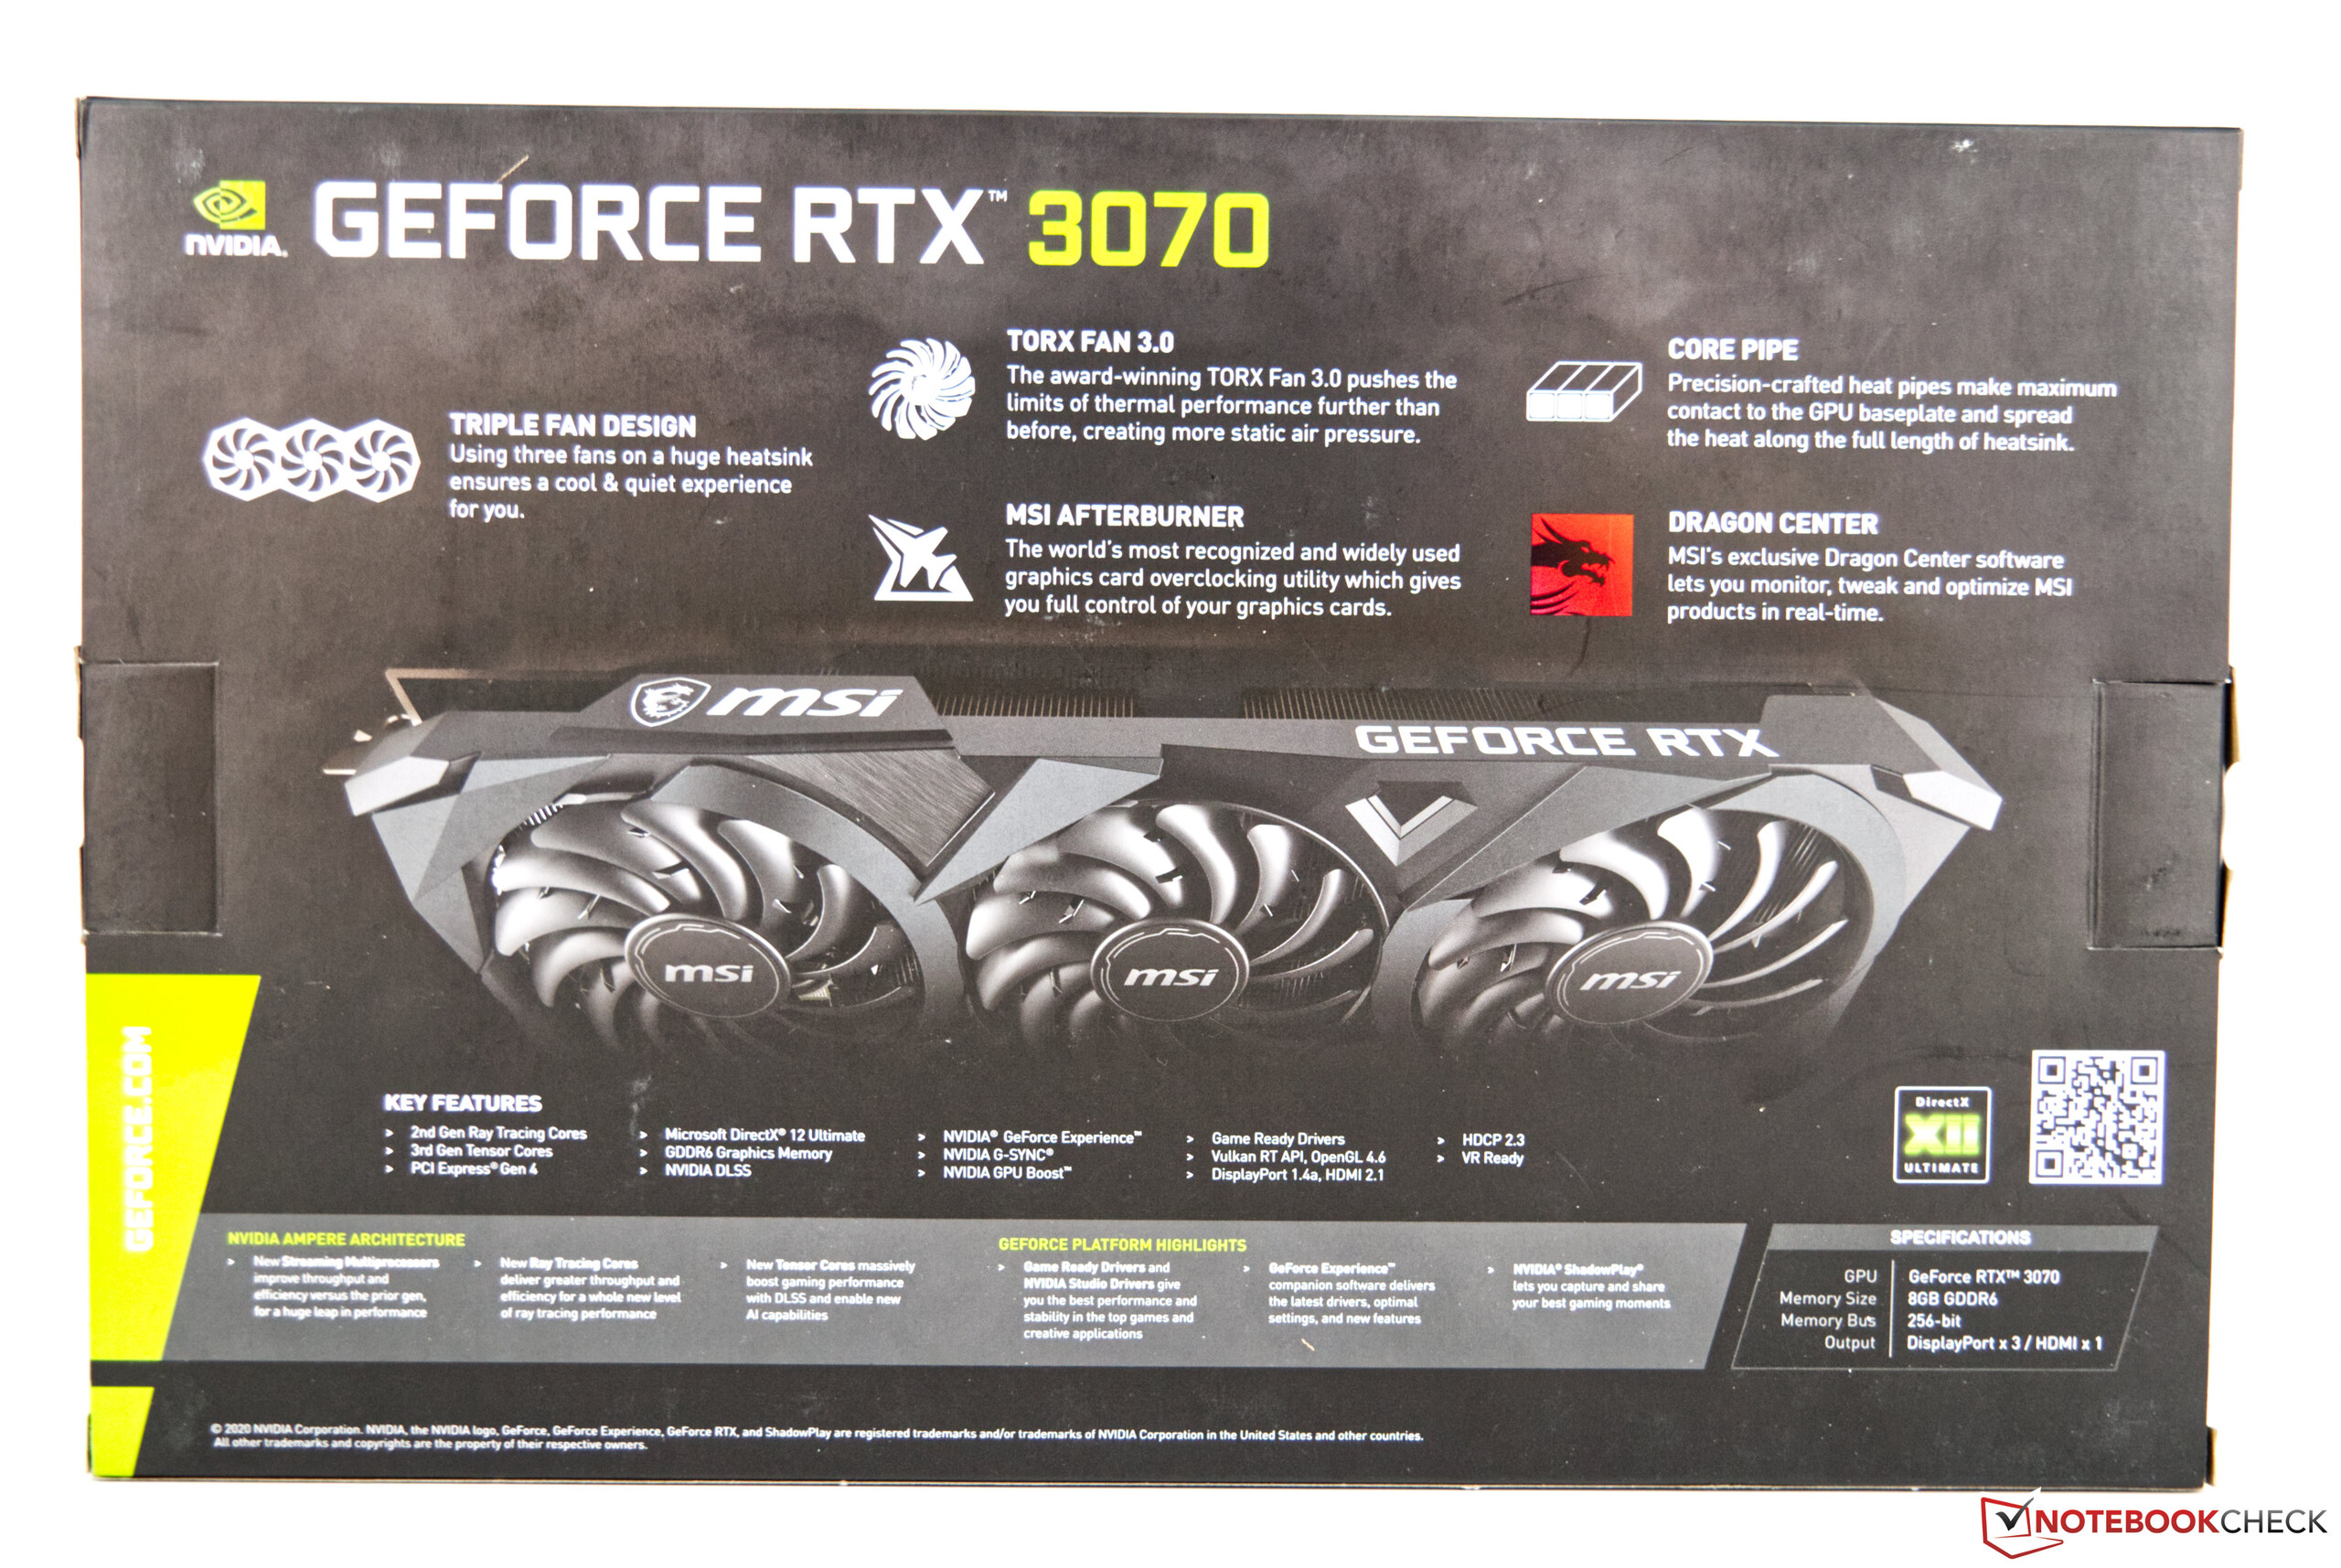
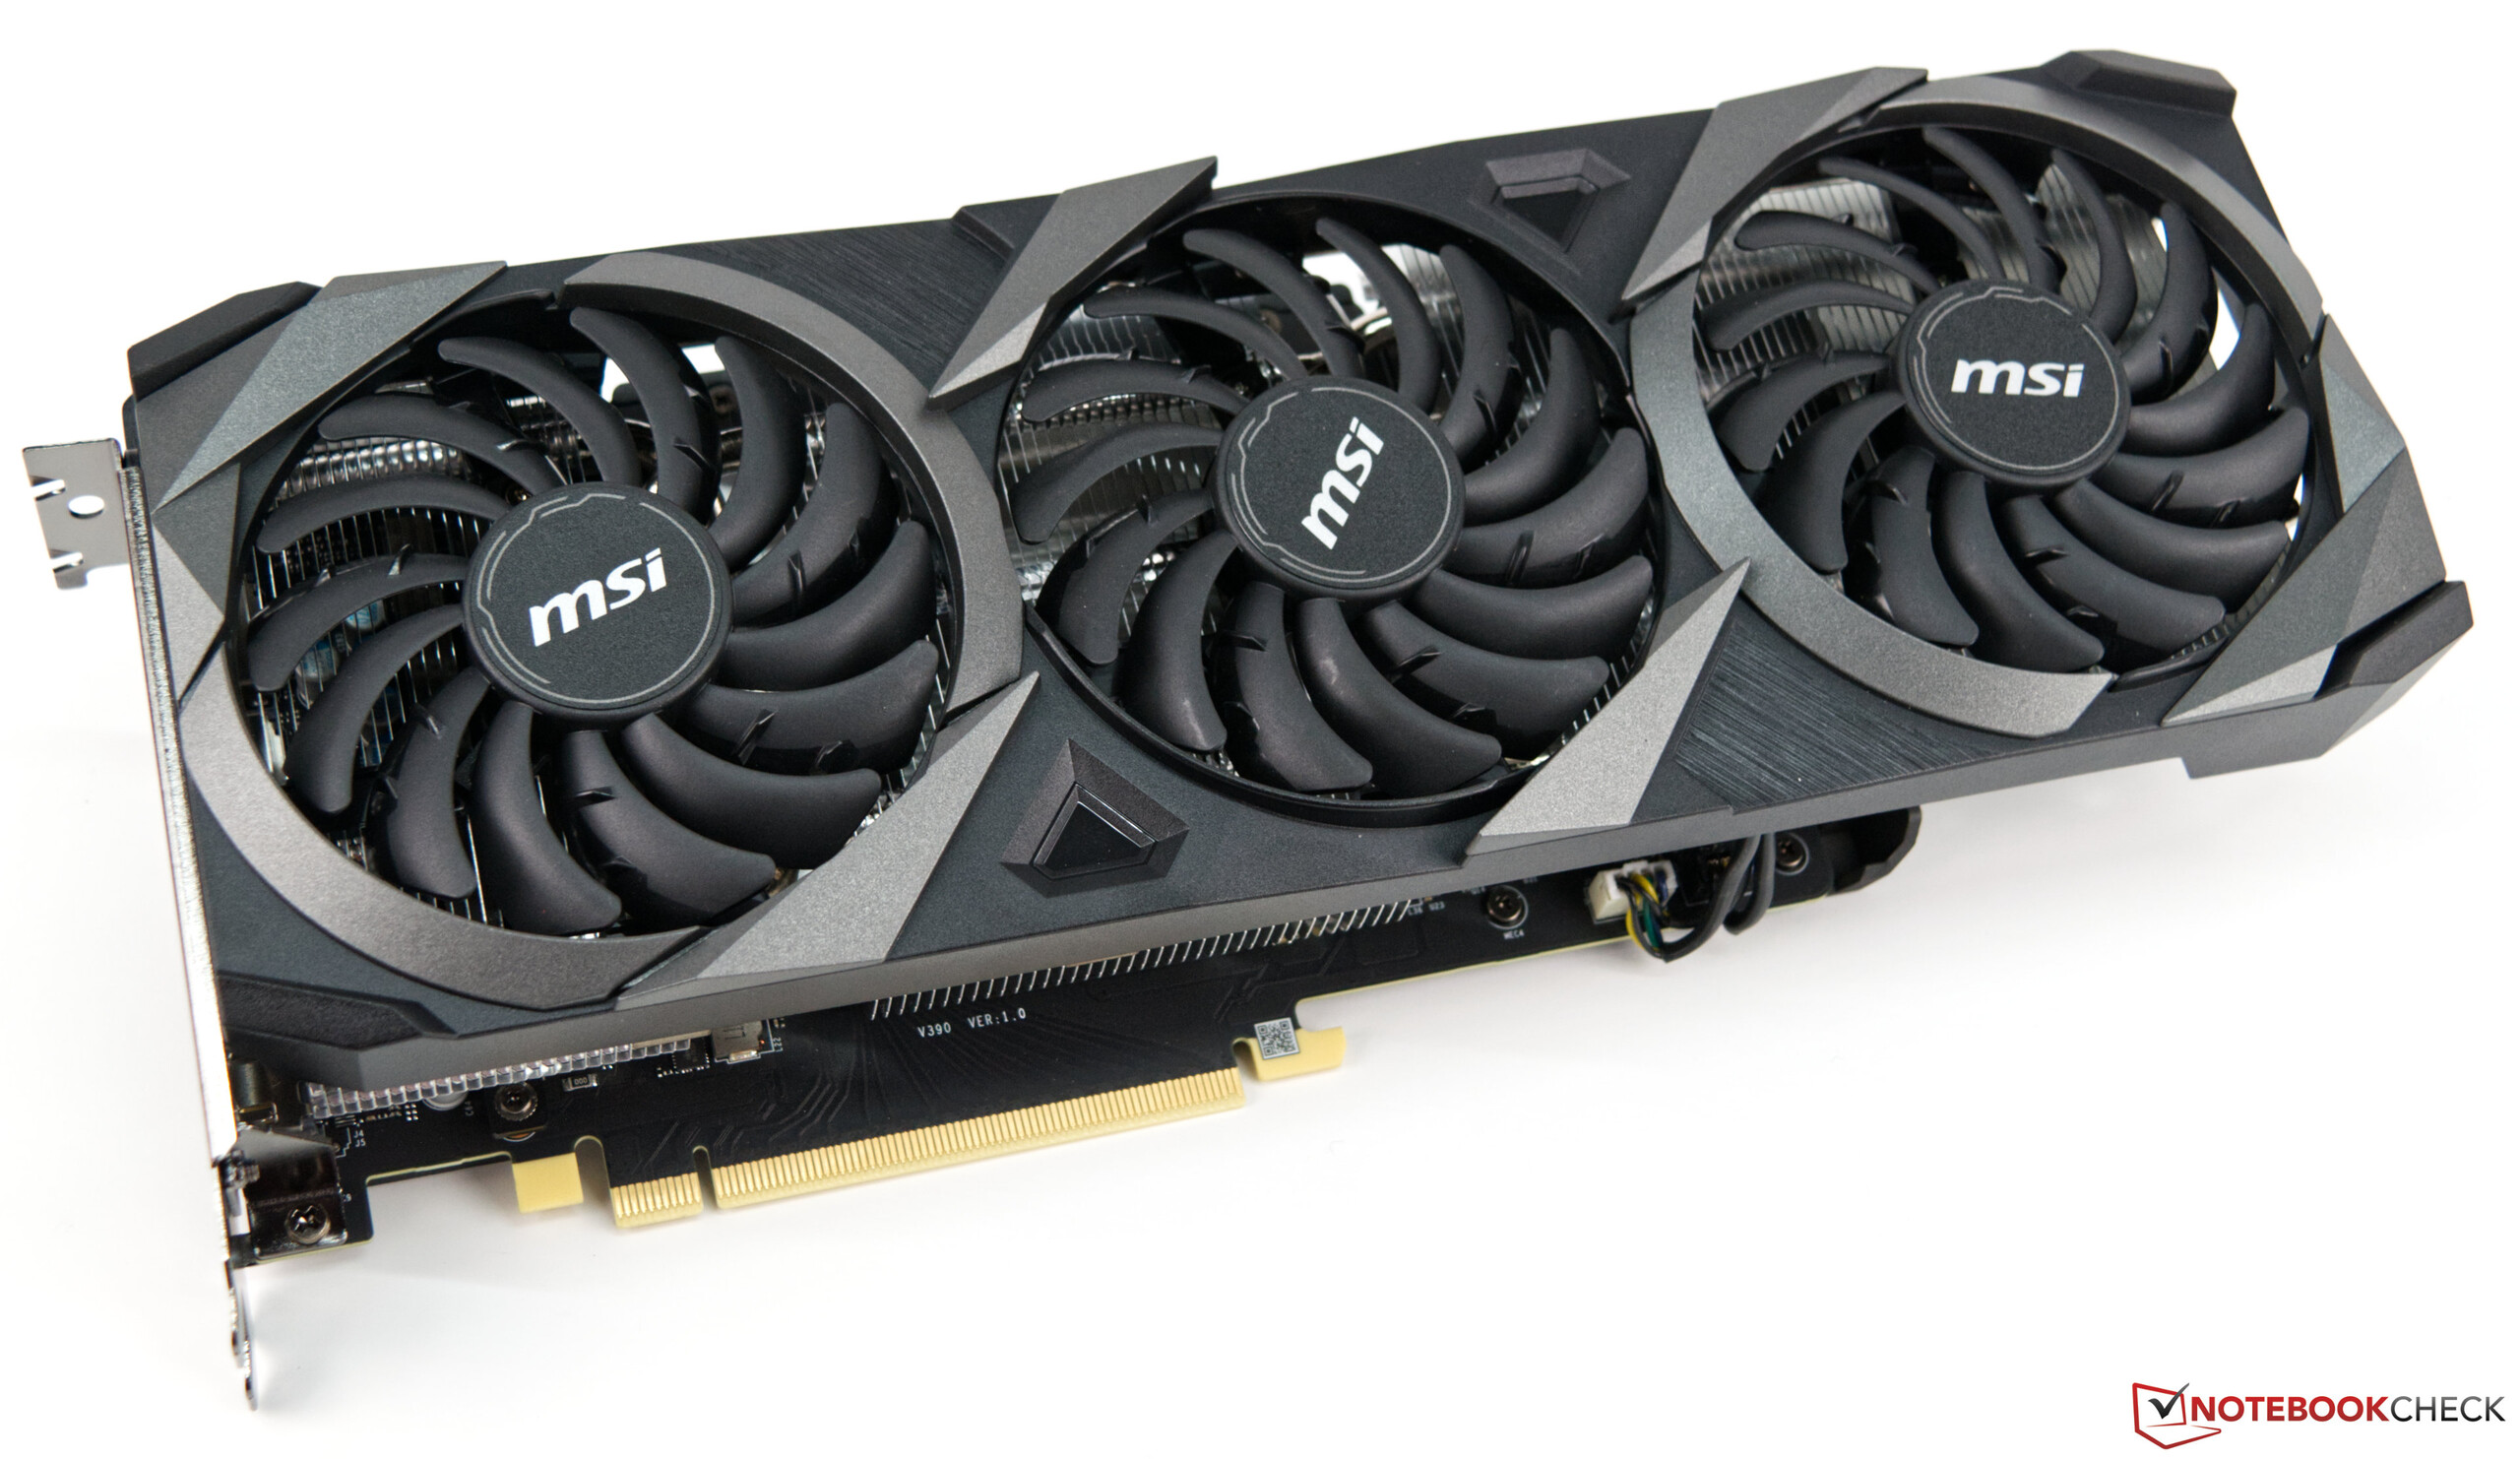
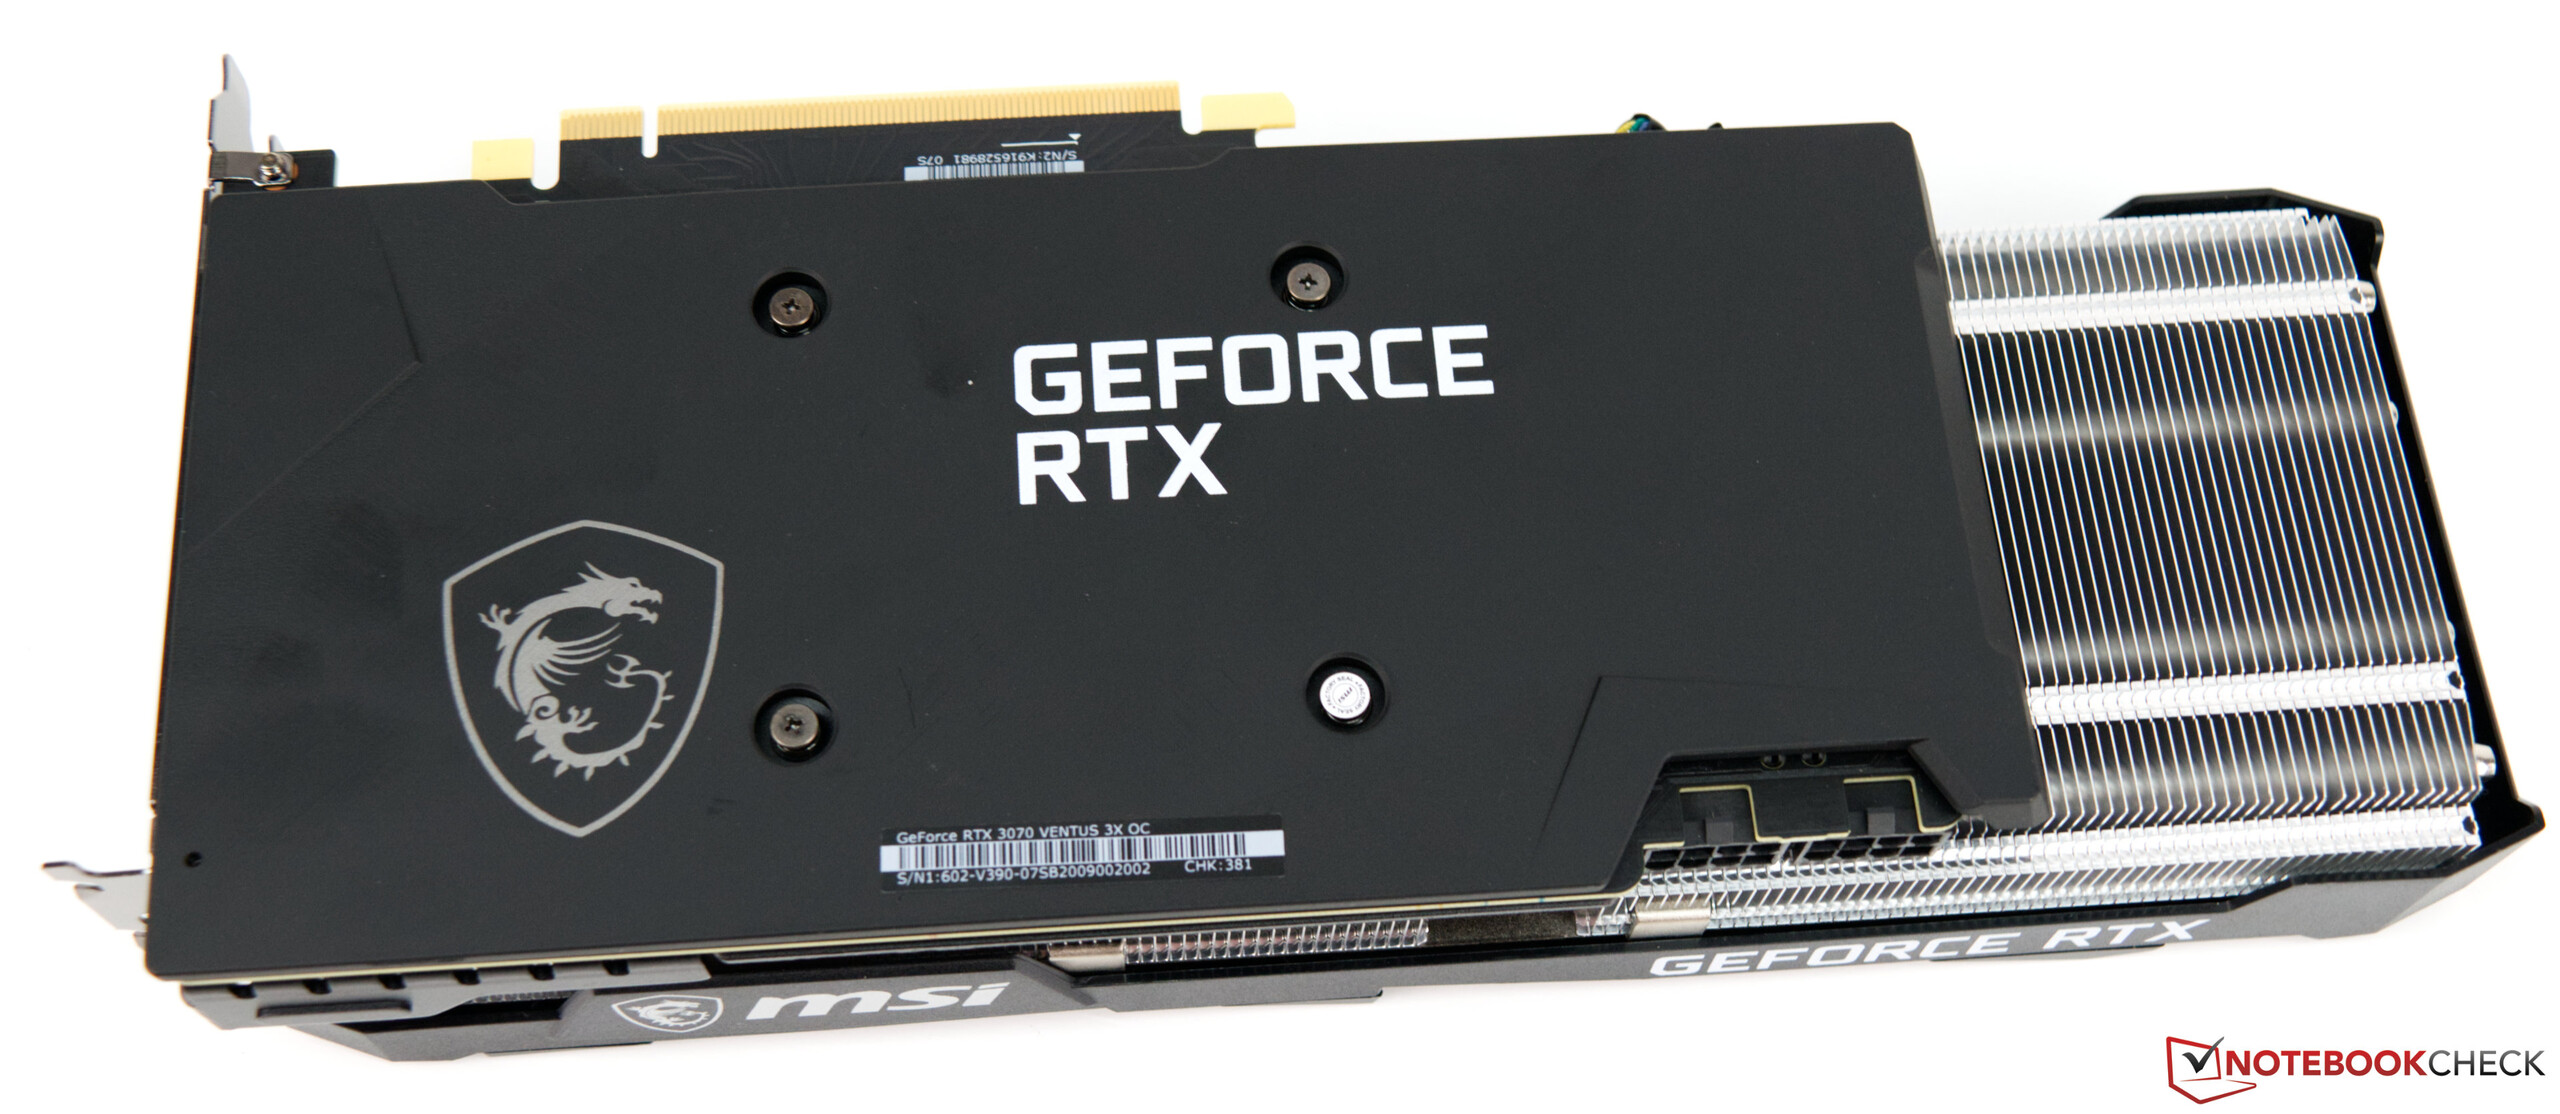
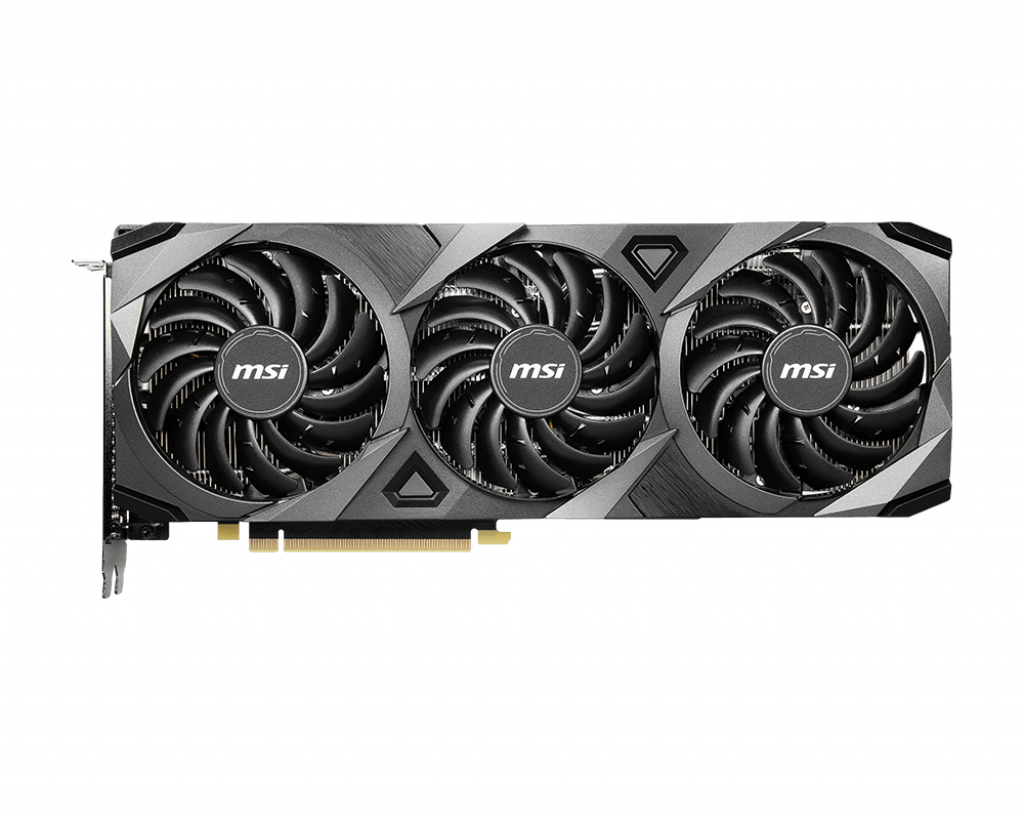
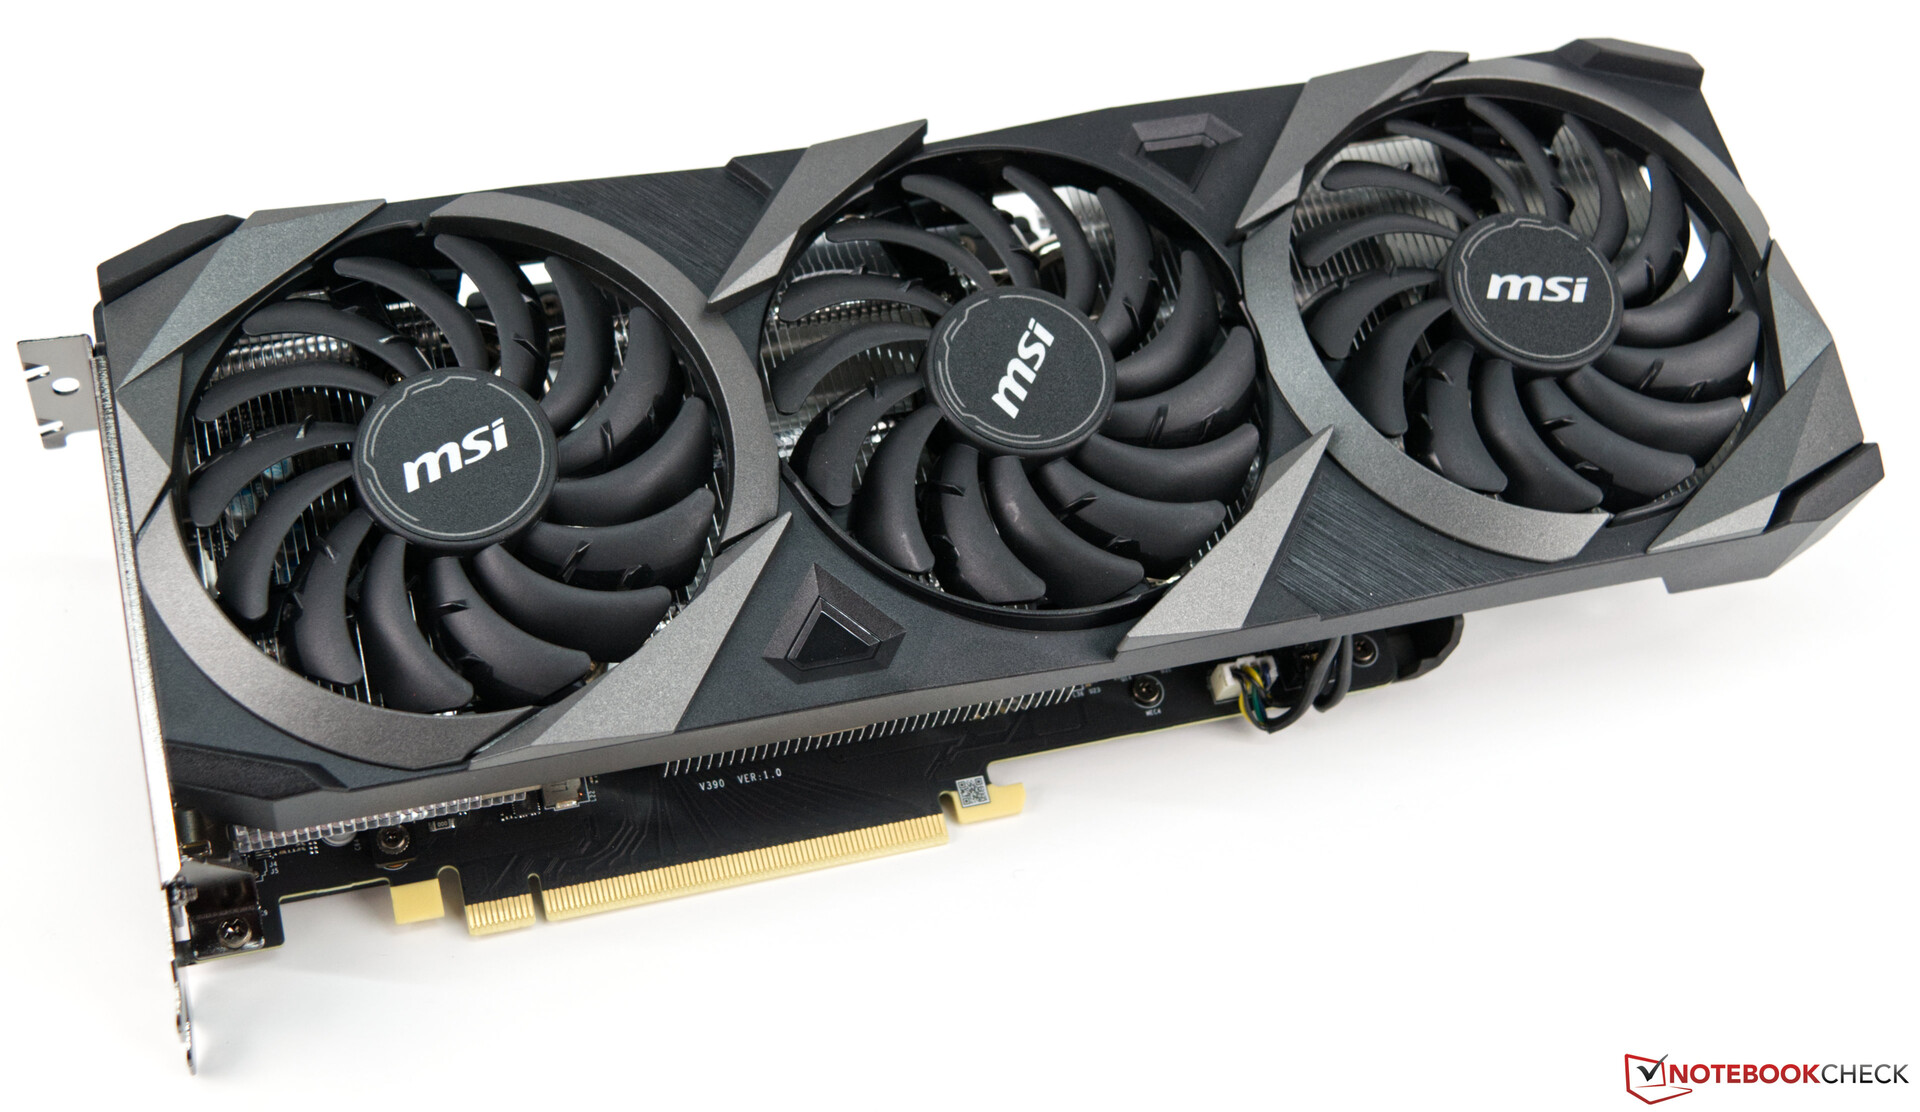
Fortunately, the scarcity does not affect the performance and MSI's model was quite convincing in the test. And those who can do without all the lighting orgies via RGB should take a closer look at the Ventus 3X series. The MSI GeForce RTX 3070 Ventus 3X OC has a large heatsink with three axial fans, but they stand completely still in 2D mode and at low load and thus do not cause any noise emissions. But even under load, this graphics card never gets loud. The model can use a maximum of 220 watts, which is exactly the same as the Founders Edition. The model from the Gaming X Trio range that we also recently tested was equipped with a 240 watt BIOS. We'll get to what this ultimately means for the performance later in the review.
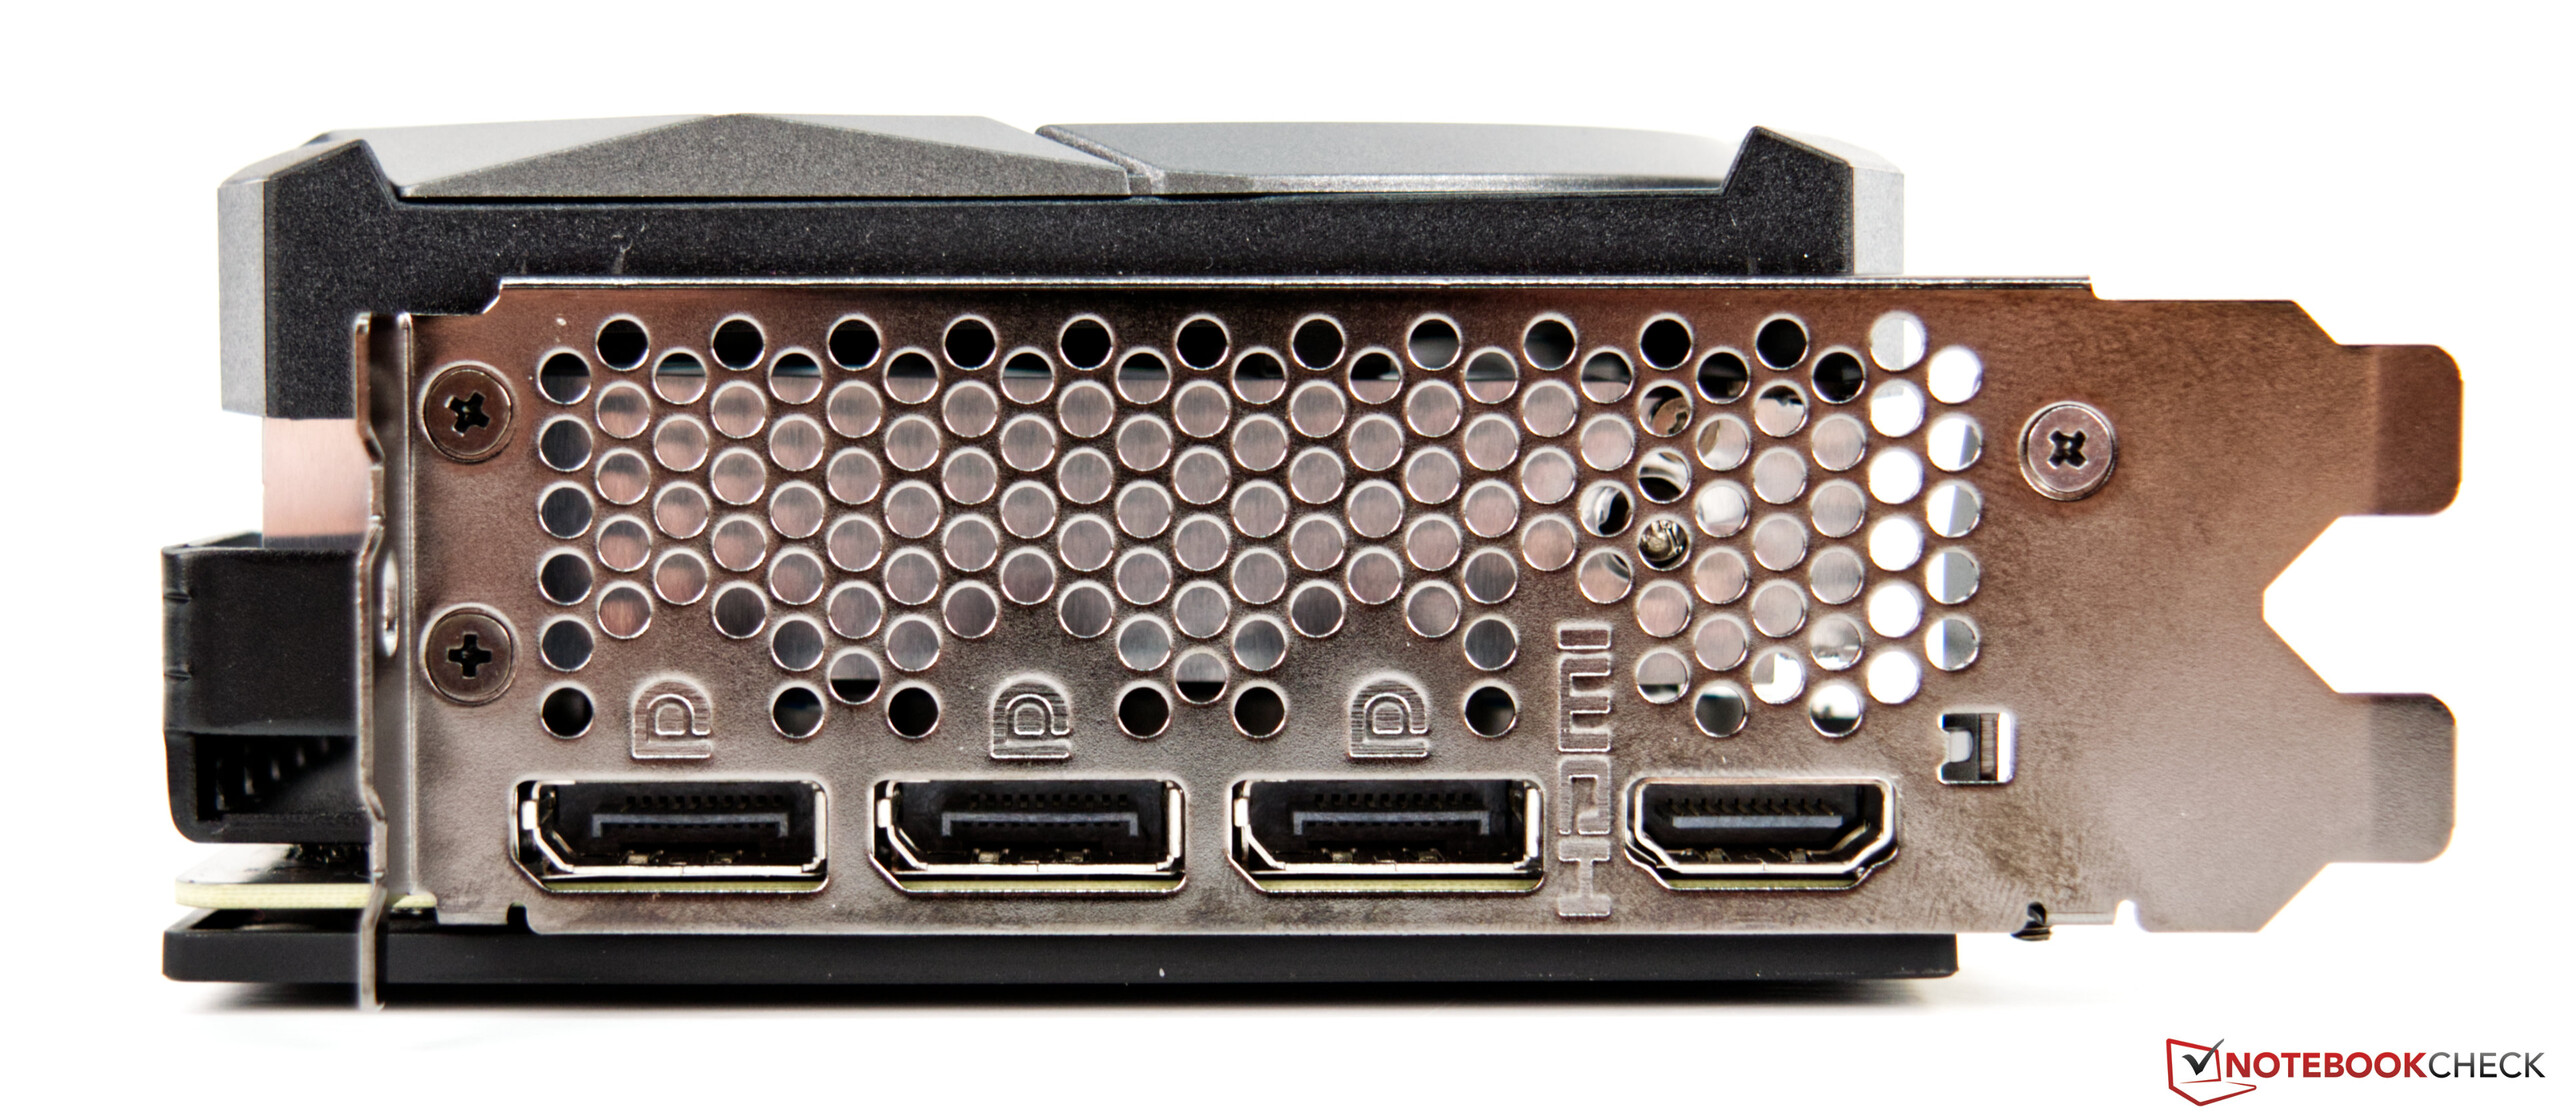
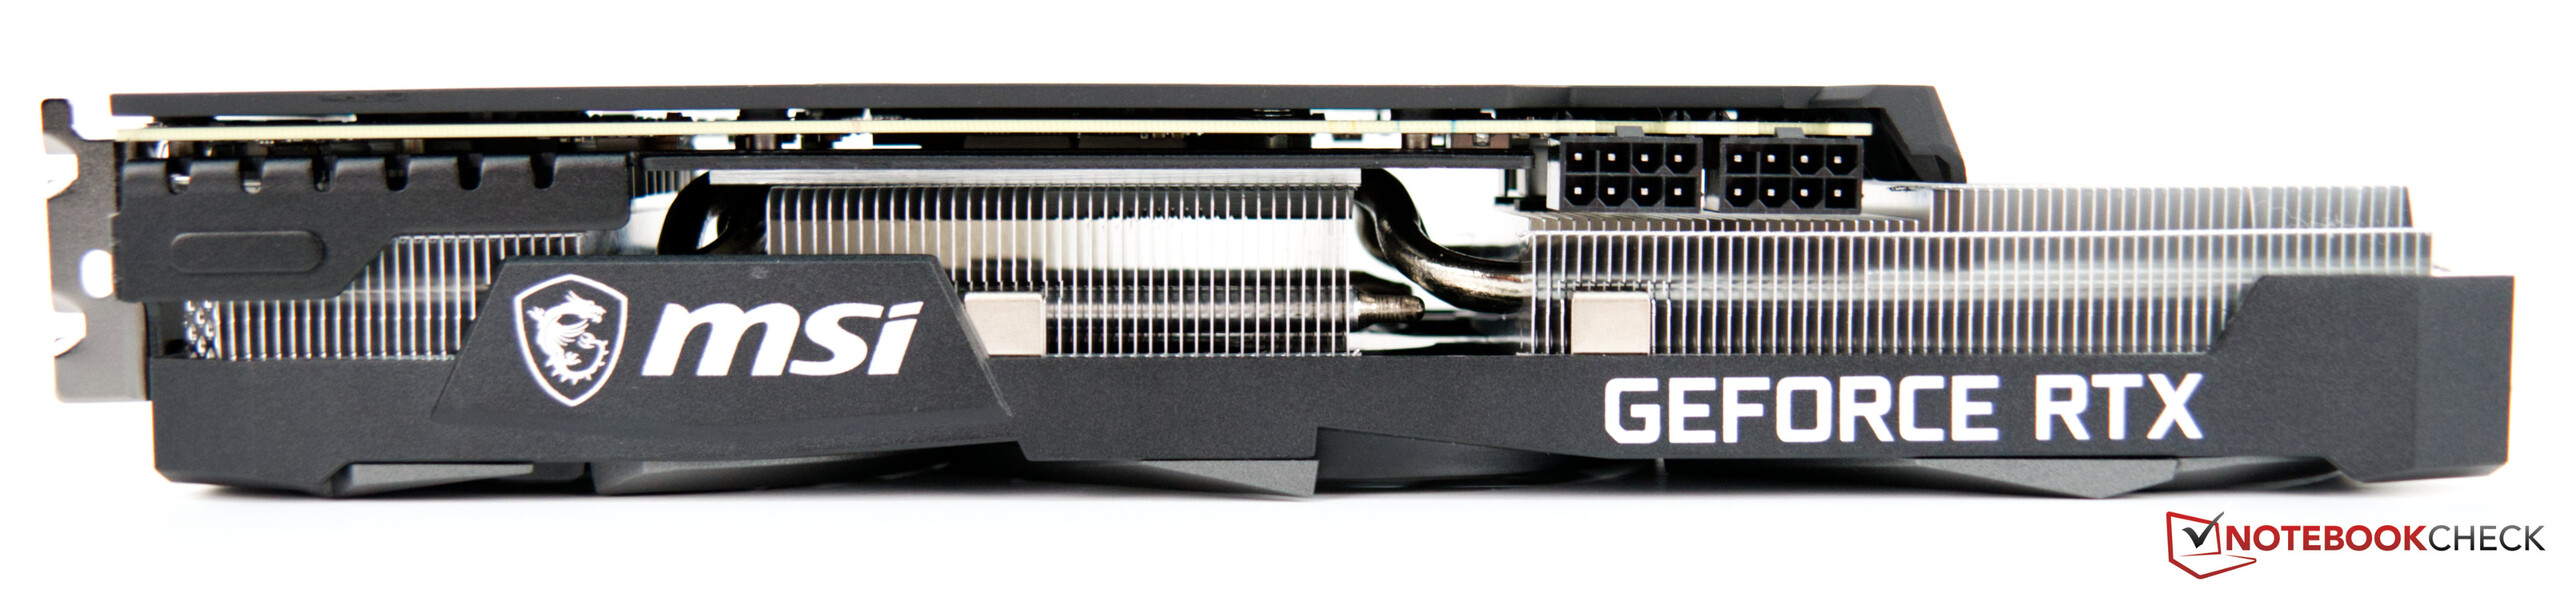
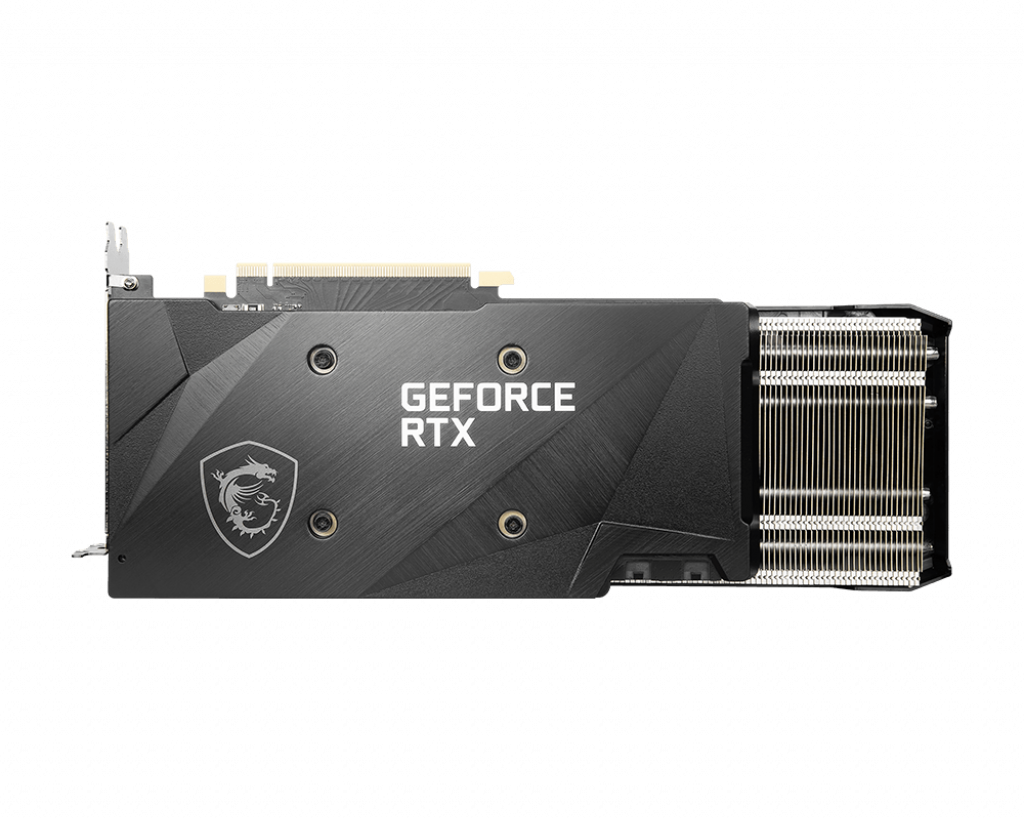
However, at just under 31 centimeters (~12.2 in), our test sample is only slightly shorter than the MSI GeForce RTX 3070 Gaming X Trio, which means that you should also check whether this model will fit in the case before buying. Furthermore, the MSI GeForce RTX 3070 Ventus 3X OC is equipped with two 8-pin power connectors and externally up to four monitors can be operated simultaneously. For this, there is one HDMI with the latest standard (2.1) and three DisplayPort ports (1.4a).
Comparison of the RTX 3080 with other NVIDIA GPUs
| Features | RTX 3090 FE | RTX 3080 FE | MSI RTX3070 | RTX 3070 FE | Titan RTX | RTX 2080 Ti | RTX 2080 | RTX 2070 S |
| Chip | GA102 | GA102 | GA104 | GA104 | TU102 | TU102 | TU104 | TU104 |
| FinFET Process | 8 nm | 8nm | 8 nm | 12 nm | 12 nm | 12 nm | 12 nm | 12 nm |
| CUDA Cores | 10,496 | 8.704 | 5.888 | 5.888 | 4.608 | 4.352 | 2.944 | 2.560 |
| TextureUnits | 328 | 272 | 184 | 184 | 288 | 272 | 184 | 160 |
| Tensor Cores | 328 3rd Gen. | 272 3rd Gen. | 1843rd Gen. | 184 3rd Gen. | 576 2nd Gen. | 544 2nd Gen. | 368 2nd Gen. | 320 2nd Gen. |
| RTCores | 82 | 68 | 46 | 46 | 72 | 68 | 46 | 40 |
| GPU Base Clock | 1.395 MHz | 1.440 MHz | 1.500 MHz | 1.350 MHz | 1.350 MHz | 1.515 MHz | 1.605 MHz | |
| GPU Boost Clock | 1.695 MHz | 1.710 MHz | 1.750 MHz | 1.750 MHz | 1.770 MHz | 1.545 MHz | 1.710 MHz | 1.770 MHz |
| MemoryBus | 384-bit | 320-bit | 256-bit | 384-bit | 352-bit | 256-bit | 256-bit | |
| Memory Bandwidth | 936 GB/s | 760 GB/s | 448GB/s | 448 GB/s | 672 GB/s | 616 GB/s | 448 GB/s | 448 GB/s |
| Video Memory | 24 GB GDDR6X | 10 GB GDDR6X | 8 GBGDDR6 | 8 GB GDDR6 | 24 GB GDDR6 | 11 GB GDDR6 | 8 GB GDDR6 | 8 GB GDDR6 |
| Power consumption | 350 W | 320 W | 220W | 280 W | 250 W | 215 W | 215 W |
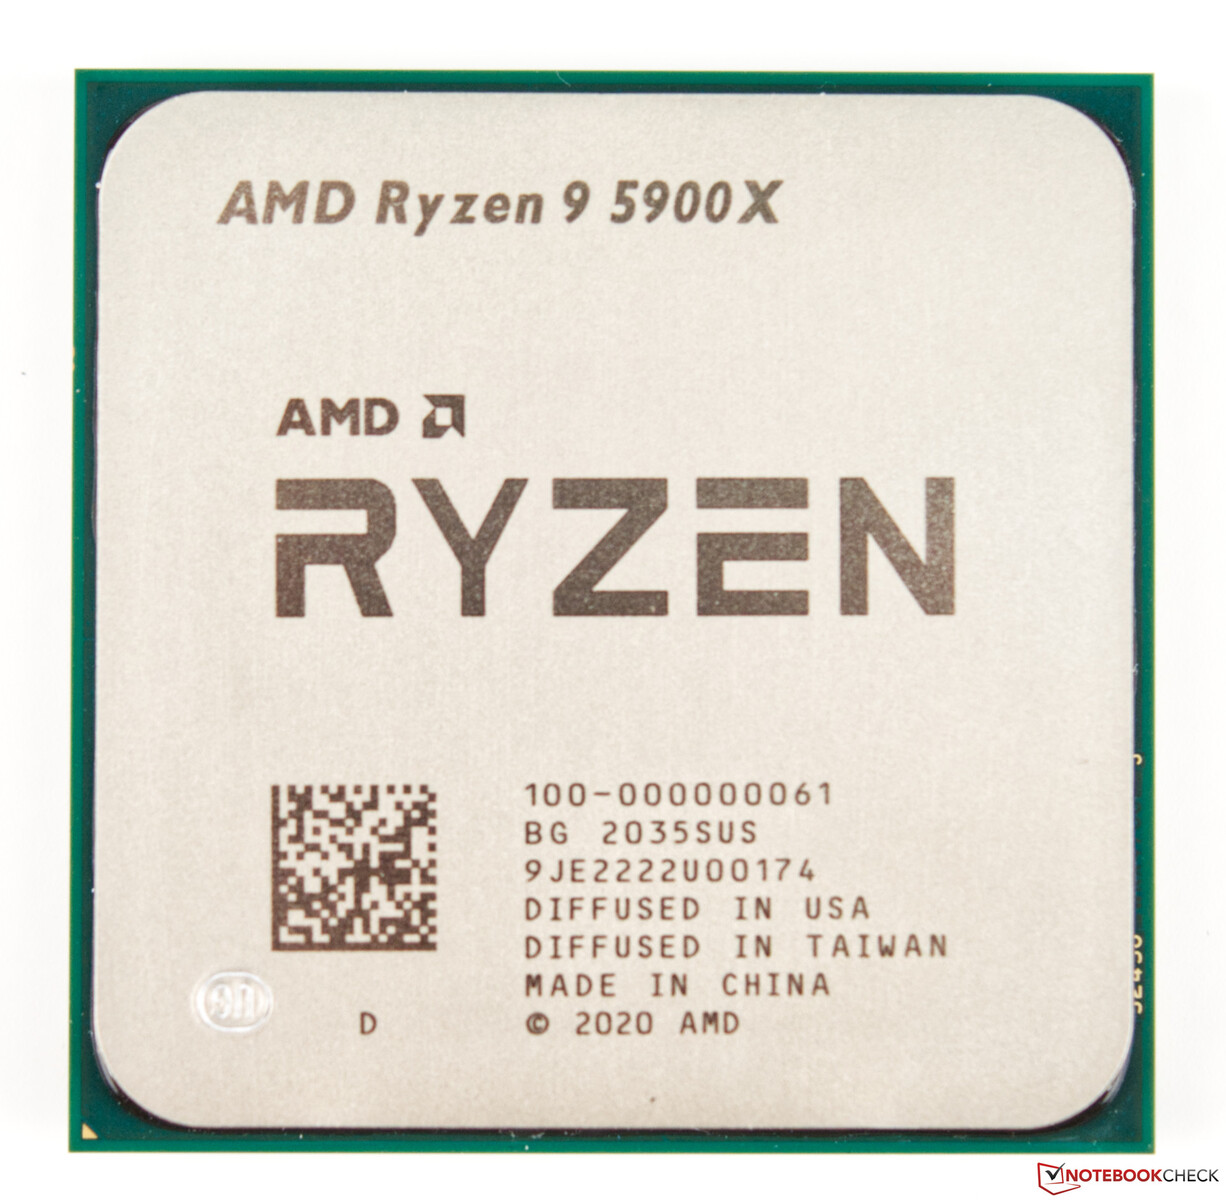
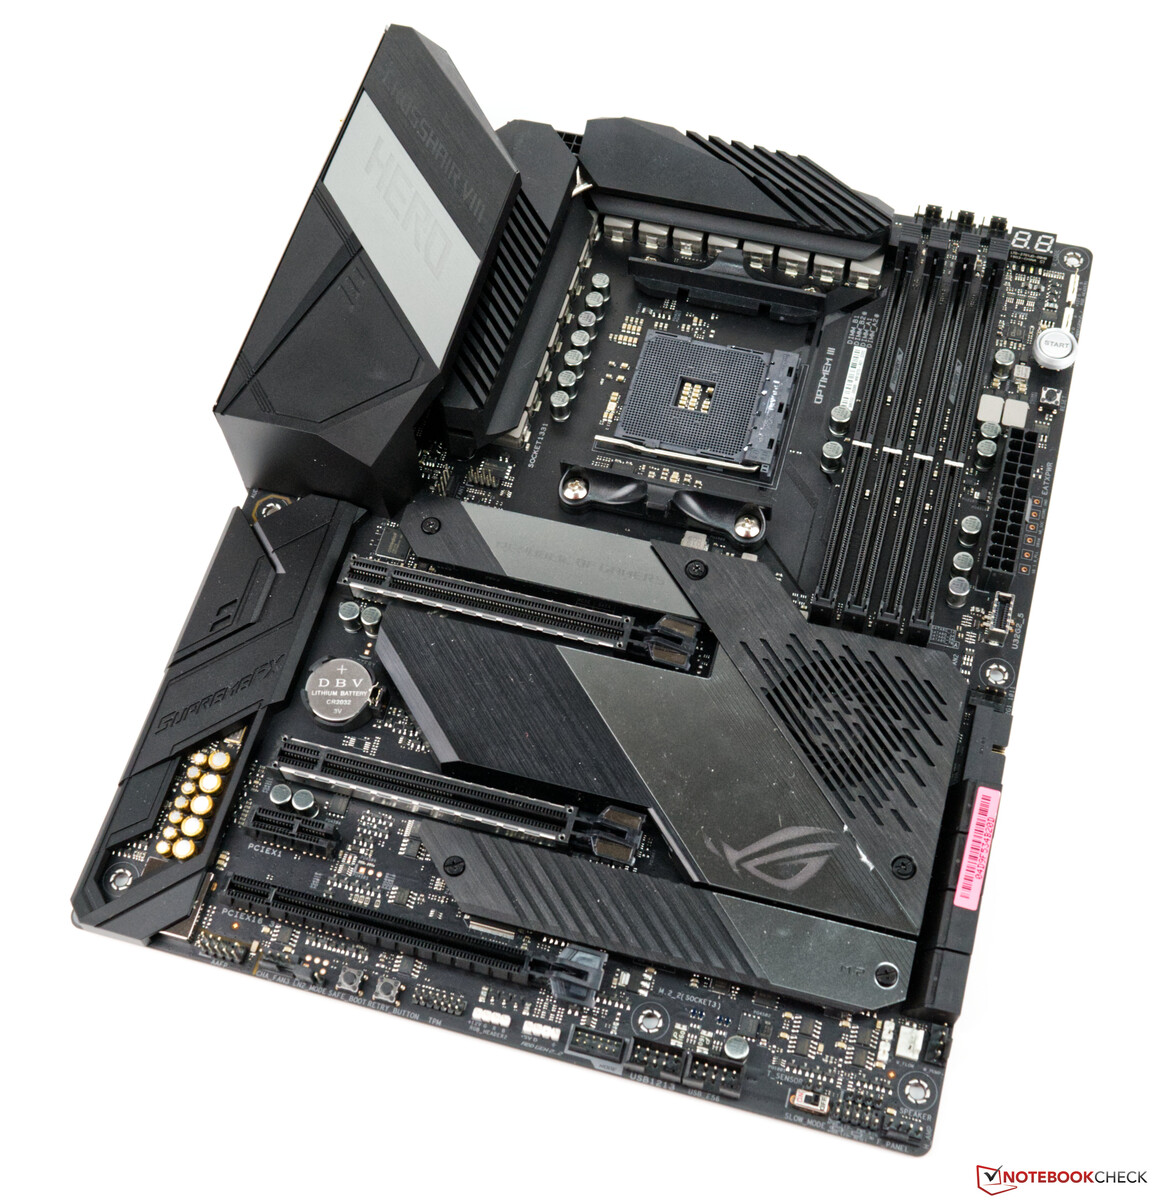
Our test system with AMD Ryzen 9 5900X as the basis
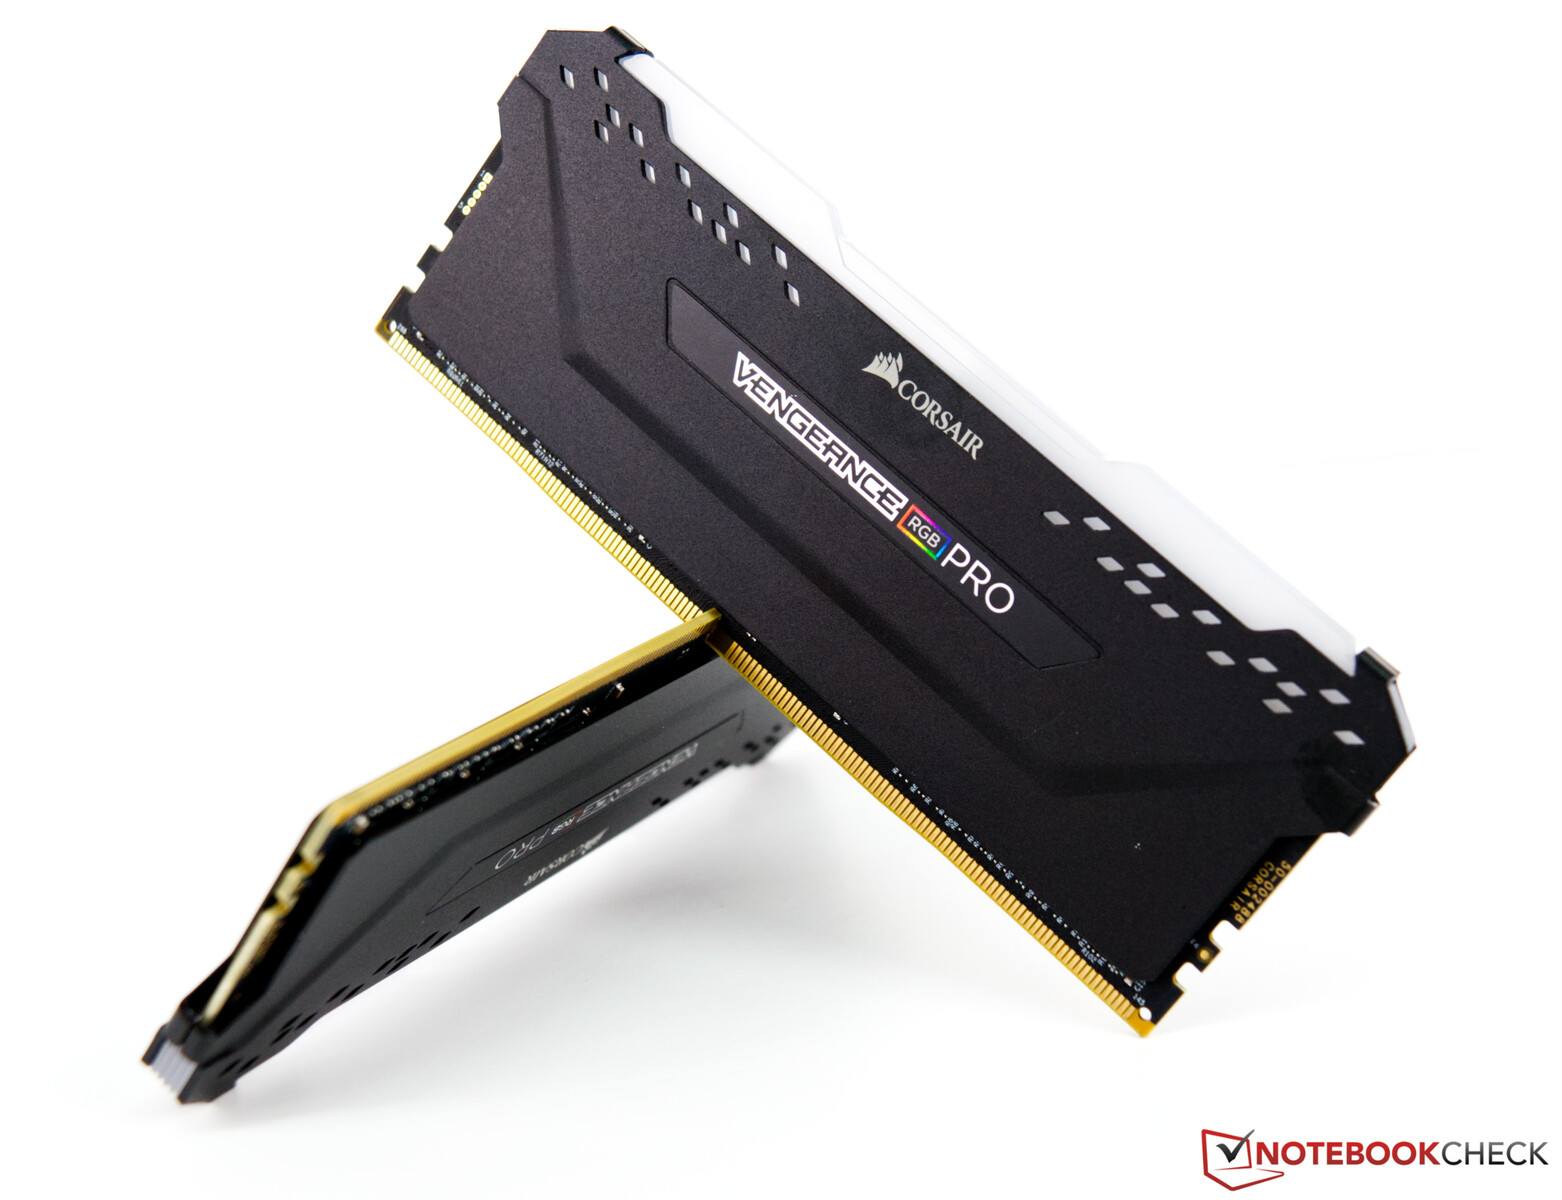
A current AMD platform based on the Asus X570 ROG Crosshair VIII serves as the test system. The CPU (AMD Ryzen 9 5900X) offers good CPU performance and we use an AIO (Alphacool Eisbear Aurora 360mm) for cooling. The 32 GB working memory comes from Corsair and clocks with 4000 MHz. We use the Acer Predator XB321HK as a monitor. This one does not limit us due to its UHD capability. We would like to thank AMD for providing the test platform and Corsair for the RAM kit.
We use the following system for the following benchmarks and tests:
- Lian Li O11 Dynamic
- AMD Ryzen 9 5900X
- MSI GeForce RTX 3070 Ventus 3X OC (driver Nvidia 460.89)
- Asus X570 ROG Crosshair VIII Hero WiFi (BIOS 2402, Default Settings, XMP 1 for DDR4-4000)
- Corsair RM1000X 1000 watt power adapter
- Corsair Vengeance RGB Pro DDR4-4000 memory kit 2 x 16 GB
- Corsair MP600 2TB M.2 PCIe-4.0 SSD
- Crucial MX500 2TB (for games)
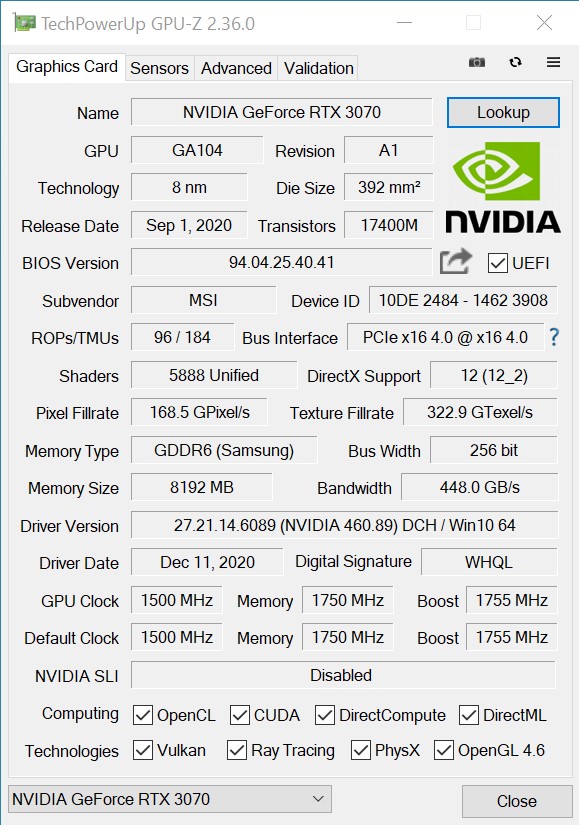
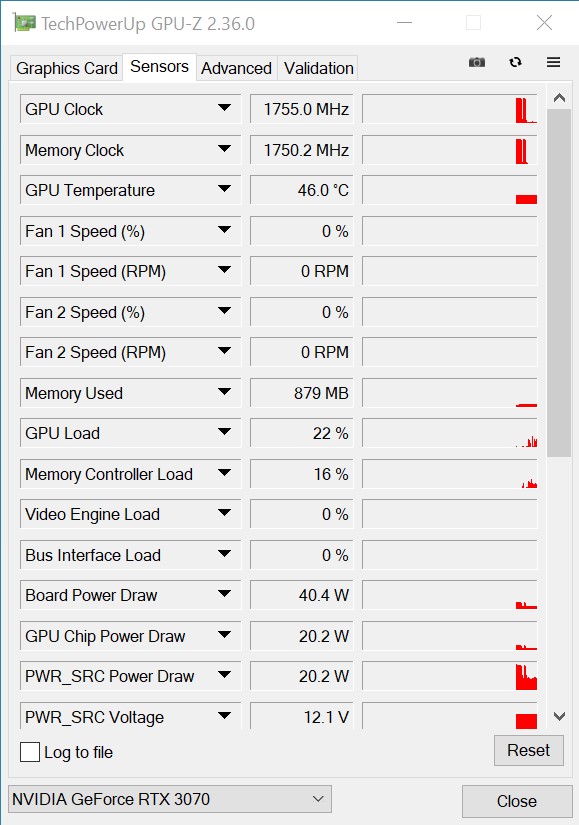
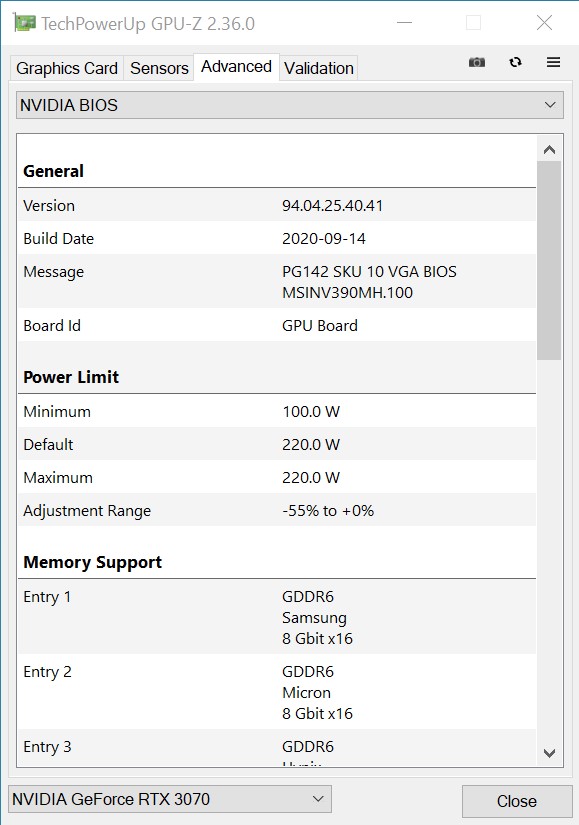
The clock rates of the MSI GeForce RTX 3070 Ventus 3X OC
As mentioned at the beginning, the clock rates of the MSI GeForce RTX 3070 Ventus 3X OC are on par with those of Nvidia's Founders Edition. The same applies to the power limit, which is 220 watts for the entire graphics card. Furthermore, the power target cannot be increased any further in our test sample.
Synthetic benchmarks
We get a first impression of the MSI GeForce RTX 3070 Ventus 3X OC's performance in the synthetic benchmarks. As you can already see from the technical data, our test sample ranks behind the GeForce RTX 3070 Gaming X Trio, although the gap is only minimal and only measurable. The RTX 3070 performs very well against the GeForce RTX 2080 Ti, which we tested as a custom version from KFA2, and can almost always beat the top model from the previous generation.
| 3DMark 03 Standard | 136483 points | |
| 3DMark 05 Standard | 34535 points | |
| 3DMark 06 Standard Score | 35659 points | |
| 3DMark Vantage P Result | 62128 points | |
| 3DMark 11 Performance | 26565 points | |
| 3DMark Ice Storm Standard Score | 197964 points | |
| 3DMark Cloud Gate Standard Score | 48366 points | |
| 3DMark Fire Strike Score | 20451 points | |
| 3DMark Fire Strike Extreme Score | 12092 points | |
| 3DMark Time Spy Score | 8797 points | |
Help | ||
Game benchmarks
In our gaming tests, the MSI GeForce RTX 3070 Ventus 3X OC does a slightly better job than in the synthetic benchmarks, which means that the Gaming X Trio model is beaten in some tests. Both MSI models are thus closer together here and are virtually equally fast. Our test sample can also mostly prevail against the RTX 2080 Ti. Nevertheless, the GeForce RTX 3070 Ventus 3X OC runs out of steam in very high resolutions, so the older top model has the lead here. The GeForce RTX 3070 is only suitable for 4K gaming to a limited extent because the frame rates vary a lot from game to game. The MSI GeForce RTX 3070 Ventus 3X OC sometimes has problems with smooth gameplay in 2160p with the latest games. Thus, we consider this graphics card more suitable when it comes to 1440p gaming. Here, the MSI GeForce RTX 3070 Ventus 3X OC performs consistently well and can always bring good frame rates to the screen in the games we tested.
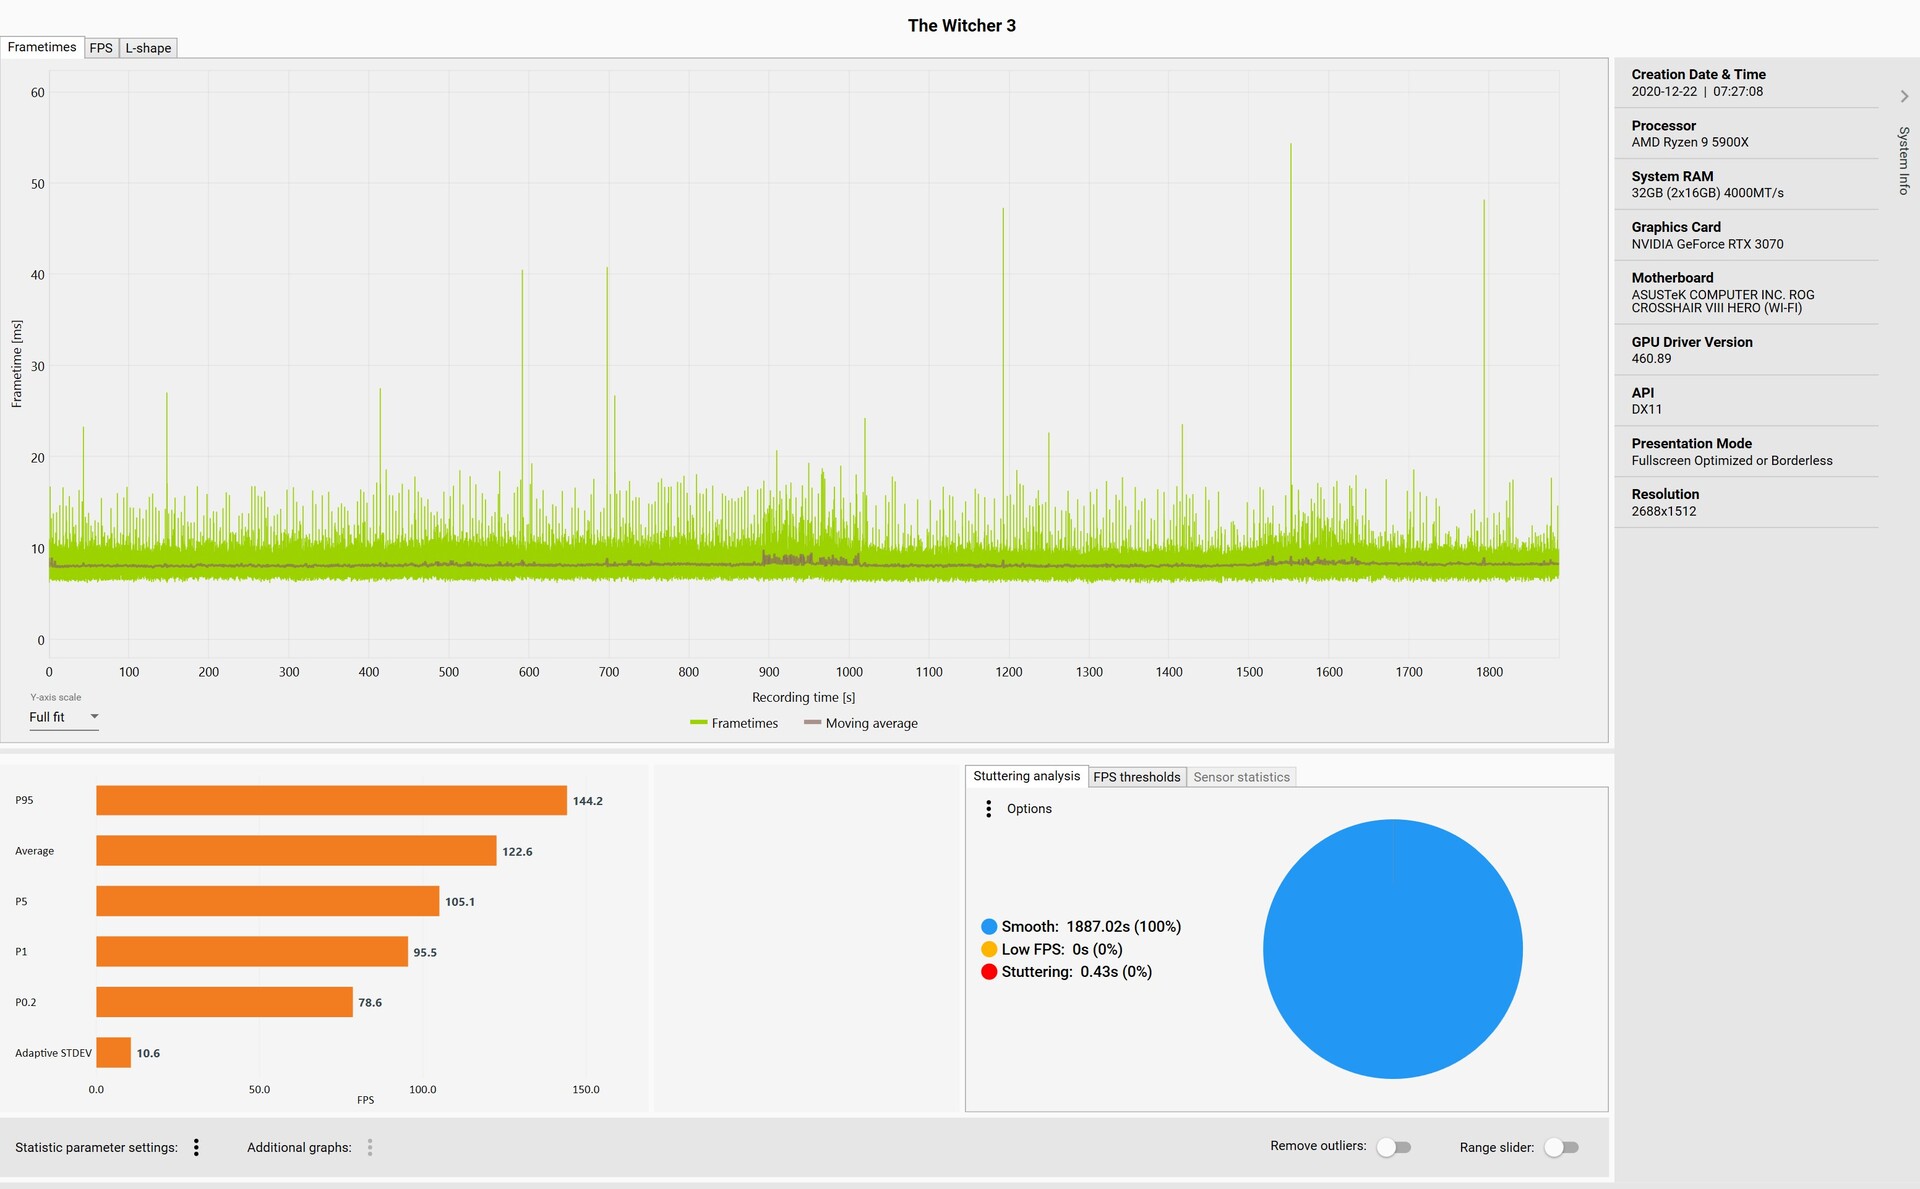
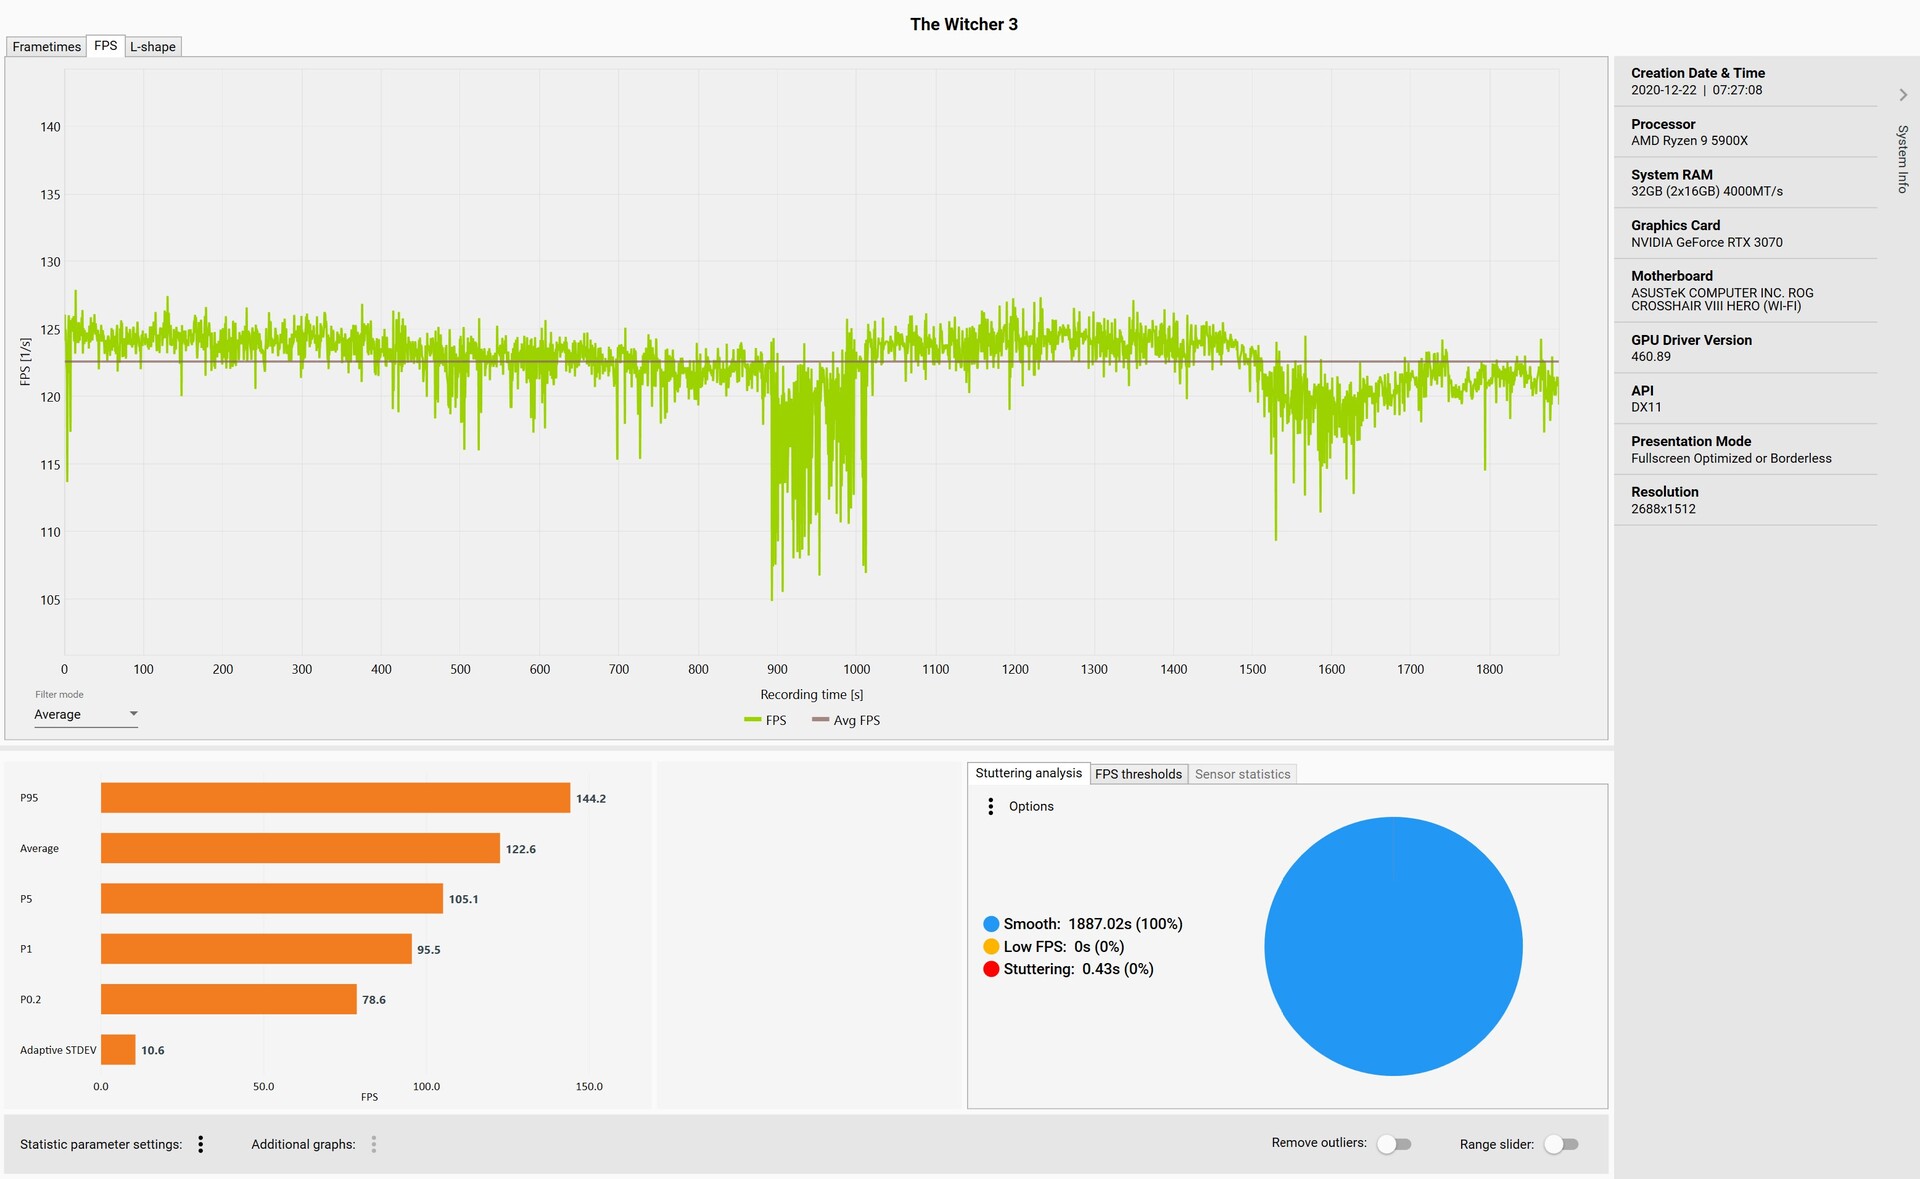
Those who mostly play in 1080p or 1440p will be quite happy with the performance of the MSI GeForce RTX 3070 Ventus 3X OC. Nevertheless, the 8 GB VRAM leaves a bland aftertaste if you want to be prepared for the future. Nevertheless, the 8 GB VRAM are still sufficient at the moment. As always, we use the game The Witcher 3 (1080p Ultra Preset) for the frame times and the frame rate. We only noticed a few higher latencies now and then during the recording, but they did not noticeably affect the gameplay. The frame rate is also relatively constant over time. There are a few frame drops in the middle and at the end, but this does not affect the smooth gameplay since there is always at least 105 FPS.
| F1 2020 | |
| 3840x2160 Ultra High Preset AA:T AF:16x | |
| MSI GeForce RTX 3090 Suprim X | |
| AMD Radeon RX 6800 XT | |
| ASUS GeForce RTX 3080 ROG STRIX OC GAMING | |
| MSI GeForce RTX 3070 Gaming X Trio | |
| MSI GeForce RTX 3070 Ventus 3X OC | |
| 2560x1440 Ultra High Preset AA:T AF:16x | |
| MSI GeForce RTX 3090 Suprim X | |
| AMD Radeon RX 6800 XT | |
| ASUS GeForce RTX 3080 ROG STRIX OC GAMING | |
| MSI GeForce RTX 3070 Gaming X Trio | |
| MSI GeForce RTX 3070 Ventus 3X OC | |
| Borderlands 3 | |
| 3840x2160 Badass Overall Quality (DX11) | |
| MSI GeForce RTX 3090 Suprim X | |
| ASUS GeForce RTX 3080 ROG STRIX OC GAMING | |
| AMD Radeon RX 6800 XT | |
| MSI GeForce RTX 3070 Gaming X Trio | |
| MSI GeForce RTX 3070 Ventus 3X OC | |
| KFA2 GeForce RTX 2080 Ti EX | |
| 2560x1440 Badass Overall Quality (DX11) | |
| MSI GeForce RTX 3090 Suprim X | |
| ASUS GeForce RTX 3080 ROG STRIX OC GAMING | |
| AMD Radeon RX 6800 XT | |
| KFA2 GeForce RTX 2080 Ti EX | |
| MSI GeForce RTX 3070 Gaming X Trio | |
| MSI GeForce RTX 3070 Ventus 3X OC | |
| Red Dead Redemption 2 | |
| 3840x2160 Maximum Settings | |
| MSI GeForce RTX 3090 Suprim X | |
| ASUS GeForce RTX 3080 ROG STRIX OC GAMING | |
| AMD Radeon RX 6800 XT | |
| MSI GeForce RTX 3070 Gaming X Trio | |
| MSI GeForce RTX 3070 Ventus 3X OC | |
| 2560x1440 Maximum Settings | |
| MSI GeForce RTX 3090 Suprim X | |
| AMD Radeon RX 6800 XT | |
| ASUS GeForce RTX 3080 ROG STRIX OC GAMING | |
| MSI GeForce RTX 3070 Gaming X Trio | |
| MSI GeForce RTX 3070 Ventus 3X OC | |
| Mafia Definitive Edition | |
| 3840x2160 High Preset | |
| MSI GeForce RTX 3090 Suprim X | |
| ASUS GeForce RTX 3080 ROG STRIX OC GAMING | |
| AMD Radeon RX 6800 XT | |
| MSI GeForce RTX 3070 Gaming X Trio | |
| MSI GeForce RTX 3070 Ventus 3X OC | |
| 2560x1440 High Preset | |
| MSI GeForce RTX 3090 Suprim X | |
| ASUS GeForce RTX 3080 ROG STRIX OC GAMING | |
| AMD Radeon RX 6800 XT | |
| MSI GeForce RTX 3070 Gaming X Trio | |
| MSI GeForce RTX 3070 Ventus 3X OC | |
| Watch Dogs Legion | |
| 3840x2160 Ultra Preset (DX12) | |
| MSI GeForce RTX 3090 Suprim X | |
| ASUS GeForce RTX 3080 ROG STRIX OC GAMING | |
| AMD Radeon RX 6800 XT | |
| MSI GeForce RTX 3070 Ventus 3X OC | |
| MSI GeForce RTX 3070 Gaming X Trio | |
| 2560x1440 Ultra Preset (DX12) | |
| MSI GeForce RTX 3090 Suprim X | |
| AMD Radeon RX 6800 XT | |
| ASUS GeForce RTX 3080 ROG STRIX OC GAMING | |
| MSI GeForce RTX 3070 Ventus 3X OC | |
| MSI GeForce RTX 3070 Gaming X Trio | |
| The Witcher 3 | |
| 3840x2160 High Graphics & Postprocessing (Nvidia HairWorks Off) | |
| MSI GeForce RTX 3090 Suprim X | |
| ASUS GeForce RTX 3080 ROG STRIX OC GAMING | |
| AMD Radeon RX 6800 XT | |
| KFA2 GeForce RTX 2080 Ti EX | |
| MSI GeForce RTX 3070 Ventus 3X OC | |
| MSI GeForce RTX 3070 Gaming X Trio | |
| Nvidia GeForce RTX 2080 Super | |
| MSI RTX 2080 Gaming X Trio | |
| Nvidia GeForce RTX 2070 Super | |
| MSI RTX 2070 Gaming Z 8G | |
| Nvidia GeForce RTX 2060 Super | |
| AMD Radeon VII | |
| AMD Radeon RX 5700 XT | |
| MSI RTX 2060 Gaming Z 6G | |
| AMD Radeon RX Vega 64 | |
| AMD Radeon RX 5700 | |
| 1920x1080 Ultra Graphics & Postprocessing (HBAO+) | |
| MSI GeForce RTX 3090 Suprim X | |
| AMD Radeon RX 6800 XT | |
| ASUS GeForce RTX 3080 ROG STRIX OC GAMING | |
| KFA2 GeForce RTX 2080 Ti EX | |
| MSI GeForce RTX 3070 Gaming X Trio | |
| MSI GeForce RTX 3070 Ventus 3X OC | |
| MSI RTX 2080 Gaming X Trio | |
| Nvidia GeForce RTX 2080 Super | |
| Nvidia GeForce RTX 2070 Super | |
| AMD Radeon RX 5700 XT | |
| MSI RTX 2070 Gaming Z 8G | |
| AMD Radeon RX 5700 | |
| Nvidia GeForce RTX 2060 Super | |
| AMD Radeon RX Vega 64 | |
| AMD Radeon VII | |
| MSI RTX 2060 Gaming Z 6G | |
| low | med. | high | ultra | QHD | 4K | |
|---|---|---|---|---|---|---|
| GTA V (2015) | 184 | 175 | 170 | 108 | 98.3 | 117 |
| The Witcher 3 (2015) | 407 | 363 | 176 | 121 | 90.9 | |
| Dota 2 Reborn (2015) | 171 | 157 | 153.6 | 136.3 | 128.5 | |
| Rise of the Tomb Raider (2016) | 226 | 159 | 156 | 151 | 80.9 | |
| Final Fantasy XV Benchmark (2018) | 209 | 159 | 122 | 94.1 | 57.6 | |
| X-Plane 11.11 (2018) | 141 | 123 | 95.4 | 84.3 | ||
| Far Cry 5 (2018) | 184 | 161 | 154 | 143 | 125 | 70 |
| Strange Brigade (2018) | 413 | 302 | 251 | 222 | 166 | 96.8 |
| Shadow of the Tomb Raider (2018) | 200 | 176 | 168 | 160 | 116 | 63.5 |
| Battlefield V (2018) | 188.9 | 154.3 | 137.4 | 125.2 | 106.8 | 70.9 |
| Apex Legends (2019) | 144 | 144 | 144 | 144 | 144 | 106 |
| Far Cry New Dawn (2019) | 152 | 135 | 130 | 116 | 107 | 72 |
| Metro Exodus (2019) | 193 | 148 | 117 | 93.7 | 74.8 | 48.6 |
| Anno 1800 (2019) | 170 | 147 | 100 | 52 | 50.5 | 35 |
| Control (2019) | 238 | 149 | 117 | 79.8 | 41 | |
| Borderlands 3 (2019) | 134 | 123 | 94.5 | 95.3 | 75.1 | 43.8 |
| Star Wars Jedi Fallen Order (2019) | 130 | 128 | 128 | 125 | 70.1 | |
| Red Dead Redemption 2 (2019) | 156.5 | 149 | 112.8 | 76.2 | 63.4 | 42.1 |
| Hunt Showdown (2020) | 174 | 152 | 137 | 128 | 74.2 | |
| Doom Eternal (2020) | 246 | 246 | 244 | 237 | 208 | 116 |
| F1 2020 (2020) | 327 | 268 | 252 | 181 | 143 | 88.7 |
| Death Stranding (2020) | 224 | 190 | 173 | 170 | 126 | 74.1 |
| Horizon Zero Dawn (2020) | 189 | 153 | 138 | 124 | 104 | 61 |
| Crysis Remastered (2020) | 221 | 182 | 97.7 | 75.8 | 64.3 | 38.9 |
| Serious Sam 4 (2020) | 148.8 | 122 | 120.9 | 99 | 92 | 66.6 |
| Mafia Definitive Edition (2020) | 184 | 140 | 132 | 98.1 | 55.2 | |
| Star Wars Squadrons (2020) | 437 | 344 | 333 | 312 | 228 | 136 |
| FIFA 21 (2020) | 203 | 195 | 200 | 191 | 193 | 194 |
| Watch Dogs Legion (2020) | 122 | 118 | 112 | 86 | 66.3 | 39.2 |
| Dirt 5 (2020) | 179 | 122 | 106 | 89.3 | 75.9 | 54.7 |
| Assassin´s Creed Valhalla (2020) | 133 | 103 | 87 | 80 | 65 | 42 |
| Call of Duty Black Ops Cold War (2020) | 141 | 133 | 117 | 95.7 | 83 | 50.2 |
| Yakuza Like a Dragon (2020) | 109 | 109 | 116 | 111 | 96 | 51.7 |
| Immortals Fenyx Rising (2020) | 115 | 92 | 83 | 81 | 68 | 50 |
| Cyberpunk 2077 1.0 (2020) | 132 | 108 | 92.4 | 81 | 54.8 | 27.9 |
Compute Performance
In LuxMark and ComputeMark, our GeForce RTX 3070 Ventus 3X OC loses the internal MSI duel. The lower TDP and the lower Boost result in a razor-thin defeat. Nevertheless, the inexpensive model does not have to hide because the benchmark results are on a good level overall. Professional graphics solutions, such as the Quadro or Fire Pro models, offer a significantly higher performance in the compute area due to the adapted drives.
Emissions of the MSI GeForce RTX 3070 Ventus 3X OC
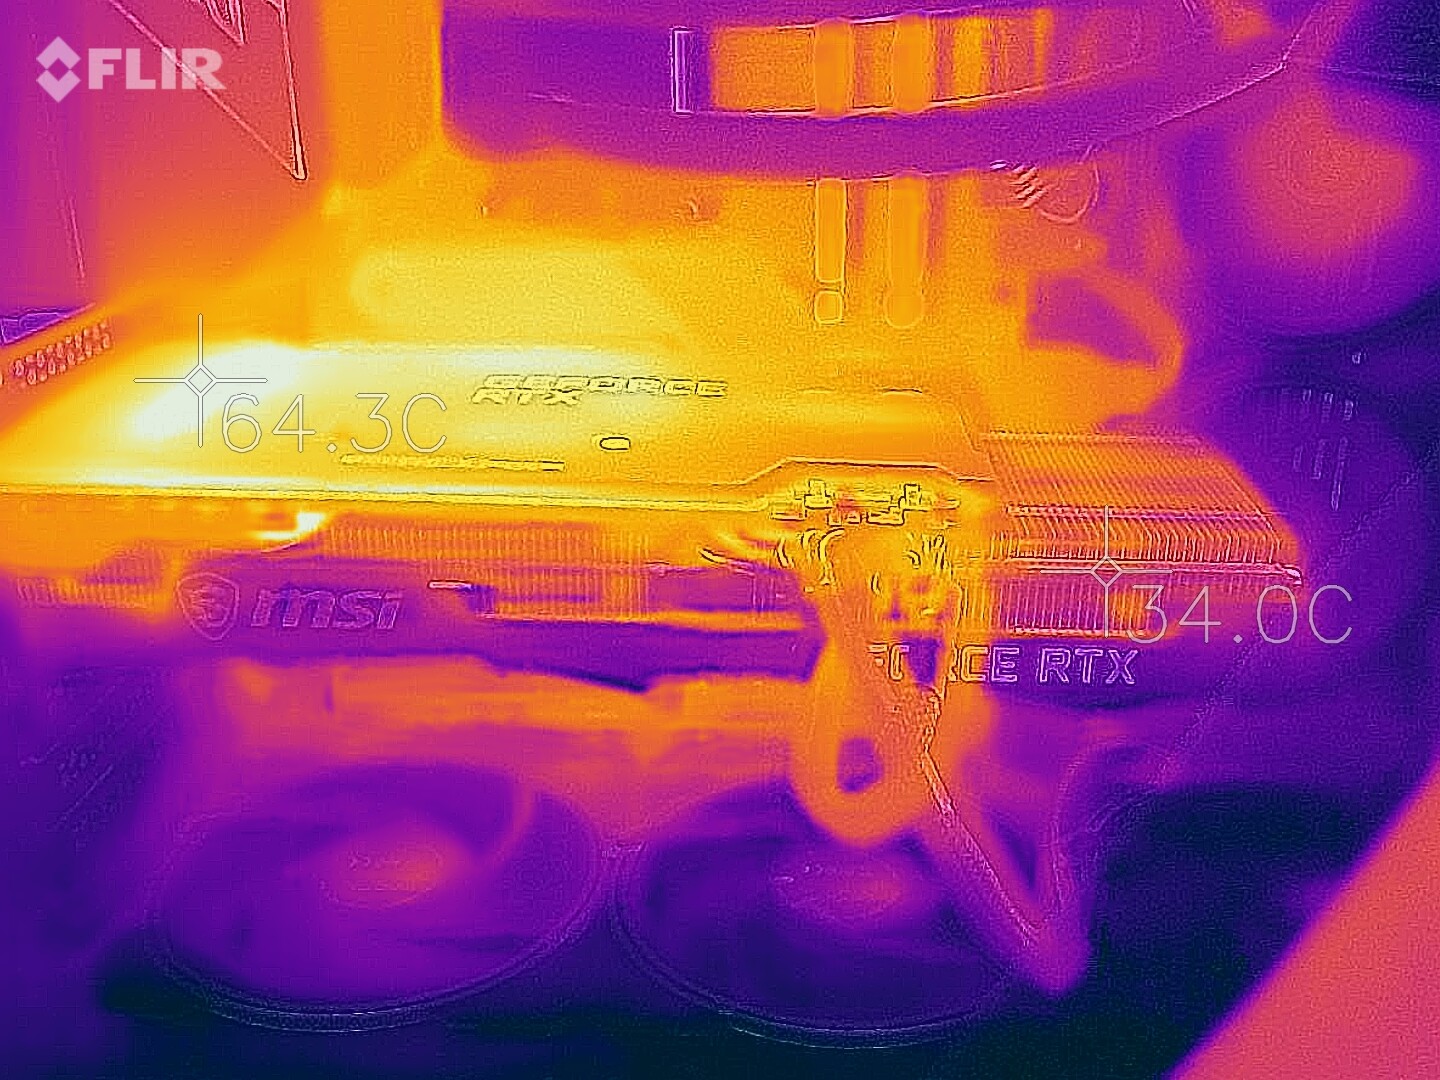
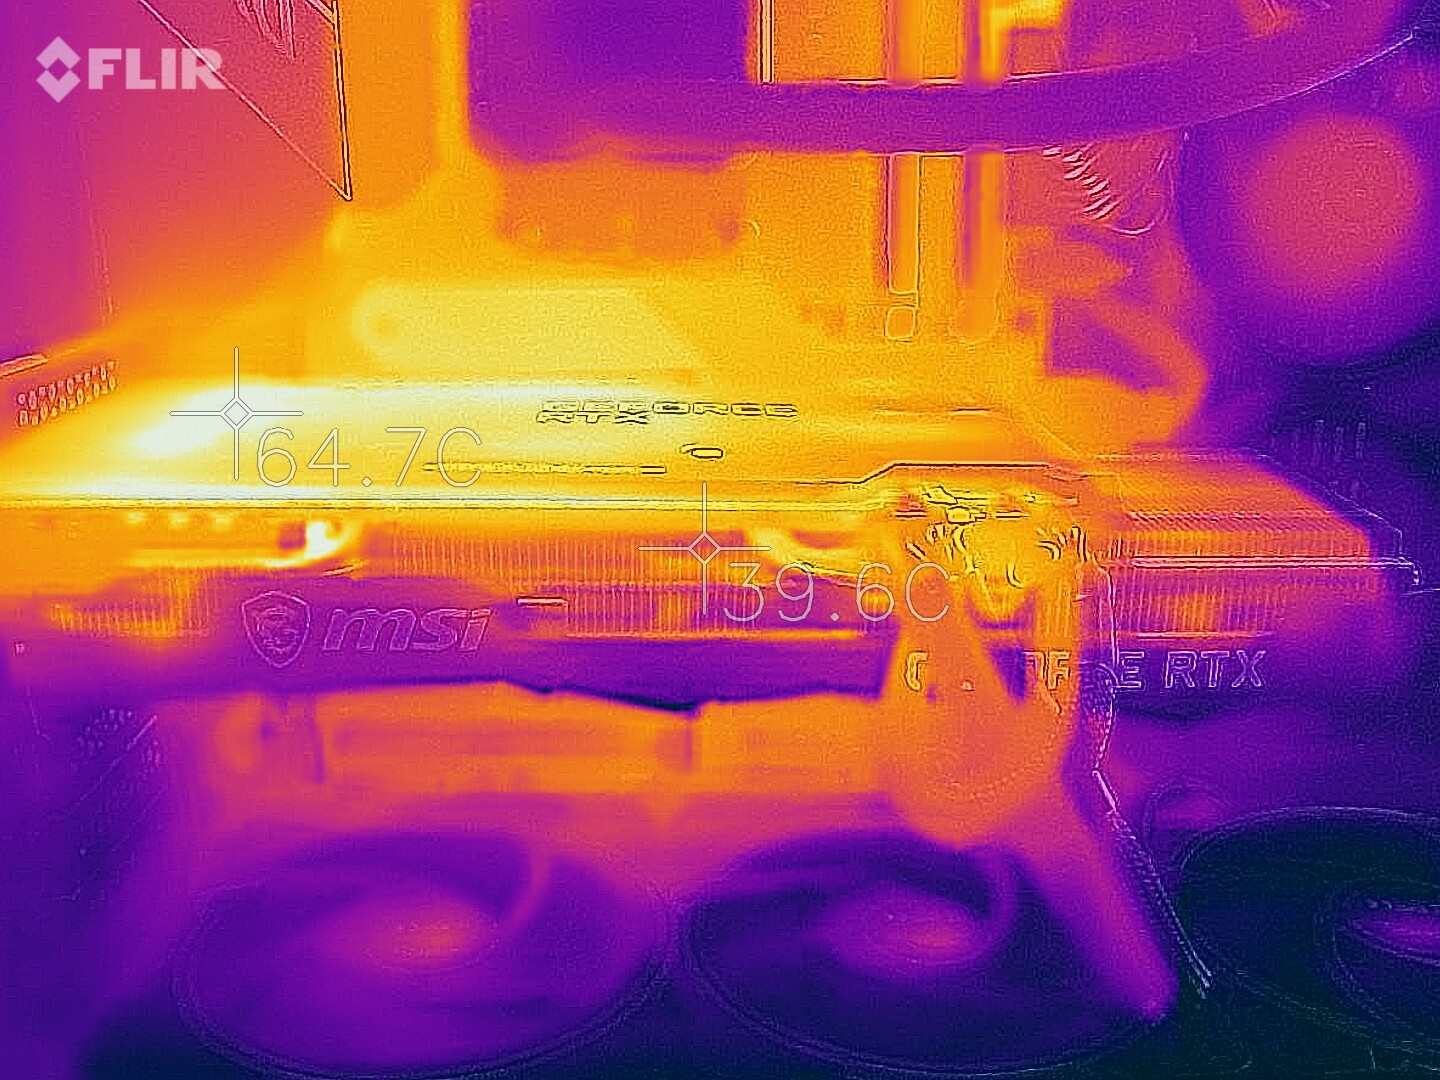
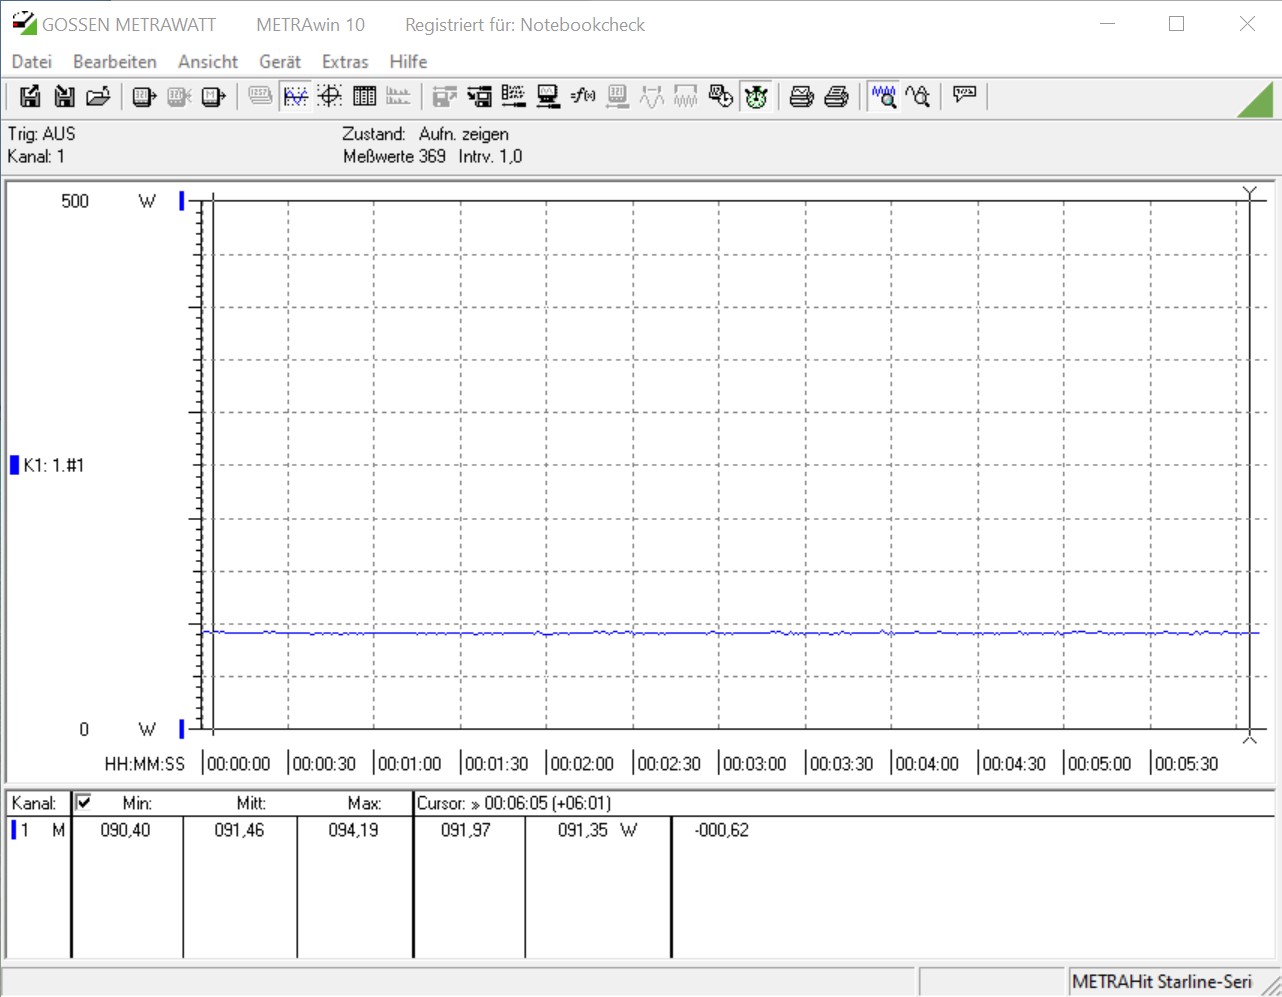
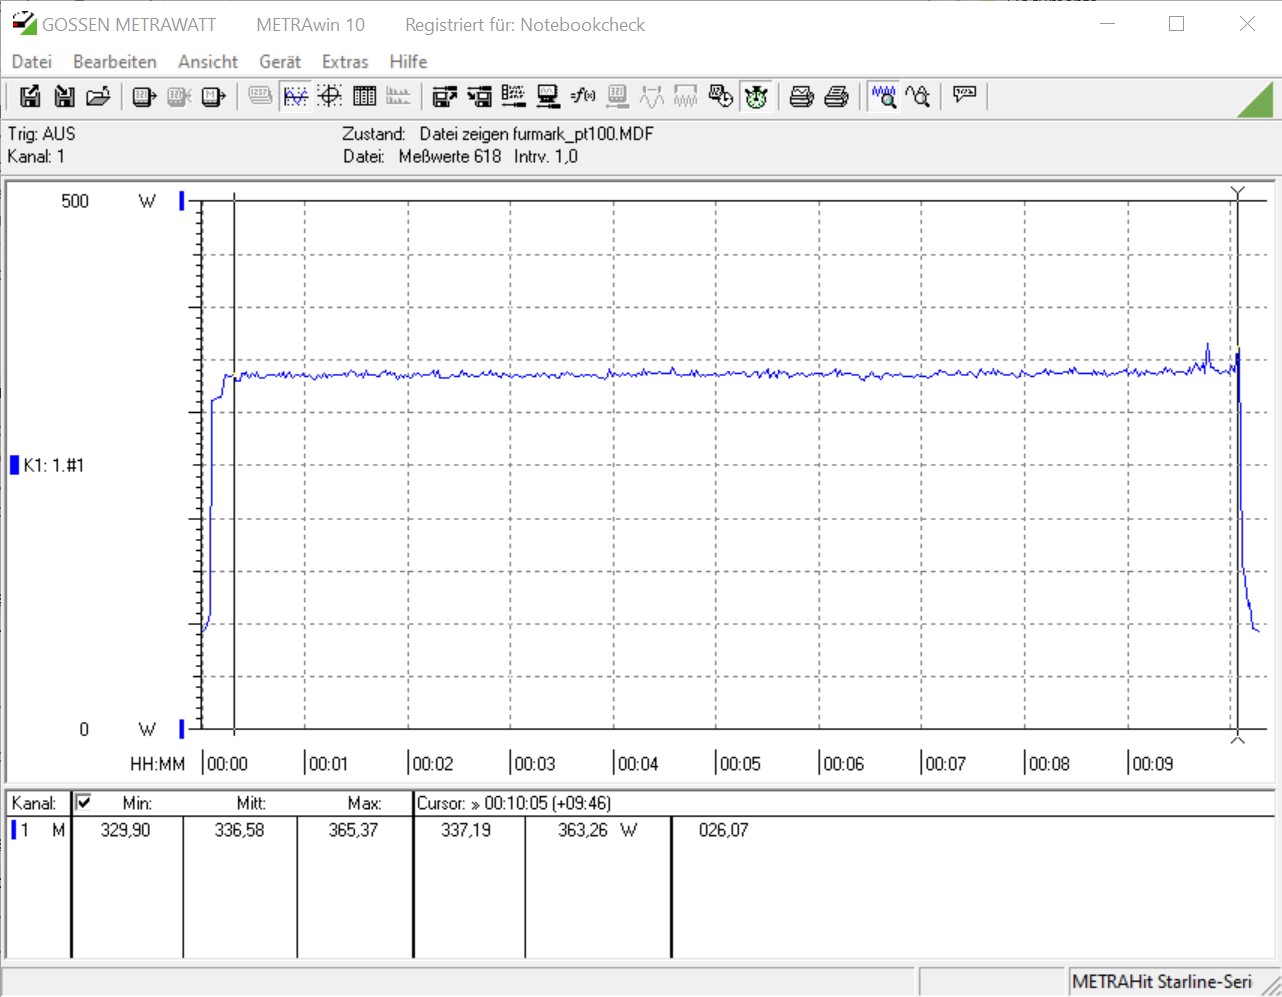
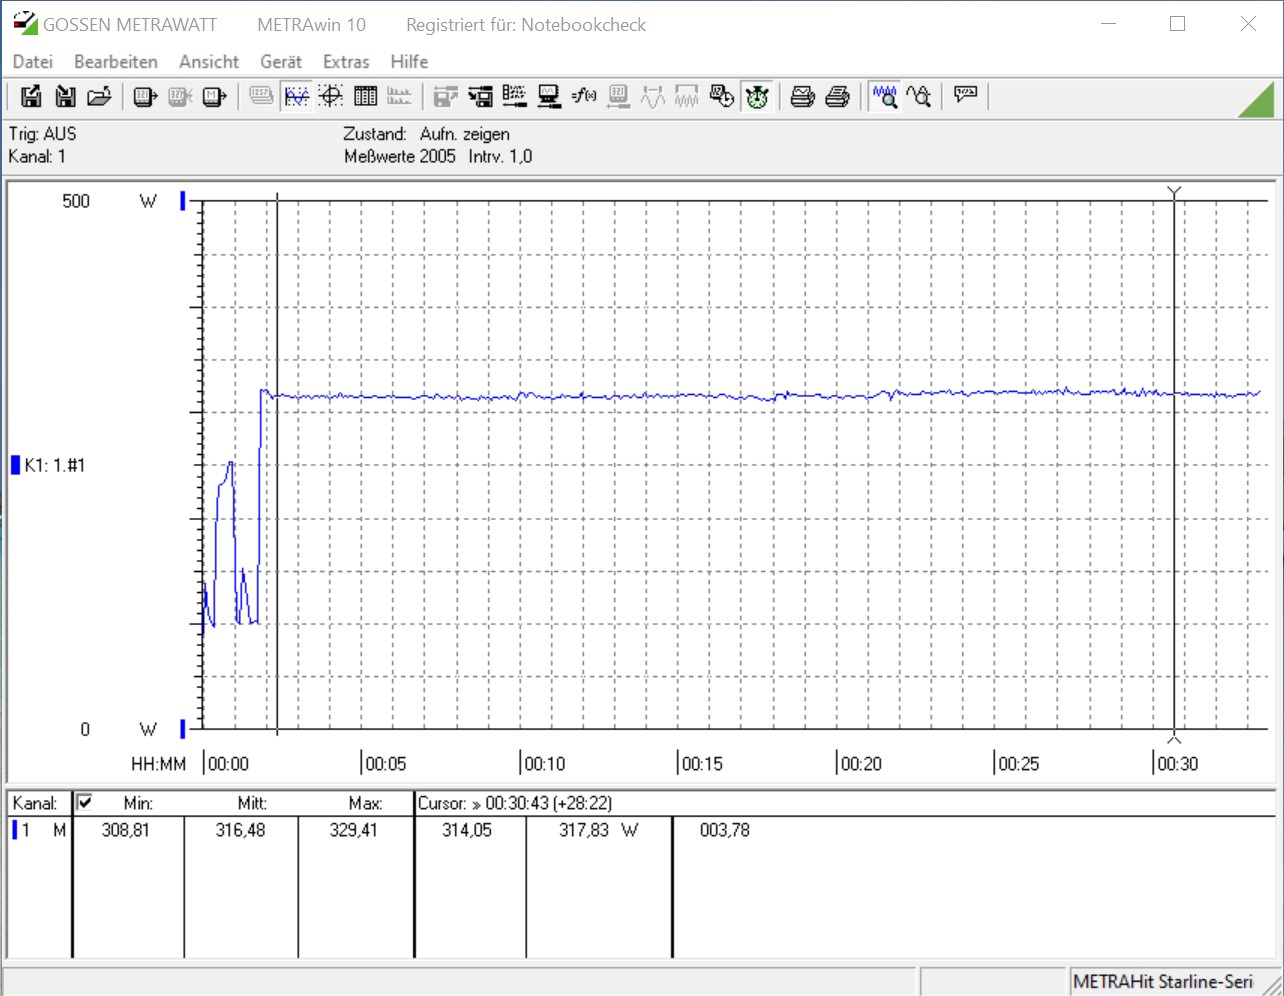
MSI's GeForce RTX 3070 Ventus 3X OC can convince across the board in terms of emissions. According to the manufacturer, the graphics card is slightly more frugal than a GeForce RTX 2080 Ti with 220 watts and on par with the high-end model of the Turing generation in terms of performance. In our test system, this means an idle power consumption of 91 watts and an average of 336 watts in the stress test. We even measured an average of only 316 watts during gaming, which is a really good result in comparison.
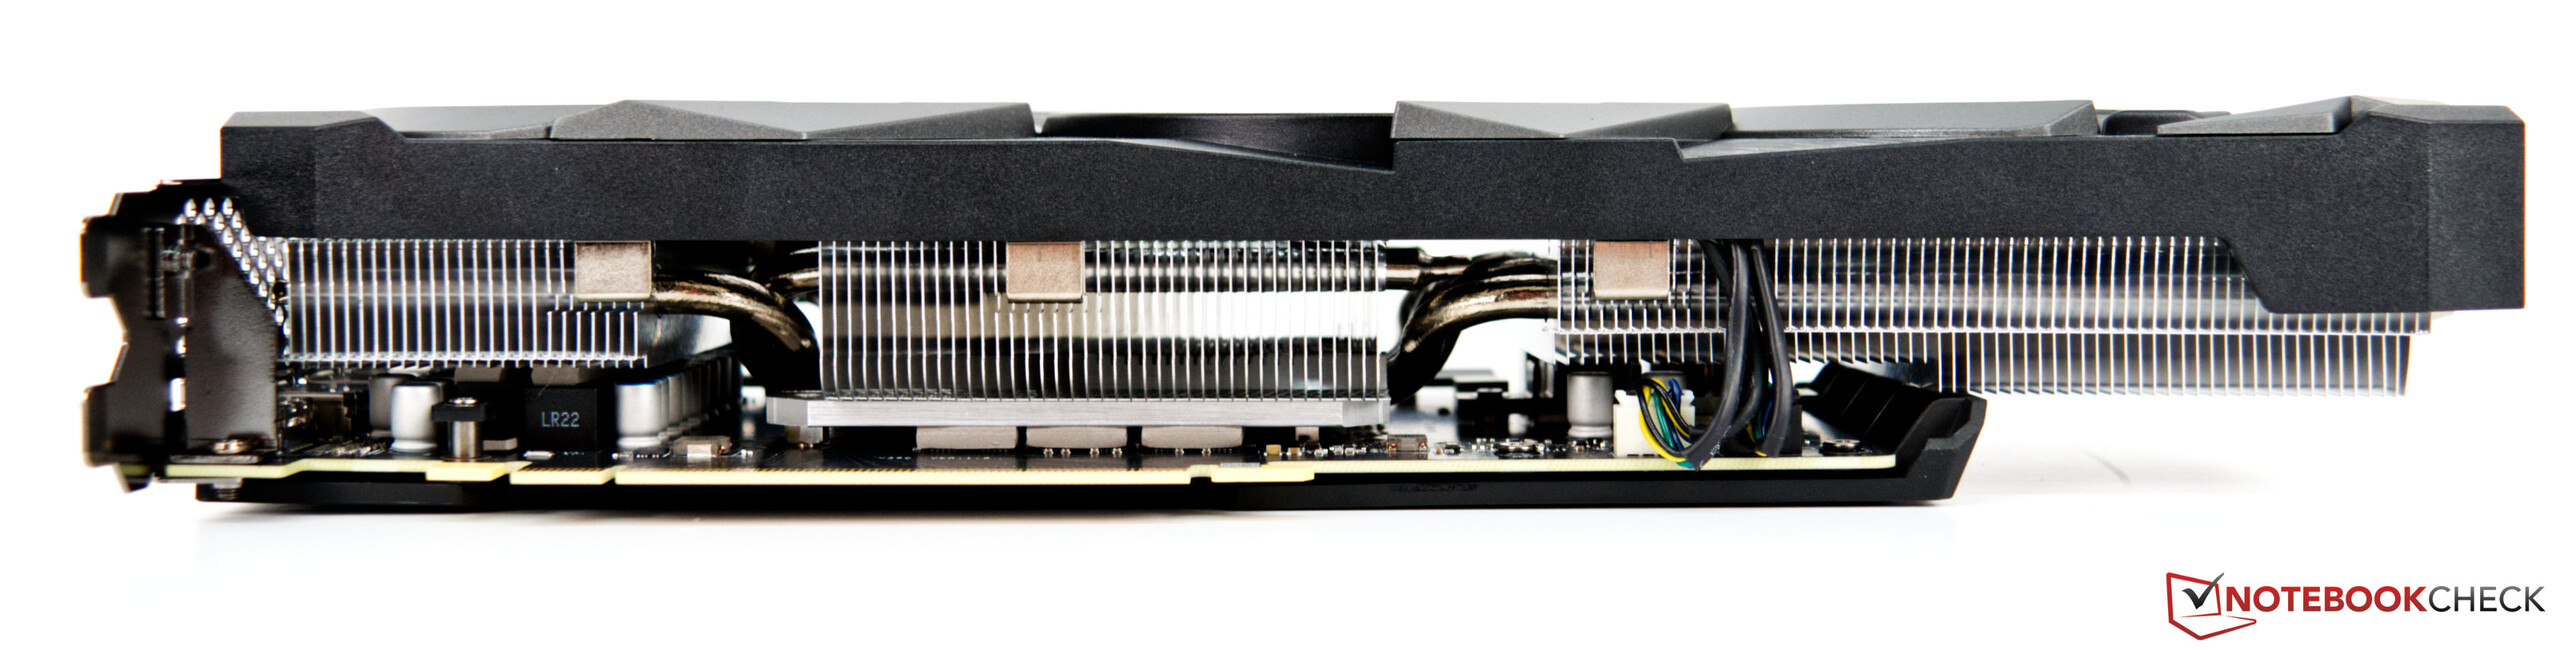
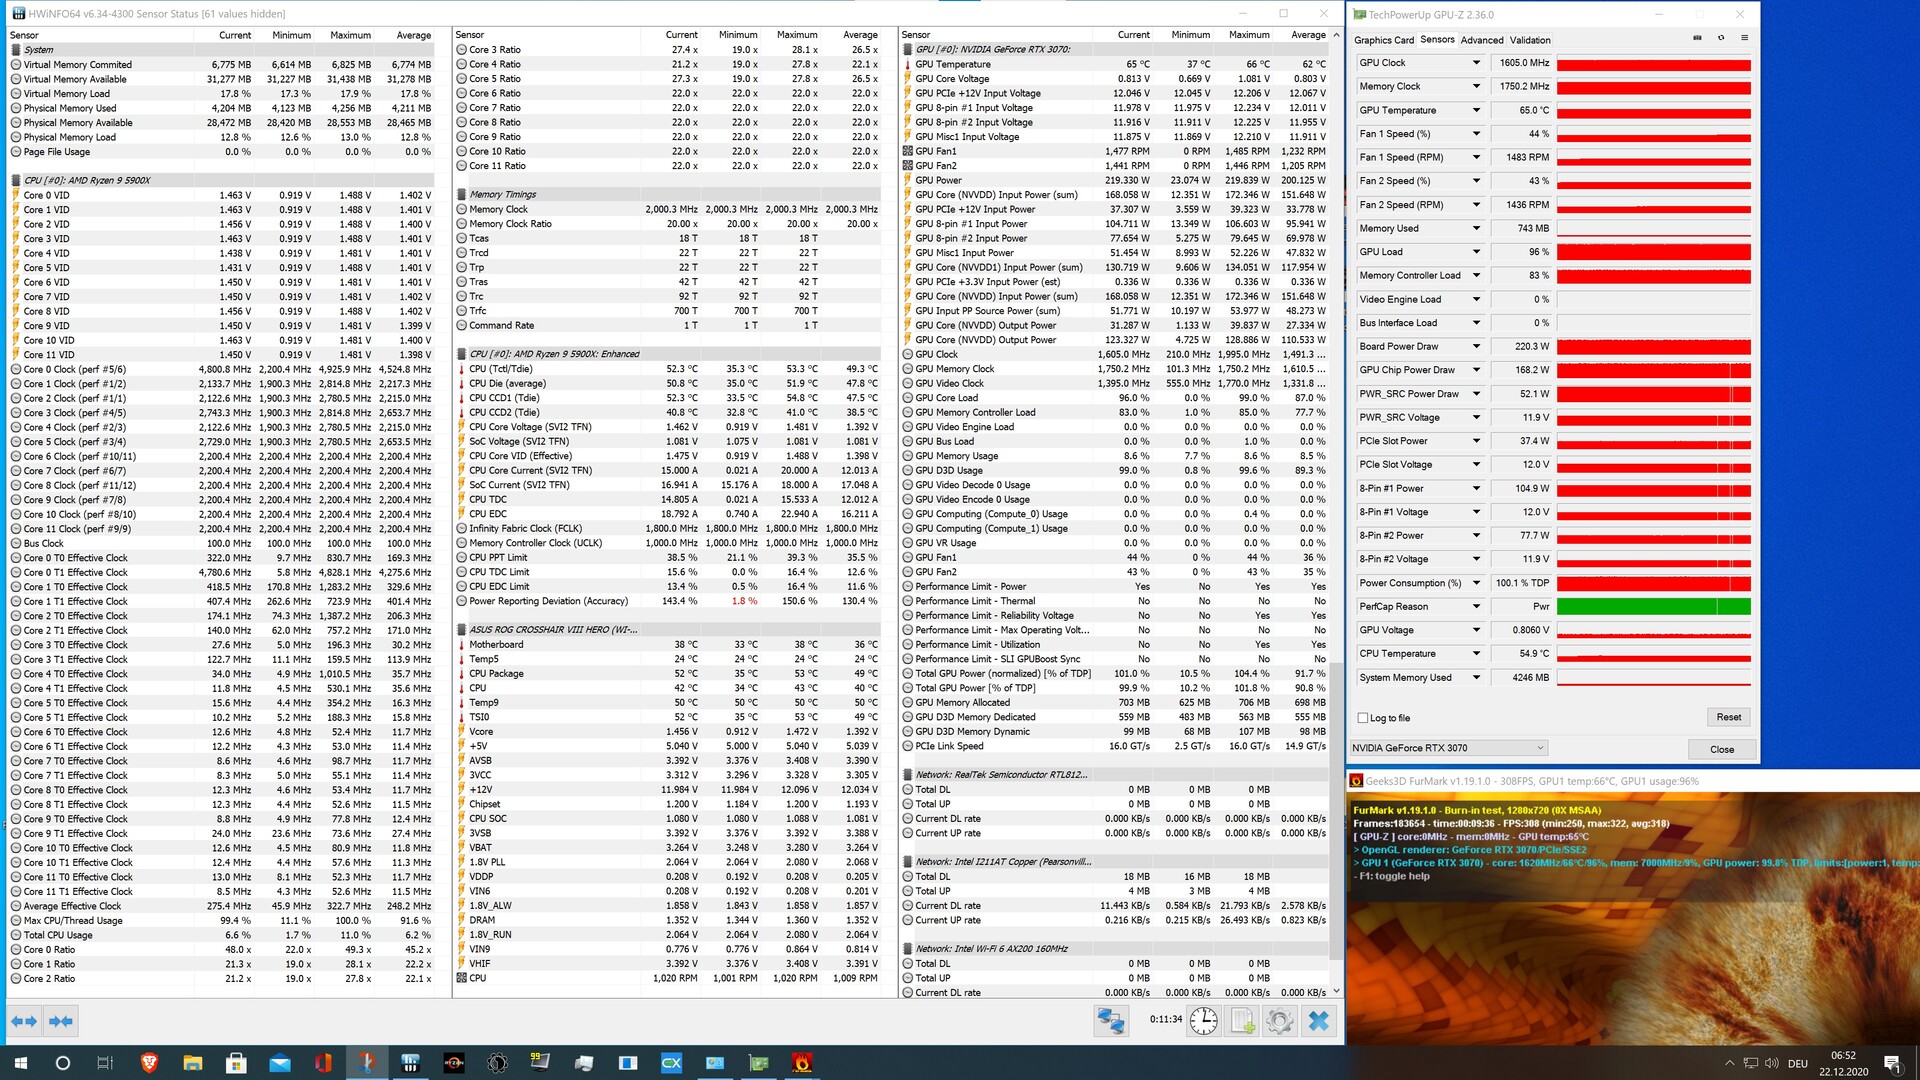
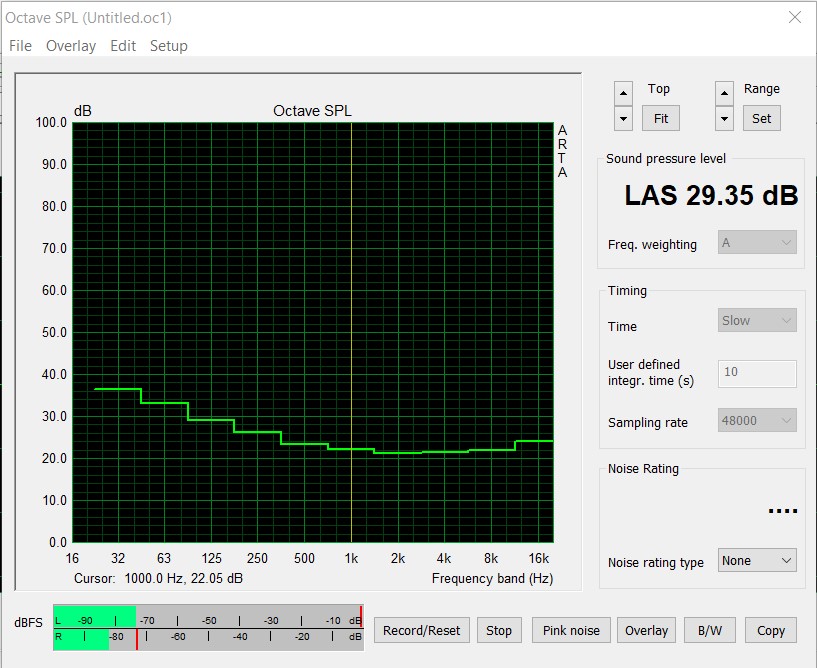
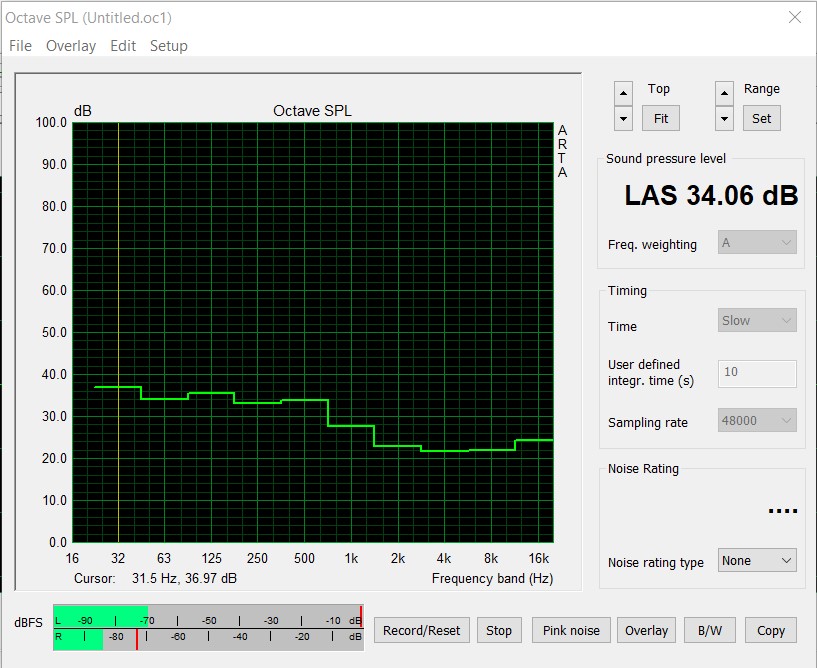
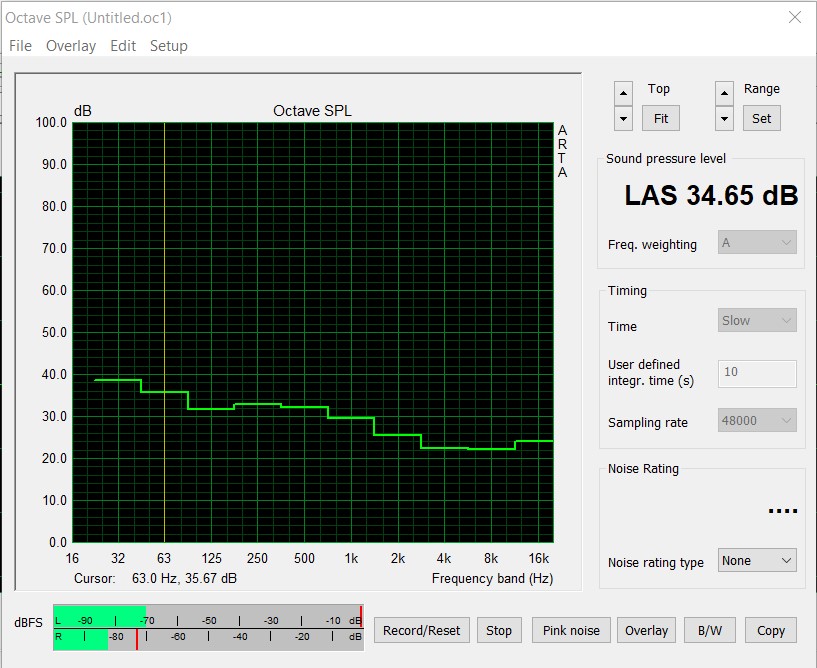
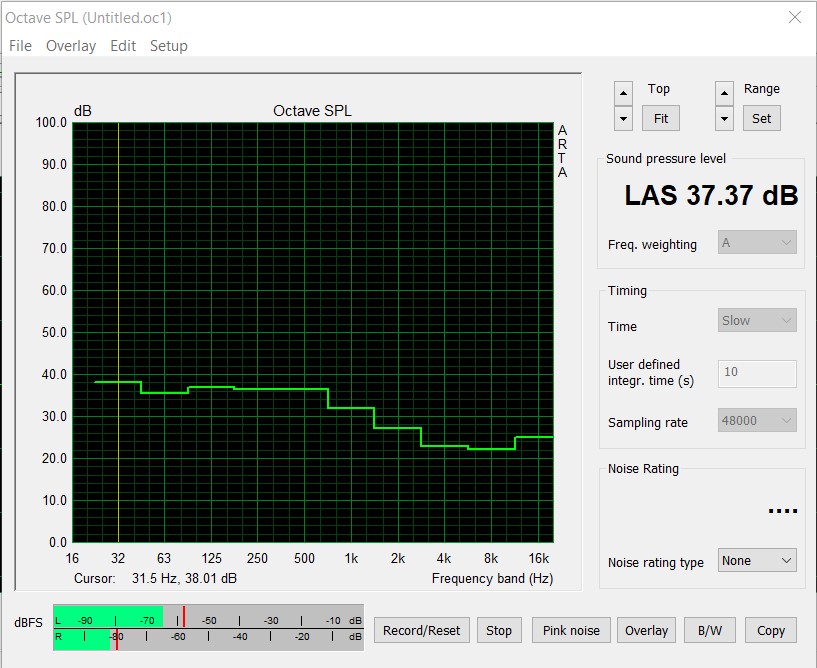
In terms of noise emissions, the MSI GeForce RTX 3070 Ventus 3X OC is also highly recommendable. During the stress test, we measured 34.6 dB(A) at a distance of 20 centimeters (~8 in) from the case. Here, we turned off all case fans to only record the graphics card. If we turn the case fans on again, the noise level increases to 37.3 dB(A) during the stress test, which is still a very good result. The graphics card's fan speed was just under 1,500 rpm, which corresponds to 44 percent. With a maximum of 65 °C (149 °F), our test sample remained relatively cool even under load. Although the installed cooler looks a bit cheap compared to the Gaming X Trio variant, it achieved very good results with the RTX 3070 Ventus 3X OC.
* ... smaller is better
Pros
Cons
Conclusion - Fast, quiet and low emissions

The MSI GeForce RTX 3070 Ventus 3X OC is a modern, fast graphics card without a lot of bling bling and is also fast enough to play all current titles in 1440p. This model also partially masters games in 4K, although you have to look from game to game here.
If you compare the performance with the Turing generation, the GeForce RTX 3070 is on par with a GeForce RTX 2080 Ti, which was offered with an MSRP of 1,249 Euros (~$1516) at release. For our model from MSI, the MSRP is now 529 Euros (~$642). Unfortunately, these prices are just wishful thinking at the moment because the market situation has been very tense since the release of the new Ampere graphics cards. This of course has an impact on the price, which is just under 800 Euros (~$971) for our test sample at the time of testing. So, if you don't absolutely need a new graphics card, you should be patient until Nvidia and the board partners can deliver graphics cards in sufficient quantities. Only then can the current situation be expected to ease. On the other hand, things don't look any better for AMD.
With the MSI GeForce RTX 3070 Ventus 3X OC, you get a fast and modern Ampere graphics card that convinces in terms of emissions.
But back to the graphics card. Overall, the MSI GeForce RTX 3070 Ventus 3X OC delivers a good performance and can also completely convince in terms of emissions. The fan-stop mode ensures silent operation under low load, which will please silent freaks.
The only real point of criticism we can mention here is the price. However, the length of the graphics card should also be taken into account, because compact cases might be ruled out here. If you are planning to buy an RTX 3070, you should at least choose a 750-watt model when reaching for the power supply.
All benchmarks and test values of the RTX 3070 can be found on the graphics card page of the GeForce RTX 3070 (continuously updated).

