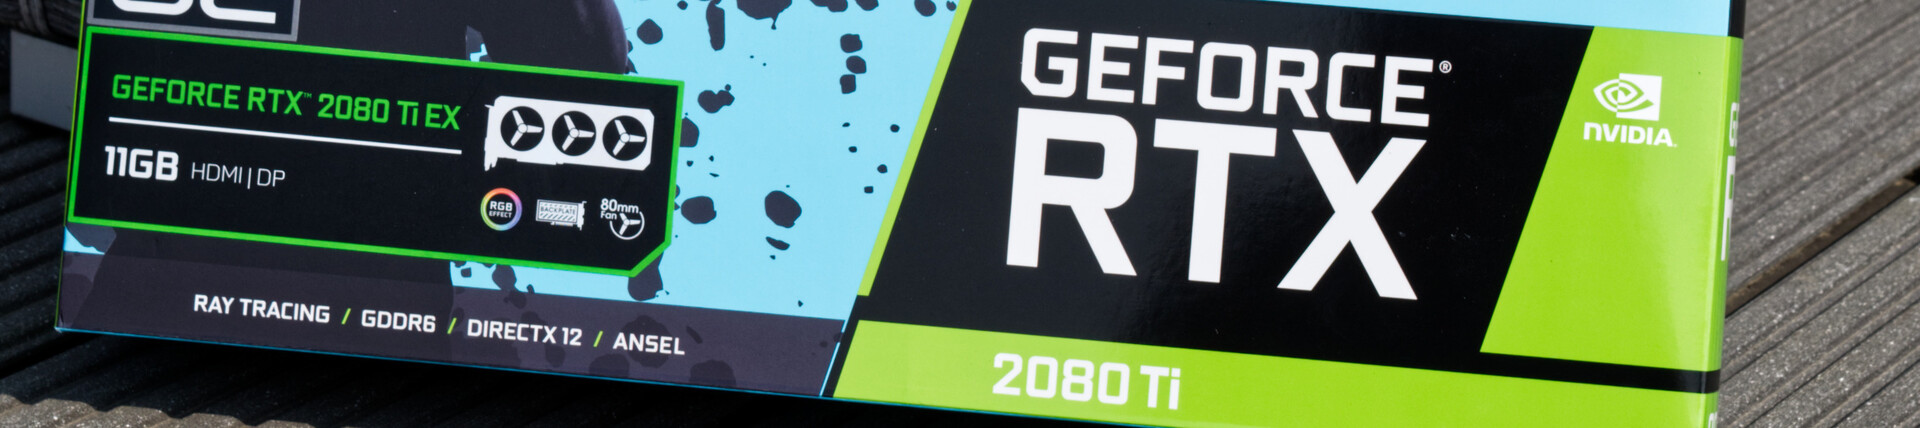
KFA2 GeForce RTX 2080 Ti EX Review - High-end Nvidia GPU with a custom cooling solution

After Nvidia released the Super-branded graphics cards, which were in fact just slightly improved versions of the RTX 2060, RTX 2070 and the RTX 2080, the GeForce RTX 2080 Ti remains the only Nvidia high-end GPU that has not been refreshed. However, with 11 GB of VRAM, this model offers more video memory than all other models. We have recently reviewed a GeForce RTX 2060 Super from KFA2 and now we have an opportunity to take a closer look at KFA2's GeForce RTX 2080 Ti EX.
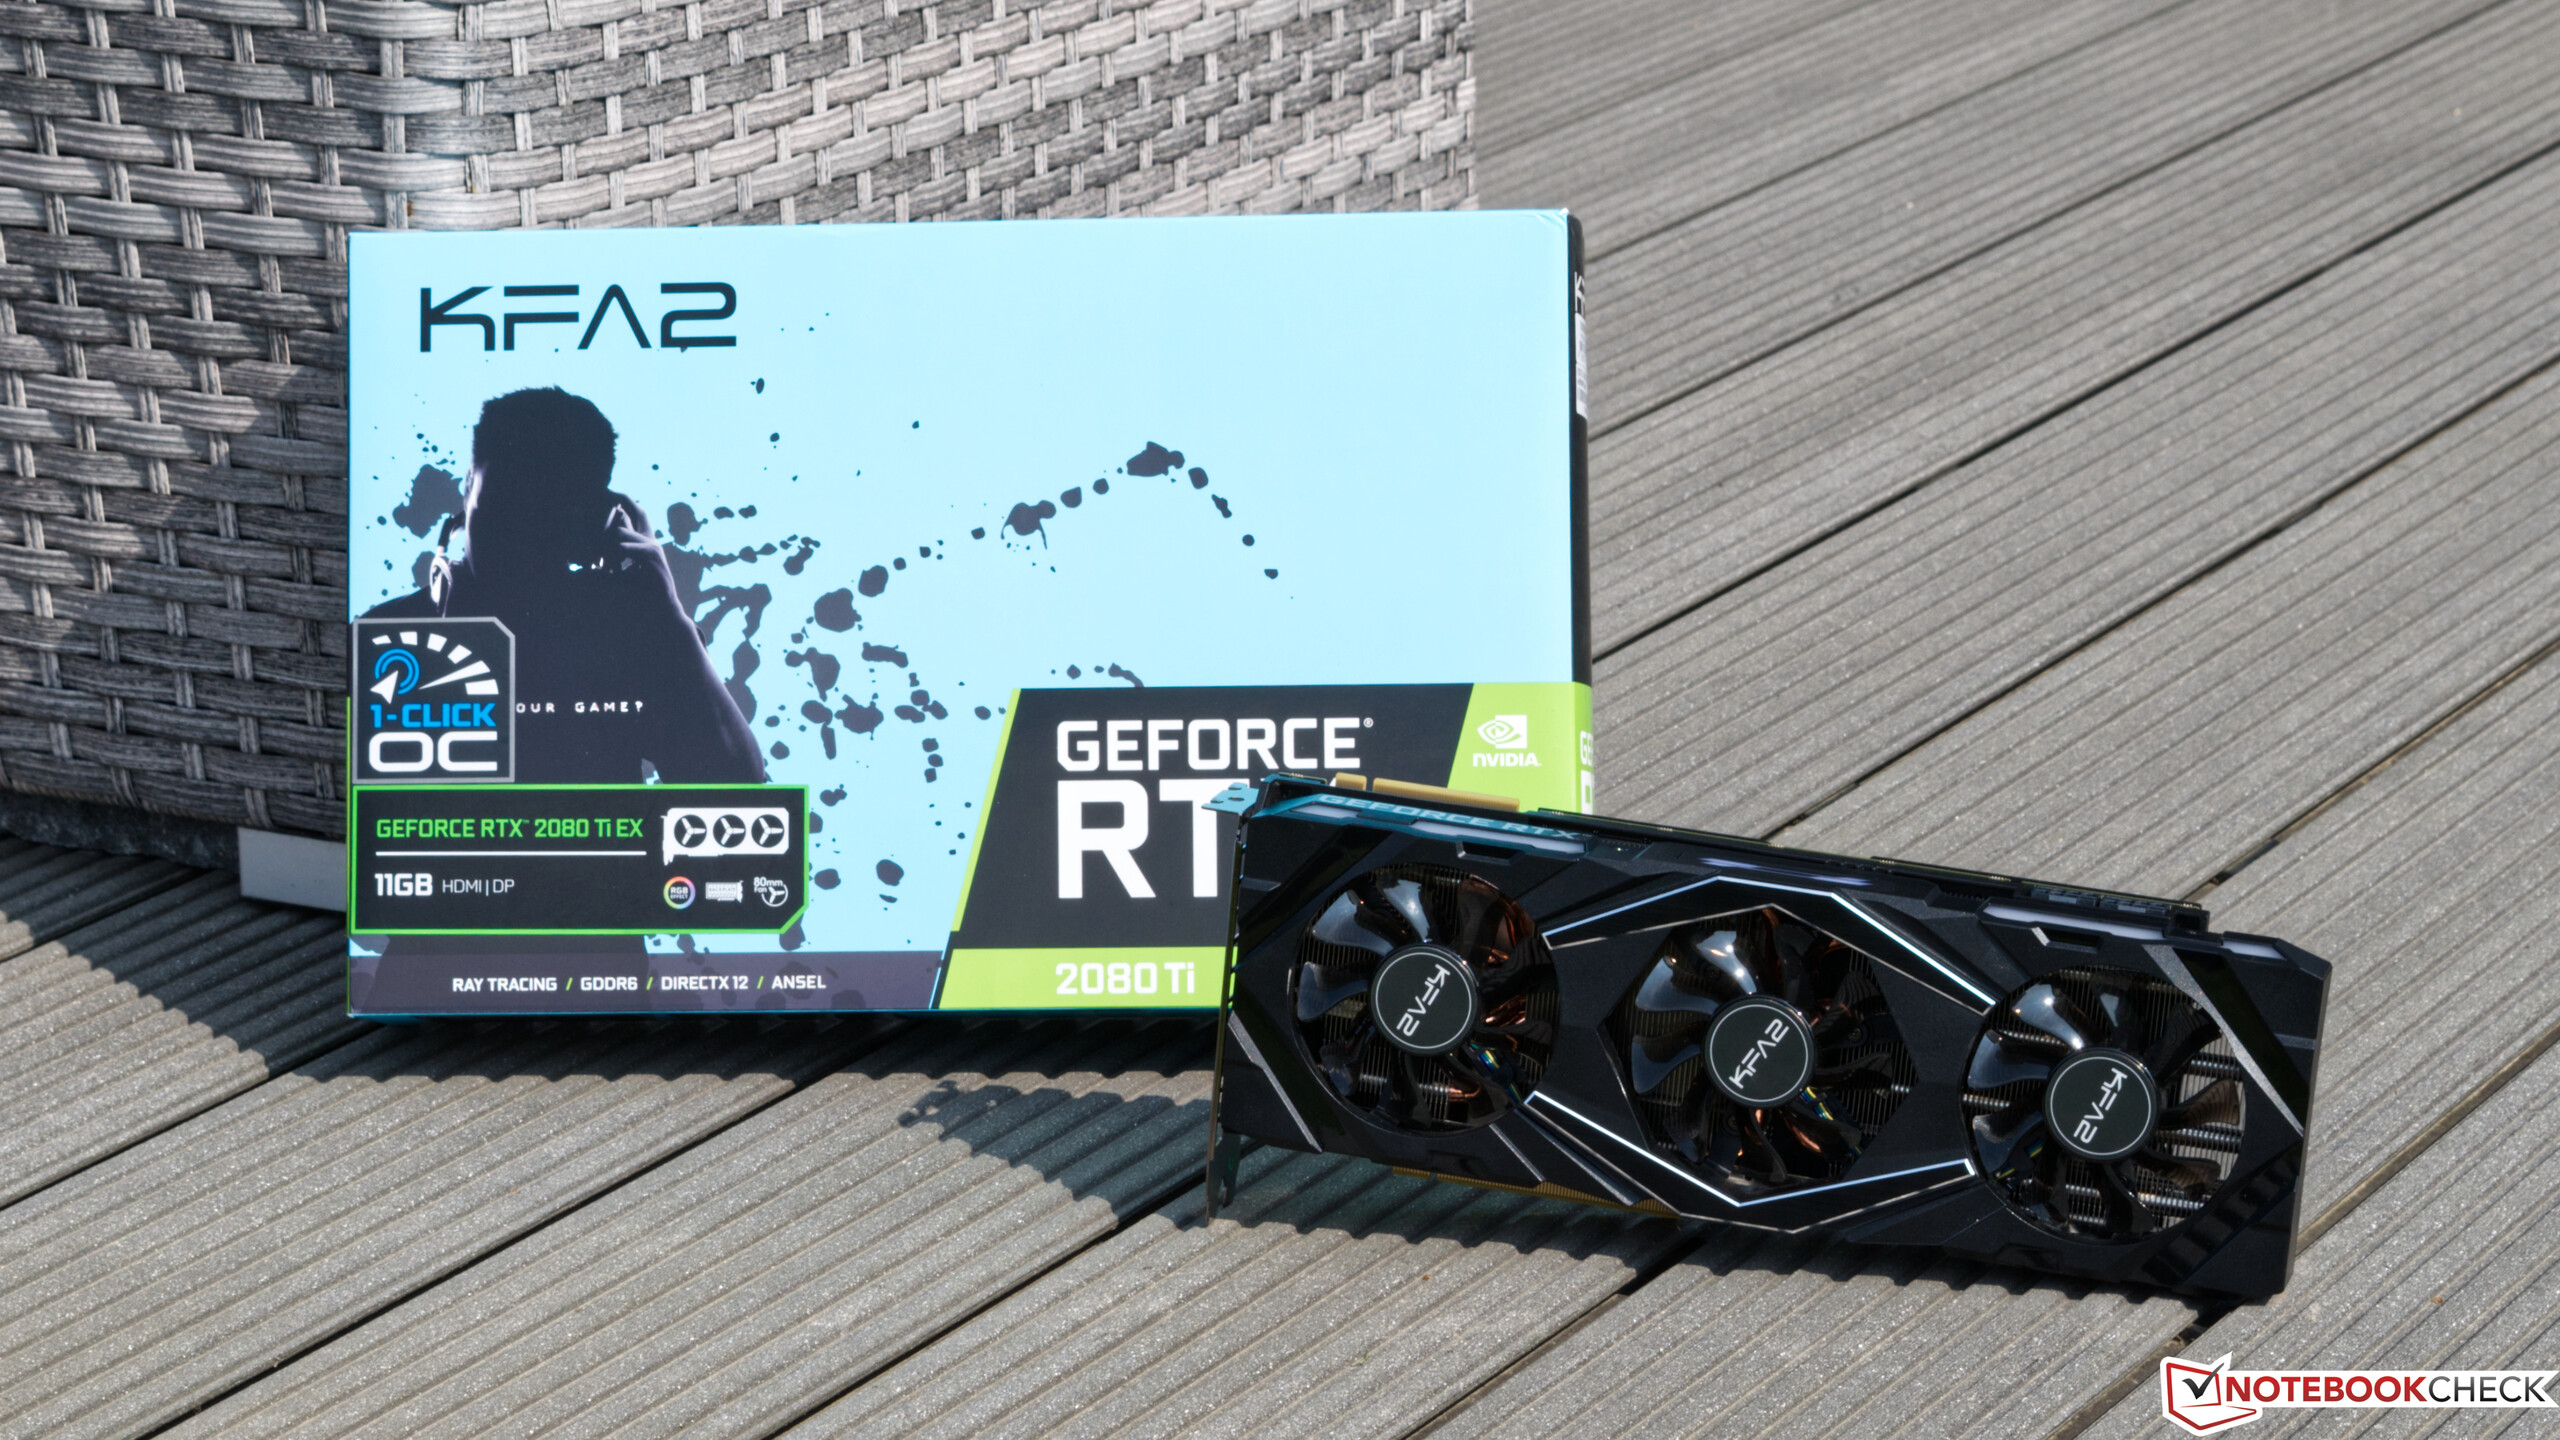
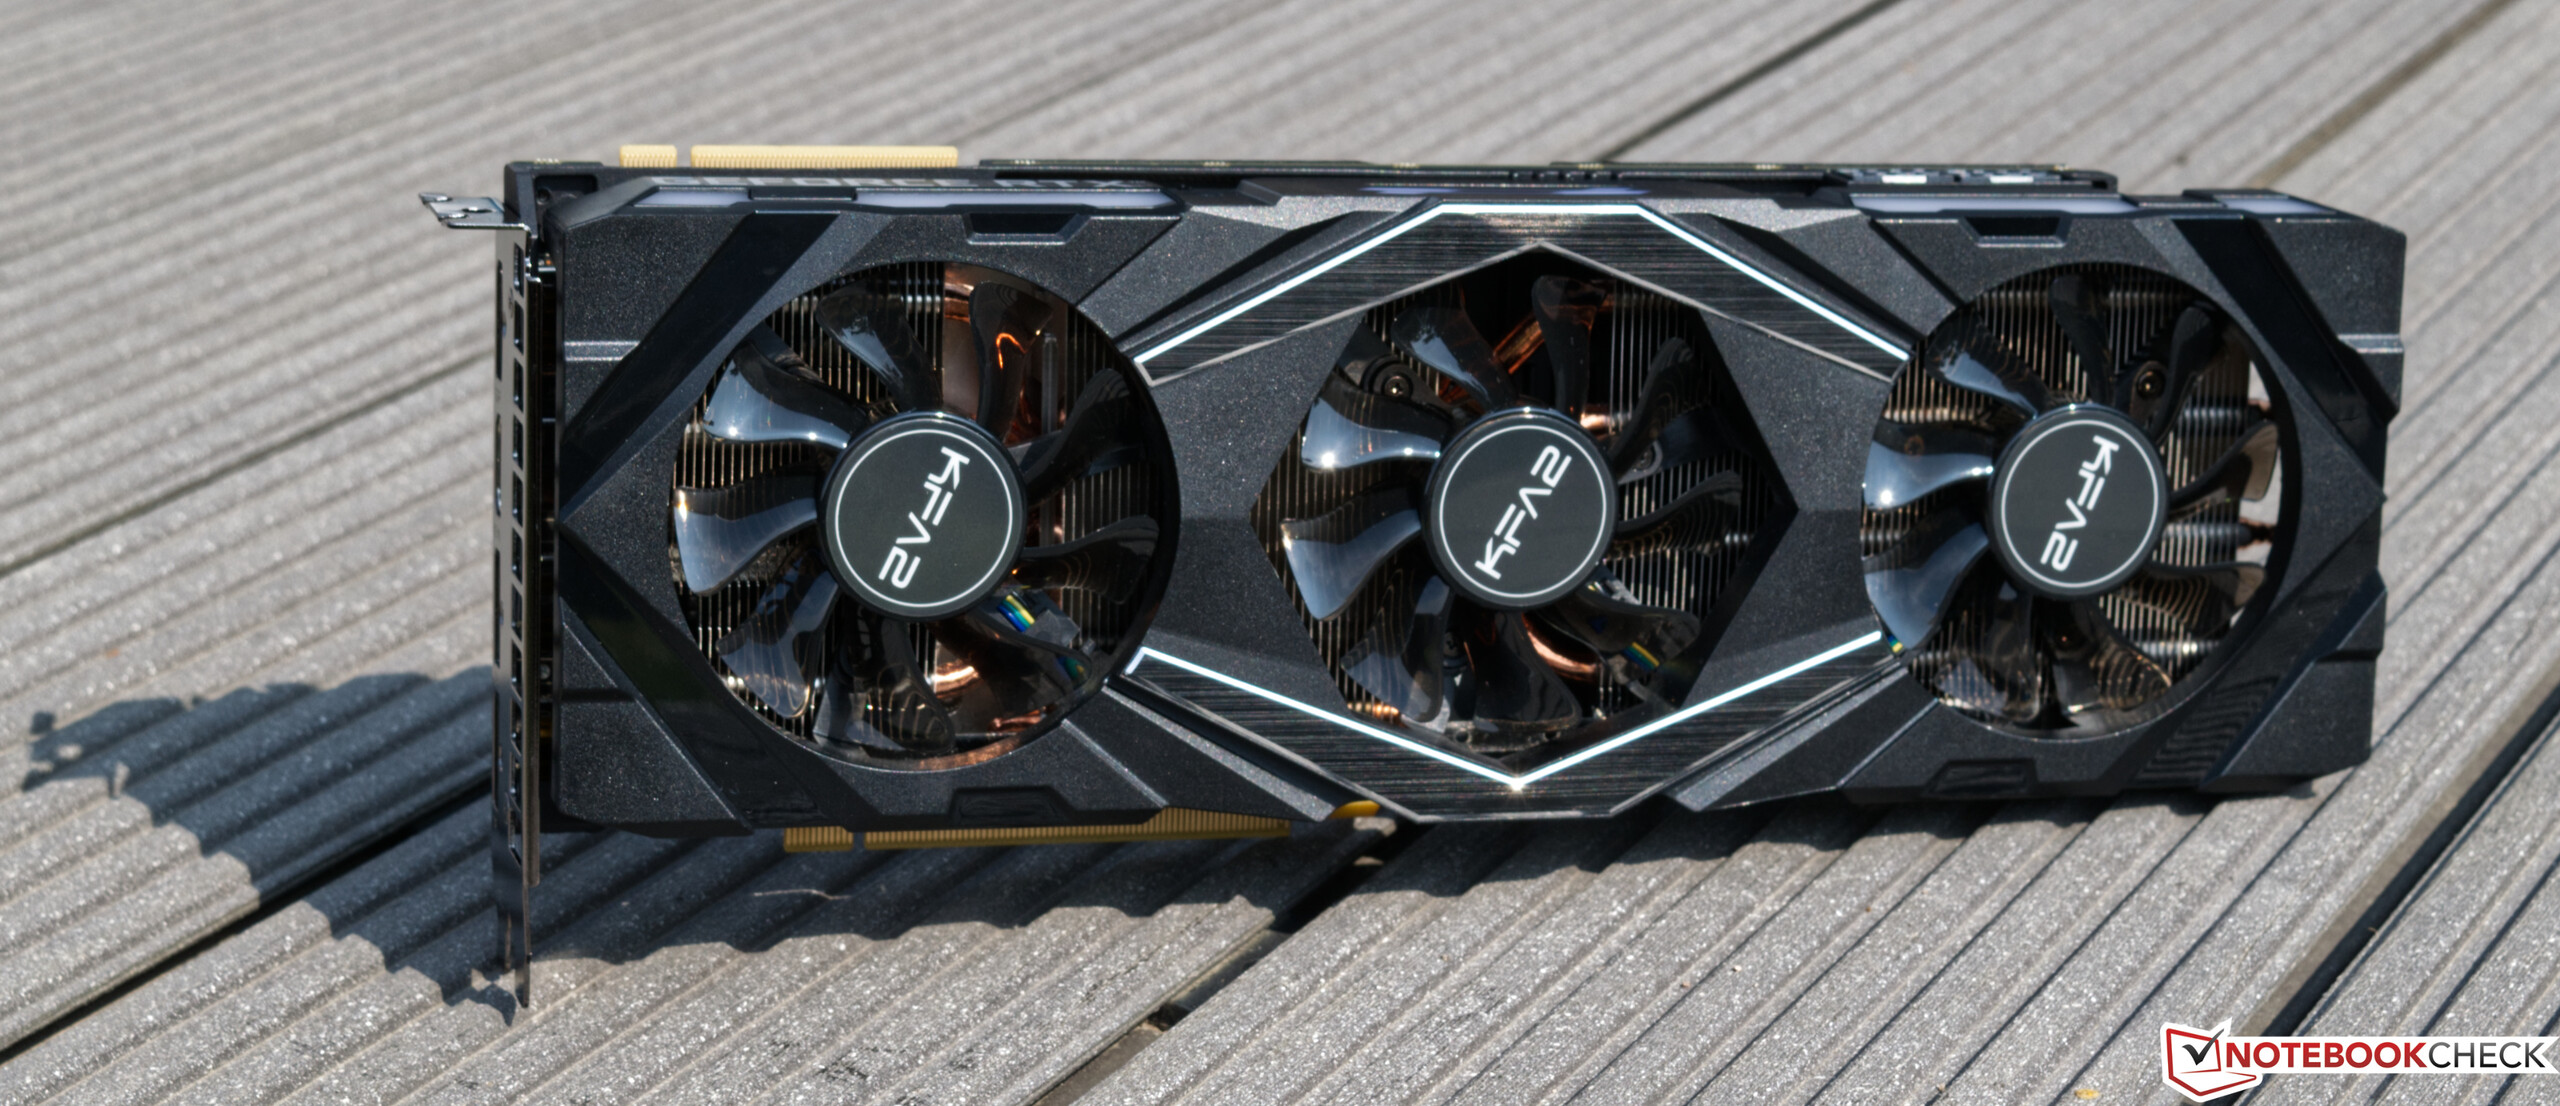
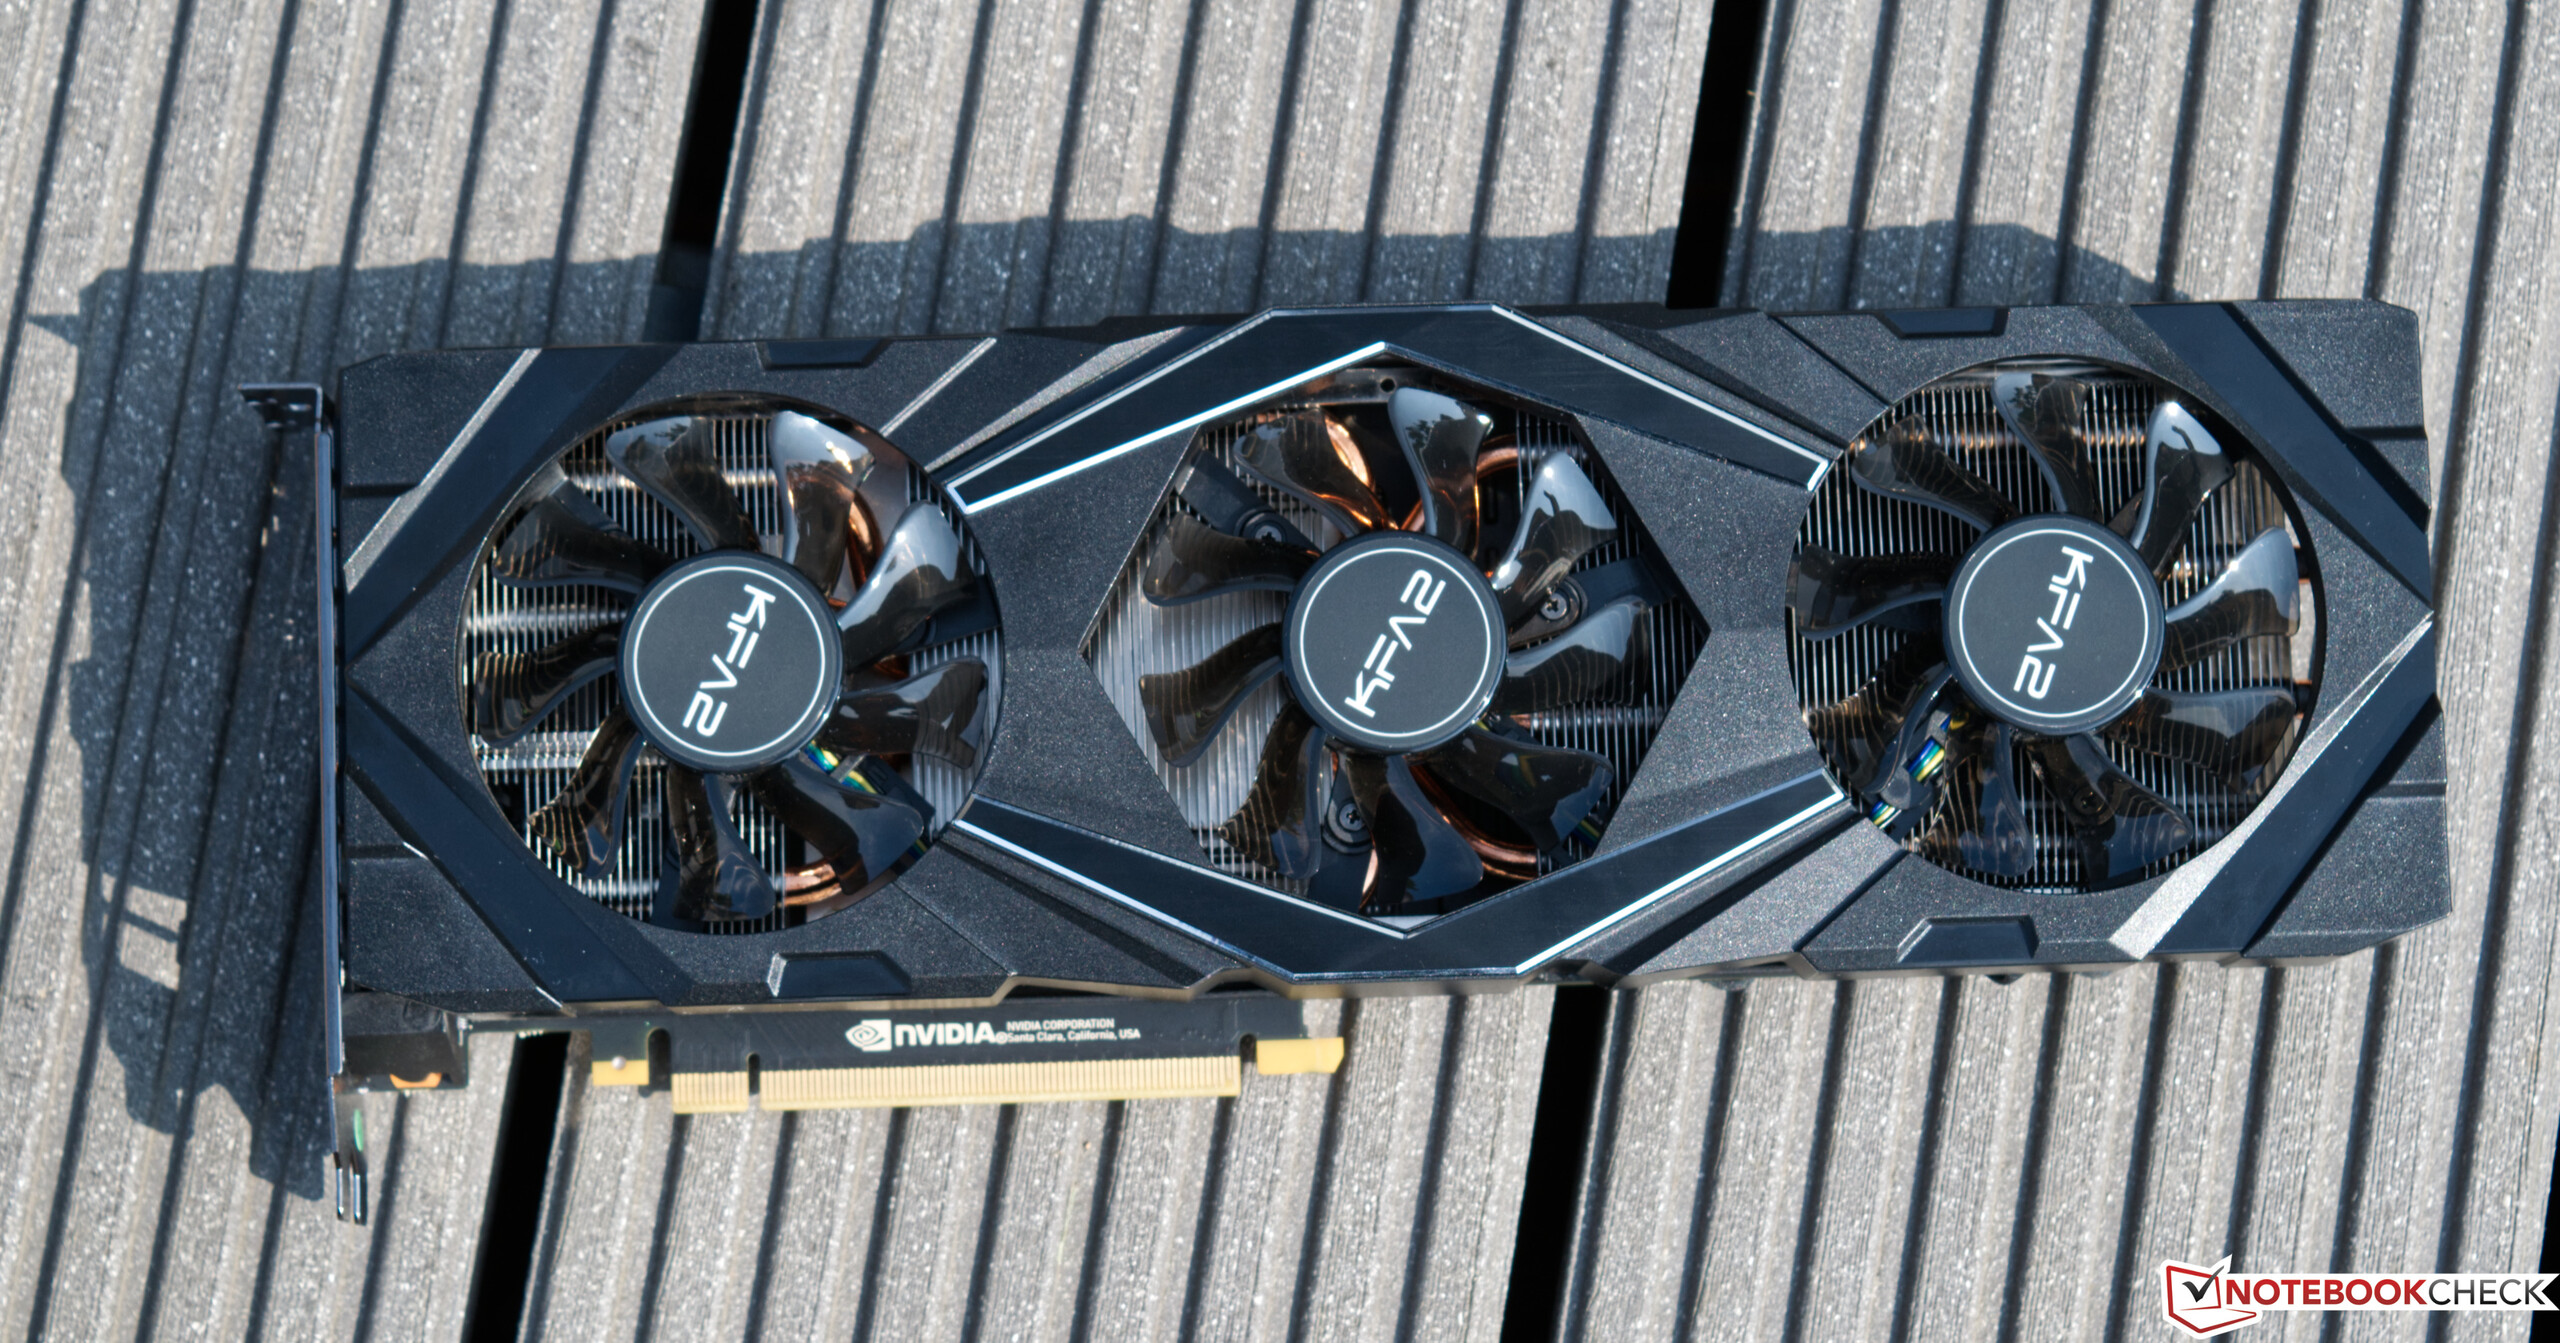
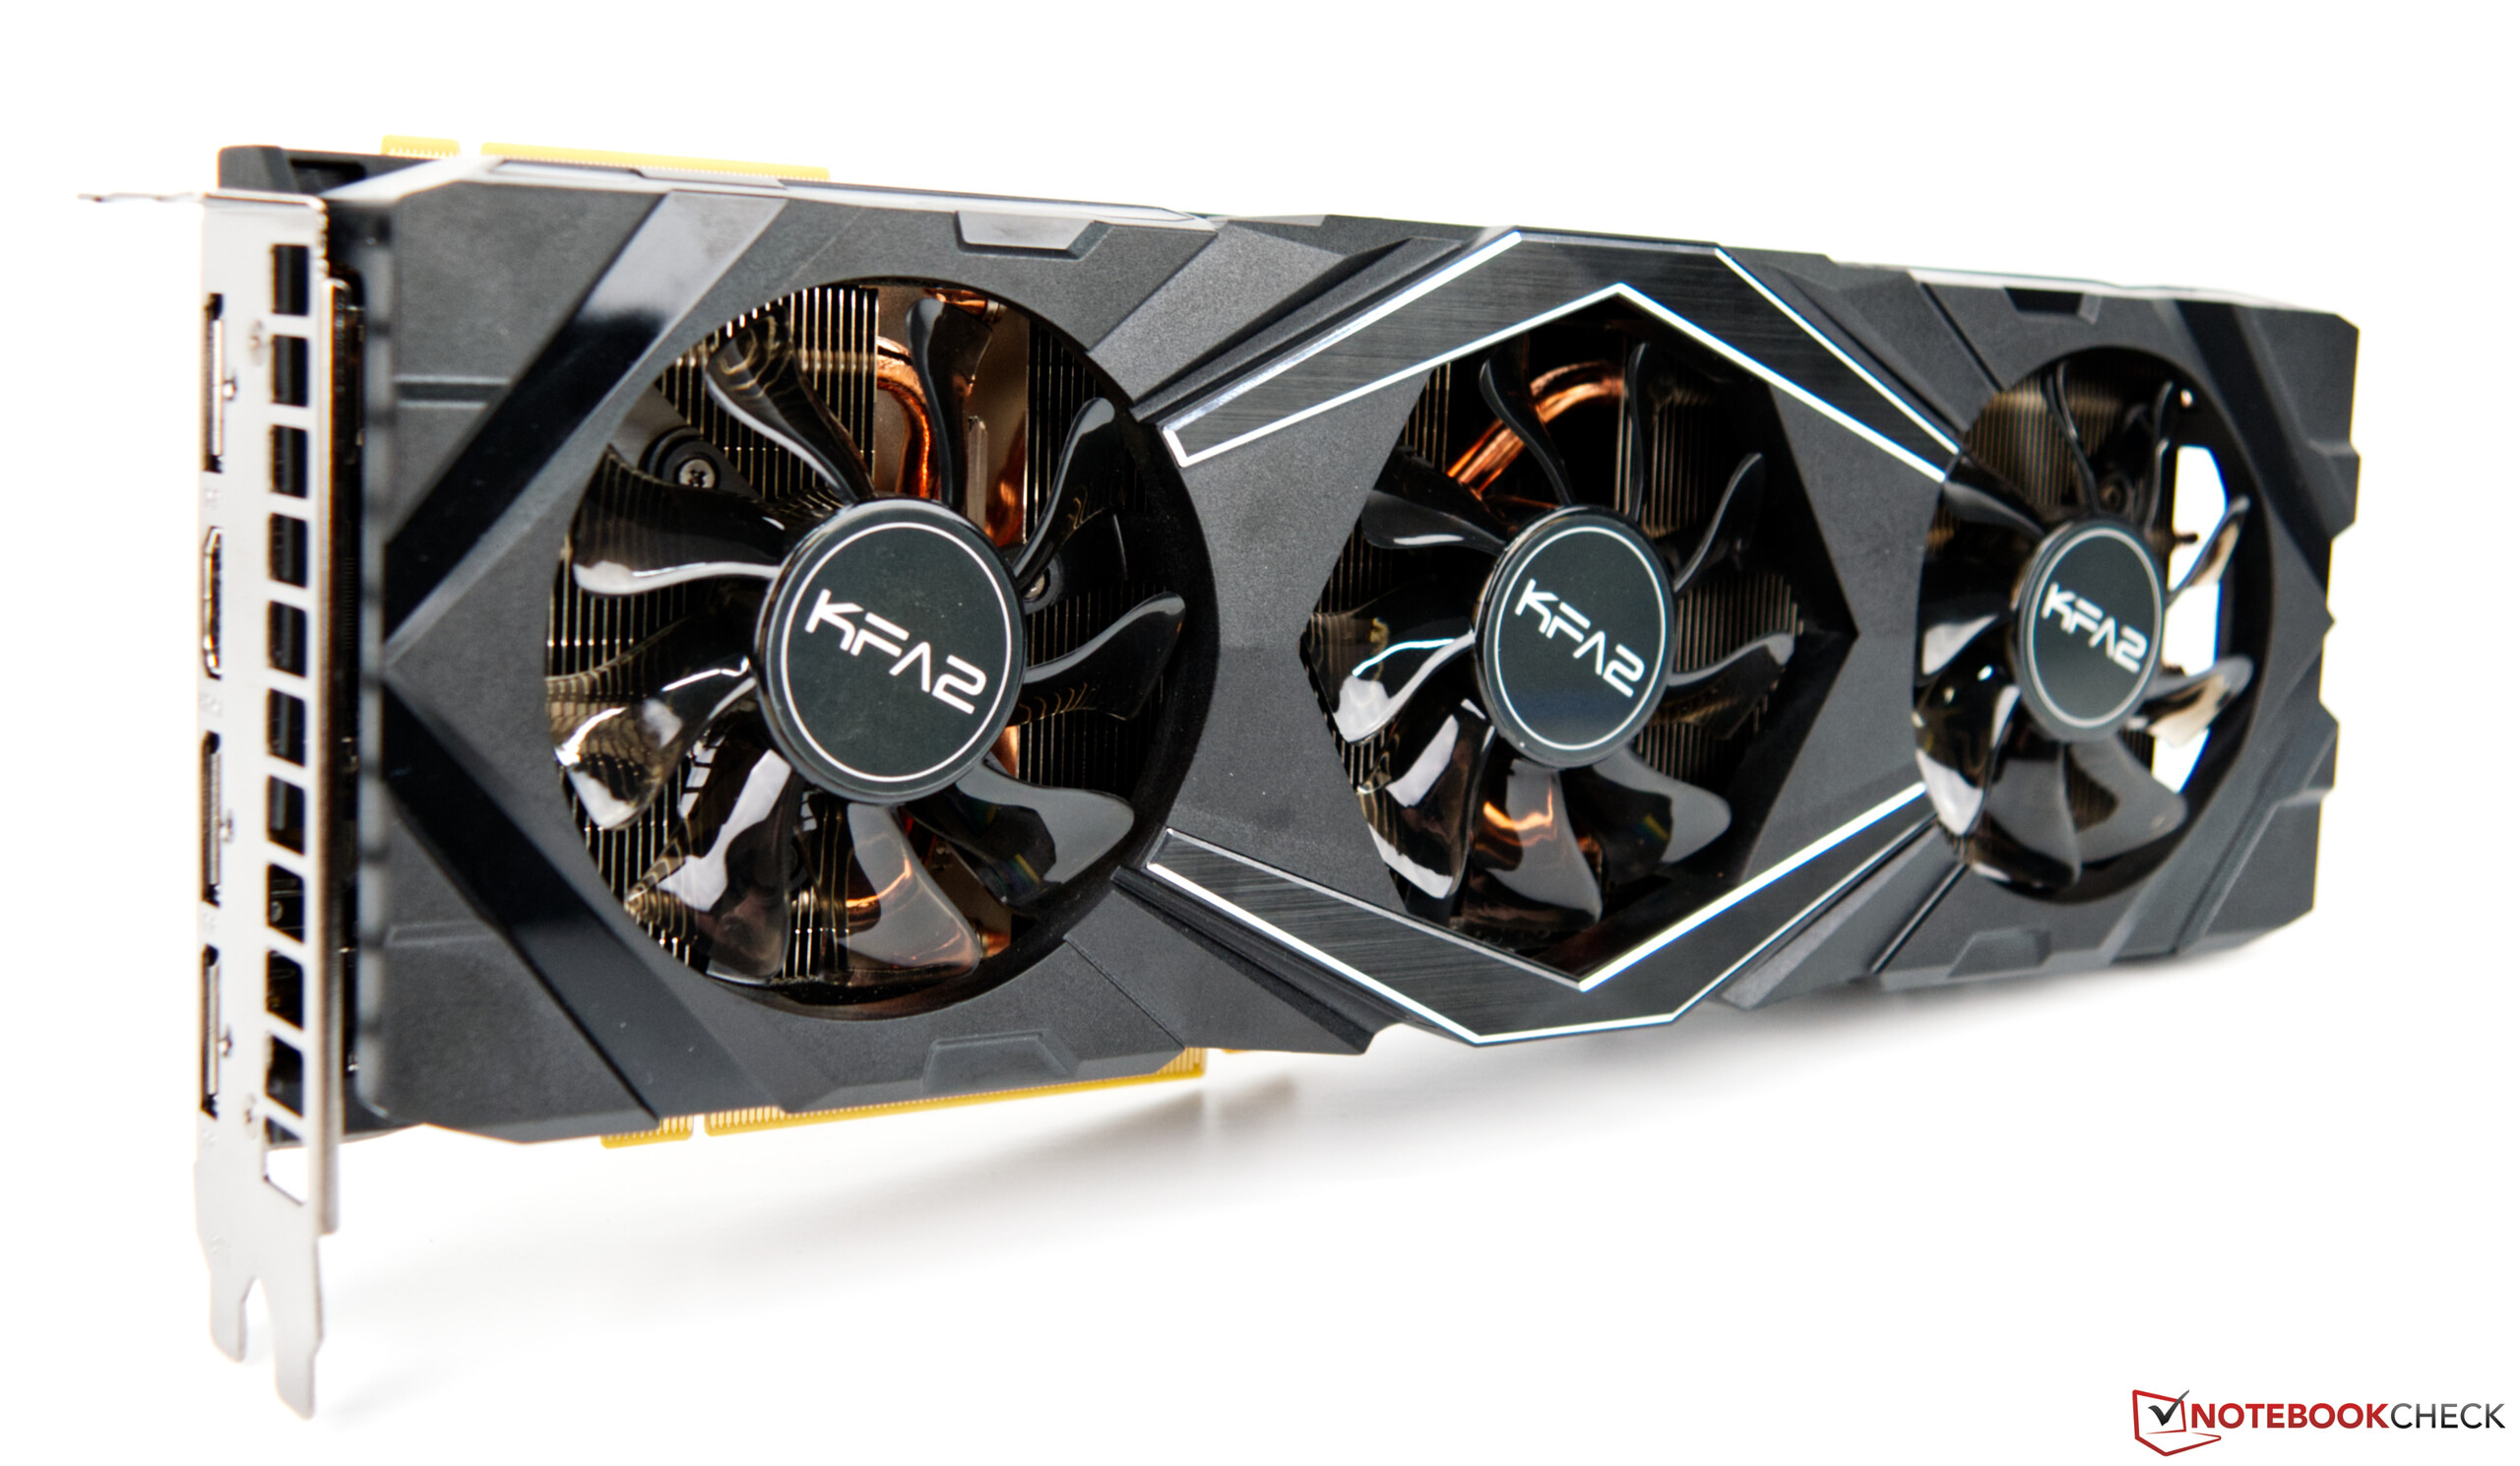
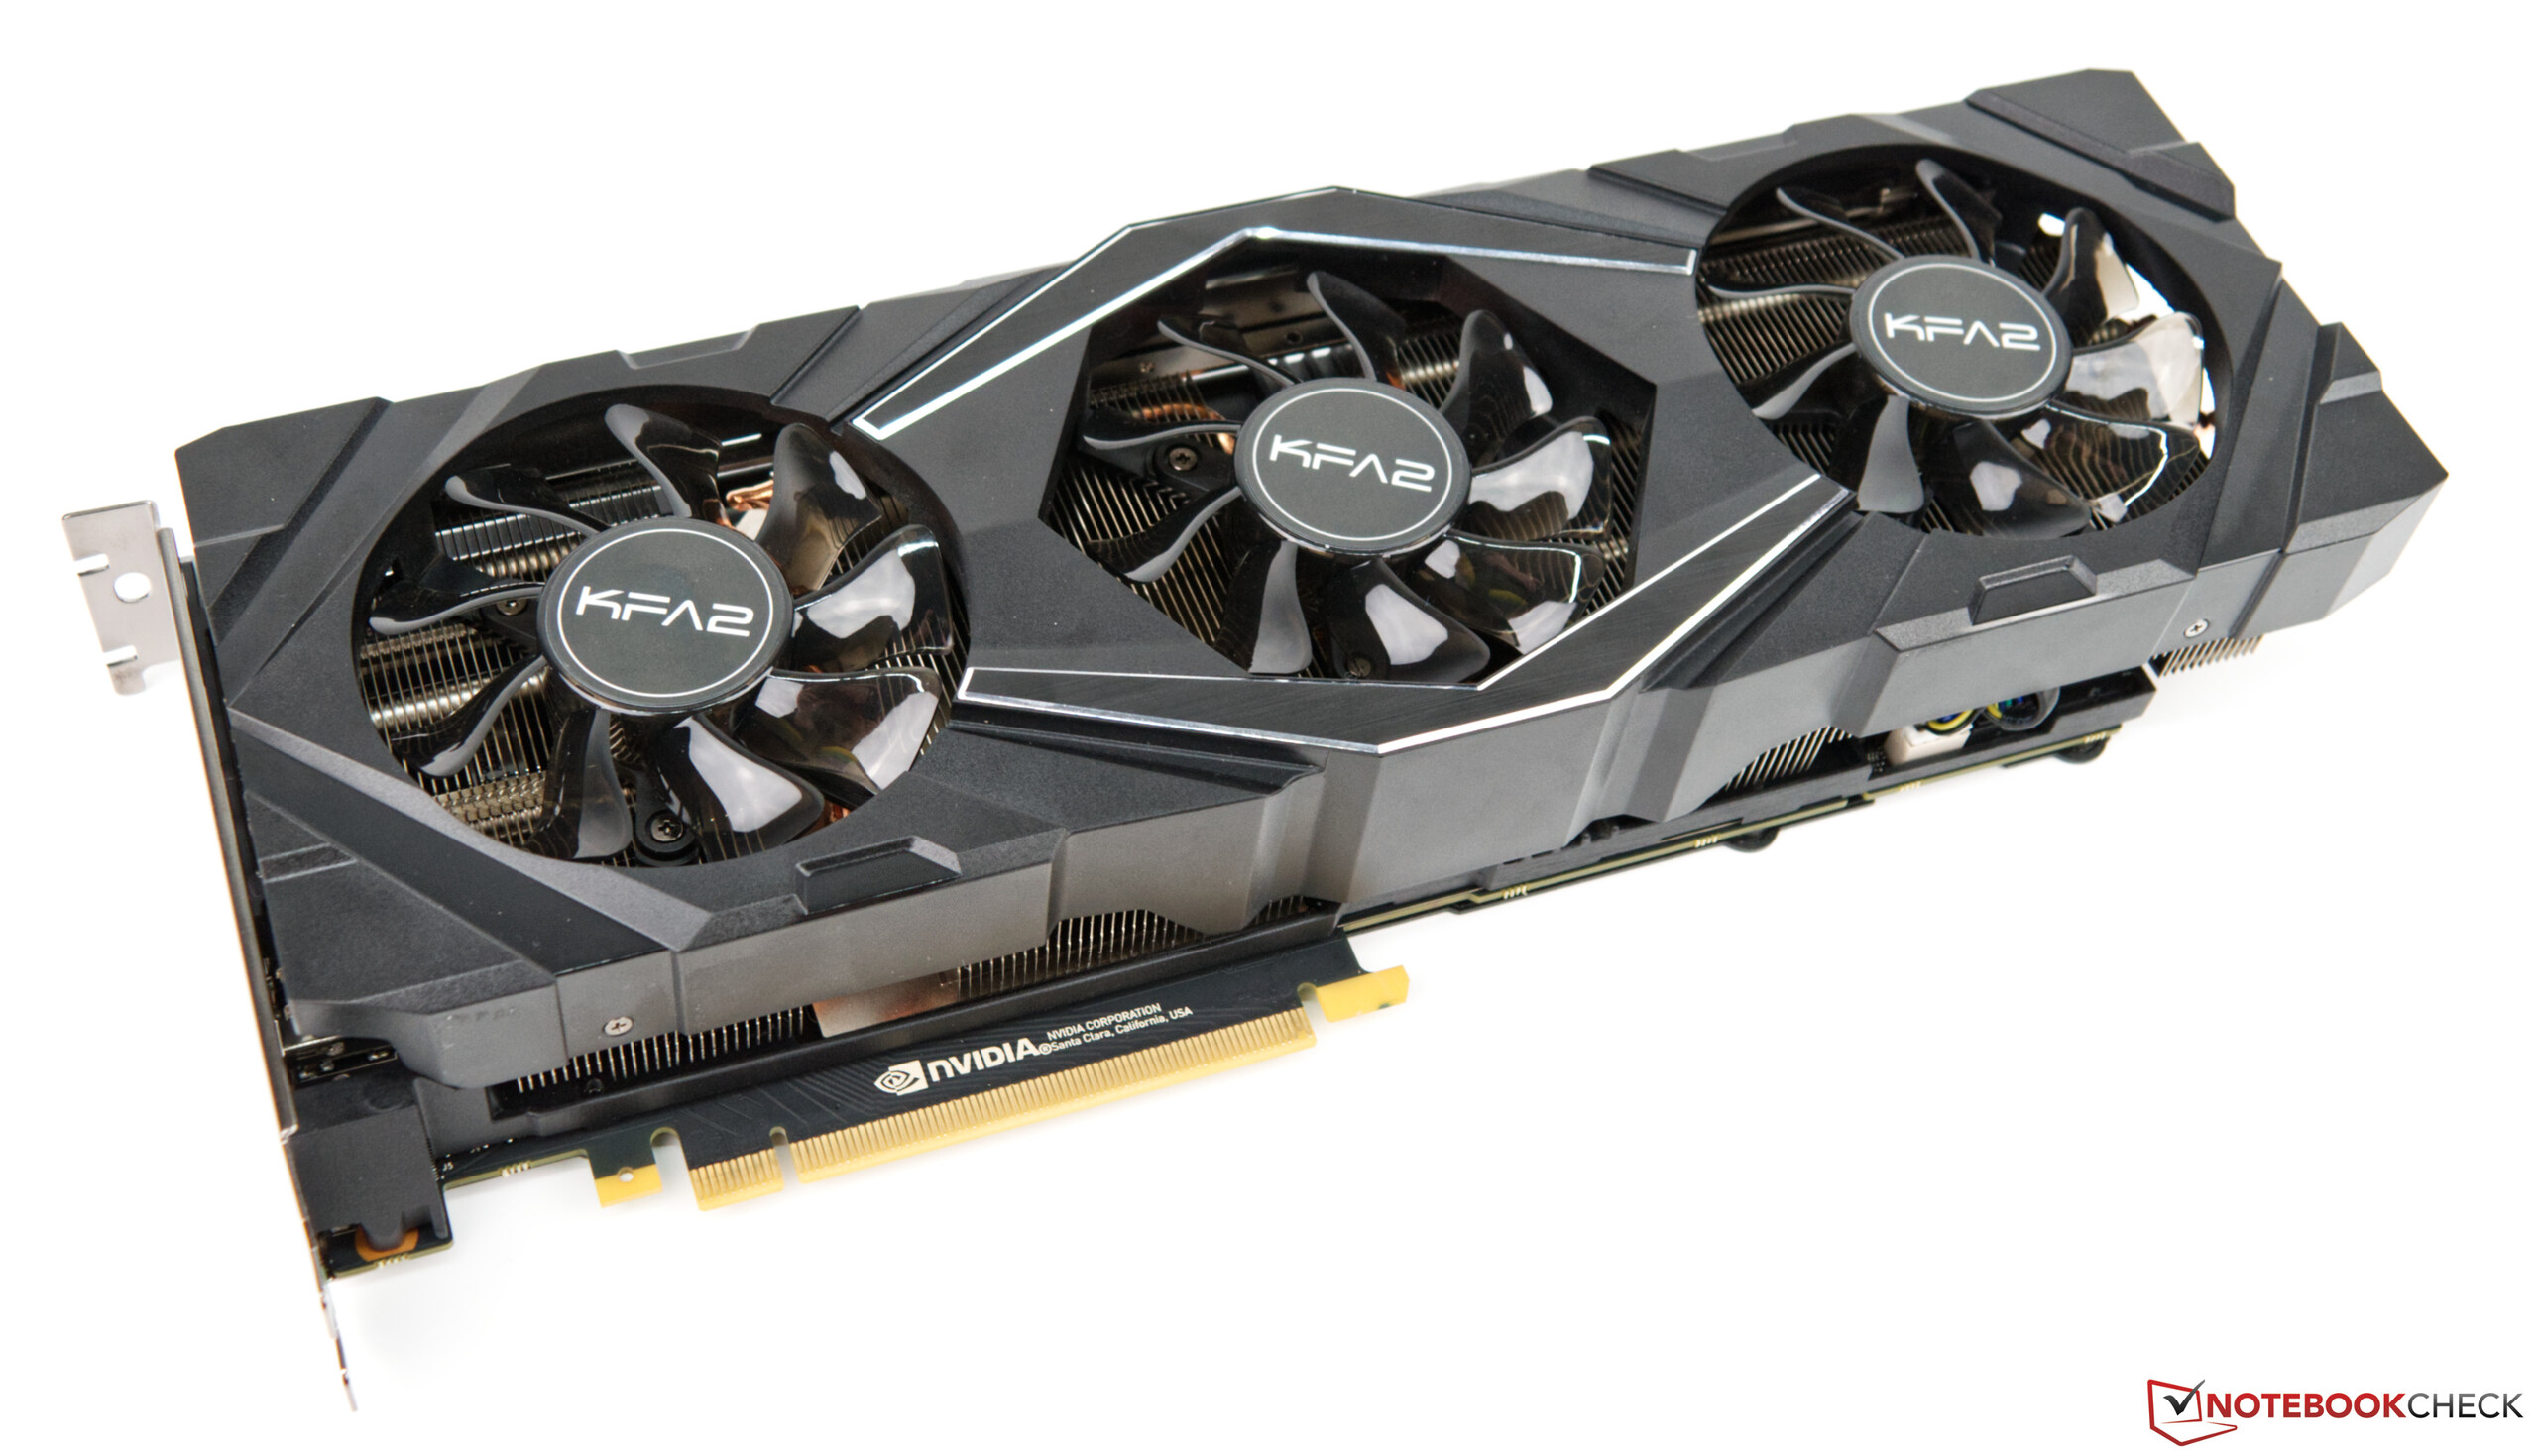
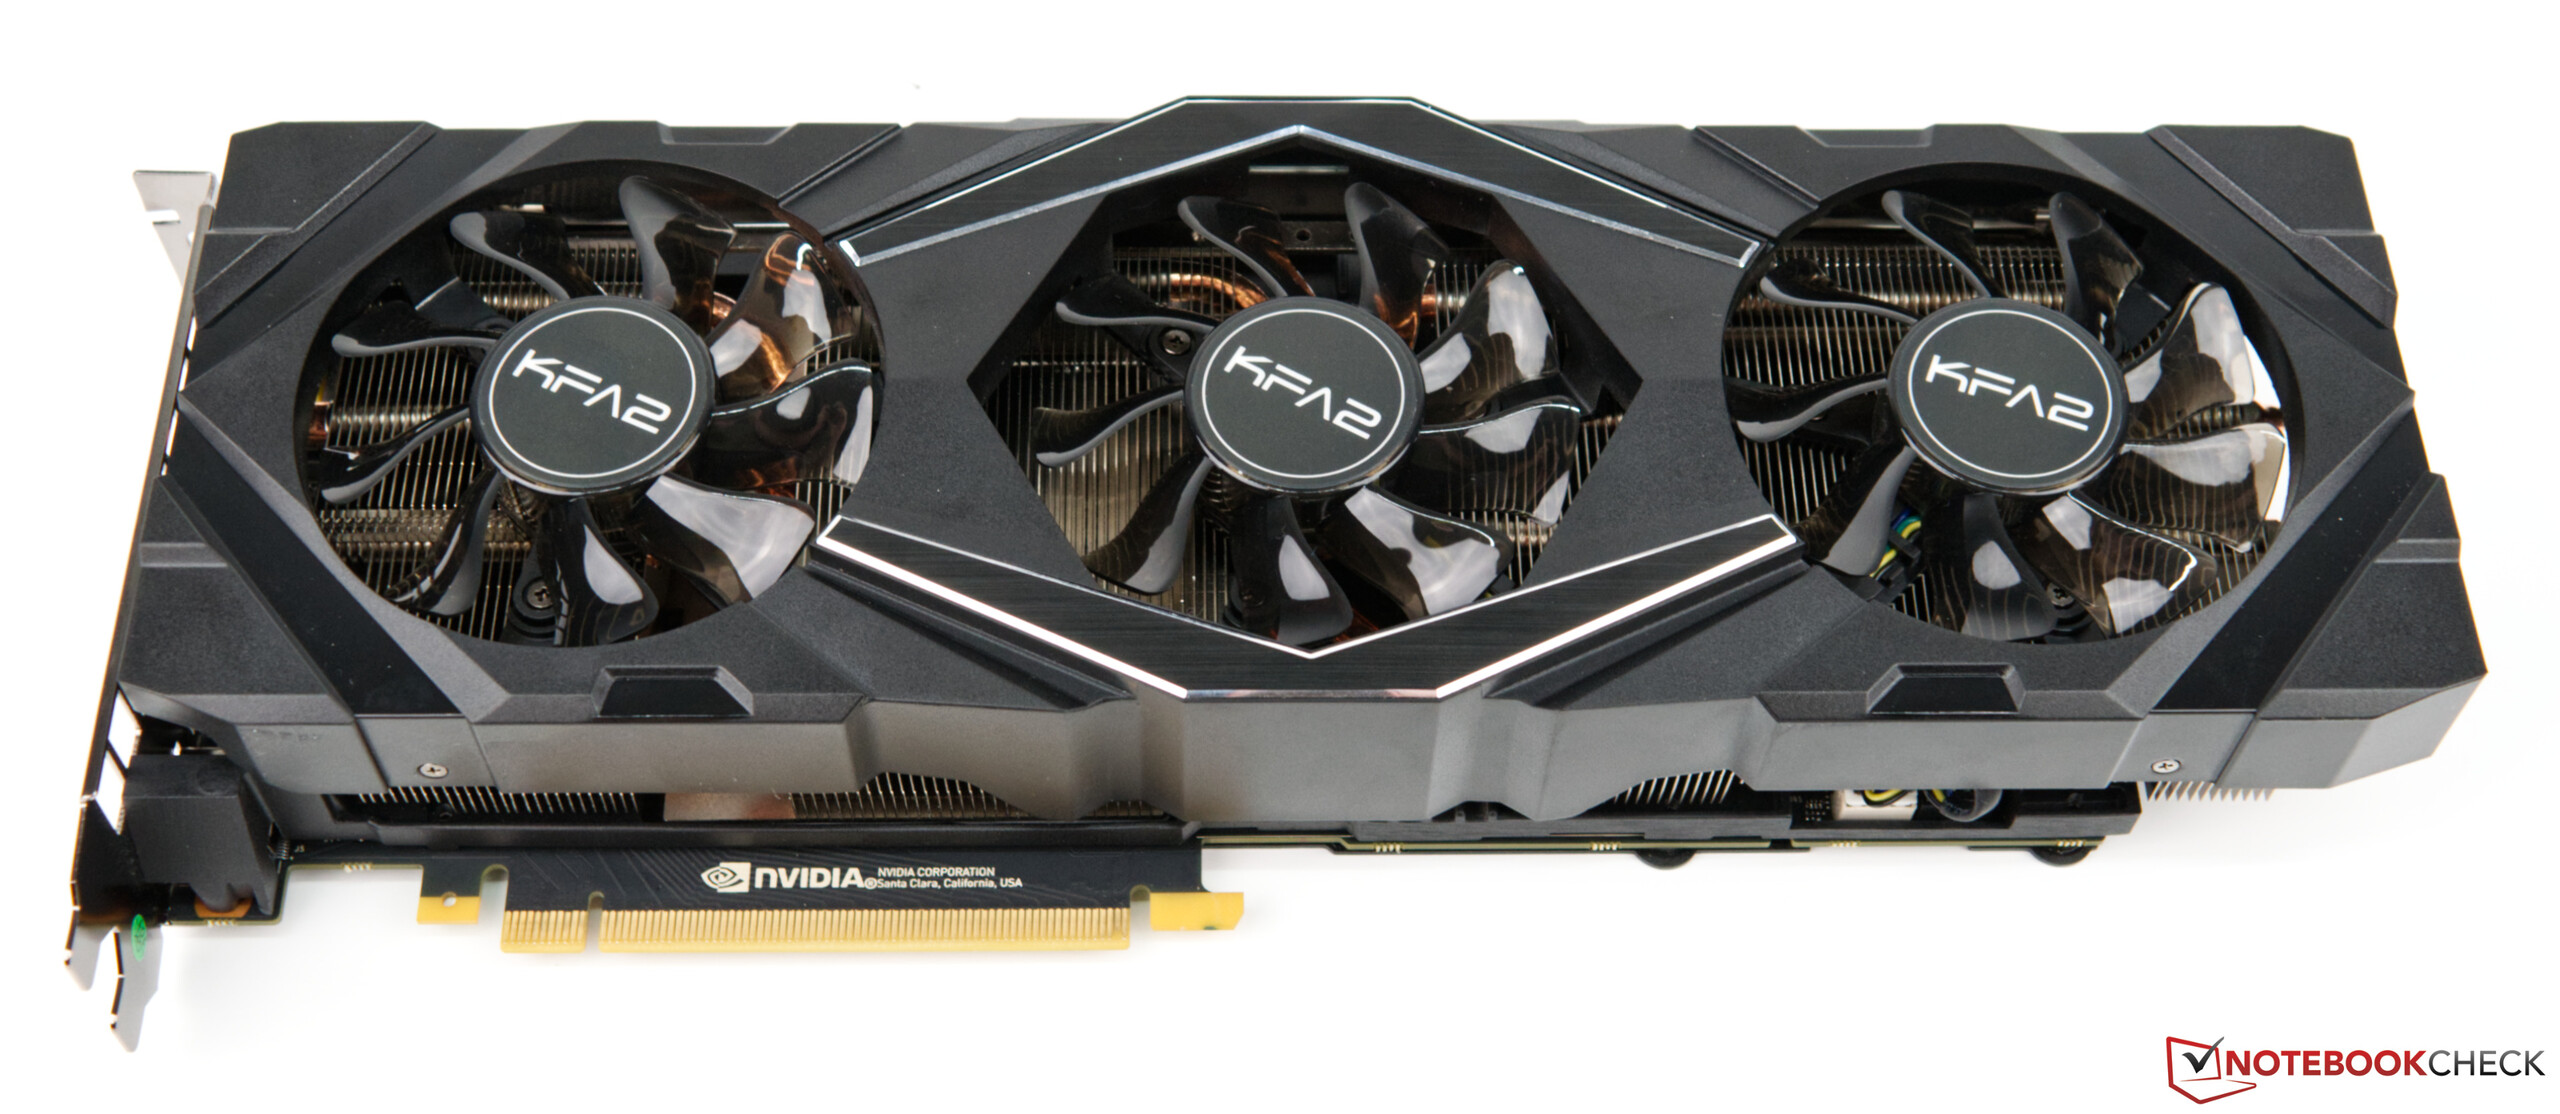
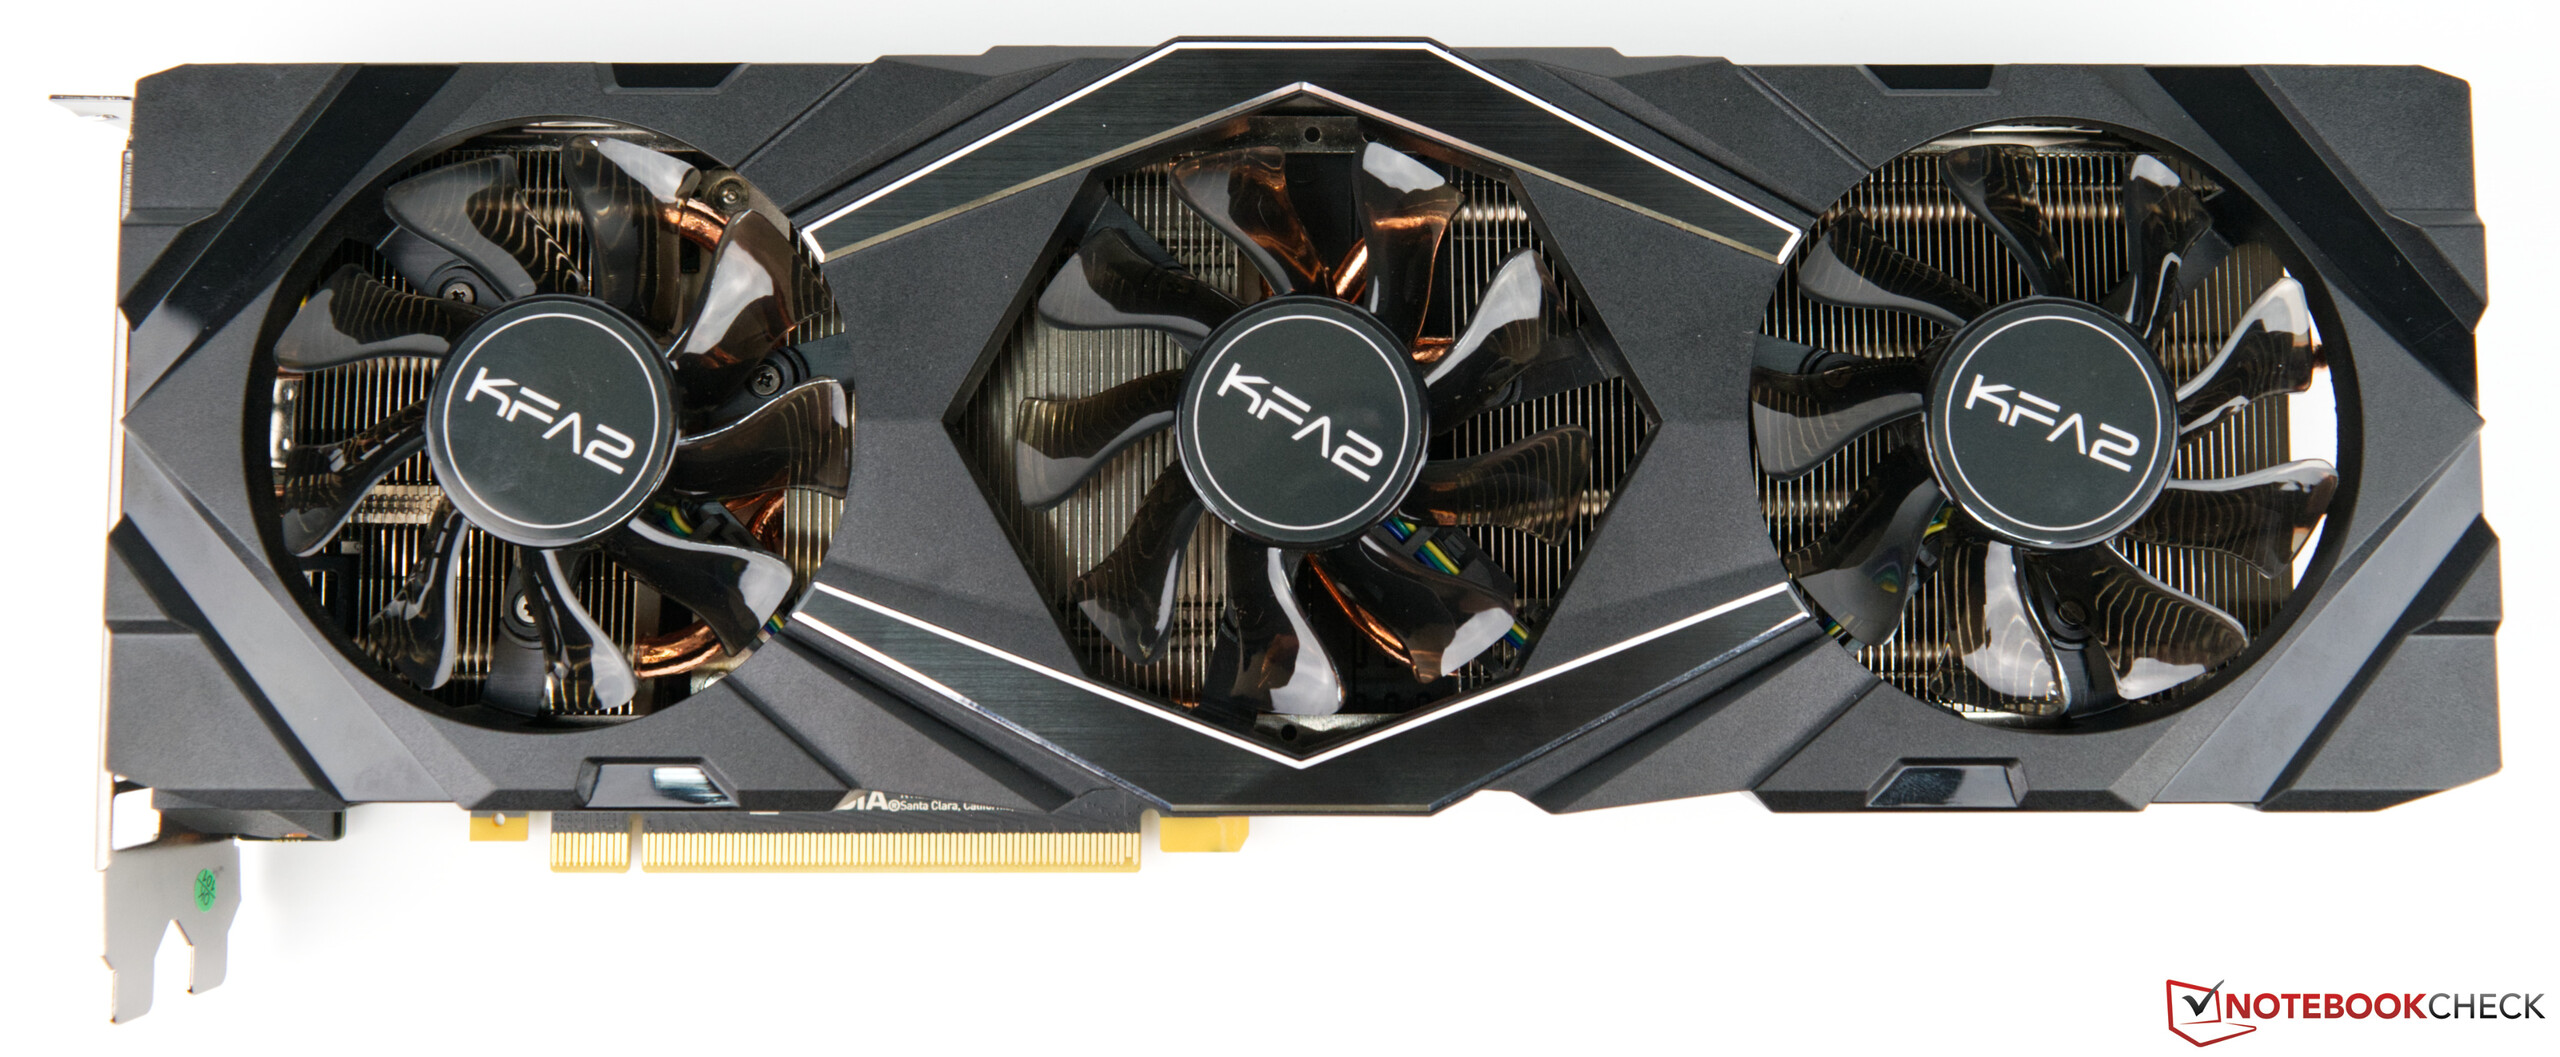
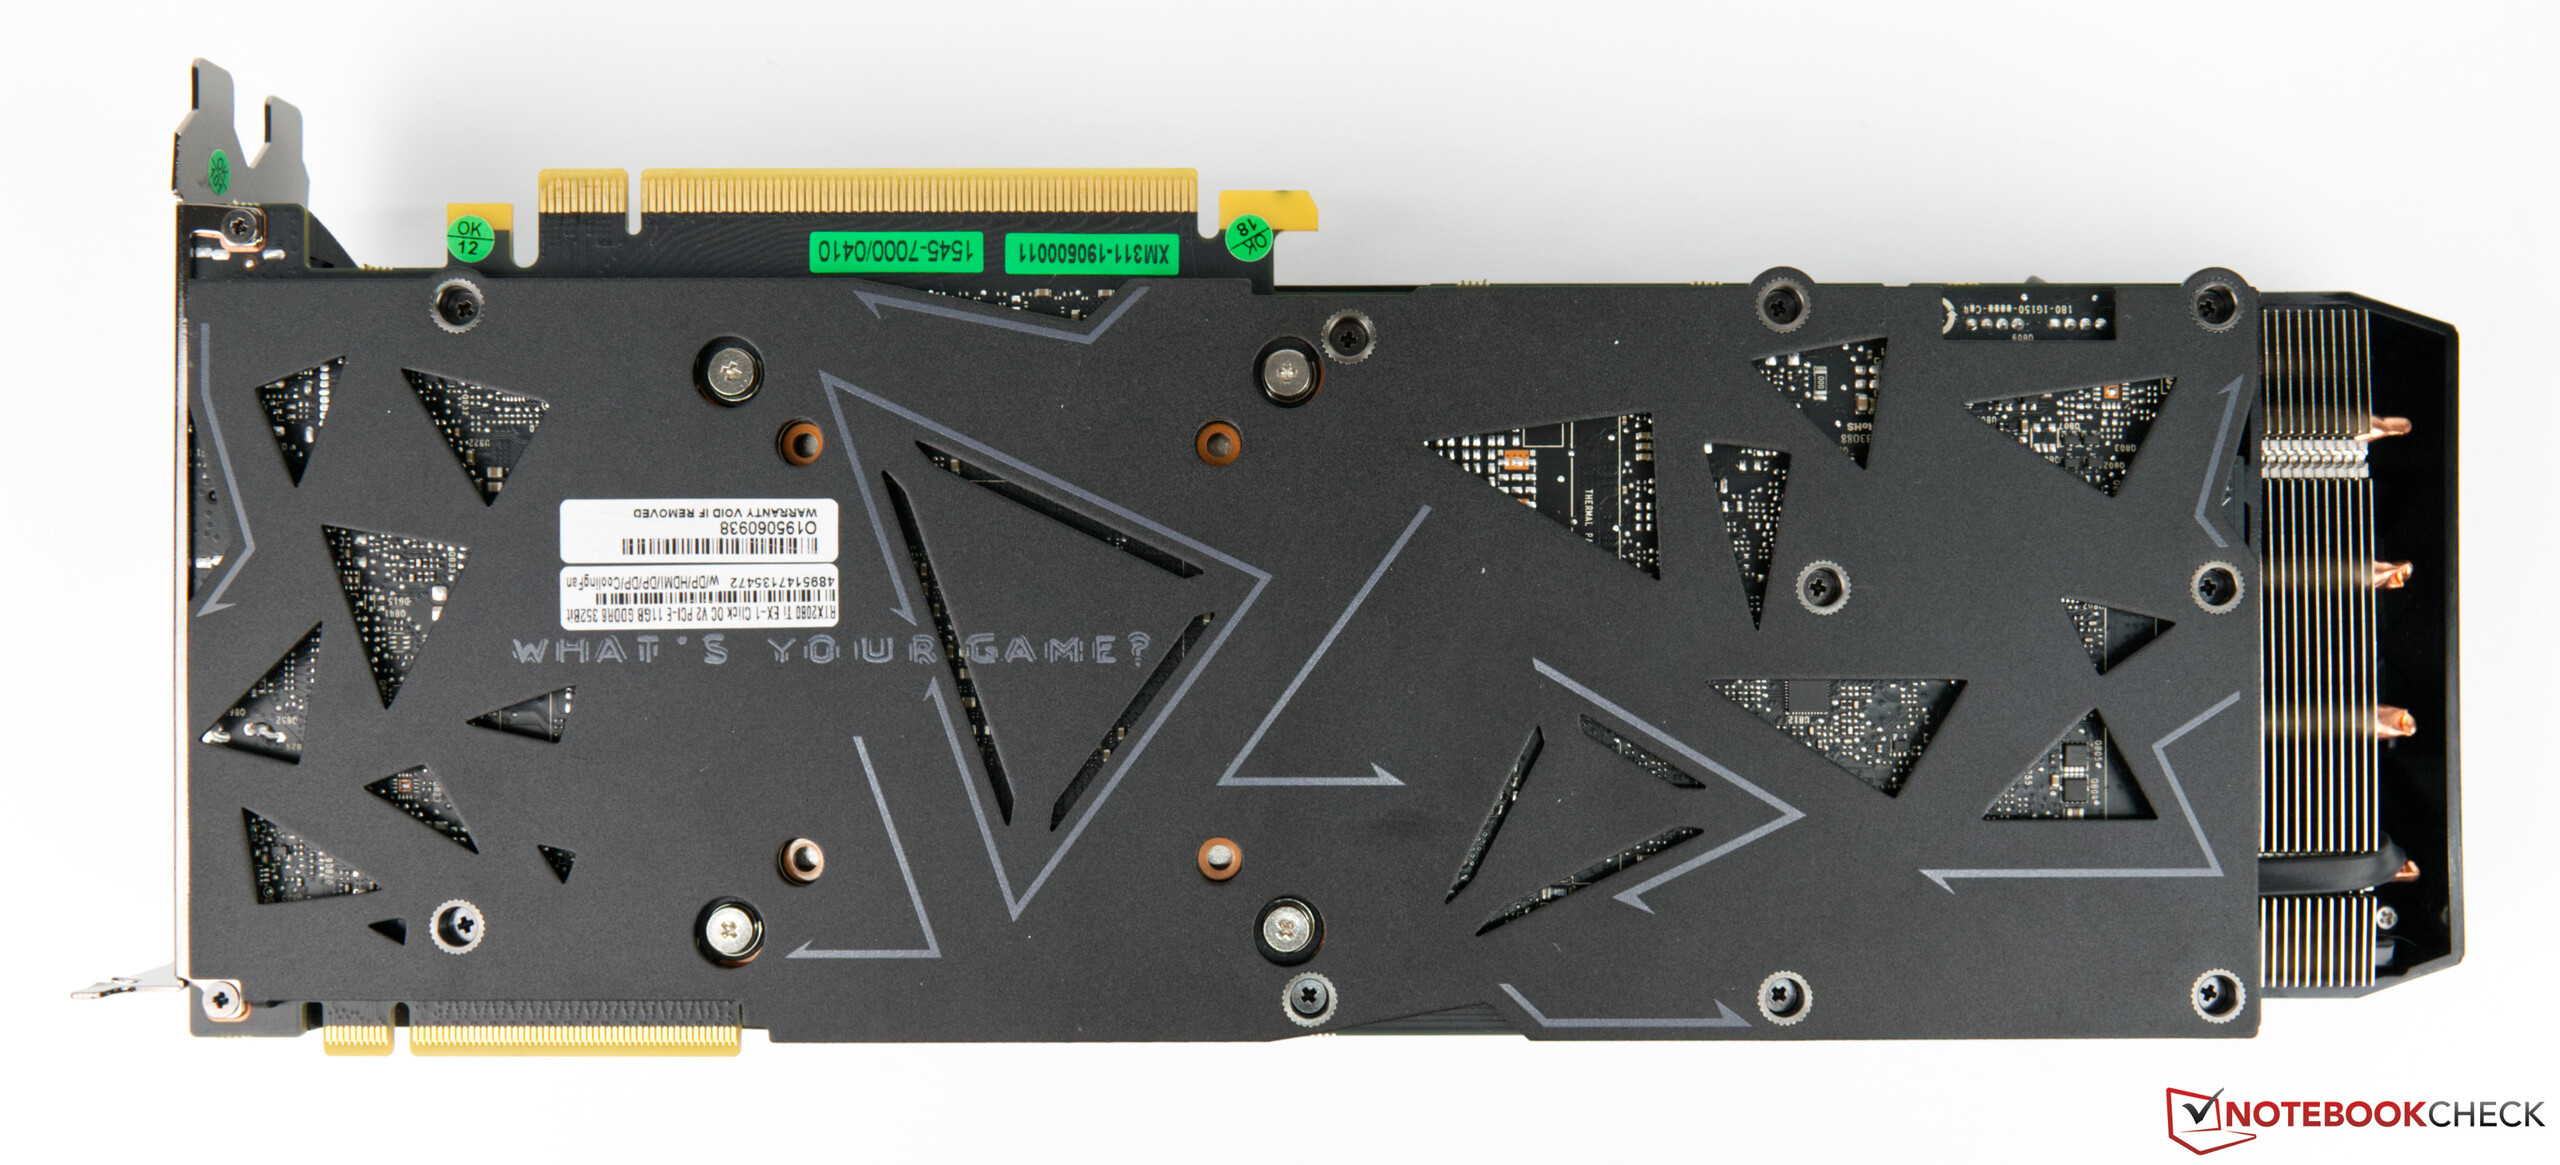
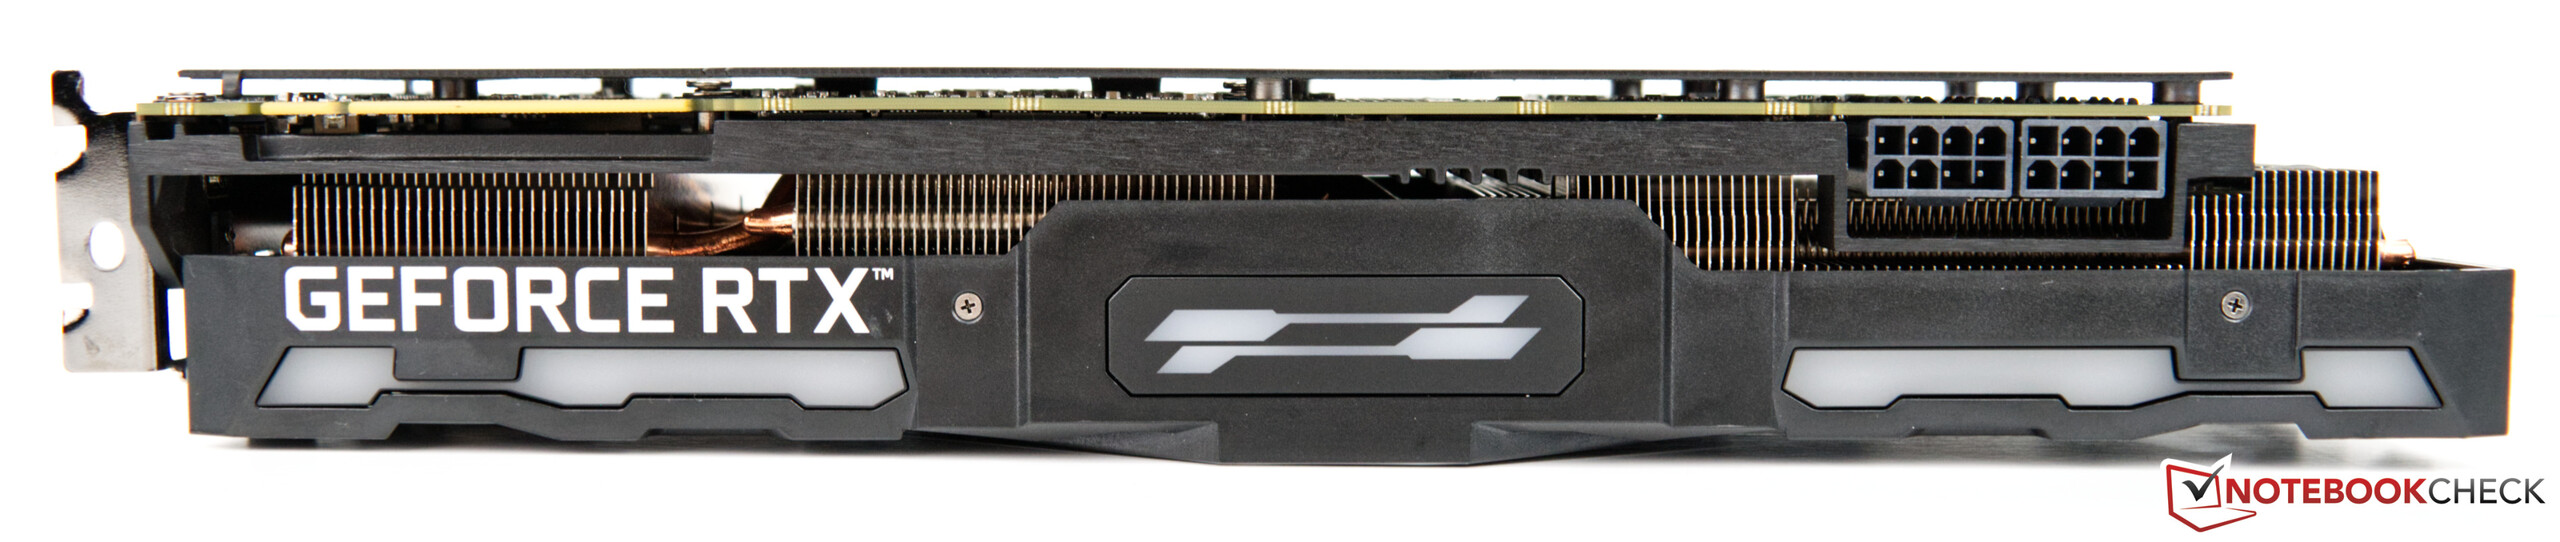
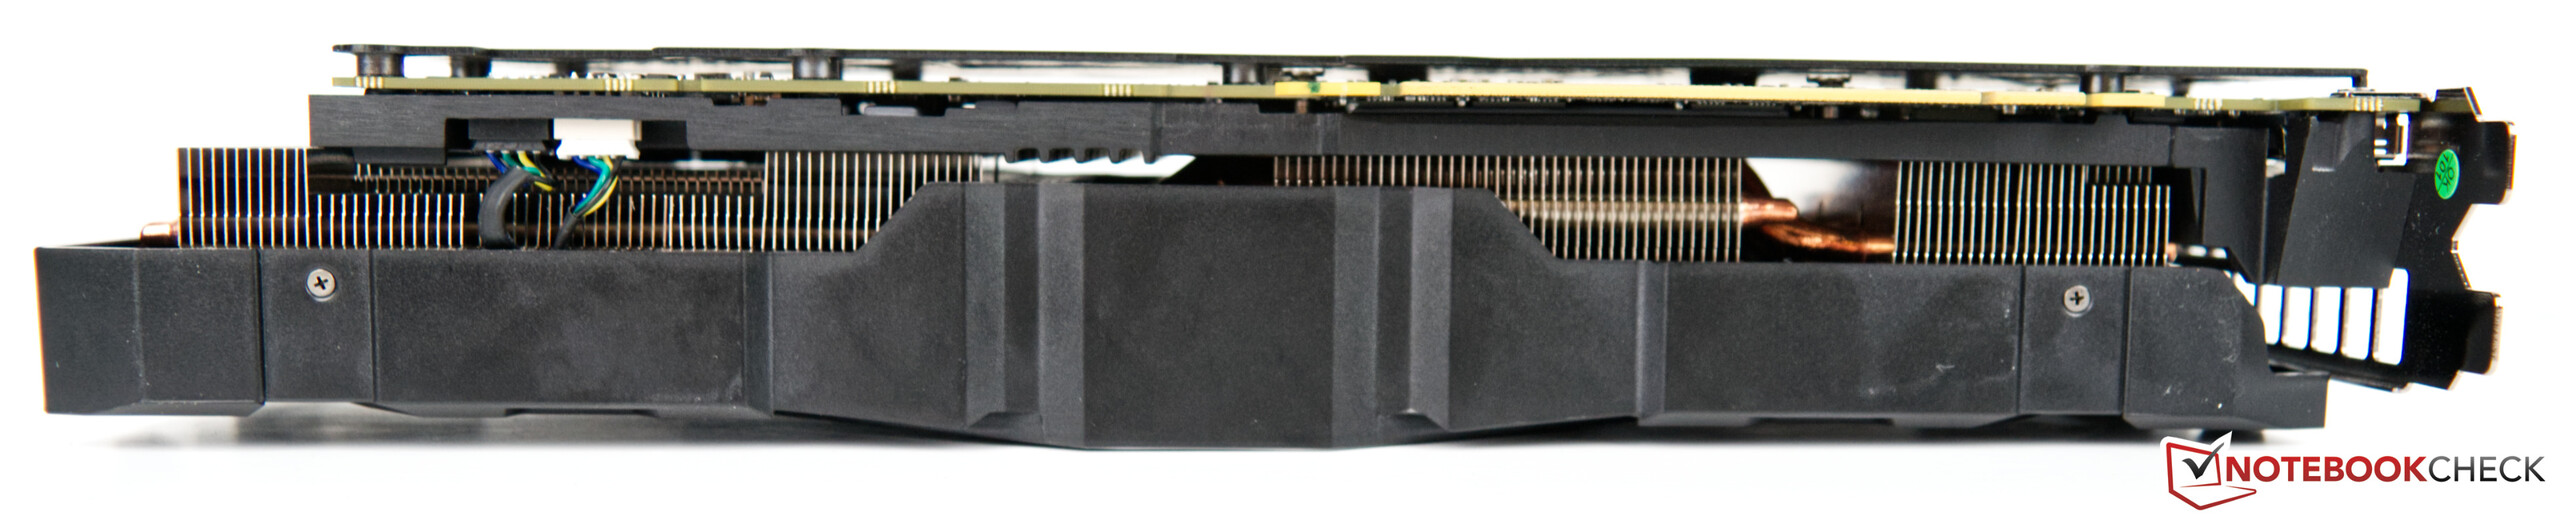
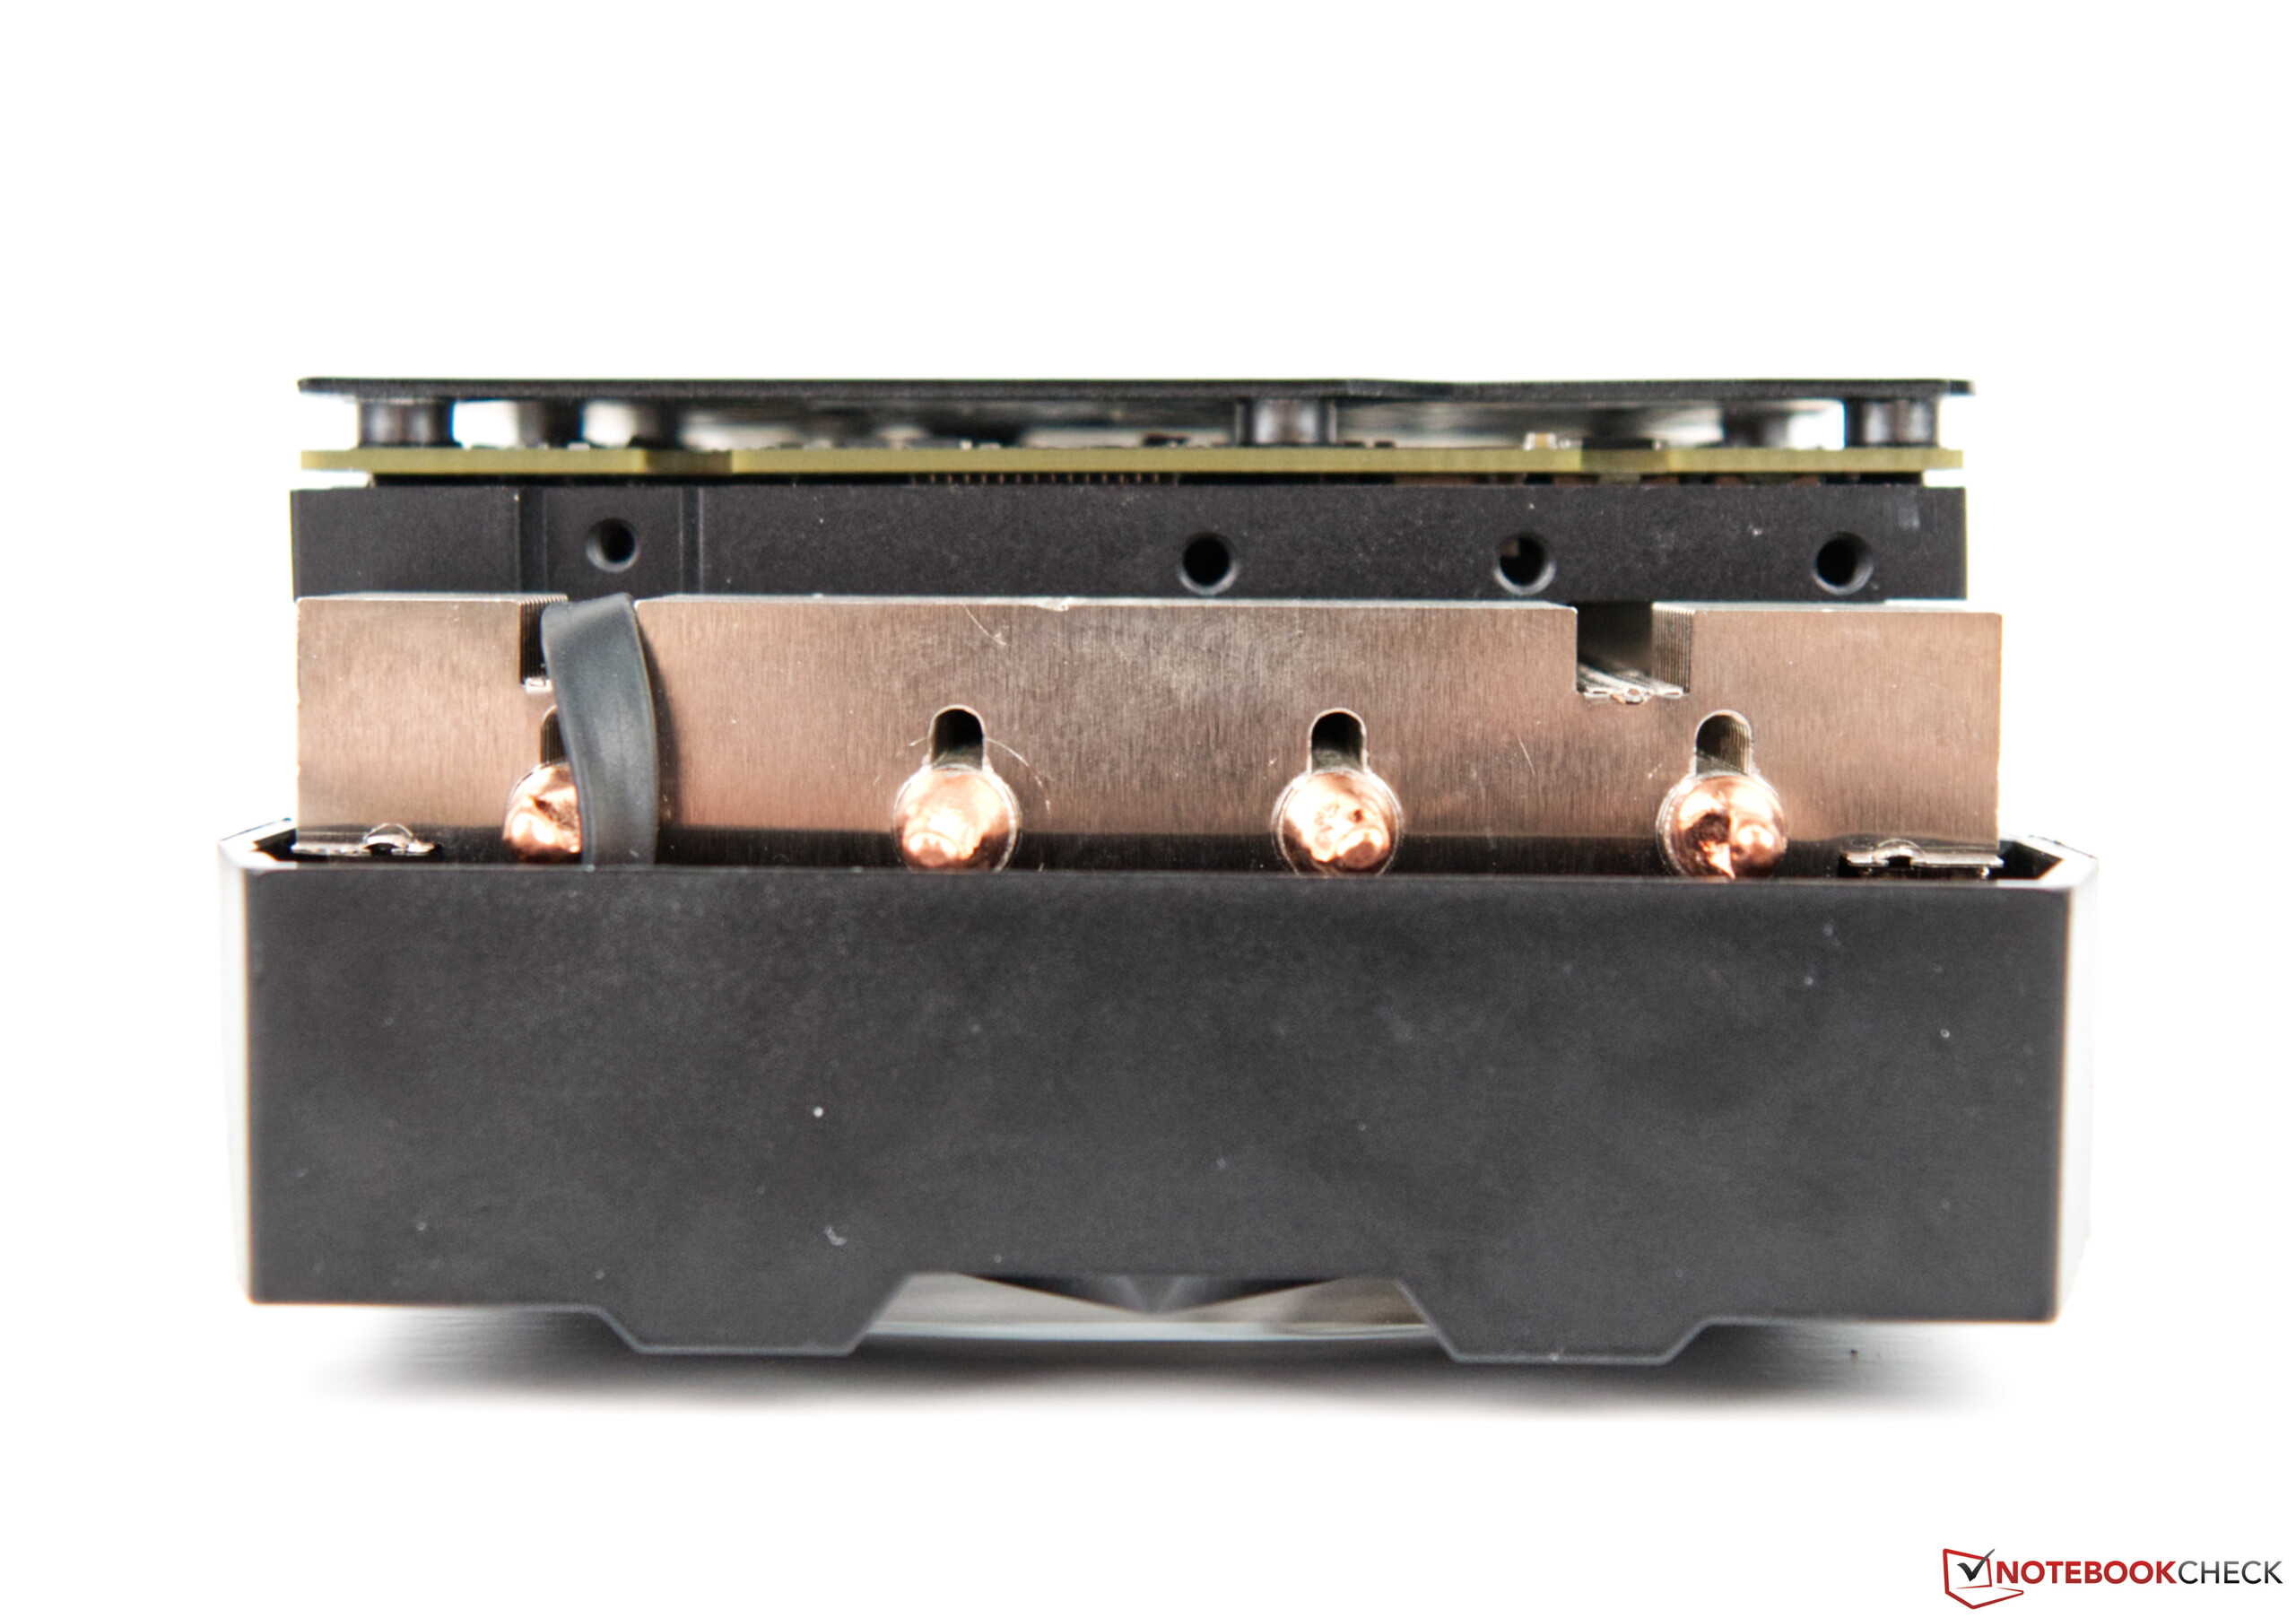
There are no differences in terms of specifications between the KFA2 model and the reference model. However, the KFA2 video card looks different, because it features a more powerful custom cooling solution with three axial fans. The KFA2 graphics card uses the reference board, which is why there should not be any compatibility problems if you decide to water-cool your GPU. Nevertheless, you should still make sure that your particular GPU meets the requirements for water-cooling before committing to buy.
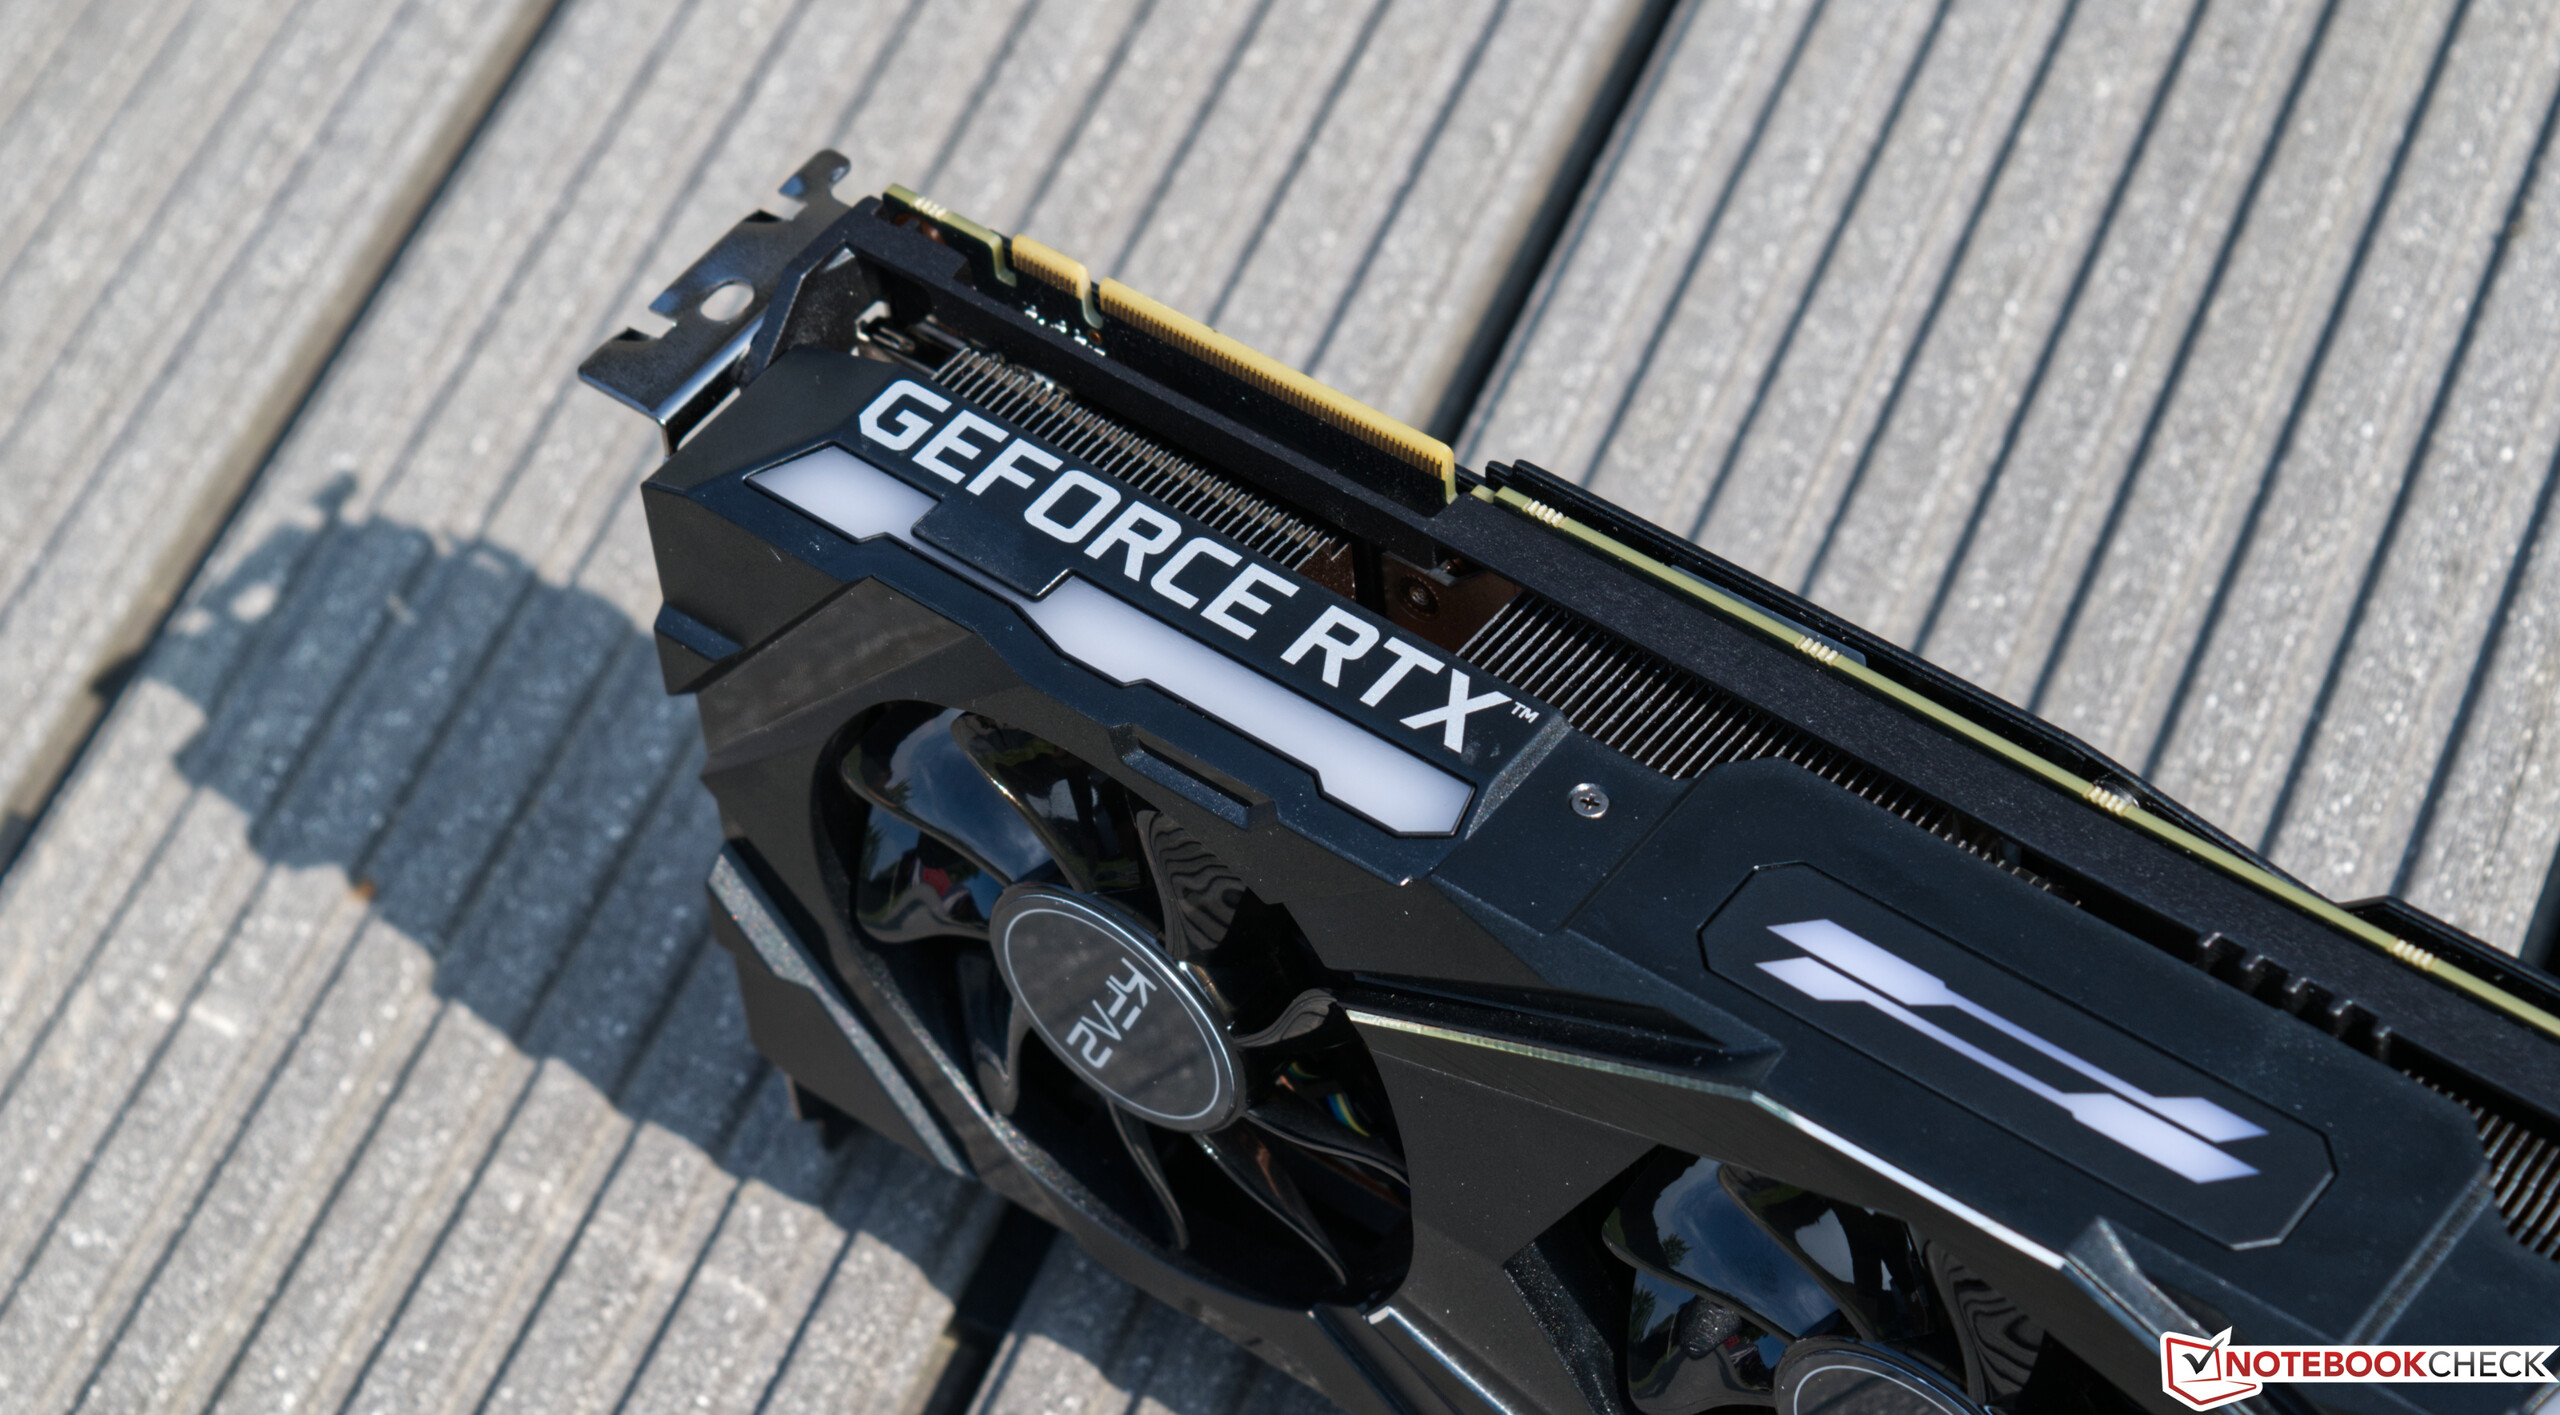
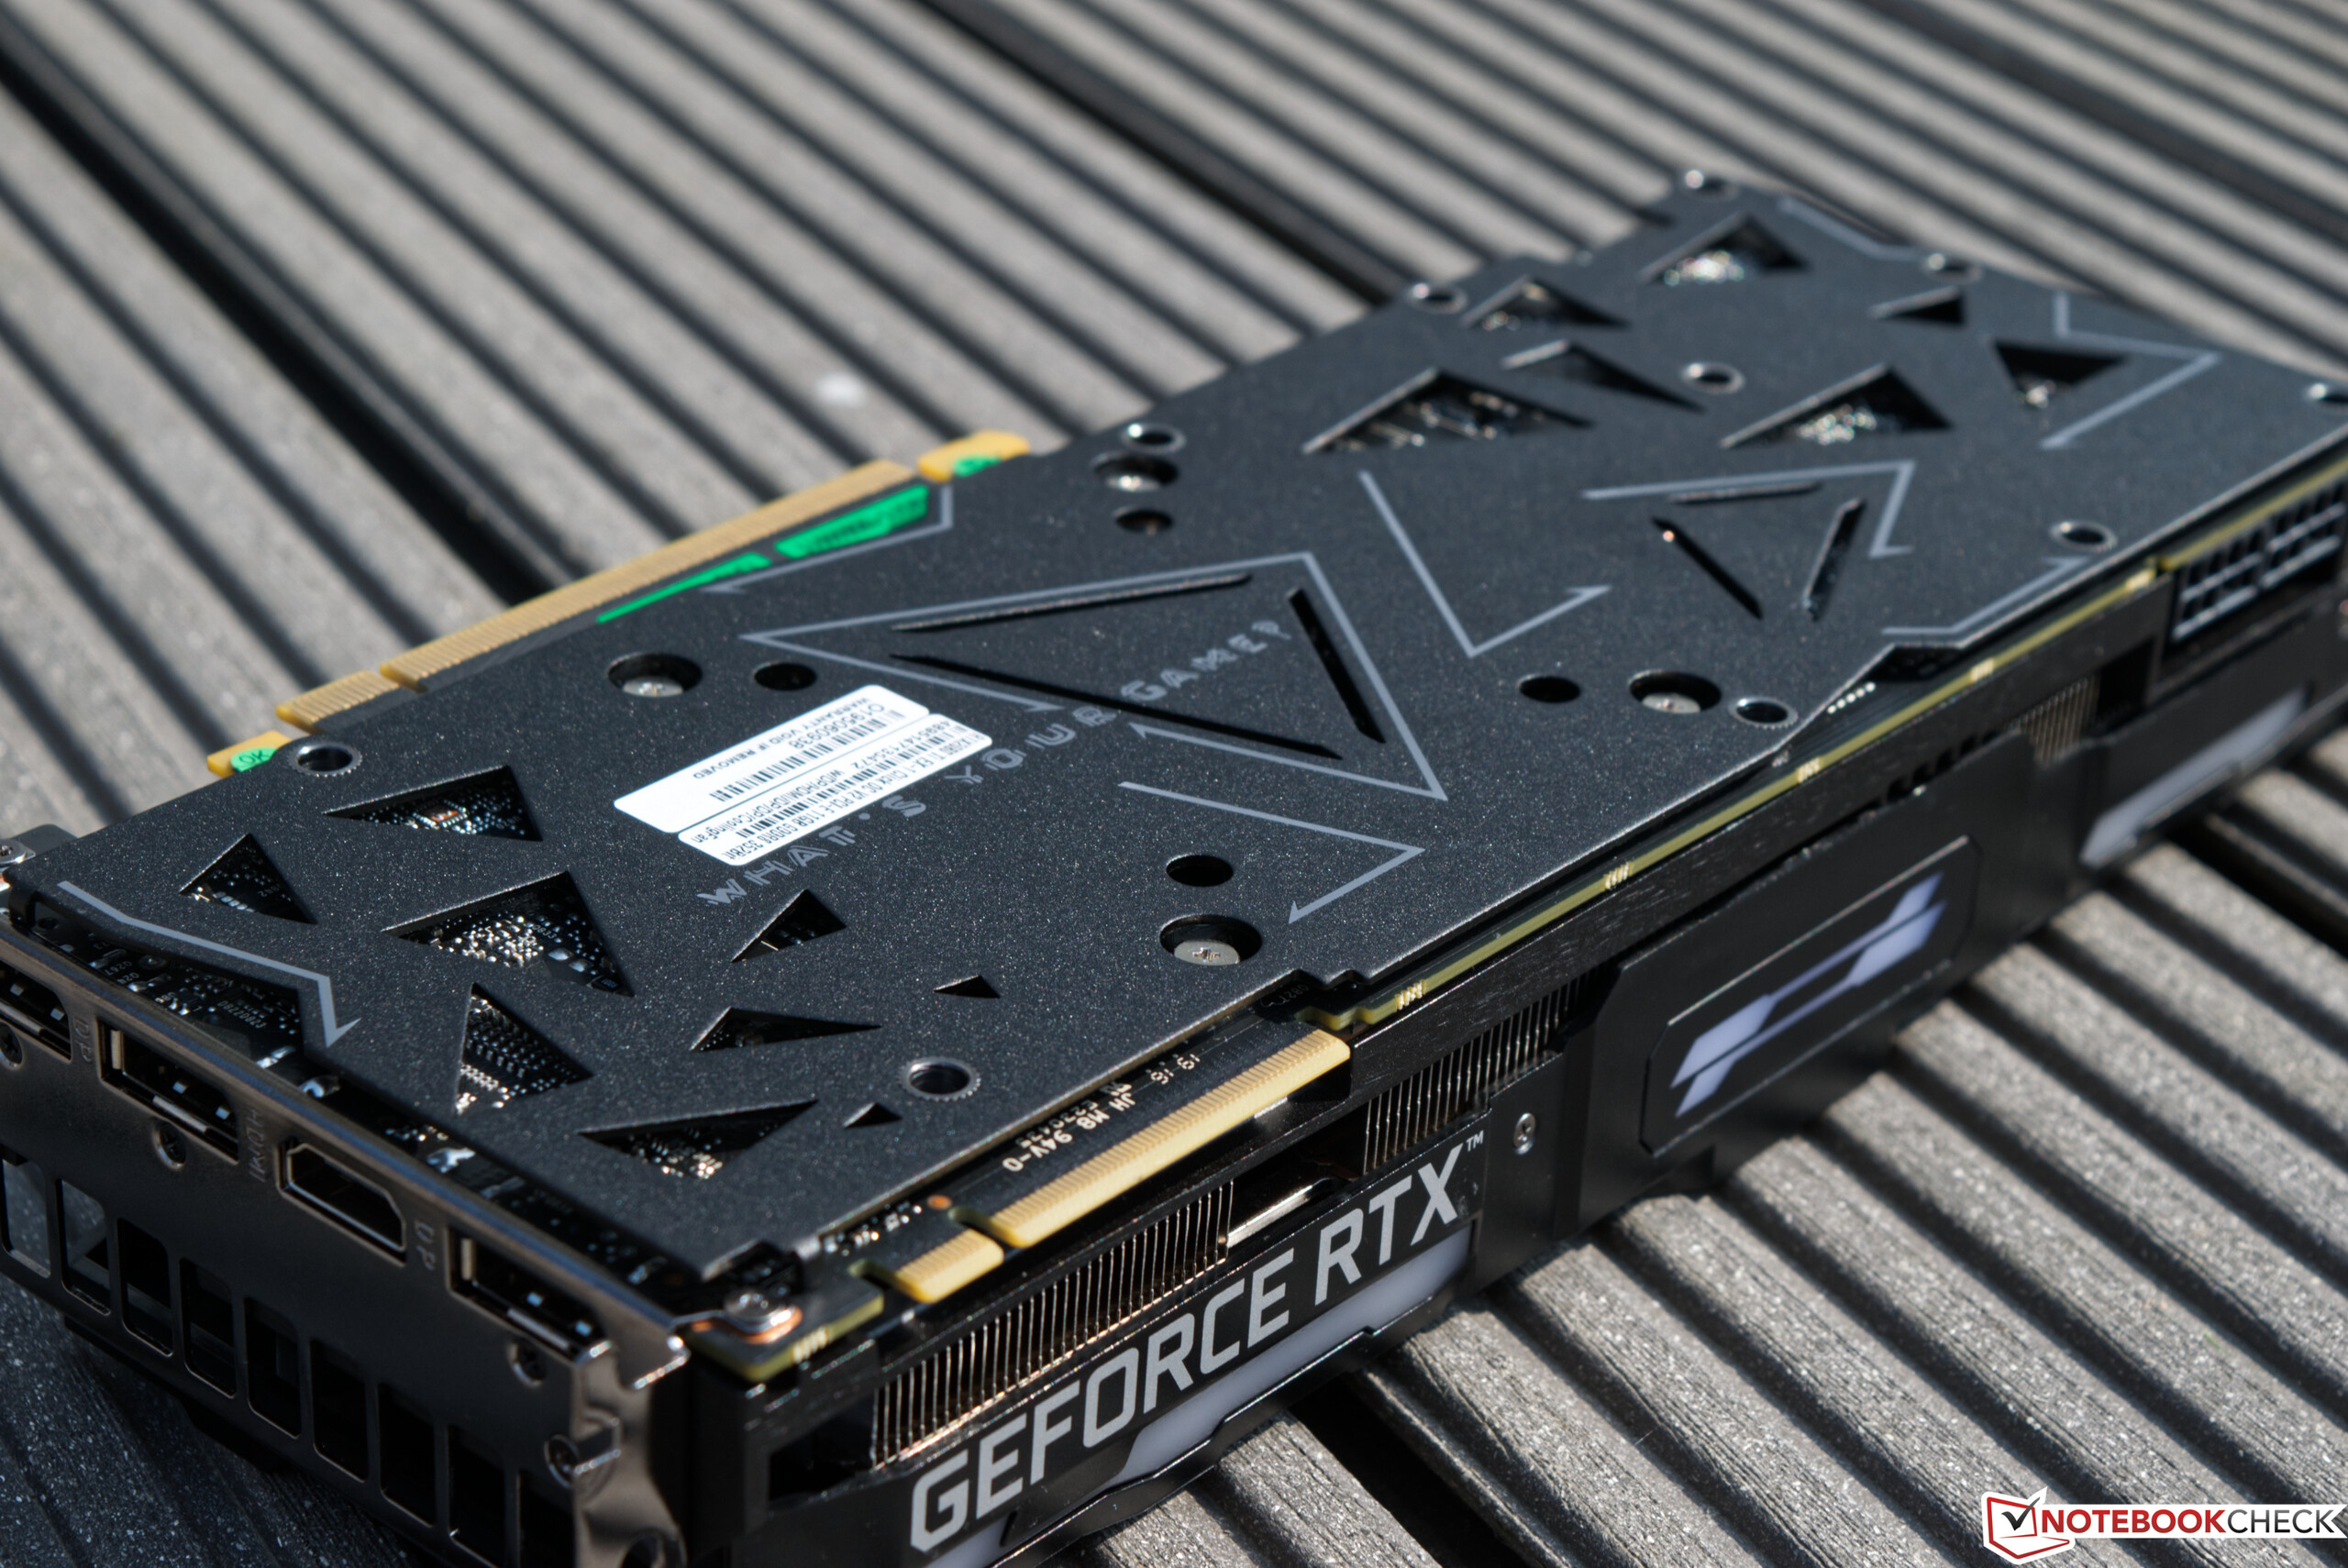
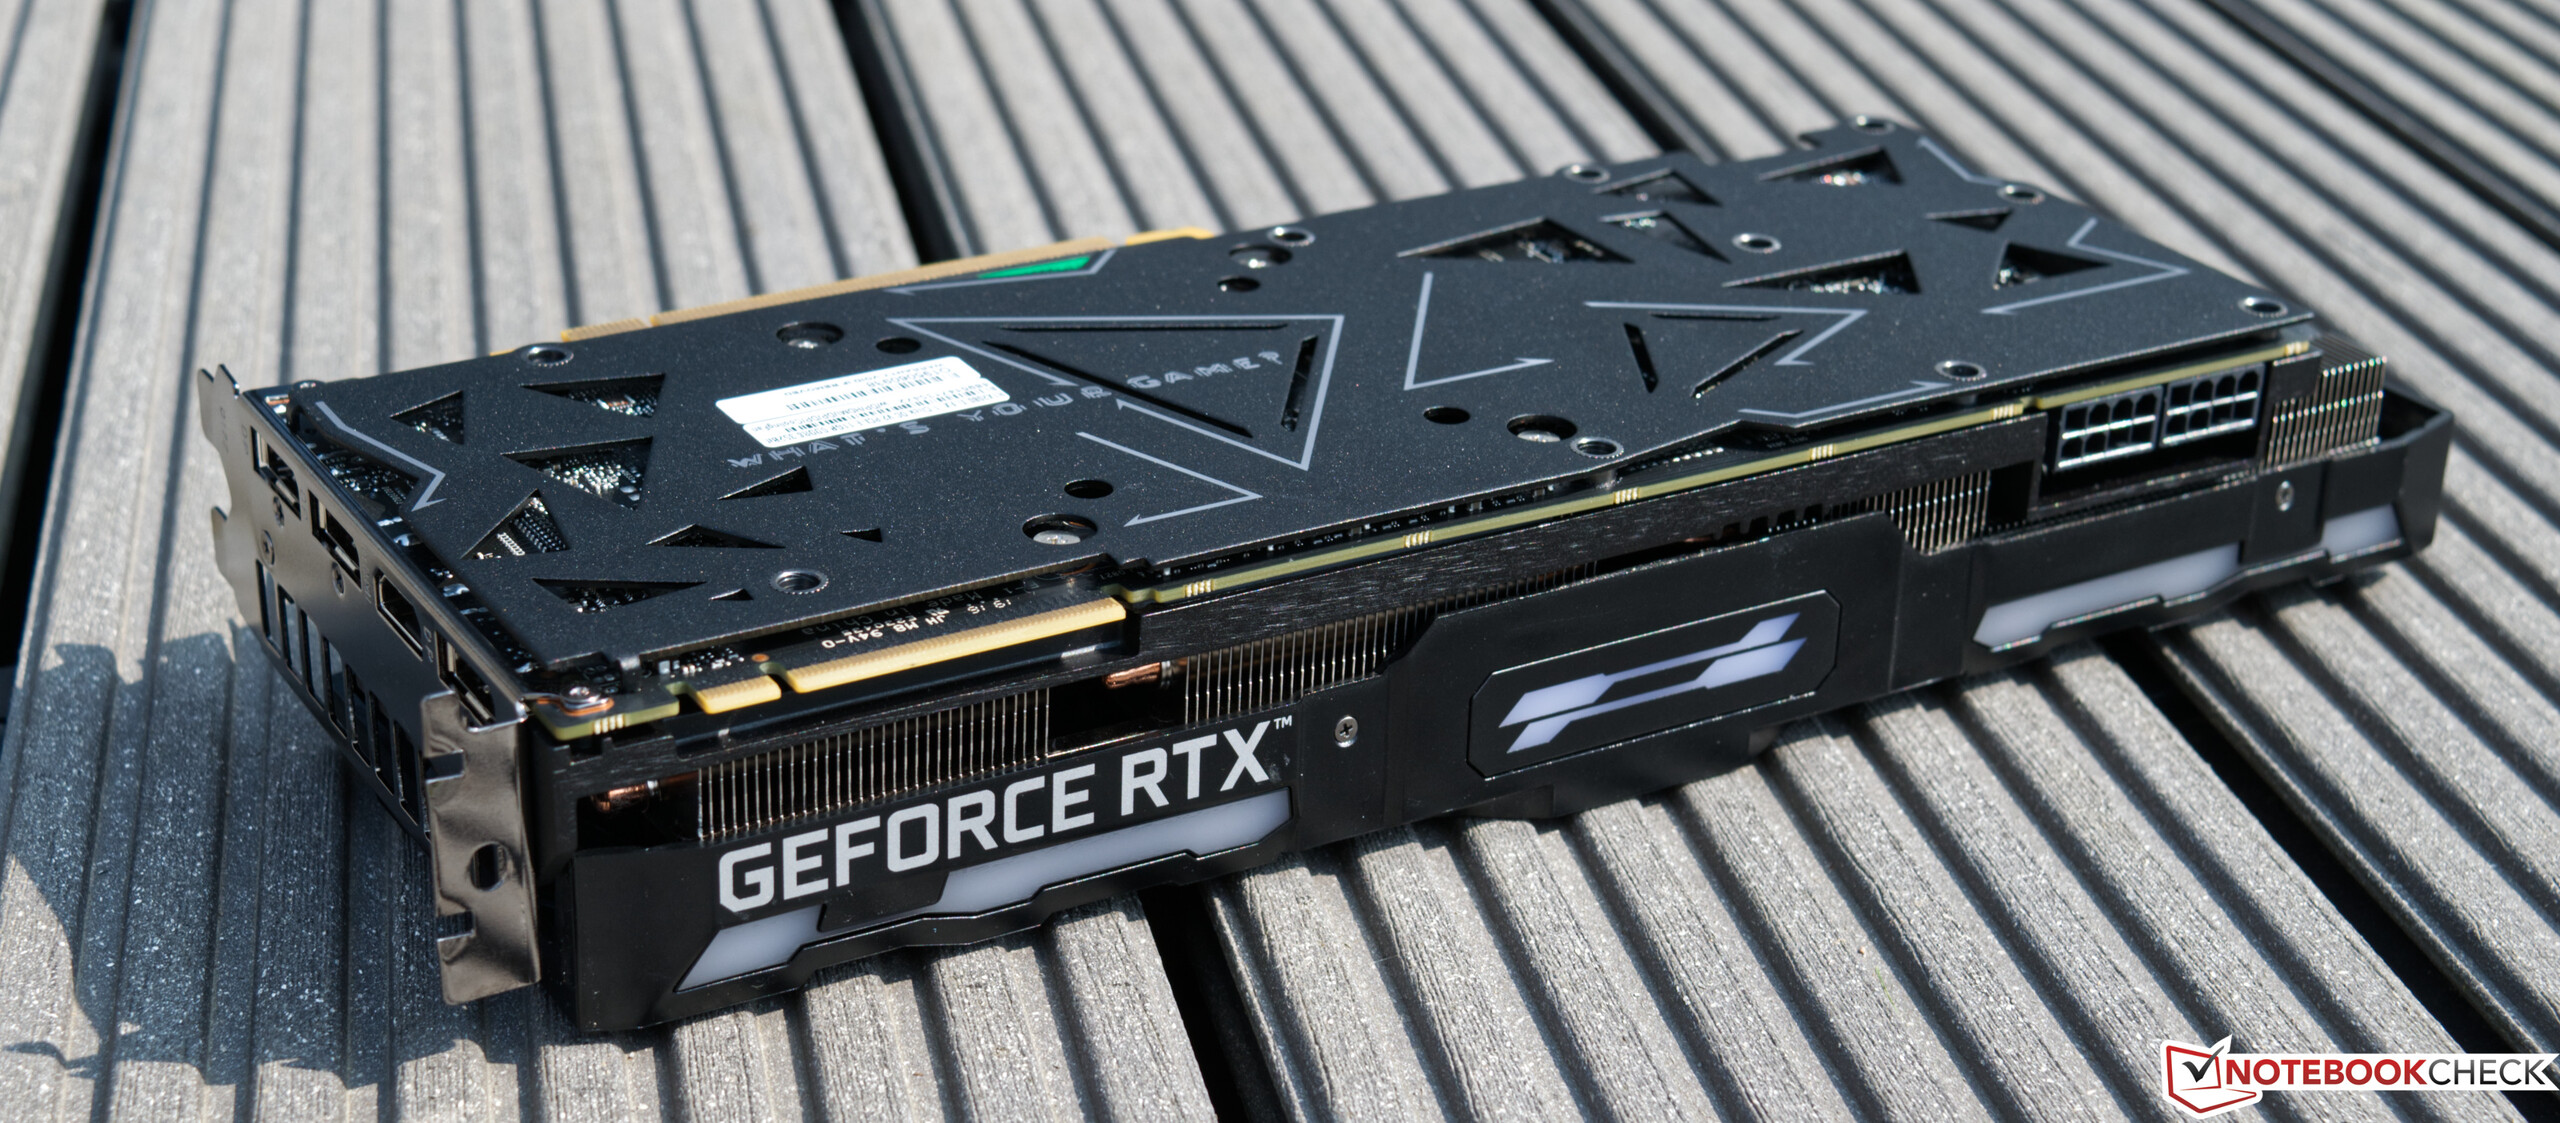
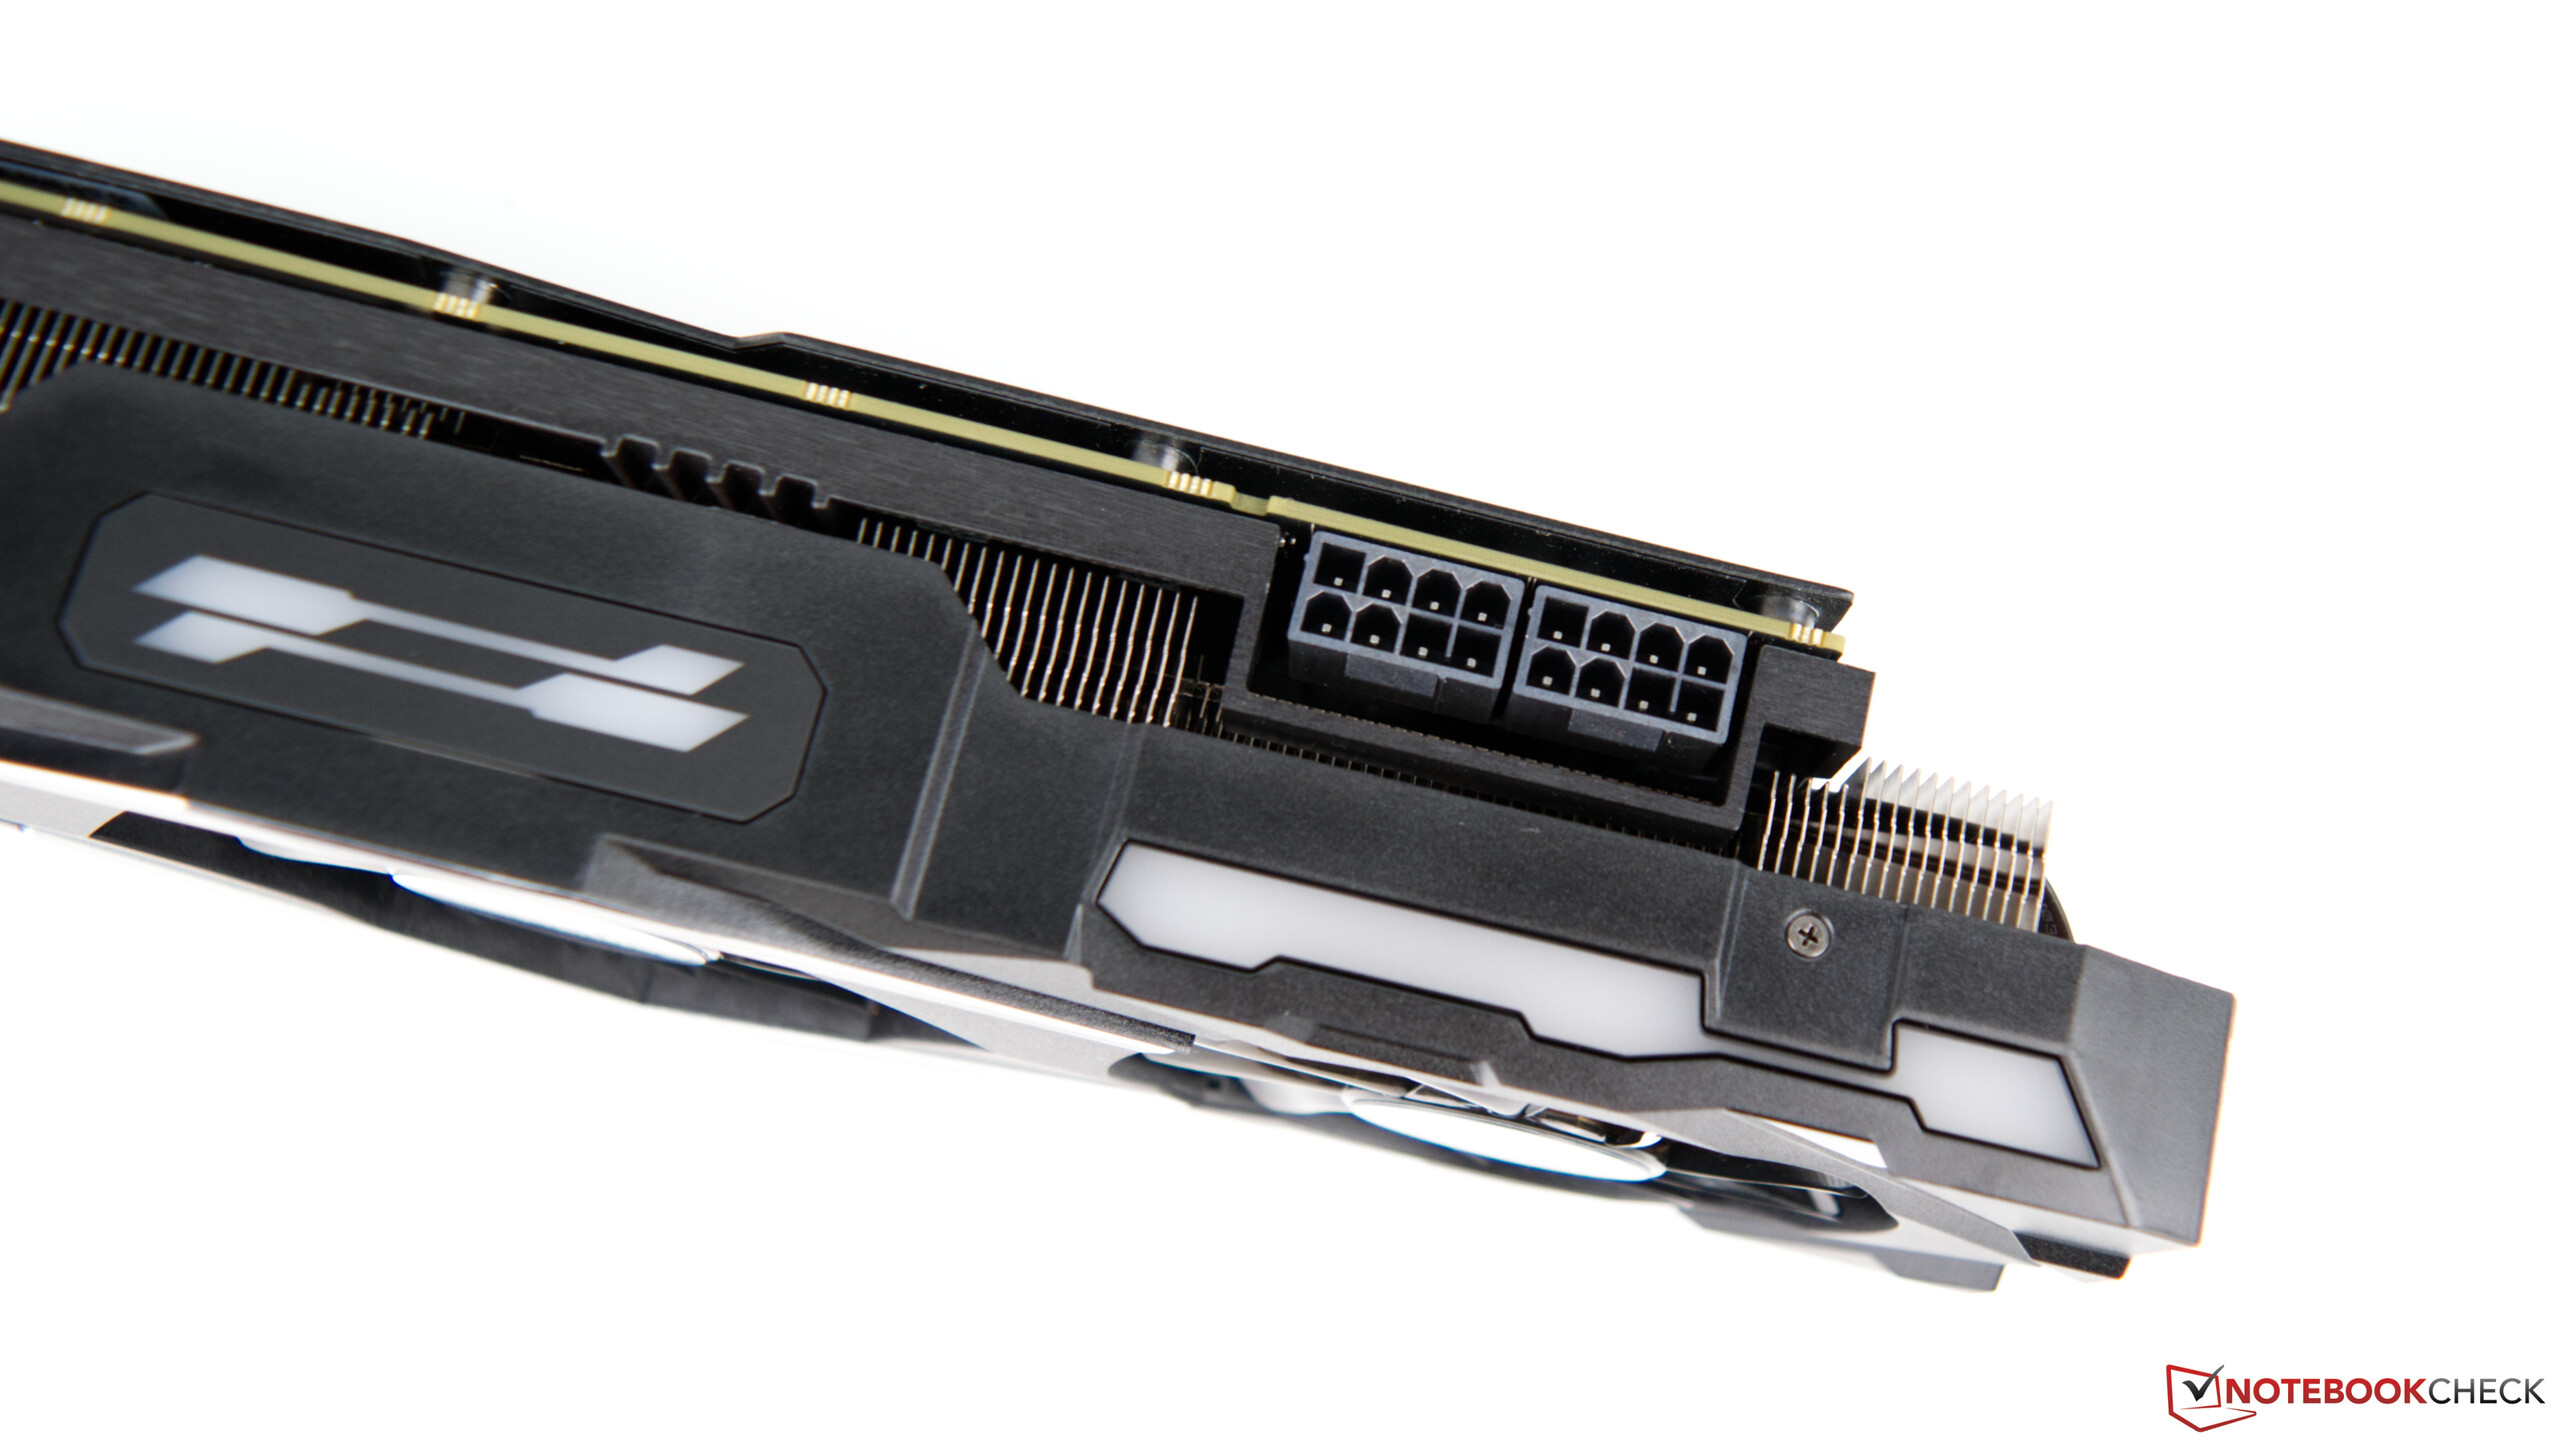
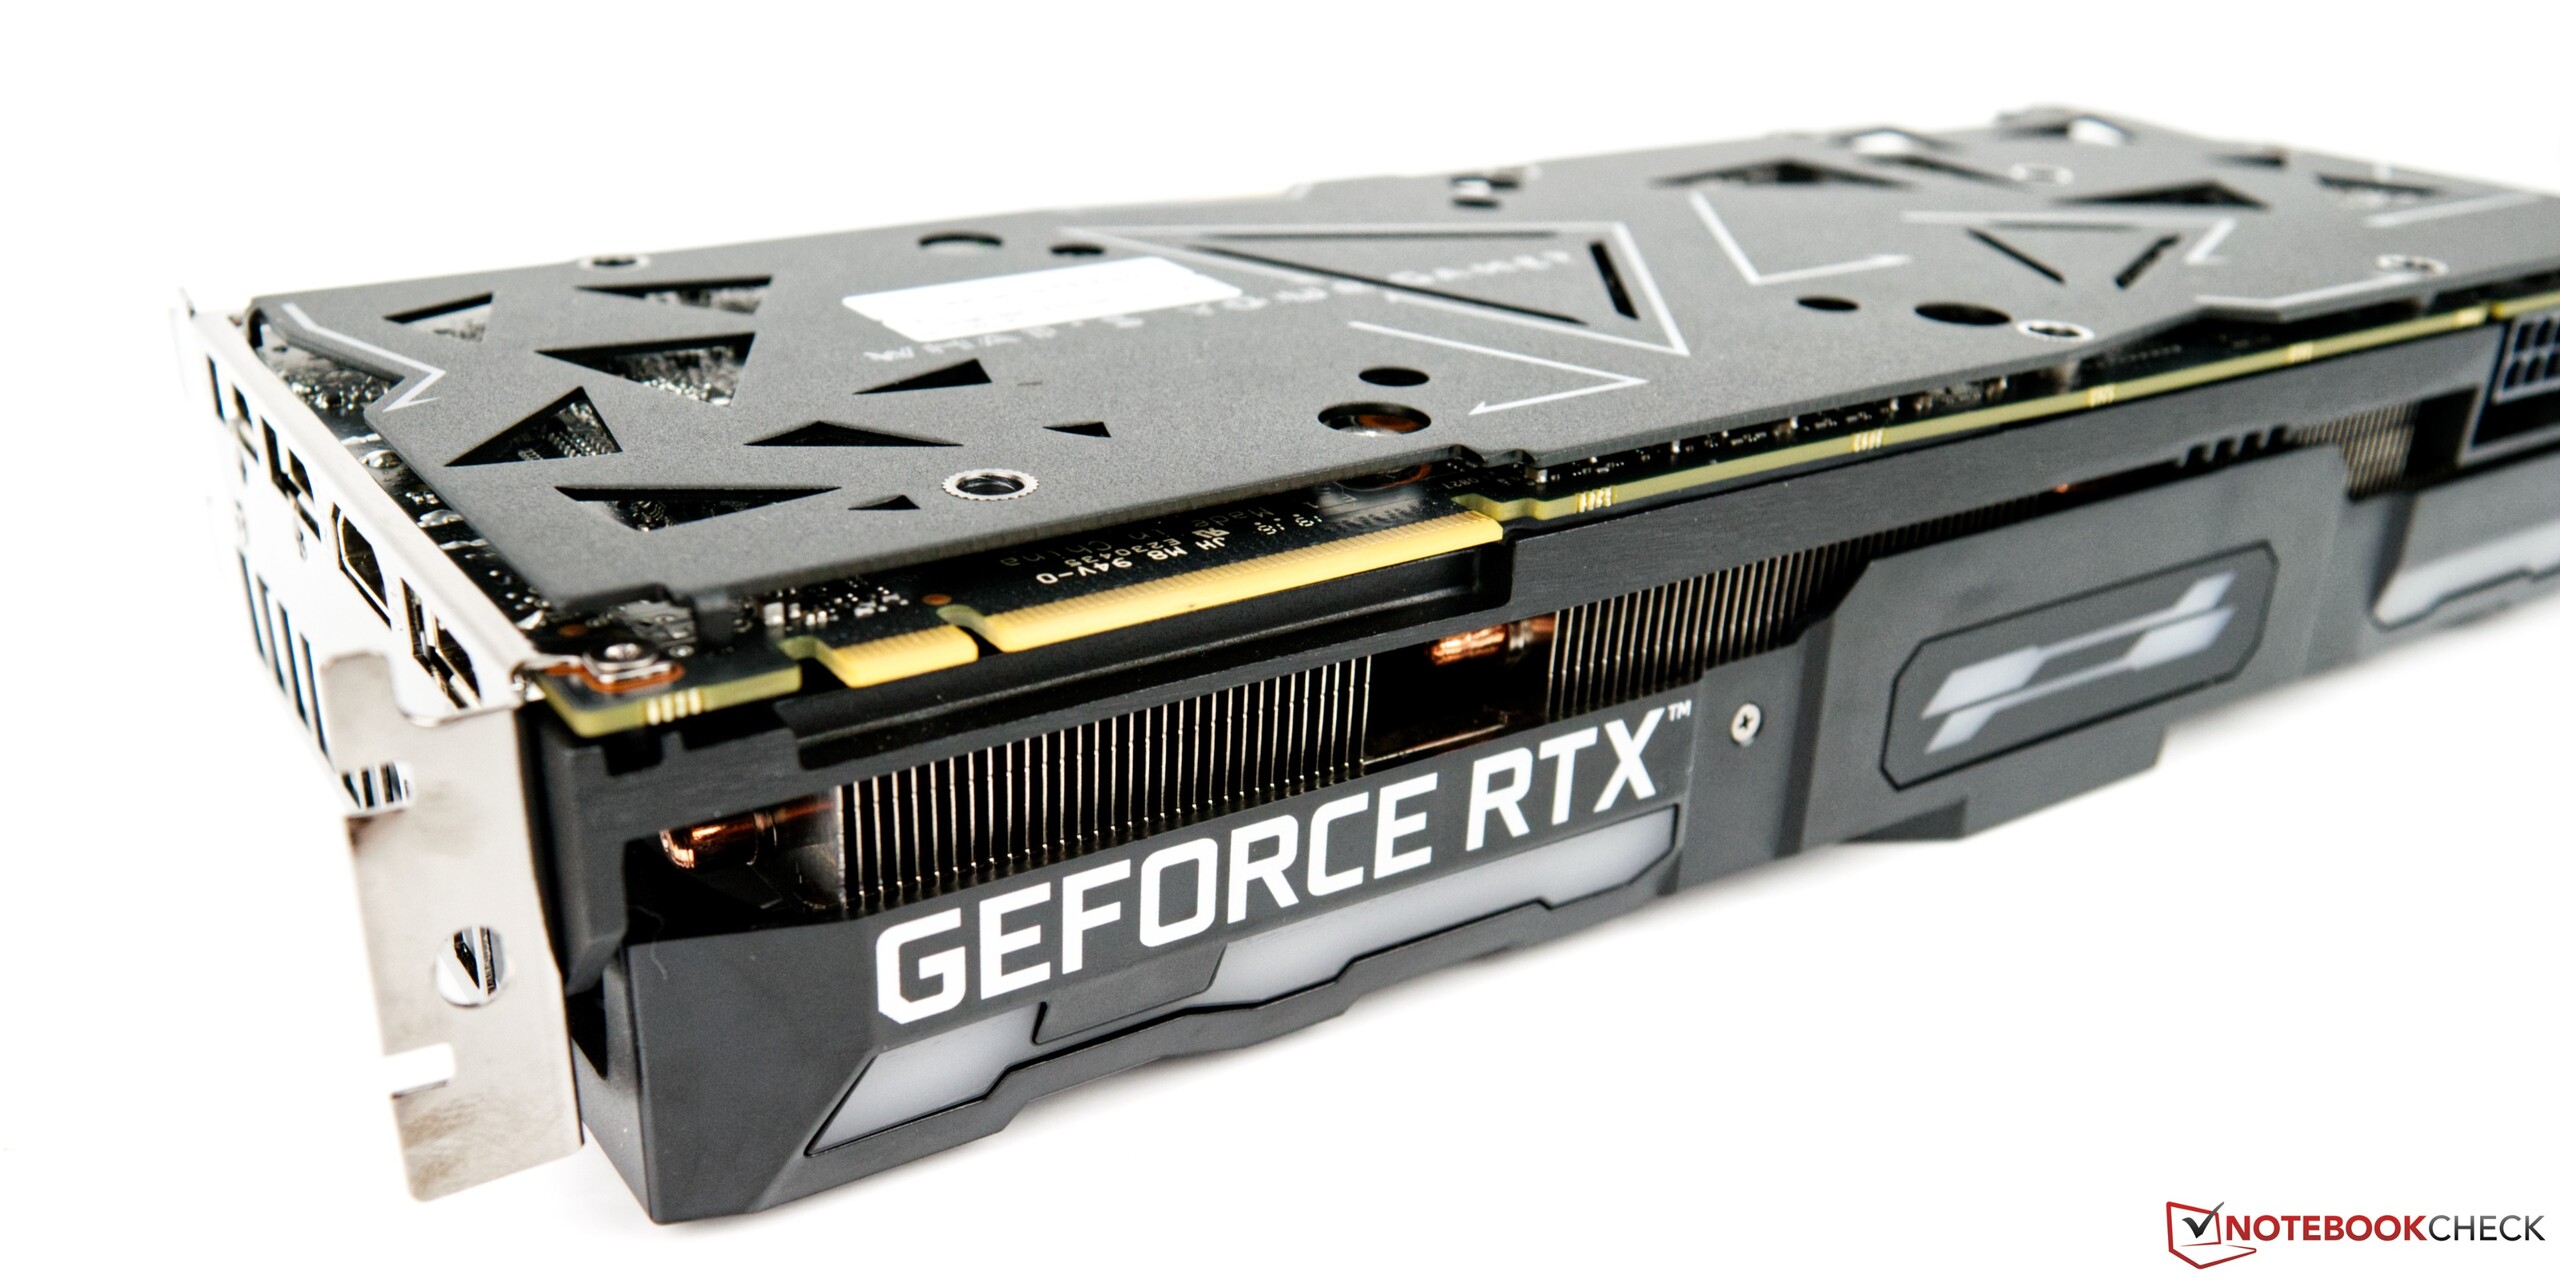
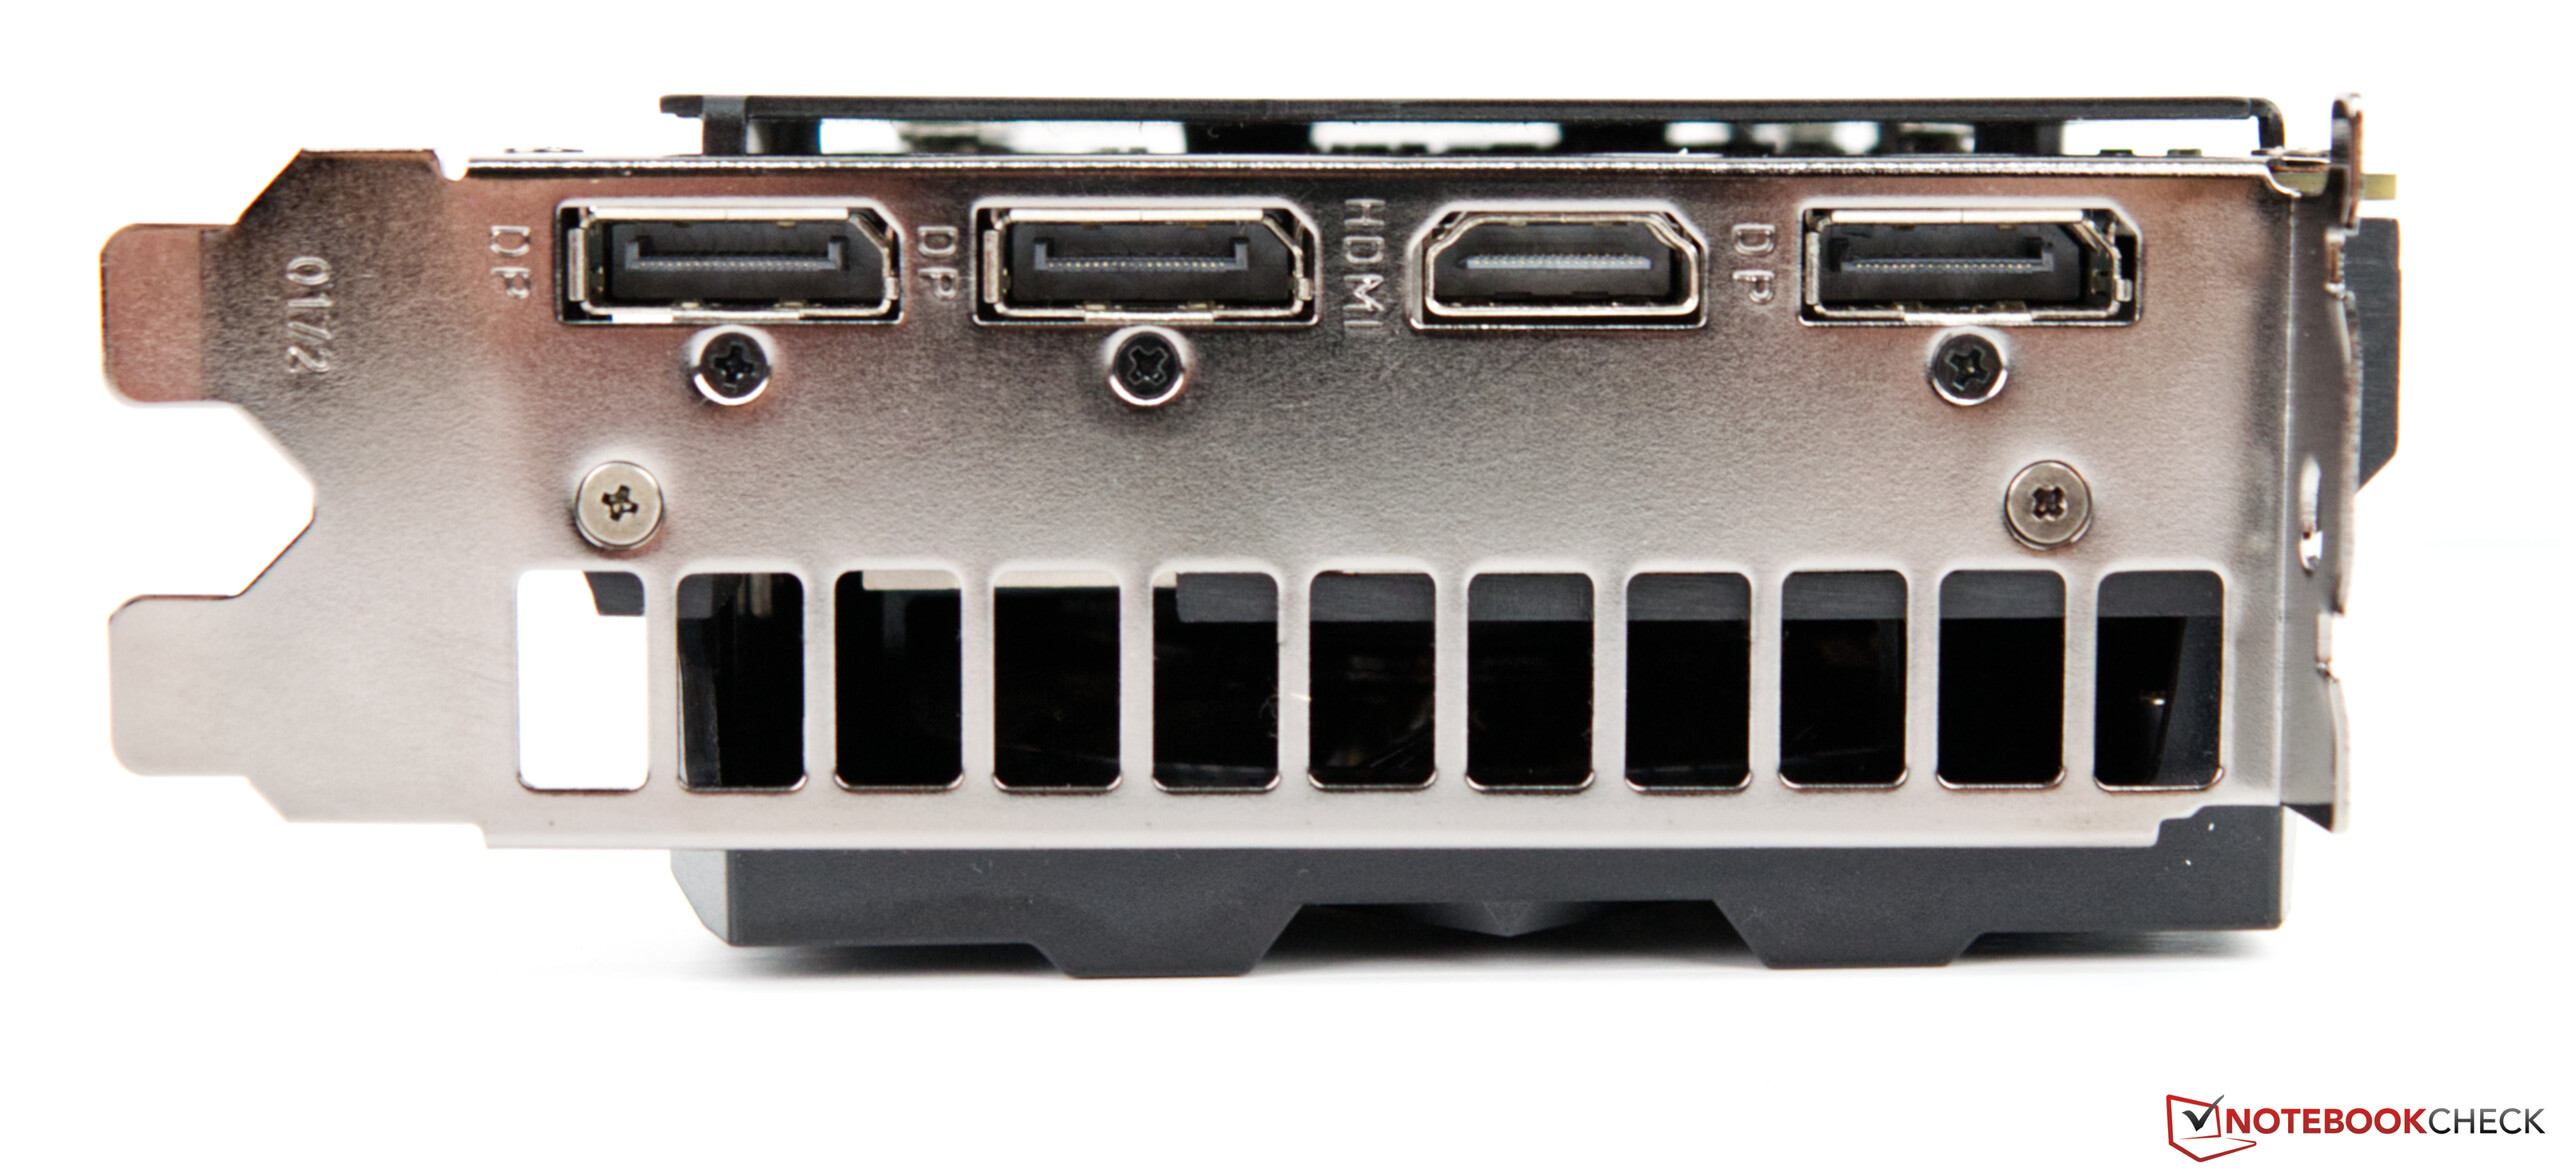
At the time of writing, the KFA2 GeForce RTX 2080 Ti EX retails for about 1070 Euros ($1097), which is quite a lot for a GPU. However, the Founders Edition model costs significantly more. Here Nvidia asks 1259 Euros ($1381). This puts things into perspective and makes the KFA2 model look more attractive, since it is one of the cheapest models on the market. Those who decide to go for a KFA2 model will get a very powerful graphics card with a good cooler that is extremely quiet in 2D operation. You will not have to forgo RGB lighting either, since there are several RGB elements on the side, which can be configured through the Xtreme Tuner utility. Unfortunately, the KFA2 model does not feature a USB Type-C port, which would come in handy for VR applications. Those who do not use VR and do not plan to use it in the foreseeable future will not be bothered by the absence of a USB Type-C port. Furthermore, the KFA2 GeForce RTX 2080 Ti EX offers three DP ports and one HDMI port. The GPU requires 250 watts of energy and two 8-pin power connectors.
Because the oversized cooling solution extends over the PCB, you will have to make sure that your case has enough free space. When compared to the reference model, the KFA2 GPU is six centimeters longer (~2.4 in).
The Turing Specifications in Detail
| Specifications | RTX 2060 | RTX 2060S | RTX 2070 | RTX 2070S | RTX 2080 | RTX 2080S | RTX 2080 Ti | KFA2 RTX 2080 Ti | Titan RTX |
| GPU Architecture | TU106 | TU106 | TU106 | TU104 | TU104 | TU104 | TU102 | TU102 | TU102 |
| Manufacturing Process | 12 nm | 12 nm | 12 nm | 12 nm | 12 nm | 12 nm | 12 nm | 12 nm | 12 nm |
| CUDA Cores | 1.920 | 2.176 | 2.304 | 2.560 | 2.944 | 3.072 | 4.352 | 4.352 | 4.608 |
| Texture Mapping Units | 120 | 136 | 144 | 160 | 184 | 192 | 272 | 272 | 288 |
| Tensor Cores | 240 | 272 | 288 | 320 | 368 | 384 | 544 | 544 | 572 |
| RT Cores | 30 | 34 | 36 | 40 | 46 | 48 | 68 | 68 | 72 |
| Base Core Clock | 1.365 MHz | 1.470 MHz | 1.410 MHz | 1.605 MHz | 1.515 MHz | 1.650 MHz | 1.350 MHz | 1.350 MHz | 1.350 MHz |
| Boost Core Clock | 1.680 MHz | 1.650 MHz | 1.620 MHz | 1.770 MHz | 1.710 MHz | 1.815 MHz | 1.545 MHz | 1.545 MHz | 1.770 MHz |
| Memory Interface | 192 Bit | 256 Bit | 256 Bit | 256 Bit | 256 Bit | 256 Bit | 352 Bit | 352 Bit | 384 Bit |
| Memory Bandwidth | 336 GB/s | 448 GB/s | 448 GB/s | 448 GB/s | 448 GB/s | 496,1 GB/s | 616 GB/s | 616 GB/s | 672 GB/s |
| Memory Capacity | 6 GB GDDR6 | 8 GB GDDR6 | 8 GB GDDR6 | 8 GB GDDR6 | 8 GB GDDR6 | 8 GB GDDR6 | 11 GB GDDR6 | 11 GB GDDR6 | 24 GB GDDR6 |
| TDP | 160 W | 175 W | 175 W | 215 W | 215 W | 250 W | 250 W | 250 W | 280 W |
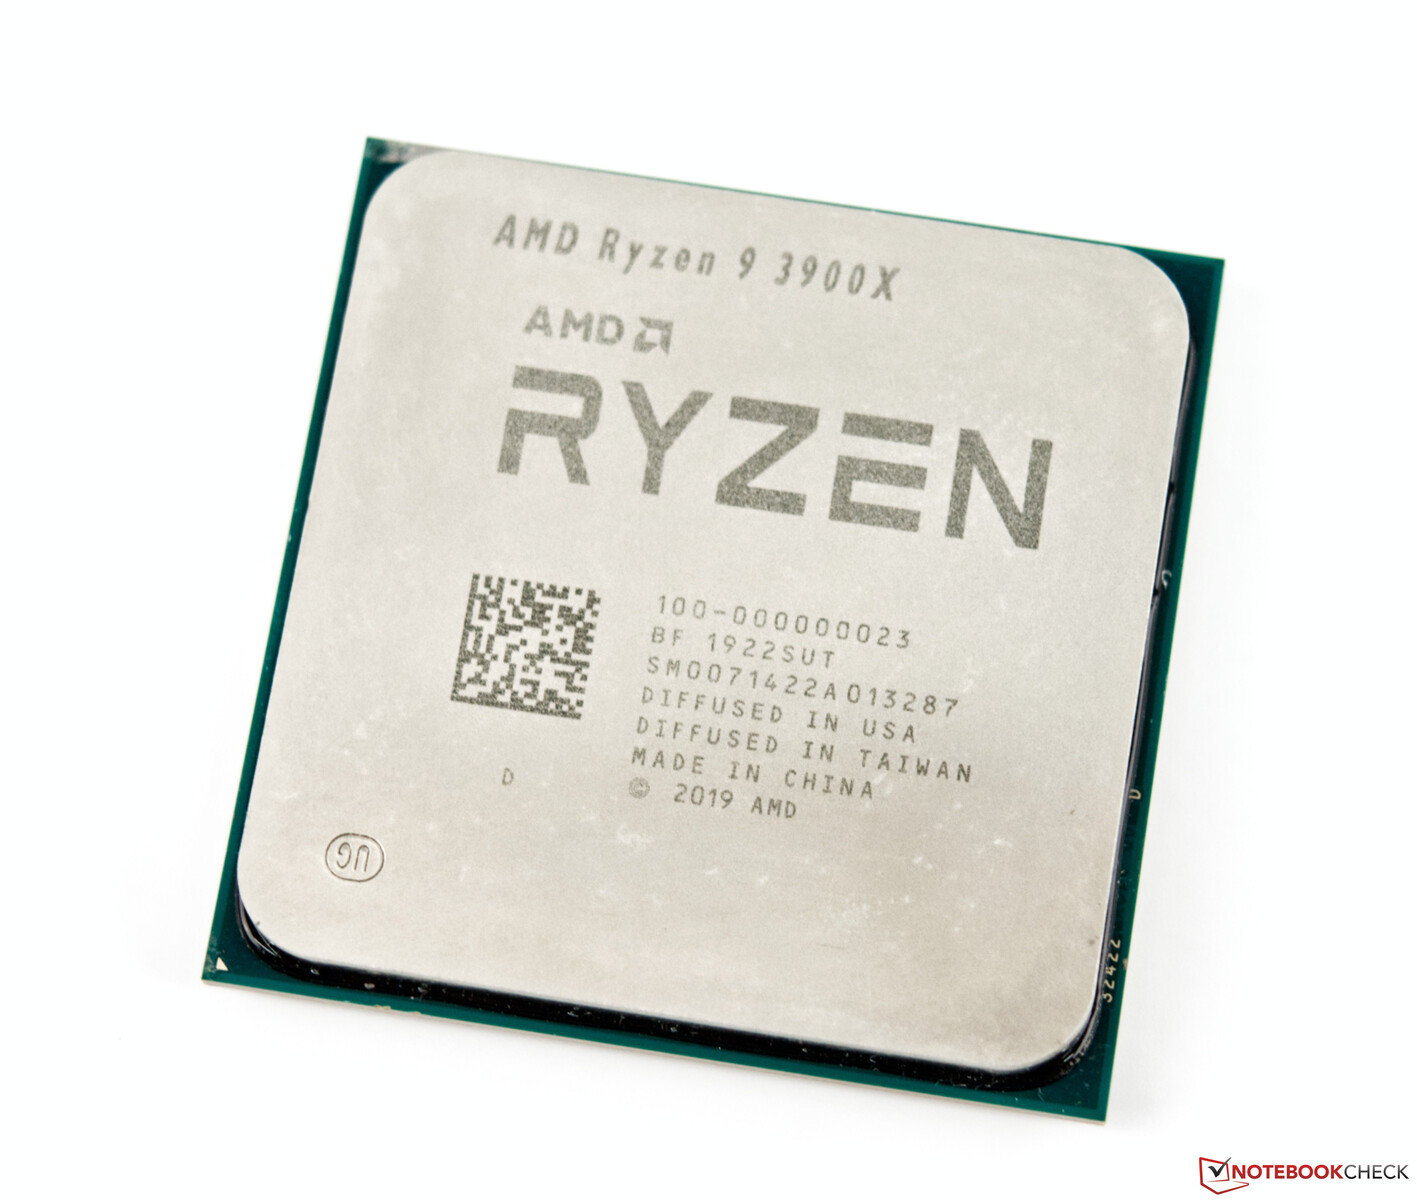
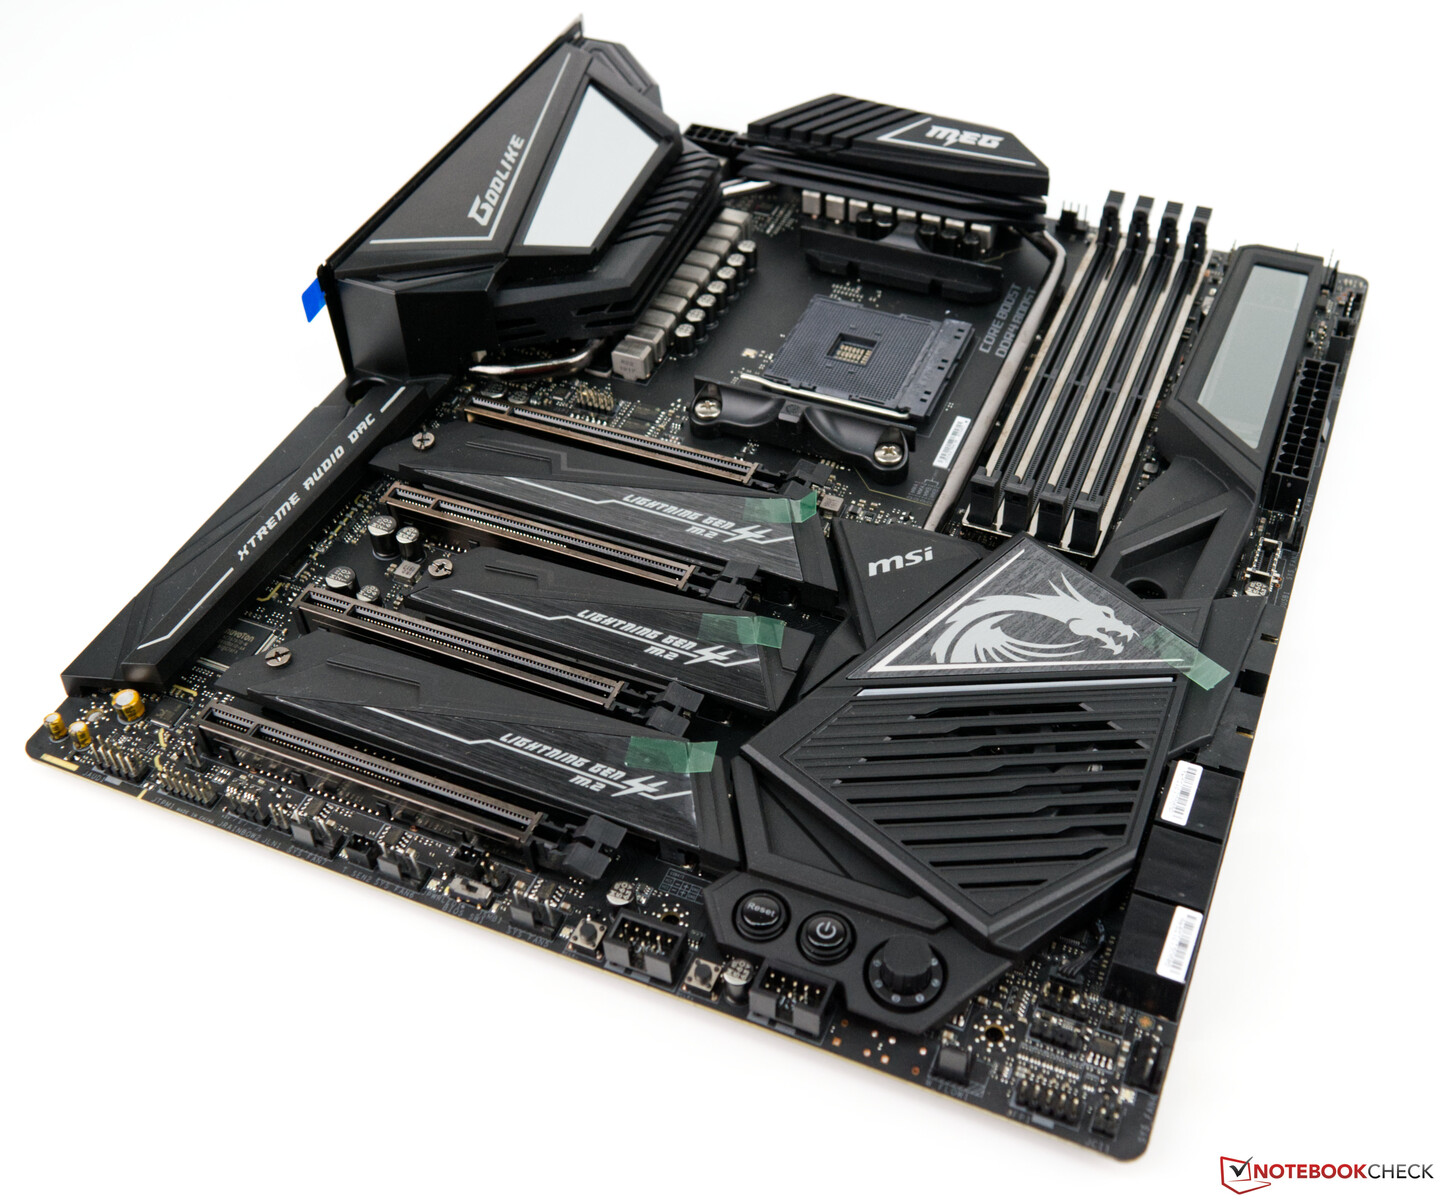
The Test Bench - Based on the AMD Ryzen 9 3900X
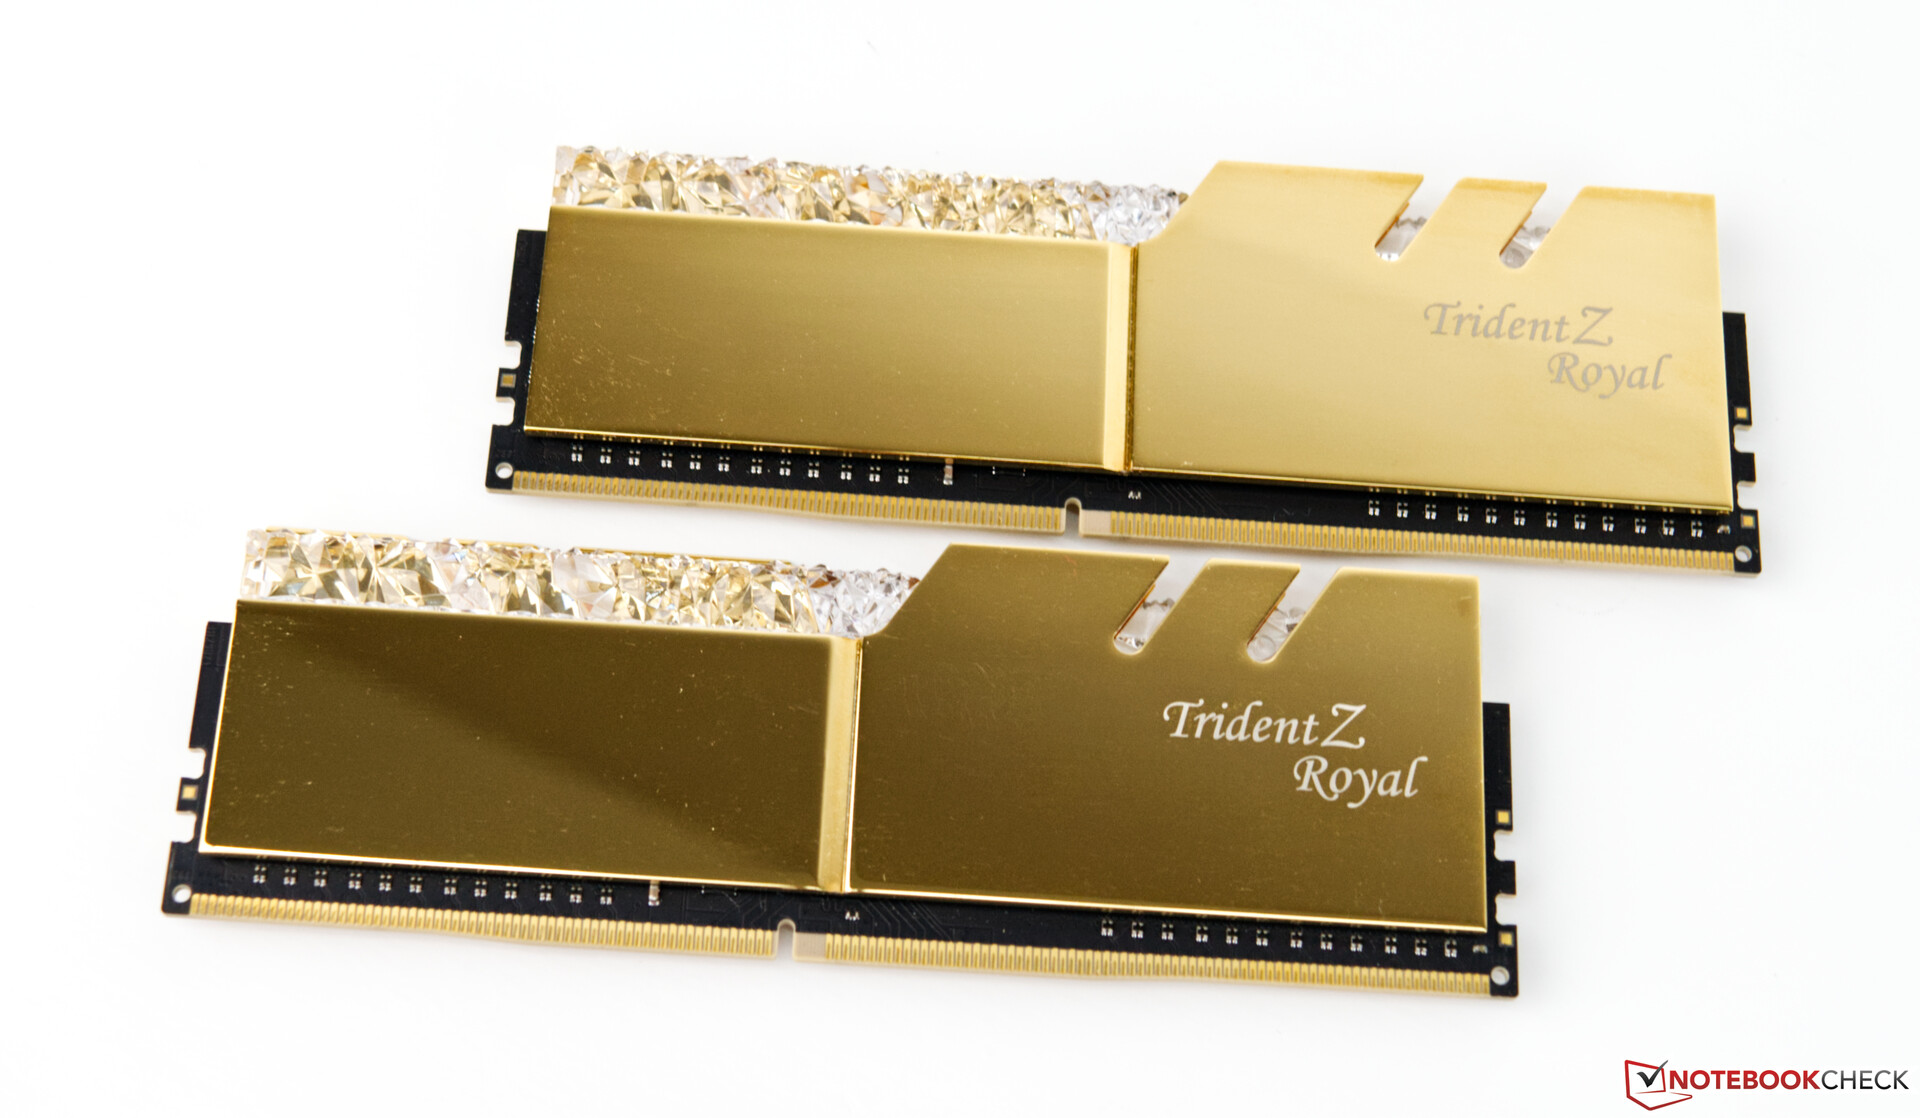
Our test bench is based on a current AMD platform. The MSI MEG X570 Godlike serves as the motherboard. The CPU, which is known as the AMD Ryzen 9 3900X, offers a lot of performance. The system is cooled by an all-in-one water cooler from Be Quiet (Silent Loop 280mm). The 16 GB of 3600 MHz RAM comes from G-Skill. The Acer Predator XB321HK does not represent a bottleneck, thanks to its 4K resolution. We are very grateful to AMD for providing us with the above-mentioned system.
For the following benchmarks we used the following system:
- Corsair Carbide Air 540 ATX Cube
- AMD Ryzen 9 3900X
- KFA2 GeForce RTX 2080 Ti EX 1-Click-OC (GeForce 436.30 driver)
- MSI MEG X570 Godlike (BIOS 1.20, default settings, XMP 1 for DDR4-3600 CL16)
- Antec 1200-watt power supply
- G-Skill Trident Z Royal gold DDR4-3600 16 GB (2 x 8 GB) kit, running at 3600 MHz; timings: CL16-16-16-36
- Corsair MP600 2TB M.2 PCIe 4.0 SSD
- Crucial MX500 2TB (for games)
The Core Clocks of the KFA2 GeForce RTX 2080 Ti EX
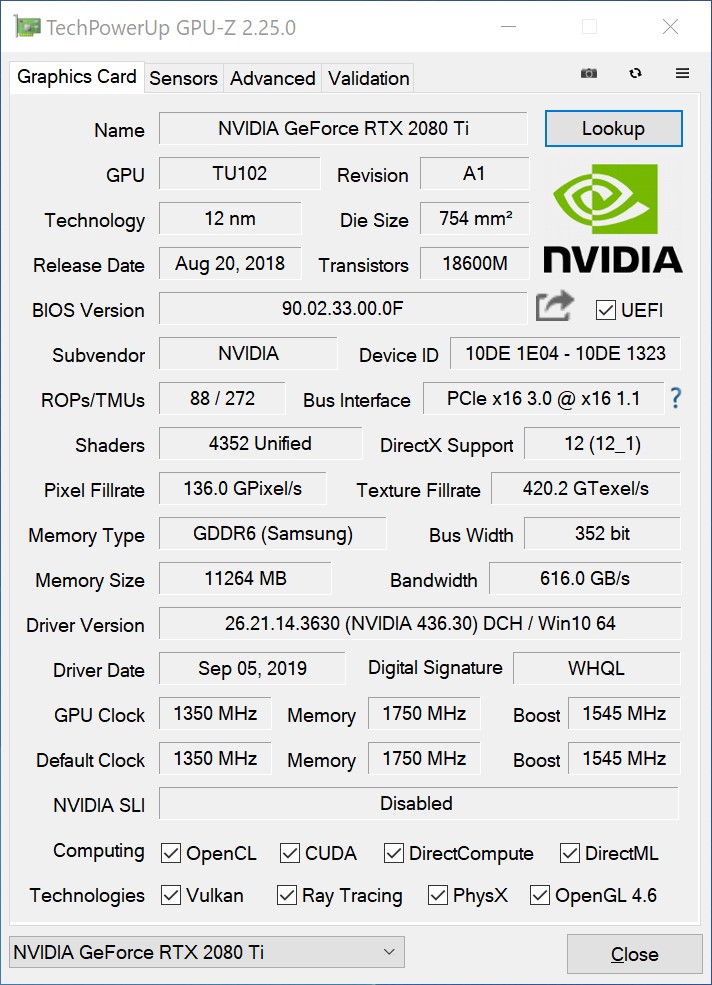
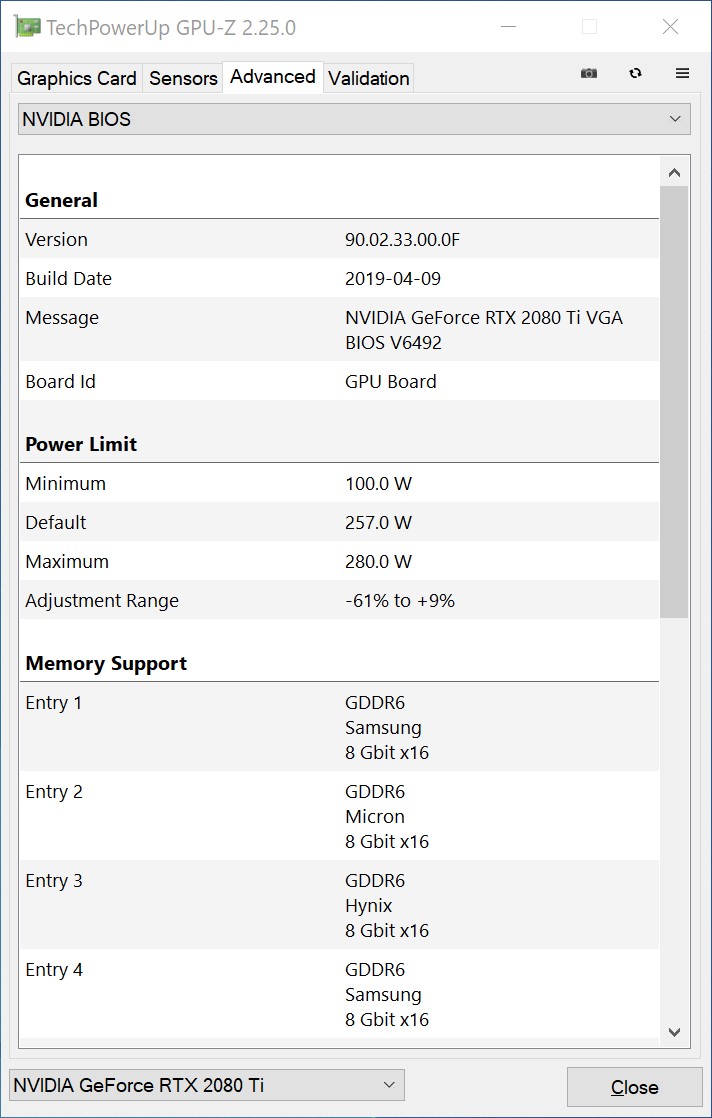
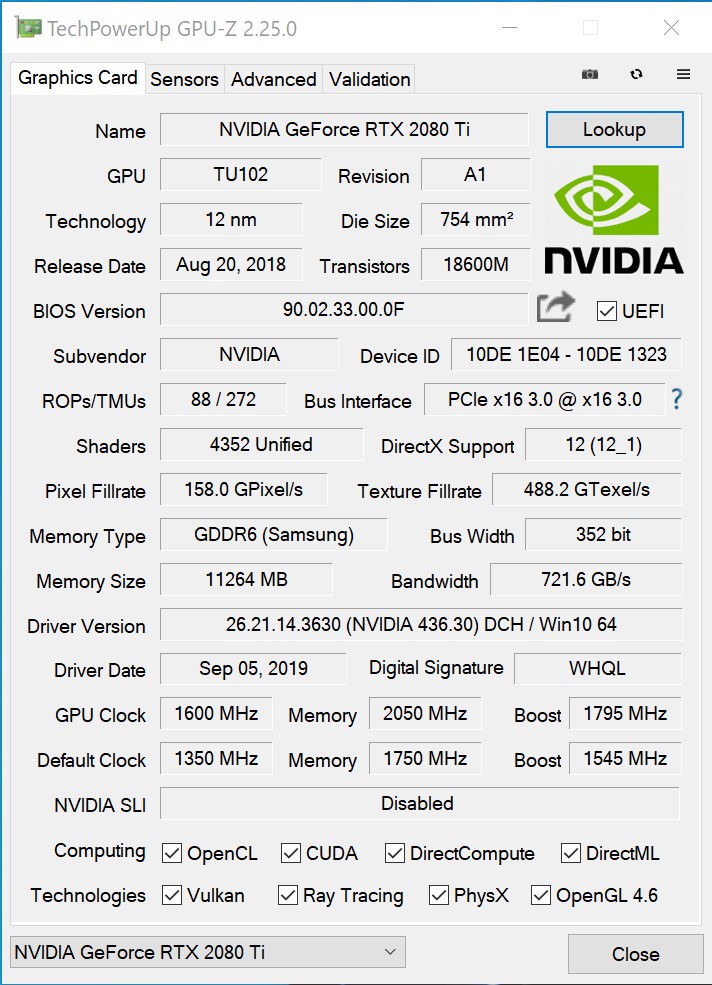
The KFA2 model has the same core clocks as the reference model. According to the specifications sheet, the base clock amounts to 1350 MHz and the boost clock is 1545 MHz. However, when gaming the GPU operates at 1800 to 1900 MHz. The RTX 2080 Ti has 11 GB of VRAM, which is clocked at 1750 MHz (effective memory speed: 14 GHz). Thanks to the 352-bit-wide bus, the memory bandwidth amounts to 616 GB/s.
The TDP of the KFA2 GPU is 250 watts, which is 10 watts lower than that of the reference model. The KFA2 model almost always reaches the power limit, which means that the GPU is running at full speed. The power limit can be raised with the tuning utility. This leads to a higher and more stable boost clock. The KFA2 GeForce RTX 2080 Ti EX comes with the 1 Click OC feature, which increases the base clock by 45 MHz and sets the power target to 108%.

Synthetic Benchmarks
The synthetic benchmarks confirm that the KFA2 GeForce RTX 2080 Ti EX offers a great deal of performance. However, the GeForce RTX 2080 Ti in the Corsair One i160 manages to beat our review model. This goes to show that an Intel-based system is still the best system for gaming. That being said, with a 4% difference, our Ryzen 9-based system does almost as well as the Intel-based PC. The GeForce RTX 2080 Ti is 23% faster than the GeForce RTX 2080 Super.
| 3DMark 11 - 1280x720 Performance GPU | |
| Corsair One i160 | |
| KFA2 GeForce RTX 2080 Ti EX | |
| Nvidia Titan RTX | |
| MSI RTX 2080 Gaming X Trio | |
| Nvidia GeForce RTX 2080 Super | |
| AMD Radeon VII | |
| AMD Radeon RX 5700 XT | |
| Nvidia GeForce RTX 2070 Super | |
| AMD Radeon RX 5700 | |
| MSI RTX 2070 Gaming Z 8G | |
| Nvidia GeForce RTX 2060 Super | |
| AMD Radeon RX Vega 64 | |
| MSI RTX 2060 Gaming Z 6G | |
| Unigine Valley 1.0 | |
| 1920x1080 Extreme HD DirectX AA:x8 | |
| Corsair One i160 | |
| KFA2 GeForce RTX 2080 Ti EX | |
| Nvidia Titan RTX | |
| Nvidia GeForce RTX 2080 Super | |
| MSI RTX 2080 Gaming X Trio | |
| Nvidia GeForce RTX 2070 Super | |
| MSI RTX 2070 Gaming Z 8G | |
| AMD Radeon VII | |
| Nvidia GeForce RTX 2060 Super | |
| AMD Radeon RX 5700 XT | |
| AMD Radeon RX 5700 | |
| MSI RTX 2060 Gaming Z 6G | |
| 1920x1080 Extreme HD Preset OpenGL AA:x8 | |
| KFA2 GeForce RTX 2080 Ti EX | |
| Corsair One i160 | |
| Nvidia Titan RTX | |
| Nvidia GeForce RTX 2080 Super | |
| MSI RTX 2080 Gaming X Trio | |
| Nvidia GeForce RTX 2070 Super | |
| MSI RTX 2070 Gaming Z 8G | |
| Nvidia GeForce RTX 2060 Super | |
| AMD Radeon RX 5700 XT | |
| MSI RTX 2060 Gaming Z 6G | |
| AMD Radeon RX 5700 | |
| AMD Radeon VII | |
| 3DMark 05 Standard | 52639 points | |
| 3DMark 06 Standard Score | 44825 points | |
| 3DMark Vantage P Result | 82093 points | |
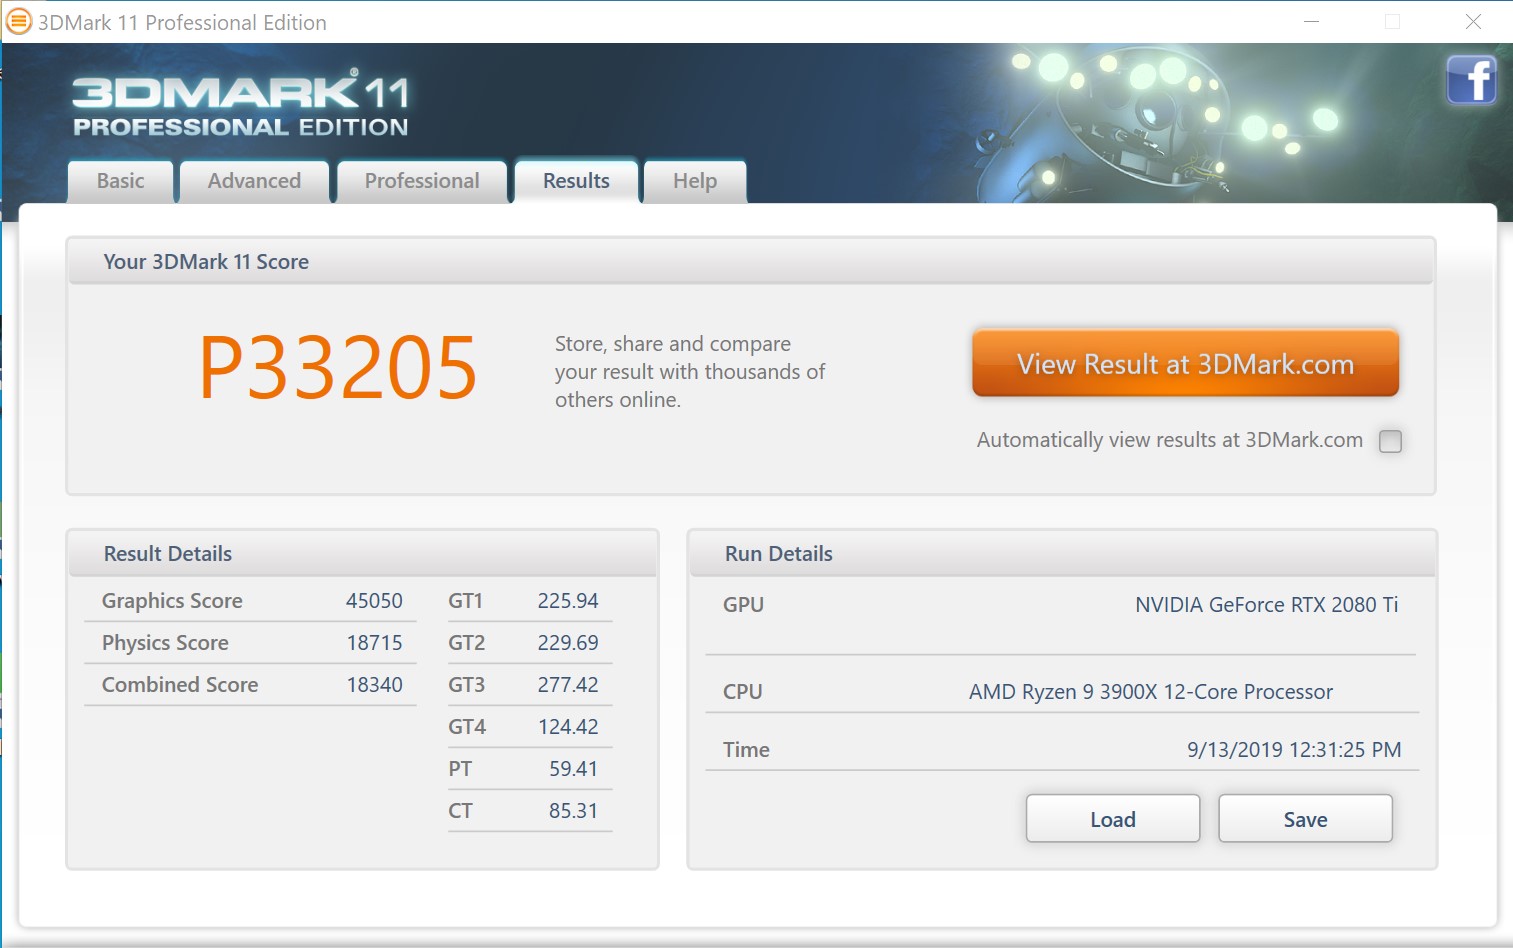
| 3DMark 11 Performance | 33205 points | |
| 3DMark Ice Storm Standard Score | 209400 points | |
| 3DMark Cloud Gate Standard Score | 57827 points | |
| 3DMark Fire Strike Score | 25890 points | |
| 3DMark Fire Strike Extreme Score | 15211 points | |
| 3DMark Time Spy Score | 13424 points | |
Help | ||
Gaming Benchmarks
The gaming benchmarks leave no doubt that the KFA2 GeForce RTX 2080 Ti is a very fast graphics card. It does not matter whether you use an Intel-based system or a Ryzen-powered PC. Of course, there are games that perform better with one CPU or the other. When we benchmark games at very high resolutions the CPU stops being the main bottleneck, which it is at lower resolutions. The GeForce RTX 2080 Ti can run all current titles in 4K without any problems. Moreover, the additional RTX features make the games look much more impressive.
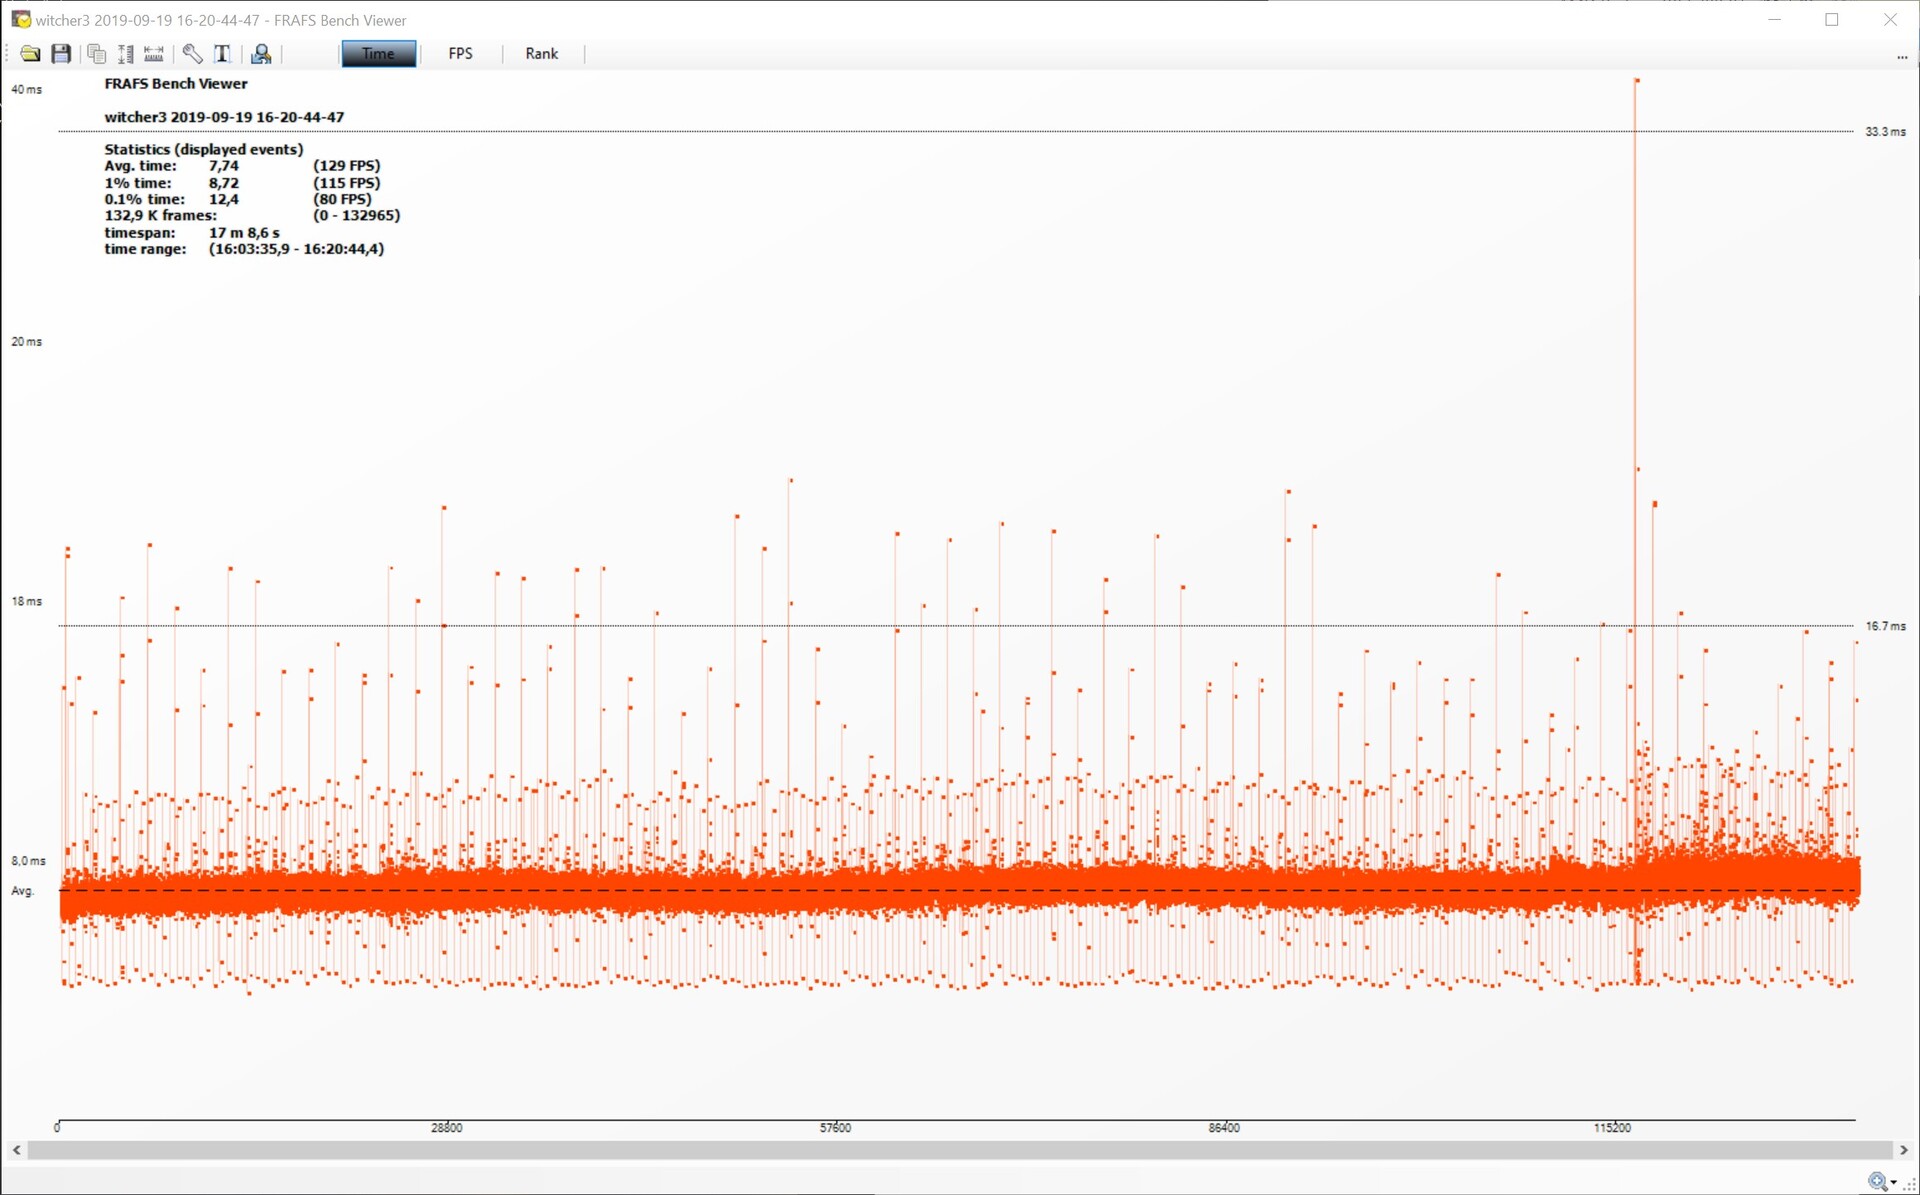
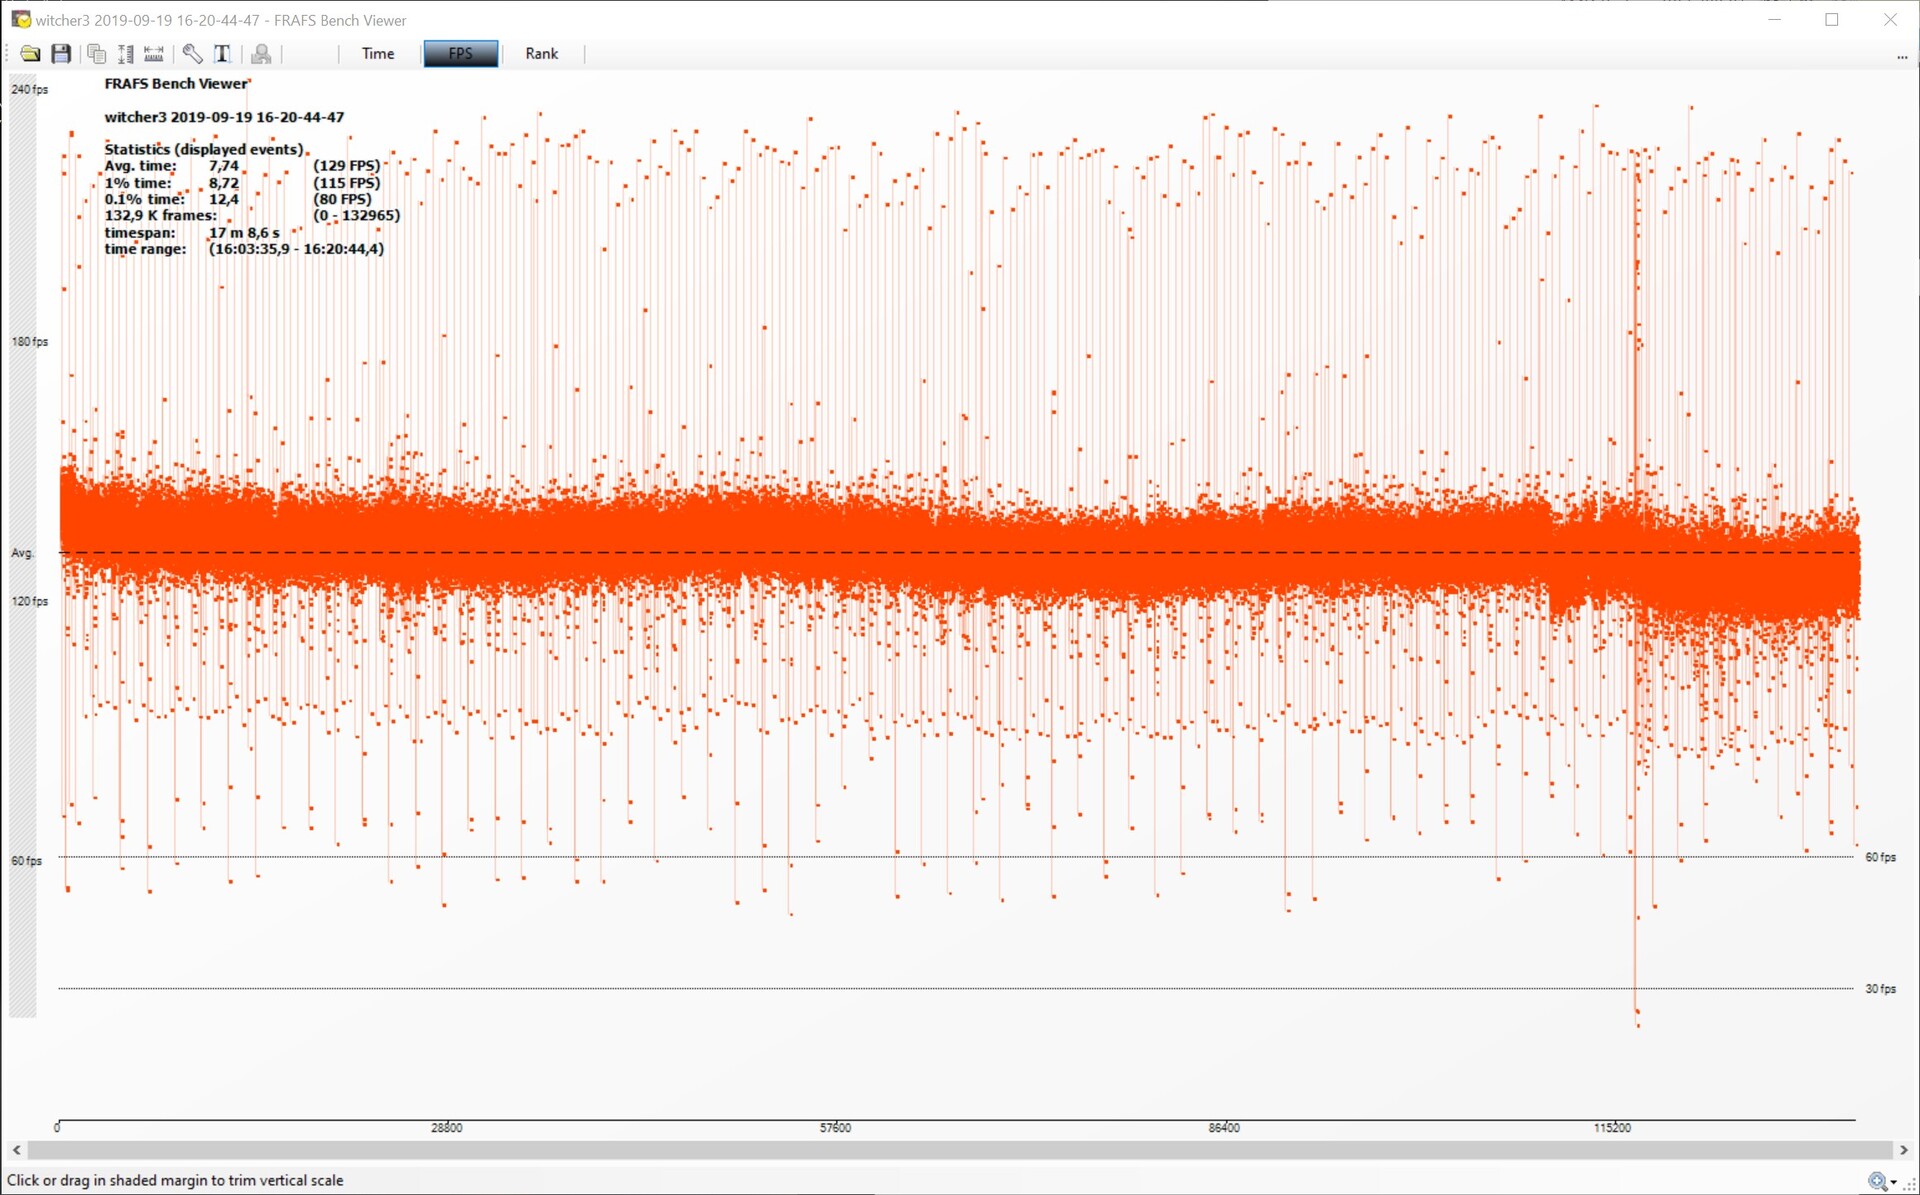
We did not encounter any abnormal behavior when it comes to frametimes and frame rates. There are occasional spikes and drops in the frame rates, but these are very short and are not noticeable during actual gameplay. We collect the frametime and frame rate data with the video game known as The Witcher 3
(preset: Ultra). The performance of the KFA2 model fell slightly over the course of our benchmark run, it sank from 135 FPS to 130 FPS. These are still very high frame rates, which means the game will remain more than playable even during very long gaming sessions.
The Witcher 3 frame rate on ultra
| Forza Horizon 4 | |
| 1920x1080 Ultra Preset AA:2xMS | |
| KFA2 GeForce RTX 2080 Ti EX | |
| Corsair One i160 | |
| AMD Radeon RX 5700 XT | |
| MSI RTX 2080 Gaming X Trio | |
| AMD Radeon RX 5700 XT | |
| Nvidia GeForce RTX 2080 Super | |
| Nvidia Titan RTX | |
| AMD Radeon VII | |
| Nvidia GeForce RTX 2070 Super | |
| AMD Radeon RX Vega 64 | |
| AMD Radeon RX 5700 | |
| MSI RTX 2070 Gaming Z 8G | |
| Nvidia GeForce RTX 2060 Super | |
| MSI RTX 2060 Gaming Z 6G | |
| 3840x2160 Ultra Preset AA:2xMS | |
| KFA2 GeForce RTX 2080 Ti EX | |
| Corsair One i160 | |
| Nvidia Titan RTX | |
| MSI RTX 2080 Gaming X Trio | |
| Nvidia GeForce RTX 2080 Super | |
| AMD Radeon RX 5700 XT | |
| AMD Radeon VII | |
| Nvidia GeForce RTX 2070 Super | |
| AMD Radeon RX 5700 | |
| MSI RTX 2070 Gaming Z 8G | |
| AMD Radeon RX Vega 64 | |
| Nvidia GeForce RTX 2060 Super | |
| MSI RTX 2060 Gaming Z 6G | |
| 2560x1440 Ultra Preset AA:2xMS | |
| KFA2 GeForce RTX 2080 Ti EX | |
| Corsair One i160 | |
| AMD Radeon RX 5700 XT | |
| MSI RTX 2080 Gaming X Trio | |
| Nvidia GeForce RTX 2080 Super | |
| Nvidia GeForce RTX 2070 Super | |
| AMD Radeon RX 5700 | |
| MSI RTX 2070 Gaming Z 8G | |
| Nvidia GeForce RTX 2060 Super | |
| F1 2018 | |
| 1920x1080 Ultra High Preset AA:T AF:16x | |
| Corsair One i160 | |
| Nvidia Titan RTX | |
| MSI RTX 2080 Gaming X Trio | |
| AMD Radeon VII | |
| Nvidia GeForce RTX 2070 Super | |
| Nvidia GeForce RTX 2080 Super | |
| MSI RTX 2070 Gaming Z 8G | |
| Nvidia GeForce RTX 2060 Super | |
| KFA2 GeForce RTX 2080 Ti EX | |
| MSI RTX 2060 Gaming Z 6G | |
| AMD Radeon RX Vega 64 | |
| 3840x2160 Ultra High Preset AA:T AF:16x | |
| Nvidia Titan RTX | |
| Corsair One i160 | |
| KFA2 GeForce RTX 2080 Ti EX | |
| MSI RTX 2080 Gaming X Trio | |
| Nvidia GeForce RTX 2080 Super | |
| AMD Radeon VII | |
| Nvidia GeForce RTX 2070 Super | |
| MSI RTX 2070 Gaming Z 8G | |
| Nvidia GeForce RTX 2060 Super | |
| MSI RTX 2060 Gaming Z 6G | |
| AMD Radeon RX Vega 64 | |
| 2560x1440 Ultra High Preset AA:T AF:16x | |
| Corsair One i160 | |
| MSI RTX 2080 Gaming X Trio | |
| Nvidia GeForce RTX 2080 Super | |
| KFA2 GeForce RTX 2080 Ti EX | |
| Nvidia GeForce RTX 2070 Super | |
| MSI RTX 2070 Gaming Z 8G | |
| Nvidia GeForce RTX 2060 Super | |
| Monster Hunter World | |
| 1920x1080 Highest Preset (Image Quality High) | |
| Corsair One i160 | |
| Nvidia Titan RTX | |
| MSI RTX 2080 Gaming X Trio | |
| Nvidia GeForce RTX 2080 Super | |
| Nvidia GeForce RTX 2070 Super | |
| MSI RTX 2070 Gaming Z 8G | |
| AMD Radeon VII | |
| Nvidia GeForce RTX 2060 Super | |
| AMD Radeon RX 5700 XT | |
| MSI RTX 2060 Gaming Z 6G | |
| AMD Radeon RX Vega 64 | |
| AMD Radeon RX 5700 | |
| 3840x2160 Highest Preset (Image Quality High) | |
| Nvidia Titan RTX | |
| Corsair One i160 | |
| MSI RTX 2080 Gaming X Trio | |
| Nvidia GeForce RTX 2080 Super | |
| Nvidia GeForce RTX 2070 Super | |
| AMD Radeon VII | |
| MSI RTX 2070 Gaming Z 8G | |
| AMD Radeon RX 5700 XT | |
| AMD Radeon RX Vega 64 | |
| Nvidia GeForce RTX 2060 Super | |
| AMD Radeon RX 5700 | |
| MSI RTX 2060 Gaming Z 6G | |
| 2560x1440 Highest Preset (Image Quality High) | |
| Corsair One i160 | |
| MSI RTX 2080 Gaming X Trio | |
| Nvidia GeForce RTX 2080 Super | |
| Nvidia GeForce RTX 2070 Super | |
| MSI RTX 2070 Gaming Z 8G | |
| AMD Radeon RX 5700 XT | |
| Nvidia GeForce RTX 2060 Super | |
| AMD Radeon RX 5700 | |
| Destiny 2 | |
| 1920x1080 Highest Preset AA:SM AF:16x | |
| Corsair One i160 | |
| KFA2 GeForce RTX 2080 Ti EX | |
| Nvidia Titan RTX | |
| MSI RTX 2070 Gaming Z 8G | |
| Nvidia GeForce RTX 2080 Super | |
| MSI RTX 2080 Gaming X Trio | |
| Nvidia GeForce RTX 2060 Super | |
| Nvidia GeForce RTX 2070 Super | |
| AMD Radeon RX 5700 XT | |
| AMD Radeon RX 5700 | |
| AMD Radeon VII | |
| MSI RTX 2060 Gaming Z 6G | |
| 3840x2160 Highest Preset AA:SM AF:16x | |
| Nvidia Titan RTX | |
| Corsair One i160 | |
| KFA2 GeForce RTX 2080 Ti EX | |
| Nvidia GeForce RTX 2080 Super | |
| MSI RTX 2080 Gaming X Trio | |
| Nvidia GeForce RTX 2070 Super | |
| MSI RTX 2070 Gaming Z 8G | |
| AMD Radeon RX 5700 XT | |
| Nvidia GeForce RTX 2060 Super | |
| AMD Radeon VII | |
| MSI RTX 2060 Gaming Z 6G | |
| AMD Radeon RX 5700 | |
| 2560x1440 Highest Preset AA:SM AF:16x | |
| Corsair One i160 | |
| KFA2 GeForce RTX 2080 Ti EX | |
| Nvidia GeForce RTX 2080 Super | |
| MSI RTX 2080 Gaming X Trio | |
| Nvidia GeForce RTX 2070 Super | |
| MSI RTX 2070 Gaming Z 8G | |
| AMD Radeon RX 5700 XT | |
| Nvidia GeForce RTX 2060 Super | |
| AMD Radeon RX 5700 | |
| The Witcher 3 | |
| 1920x1080 Ultra Graphics & Postprocessing (HBAO+) | |
| KFA2 GeForce RTX 2080 Ti EX | |
| Corsair One i160 | |
| Nvidia Titan RTX | |
| MSI RTX 2080 Gaming X Trio | |
| Nvidia GeForce RTX 2080 Super | |
| Nvidia GeForce RTX 2070 Super | |
| AMD Radeon RX 5700 XT | |
| AMD Radeon RX 5700 XT | |
| MSI RTX 2070 Gaming Z 8G | |
| AMD Radeon RX 5700 | |
| Nvidia GeForce RTX 2060 Super | |
| AMD Radeon RX Vega 64 | |
| AMD Radeon VII | |
| MSI RTX 2060 Gaming Z 6G | |
| 3840x2160 High Graphics & Postprocessing (Nvidia HairWorks Off) | |
| Nvidia Titan RTX | |
| Corsair One i160 | |
| KFA2 GeForce RTX 2080 Ti EX | |
| Nvidia GeForce RTX 2080 Super | |
| MSI RTX 2080 Gaming X Trio | |
| Nvidia GeForce RTX 2070 Super | |
| MSI RTX 2070 Gaming Z 8G | |
| Nvidia GeForce RTX 2060 Super | |
| AMD Radeon VII | |
| AMD Radeon RX 5700 XT | |
| MSI RTX 2060 Gaming Z 6G | |
| AMD Radeon RX Vega 64 | |
| AMD Radeon RX 5700 | |
| Watch Dogs 2 | |
| 1920x1080 Ultra Preset | |
| Corsair One i160 | |
| KFA2 GeForce RTX 2080 Ti EX | |
| Nvidia Titan RTX | |
| Nvidia GeForce RTX 2080 Super | |
| MSI RTX 2080 Gaming X Trio | |
| Nvidia GeForce RTX 2070 Super | |
| MSI RTX 2070 Gaming Z 8G | |
| Nvidia GeForce RTX 2060 Super | |
| AMD Radeon RX Vega 64 | |
| MSI RTX 2060 Gaming Z 6G | |
| AMD Radeon VII | |
| 3840x2160 High Preset | |
| Nvidia Titan RTX | |
| Corsair One i160 | |
| KFA2 GeForce RTX 2080 Ti EX | |
| Nvidia GeForce RTX 2080 Super | |
| MSI RTX 2080 Gaming X Trio | |
| Nvidia GeForce RTX 2070 Super | |
| MSI RTX 2070 Gaming Z 8G | |
| Nvidia GeForce RTX 2060 Super | |
| AMD Radeon VII | |
| MSI RTX 2060 Gaming Z 6G | |
| AMD Radeon RX Vega 64 | |
| Battlefield 1 | |
| 1920x1080 Ultra Preset AA:T | |
| Corsair One i160 | |
| KFA2 GeForce RTX 2080 Ti EX | |
| Nvidia Titan RTX | |
| Nvidia GeForce RTX 2070 Super | |
| Nvidia GeForce RTX 2080 Super | |
| MSI RTX 2080 Gaming X Trio | |
| AMD Radeon RX Vega 64 | |
| Nvidia GeForce RTX 2060 Super | |
| MSI RTX 2070 Gaming Z 8G | |
| AMD Radeon VII | |
| MSI RTX 2060 Gaming Z 6G | |
| 3840x2160 High Preset AA:T | |
| Corsair One i160 | |
| KFA2 GeForce RTX 2080 Ti EX | |
| Nvidia Titan RTX | |
| Nvidia GeForce RTX 2080 Super | |
| MSI RTX 2080 Gaming X Trio | |
| AMD Radeon VII | |
| Nvidia GeForce RTX 2070 Super | |
| MSI RTX 2070 Gaming Z 8G | |
| Nvidia GeForce RTX 2060 Super | |
| AMD Radeon RX Vega 64 | |
| MSI RTX 2060 Gaming Z 6G | |
| For Honor | |
| 1920x1080 Extreme Preset AA:T AF:16x | |
| Nvidia Titan RTX | |
| Corsair One i160 | |
| KFA2 GeForce RTX 2080 Ti EX | |
| Nvidia GeForce RTX 2080 Super | |
| MSI RTX 2080 Gaming X Trio | |
| AMD Radeon RX 5700 XT | |
| AMD Radeon RX 5700 XT | |
| Nvidia GeForce RTX 2070 Super | |
| AMD Radeon RX 5700 | |
| MSI RTX 2070 Gaming Z 8G | |
| Nvidia GeForce RTX 2060 Super | |
| AMD Radeon RX Vega 64 | |
| MSI RTX 2060 Gaming Z 6G | |
| AMD Radeon VII | |
| 3840x2160 High Preset AA:T AF:8x | |
| Nvidia Titan RTX | |
| KFA2 GeForce RTX 2080 Ti EX | |
| Corsair One i160 | |
| Nvidia GeForce RTX 2080 Super | |
| MSI RTX 2080 Gaming X Trio | |
| Nvidia GeForce RTX 2070 Super | |
| AMD Radeon VII | |
| AMD Radeon RX 5700 XT | |
| MSI RTX 2070 Gaming Z 8G | |
| Nvidia GeForce RTX 2060 Super | |
| AMD Radeon RX 5700 | |
| MSI RTX 2060 Gaming Z 6G | |
| AMD Radeon RX Vega 64 | |
| Ghost Recon Wildlands | |
| 1920x1080 Ultra Preset AA:T AF:16x | |
| Corsair One i160 | |
| Nvidia Titan RTX | |
| KFA2 GeForce RTX 2080 Ti EX | |
| Nvidia GeForce RTX 2080 Super | |
| MSI RTX 2080 Gaming X Trio | |
| Nvidia GeForce RTX 2070 Super | |
| AMD Radeon RX 5700 XT | |
| MSI RTX 2070 Gaming Z 8G | |
| Nvidia GeForce RTX 2060 Super | |
| AMD Radeon RX 5700 | |
| MSI RTX 2060 Gaming Z 6G | |
| AMD Radeon RX Vega 64 | |
| AMD Radeon VII | |
| 3840x2160 Ultra Preset AA:T AF:16x | |
| Nvidia Titan RTX | |
| Corsair One i160 | |
| KFA2 GeForce RTX 2080 Ti EX | |
| Nvidia GeForce RTX 2080 Super | |
| MSI RTX 2080 Gaming X Trio | |
| Nvidia GeForce RTX 2070 Super | |
| AMD Radeon RX 5700 XT | |
| MSI RTX 2070 Gaming Z 8G | |
| AMD Radeon RX 5700 | |
| Nvidia GeForce RTX 2060 Super | |
| GTA V | |
| 1920x1080 Highest AA:4xMSAA + FX AF:16x | |
| Nvidia Titan RTX | |
| MSI RTX 2080 Gaming X Trio | |
| AMD Radeon VII | |
| MSI RTX 2070 Gaming Z 8G | |
| Corsair One i160 | |
| MSI RTX 2060 Gaming Z 6G | |
| KFA2 GeForce RTX 2080 Ti EX | |
| Nvidia GeForce RTX 2060 Super | |
| Nvidia GeForce RTX 2070 Super | |
| Nvidia GeForce RTX 2080 Super | |
| AMD Radeon RX 5700 | |
| AMD Radeon RX 5700 XT | |
| 3840x2160 High/On (Advanced Graphics Off) AA:FX AF:8x | |
| Corsair One i160 | |
| Nvidia Titan RTX | |
| KFA2 GeForce RTX 2080 Ti EX | |
| Nvidia GeForce RTX 2080 Super | |
| Nvidia GeForce RTX 2070 Super | |
| AMD Radeon RX 5700 XT | |
| MSI RTX 2080 Gaming X Trio | |
| Nvidia GeForce RTX 2060 Super | |
| AMD Radeon RX 5700 | |
| AMD Radeon VII | |
| MSI RTX 2070 Gaming Z 8G | |
| MSI RTX 2060 Gaming Z 6G | |
| Battlefield 4 - 3840x2160 High Preset | |
| Nvidia Titan RTX | |
| Corsair One i160 | |
| KFA2 GeForce RTX 2080 Ti EX | |
| Nvidia GeForce RTX 2080 Super | |
| MSI RTX 2080 Gaming X Trio | |
| Nvidia GeForce RTX 2070 Super | |
| MSI RTX 2070 Gaming Z 8G | |
| AMD Radeon RX Vega 64 | |
| AMD Radeon VII | |
| Nvidia GeForce RTX 2060 Super | |
| MSI RTX 2060 Gaming Z 6G | |
| Rage 2 | |
| 3840x2160 Ultra Preset (Resolution Scale Off) | |
| Corsair One i160 | |
| KFA2 GeForce RTX 2080 Ti EX | |
| Nvidia Titan RTX 24 GB | |
| Nvidia GeForce RTX 2080 Super | |
| MSI RTX 2080 Gaming X Trio | |
| Nvidia GeForce RTX 2070 Super | |
| MSI RTX 2070 Gaming Z 8G | |
| AMD Radeon RX 5700 XT | |
| Nvidia GeForce RTX 2060 Super | |
| AMD Radeon RX Vega 64 | |
| AMD Radeon RX 5700 | |
| MSI RTX 2060 Gaming Z 6G | |
| 1920x1080 Ultra Preset (Resolution Scale Off) | |
| Corsair One i160 | |
| KFA2 GeForce RTX 2080 Ti EX | |
| Nvidia Titan RTX 24 GB | |
| Nvidia GeForce RTX 2080 Super | |
| MSI RTX 2080 Gaming X Trio | |
| Nvidia GeForce RTX 2070 Super | |
| MSI RTX 2070 Gaming Z 8G | |
| AMD Radeon RX Vega 64 | |
| Nvidia GeForce RTX 2060 Super | |
| AMD Radeon RX 5700 XT | |
| MSI RTX 2060 Gaming Z 6G | |
| 2560x1440 Ultra Preset (Resolution Scale Off) | |
| Corsair One i160 | |
| KFA2 GeForce RTX 2080 Ti EX | |
| Nvidia Titan RTX 24 GB | |
| Nvidia GeForce RTX 2080 Super | |
| MSI RTX 2080 Gaming X Trio | |
| Nvidia GeForce RTX 2070 Super | |
| MSI RTX 2070 Gaming Z 8G | |
| AMD Radeon RX Vega 64 | |
| Nvidia GeForce RTX 2060 Super | |
| AMD Radeon RX 5700 XT | |
| AMD Radeon RX 5700 | |
| MSI RTX 2060 Gaming Z 6G | |
| F1 2019 | |
| 3840x2160 Ultra High Preset AA:T AF:16x | |
| Nvidia Titan RTX 24 GB | |
| Corsair One i160 | |
| KFA2 GeForce RTX 2080 Ti EX | |
| Nvidia GeForce RTX 2080 Super | |
| Nvidia GeForce RTX 2070 Super | |
| AMD Radeon RX 5700 XT | |
| AMD Radeon RX 5700 | |
| Nvidia GeForce RTX 2060 Super | |
| AMD Radeon RX Vega 64 | |
| 1920x1080 Ultra High Preset AA:T AF:16x | |
| Corsair One i160 | |
| KFA2 GeForce RTX 2080 Ti EX | |
| AMD Radeon RX 5700 XT | |
| Nvidia GeForce RTX 2080 Super | |
| AMD Radeon RX 5700 XT | |
| Nvidia GeForce RTX 2070 Super | |
| Nvidia Titan RTX 24 GB | |
| AMD Radeon RX Vega 64 | |
| AMD Radeon RX 5700 | |
| Nvidia GeForce RTX 2060 Super | |
| 2560x1440 Ultra High Preset AA:T AF:16x | |
| KFA2 GeForce RTX 2080 Ti EX | |
| Corsair One i160 | |
| Nvidia Titan RTX 24 GB | |
| Nvidia GeForce RTX 2080 Super | |
| Nvidia GeForce RTX 2070 Super | |
| AMD Radeon RX 5700 XT | |
| AMD Radeon RX 5700 | |
| Nvidia GeForce RTX 2060 Super | |
| AMD Radeon RX Vega 64 | |
| FIFA 20 | |
| 3840x2160 Ultra Preset AA:4xMS | |
| KFA2 GeForce RTX 2080 Ti EX | |
| Nvidia GeForce RTX 2080 Super | |
| Nvidia GeForce RTX 2070 Super | |
| AMD Radeon RX 5700 XT | |
| Nvidia GeForce RTX 2060 Super | |
| AMD Radeon RX 5700 | |
| 2560x1440 Ultra Preset AA:4xMS | |
| AMD Radeon RX 5700 XT | |
| AMD Radeon RX 5700 | |
| Nvidia GeForce RTX 2080 Super | |
| KFA2 GeForce RTX 2080 Ti EX | |
| Nvidia GeForce RTX 2070 Super | |
| Nvidia GeForce RTX 2060 Super | |
| 1920x1080 Ultra Preset AA:4xMS | |
| AMD Radeon RX 5700 | |
| AMD Radeon RX 5700 XT | |
| KFA2 GeForce RTX 2080 Ti EX | |
| Nvidia GeForce RTX 2080 Super | |
| Nvidia GeForce RTX 2070 Super | |
| Nvidia GeForce RTX 2060 Super | |
| Control | |
| 3840x2160 High Quality Preset | |
| Nvidia Titan RTX 24 GB | |
| KFA2 GeForce RTX 2080 Ti EX | |
| Nvidia GeForce RTX 2070 Super | |
| Nvidia GeForce RTX 2080 Super | |
| AMD Radeon RX 5700 XT | |
| Nvidia GeForce RTX 2060 Super | |
| AMD Radeon RX 5700 | |
| 2560x1440 High Quality Preset | |
| Nvidia Titan RTX 24 GB | |
| KFA2 GeForce RTX 2080 Ti EX | |
| Nvidia GeForce RTX 2070 Super | |
| Nvidia GeForce RTX 2080 Super | |
| AMD Radeon RX 5700 XT | |
| Nvidia GeForce RTX 2060 Super | |
| AMD Radeon RX 5700 | |
| 1920x1080 High Quality Preset | |
| Nvidia Titan RTX 24 GB | |
| KFA2 GeForce RTX 2080 Ti EX | |
| Nvidia GeForce RTX 2070 Super | |
| Nvidia GeForce RTX 2080 Super | |
| AMD Radeon RX 5700 XT | |
| Nvidia GeForce RTX 2060 Super | |
| AMD Radeon RX 5700 | |
| Borderlands 3 | |
| 3840x2160 Badass Overall Quality (DX11) | |
| Nvidia Titan RTX 24 GB | |
| KFA2 GeForce RTX 2080 Ti EX | |
| Nvidia GeForce RTX 2080 Super | |
| Nvidia GeForce RTX 2070 Super | |
| AMD Radeon RX 5700 XT | |
| Nvidia GeForce RTX 2060 Super | |
| AMD Radeon RX 5700 | |
| 2560x1440 Badass Overall Quality (DX11) | |
| KFA2 GeForce RTX 2080 Ti EX | |
| Nvidia Titan RTX 24 GB | |
| Nvidia GeForce RTX 2080 Super | |
| Nvidia GeForce RTX 2070 Super | |
| AMD Radeon RX 5700 XT | |
| Nvidia GeForce RTX 2060 Super | |
| AMD Radeon RX 5700 | |
| 1920x1080 Badass Overall Quality (DX11) | |
| KFA2 GeForce RTX 2080 Ti EX | |
| Nvidia GeForce RTX 2080 Super | |
| Nvidia GeForce RTX 2070 Super | |
| Nvidia Titan RTX 24 GB | |
| AMD Radeon RX 5700 XT | |
| Nvidia GeForce RTX 2060 Super | |
| AMD Radeon RX 5700 | |
| low | med. | high | ultra | QHD | 4K | |
|---|---|---|---|---|---|---|
| BioShock Infinite (2013) | 394 | 349 | 325 | 233 | ||
| Battlefield 4 (2013) | 200 | 200 | 200 | 200 | 148.5 | |
| GTA V (2015) | 177 | 172 | 162 | 99 | 138 | |
| The Witcher 3 (2015) | 403 | 341 | 245 | 135 | 96 | |
| Dota 2 Reborn (2015) | 163.7 | 148.9 | 143.9 | 141.2 | 139.6 | |
| Rainbow Six Siege (2015) | 470 | 379 | 332 | 313 | 173 | |
| Rise of the Tomb Raider (2016) | 324 | 223 | 212 | 198 | 93 | |
| Far Cry Primal (2016) | 129 | 116 | 107 | 100 | 88 | |
| The Division (2016) | 328 | 279 | 196 | 160 | 86 | |
| Doom (2016) | 194 | 178 | 163 | 167 | 131 | |
| Overwatch (2016) | 300 | 300 | 300 | 295 | 188 | |
| Deus Ex Mankind Divided (2016) | 167 | 156 | 135 | 100 | 67 | |
| Battlefield 1 (2016) | 200 | 196 | 184 | 171 | 112 | |
| Dishonored 2 (2016) | 92 | 89 | 88 | 82 | 86 | |
| Watch Dogs 2 (2016) | 155 | 141 | 126 | 101 | 66 | |
| For Honor (2017) | 358 | 257 | 246 | 195 | 99 | |
| Ghost Recon Wildlands (2017) | 147 | 122 | 120 | 82 | 64 | |
| Rocket League (2017) | 250 | 250 | 249 | 209 | ||
| Dirt 4 (2017) | 269 | 207 | 183 | 170 | 123 | |
| Playerunknown's Battlegrounds (PUBG) (2017) | 214 | 190 | 183 | 180 | 86 | |
| Destiny 2 (2017) | 181 | 178 | 178 | 178 | 157 | 89 |
| Assassin´s Creed Origins (2017) | 145 | 127 | 121 | 104 | 89 | 62 |
| Call of Duty WWII (2017) | 305 | 302 | 221 | 200 | 166 | 110 |
| Fortnite (2018) | 349 | 290 | 218 | 197 | 141 | 76 |
| Final Fantasy XV Benchmark (2018) | 185 | 155 | 118 | 55.6 | ||
| Kingdom Come: Deliverance (2018) | 175 | 155 | 122 | 85 | 83 | 50 |
| X-Plane 11.11 (2018) | 127 | 113 | 91 | 79 | ||
| Far Cry 5 (2018) | 139 | 124 | 119 | 111 | 109 | 74 |
| The Crew 2 (2018) | 60 | 60 | 60 | 60 | 60 | 60 |
| F1 2018 (2018) | 201 | 172 | 143 | 116 | 114 | 95 |
| Shadow of the Tomb Raider (2018) | 148 | 138 | 136 | 130 | 108 | 60 |
| FIFA 19 (2018) | 364 | 358 | 330 | 323 | 319 | 298 |
| Forza Horizon 4 (2018) | 207 | 182 | 180 | 168 | 147 | 107 |
| Assassin´s Creed Odyssey (2018) | 135 | 121 | 105 | 80 | 71 | 46 |
| Call of Duty Black Ops 4 (2018) | 288 | 241 | 232 | 223 | 159 | 84 |
| Hitman 2 (2018) | 66 | 63 | 56.8 | 55.8 | 55.1 | 54.8 |
| Battlefield V (2018) | 181 | 147 | 137 | 127 | 108 | 73 |
| Farming Simulator 19 (2018) | 220 | 163 | 143 | 133 | 132 | 104 |
| Darksiders III (2018) | 159 | 100 | 96 | 91 | 91 | 68 |
| Just Cause 4 (2018) | 227 | 195 | 153 | 148 | 111 | 67 |
| Apex Legends (2019) | 144 | 144 | 144 | 144 | 144 | 109 |
| Far Cry New Dawn (2019) | 128 | 110 | 106 | 96 | 92 | 73 |
| Metro Exodus (2019) | 143.9 | 122.9 | 104.4 | 89.7 | 71.9 | 47.5 |
| Anthem (2019) | 127 | 121 | 120 | 113 | 105 | 65 |
| Dirt Rally 2.0 (2019) | 302 | 212 | 200 | 139 | 112 | 70 |
| The Division 2 (2019) | 208 | 172 | 124 | 123 | 92 | 53 |
| Anno 1800 (2019) | 100 | 100 | 77 | 43.3 | 41.8 | 37.6 |
| Rage 2 (2019) | 212 | 181 | 164 | 159 | 110 | 55.7 |
| F1 2019 (2019) | 238 | 217 | 178 | 164 | 147 | 95 |
| Control (2019) | 239 | 163 | 126 | 84 | 42.6 | |
| Borderlands 3 (2019) | 147.8 | 131.1 | 116.5 | 101.3 | 78 | 43.6 |
| FIFA 20 (2019) | 269 | 269 | 255 | 253 | 247 | 249 |
Compute Performance
The compute performance often depends on the CPU. The Intel Core i9-9900K in combination with the RTX 2080 Ti is the better choice, which is why our review model from KFA2 is beaten in productivity benchmarks. The GeForce RTX 2080 Ti is not able to keep up with the Nvidia Titan RTX. Those who really need to use compute-intensive applications should take a look at the professional Quadro GPUs. Such cards offer significantly more performance due to better-optimized drivers.
| SiSoft Sandra 2016 | |
| Image Processing | |
| AMD Radeon VII | |
| Corsair One i160 | |
| KFA2 GeForce RTX 2080 Ti EX | |
| Nvidia GeForce RTX 2080 Super | |
| MSI RTX 2080 Gaming X Trio | |
| Nvidia GeForce RTX 2070 Super | |
| MSI RTX 2070 Gaming Z 8G | |
| Nvidia GeForce RTX 2060 Super | |
| AMD Radeon RX 5700 XT | |
| MSI RTX 2060 Gaming Z 6G | |
| AMD Radeon RX 5700 | |
| GP Cryptography (Higher Security AES256+SHA2-512) | |
| KFA2 GeForce RTX 2080 Ti EX | |
| Corsair One i160 | |
| MSI RTX 2080 Gaming X Trio | |
| AMD Radeon VII | |
| Nvidia GeForce RTX 2080 Super | |
| Nvidia GeForce RTX 2070 Super | |
| MSI RTX 2070 Gaming Z 8G | |
| Nvidia GeForce RTX 2060 Super | |
| MSI RTX 2060 Gaming Z 6G | |
| GP Financial Analysis (FP High/Double Precision) | |
| AMD Radeon VII | |
| Corsair One i160 | |
| KFA2 GeForce RTX 2080 Ti EX | |
| MSI RTX 2080 Gaming X Trio | |
| Nvidia GeForce RTX 2080 Super | |
| Nvidia GeForce RTX 2070 Super | |
| MSI RTX 2070 Gaming Z 8G | |
| Nvidia GeForce RTX 2060 Super | |
| MSI RTX 2060 Gaming Z 6G | |
| AMD Radeon RX 5700 XT | |
| AMD Radeon RX 5700 | |
Emissions of the KFA2 GeForce RTX 2080 Ti EX
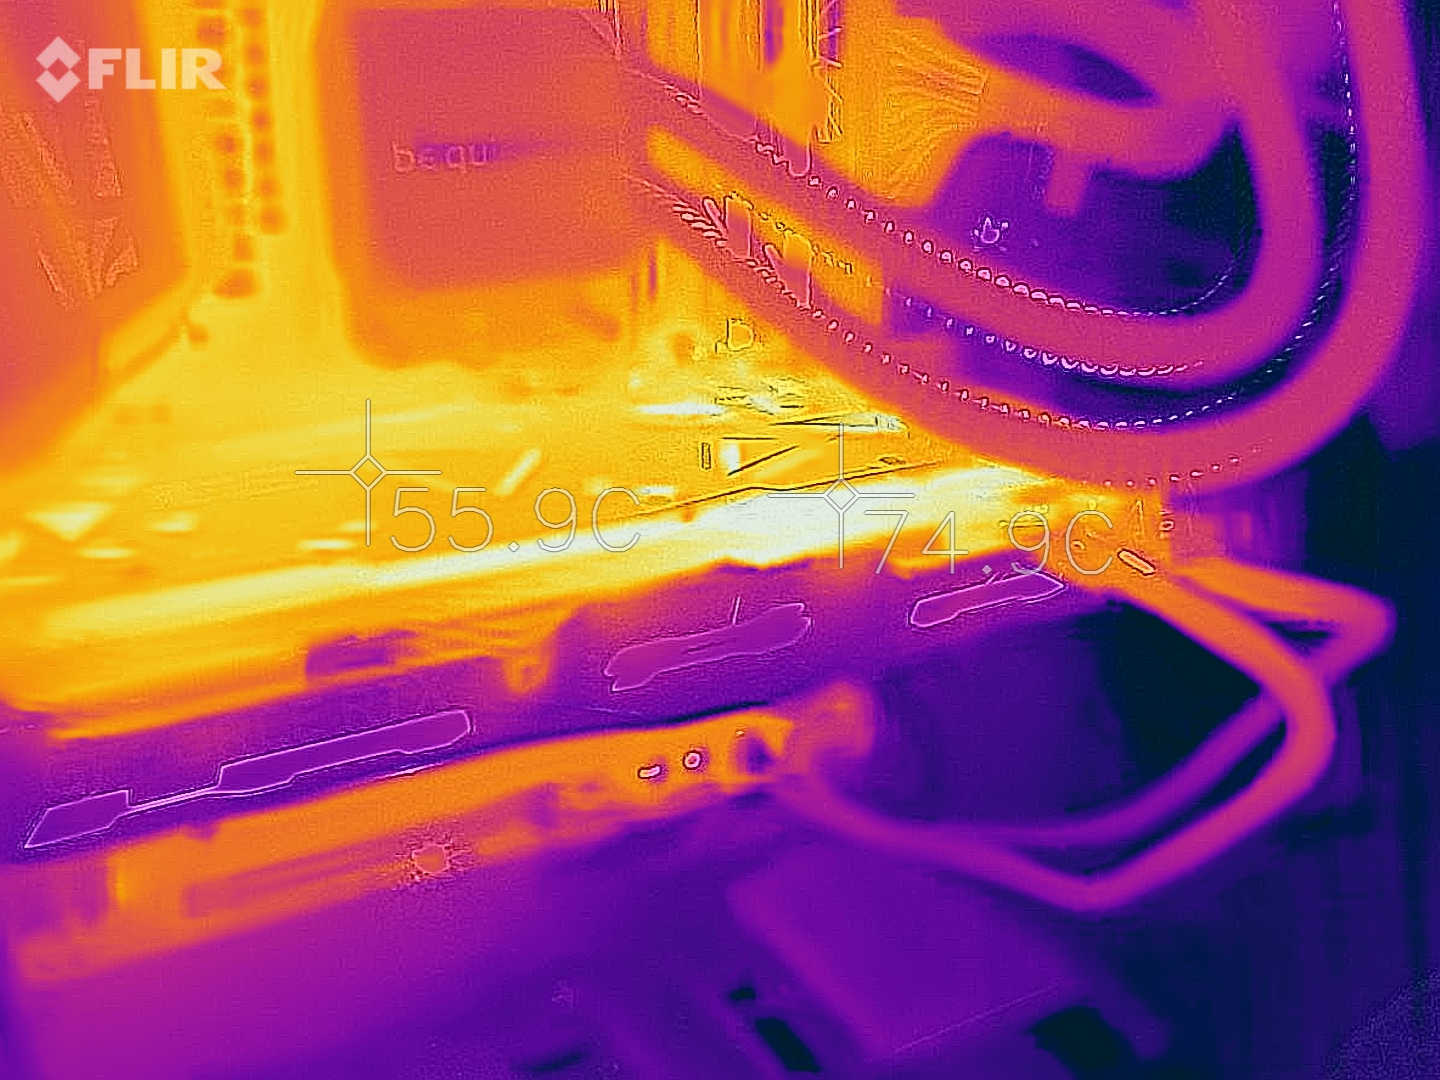
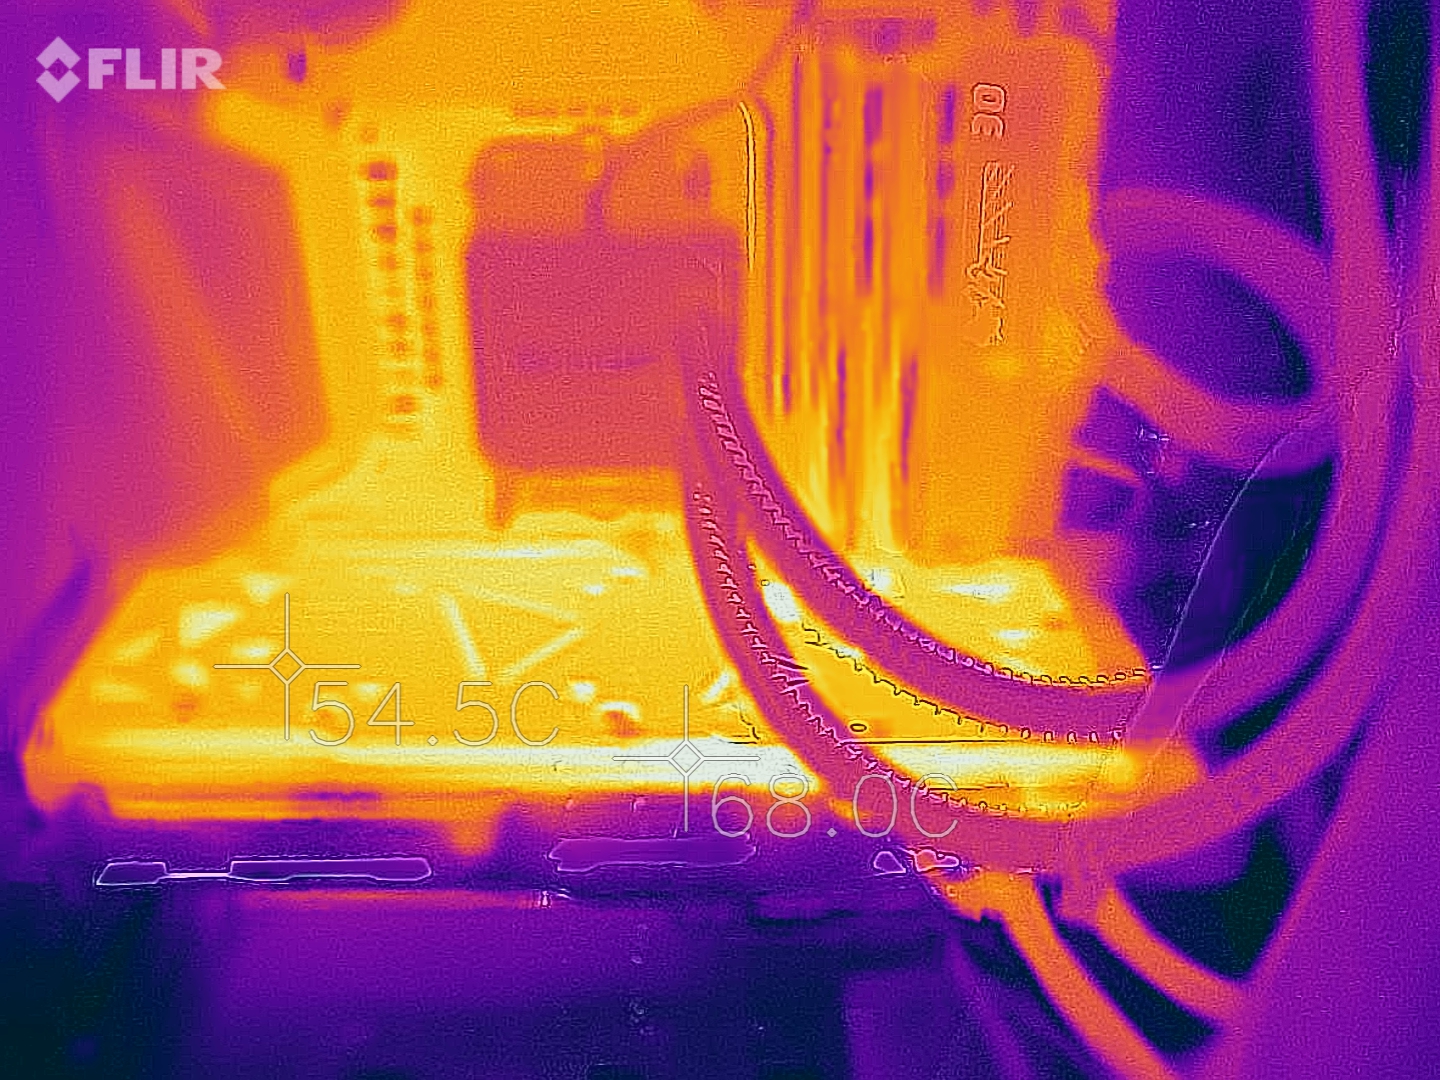
The GeForce RTX 2080 Ti EX from KFA2 has the exact same specifications as the reference model. The only differentiating factor is the cooling solution. Unlike the reference model, KFA2’s RTX 2080 Ti comes with three axial cooling fans. The two fans at the front of the GPU are always active. However, they spin at 1200 RPM (or 34%) in 2D operation, which is why they are very quiet. The rear fan only kicks in when the GPU is taxed.
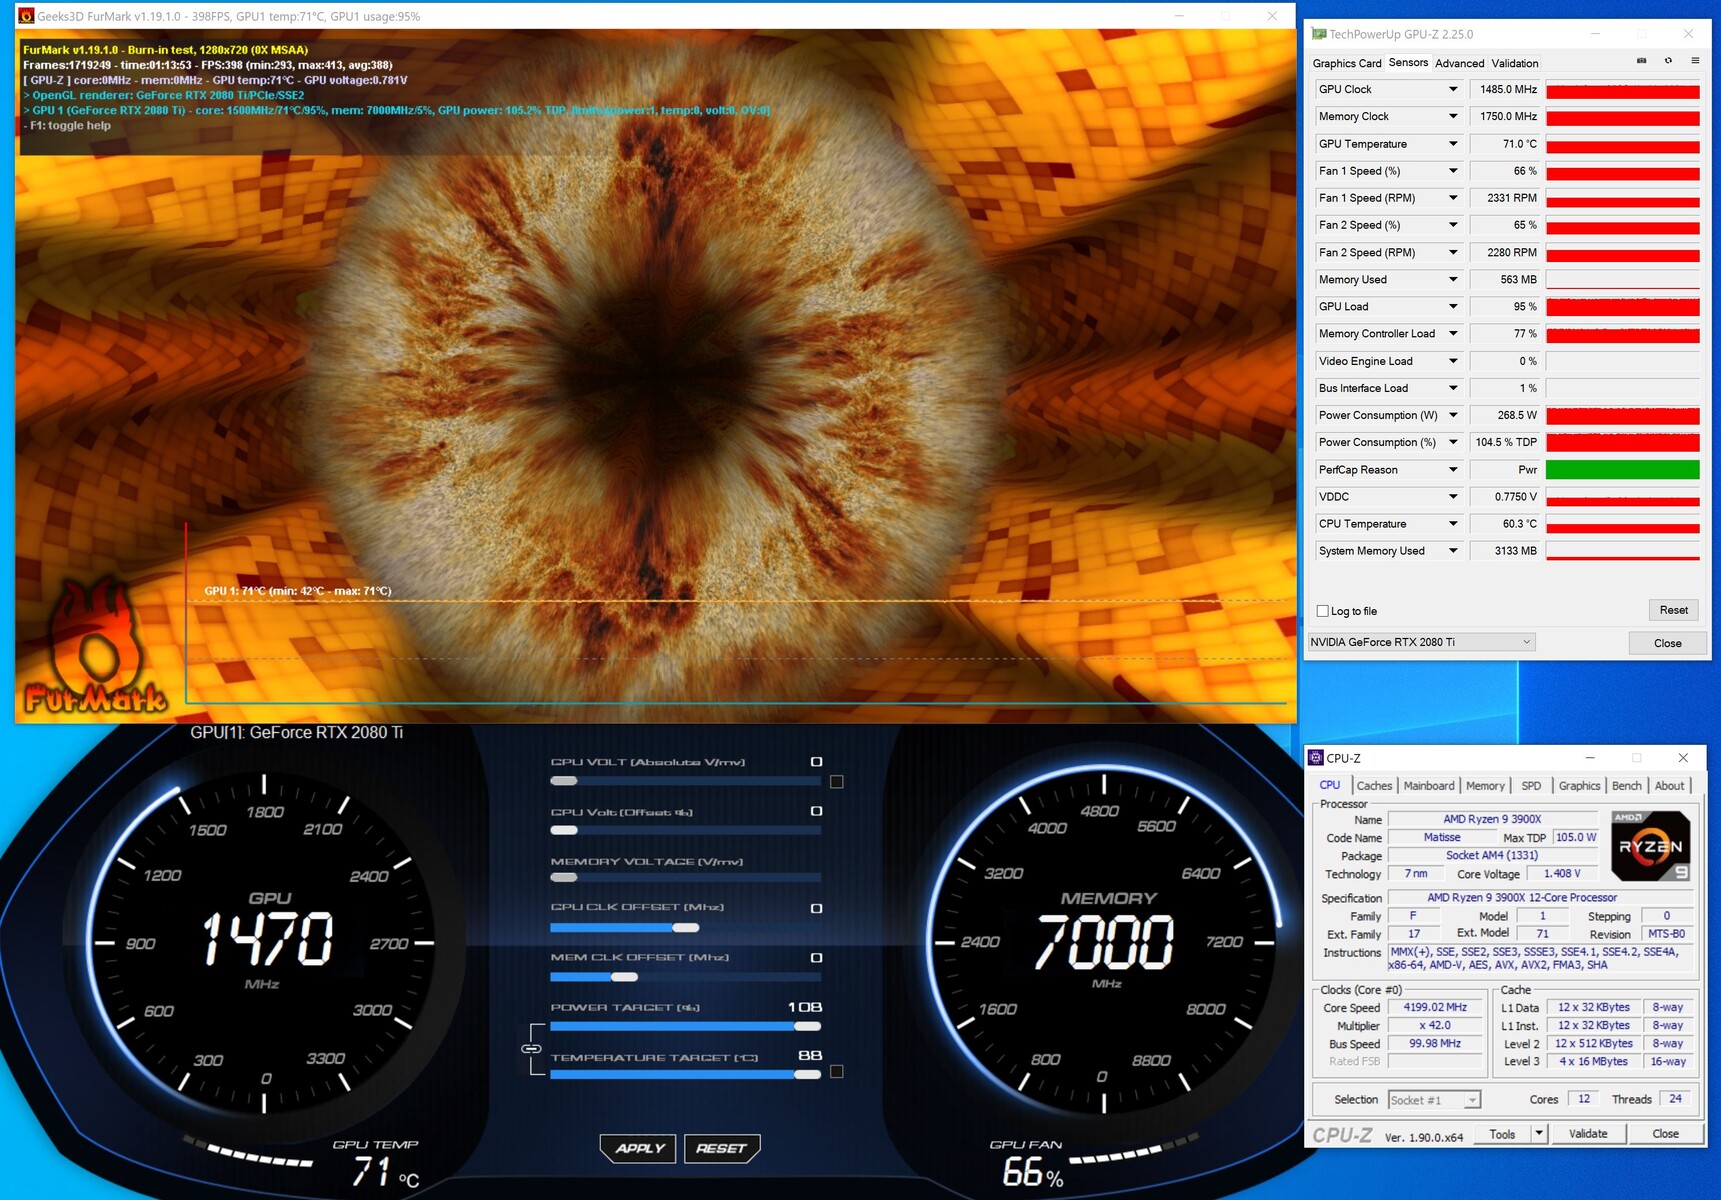
The KFA2 GPU has a TDP of 250 watts. This is 10 watts lower than the TDP of the Founders Edition graphics card, which needs 260 watts of energy. The power target of our model can be raised by 8%, which leads to a TDP of 270 watts.
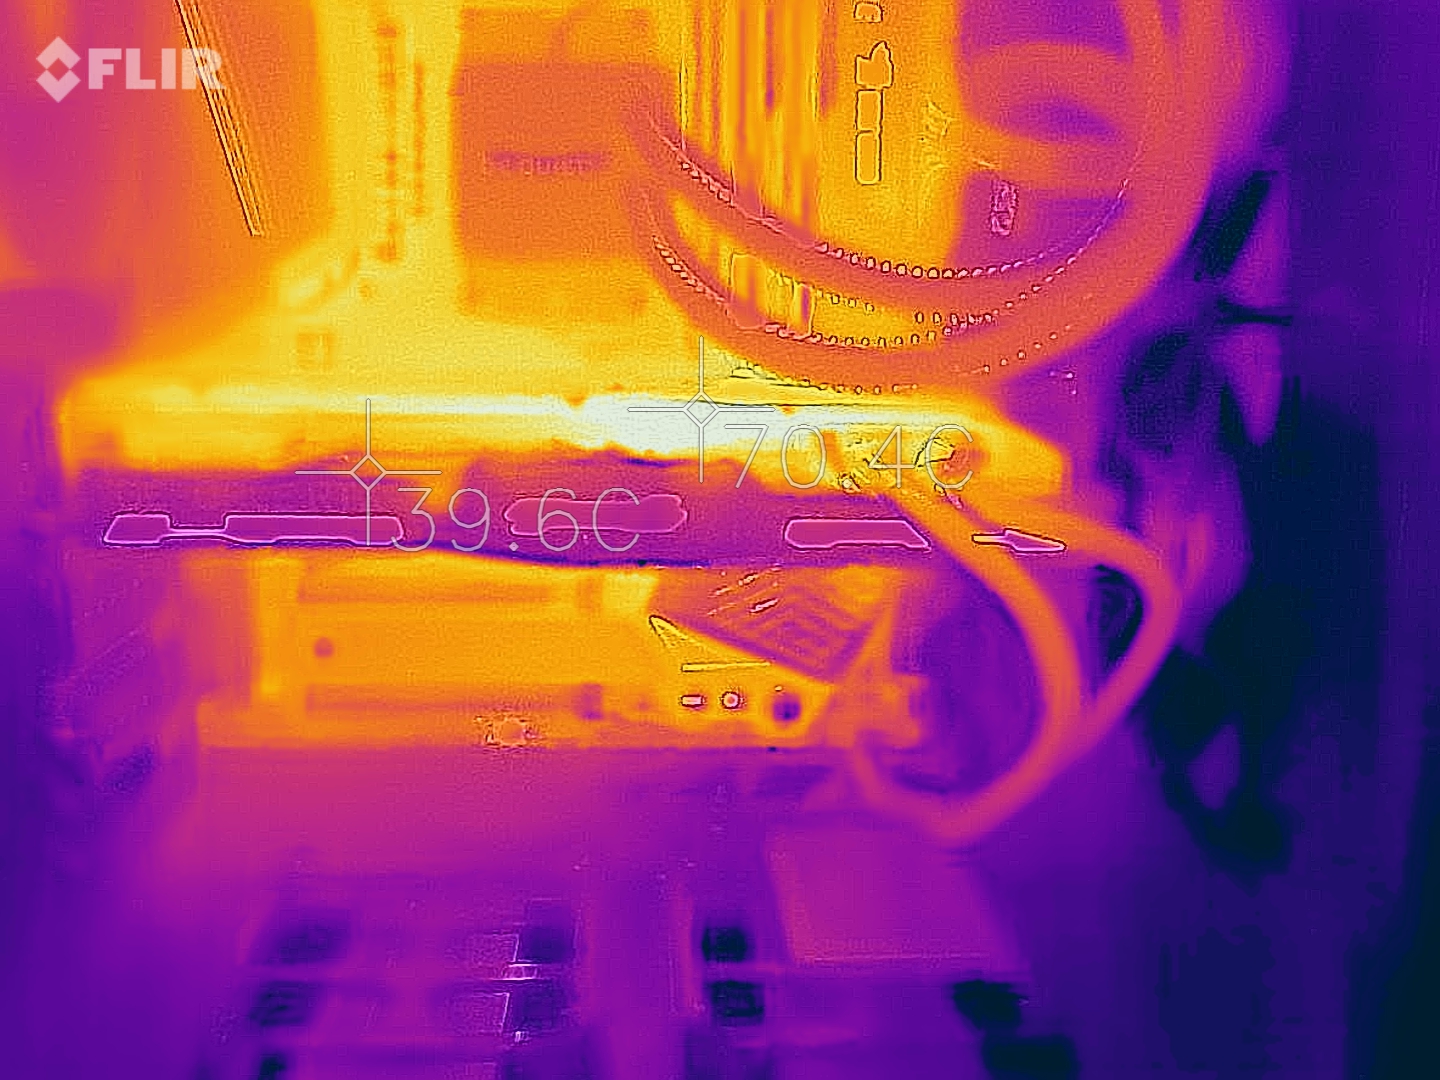
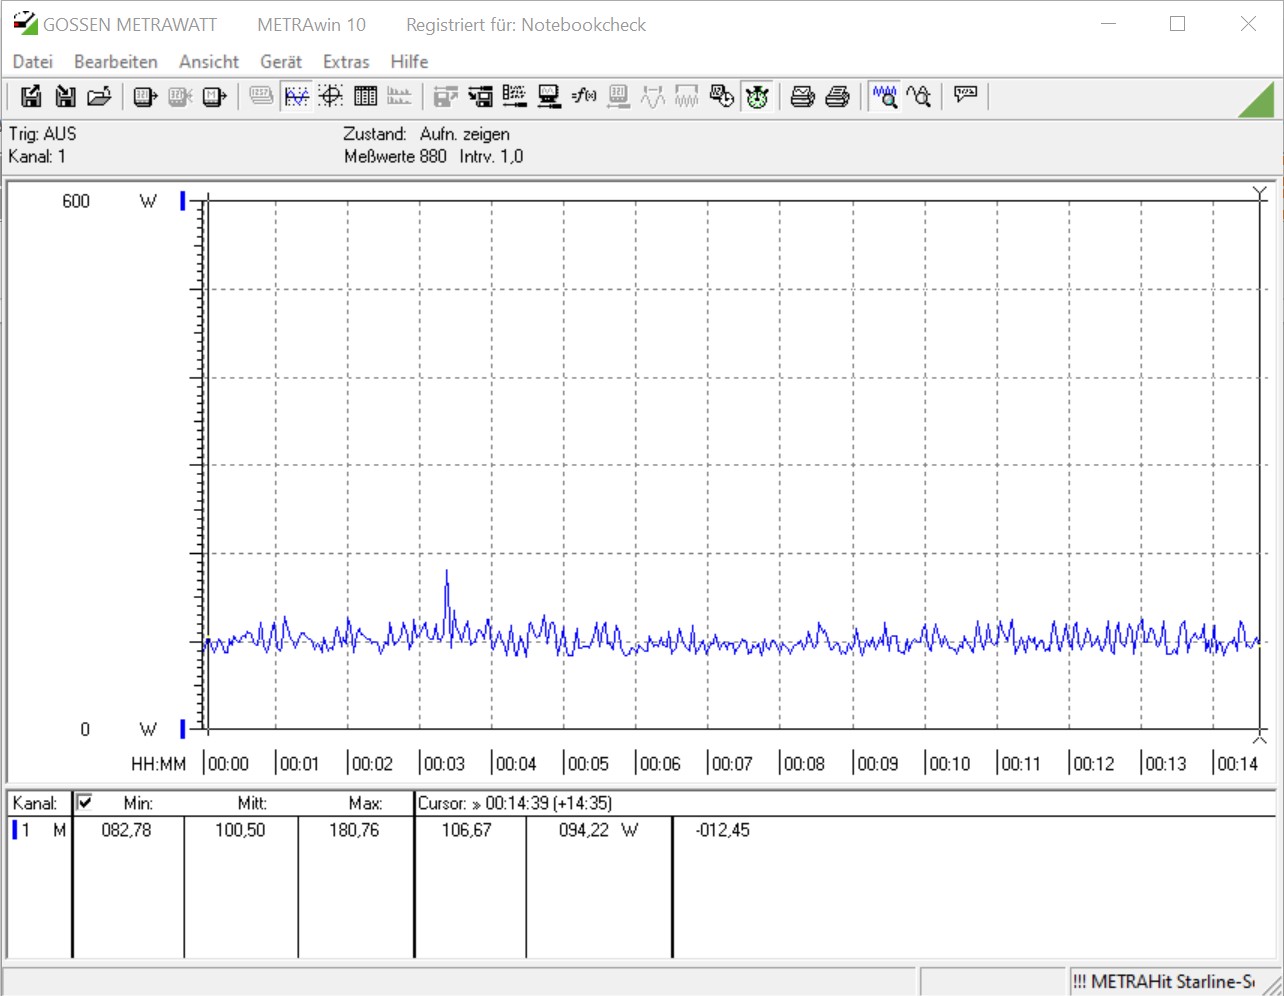
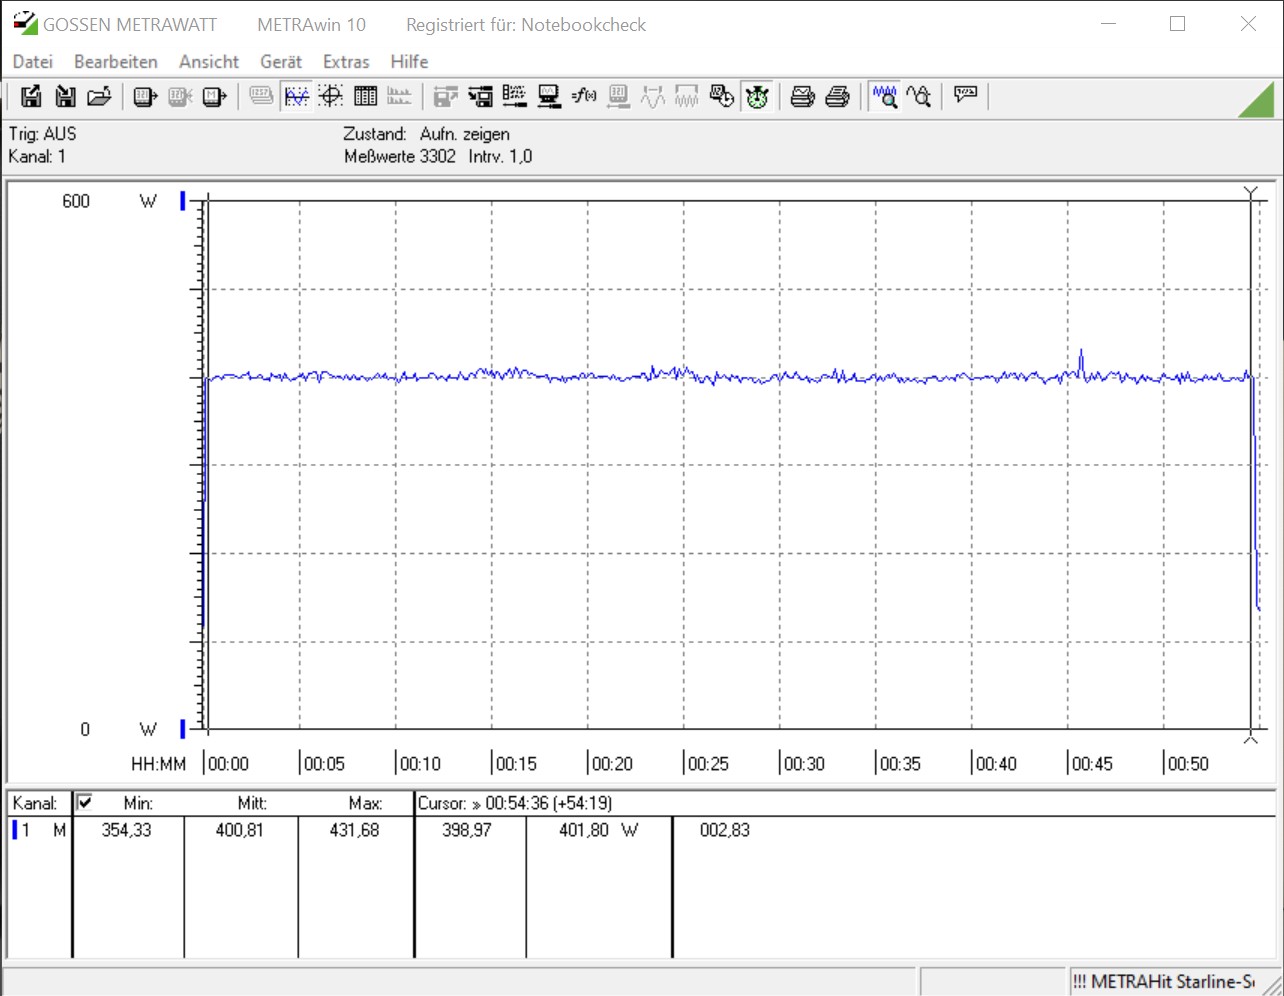
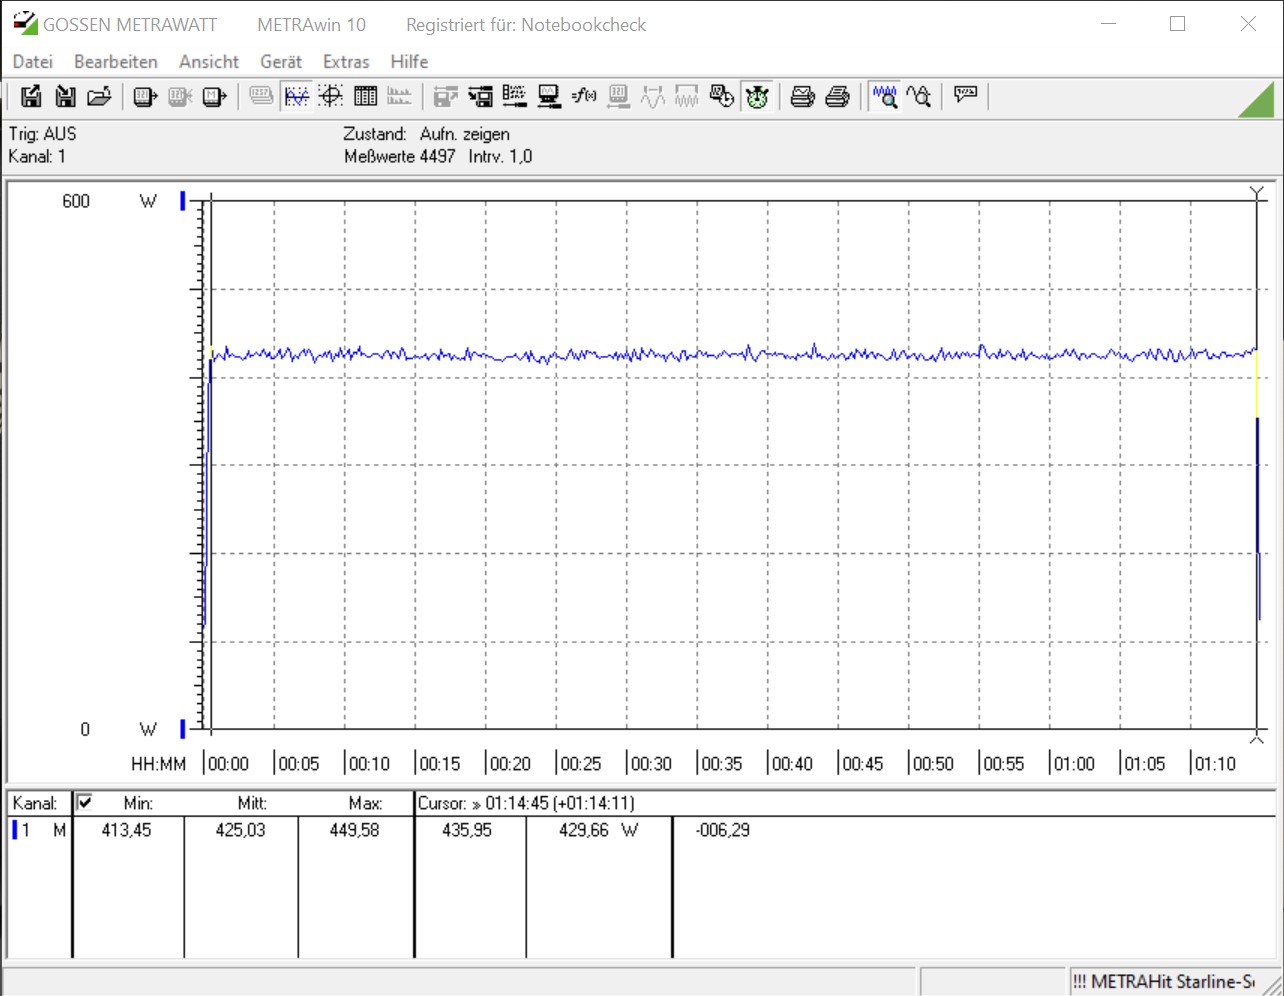
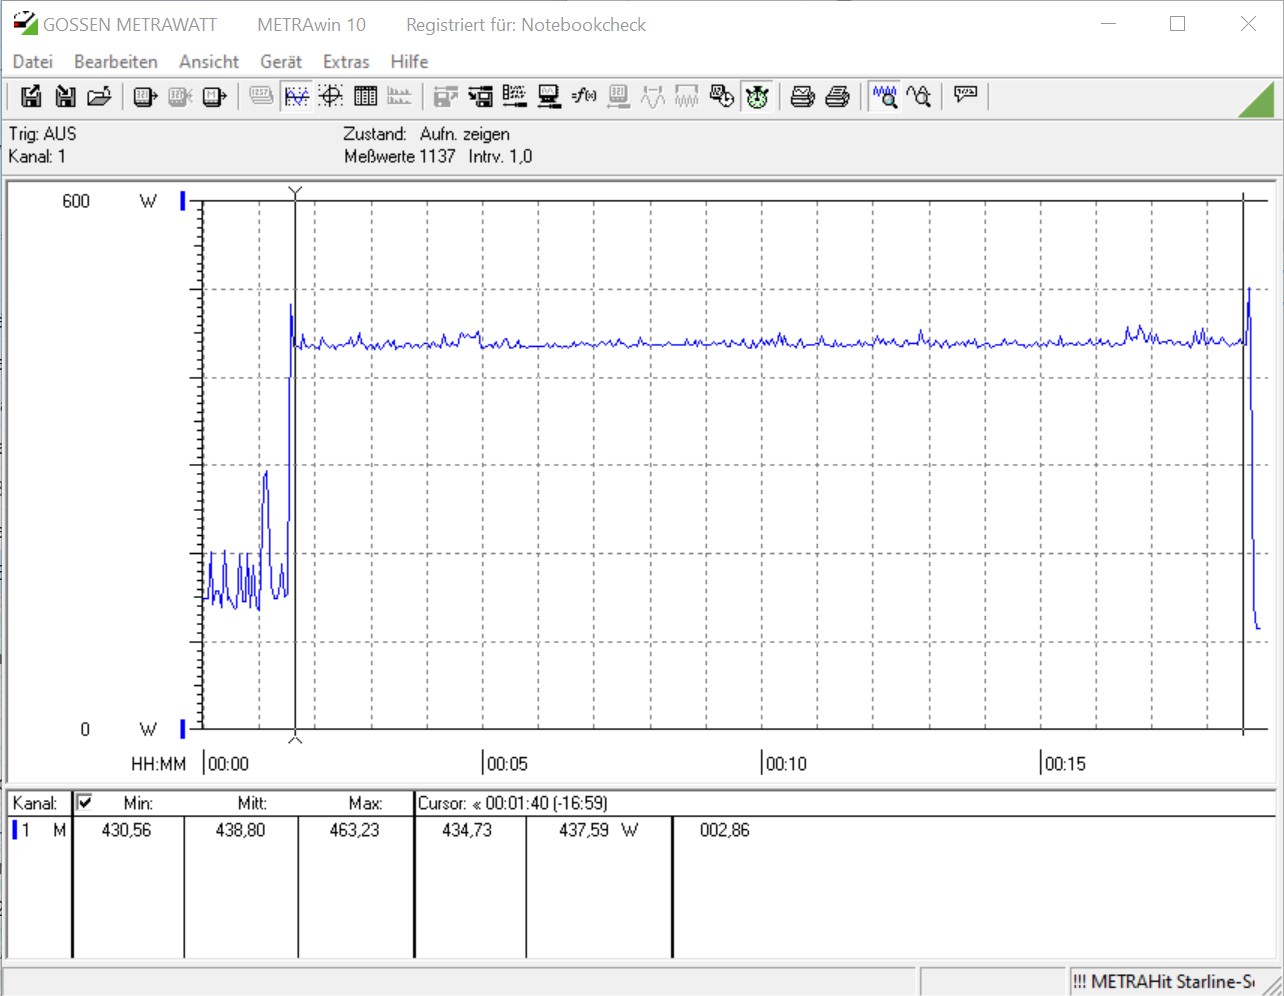
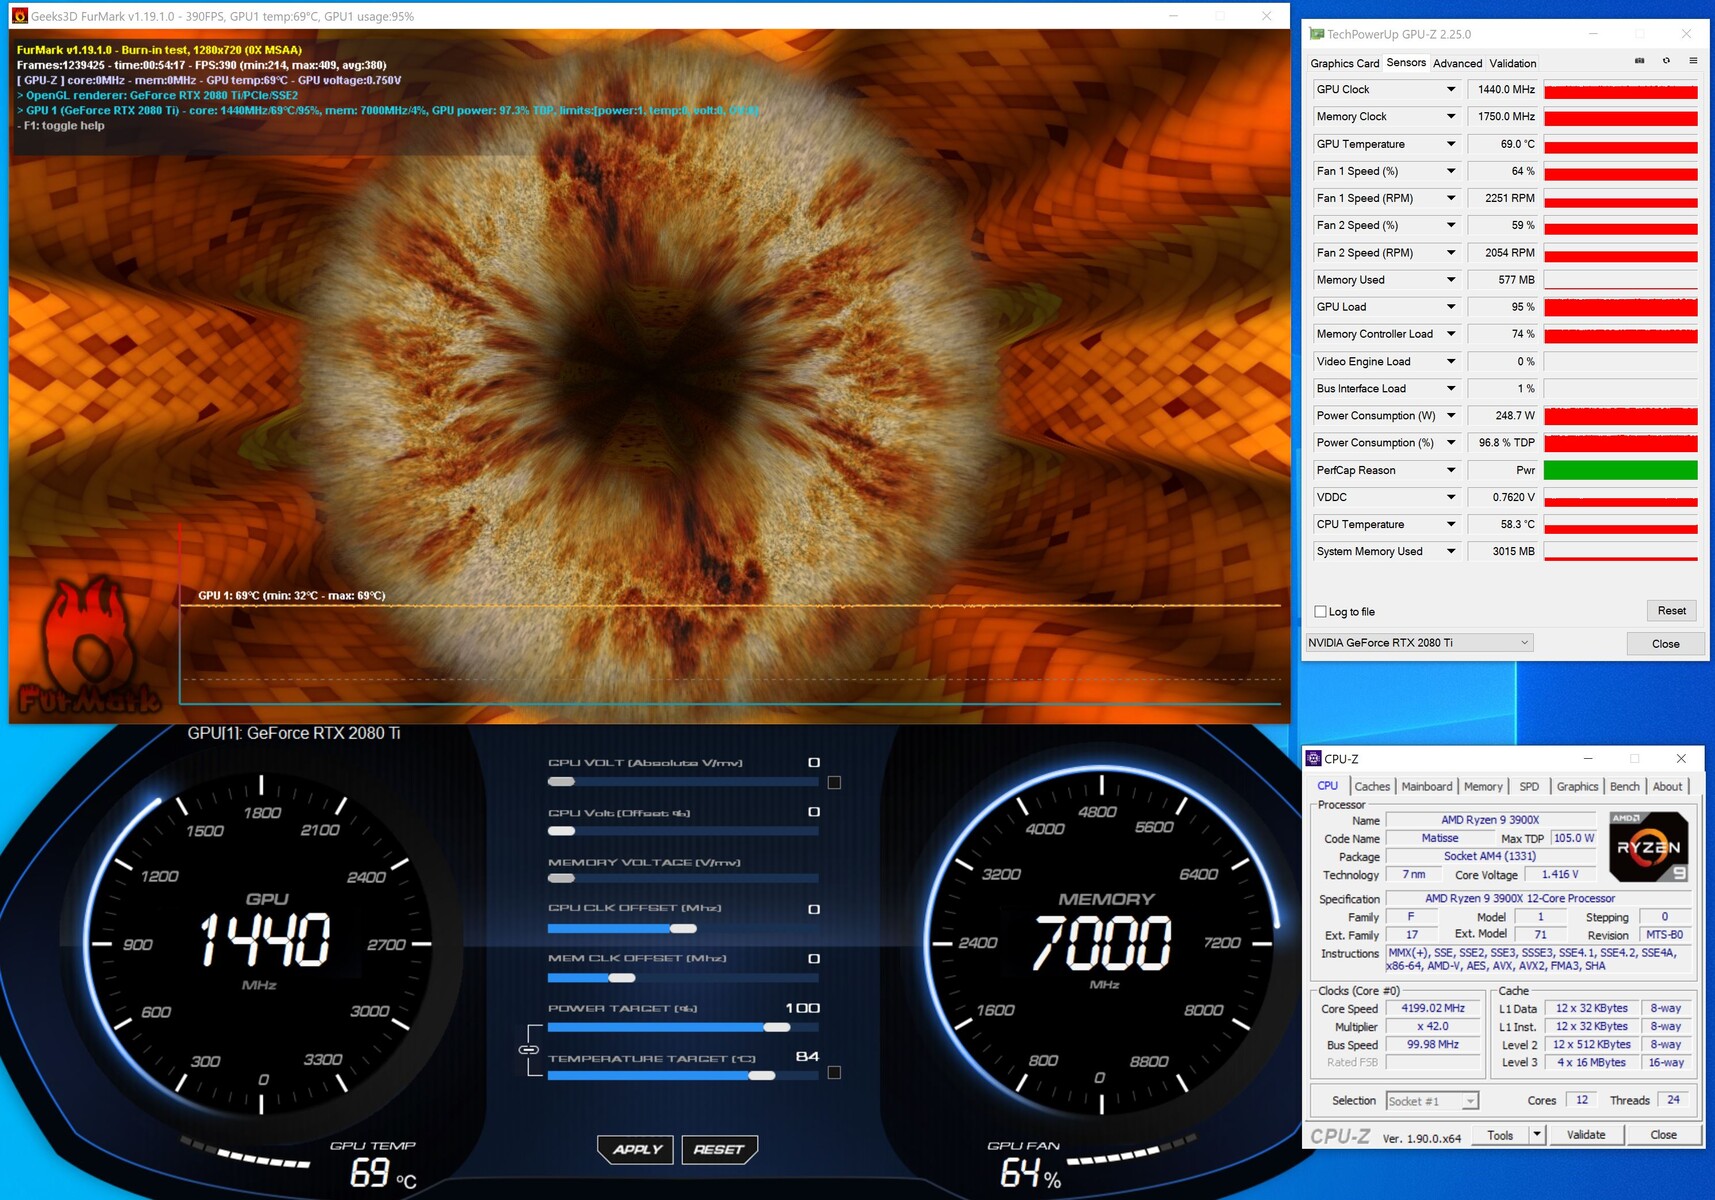
When idle, the system power consumption amounts to 100.5 watts. Under heavy load, the system energy consumption (without the monitor) peaked at about 401 watts. These figures are further confirmed by GPU-Z, which puts the power draw of the graphics card at about 250 watts. With the increased power target, the GPU consumes up to 268.5 watts. There are no thermal issues with the KFA2 GPU. Under load, the temperatures reach up to 69 °C (156.2 °F). With the power target set to 108%, the temperatures are only 2 °C (3.6 °F) higher.
All benchmarks were conducted with the case closed in order to simulate a realistic usage scenario.
| Power Consumption | |
| 1920x1080 The Witcher 3 ultra (external Monitor) | |
| KFA2 GeForce RTX 2080 Ti EX (Idle: 100.5 W) | |
| Nvidia Titan RTX | |
| Nvidia GeForce RTX 2080 Super (Idle: 86.2 W) | |
| AMD Radeon RX Vega 64 (Idle: 81.56 W) | |
| Nvidia GeForce RTX 2070 Super (Idle: 92.6 W) | |
| AMD Radeon RX 5700 XT (Idle: 83.2 W) | |
| Corsair One i160 (Idle: 51.5 W) | |
| KFA2 GeForce RTX 2060 Super (81.7 fps, Idle: 93.8 W) | |
| Nvidia GeForce RTX 2060 Super (Idle: 86.7 W) | |
| AMD Radeon RX 5700 (Idle: 77.9 W) | |
| 1280x720 FurMark 1.19 GPU Stress Test (external Monitor) | |
| Nvidia GeForce RTX 2080 Super (Idle: 86.2 W) | |
| KFA2 GeForce RTX 2080 Ti EX (Idle: 100.5 W) | |
| Nvidia GeForce RTX 2070 Super (Idle: 92.6 W) | |
| AMD Radeon RX 5700 XT (Idle: 83.2 W) | |
| Corsair One i160 (Idle: 51.5 W) | |
| KFA2 GeForce RTX 2060 Super (234 fps, Idle: 93.8 W) | |
| Nvidia GeForce RTX 2060 Super (Idle: 86.7 W) | |
| AMD Radeon RX 5700 (Idle: 77.9 W) | |
* ... smaller is better
Overclocking - RTX 2080 Ti with overclocking potential
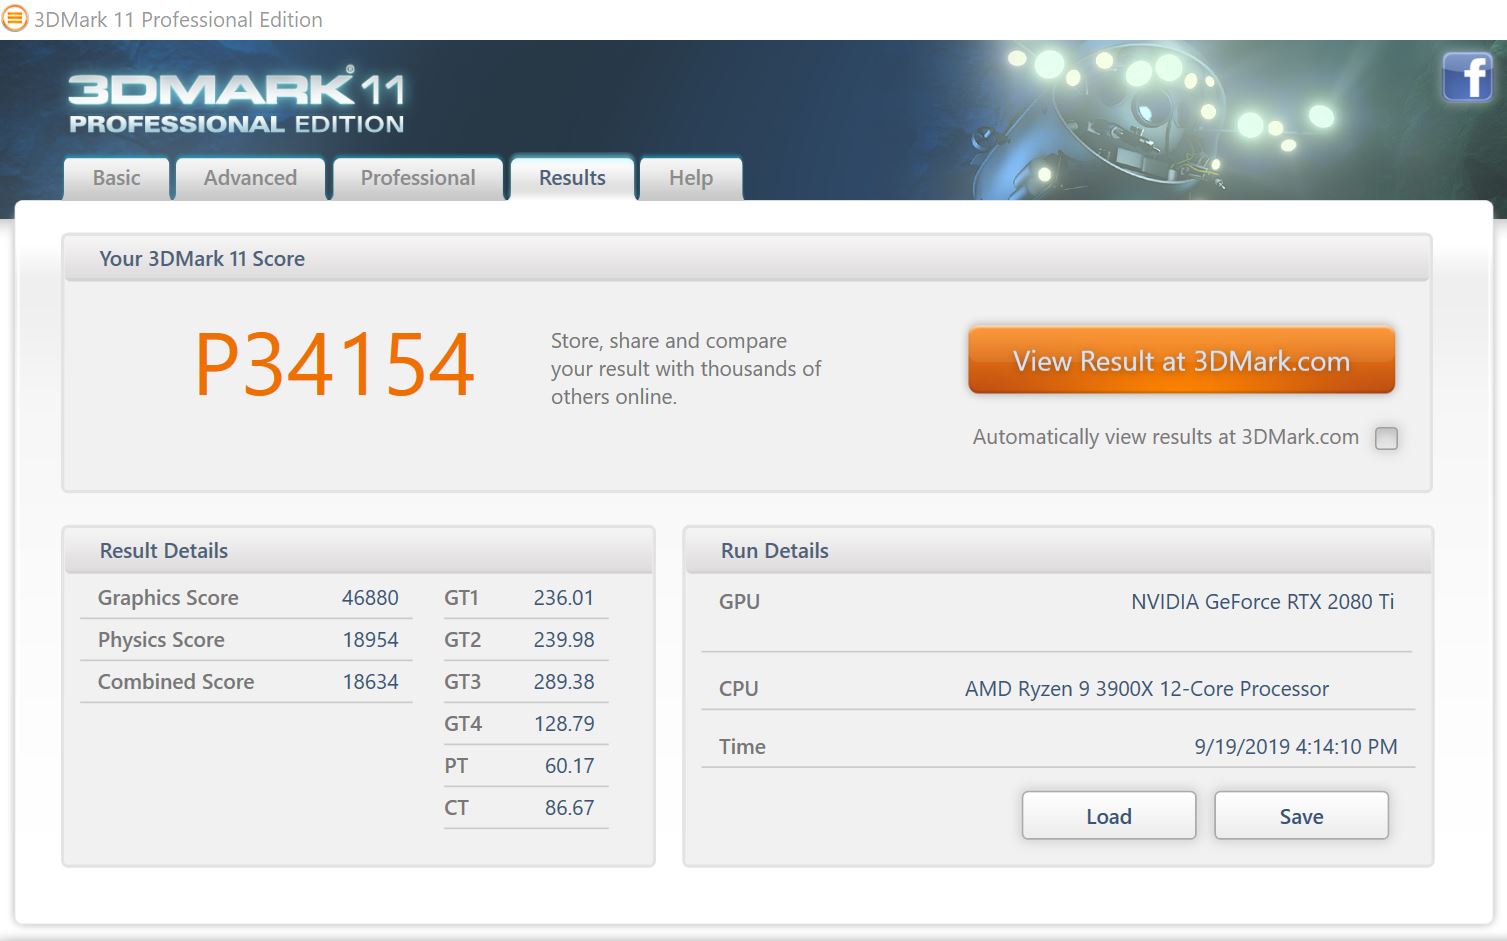
Even though the KFA2 GeForce RTX 2080 Ti EX cut a very fine figure in our review in terms of performance, we still decided to explore its overclocking potential. The KFA2 GPU comes with the 1-click OC feature, which raises the base clock by 45 MHz and the power target to 108%. This leads to a higher and more stable boost clock. With the 1-click OC feature activated, the GPU performs 4% better in 3DMark 11.
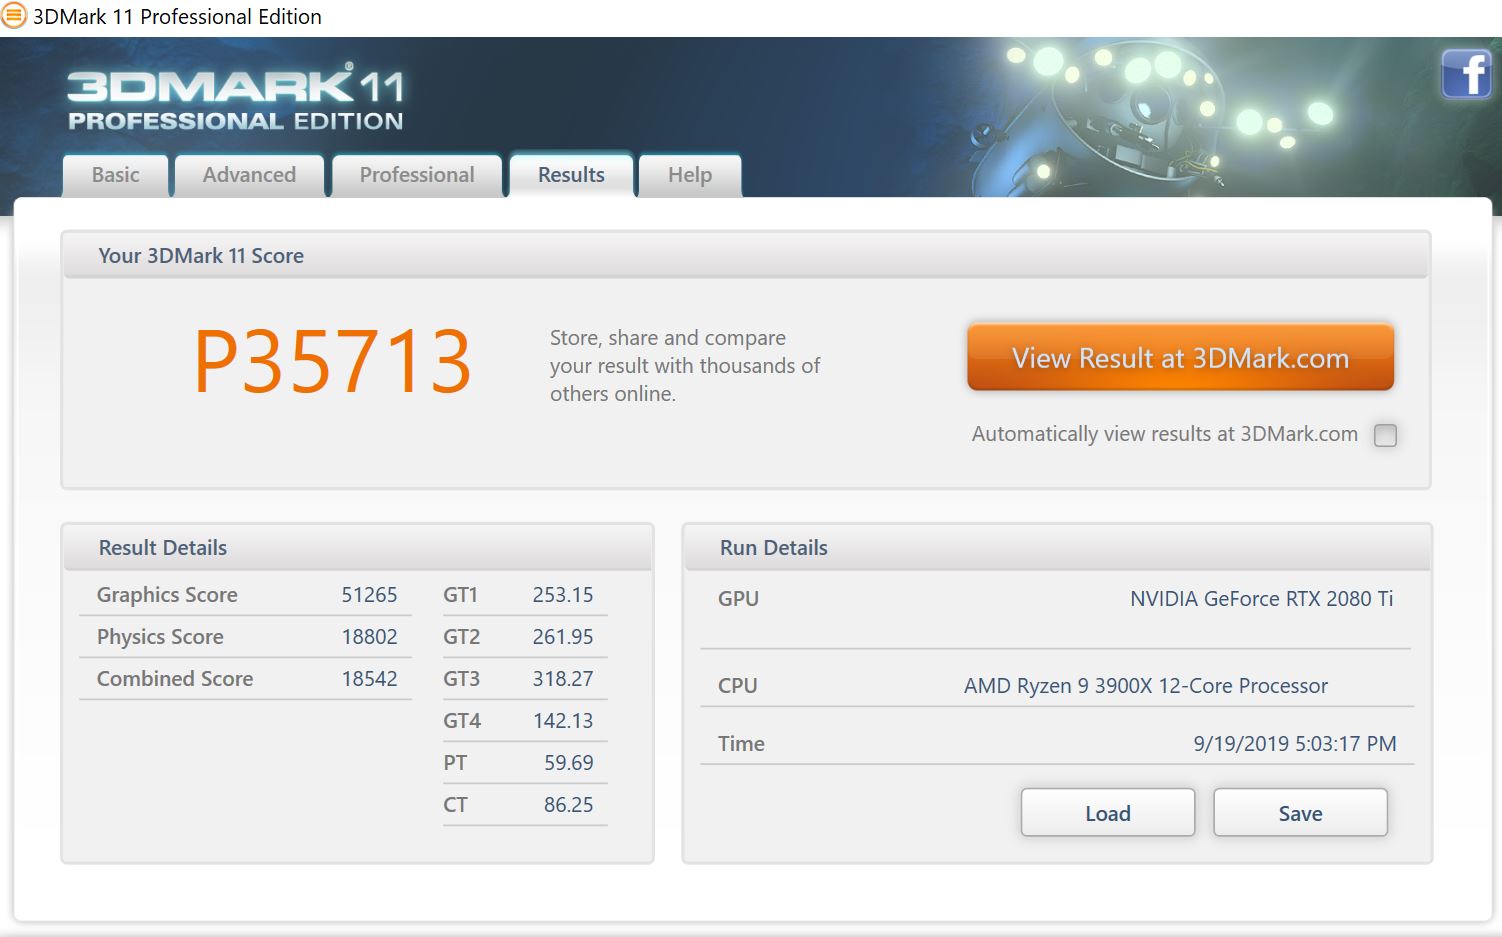
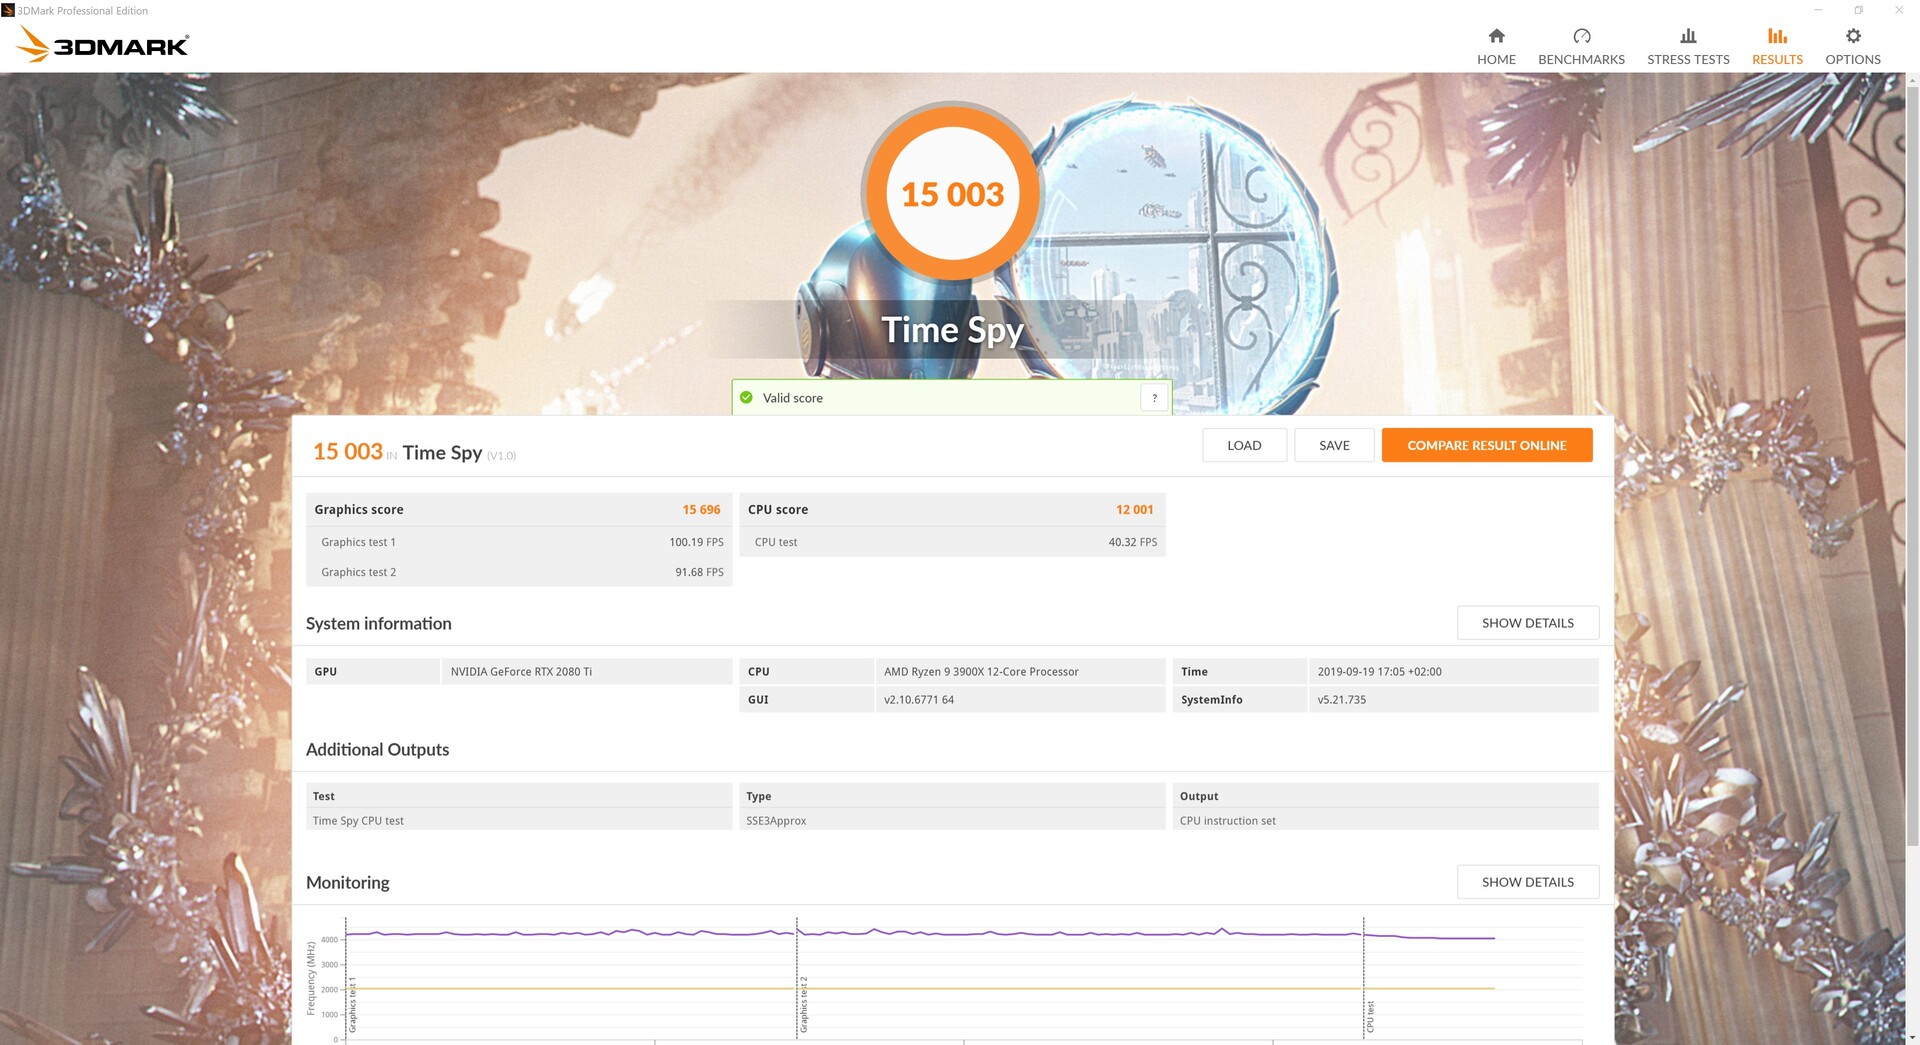
However, this was not enough for us. Through manual overclocking we were able to raise the core clock by 250 MHz and the memory speed by 1250 MHz. The results speak for themselves. The GPU performs 13% better in 3D applications after the manual overclock. In the DirectX 12-based Time Spy benchmark, we are actually seeing a 14% increase in performance.
Of course, the graphics card is fast enough as is, which is why there is no real need for overclocking. However, the overclocking potential will certainly come in handy as the GPU ages. Actually, whether the GPU draws 250 or 270 watts under load does not make much of a difference in the grand scheme of things.
Those who decide to water-cool the GPU will be able to squeeze a bit more performance out of it. However, in that case, you will have to give up RGB lighting
Pros
Cons
Verdict - An absolutely high-end model
Before we mention the price we would like to state that the KFA2 GeForce RTX 2080 Ti EX is a very powerful desktop graphics card. Because of the length, users will have to make sure that this monster fits in their particular case before committing to buy. Moreover, the GPU requires a 650-watt PSU and two 8-pin connectors.
In terms of performance, this graphics card is on the same level as other RTX 2080 Ti’s and is only beaten by the significantly more expensive Nvidia Titan RTX. Those who want to get this GPU should do so only if they plan to game at resolutions far above 1080p, because currently the GeForce RTX 2080 Ti comes into its own only at very high resolutions.
Paying more than 1000 Euros ($1097) for a graphics card is not easy to stomach, but if you really want to game at 4K, then you should give this GPU some serious consideration.
Nevertheless, the KFA2 GeForce RTX 2080 Ti EX will not be flying off the shelves, because a four-figure price tag looks mighty scary on a GPU. However, the KFA2 model is somewhat cheaper than the reference model, which retails for 1259 Euros ($1381). Moreover, the KFA2 GPU also offers a bigger cooler and RGB lighting. The KFA2 graphics card is one of the cheapest versions of the RTX 2080 Ti.
All in all, the GeForce RTX 2080 Ti offers enough performance to be able to run any modern title at 2160p. The RTX 2080 Ti might be interesting to those who upgrade their GPU every couple of years, because it will still be quite capable even in two years’ time, especially at 1080p or 1440p and with Raytracing disabled.
The GeForce RTX 2080 Ti also scores some major points with its RTX features. However, some titles such as Control already require a very powerful GPU to be playable with Raytracing enabled. Here, the KFA2 GeForce RTX 2080 Ti EX achieves an average frame rate of 72 FPS at 1080p, whereas the GeForce RTX 2080 Super only manages to achieve 53 FPS on average.
Benchmarks of all GeForce RTX 2080 Ti GPUs
Benchmarks
3DM Vant. Perf. total +
specvp12 sw-03 +
Cinebench R15 OpenGL 64 Bit +
* Smaller numbers mean a higher performance
Game Benchmarks
The following benchmarks stem from our benchmarks of review laptops. The performance depends on the used graphics memory, clock rate, processor, system settings, drivers, and operating systems. So the results don't have to be representative for all laptops with this GPU. For detailed information on the benchmark results, click on the fps number.

F1 2021
2021
Days Gone
2021


Outriders
2021
Hitman 3
2021
Cyberpunk 2077 1.0
2020

Yakuza Like a Dragon
2020


Dirt 5
2020
Watch Dogs Legion
2020
FIFA 21
2020
Star Wars Squadrons
2020

Serious Sam 4
2020
Crysis Remastered
2020

Horizon Zero Dawn
2020
Death Stranding
2020
F1 2020
2020
Valorant
2020
Gears Tactics
2020
Doom Eternal
2020
Hunt Showdown
2020
Escape from Tarkov
2020


Need for Speed Heat
2019

GRID 2019
2019

FIFA 20
2019
Borderlands 3
2019
Control
2019
F1 2019
2019

Rage 2
2019
Anno 1800
2019
The Division 2
2019
Dirt Rally 2.0
2019
Anthem
2019
Far Cry New Dawn
2019
Metro Exodus
2019
Apex Legends
2019
Just Cause 4
2018
Darksiders III
2018
Battlefield V
2018
Farming Simulator 19
2018
Hitman 2
2018


Forza Horizon 4
2018
FIFA 19
2018

F1 2018
2018
Monster Hunter World
2018
The Crew 2
2018
Far Cry 5
2018

X-Plane 11.11
2018


Fortnite
2018


Call of Duty WWII
2017

Destiny 2
2017
ELEX
2017

Dirt 4
2017Rocket League
2017Prey
2017For Honor
2017
Resident Evil 7
2017Watch Dogs 2
2016
Dishonored 2
2016
Battlefield 1
2016
Overwatch
2016
Doom
2016

The Division
2016
Far Cry Primal
2016

Rainbow Six Siege
2015
World of Warships
2015Dota 2 Reborn
2015
The Witcher 3
2015
GTA V
2015
Battlefield 4
2013BioShock Infinite
2013Counter-Strike: GO
2012| low | med. | high | ultra | QHD | 4K | |
|---|---|---|---|---|---|---|
| F1 2021 | 254 | 237 | 147 | 119 | 68 | |
| Days Gone | 163 | 158 | 135 | 105 | 63.9 | |
| Mass Effect Legendary Edition | 132 | 126 | 125 | 115 | ||
| Resident Evil Village | 183 | 181 | 181 | 147 | 74.3 | |
| Outriders | 135 | 135 | 132 | 114 | 61.8 | |
| Hitman 3 | 171 | 164 | 162 | 147 | 85.2 | |
| Cyberpunk 2077 1.0 | 114 | 107 | 95.4 | 64 | 32.2 | |
| Immortals Fenyx Rising | 113 | 102 | 93 | 81 | 59 | |
| Yakuza Like a Dragon | 161 | 156 | 139 | 100 | 53.8 | |
| Call of Duty Black Ops Cold War | 155 | 133 | 118 | 89.2 | 54.4 | |
| Assassin´s Creed Valhalla | 107 | 91 | 80 | 67 | 46 | |
| Dirt 5 | 134 | 112 | 73.4 | 64.8 | 50 | |
| Watch Dogs Legion | 111 | 98.7 | 89.6 | 72.9 | 44 | |
| FIFA 21 | 269 | 266 | 255 | 254 | 251 | 247 |
| Star Wars Squadrons | 360 | 354 | 331 | 326 | 246 | 144 |
| Mafia Definitive Edition | 131 | 120 | 117 | 105 | 62.4 | |
| Serious Sam 4 | 185 | 123 | 117 | 108 | 107 | 86.3 |
| Crysis Remastered | 179 | 106 | 71.3 | 57.9 | 37.6 | |
| Flight Simulator 2020 | 84.4 | 70.8 | 58.6 | 47.3 | 46.5 | 32.7 |
| Horizon Zero Dawn | 159 | 146 | 133 | 115 | 94 | 54 |
| Death Stranding | 174 | 173 | 170 | 169 | 133 | 78.8 |
| F1 2020 | 289 | 247 | 240 | 202 | 162 | 100 |
| Valorant | 290 | 285 | 267 | 266 | 259 | |
| Gears Tactics | 321 | 243 | 166 | 126 | 101 | 64.7 |
| Doom Eternal | 315 | 290 | 266 | 259 | 204 | 113 |
| Hunt Showdown | 235 | 200 | 170 | 125 | 60.4 | |
| Escape from Tarkov | 121 | 121 | 121 | 121 | 120 | 73.4 |
| Red Dead Redemption 2 | 127 | 119 | 103 | 76 | 63 | 42.3 |
| Star Wars Jedi Fallen Order | 106 | 106 | 104 | 105 | 73 | |
| Need for Speed Heat | 93 | 91 | 67 | |||
| Call of Duty Modern Warfare 2019 | 162 | 127 | 77 | |||
| GRID 2019 | 141 | 118 | 77 | |||
| Ghost Recon Breakpoint | 103 | 82 | 52 | |||
| FIFA 20 | 269 | 269 | 255 | 253 | 247 | 249 |
| Borderlands 3 | 155 | 137 | 122 | 105 | 81 | 45 |
| Control | 240 | 166 | 129 | 87 | 44 | |
| F1 2019 | 269 | 243 | 192 | 171 | 145 | 96 |
| Total War: Three Kingdoms | 96.3 | 81.1 | 43.8 | |||
| Rage 2 | 287 | 195 | 171 | 166 | 114 | 58 |
| Anno 1800 | 108 | 106 | 81 | 45 | 43 | 40 |
| The Division 2 | 211 | 180 | 144 | 127 | 96 | 55 |
| Dirt Rally 2.0 | 304 | 228 | 220 | 166 | 133 | 83 |
| Anthem | 117 | 120 | 118 | 112 | 106 | 69 |
| Far Cry New Dawn | 133 | 114 | 110 | 100 | 98 | 76 |
| Metro Exodus | 154 | 131 | 109 | 94 | 75 | 50 |
| Apex Legends | 144 | 144 | 144 | 144 | 144 | 111 |
| Just Cause 4 | 232 | 197 | 156 | 149 | 112 | 66 |
| Darksiders III | 208 | 135 | 127 | 121 | 112 | 71 |
| Battlefield V | 189 | 170 | 164 | 159 | 134 | 86 |
| Farming Simulator 19 | 245 | 184 | 159 | 146 | 146 | 107 |
| Hitman 2 | 88 | 85 | 77 | 74 | 74 | 62 |
| Call of Duty Black Ops 4 | 285 | 244 | 235 | 213 | 166 | 87 |
| Assassin´s Creed Odyssey | 137 | 125 | 108 | 82 | 72 | 50 |
| Forza Horizon 4 | 212 | 184 | 182 | 163 | 143 | 105 |
| FIFA 19 | 361 | 346 | 321 | 317 | 313 | 300 |
| Shadow of the Tomb Raider | 158 | 144 | 143 | 136 | 110 | 61 |
| F1 2018 | 248 | 216 | 167 | 141 | 133 | 97 |
| Monster Hunter World | 188 | 182 | 179 | 145 | 102 | 49 |
| The Crew 2 | 60 | 60 | 60 | 60 | 60 | 60 |
| Far Cry 5 | 153 | 136 | 130 | 121 | 116 | 77 |
| World of Tanks enCore | 105 | |||||
| X-Plane 11.11 | 130 | 117 | 92 | 78 | ||
| Kingdom Come: Deliverance | 187 | 163 | 132 | 91 | 84 | 50 |
| Final Fantasy XV Benchmark | 198 | 162 | 121 | 57 | ||
| Fortnite | 381 | 302 | 232 | 216 | 151 | 79 |
| Star Wars Battlefront 2 | 198 | 190 | 179 | 138 | 76.9 | |
| Need for Speed Payback | 163 | 157 | 154 | 151 | 95.6 | |
| Call of Duty WWII | 313 | 308 | 224 | 203 | 172 | 113 |
| Assassin´s Creed Origins | 146 | 131 | 126 | 107 | 93 | 64 |
| Destiny 2 | 193 | 191 | 190 | 190 | 162 | 91 |
| ELEX | 121 | 121 | 121 | 116 | 62.3 | |
| Middle-earth: Shadow of War | 204 | 180 | 153 | 78 | ||
| Playerunknown's Battlegrounds (PUBG) | 221 | 201 | 193 | 191 | 88 | |
| Dirt 4 | 364 | 268 | 231 | 183 | 125 | |
| Rocket League | 250 | 250 | 249 | 209 | ||
| Prey | 144 | 144 | 144 | 123 | ||
| Ghost Recon Wildlands | 169 | 139 | 135 | 86 | 66 | |
| For Honor | 369 | 270 | 258 | 206 | 99 | |
| Resident Evil 7 | 599 | 382 | 316 | 117 | ||
| Watch Dogs 2 | 166 | 156 | 135 | 107 | 68 | |
| Dishonored 2 | 106 | 105 | 104 | 101 | 96 | |
| Battlefield 1 | 200 | 198 | 192 | 185 | 115 | |
| Deus Ex Mankind Divided | 177 | 165 | 143 | 103 | 69 | |
| Overwatch | 300 | 300 | 300 | 297 | 193 | |
| Doom | 191 | 176 | 164 | 162 | 138 | |
| Ashes of the Singularity | 89.4 | 83.4 | ||||
| The Division | 341 | 282 | 196 | 158 | 90 | |
| Far Cry Primal | 139 | 126 | 116 | 107 | 90 | |
| Rise of the Tomb Raider | 335 | 231 | 217 | 200 | 95 | |
| Rainbow Six Siege | 448 | 370 | 338 | 320 | 180 | |
| World of Warships | 168 | |||||
| Dota 2 Reborn | 154 | 145 | 146 | 140 | 137 | |
| The Witcher 3 | 399 | 342 | 247 | 134 | 98 | |
| GTA V | 180 | 174 | 165 | 103 | 142 | |
| Battlefield 4 | 200 | 200 | 200 | 200 | 152 | |
| BioShock Infinite | 419 | 384 | 355 | 246 | ||
| Counter-Strike: GO | 270 | |||||
| low | med. | high | ultra | QHD | 4K | < 30 fps < 60 fps < 120 fps ≥ 120 fps | 6 62 | 13 74 | 1 21 66 | 2 29 55 | 3 38 27 | 23 57 16 |
For more games that might be playable and a list of all games and graphics cards visit our Gaming List
