


KFA2 GeForce RTX 4060 Ti EX 16 GB desktop graphics card review: A powerful mid-range GPU now with more VRAM
With the GeForce RTX 4060 Ti, Nvidia has brought out a good and very efficient graphics card for the price-conscious buyer. The 8-GB model already did well but it couldn't suppress all the calls for more VRAM. In this review, you can read about whether the Nvidia GeForce RTX 4060 Ti with 16 GB VRAM is any better.
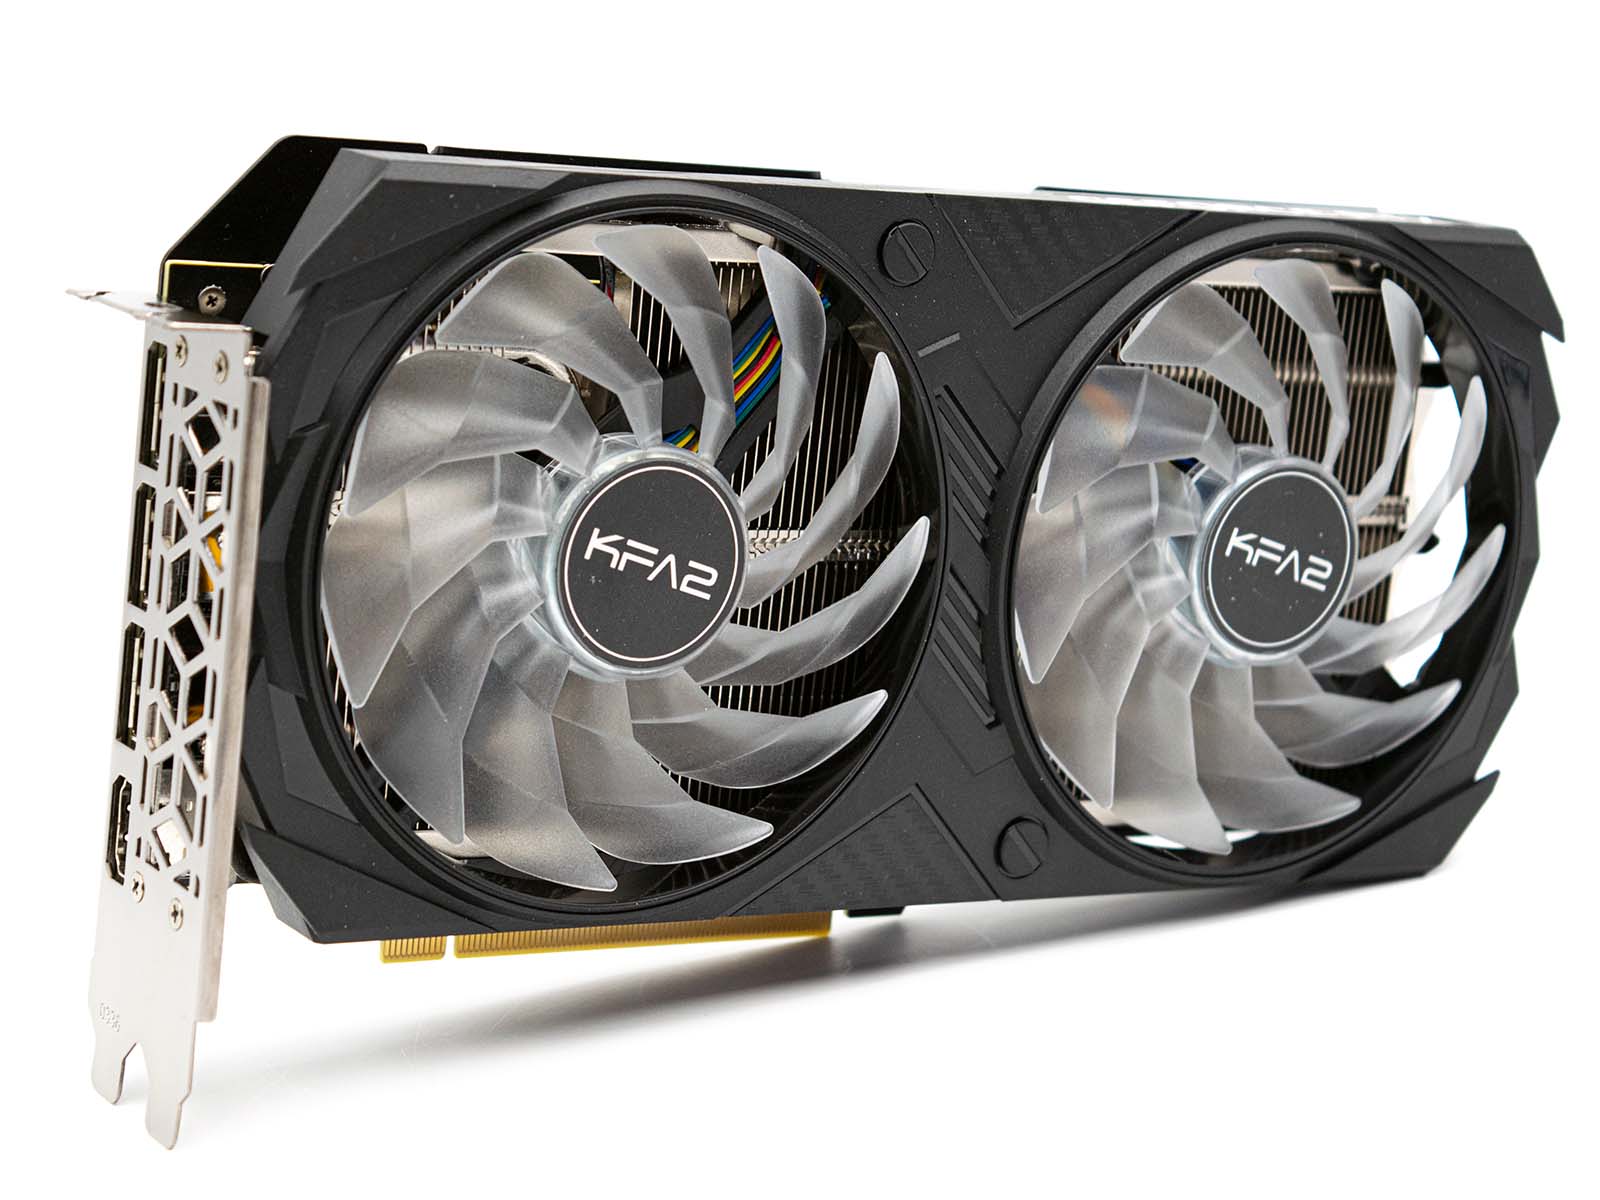
AMD Ryzen 9 7950X, NVIDIA GeForce RTX 4060 Ti 16G, 32", 685 g