Notebookcheck Logo

Star Wars Jedi Survivor review: Laptop and desktop benchmarks

Moderate condition for an otherwise good game. Publisher EA have not made it easy for themselves in the past years - as blunders in the form of Pay to Win in Fifa or Jedi Survivor's bad performance in combination with high hardware requirements have shown. Which graphics card do you need in order to have fluid lightsaber battles?
Jedi Survivor

Test laptops

XMG Neo 17 E23 (RTX 4090)
Schenker Key 17 Pro E23 (RTX 4080)
XMG Pro 15 E23 (RTX 4060)
XMG Focus 15 E23 (RTX 4050)
Asus ROG Zephyrus G14 (RX 6800S)

We currently use these laptops in our gaming benchmarks. Click on the photos to be directed to the corresponding manufacturer's website. All further test systems (tower PCs, mini PCs, ...) are listed at the end of the article.

Technology

After hearing about the many negative reviews the game was receiving at launch - which were especially concerning the game's performance - we decided to wait until the release of the first patch to measure our benchmarks. Although Jedi Survivor still runs less than ideally, it seems that the biggest issues have so far been resolved (as of 05/02/23).

While the game's system requirements are unusually high and it runs a little bumpy at times regardless of the hardware you are playing on, you can still enjoy a relatively good playing experience on more powerful GPUs.

Jedi Survivor
Jedi Survivor
Jedi Survivor
Jedi Survivor
Jedi Survivor
Jedi Survivor

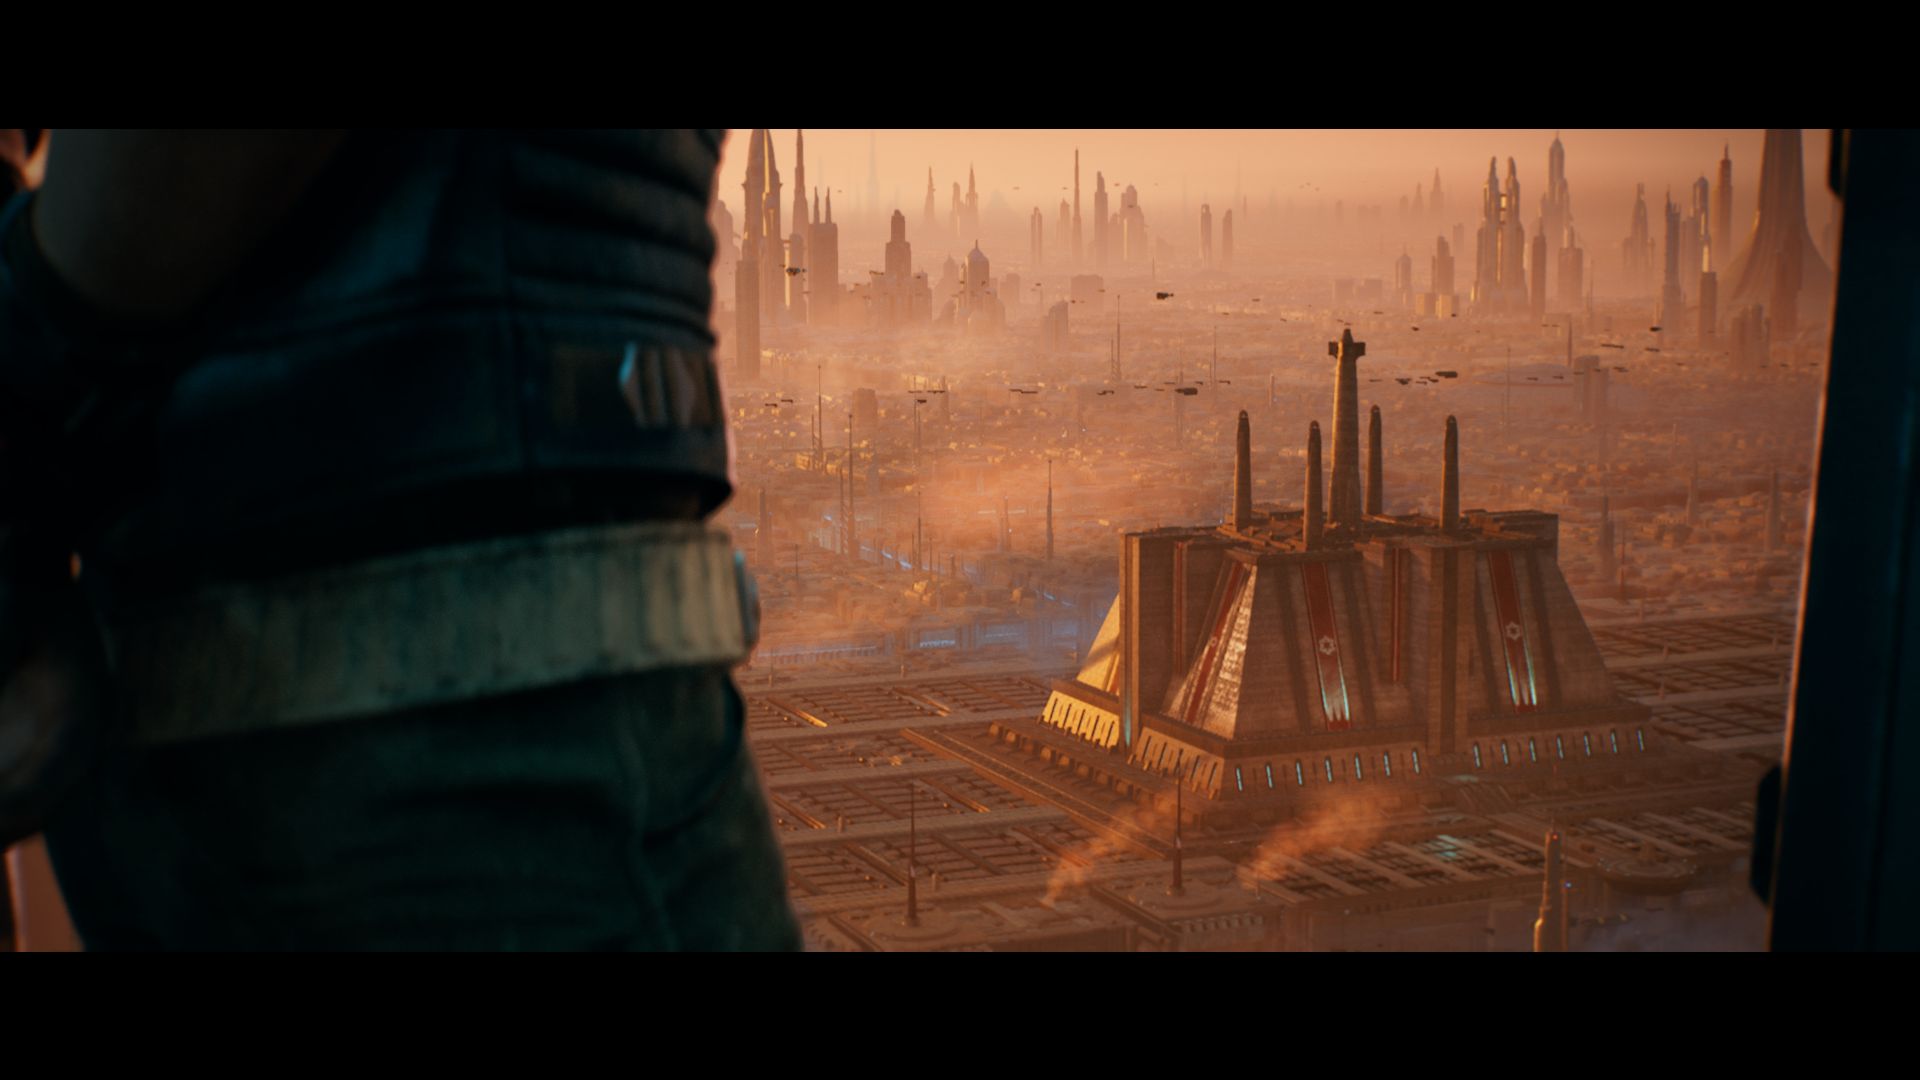
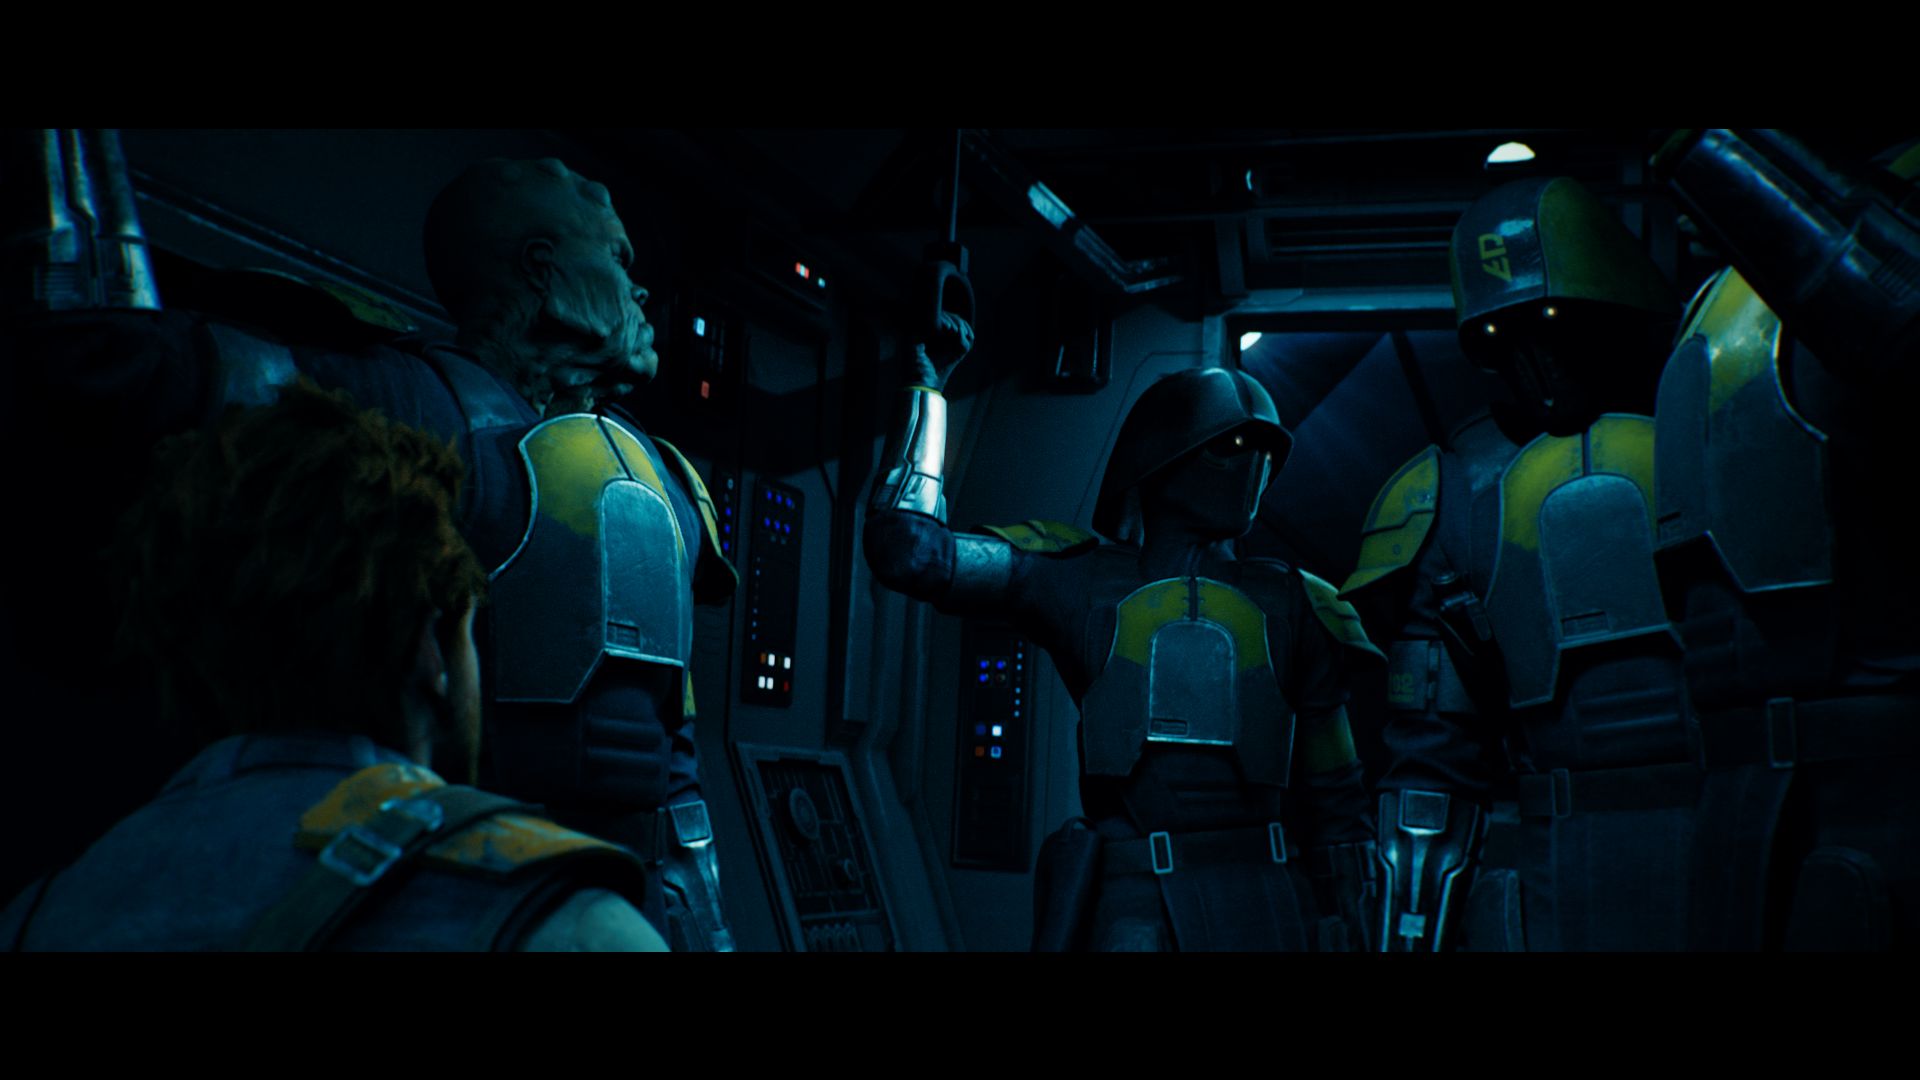
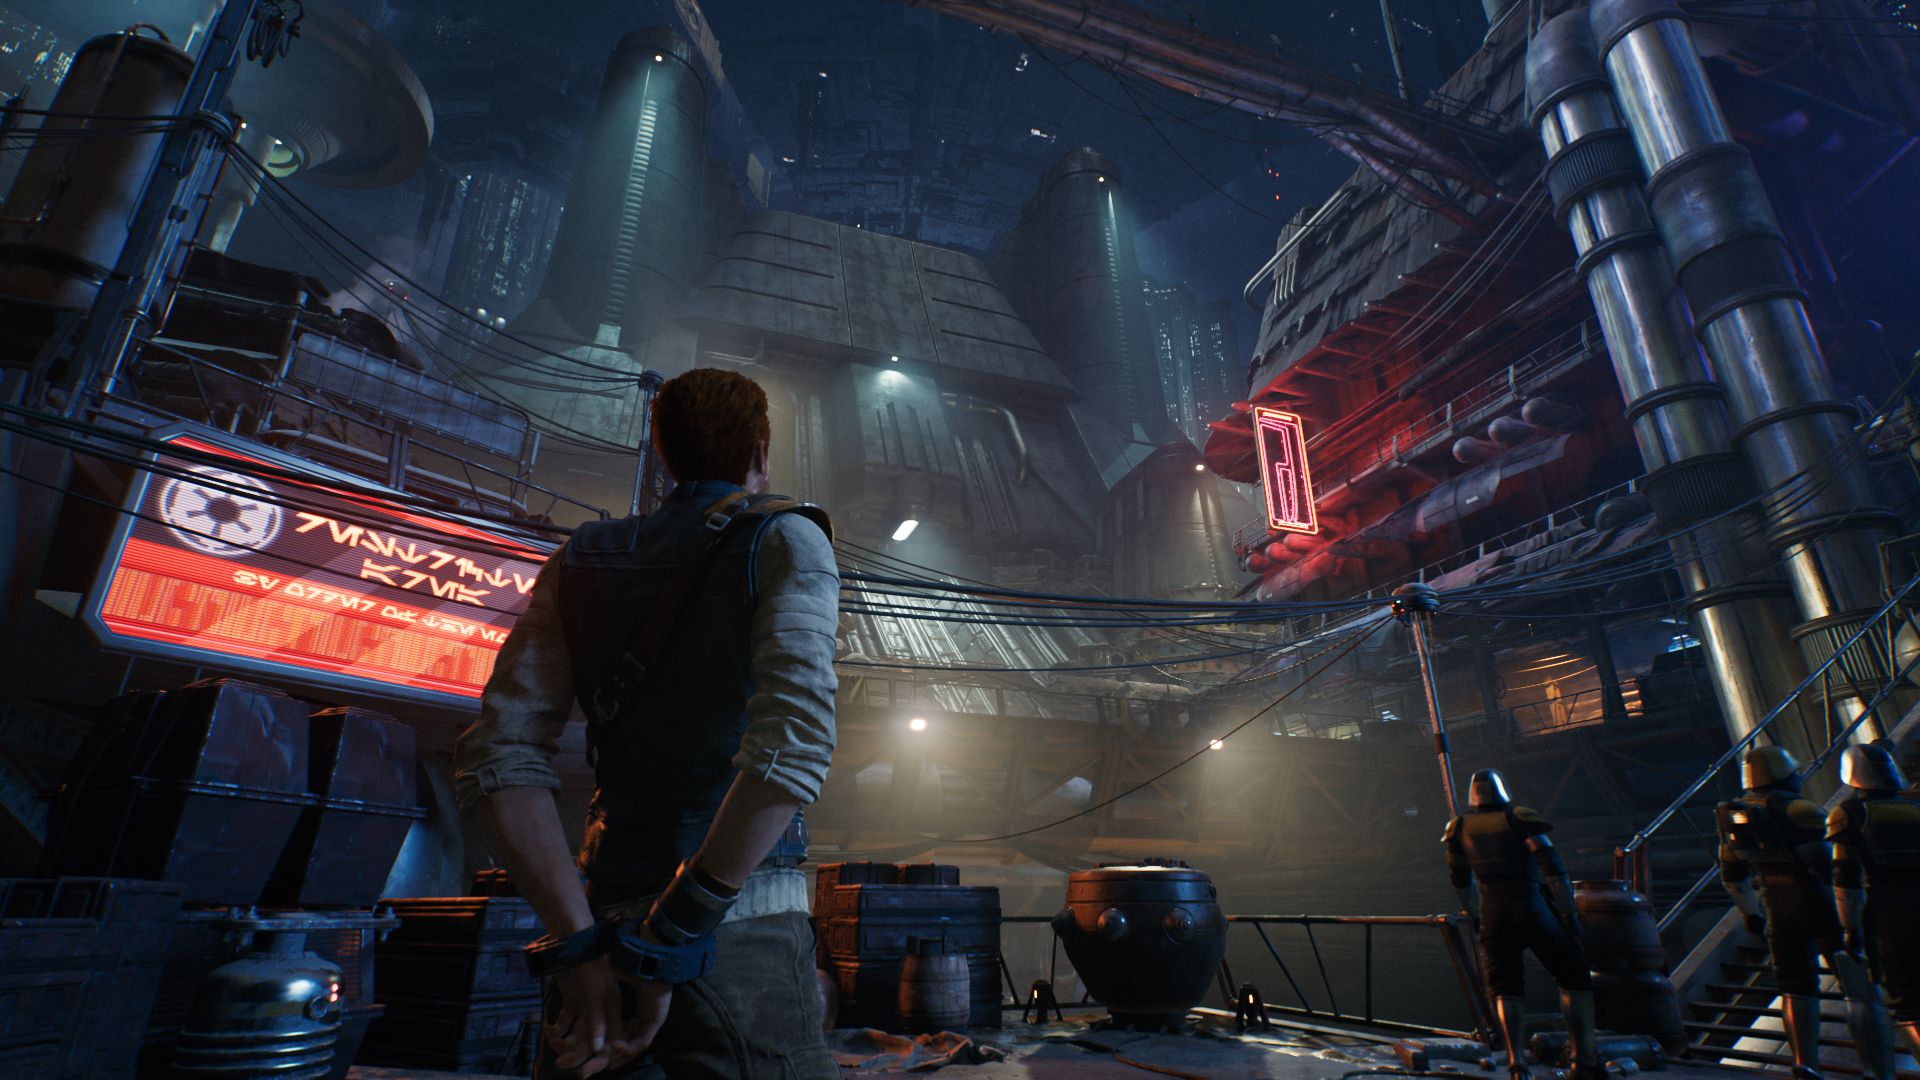
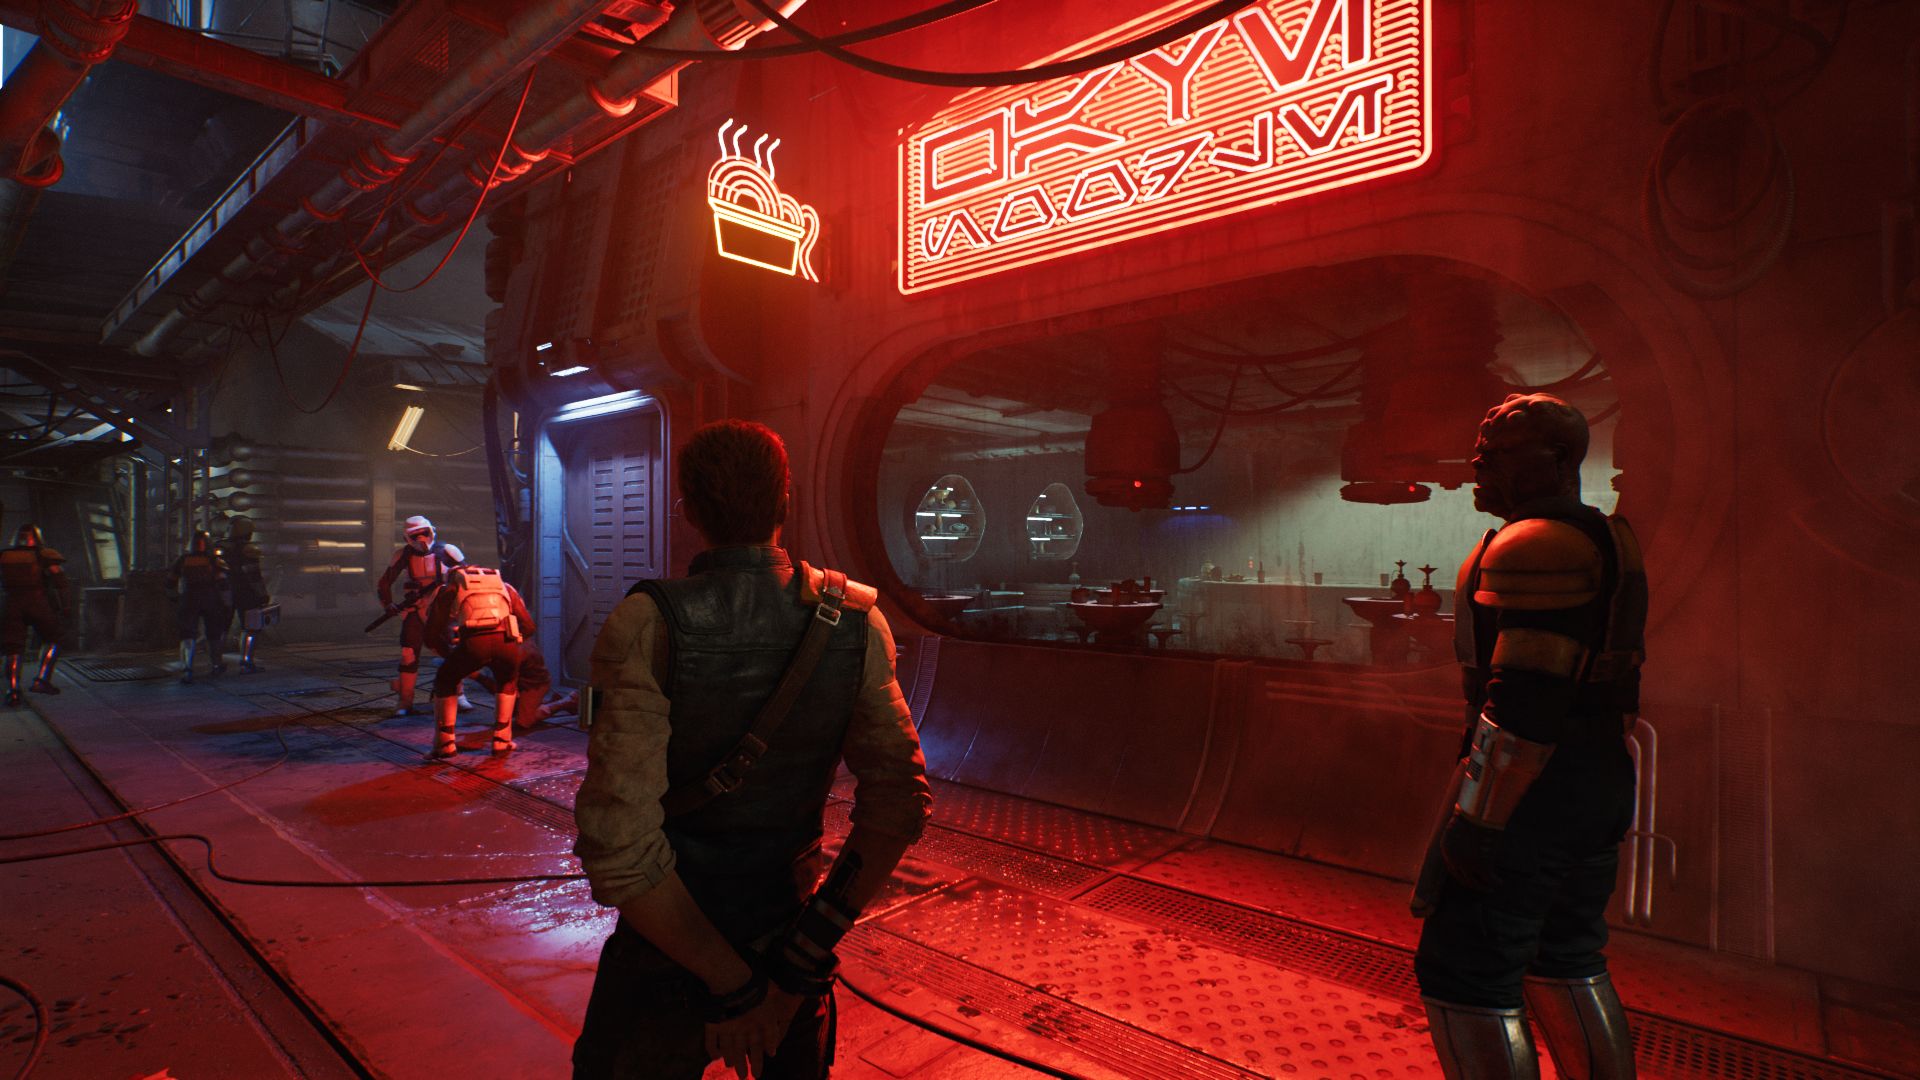
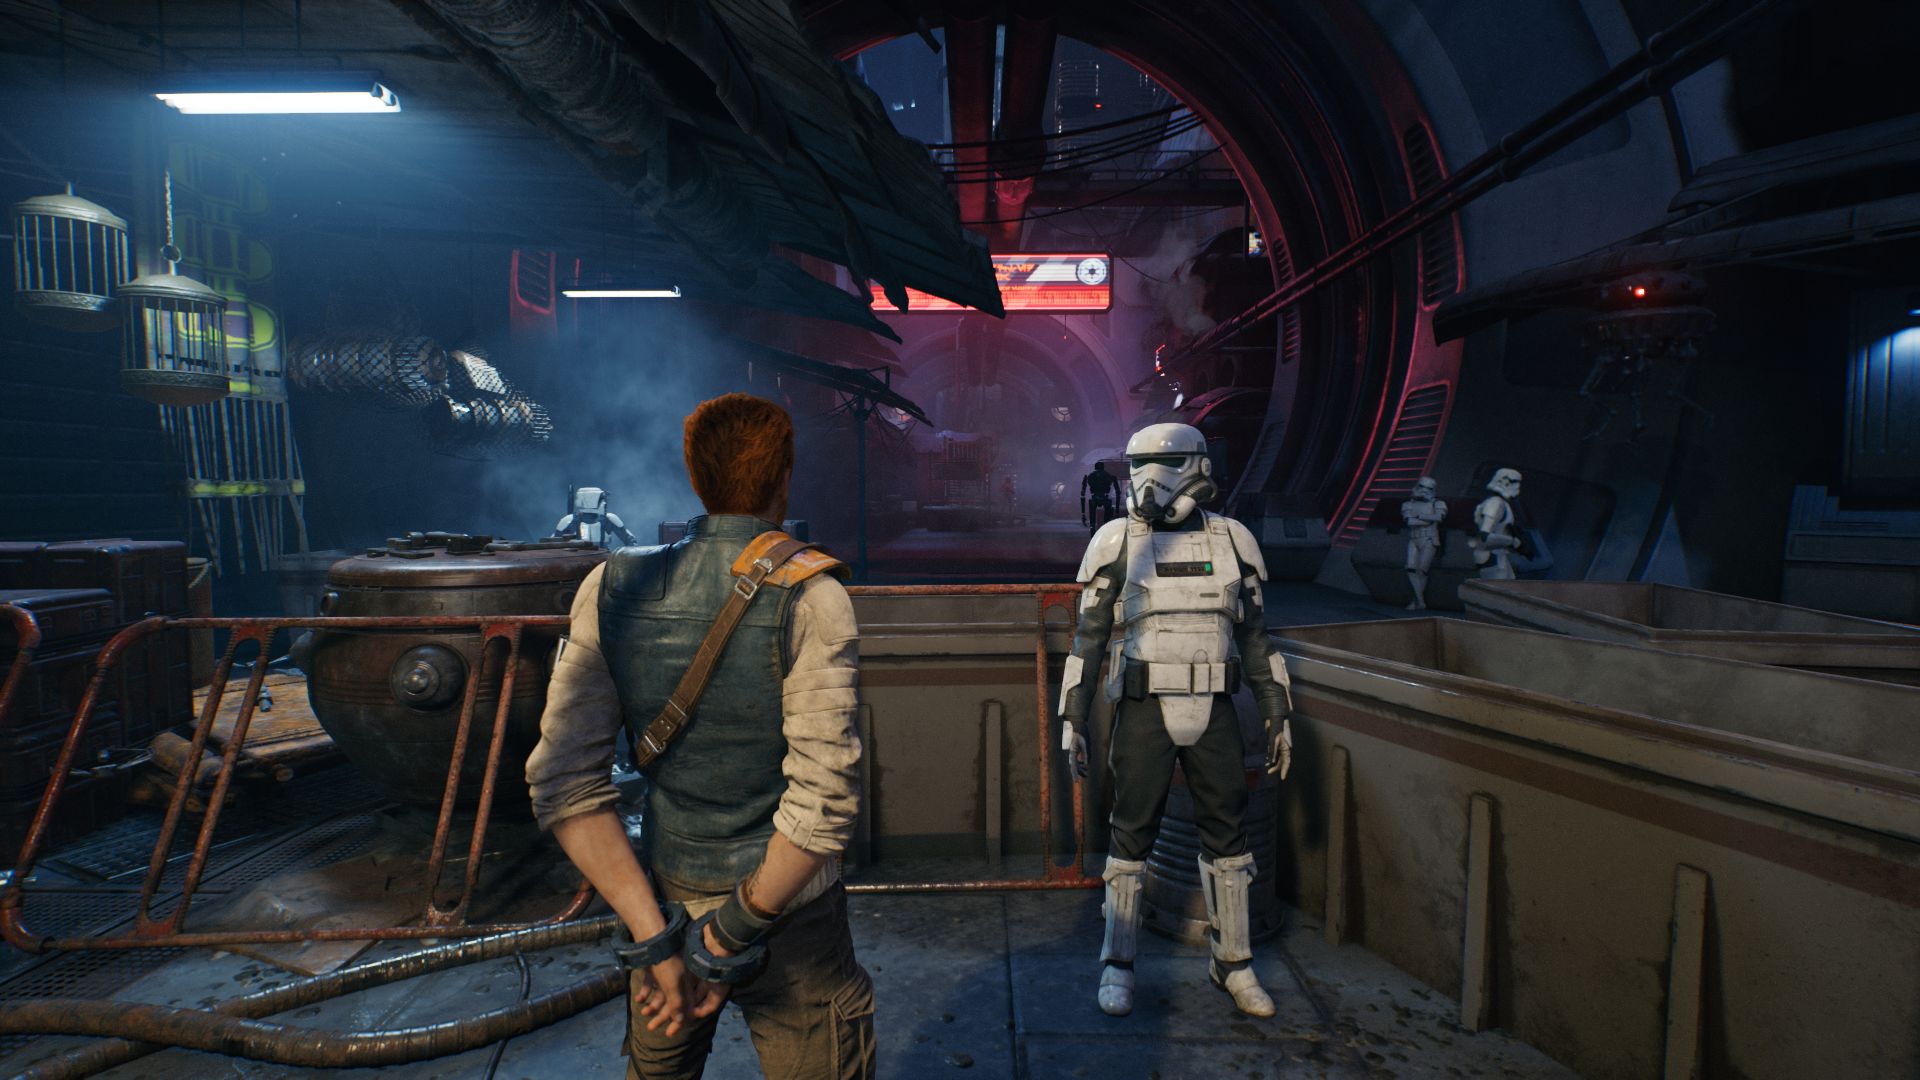
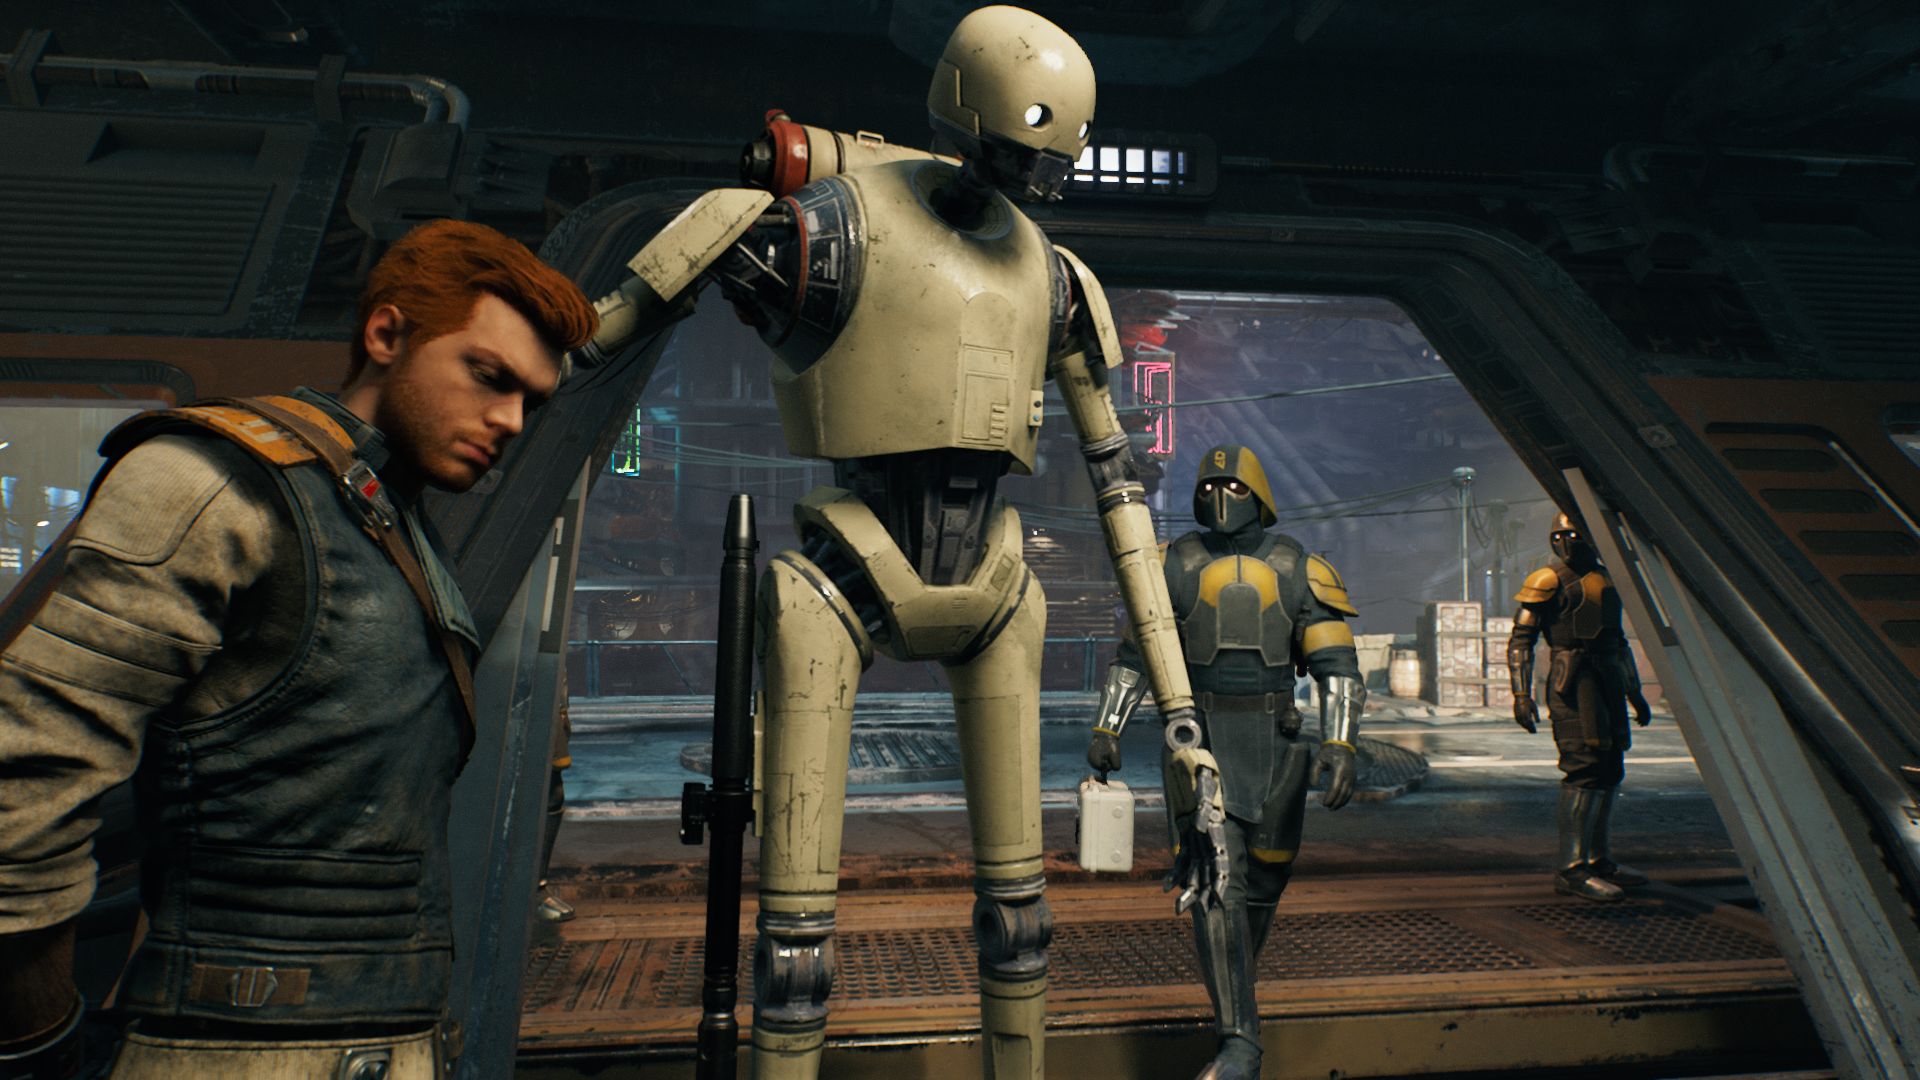
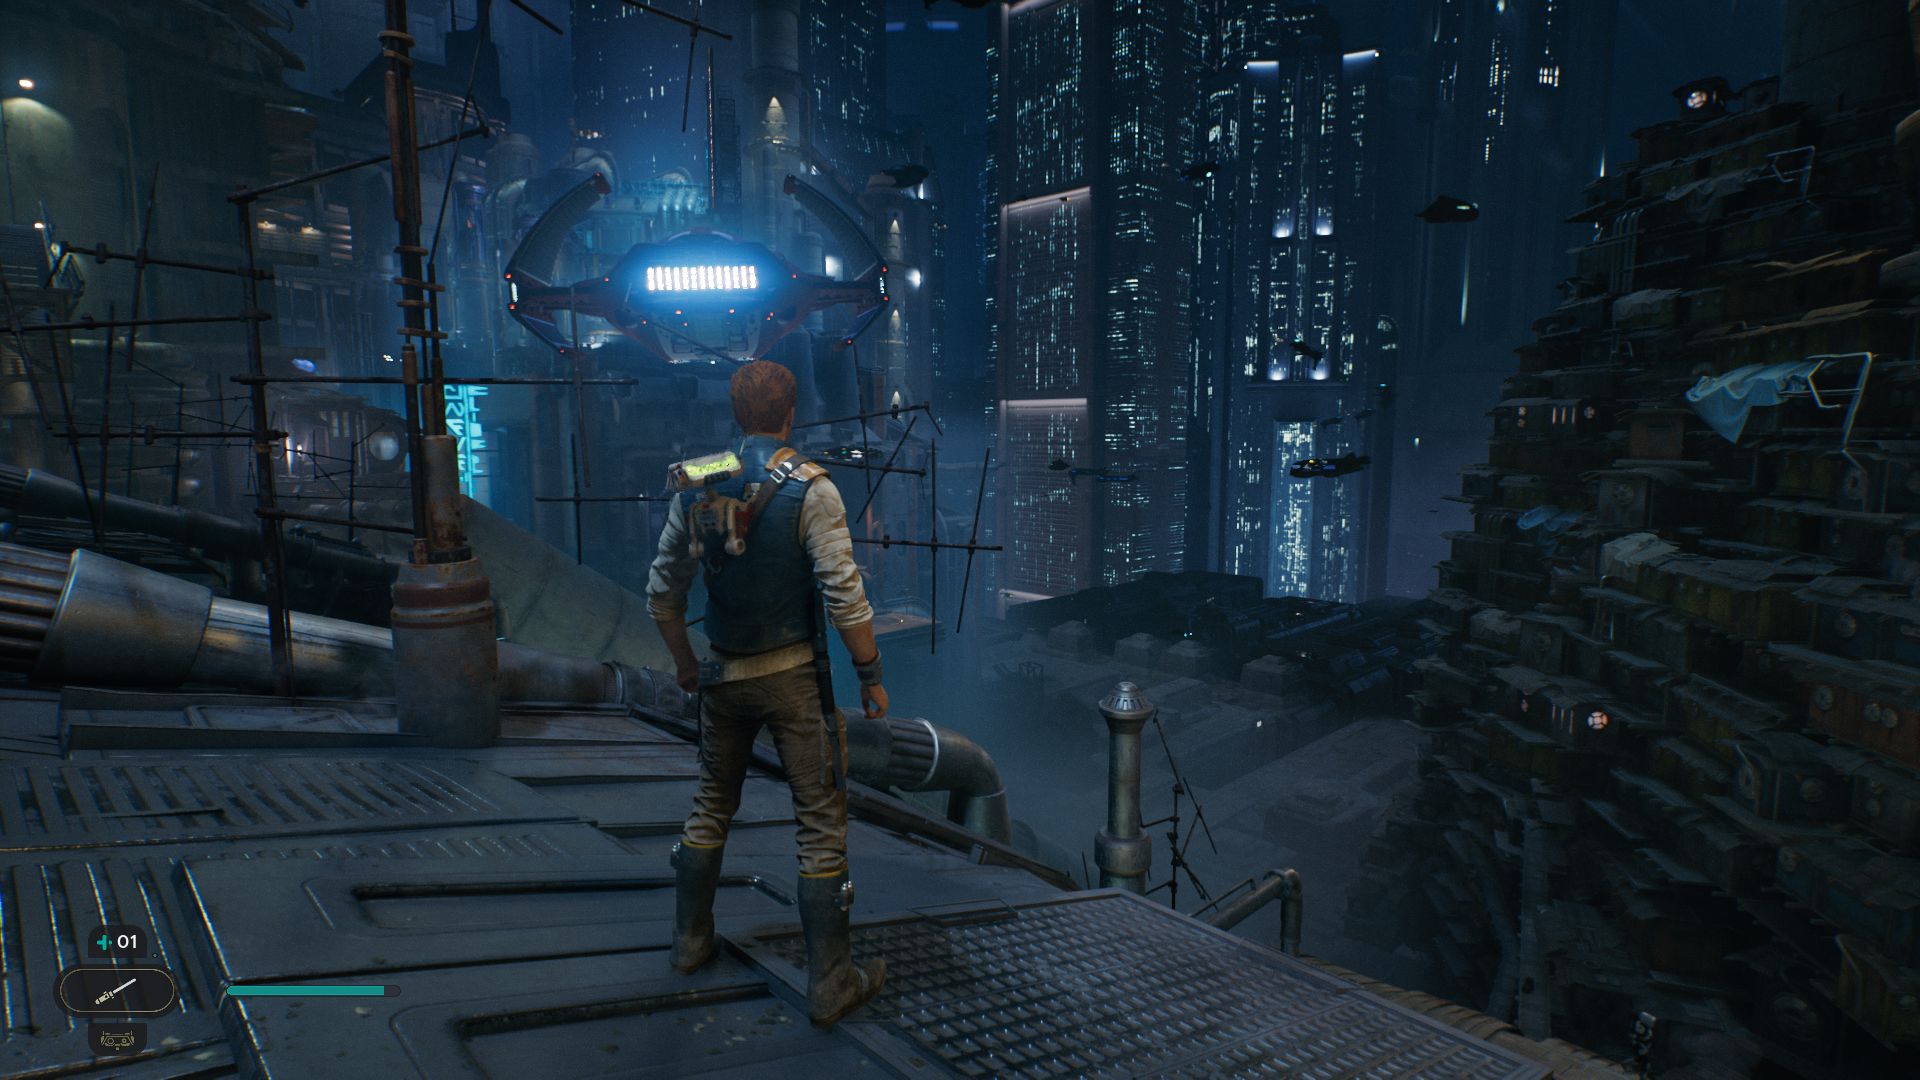
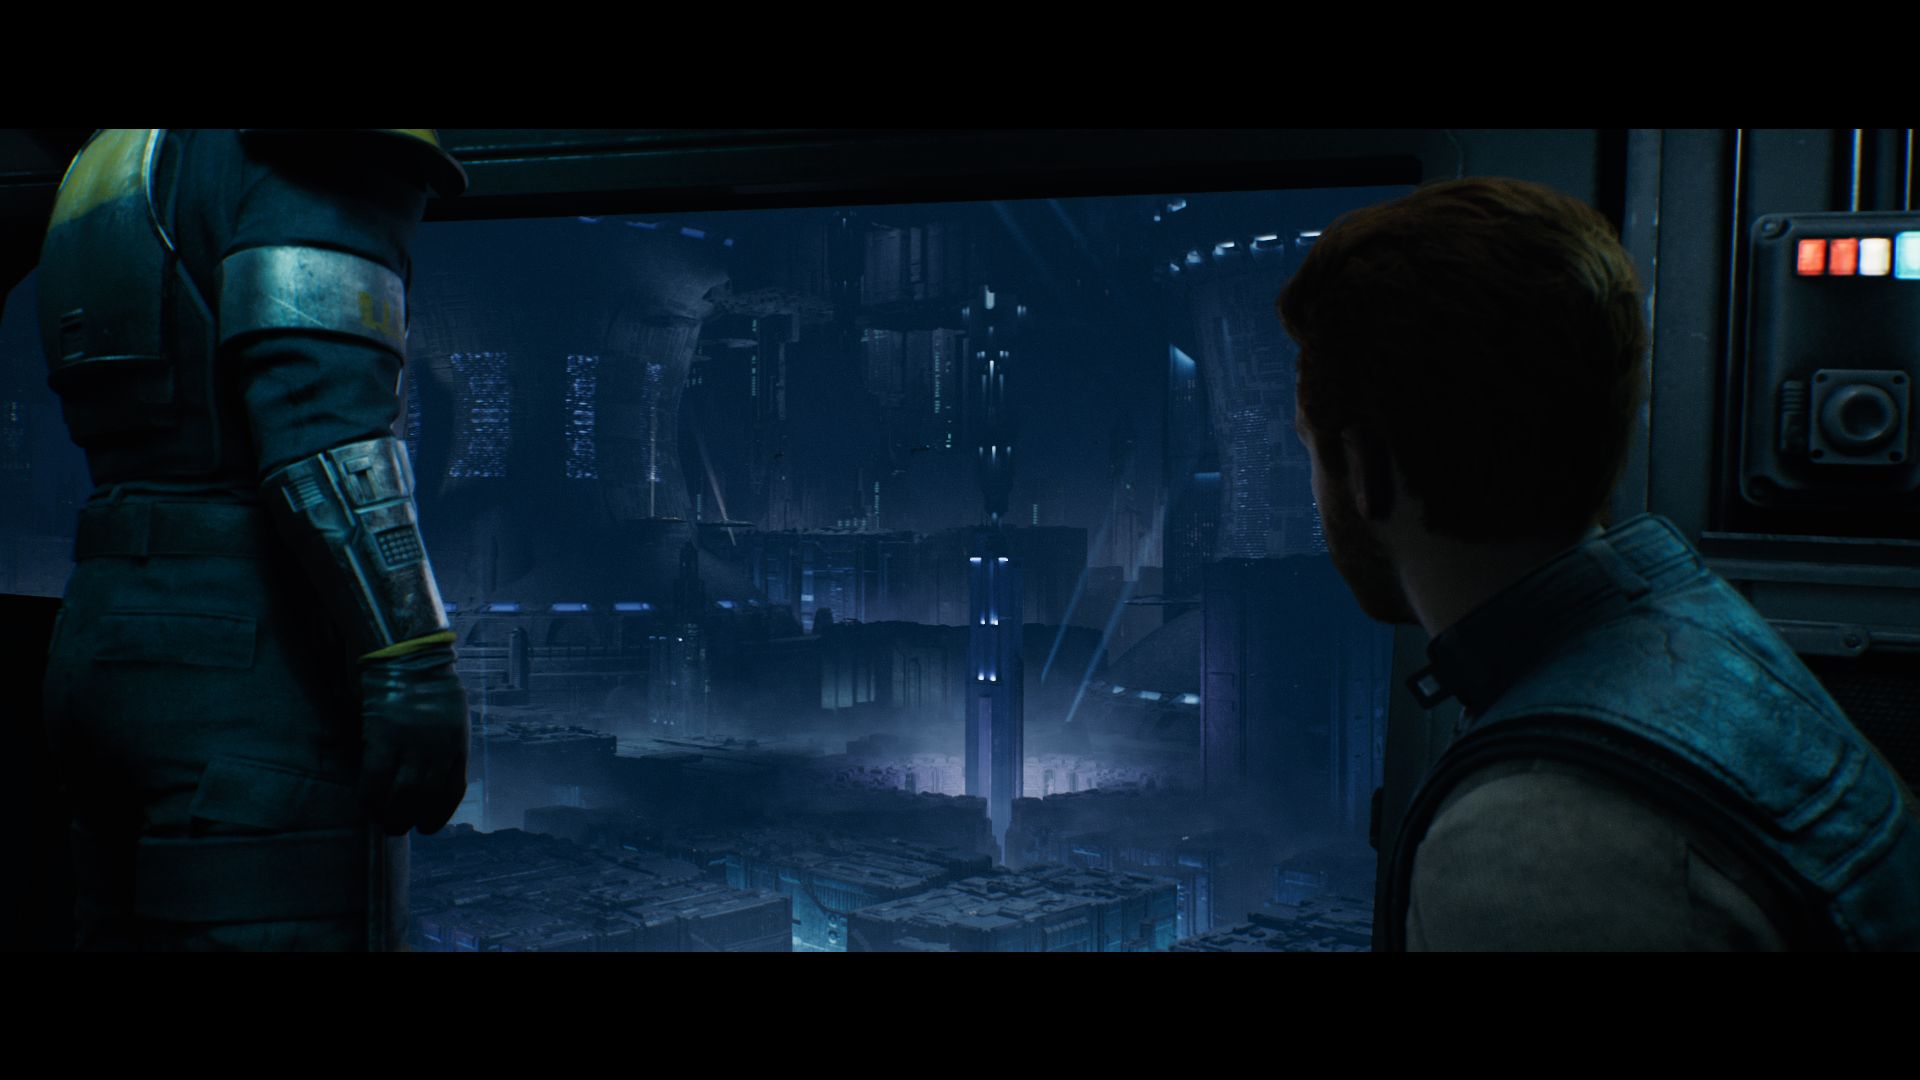
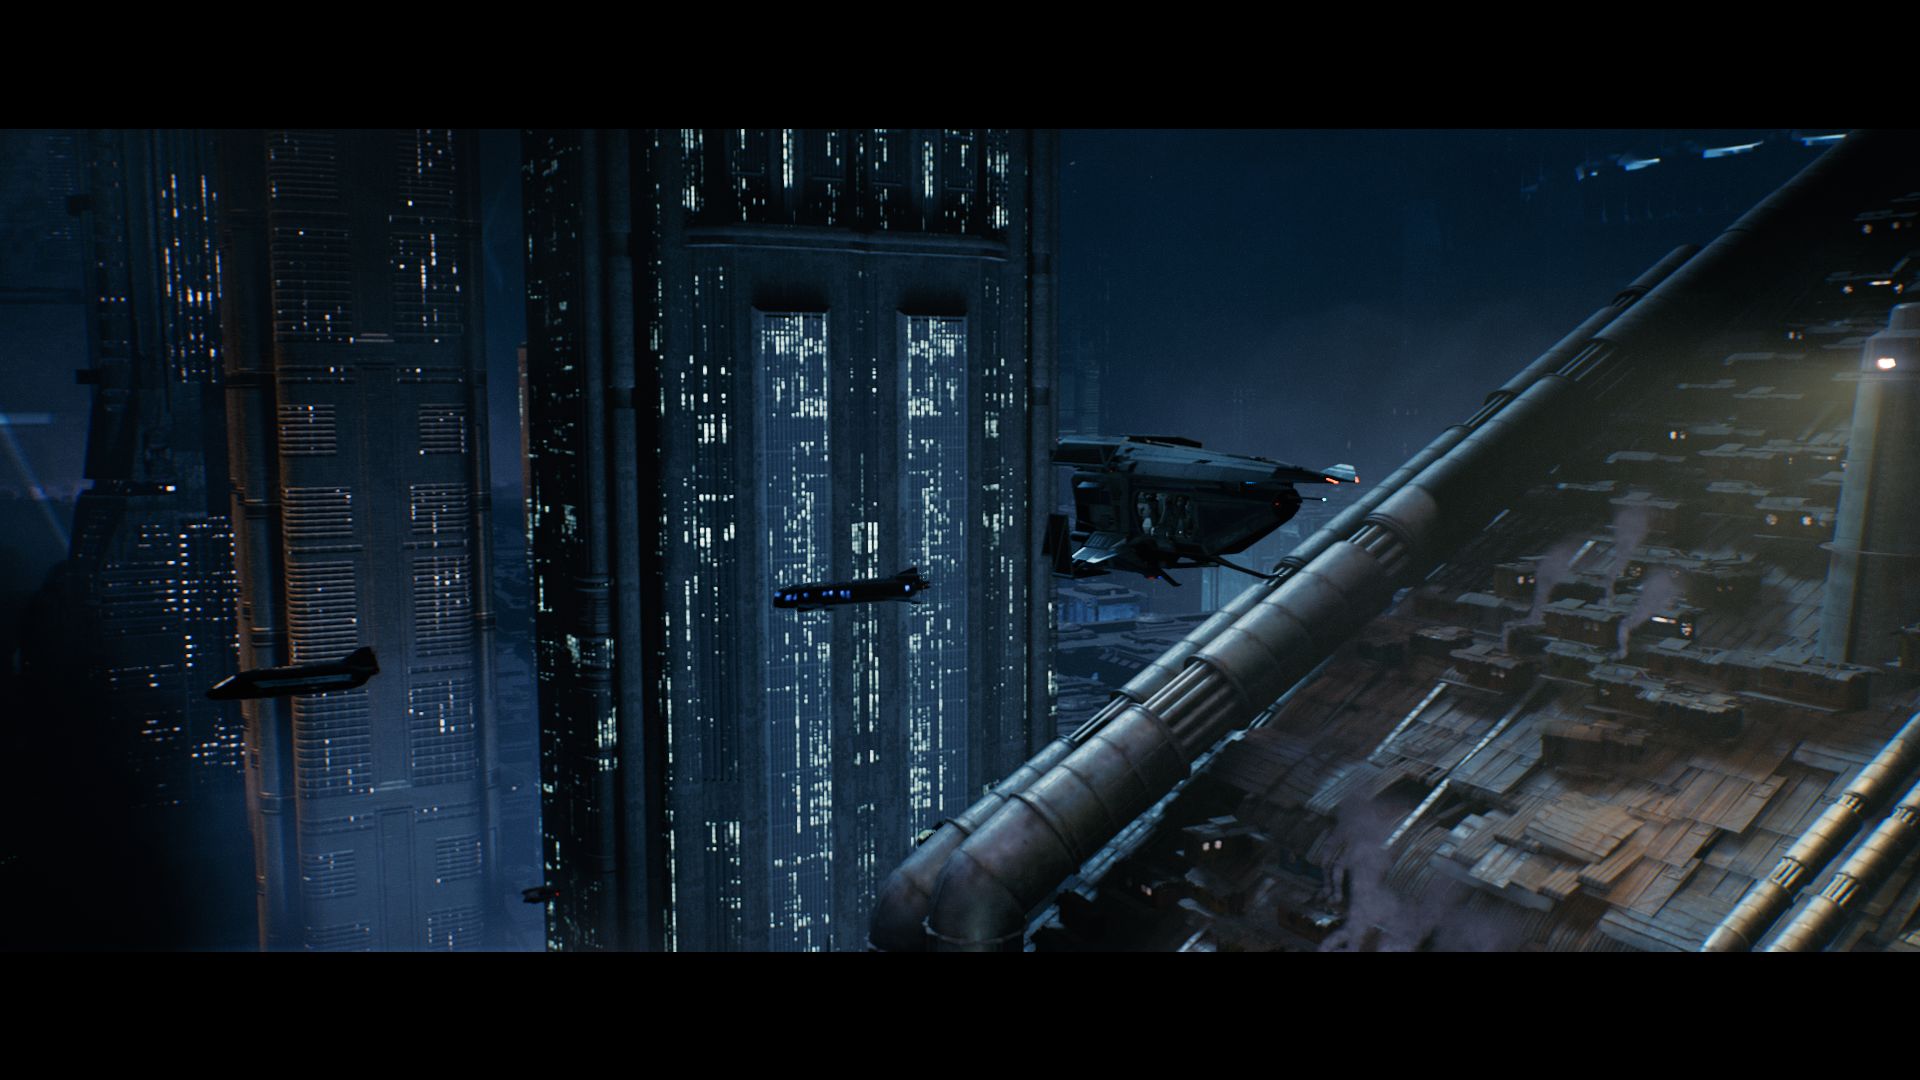
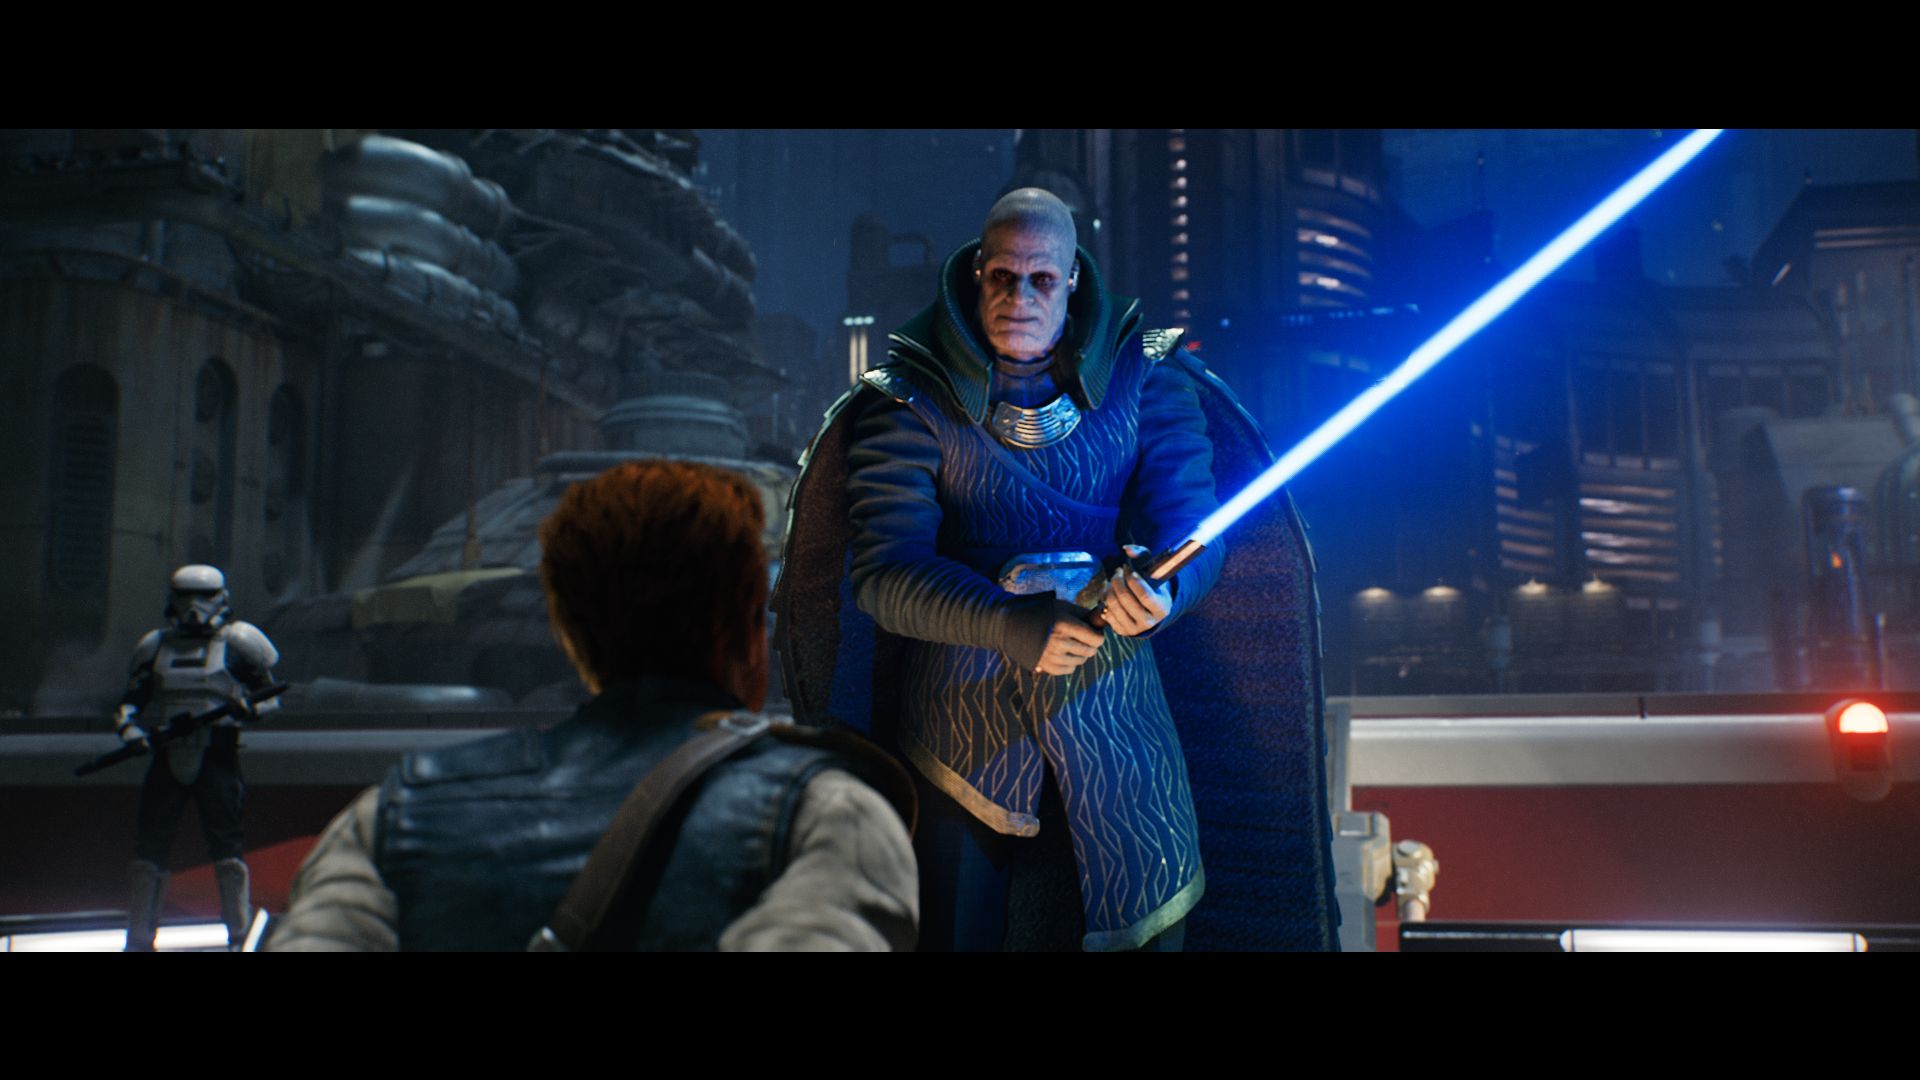
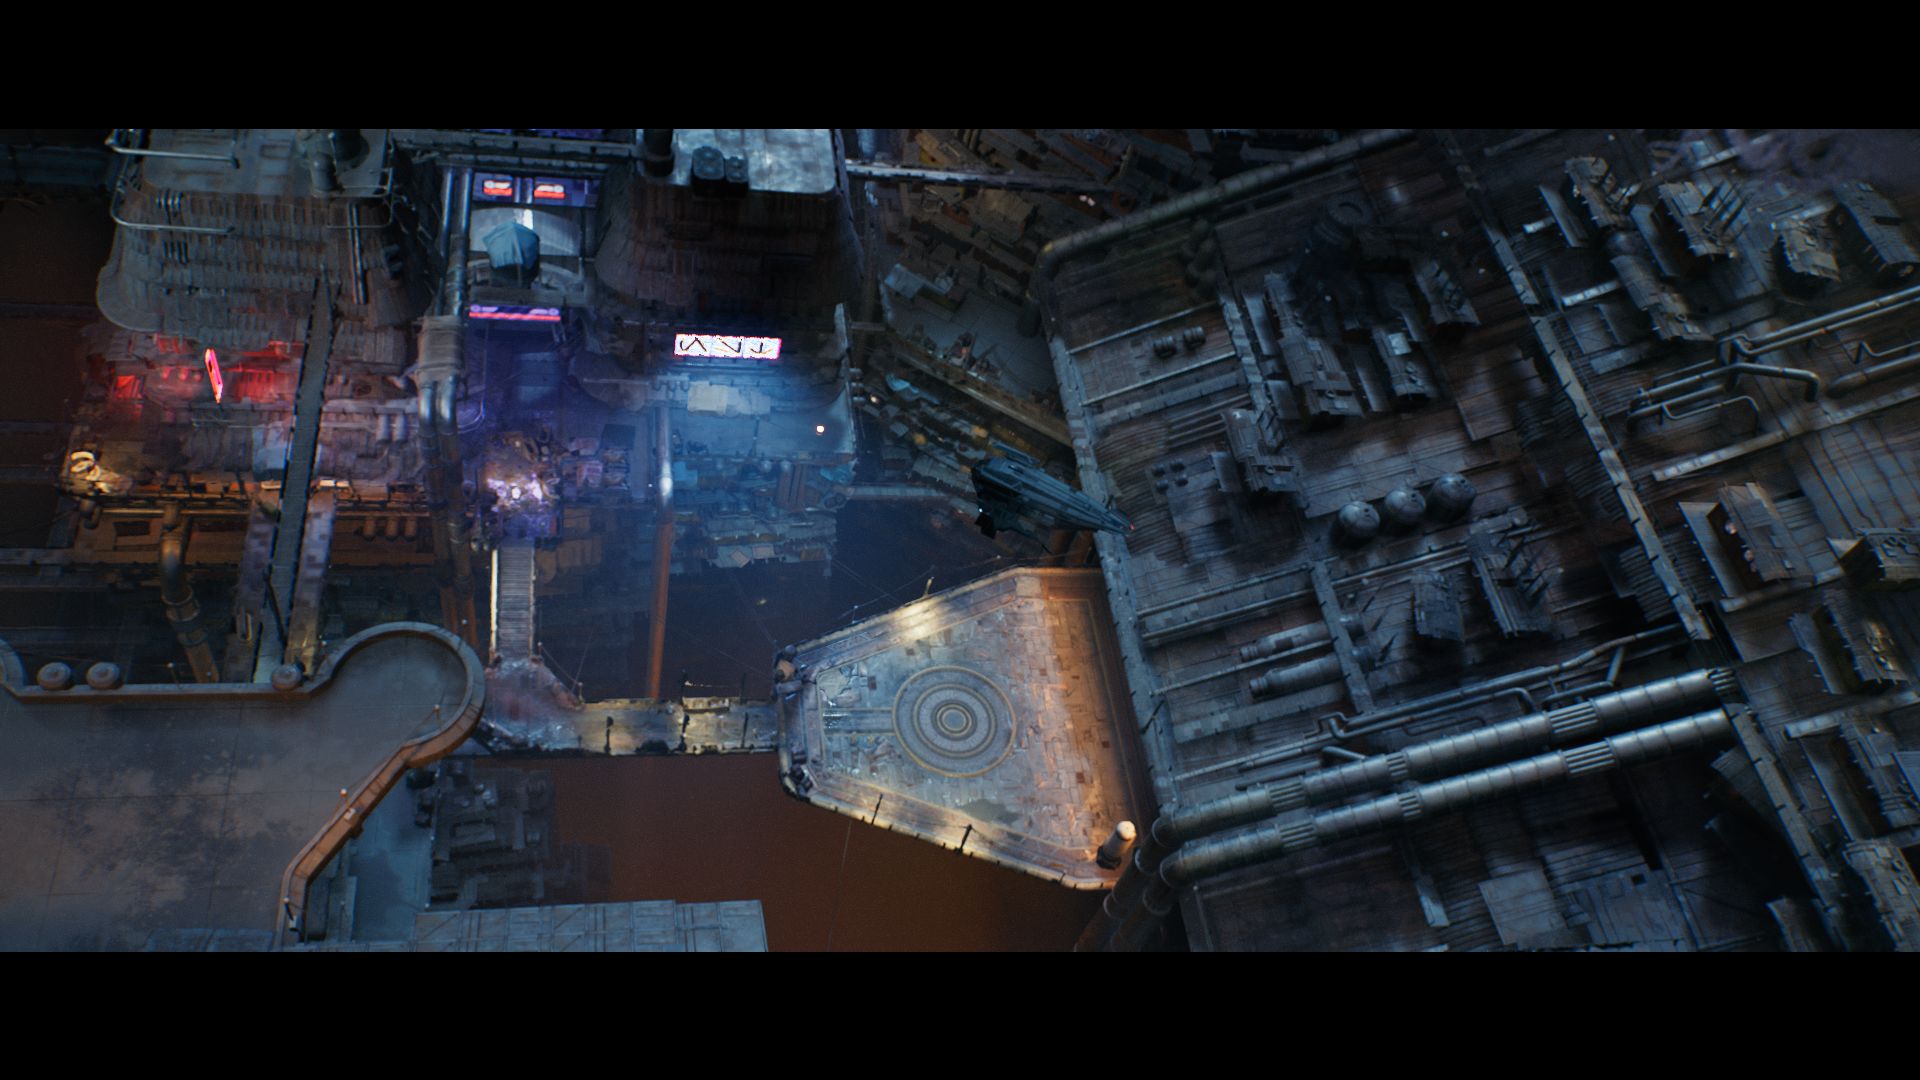
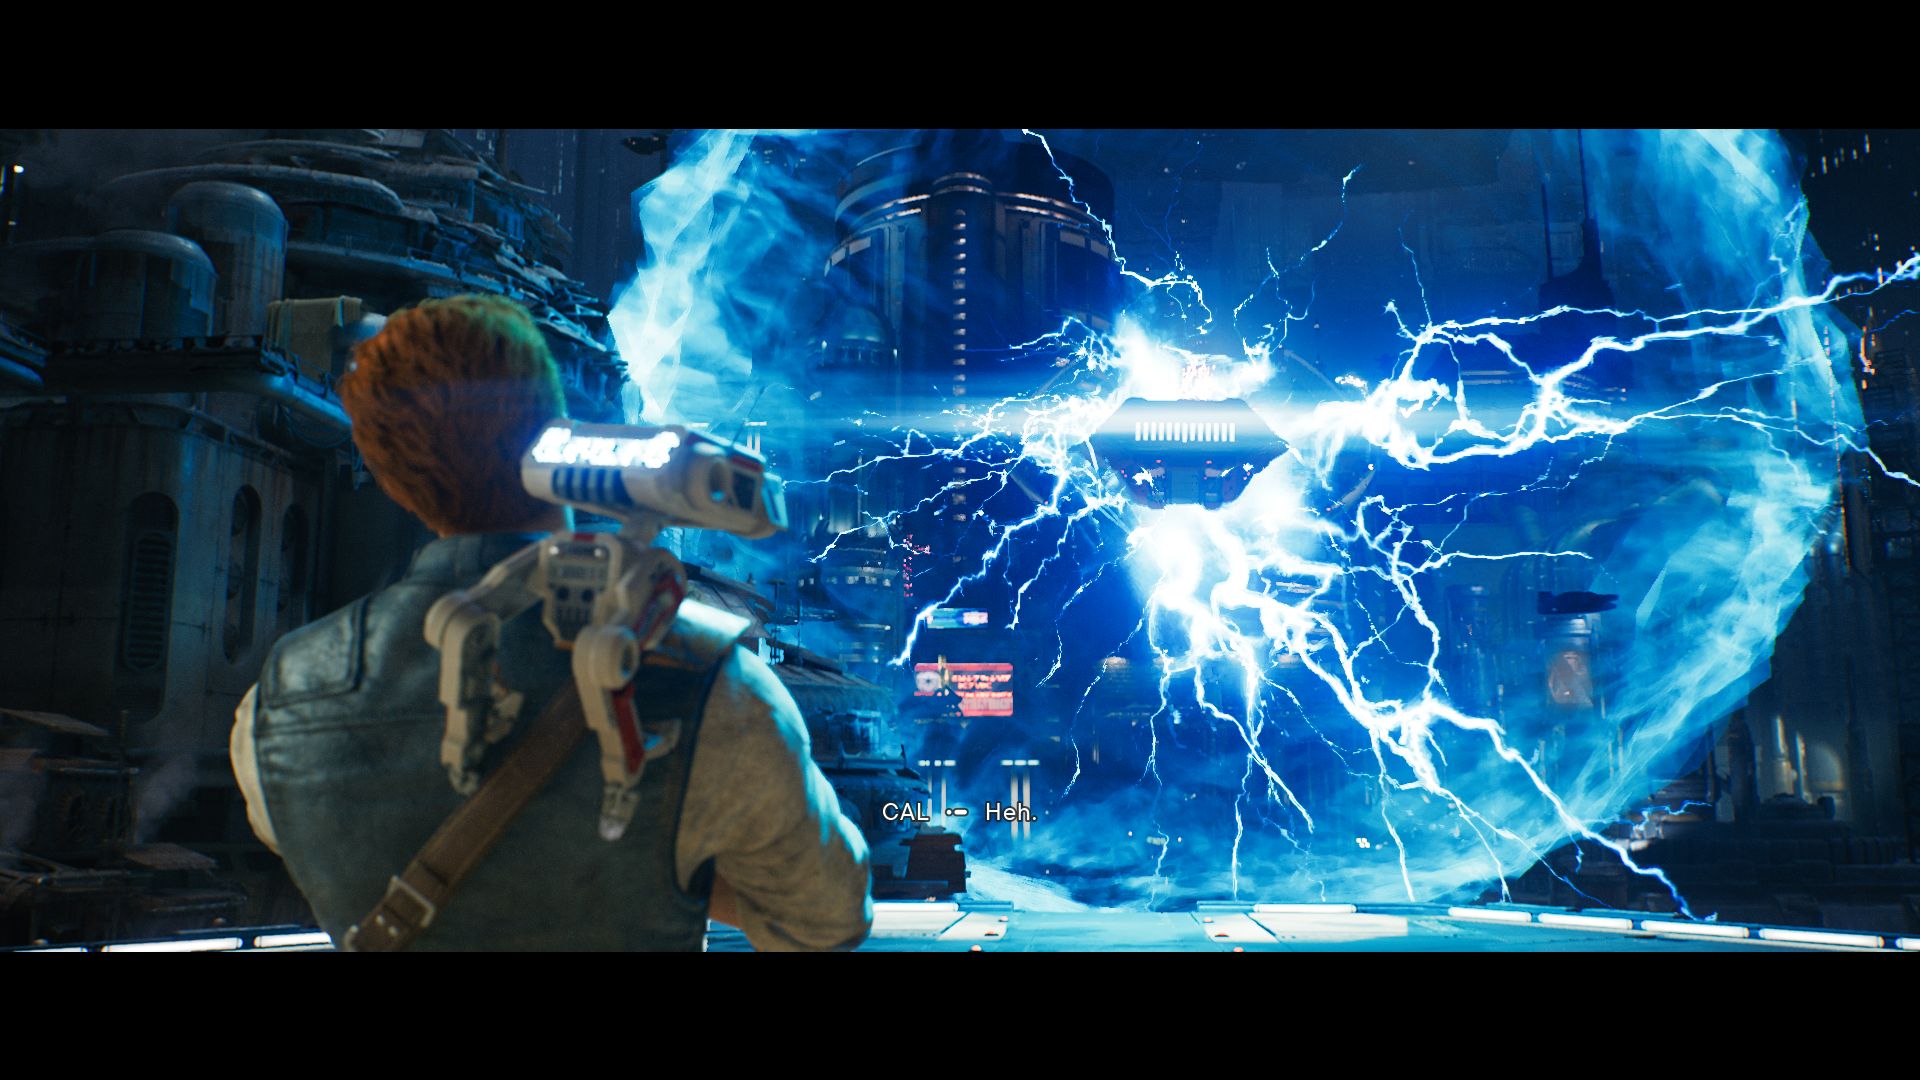
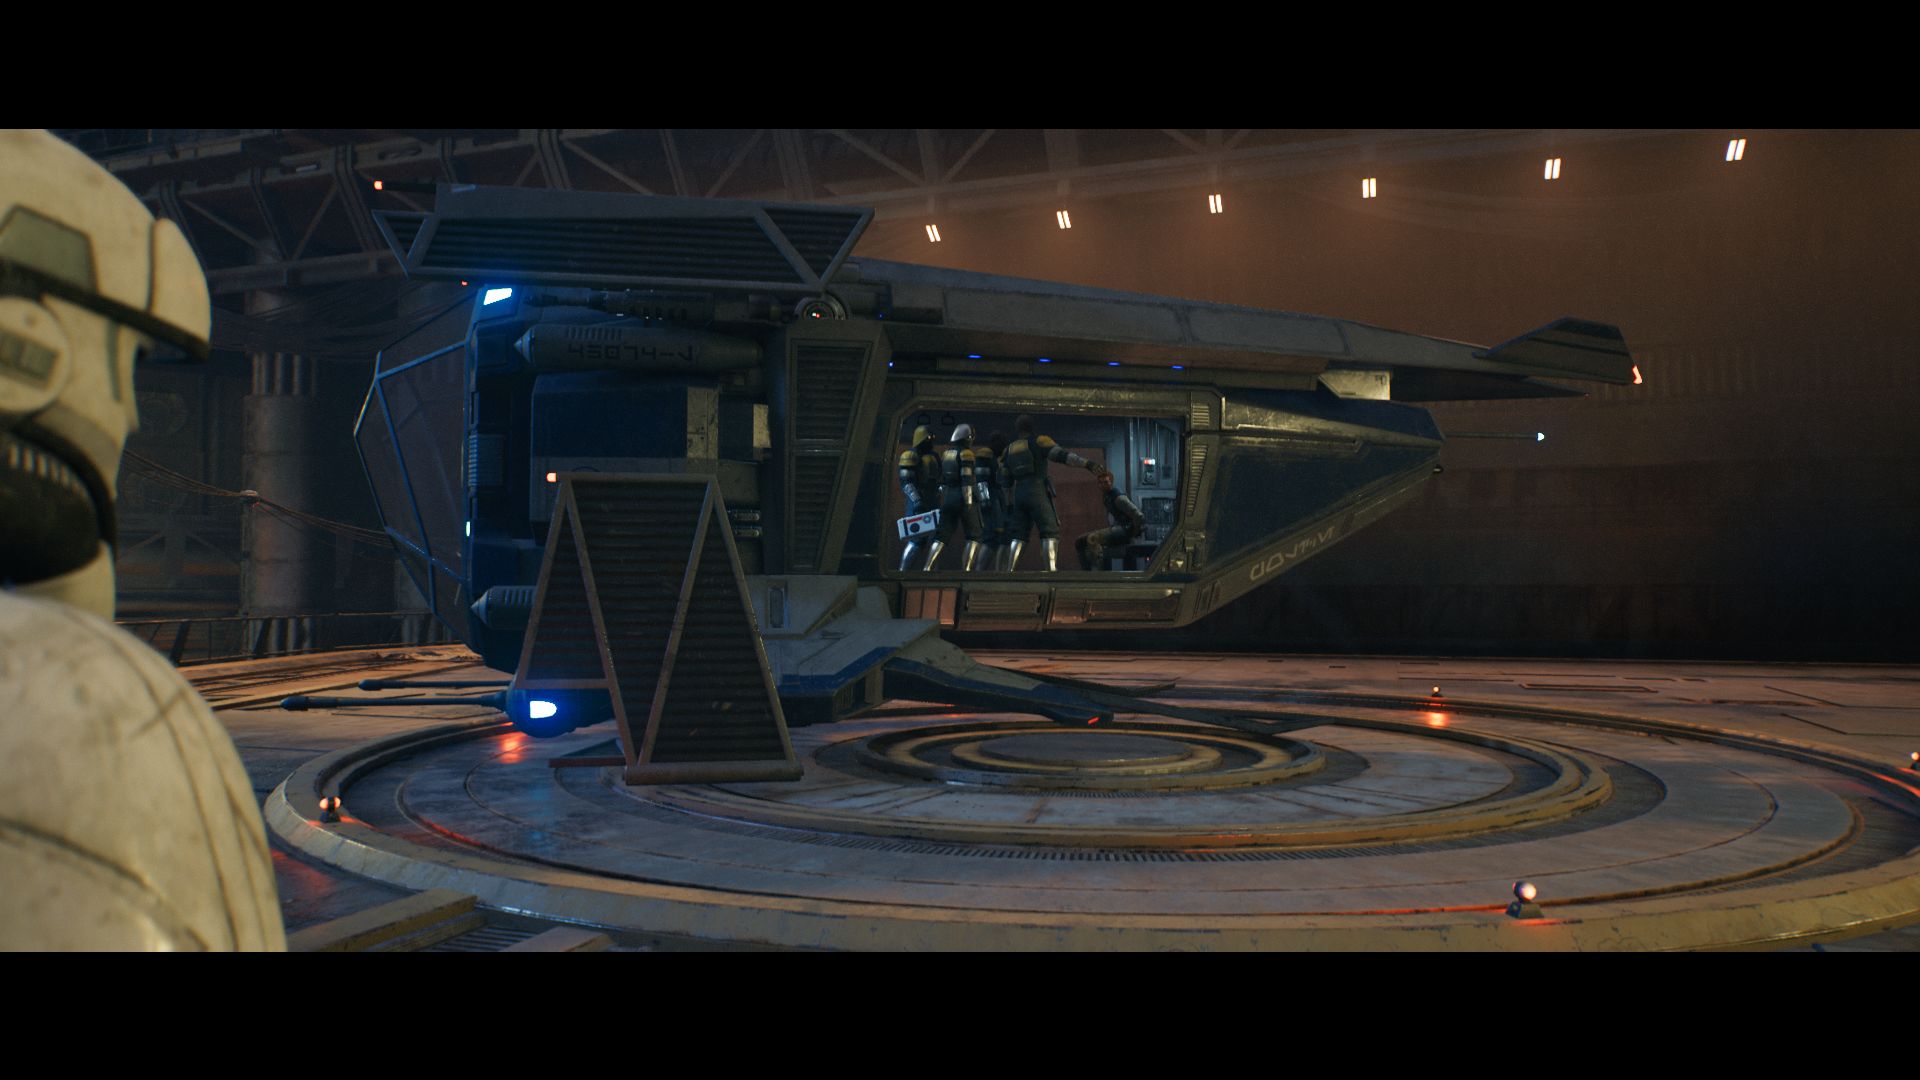
Visually, the game can't really be critiqued - aside from its graphical errors. The (inside) levels have been designed with care and exude lots of Star Wars flair in the shape of an atmospheric soundtrack and successful combat mechanics. The characters, textures and effects are also impressive - giving the game an overall good quality. The same can be said for its cinematic production and game structure. 

Jedi Survivor
Jedi Survivor
Jedi Survivor
Jedi Survivor
Jedi Survivor
Jedi Survivor

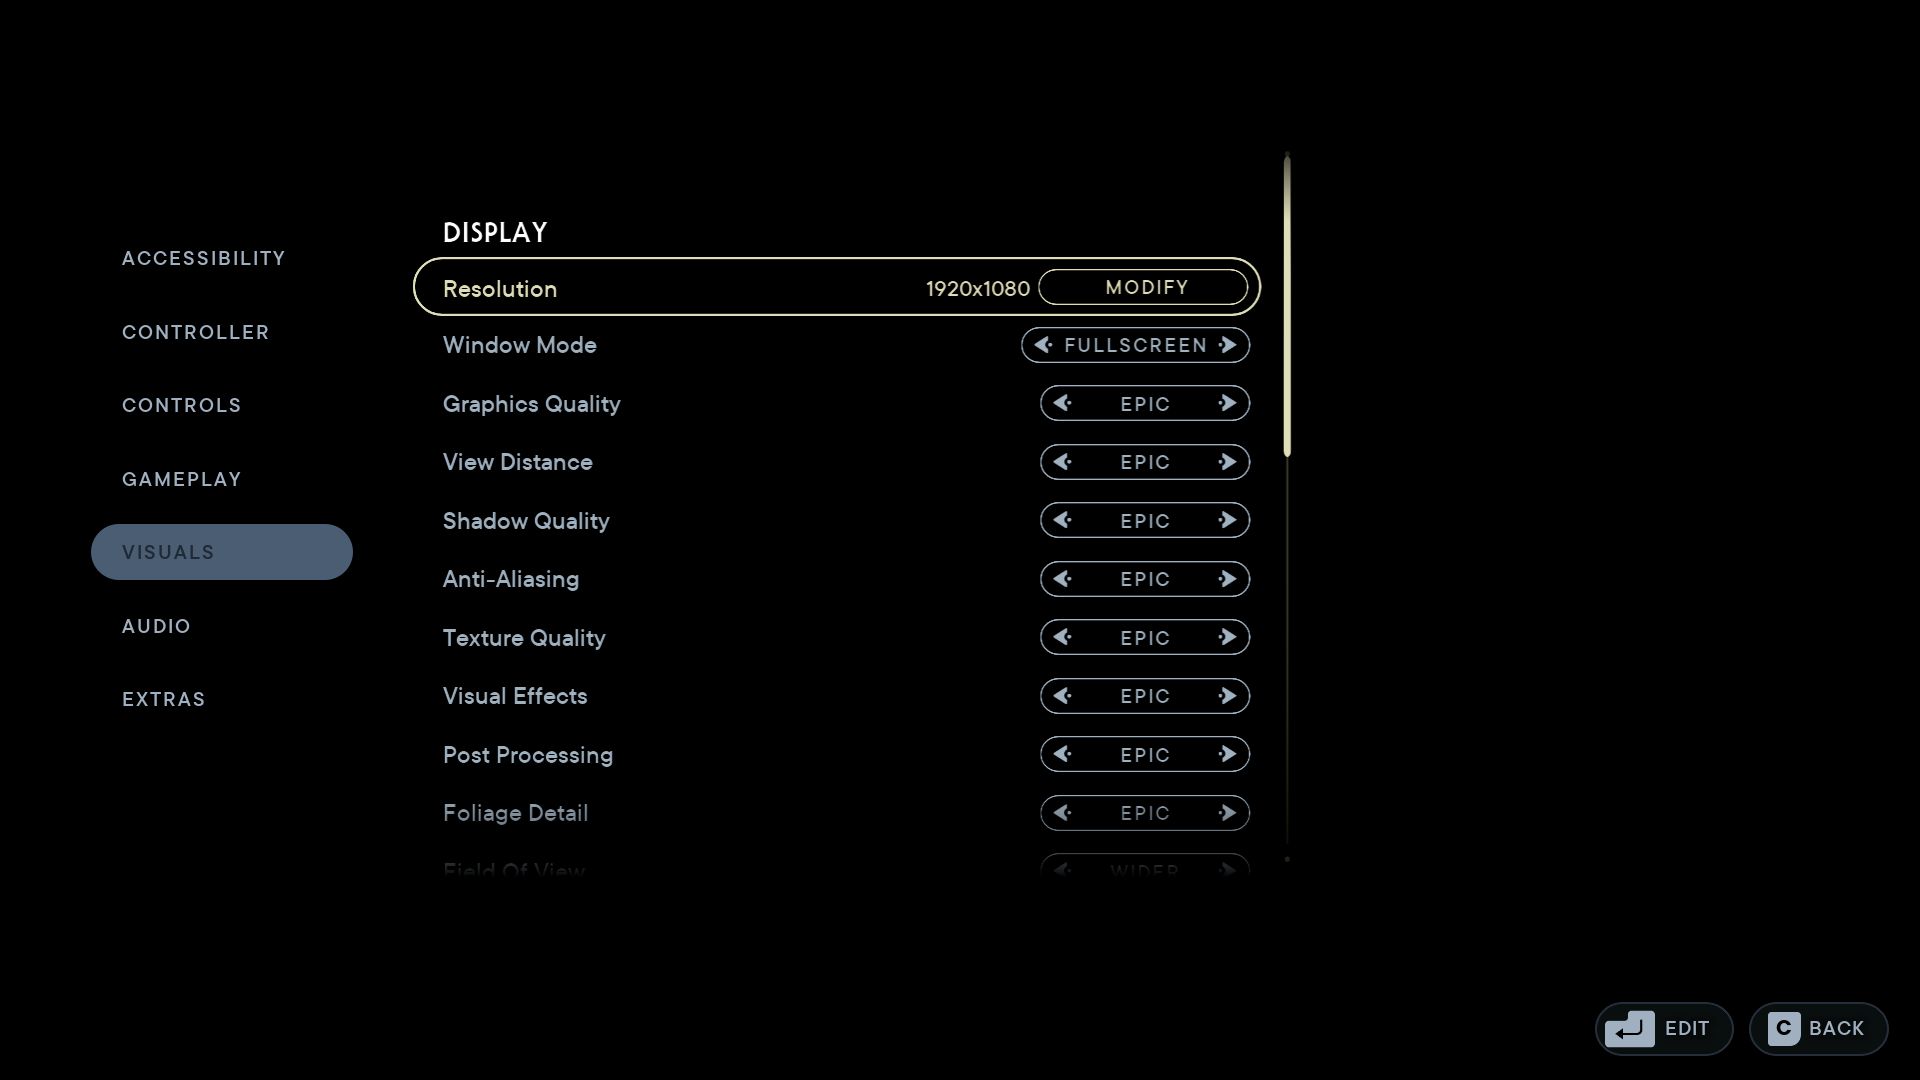
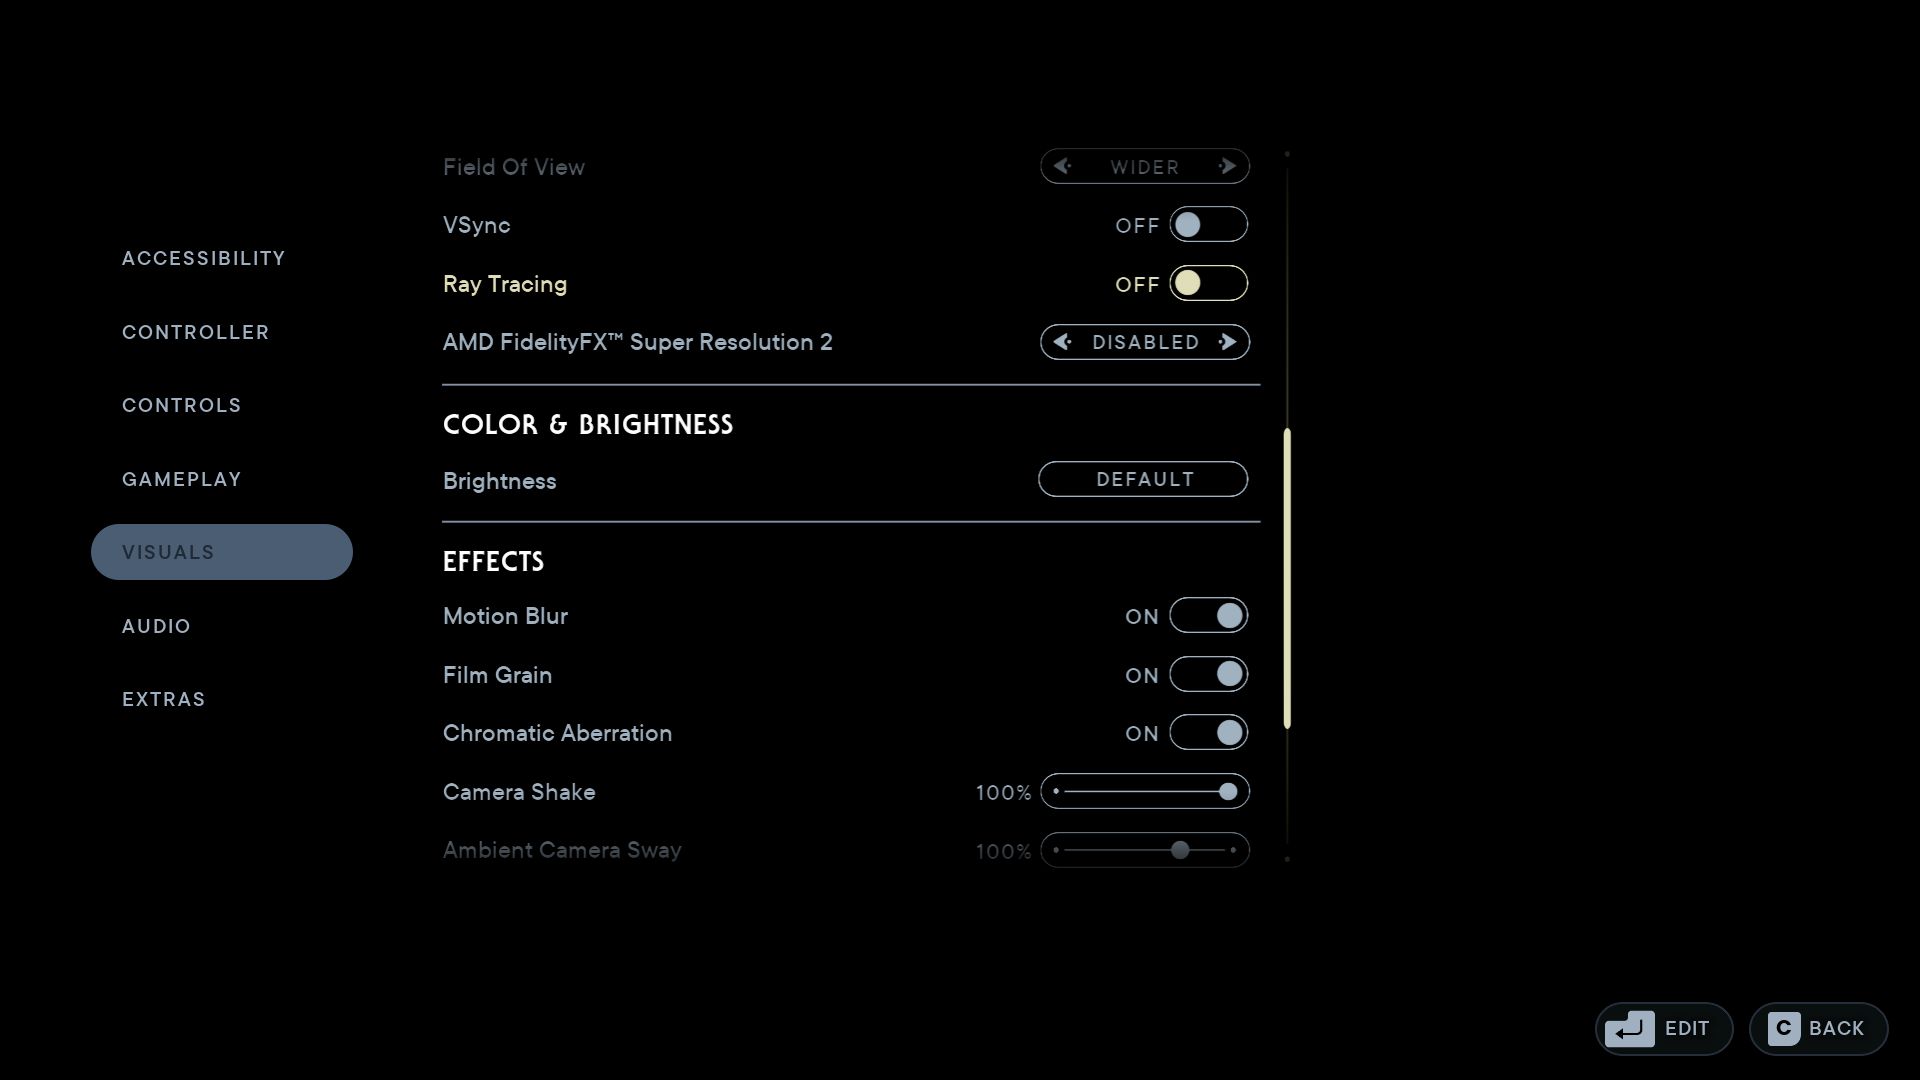
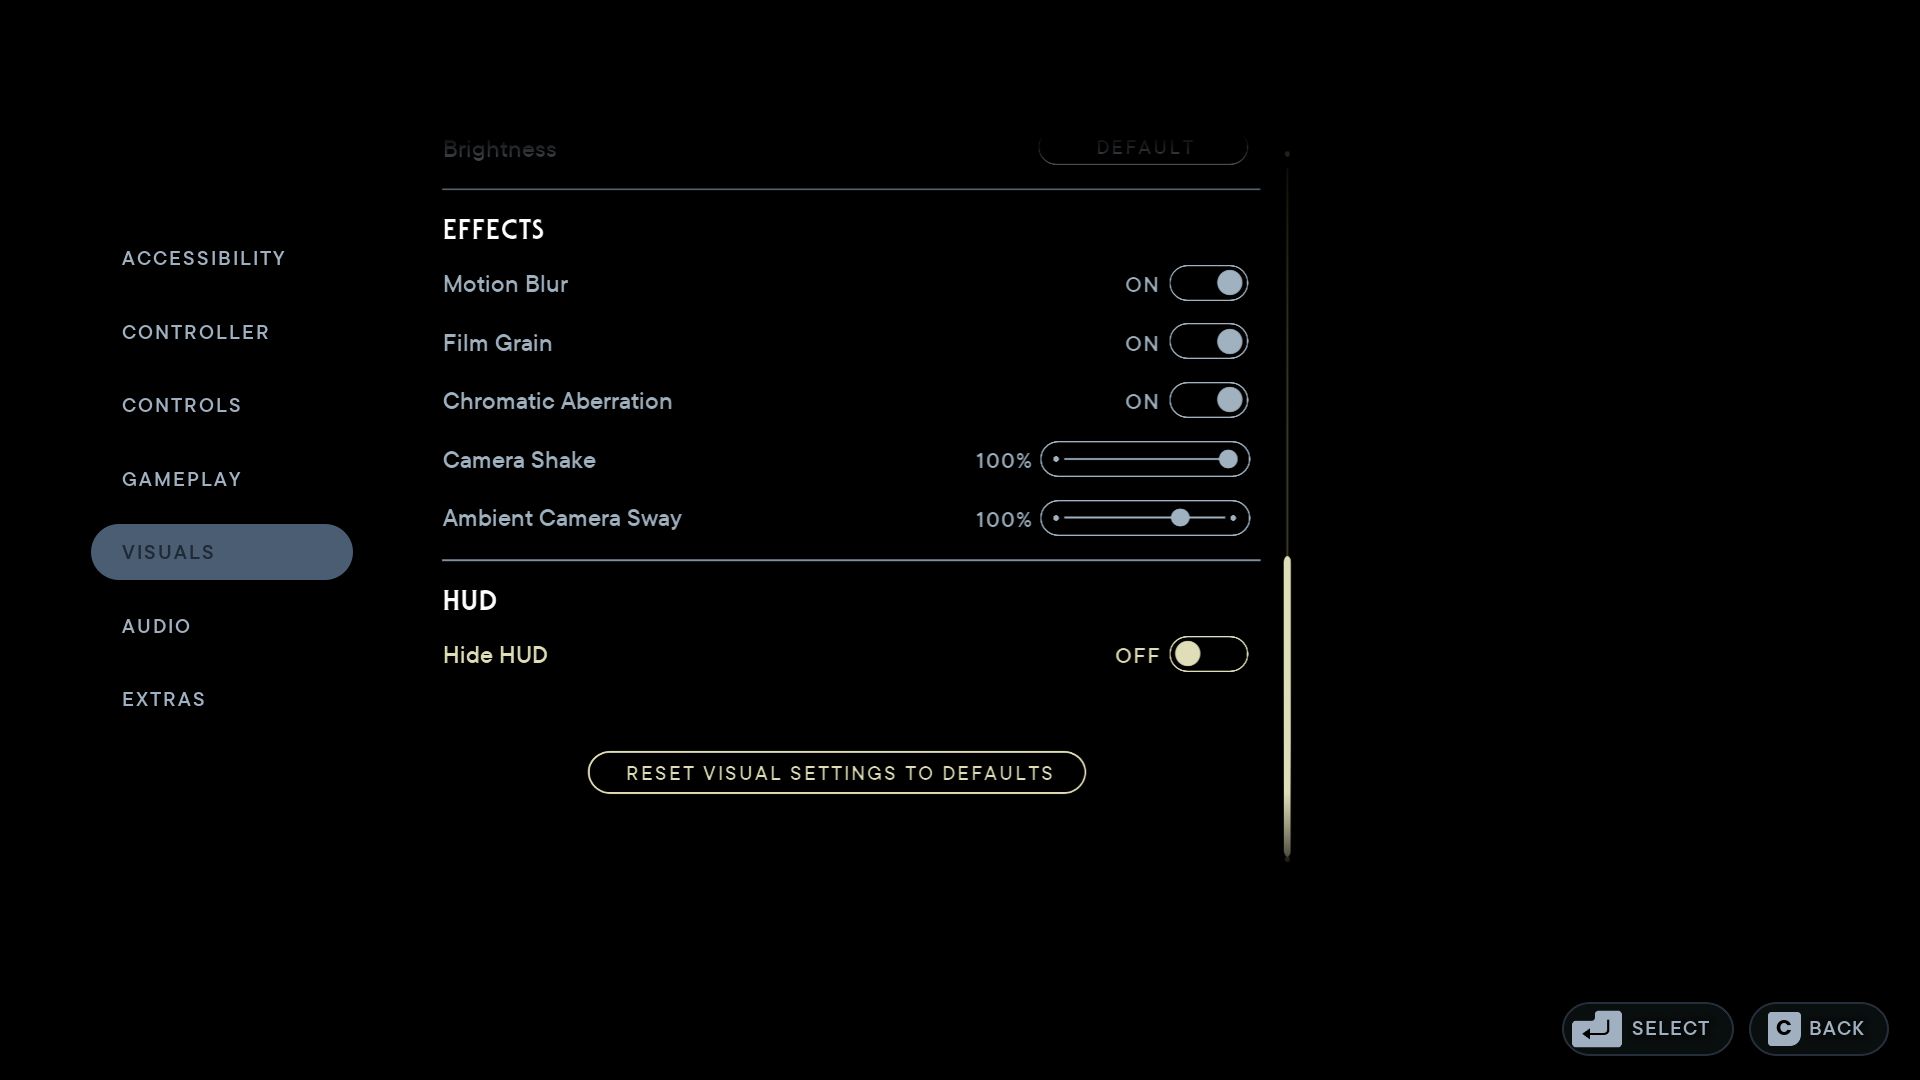
One thing which EA (or the developer Respawn) could improve is the graphics menu. On the one hand, the game is designed to be played using a gamepad, so using a mouse/keyboard proves to be a little finicky. On the other hand, there aren't even explanations next to any of the individual options (at least changes are applied without having to restart the game). While you may be able to change the resolution in the upper part and have the optional choice to select a preset - in the middle section, there are various buttons for V-Sync, ray tracing and FSR 2 (DLSS is currently not available). The color, effect and HUD options at the bottom shouldn't have a noticeable effect on the game's performance.

Jedi Survivor
Jedi Survivor
Jedi Survivor
Jedi Survivor
Jedi Survivor
Jedi Survivor

The fact that the game files have to be optimized every time the game is booted up is sadly becoming more and more the norm nowadays. Even so, this procedure is getting continuously faster, for example compared to The Last of Us - which pretty much set a new negative record in this regard. On the other hand, the game takes quite a while to download with its 130 GB size.

Jedi Survivor
Jedi Survivor
Jedi Survivor

Benchmarks

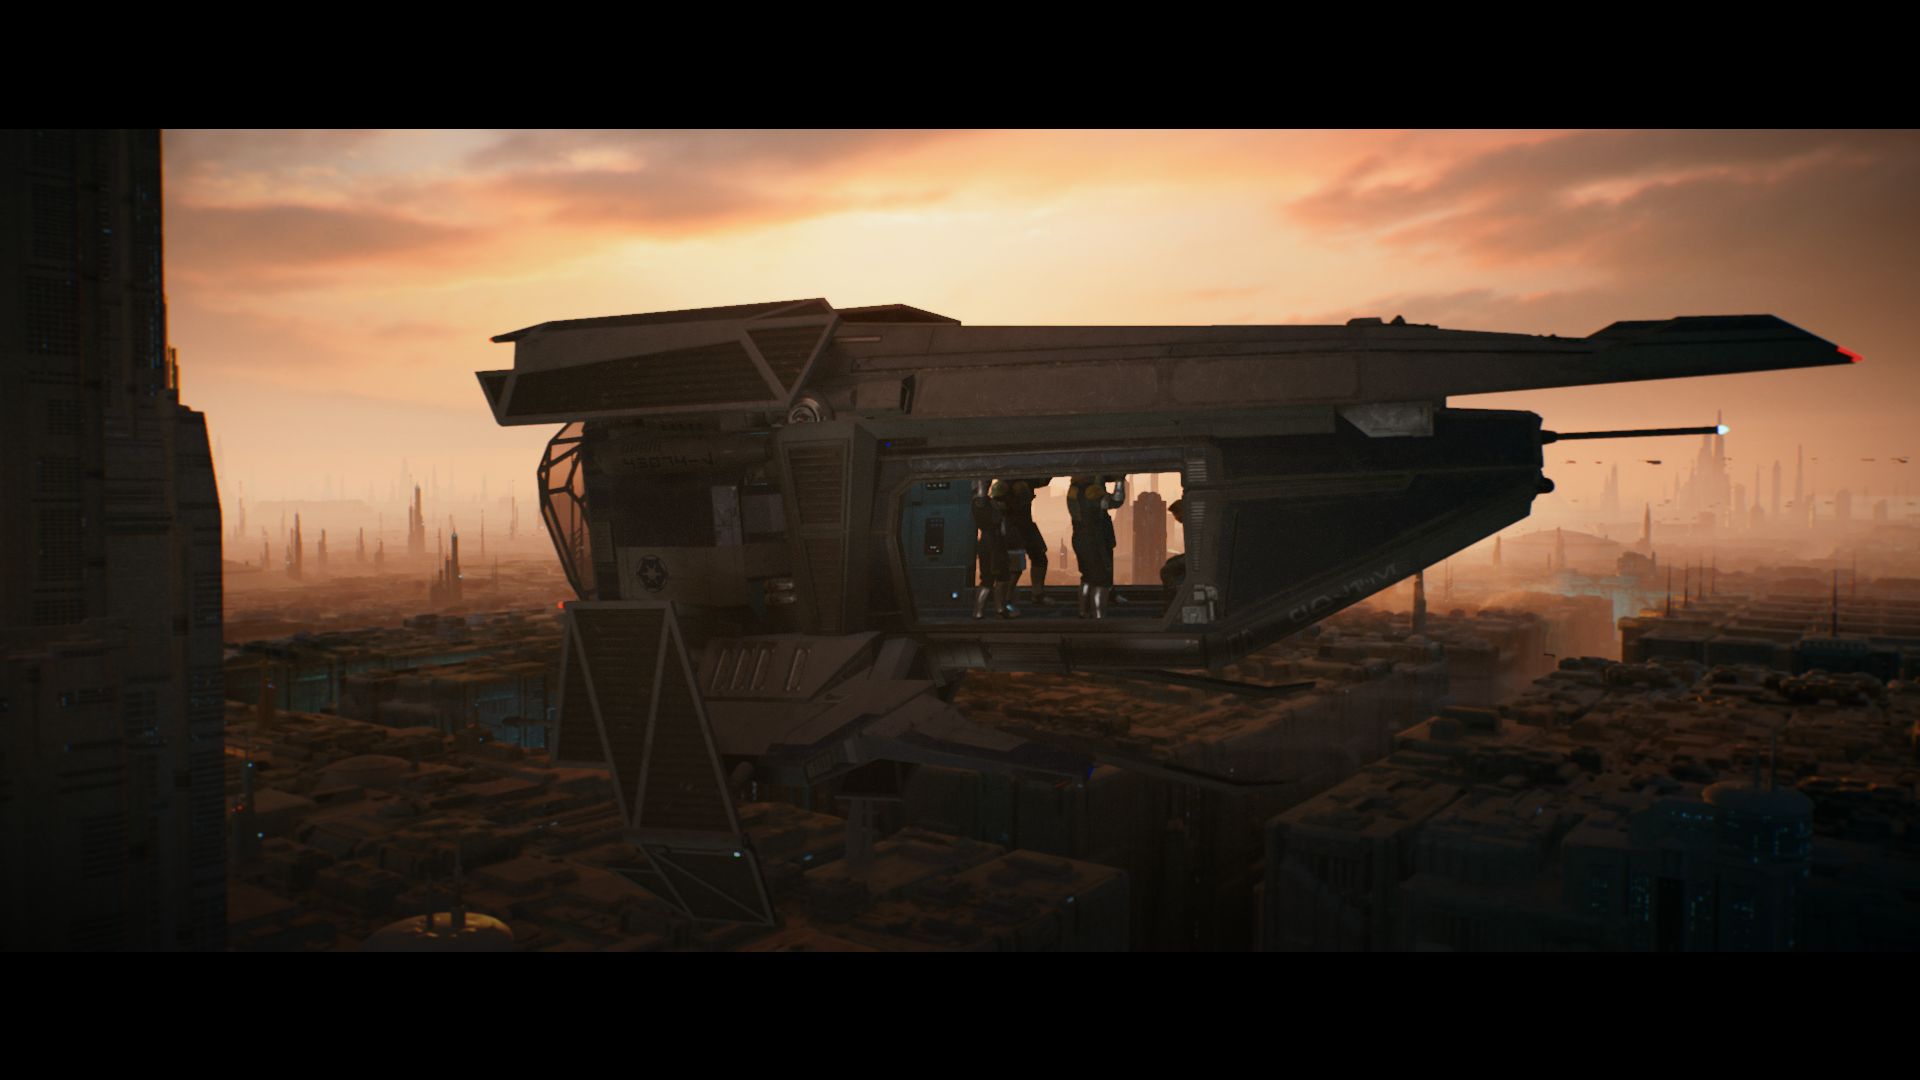
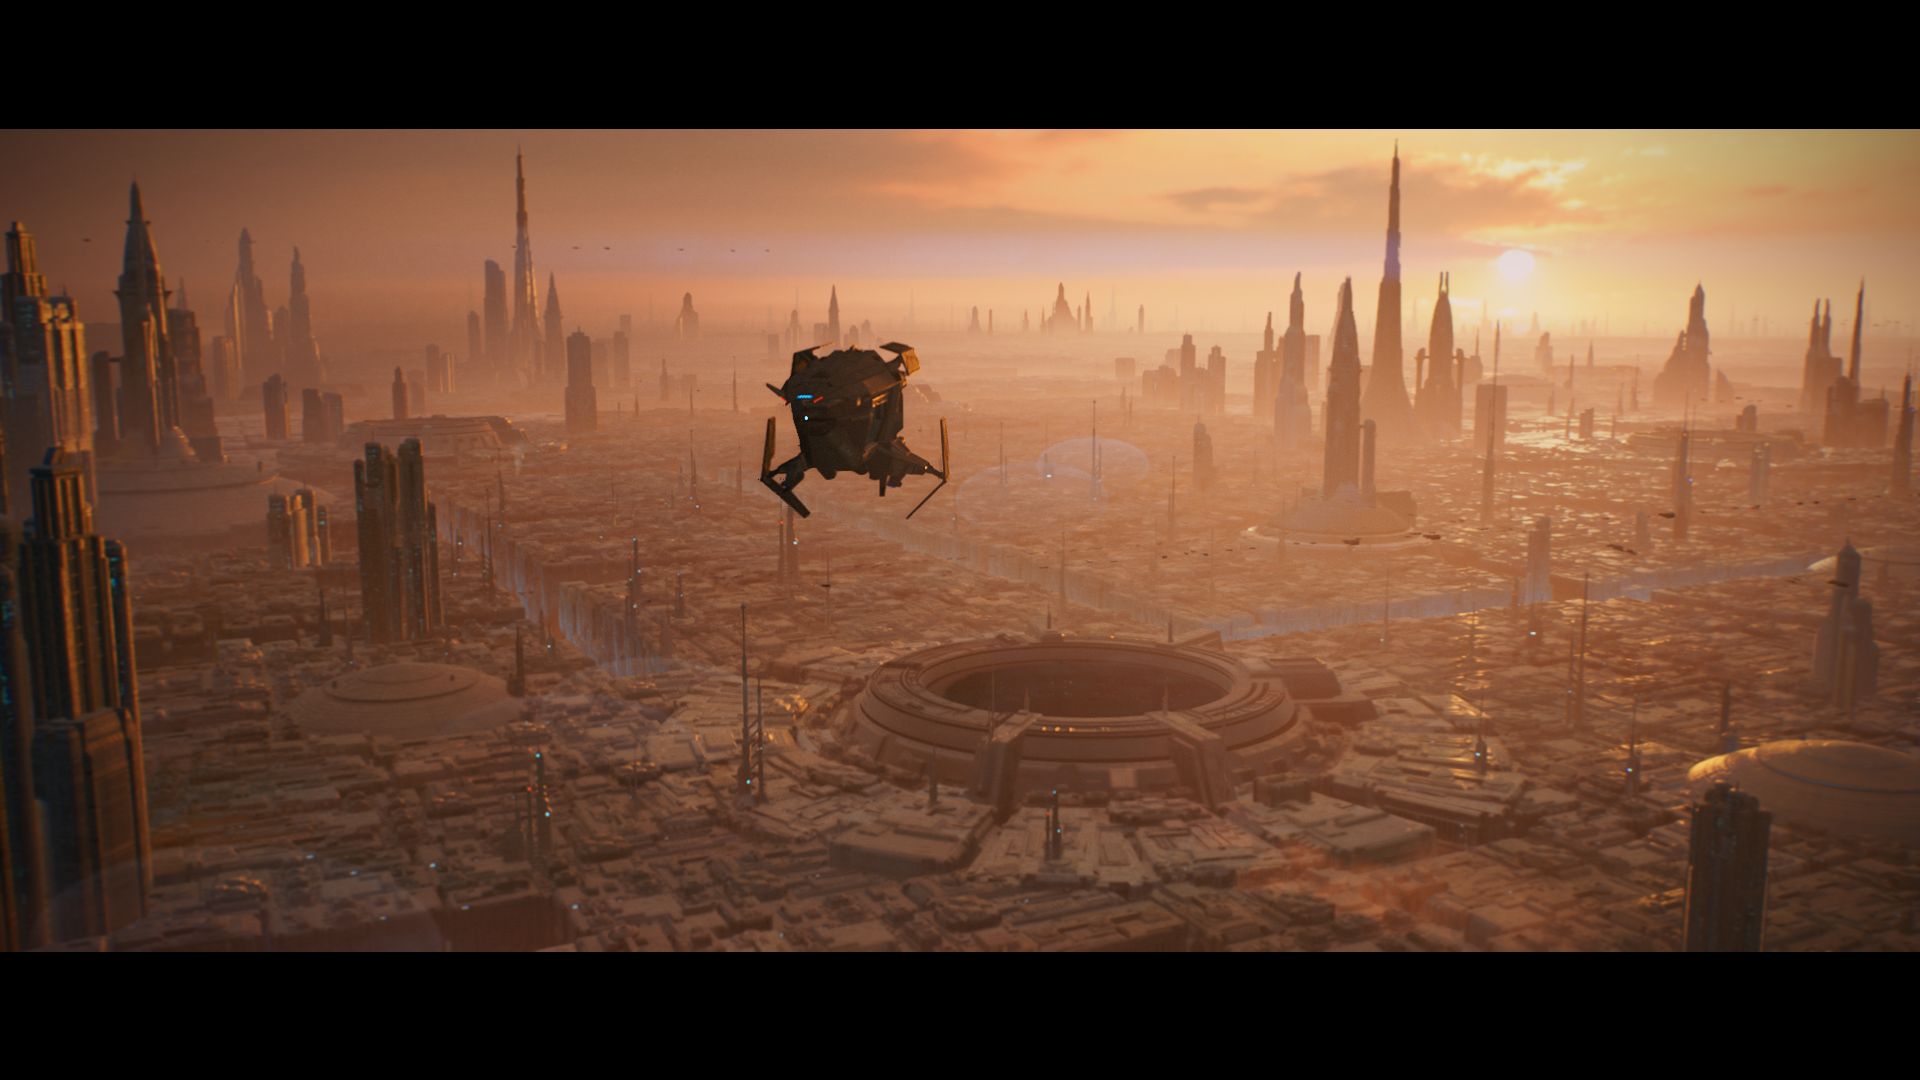
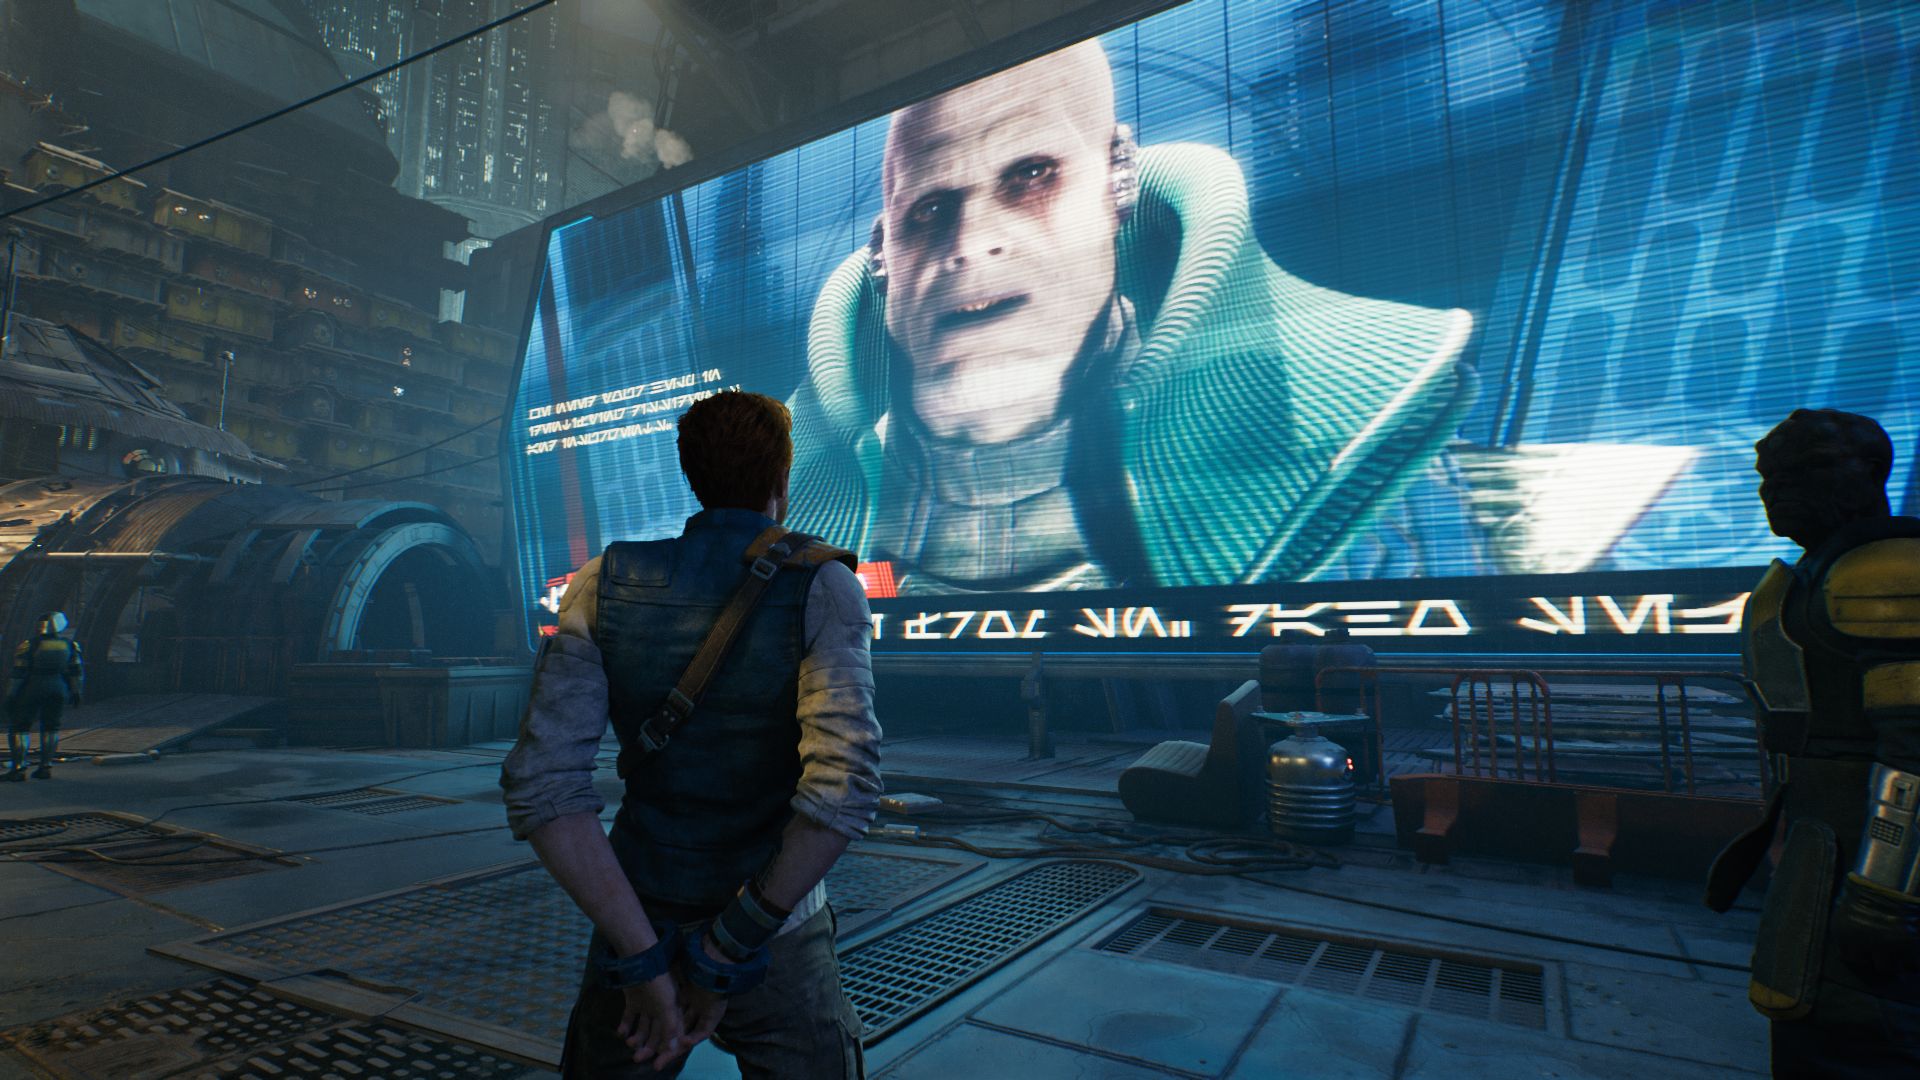
We used the beginning of the game for our speed measurements, where the handcuffed main character gets led to the local bad guy on Coruscant. Using the tool CapFrameX, we recorded a set route for 30 seconds. You can take a look at this sequence in the video below. 

Results


FHD (1,920 x 1,080)

Even using more powerful iGPUs such as the Radeon 680M, the game struggles with anything more than low settings and resolutions. You really shouldn't expect anything more than 1,920 x 1,080 pixels using the preset Low. Current mid-range GPUs, however, are able to manage Full HD relatively well. For example, an RTX 4050 with high TGP managed to run the game at over 60 fps using the preset high, and it managed around 50 fps using the preset Epic.

Star Wars Jedi Survivor
    1920x1080 Low Preset     1920x1080 Medium Preset     1920x1080 High Preset     1920x1080 Epic Preset
AMD Radeon RX 7900 XTX, i9-12900K
Desktop-PC
128.9 (22.9min, 61.9P0.1, 86.5P1) fps ∼75%
127.4 (22.4min, 51.1P0.1, 86.5P1) fps ∼76%
123.8 (26.2min, 43.5P0.1, 87.2P1) fps ∼69%
NVIDIA GeForce RTX 4080, i9-12900K
Desktop-PC
119 (33.3min, 48.6P0.1, 85.9P1) fps ∼69%
116.6 (19.7min, 50.4P0.1, 81.8P1) fps ∼70%
116 (24.9min, 42.6P0.1, 84.6P1) fps ∼64%
NVIDIA GeForce RTX 4090 Laptop GPU, i9-13900HX
XMG Neo 17 E23
113.9 (19.7min, 49P0.1, 76.1P1) fps ∼66%
108.6 (15.8min, 29.8P0.1, 67.4P1) fps ∼65%
108.4 (15.1min, 36.5P0.1, 71.1P1) fps ∼60%
NVIDIA GeForce RTX 4080 Laptop GPU, i9-13900HX
Schenker Key 17 Pro E23
108.7 (27.9min, 41.5P0.1, 78.7P1) fps ∼63%
105.7 (18.5min, 41.7P0.1, 77.1P1) fps ∼63%
102.2 (20.3min, 41.7P0.1, 73.4P1) fps ∼57%
NVIDIA GeForce RTX 4060 Laptop GPU, i9-13900HX
XMG Pro 15 E23
94.1 (26.5min, 41.6P0.1, 66.8P1) fps ∼55%
77.6 (12min, 25.9P0.1, 53.8P1) fps ∼47%
63 (19.4min, 26.6P0.1, 45.4P1) fps ∼35%
NVIDIA GeForce RTX 4050 Laptop GPU, i9-13900HX
XMG Focus 15 E23
85.8 (22.3min, 42.7P0.1, 62.8P1) fps ∼50%
65.9 (20.5min, 27.9P0.1, 44.5P1) fps ∼40%
52 (17.7min, 24.4P0.1, 37.2P1) fps ∼29%
AMD Radeon RX 6800S, R9 6900HS
Asus ROG Zephyrus G14
68.6 (18.4min, 28.2P0.1, 49P1) fps ∼73%
66 (16.7min, 28.7P0.1, 44.2P1) fps ∼38%
61.2 (14min, 23.8P0.1, 38.3P1) fps ∼37%
51.2 (12min, 17.8P0.1, 38.4P1) fps ∼28%
AMD Radeon 680M, R9 6900HS
Asus ROG Zephyrus G14
40.2 (18.4min, 19.4P0.1, 28.7P1) fps ∼43%
27.3 (14.2min, 14.5P0.1, 17.1P1) fps ∼16%
19.7 (10.1min, 11P0.1, 13.4P1) fps ∼12%
15.4 (8.22min, 8.38P0.1, 11P1) fps ∼9%

QHD (2,560 x 1,440)

Anyone wanting to play Jedi Survivor at 2,560 x 1,440 pixels and with maximum settings will definitely need at least a GeForce RTX 4060 or similar (again with high TGP).

Star Wars Jedi Survivor
    2560x1440 Epic Preset
AMD Radeon RX 7900 XTX, i9-12900K
Desktop-PC
112.4 (23.6min, 45.1P0.1, 79.7P1) fps ∼75%
NVIDIA GeForce RTX 4080, i9-12900K
Desktop-PC
101.9 (15.3min, 44P0.1, 74.3P1) fps ∼68%
NVIDIA GeForce RTX 4090 Laptop GPU, i9-13900HX
XMG Neo 17 E23
83 (18.6min, 40.3P0.1, 58.4P1) fps ∼55%
NVIDIA GeForce RTX 4080 Laptop GPU, i9-13900HX
Schenker Key 17 Pro E23
72.5 (20.5min, 35.8P0.1, 54.9P1) fps ∼48%
NVIDIA GeForce RTX 4060 Laptop GPU, i9-13900HX
XMG Pro 15 E23
39.7 (19.2min, 20.9P0.1, 30.5P1) fps ∼26%
NVIDIA GeForce RTX 4050 Laptop GPU, i9-13900HX
XMG Focus 15 E23
32.5 (12.3min, 17.6P0.1, 24.4P1) fps ∼22%

UHD (3,840 x 2,160)

The game becomes an absolute resource hog at 4K. You need at least a laptop with an RTX 4080 or an RTX 4090 to run the game at 3,840 x 2,160 pixels using the preset Epic while still maintaining decent frame rates - here, also assuming that you have the option of a high TGP setting.

Star Wars Jedi Survivor
    3840x2160 Epic Preset
AMD Radeon RX 7900 XTX, i9-12900K
Desktop-PC
56.6 (16.7min, 25.9P0.1, 45P1) fps ∼41%
NVIDIA GeForce RTX 4080, i9-12900K
Desktop-PC
54.3 (21.1min, 29.4P0.1, 41.3P1) fps ∼39%
NVIDIA GeForce RTX 4090 Laptop GPU, i9-13900HX
XMG Neo 17 E23
42.3 (7.45min, 12.9P0.1, 26.8P1) fps ∼31%
NVIDIA GeForce RTX 4080 Laptop GPU, i9-13900HX
Schenker Key 17 Pro E23
35.3 (16.4min, 23.2P0.1, 26.9P1) fps ∼26%
NVIDIA GeForce RTX 4060 Laptop GPU, i9-13900HX
XMG Pro 15 E23
19.2 (12.4min, 13.1P0.1, 15P1) fps ∼14%
NVIDIA GeForce RTX 4050 Laptop GPU, i9-13900HX
XMG Focus 15 E23
15.8 (10.6min, 10.9P0.1, 13.2P1) fps ∼11%

Ray tracing

Performance loss with activated ray tracing is neither low nor is it particularly steep. As long as you limit the resolution to 1,920 x 1,080 pixels, an RTX 4050 or an RTX 4060 will manage to run the game well enough. For better resolutions, we would recommend using FSR.

Star Wars Jedi Survivor
    1920x1080 Epic Preset + Ray Tracing
NVIDIA GeForce RTX 4080, i9-12900K
Desktop-PC
86.3 (22min, 30.3P0.1, 58.1P1) fps ∼70%
NVIDIA GeForce RTX 4090 Laptop GPU, i9-13900HX
XMG Neo 17 E23
80.5 (6.02min, 10.5P0.1, 33.2P1) fps ∼65%
AMD Radeon RX 7900 XTX, i9-12900K
Desktop-PC
79.3 (8.89min, 22.2P0.1, 52.8P1) fps ∼64%
NVIDIA GeForce RTX 4080 Laptop GPU, i9-13900HX
Schenker Key 17 Pro E23
76.9 (11.4min, 20.1P0.1, 50.9P1) fps ∼62%
NVIDIA GeForce RTX 4060 Laptop GPU, i9-13900HX
XMG Pro 15 E23
48.9 (11.8min, 14.6P0.1, 35.6P1) fps ∼39%
NVIDIA GeForce RTX 4050 Laptop GPU, i9-13900HX
XMG Focus 15 E23
41.3 (11min, 18.7P0.1, 29.6P1) fps ∼33%
AMD Radeon RX 6800S, R9 6900HS
Asus ROG Zephyrus G14
37.2 (9.11min, 9.76P0.1, 26.3P1) fps ∼30%

Note

Since gaming tests take a lot of time and are often limited by installation or activation limits, we can only deliver part of our benchmarks at the time of publishing. We will be adding more graphics cards in the coming days and weeks.

Overview

Show Restrictions
PosModel< PrevNext >Star Wars Jedi Survivor
 Star Wars Jedi Survivor (2023)
low
1920x1080
Low Preset
med.
1920x1080
Medium Preset
high
1920x1080
High Preset
ultra
1920x1080
Epic Preset
QHD
2560x1440
Epic Preset
4K
3840x2160
Epic Preset
NVIDIA GeForce RTX 4090
190n3
186.1n3
186n3
158.5n3
150.3n3
82.3n3
AMD Radeon RX 7900 XTX
186.2
155.65n2
151.45n2
146.3n2
117.75n2
59.05n2
NVIDIA GeForce RTX 4080 Super
188.65n2
184.05n2
173.95n2
169.7n2
117.35n2
57.95n2
NVIDIA GeForce RTX 4080
119
116.6
116
101.9
54.3
NVIDIA GeForce RTX 4070 Ti
145.5
139.9
138.2
128.4
87.4
42.9
AMD Radeon RX 7900 GRE
131.35n2
125n2
116.95n2
112.9n2
84.5n2
41.15n2
AMD Radeon RX 6950 XT
156
147.5
139.4
132.3
86.2
41.8
NVIDIA GeForce RTX 4090 Laptop GPU
131.2
120.75n2
107.3n4
108.4n5
84.4n5
42.3n5
NVIDIA GeForce RTX 3090
158.1
137.1
133.4
125.8
82.8
41.7
AMD Radeon RX 7800 XT
147.9
135.8
126.6
117.5
76
37.1
NVIDIA GeForce RTX 4080 Laptop GPU
108.7
105.7
102.2
72.5
35.3
NVIDIA GeForce RTX 4070
127.7
130.2
121.2
106.7
69.6
34.3
AMD Radeon RX 6800
128.9
113.7
104.1
97
62.1
29.9
AMD Radeon RX 7700 XT
129.9
115.6
107.5
101
62.3
30.3
NVIDIA Titan RTX
124.1
108.8
100.6
95.3
60
30.6
NVIDIA GeForce RTX 3070 Ti
123.7
109.1
96.4
100.5
61.1
30.3
NVIDIA GeForce RTX 4060 Ti 16G
113.6
98.3
91.7
85.3
53.5
25
NVIDIA GeForce RTX 4060 Ti 8G
114.2n3
98.6n3
91.3n3
84.7n3
54.2n3
25.4n3
NVIDIA GeForce RTX 3080 Ti Laptop GPU
84.1
79.4
75.8
49.5
24.8
PosModel< PrevNext >Star Wars Jedi Survivor
low med. high ultra QHD 4K
NVIDIA GeForce RTX 4070 Laptop GPU
84n5
78.3n6
75.6n7
72.05n8
45.85n8
24.2n3
AMD Radeon RX 6750 XT
107.8
94.7
87.5
82
51.7
24.8
AMD Radeon RX 6700 XT
99.6
88
82
76.3
48
22.6
NVIDIA GeForce RTX 3080 Laptop GPU
83.5
73
68.1
67.35n2
45.1
23.2
NVIDIA GeForce RTX 3060 Ti
100.7
82
87.4
78
49
23.8
Intel Arc A770
81.1
73.1
68.4
65.1
44
22.3
NVIDIA GeForce RTX 4060
85.1
74
69.3
65.4
40.8
19.3
AMD Radeon RX 7600
87.6
78.8
73.6
68.4
43
20.3
NVIDIA GeForce RTX 3070 Ti Laptop GPU
79.5
74.3
71.8
46
22.8
NVIDIA GeForce RTX 4060 Laptop GPU
76.1n4
69.1n5
65.4n8
60.85n10
38.25n10
18.8n2
AMD Radeon RX 6650 XT
82.4
73.8
69
63.9
39.1
18.7
NVIDIA GeForce RTX 3070 Laptop GPU
81.1
72.3
67.4
56.8n2
36.65n2
17.95n2
AMD Radeon RX 6800S
68.6
66
61.2
51.2
AMD Radeon RX 7600M XT
79.6
70.1
66
61.3
37.8
16.8
Intel Arc A750
75.9
67.2
63.3
58.9
39
19.5
Apple M3 Max 40-Core GPU
51
NVIDIA Titan X Pascal
67.7
60.3
56.2
52.7
34
17.3
NVIDIA GeForce RTX 2070 Super (Desktop)
87.1
74.4
69.7
65.6
41.6
20.2
AMD Radeon RX 5700 XT (Desktop)
76
65.7
60.8
57.3
36.5
18.7
AMD Radeon RX 7600S
61.2
57.5
53.8
33.7
15.5
PosModel< PrevNext >Star Wars Jedi Survivor
low med. high ultra QHD 4K
Intel Arc A580
66.3
59.6
55.9
52.8
32.7
16.5
NVIDIA GeForce RTX 2060 Super (Desktop)
72
62.2
57.1
54.2
33.7
16.8
AMD Radeon RX 6600
66.1
58
54.5
50.8
30.9
14.3
Apple M3 Pro 18-Core GPU
30
26
17
AMD Radeon RX 5700 (Desktop)
66.4
57.7
53.3
50.7
32.4
16.1
AMD Radeon RX 6600M
66.3n2
57.55n2
54.35n2
50.6n2
30.4n2
14.55n2
AMD Radeon RX 5600 XT (Desktop)
69.5
62.2
59.3
55.4
34.1
15.5
NVIDIA GeForce GTX 1660 Super (Desktop)
51.9
43.7
41.4
38.8
23.6
10.5
AMD Radeon RX 6500 XT
39.1
30.4
28.9
23.7
AMD Radeon RX 5500 XT (Desktop)
42.5
36.2
33.5
31.6
20.2
10.2
NVIDIA GeForce RTX 4050 Laptop GPU
63n3
58n5
56n7
50.7n7
31.75n4
15.8
Intel Arc A730M
47.35n2
42.55n2
39n2
36.45n2
11.6
NVIDIA GeForce GTX 1660 Ti Mobile
48.2
41.5
39.2
37
NVIDIA GeForce RTX 3050 Ti Laptop GPU
36.9
31
28.9
25.8
15.4
NVIDIA GeForce GTX 1660 (Desktop)
48.4
41
38.6
36.1
22.2
10.2
NVIDIA GeForce GTX 1650 Super (Desktop)
43.6
34.7
32.9
28.8
15.4
5.15
NVIDIA GeForce RTX 3050 4GB Laptop GPU
30.1n2
25.65n2
24.45n2
23.7n2
NVIDIA GeForce GTX 1060 Mobile
26.6
23.2
22.1
20.4
NVIDIA GeForce GTX 1650 Ti Mobile
31.8
26.2
24.2
23.7
Intel Arc A370M
23
19.7
19.2
17.7
PosModel< PrevNext >Star Wars Jedi Survivor
low med. high ultra QHD 4K
AMD Radeon RX 5500M
35.1
32.2
30.2
29.4
NVIDIA GeForce RTX 2050 Mobile
21.8
20.1
19.1
NVIDIA GeForce GTX 1650 Mobile
28.8
23.6
22.4
21.1
Intel Arc A380
26.1
22.8
21.6
20.4
AMD Radeon 780M
22.7
20
18.3
16.6
AMD Radeon 680M
40.2
27.3
19.7
15.4
NVIDIA GeForce GTX 1050 Mobile
15.6
13.8
13
12.3
AMD Radeon 660M
11.5
10.2
AMD Radeon RX 560X (Laptop)
15.7
13.5
12.2
NVIDIA GeForce MX350
9.32
AMD Radeon RX 550 (Laptop)
6.45
NVIDIA GeForce MX250
7.39
AMD Radeon RX Vega 10
7.29
AMD Radeon RX Vega 8 (Ryzen 4000/5000)
9.36
AMD Radeon RX Vega 6 (Ryzen 4000/5000)
7
AMD Radeon RX Vega 5
5.71
(-) * Smaller values are better. / n123 Number of benchmarks for this median value / * Approximate position


Legend
5Stutters – This game is very likely to stutter and have poor frame rates. Based on all known benchmarks using the specified graphical settings, average frame rates are expected to fall below 25fps
May Stutter – This graphics card has not been explicitly tested on this game. Based on interpolated information from surrounding graphics cards of similar performance levels, stutters and poor frame rates are expected.
30Fluent – Based on all known benchmarks using the specified graphical settings, this game should run at or above 25fps
40Fluent – Based on all known benchmarks using the specified graphical settings, this game should run at or above 35fps
60Fluent – Based on all known benchmarks using the specified graphical settings, this game should run at or above 58fps
May Run Fluently – This graphics card has not been explicitly tested on this game. Based on interpolated information from surrounding graphics cards of similar performance levels, fluent frame rates are expected.
?Uncertain – This graphics card experienced unexpected performance issues during testing for this game. A slower card may be able to achieve better and more consistent frame rates than this particular GPU running the same benchmark scene.
Uncertain – This graphics card has not been explicitly tested on this game and no reliable interpolation can be made based on the performances of surrounding cards of the same class or family.
The value in the fields displays the average frame rate of all values in the database. Move your cursor over the value to see individual results.

All test systems

Device Graphics card Processor RAM
Laptops
XMG Neo 17 E23 Nvidia GeForce RTX 4090 @175 W TGP (16 GB GDDR6X) Intel Core i9-13900HX 2 x 16 GB DDR5
Schenker Key 17 Pro E23 Nvidia GeForce RTX 4080 @175 W TGP (12 GB GDDR6X) Intel Core i9-13900HX 2 x 16 GB DDR5
XMG Pro 15 E23 Nvidia GeForce RTX 4060 @140 W TGP (8 GB GDDR6) Intel Core i9-13900HX 2 x 16 GB DDR5
XMG Focus 15 E23 Nvidia GeForce RTX 4050 @140 W TGP (6 GB GDDR6) Intel Core i9-13900HX 2 x 16 GB DDR5
Asus ROG Zephyrus G14 AMD Radeon RX 6800S (8 GB GDDR6) & AMD Radeon 680M AMD Ryzen 9 6900HS 2 x 16 GB DDR5
Tower PCs
Custom I Nvidia GeForce RTX 4080 (16 GB GDDR6X)
AMD Radeon RX 7900 XTX (24 GB GDDR6)
Intel Core i9-12900K 2 x 16 GB DDR4
Custom II Palit GeForce RTX 4090 GameRock OC (24 GB GDDR6X)
Nvidia GeForce RTX 3090 FE (24 GB GDDR6X)
Nvidia GeForce RTX 3060 Ti (8 GB GDDR6X)
Nvidia Titan RTX (24 GB GDDR6)
lNvidia GeForce RTX 2070 Super (8 GB GDDR6)
Nvidia GeForce RTX 2060 Super (8 GB GDDR6)
KFA2 GeForce GTX 1660 Super (6 GB GDDR6)
PNY GeForce GTX 1660 (6 GB GDDR5)
KFA2 GeForce GTX 1650 Super (4 GB GDDR6)
AMD Radeon RX 6950 XT (16 GB DDR6)
AMD Radeon RX 6800 (16 GB DDR6)
AMD Radeon RX 6700 XT (12 GB DDR6)
AMD Radeon RX 6650 XT (8 GB GDDR6)
AMD Radeon RX 6600 (8 GB GDDR6)
AMD Radeon RX 5700 XT (8 GB GDDR6)
AMD Radeon RX 5700 (8 GB GDDR6)
AMD Radeon RX 5600 XT (6 GB GDDR6)
AMD Radeon RX 5500 XT (8 GB GDDR6)
AMD Ryzen 9 7950X 2 x 16 GB DDR5
Mini PCs
Minisforum NUCXi7 Nvidia GeForce RTX 3070 @125 W TGP (8 GB GDDR6) Intel Core i7-11800H 2 x 8 GB DDR4
Minisforum HX99G AMD Radeon RX 6600M @100 W TGP (8 GB GDDR6) AMD Ryzen 9 6900HX 2 x 16 GB DDR5
Morefine S500+ AMD Radeon RX Vega 8 AMD Ryzen 9 5900HX 2 x 16 GB DDR4
Zotac ZBOX CI665 Nano Intel Iris Xe Graphics G7 (96 CUs) Intel Core i7-1165G7 2 x 8 GB DDR4
4K monitors Operating system Nvidia driver AMD driver
Philips Brilliance 329P9H, Gigabyte M32U Windows 11 ForceWare 531.79 Adrenalin 23.4.3
Read all 1 comments / answer
static version load dynamic
Loading Comments
Comment on this article
Please share our article, every link counts!
> Expert Reviews and News on Laptops, Smartphones and Tech Innovations > Reviews > Star Wars Jedi Survivor review: Laptop and desktop benchmarks
Florian Glaser, 2023-05- 5 (Update: 2023-05- 6)