Notebookcheck Logo

NVIDIA GeForce GTX 1650 Super (Desktop) graphics card review

With the GeForce GTX 1650 Super, there's an inexpensive Turing GPU from Nvidia that is equipped with the TU116 graphics chip. The power consumption is 100 watts, which makes operation without an additional power supply impossible. You can find out how well the GeForce GTX 1650 Super does against an AMD Radeon RX 5500 XT in this short review.
GPU-Z
GPU-Z

Nvidia's cheapest Turing graphics card is still named GeForce GTX 1650, but the GeForce GTX 1650 Super is now another inexpensive entry-level model. The biggest changes compared with the non-Super version of the GTX 1650 are in the installed graphics chip and VRAM. We're already familiar with the graphics chip from the GeForce GTX 1660 or the GeForce GTX 1660 Ti, although the number of shaders is a bit lower in the GeForce GTX 1650 Super at 1,280. In terms of VRAM, the faster GDDR6 is now also available, but it still only has 4 GB. Nevertheless, the GeForce GTX 1650 Super has no problem surpassing the GeForce GTX 1650 in terms of performance.

Due to its compactness, the graphics card is suitable for small cases. Power consumption is specified at 100 watts, which closes the gap between the GeForce GTX 1650 and the GeForce GTX 1660. The KFA2 model that we tested has a 6-pin power connector internally and offers one DVI-D, one DisplayPort 1.4, and one HDMI 2.0b port externally. The manufacturer's warranty is two years with KFA2.

KFA2 GeForce GTX 1650 Super

NVIDIA GeForce GTX 1650 Super (Desktop)

The Nvidia GeForce GTX 1650 Super for desktops is an entry-level gaming graphics card based on the Turing architecture. The chip, which has been named TU116, was introduced in November 2019. The GTX 1650 series does not offer ray tracing and tensor cores, unlike the more powerful RTX 2000 cards (e.g. RTX 2060). Performance is slightly better than with the GeForce GTX 1650 and comparable with the AMD Radeon RX 5500 XT.

There have also been significant improvements in the Turing architecture in terms of the CUDA cores. Float and INT operations can now be executed simultaneously, the cache has been unified and improved, and Adaptive Shading has been introduced. As a result, Nvidia speaks of an up to 50% higher performance per core compared to Pascal.

The new entry-level card benefits from the advantages of the TU116 chip, since the newer NVENC video encoding delivers more performance compared to Pascal.

Nvidia specifies a power consumption of 100 watts TGP (Total Graphics Power) for the graphics card. The TU11 chip is manufactured by TSMC in a 12 nm FFN process.

GeForce GTX 1600 Series

GeForce GTX 1660 Ti (Desktop) compare 1536 @ 1.5 - 1.77 GHz192 Bit @ 12000 MHz
GeForce GTX 1660 Super (Desktop) compare 1408 @ 1.53 - 1.79 GHz192 Bit @ 14000 MHz
GeForce GTX 1660 Ti Mobile compare 1536 @ 1.46 - 1.59 GHz192 Bit @ 12000 MHz
GeForce GTX 1660 (Desktop) compare 1408 @ 1.53 - 1.79 GHz192 Bit @ 8000 MHz
GeForce GTX 1650 Super (Desktop) 1280 @ 1.53 GHz192 Bit @ 14000 MHz
GeForce GTX 1660 Ti Max-Q compare 1536 @ 1.14 - 1.34 GHz192 Bit @ 12000 MHz
GeForce GTX 1650 Ti Mobile compare 1024 @ 1.35 - 1.49 GHz128 Bit @ 12000 MHz
GeForce GTX 1650 (Desktop) compare 896 @ 1.49 - 1.67 GHz128 Bit @ 8000 MHz
GeForce GTX 1650 Mobile compare 1024 @ 1.38 - 1.56 GHz128 Bit @ 12000 MHz
GeForce GTX 1650 Ti Max-Q compare 1024 @ 1.04 - 1.2 GHz128 Bit @ 10000 MHz
GeForce GTX 1650 Max-Q compare 1024 @ 1.02 - 1.25 GHz128 Bit @ 8000 MHz
ArchitectureTuring
Pipelines1280 - unified
Core Speed1530 MHz
Shader Speed1785 MHz
Memory Speed14000 MHz
Memory Bus Width192 Bit
Memory TypeGDDR6
Max. Amount of Memory4 GB
Shared Memoryno
APIDirectX 12_1, Shader 6.5, OpenGL 4.6
Power Consumption125 Watt
technology12 nm
Date of Announcement29.10.2019
v1.33
log 11. 10:05:53

#0 ran 0s before starting gpusingle class +0s ... 0s

#1 no ids found in url (should be separated by "_") +0s ... 0s

#2 not redirecting to Ajax server +0s ... 0s

#3 did not recreate cache, as it is less than 5 days old! Created at Thu, 10 Jul 2025 05:37:28 +0200 +0.001s ... 0.001s

#4 start showIntegratedCPUs +0.024s ... 0.025s

#5 return log +0.011s ... 0.036s

Our test system based on the AMD Ryzen 9 5900X

A current AMD platform based on the Asus X570 ROG Crosshair VIII Hero Wi-Fi serves as the test system. The CPU (AMD Ryzen 9 5900X) offers good CPU performance, and we use an AIO (Alphacool Eisbaer Aurora 360 mm) for cooling. The 32 GB of RAM comes from Corsair and clocks at 4,000 MHz. We use the Acer Predator XB321HK as a monitor. It doesn't limit us due to its UHD capability. At this point, we would like to thank AMD for providing the test platform and Corsair for the RAM kit.

AMD Ryzen 9 5900X
AMD Ryzen 9 5900X
Asus X570 ROG Crosshair VIII Hero
Corsair Vengeance RGB Pro DDR4-4000 2x 16 GB

For the upcoming benchmarks and tests, we use the following system:

  • Lian Li O11 Dynamic
  • AMD Ryzen 9 5900X
  • KFA2 GeForce GTX 1650 Super (Nvidia driver 460.79)
  • Asus X570 ROG Crosshair VIII Hero Wi-Fi (BIOS 2402, default settings, XMP 1 for DDR4-4000)
  • Corsair RM1000X 1,000-watt power supply
  • Corsair Vengeance RGB Pro DDR4-4000 RAM kit 2x 16 GB
  • Corsair MP600 2 TB M.2 PCIe 4.0 SSD
  • Crucial MX500 2 TB (for games)

Synthetic benchmarks

As you could already guess, our KFA2 GeForce GTX 1650 Super ranks with a clear lead over the GeForce GTX 1650. However, a respectable gap to the GTX 1660 remains. At the same time, we also used an AMD Radeon RX 5500 XT for comparison, since it's part of the same performance class. The GTX 1650 Super is unable to outperform its AMD counterpart in most benchmarks. Nevertheless, it remains to be seen whether the result shown here will also be carried over to the gaming tests. 

3DMark
1920x1080 Fire Strike Graphics
KFA 2 GeForce GTX 1660 Super
15563 Points +33%
Sapphire AMD Radeon RX 5500 XT
14328 Points +23%
PNY GeForce GTX 1660
13569 Points +16%
KFA2 GeForce GTX 1650 Super EX One Click OC
11688 Points
KFA2 GeForce GTX 1650 EX One Click Plus
9203 Points -21%
Fire Strike Extreme Graphics
KFA 2 GeForce GTX 1660 Super
7179 Points +40%
Sapphire AMD Radeon RX 5500 XT
6843 Points +33%
PNY GeForce GTX 1660
6247 Points +22%
KFA2 GeForce GTX 1650 Super EX One Click OC
5135 Points
KFA2 GeForce GTX 1650 EX One Click Plus
4152 Points -19%
2560x1440 Time Spy Graphics
KFA 2 GeForce GTX 1660 Super
5958 Points +29%
PNY GeForce GTX 1660
5422 Points +17%
Sapphire AMD Radeon RX 5500 XT
4891 Points +6%
KFA2 GeForce GTX 1650 Super EX One Click OC
4632 Points
KFA2 GeForce GTX 1650 EX One Click Plus
3538 Points -24%
Unigine Superposition
1280x720 720p Low
Sapphire AMD Radeon RX 5500 XT
22914 Points +3%
KFA2 GeForce GTX 1650 Super EX One Click OC
22323 Points
1920x1080 1080p High
Sapphire AMD Radeon RX 5500 XT
6637 Points +3%
KFA2 GeForce GTX 1650 Super EX One Click OC
6468 Points
1920x1080 1080p Extreme
Sapphire AMD Radeon RX 5500 XT
2721 Points +18%
KFA2 GeForce GTX 1650 Super EX One Click OC
2305 Points
3840x2160 4k Optimized
Sapphire AMD Radeon RX 5500 XT
3905 Points +5%
KFA2 GeForce GTX 1650 Super EX One Click OC
3724 Points
7680x4320 8k Optimized
Sapphire AMD Radeon RX 5500 XT
1597 Points +47%
KFA2 GeForce GTX 1650 Super EX One Click OC
1087 Points
Unigine Heaven 4.0
Extreme Preset OpenGL
KFA2 GeForce GTX 1650 Super EX One Click OC
68.9 fps
Sapphire AMD Radeon RX 5500 XT
63.6 fps -8%
Extreme Preset DX11
Sapphire AMD Radeon RX 5500 XT
73 fps +2%
KFA2 GeForce GTX 1650 Super EX One Click OC
71.9 fps
Unigine Valley 1.0
1920x1080 Extreme HD DirectX AA:x8
Sapphire AMD Radeon RX 5500 XT
60.9 fps +13%
KFA2 GeForce GTX 1650 Super EX One Click OC
54.1 fps
1920x1080 Extreme HD Preset OpenGL AA:x8
Sapphire AMD Radeon RX 5500 XT
51.2 fps 0%
KFA2 GeForce GTX 1650 Super EX One Click OC
51.1 fps
SiSoft Sandra 2016
GP Financial Analysis (FP High/Double Precision)
Sapphire AMD Radeon RX 5500 XT
87.5 KOPT/s +42%
KFA2 GeForce GTX 1650 Super EX One Click OC
61.8 KOPT/s
GP Cryptography (Higher Security AES256+SHA2-512)
KFA2 GeForce GTX 1650 Super EX One Click OC
44.21 GB/s
Sapphire AMD Radeon RX 5500 XT
42.08 GB/s -5%
Image Processing
Sapphire AMD Radeon RX 5500 XT
1100 MPix/s +86%
KFA2 GeForce GTX 1650 Super EX One Click OC
592 MPix/s
3DMark 11 - 1280x720 Performance GPU
Sapphire AMD Radeon RX 5500 XT
19723 Points +10%
KFA2 GeForce GTX 1650 Super EX One Click OC
17849 Points

Gaming benchmarks

The Witcher 3 frame times (Ultra preset)
The Witcher 3 frame rates (Ultra preset)

In our gaming benchmarks, the KFA2 GeForce GTX 1650 Super does well, and with a few exceptions, the graphics card masters almost all games in 1080p and maximum details. However, our test sample has to admit defeat against the AMD Radeon RX 5500 XT. The performance gain compared with a GeForce GTX 1650 is clearly noticeable, but it also varies from game to game.

We used The Witcher 3 with the Ultra preset for the frame rates and frame times. It's noticeable here that the FPS can't be kept constant. Nevertheless, we have to say that it's not a noticeable performance drop. There are a few outliers in the recorded frame times now and then, although the smooth gameplay is not significantly affected by this.

The Witcher 3 - 1920x1080 Ultra Graphics & Postprocessing (HBAO+)
KFA 2 GeForce GTX 1660 Super
59.5 (53min - 68max) fps +36%
Sapphire AMD Radeon RX 5500 XT
58.3 fps +34%
PNY GeForce GTX 1660
55.5 (50min - 63max) fps +27%
KFA2 GeForce GTX 1650 Super EX One Click OC
43.6 fps
KFA2 GeForce GTX 1650 EX One Click Plus
40.4 (35min - 46max) fps -7%
Far Cry 5 - 1920x1080 Ultra Preset AA:T
KFA 2 GeForce GTX 1660 Super
92 (83min - 104max) fps +23%
Sapphire AMD Radeon RX 5500 XT
88 (77min - 107max) fps +17%
PNY GeForce GTX 1660
82 (73min - 93max) fps +9%
KFA2 GeForce GTX 1650 Super EX One Click OC
75 (66min - 87max) fps
KFA2 GeForce GTX 1650 EX One Click Plus
59 (52min - 68max) fps -21%
Far Cry New Dawn - 1920x1080 Ultra Preset
KFA 2 GeForce GTX 1660 Super
87 (69min - 108max) fps +23%
PNY GeForce GTX 1660
80 (64min - 96max) fps +13%
Sapphire AMD Radeon RX 5500 XT
79 (62min - 102max) fps +11%
KFA2 GeForce GTX 1650 Super EX One Click OC
71 (55min - 86max) fps
KFA2 GeForce GTX 1650 EX One Click Plus
58 (47min - 70max) fps -18%
Anno 1800 - 1920x1080 Ultra Graphics Quality (DX11)
KFA 2 GeForce GTX 1660 Super
40.6 (36min - 45max) fps +31%
PNY GeForce GTX 1660
34.9 (32min - 40max) fps +13%
Sapphire AMD Radeon RX 5500 XT
33.6 fps +8%
KFA2 GeForce GTX 1650 Super EX One Click OC
31 fps
Crysis Remastered - 1920x1080 Very High Preset AA:SM
KFA 2 GeForce GTX 1660 Super
45.6 (33.6min, 35.4P0.1, 37.1P1 - 67max) fps +38%
PNY GeForce GTX 1660
40.8 (32.2min, 32.5P0.1, 34P1 - 58.7max) fps +24%
Sapphire AMD Radeon RX 5500 XT
37.5 fps +14%
KFA2 GeForce GTX 1650 Super EX One Click OC
33 fps
KFA2 GeForce GTX 1650 EX One Click Plus
27.6 (22.5min, 22.7P0.1, 23.3P1 - 41.4max) fps -16%
Dirt 5 - 1920x1080 Ultra High Preset
Sapphire AMD Radeon RX 5500 XT
53.1 (27.2min, 41P0.1, 43.1P1 - 66.5max) fps +15%
PNY GeForce GTX 1660
50 (32.9min, 38.2P0.1, 42.8P1 - 60.2max) fps +8%
KFA2 GeForce GTX 1650 Super EX One Click OC
46.3 (35.4min, 36.8P0.1, 39.2P1 - 56.1max) fps
KFA2 GeForce GTX 1650 EX One Click Plus
34.2 (25.1min, 25.9P0.1, 29P1 - 41.2max) fps -26%
Call of Duty Black Ops Cold War - 1920x1080 Highest Settings
KFA 2 GeForce GTX 1660 Super
57.2 (23min, 25.4P0.1, 33P1 - 220max) fps +55%
PNY GeForce GTX 1660
52.5 (17.8min, 27.2P0.1, 39P1 - 194max) fps +42%
Sapphire AMD Radeon RX 5500 XT
49.6 fps +34%
KFA2 GeForce GTX 1650 Super EX One Click OC
37 fps
KFA2 GeForce GTX 1650 EX One Click Plus
35.6 (26.2min, 26.6P0.1, 27.9P1 - 62.8max) fps -4%
Cyberpunk 2077 1.0 - 1920x1080 Ultra Preset
KFA 2 GeForce GTX 1660 Super
39.2 (6.1min, 22P0.1, 32.7P1 - 135max) fps +31%
PNY GeForce GTX 1660
36.6 (6.64min, 20.8P0.1, 30.6P1 - 183max) fps +22%
Sapphire AMD Radeon RX 5500 XT
32.5 fps +8%
KFA2 GeForce GTX 1650 Super EX One Click OC
30 fps
KFA2 GeForce GTX 1650 EX One Click Plus
23.7 (6.33min, 11.5P0.1, 19.6P1 - 58.8max) fps -21%
F1 2020 - 1920x1080 Ultra High Preset AA:T AF:16x
KFA 2 GeForce GTX 1660 Super
94.3 (78min - 111max) fps +26%
PNY GeForce GTX 1660
89.8 (73min - 106max) fps +20%
Sapphire AMD Radeon RX 5500 XT
88 (64min - 111max) fps +17%
KFA2 GeForce GTX 1650 Super EX One Click OC
75 (61min - 91max) fps
KFA2 GeForce GTX 1650 EX One Click Plus
60.3 (49min - 72max) fps -20%
Death Stranding - 1920x1080 Very High Preset
KFA 2 GeForce GTX 1660 Super
84.3 (75.2P1) fps +26%
Sapphire AMD Radeon RX 5500 XT
80.2 fps +20%
PNY GeForce GTX 1660
77.6 (69P1) fps +16%
KFA2 GeForce GTX 1650 Super EX One Click OC
67 fps
KFA2 GeForce GTX 1650 EX One Click Plus
52.7 (25.1P1) fps -21%
Mafia Definitive Edition - 1920x1080 High Preset
KFA 2 GeForce GTX 1660 Super
72.5 fps +25%
PNY GeForce GTX 1660
64.9 fps +12%
Sapphire AMD Radeon RX 5500 XT
59.9 fps +3%
KFA2 GeForce GTX 1650 Super EX One Click OC
58 fps
KFA2 GeForce GTX 1650 EX One Click Plus
45.2 fps -22%
Watch Dogs Legion - 1920x1080 Ultra Preset (DX12)
Sapphire AMD Radeon RX 5500 XT
35.8 (21.71min, 27.9P1 - 52.79max) fps +71%
KFA 2 GeForce GTX 1660 Super
31.4 (16.64min, 21.23P1 - 82max) fps +50%
PNY GeForce GTX 1660
29.4 (15.39min, 18.11P1 - 75.52max) fps +41%
KFA2 GeForce GTX 1650 EX One Click Plus
21.2 (11.04min, 15.31P1 - 67.16max) fps +1%
KFA2 GeForce GTX 1650 Super EX One Click OC
20.9 (10.71min, 12.73P1 - 75.52max) fps
Horizon Zero Dawn - 1920x1080 Ultimate Quality
KFA 2 GeForce GTX 1660 Super
57 (21min - 116max) fps +6%
Sapphire AMD Radeon RX 5500 XT
57 (38min - 108max) fps +6%
PNY GeForce GTX 1660
54 fps 0%
KFA2 GeForce GTX 1650 Super EX One Click OC
54 (35min - 8339max) fps
KFA2 GeForce GTX 1650 EX One Click Plus
36 (23min - 62max) fps -33%
Shadow of the Tomb Raider - 1920x1080 Highest Preset AA:T
KFA 2 GeForce GTX 1660 Super
80 fps +27%
PNY GeForce GTX 1660
72 fps +14%
Sapphire AMD Radeon RX 5500 XT
65 fps +3%
KFA2 GeForce GTX 1650 Super EX One Click OC
63 fps
Yakuza Like a Dragon - 1920x1080 Ultra Preset
KFA 2 GeForce GTX 1660 Super
64.7 (28min, 36P0.1, 43.3P1 - 121max) fps +22%
PNY GeForce GTX 1660
59 (15.9min, 31.2P0.1, 39P1 - 112max) fps +11%
Sapphire AMD Radeon RX 5500 XT
55.3 fps +4%
KFA2 GeForce GTX 1650 Super EX One Click OC
53 fps
KFA2 GeForce GTX 1650 EX One Click Plus
40.6 (24min, 24.2P0.1, 25.6P1 - 83.3max) fps -23%
lowmed.highultraQHD4K
GTA V (2015) 187 185 132 62.9 44.1 44
The Witcher 3 (2015) 206.8 130.7 80.3 43.6 29.5
Dota 2 Reborn (2015) 182.8 166.7 156.8 141.1 78.3
Rise of the Tomb Raider (2016) 250 147 86 67 30
Final Fantasy XV Benchmark (2018) 126 67.8 47.3 34.2 19
X-Plane 11.11 (2018) 149 138 106 87.8
Far Cry 5 (2018) 156 89 81 75 52 27
Monster Hunter World (2018) 206 95 77 49 35 24
Strange Brigade (2018) 258 114 94.4 80.7 59.1 32.9
Shadow of the Tomb Raider (2018) 181 86 73 63 40 19
Battlefield V (2018) 121 72 58 57 42 24
Apex Legends (2019) 142 69 82 81 61 32
Far Cry New Dawn (2019) 135 83 78 71 52 28
Metro Exodus (2019) 135 64.4 47 36.6 28.5 16.1
The Division 2 (2019) 104 83 66 49 33 16
Anno 1800 (2019) 165 110 60 31 21 13
Control (2019) 171 62 45 28 13
Borderlands 3 (2019) 161 81.5 52.8 39.8 23.3 7.87
Star Wars Jedi Fallen Order (2019) 84.2 73.7 65.6 44.3 21
Red Dead Redemption 2 (2019) 129 71 45 14 11
Doom Eternal (2020) 235 115 96
F1 2020 (2020) 257 134 108 75 55 31
Death Stranding (2020) 116 84 68 67 46 22
Horizon Zero Dawn (2020) 125 74 62 54 39 9
Crysis Remastered (2020) 161 72 41 33 22 13
Serious Sam 4 (2020) 138.9 71.7 53.2 24.3 21.1 15.4
Mafia Definitive Edition (2020) 120 61 58 38 20
Star Wars Squadrons (2020) 257.9 139 128.1 118.5 83.7 31.2
FIFA 21 (2020) 180.9 180.2 179.9 176.7 163.5 109.5
Watch Dogs Legion (2020) 110 71.3 60.6 20.9 14.3 8.09
Dirt 5 (2020) 139 69.1 54 46.3 35.6 21
Assassin´s Creed Valhalla (2020) 88 53 26 15 13 5
Call of Duty Black Ops Cold War (2020) 126 77 56 37 26 2
Yakuza Like a Dragon (2020) 107 61.8 59.1 53 34.3 16.7
Immortals Fenyx Rising (2020) 116 82 67 59 48 34
Cyberpunk 2077 1.0 (2020) 78 44 36 30 18 7
Hitman 3 (2021) 185 105 87 79 51 25
Outriders (2021) 168 89.5 70.3 55.4 36.6 29.5
Resident Evil Village (2021) 234 100 90.1 77.7 50.6 20.9
Mass Effect Legendary Edition (2021) 111 109 89.3 45.4
Days Gone (2021) 143 82.2 72 52.1 36.8 20
Monster Hunter Stories 2 (2021) 144 144 143 118 70.9
F1 2021 (2021) 308 157 127 80.9 57.7 32.1
Deathloop (2021) 105 62.8 49.6 3.03 24.9
New World (2021) 136 66.6 60.8 47.2 33.7 21.2
Alan Wake Remastered (2021) 91.9 86.4 84 54.8
Far Cry 6 (2021) 145 80 69 59 6
Back 4 Blood (2021) 128 113 102 63.7 30
Guardians of the Galaxy (2021) 98 67 67 65 31 15
Riders Republic (2021) 130 75 58 51 34
Call of Duty Vanguard (2021) 85.7 63.1 74.6 63.7 53.6 38.9
Forza Horizon 5 (2021) 180 88 77 31 26 18
Battlefield 2042 (2021) 133 74.2 62.2 20.1 4.87
Farming Simulator 22 (2021) 294 136 102 79.4 58.6 34.8
Halo Infinite (2021) 73.4 71.3 68.9 63.6 36.3
God of War (2022) 66.1 53.4 42.3 27.2 19.3 5.08
Rainbow Six Extraction (2022) 99 91 88 68 31 17
Dying Light 2 (2022) 69.1 34.8 28.2 18.5 8.62
GRID Legends (2022) 170 116 96 66 50 25
Elden Ring (2022) 58.9 52.2 45 37.2 27.6 14.4
Cyberpunk 2077 1.6 (2022) 67.4 53.3 41.1 32.1 18.5 3.3
Elex 2 (2022) 60.9 54.8 47.1 25.9 9.86
Ghostwire Tokyo (2022) 73.3 76.8 75.8 75.2 45.1 15.1
Tiny Tina's Wonderlands (2022) 99.2 79.9 49.8 35.2 22.1 10.8
Vampire Bloodhunt (2022) 193.7 104.3 100.8 95.8 53.1 20.9

Emissions of the KFA2 GeForce GTX 1650

If you decide to buy a GeForce GTX 1650 Super, you will probably mainly look at the graphics card's power consumption. The model is quite efficient at 100 watts, despite the fact that the non-Super model only requires 75 watts. This is also reflected in our measurement results. Our test system only needs 87 watts in idle usage. In the stress test, this value increases to 229 watts, which is, however, significantly lower compared to the test system with the AMD Radeon RX 5500 XT.

Power consumption while gaming is even a bit higher at 241 watts, but it can still be classified as low in comparison. In contrast to the GeForce GTX 1650, power consumption is almost 40 watts higher. Nevertheless, the KFA2 GeForce GTX 1650 Super is an energy-efficient graphics card for small systems. There's no cause for concern in terms of temperatures, as our test sample only reached 70 °C (~158 °F) in the stress test. However, the cooling unit still deserves criticism. It's audible under load, and the KFA2 model unfortunately does not have a fan-stop mode for 2D use.

Test system power consumption (idle)
Test system power consumption (FurMark)
Test system power consumption (when gaming - The Witcher 3 Ultra preset)
FurMark stress test
FurMark stress test
Power Consumption
1920x1080 The Witcher 3 ultra (external Monitor)
KFA 2 GeForce GTX 1660 Super
NVIDIA GeForce GTX 1660 Super (Desktop), AMD Ryzen 9 3900X (Idle: 84.76 W)
260.4 (255min - 277max) Watt * -8%
Sapphire AMD Radeon RX 5500 XT
AMD Radeon RX 5500 XT (Desktop), AMD Ryzen 9 5900X (Idle: 83.93 W)
250.2 (246min - 262max) Watt * -4%
PNY GeForce GTX 1660
NVIDIA GeForce GTX 1660 (Desktop), AMD Ryzen 9 3900X (Idle: 79.88 W)
248.6 (240min - 259max) Watt * -3%
KFA2 GeForce GTX 1650 Super EX One Click OC
NVIDIA GeForce GTX 1650 Super (Desktop), AMD Ryzen 9 5900X (Idle: 86.5 W)
240.7 (237min - 247max) Watt *
KFA2 GeForce GTX 1650 EX One Click Plus
NVIDIA GeForce GTX 1650 (Desktop), AMD Ryzen 9 3900X (Idle: 85.5 W)
202.9 (202min - 204max) Watt * +16%
1280x720 FurMark 1.19 GPU Stress Test (external Monitor)
Sapphire AMD Radeon RX 5500 XT
AMD Radeon RX 5500 XT (Desktop), AMD Ryzen 9 5900X (Idle: 83.93 W)
259.1 (242min - 295max) Watt * -13%
PNY GeForce GTX 1660
NVIDIA GeForce GTX 1660 (Desktop), AMD Ryzen 9 3900X (Idle: 79.88 W)
247.8 (242min - 282max) Watt * -8%
KFA 2 GeForce GTX 1660 Super
NVIDIA GeForce GTX 1660 Super (Desktop), AMD Ryzen 9 3900X (Idle: 84.76 W)
247.6 (241min - 322max) Watt * -8%
KFA2 GeForce GTX 1650 Super EX One Click OC
NVIDIA GeForce GTX 1650 Super (Desktop), AMD Ryzen 9 5900X (Idle: 86.5 W)
228.7 (223min - 271max) Watt *
KFA2 GeForce GTX 1650 EX One Click Plus
NVIDIA GeForce GTX 1650 (Desktop), AMD Ryzen 9 3900X (Idle: 85.5 W)
200.4 (193min - 230max) Watt * +12%

* ... smaller is better

Verdict - Small, compact, and energy-efficient

In review: The KFA2 GeForce GTX 1650 Super

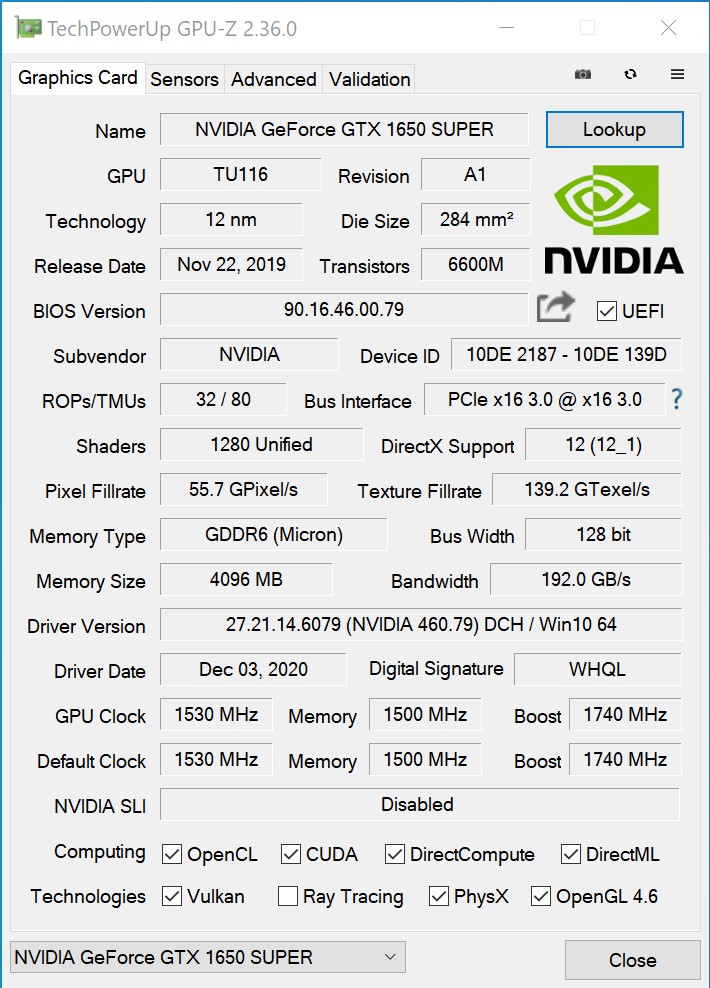
The Nvidia GeForce GTX 1650 Super is an energy-efficient graphics card that is suitable for the home living room PC. With the TU116 graphics chip, the GTX 1650 Super offers the advantages of the GTX 1660 series when it comes to the NVENC video encoding. In terms of price, this graphics card is currently very difficult to categorize, since the problematic availability of graphics cards has now also reached the entry-level models, and even here, we can already see significantly increasing prices. For example, prices starting at 160 Euros (~$192) can be found on the second-hand market.

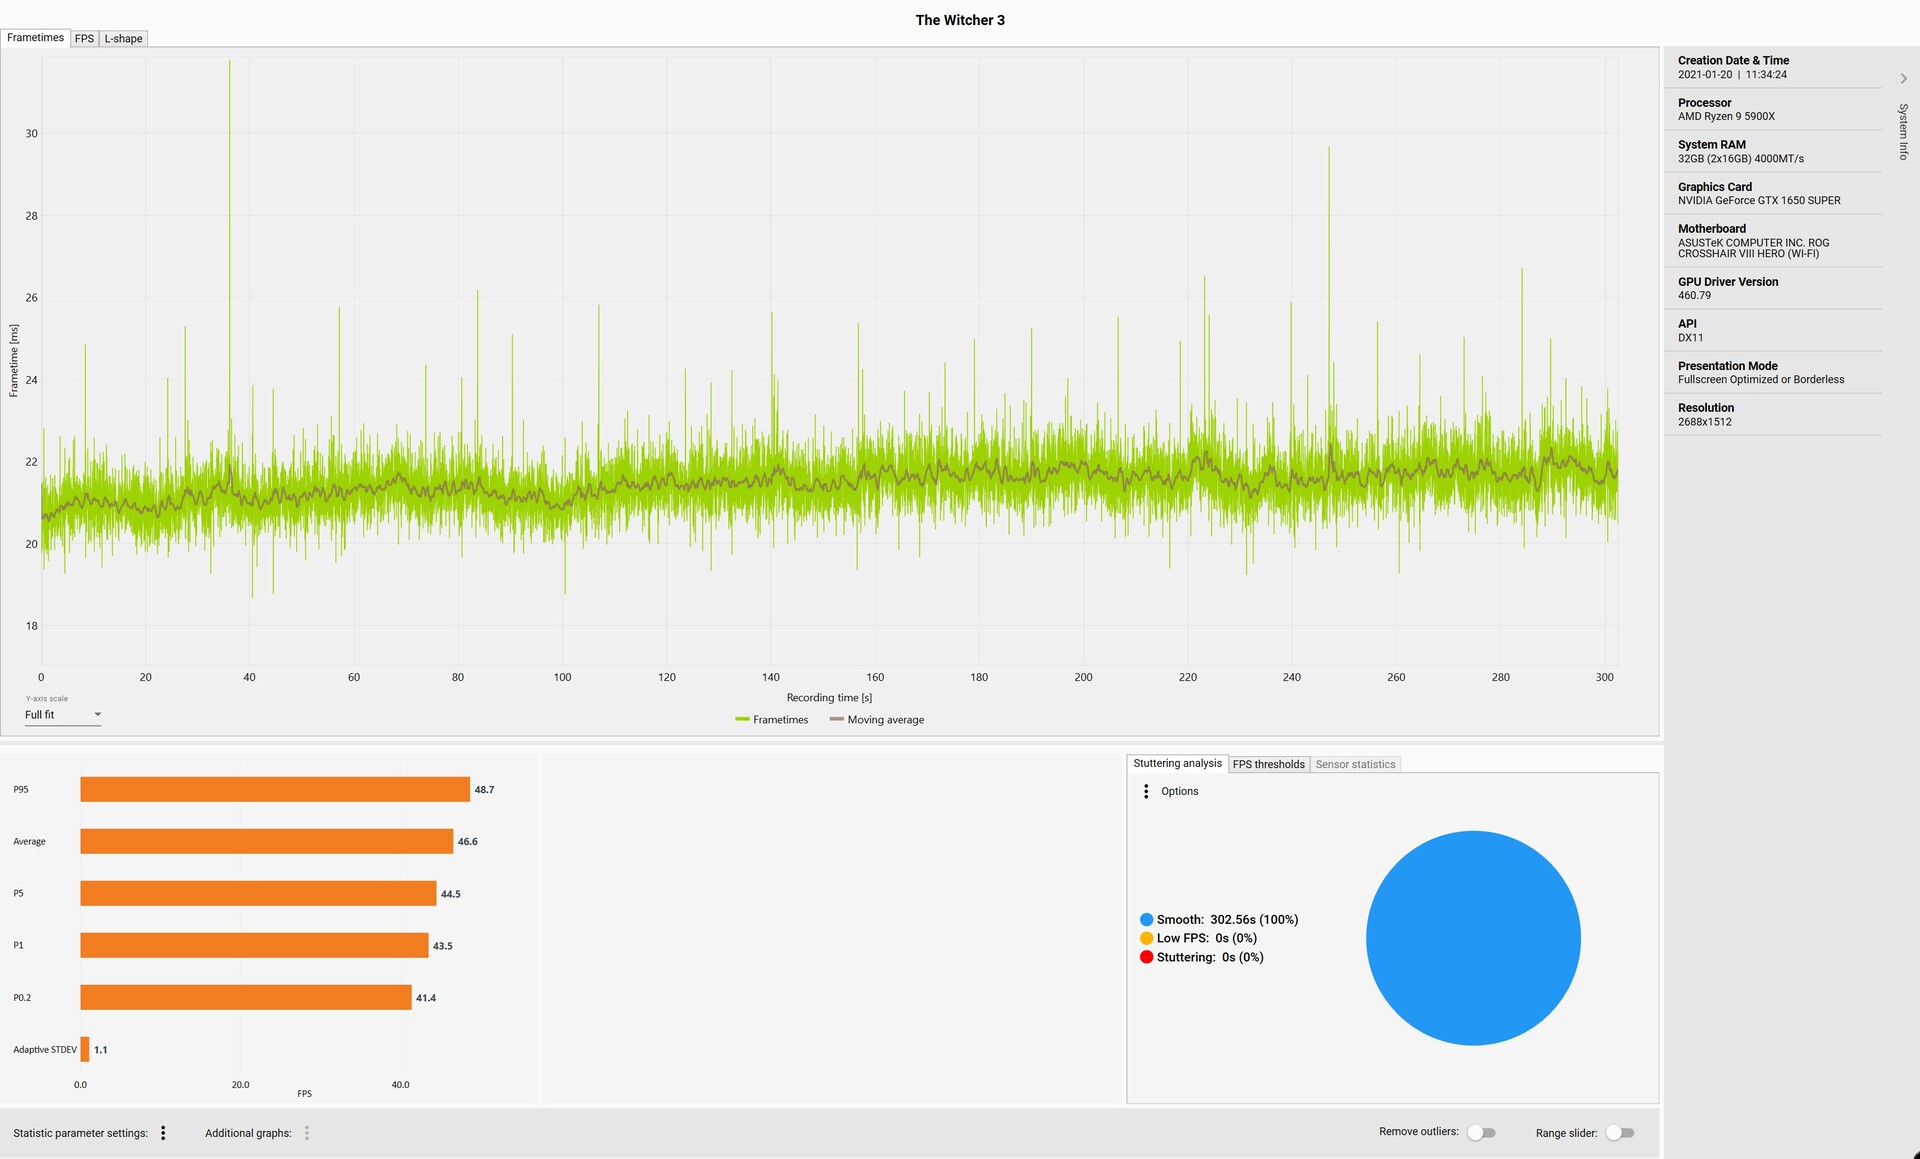
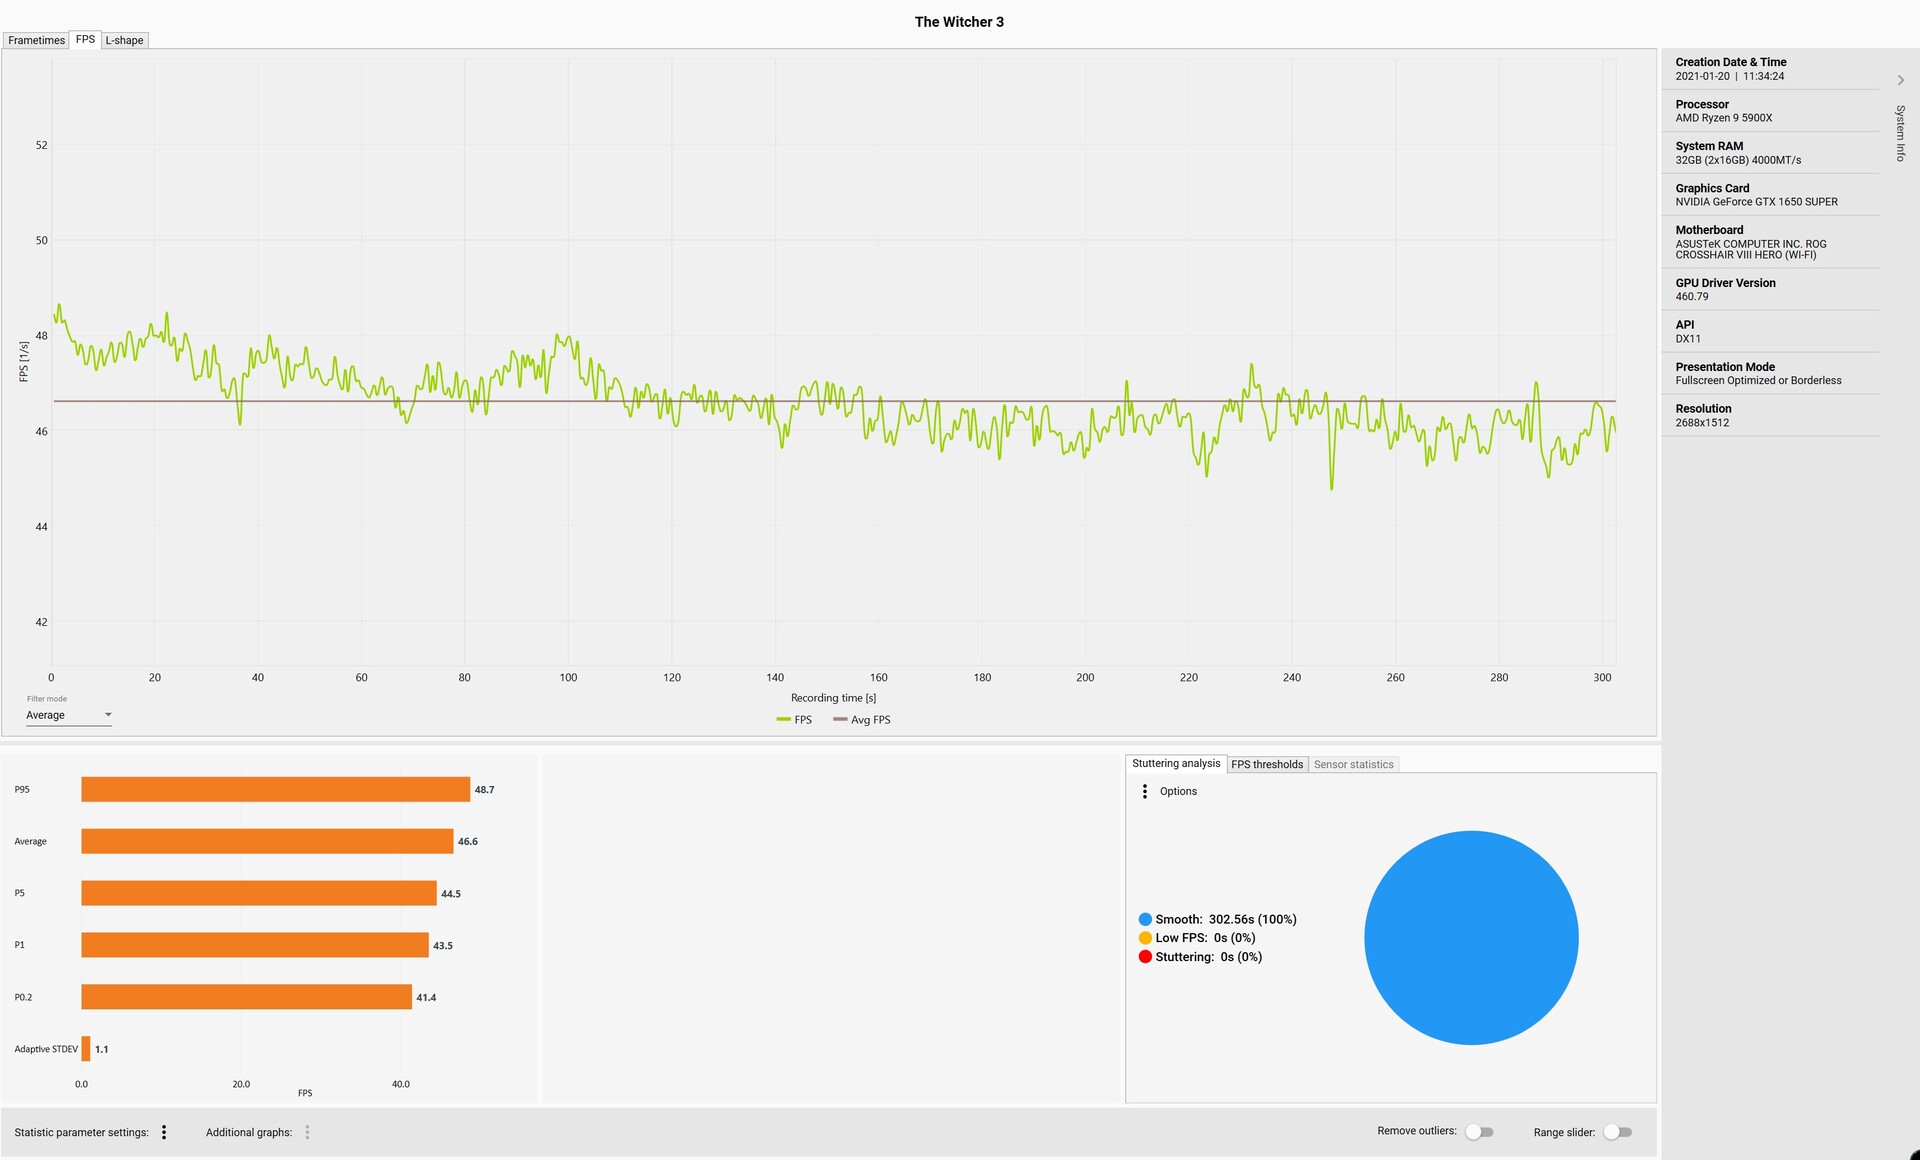
In terms of pure performance, the GeForce GTX 1650 Super ranks directly behind a GeForce GTX 1660. The VRAM of 4 GB is a bit tight if you're looking for something for the long term. At the moment, however, many games can be played smoothly in 1080p even with this graphics card without having to sacrifice details. Only a few games require a reduction in details in order to achieve smooth frame rates.

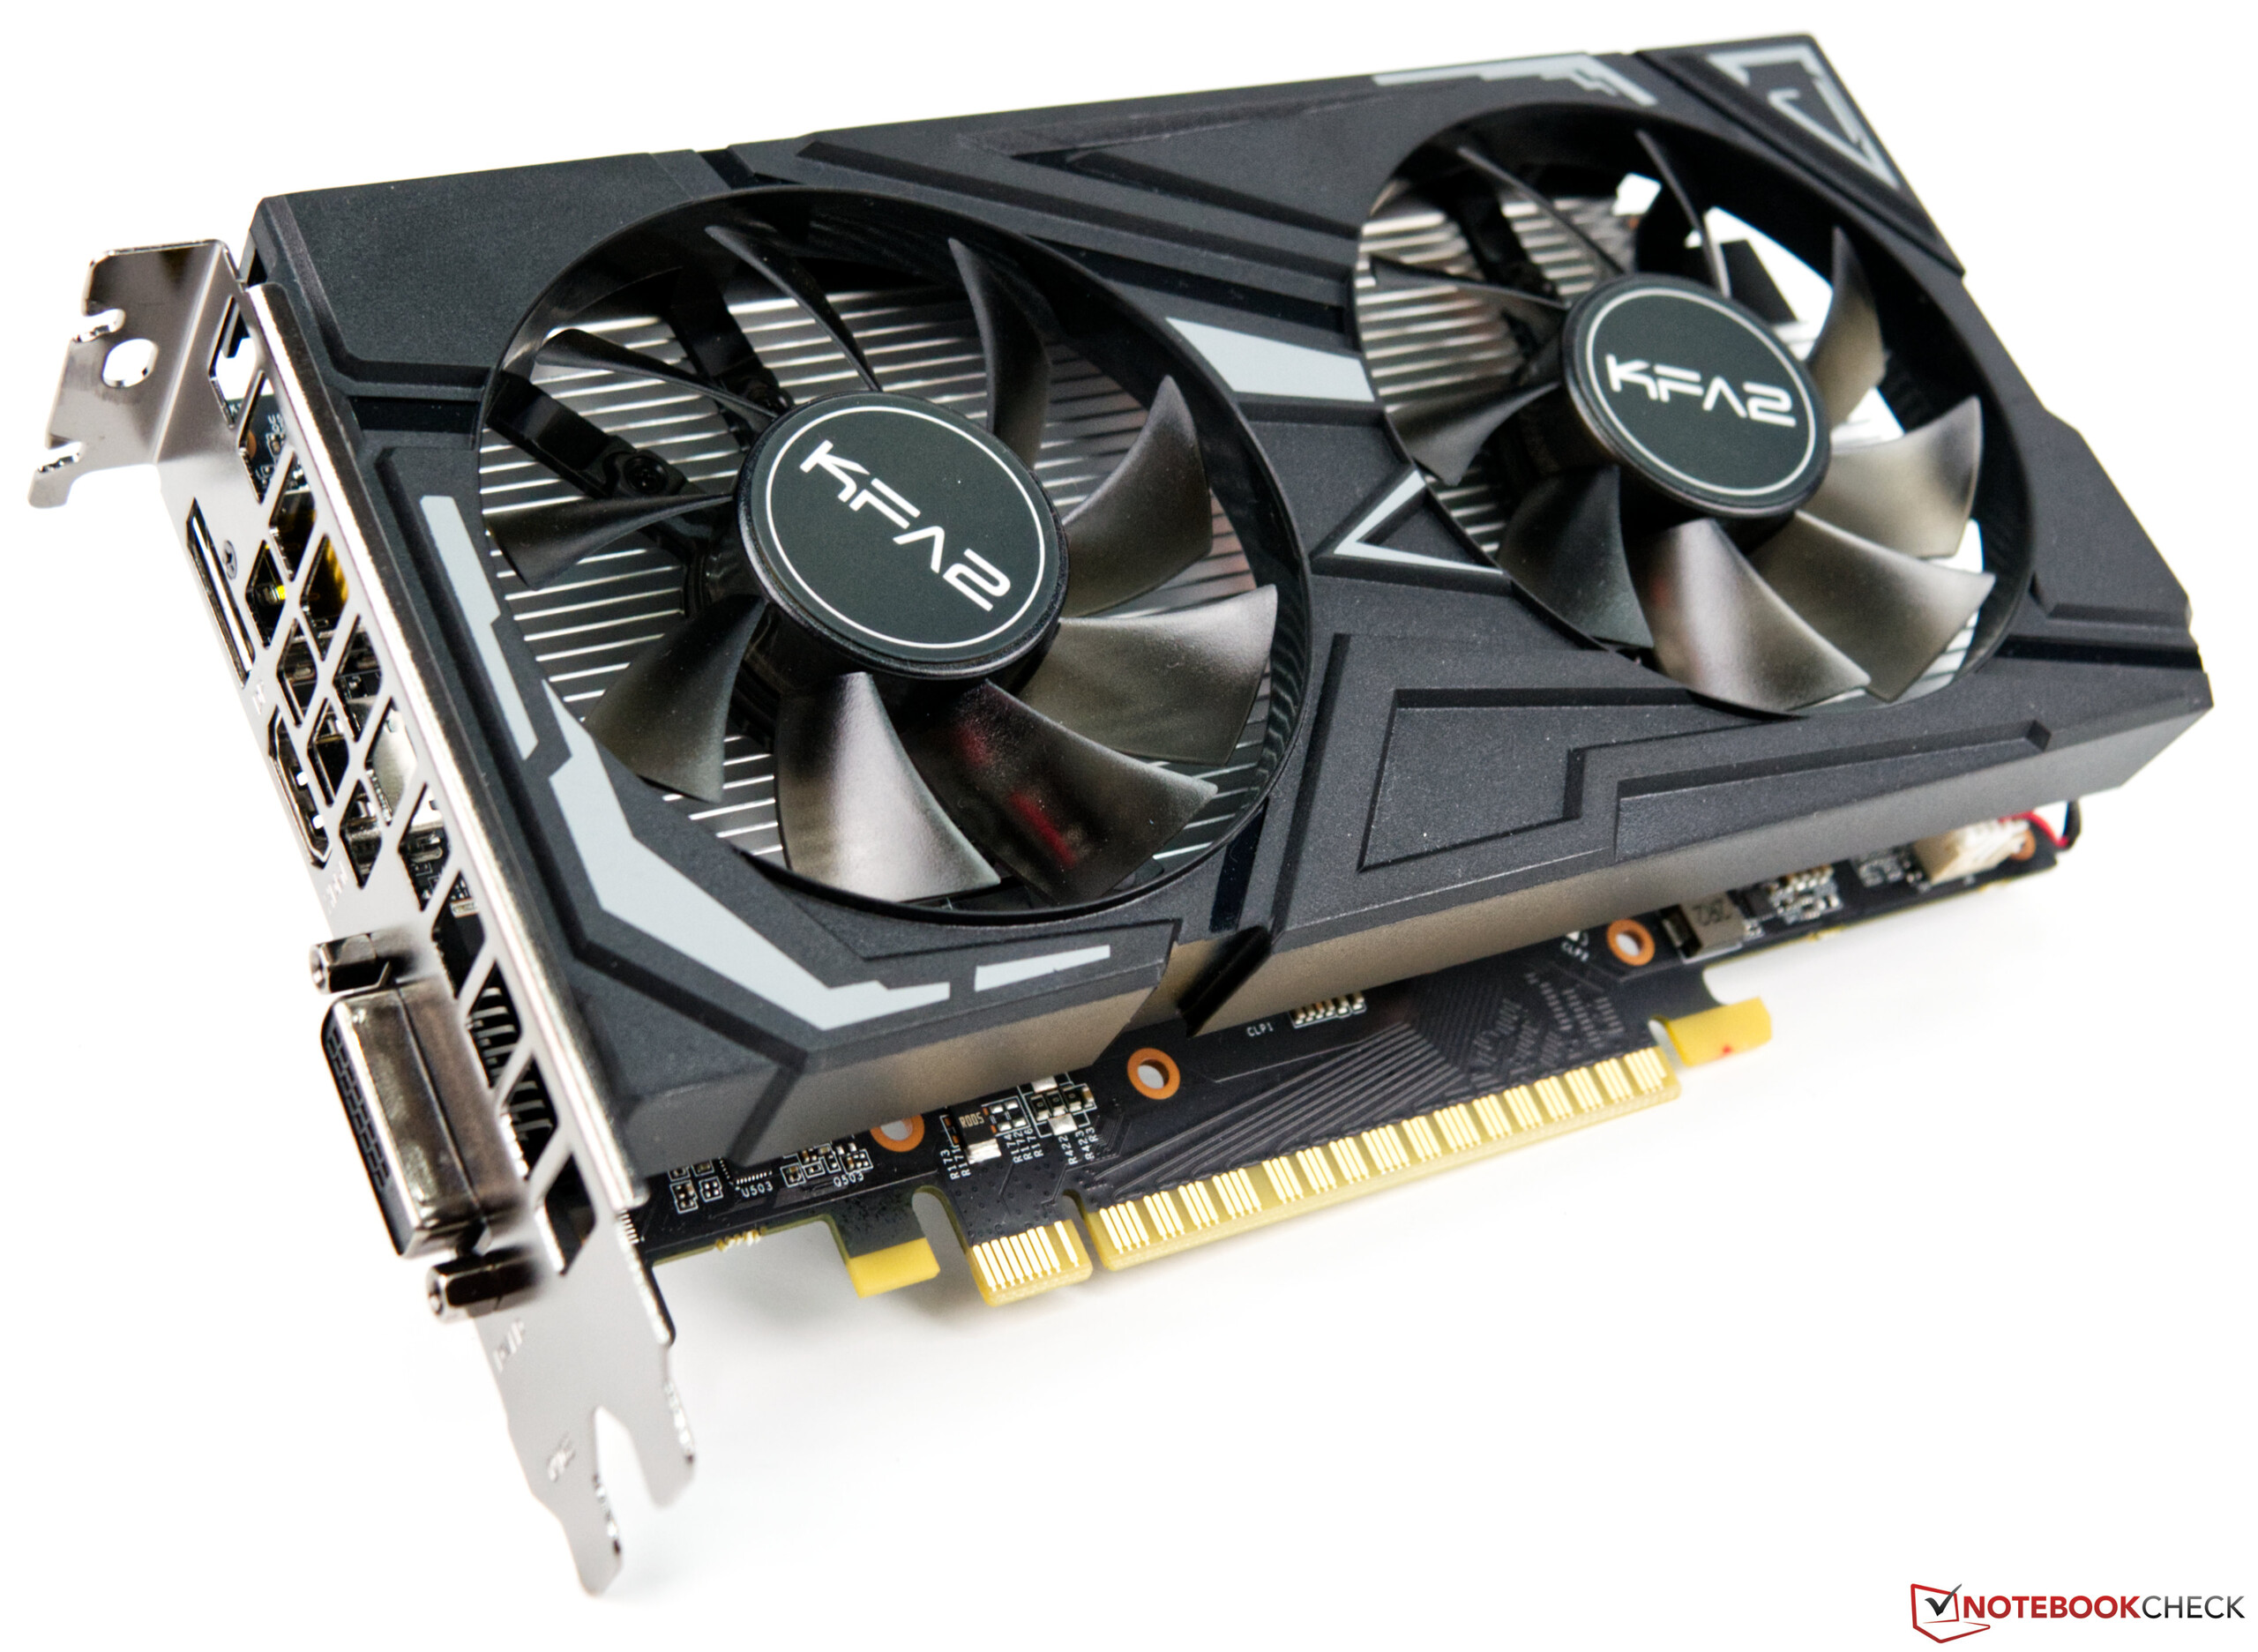
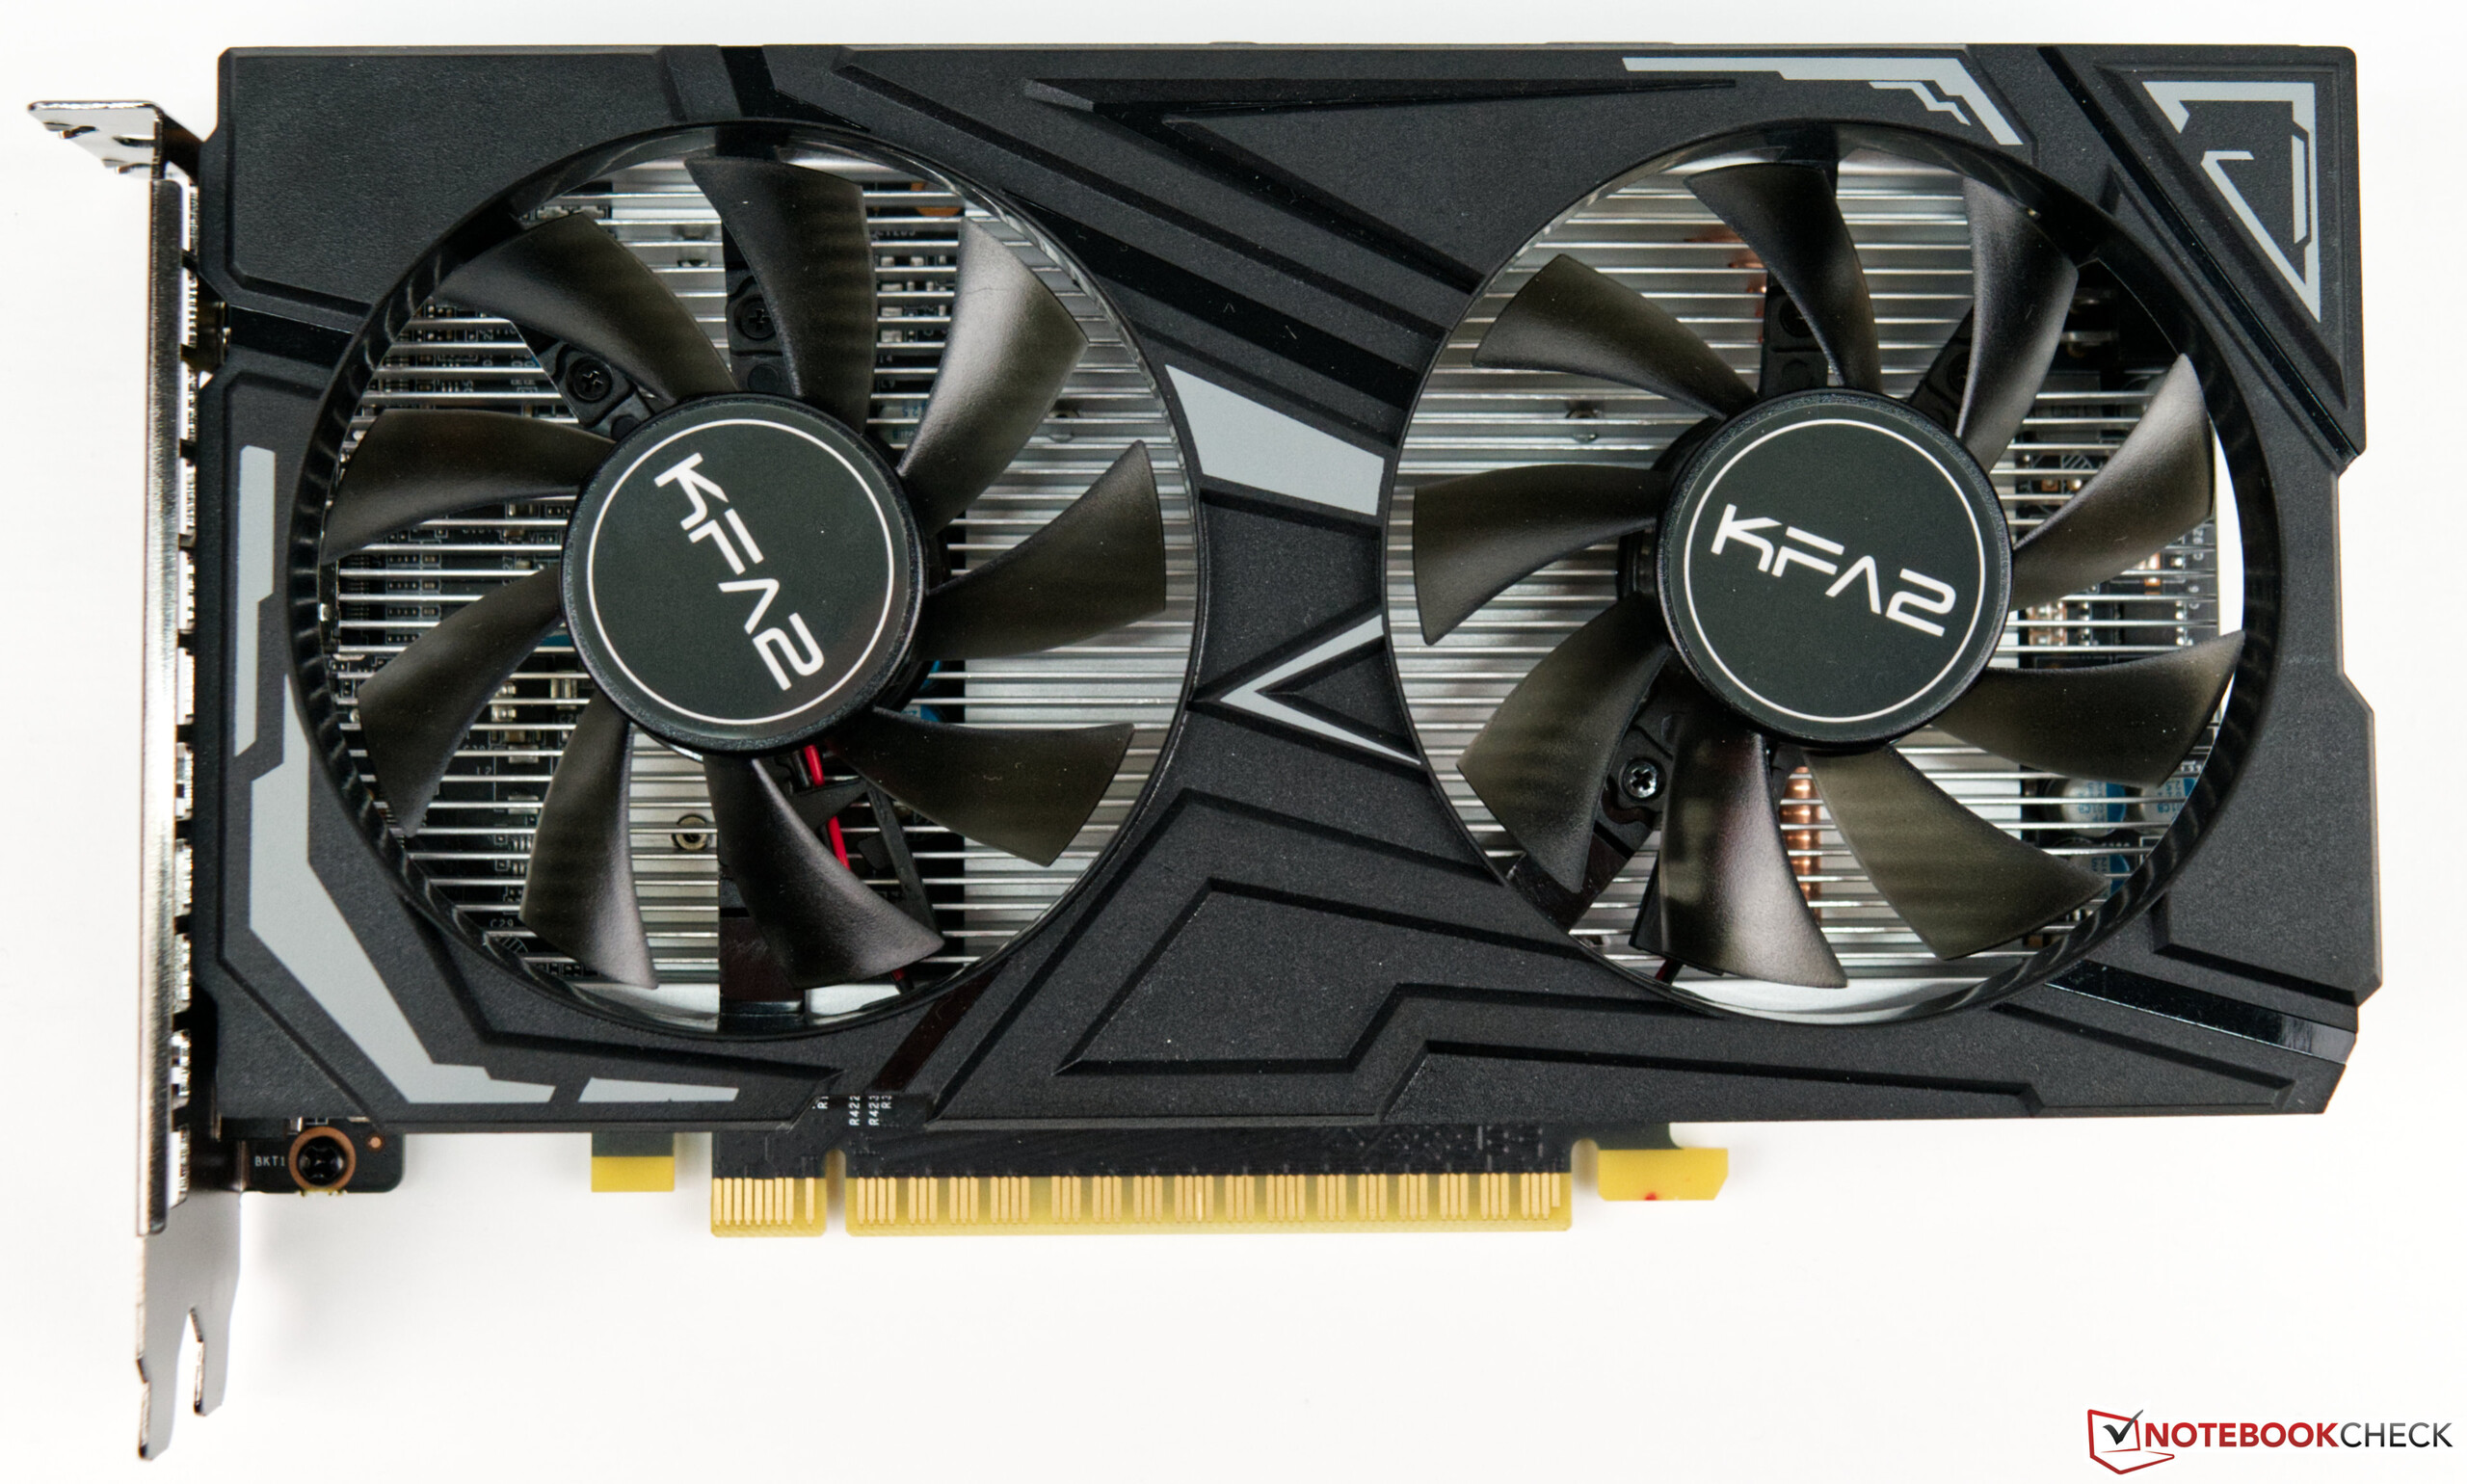
If you're looking for a small and yet powerful graphics card, there's currently no way around the GeForce GTX 1650 Super.

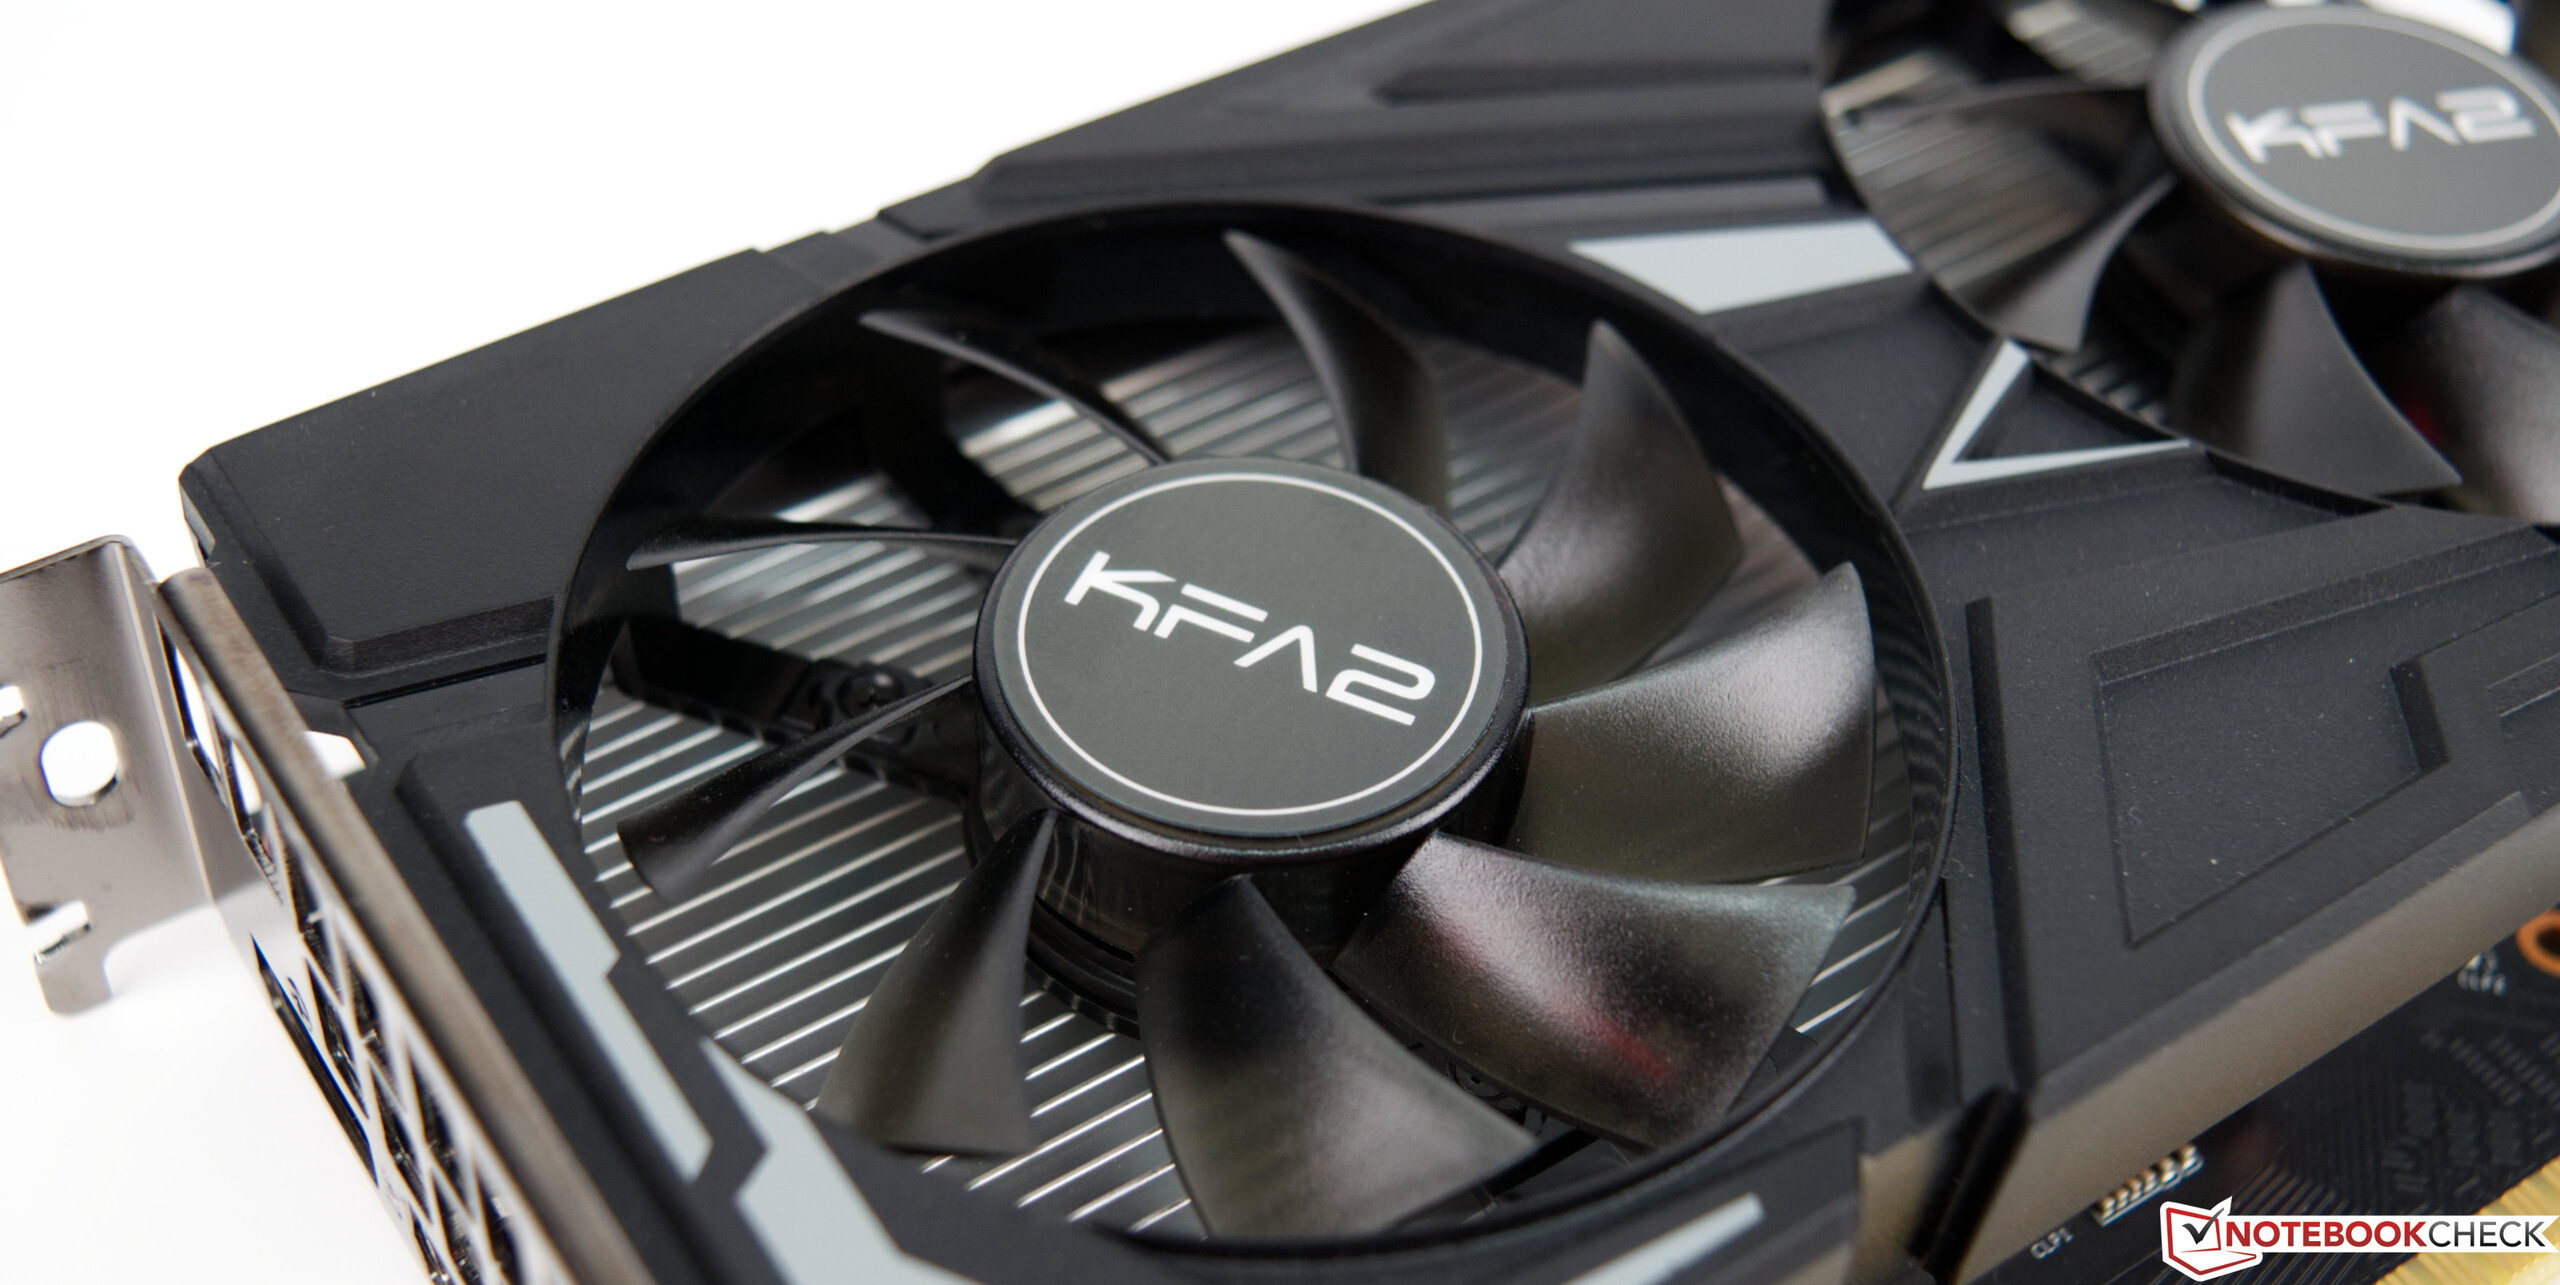
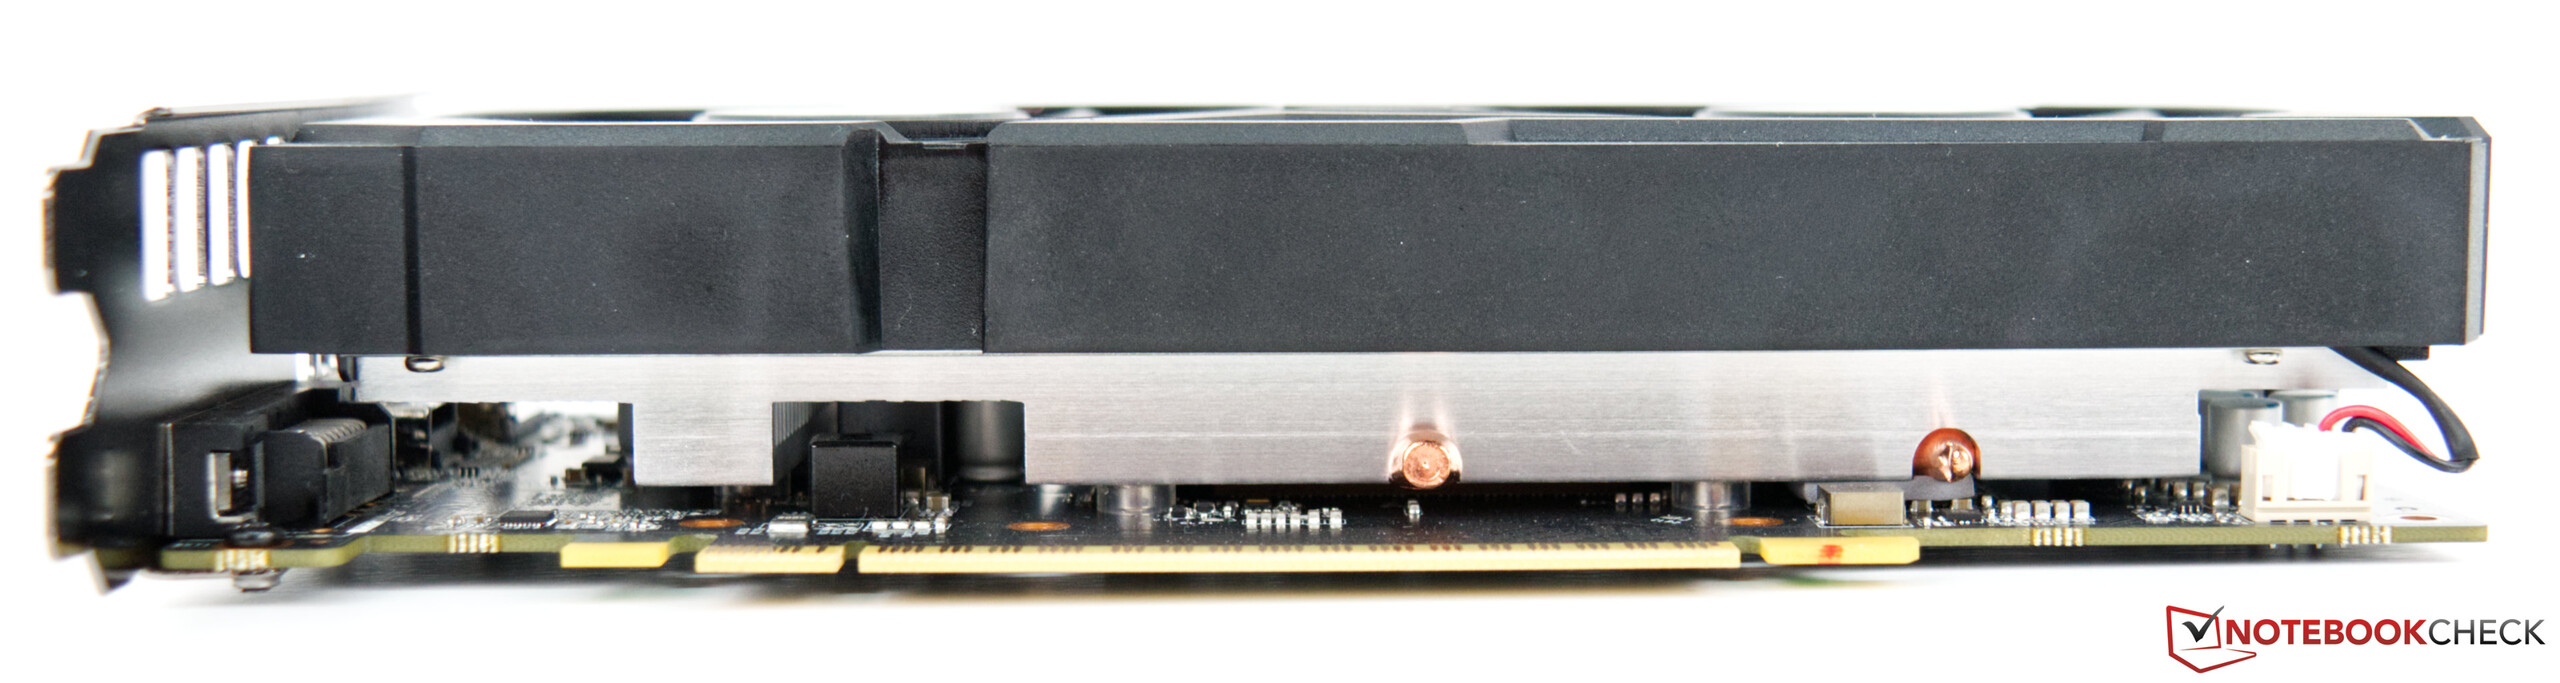
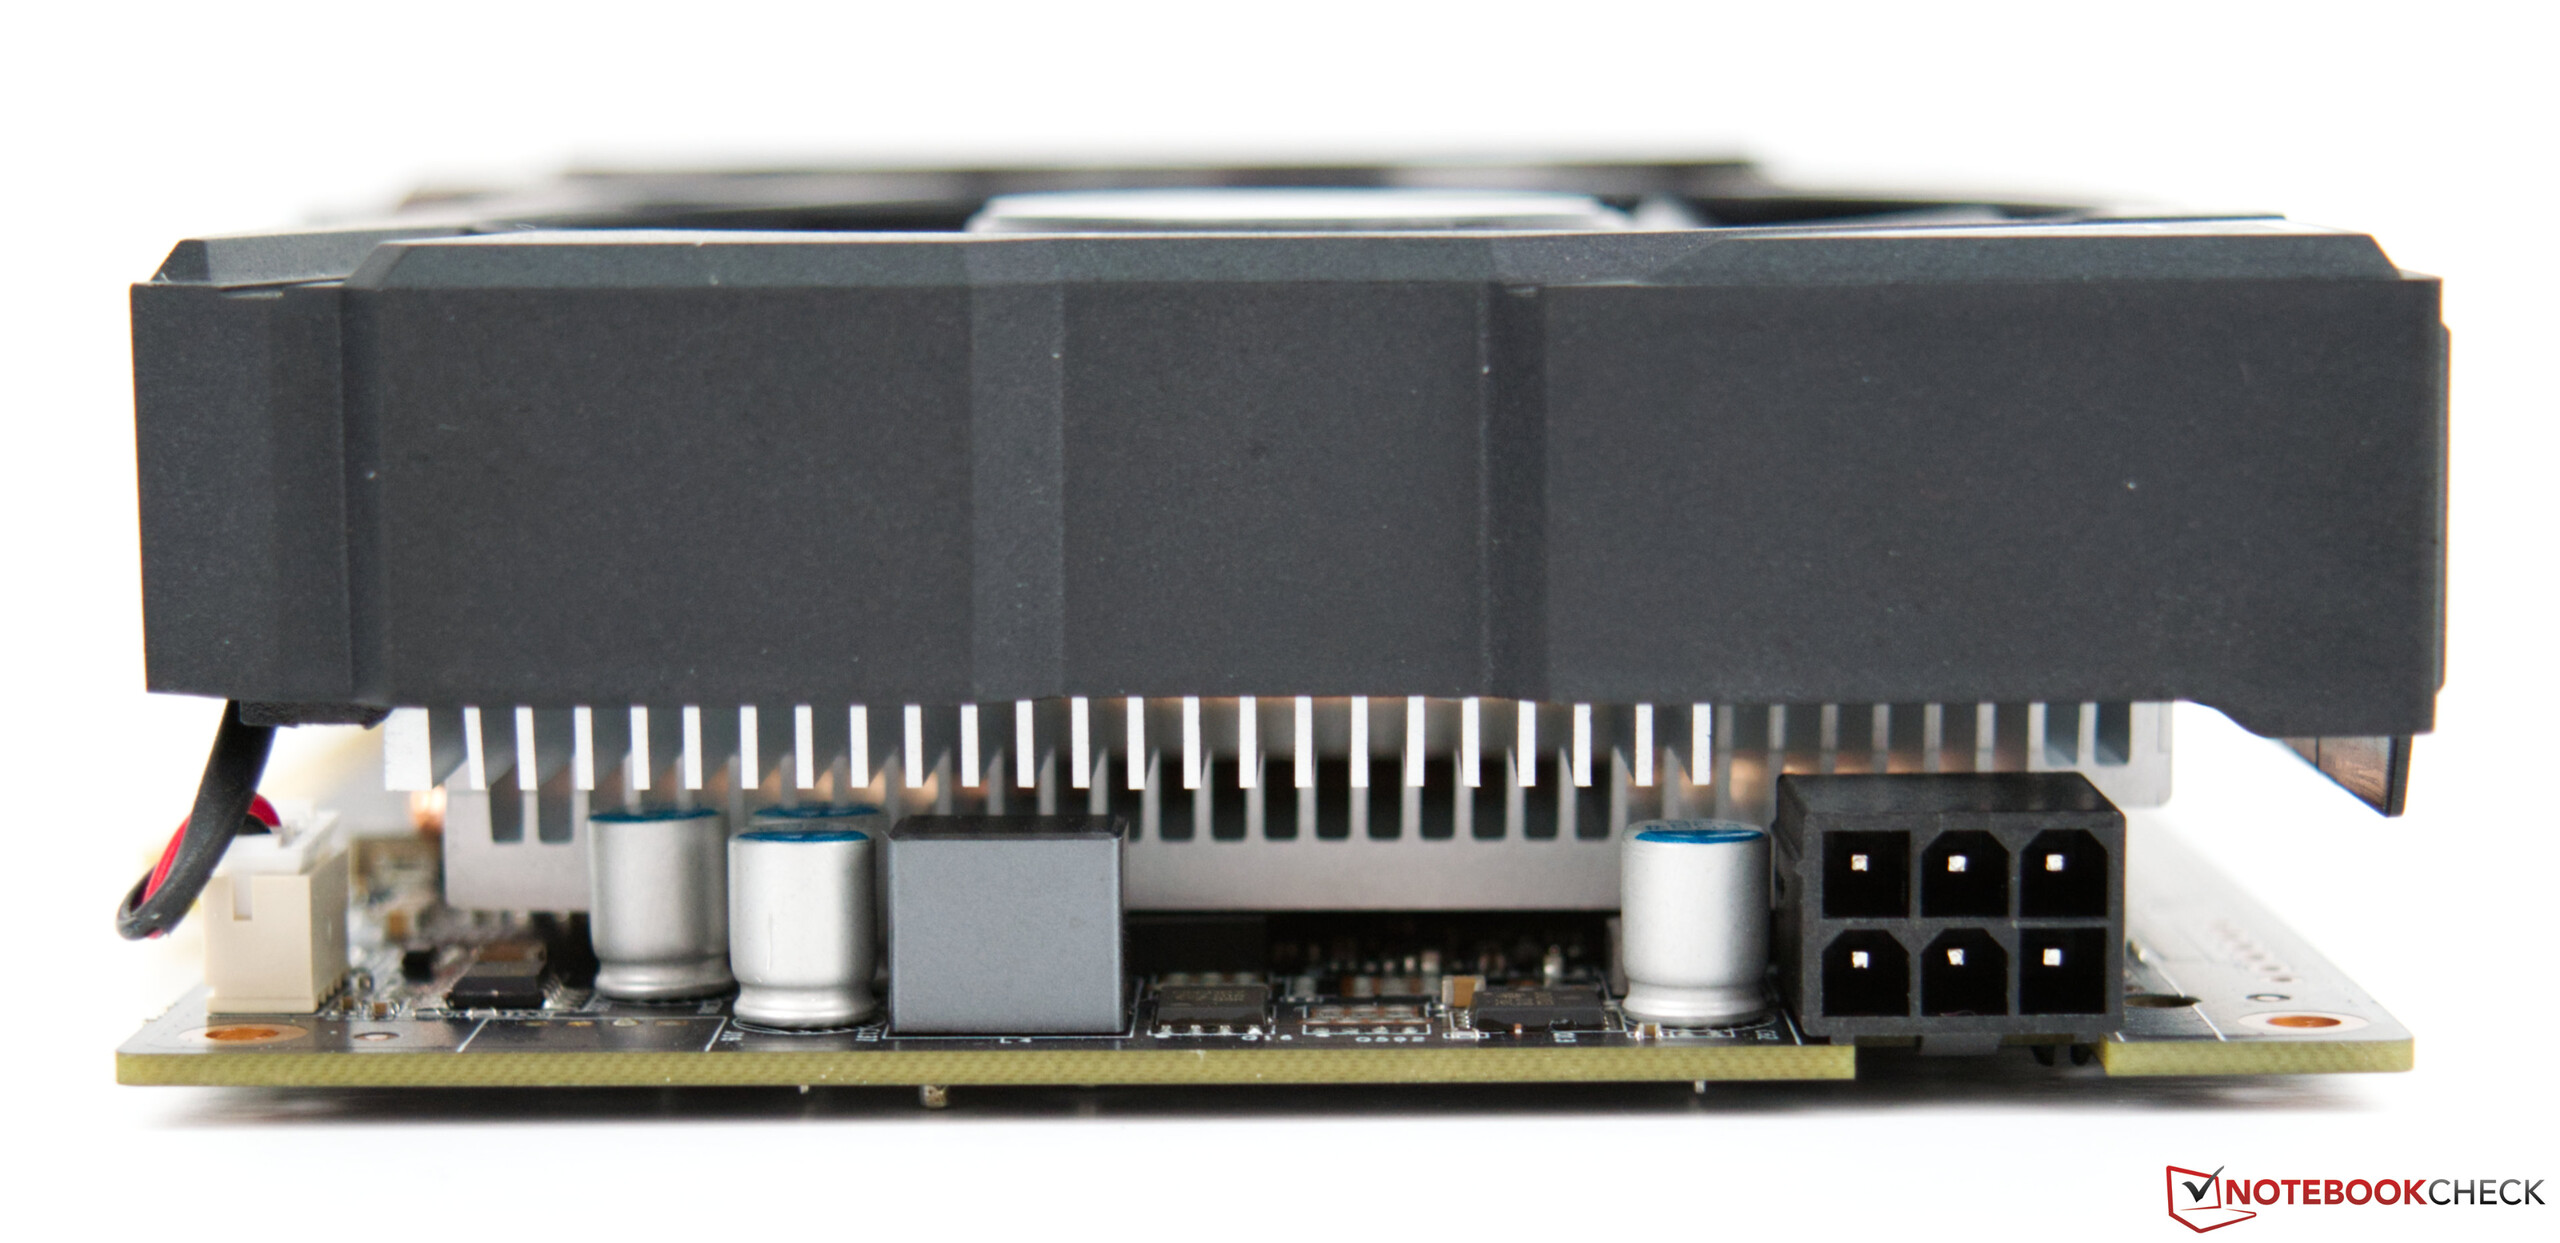
Objectively speaking, the KFA2 GeForce GTX 1650 Super is a solid graphics card for the entry level. However, the built-in cooling system deserves some criticism. A fan-stop mode for 2D use would be appreciated, and a lower noise level in 3D applications would make the graphics card more attractive.

Benchmarks

Performance Rating - 3DMark 11 + Fire Strike + Time Spy
4.6 pt (14%)
Restrict / Search: Model: Max. age: years
3DMark - 3DMark Time Spy Score
min: 5099     avg: 5191     median: 5202.5 (14%)     max: 5261 Points
3DMark - 3DMark Time Spy Graphics
min: 4632     avg: 4637     median: 4633 (9%)     max: 4651 Points
Restrict / Search: Model: Max. age: years
3DMark - 3DMark Ice Storm Unlimited Graphics
min: 450349     avg: 605764     median: 653824 (66%)     max: 665060 Points
3DMark - 3DMark Ice Storm Extreme Graphics
min: 221403     avg: 240031     median: 245383 (29%)     max: 247955 Points
3DMark - 3DMark Cloud Gate Score
min: 44256     avg: 49356     median: 50912.5 (48%)     max: 51344 Points
3DMark - 3DMark Cloud Gate Graphics
min: 63896     avg: 67460     median: 68198.5 (17%)     max: 69545 Points
3DMark - 3DMark Fire Strike Standard Score
min: 11050     avg: 11467     median: 11574 (17%)     max: 11671 Points
3DMark - 3DMark Fire Strike Standard Graphics
min: 11688     avg: 12125     median: 12206 (11%)     max: 12400 Points
3DMark - 3DMark Ice Storm Graphics
min: 278896     avg: 306260     median: 313924 (35%)     max: 318296 Points
3DMark - 3DMark Night Raid
40490 Points (38%)
3DMark - 3DMark Night Raid Graphics Score
56328 Points (22%)
3DMark 11 - 3DM11 Performance Score
min: 17833     avg: 18832     median: 19053 (23%)     max: 19387 Points
3DMark 11 - 3DM11 Performance GPU
min: 17849     avg: 18136     median: 18224.5 (14%)     max: 18247 Points
Restrict / Search: Model: Max. age: years
3DMark Vantage
3DM Vant. Perf. total +
3DMark Vantage - 3DM Vant. Perf. total
min: 57390     avg: 62121     median: 64463 (19%)     max: 64511 Points
3DM Vant. Perf. GPU no PhysX +
3DMark Vantage - 3DM Vant. Perf. GPU no PhysX
min: 52466     avg: 55647     median: 57106 (31%)     max: 57368 Points
Restrict / Search: Model: Max. age: years
3DMark 05 - 3DMark 05 - Standard
min: 84609     avg: 86965     median: 86964.5 (95%)     max: 89320 Points
Restrict / Search: Model: Max. age: years
3DMark 06 3DMark 06 - Standard 1280x1024 +
3DMark 06
min: 46823     avg: 59017     median: 64150 (84%)     max: 66078 Points
Unigine Valley 1.0 - Unigine Valley 1.0 DX
min: 53.7     avg: 54.3     median: 54.1 (16%)     max: 55 fps
SPECviewperf 12
specvp12 sw-03 +
SPECviewperf 12 - specvp12 sw-03
min: 50.2     avg: 62.2     median: 66.3 (16%)     max: 70 fps
specvp12 snx-02 +
SPECviewperf 12 - specvp12 snx-02
min: 7.98     avg: 8.8     median: 8.9 (1%)     max: 9.64 fps
specvp12 showcase-01 +
SPECviewperf 12 - specvp12 showcase-01
min: 53     avg: 56.7     median: 56.5 (10%)     max: 60.6 fps
specvp12 mediacal-01 +
SPECviewperf 12 - specvp12 mediacal-01
min: 25.53     avg: 34.4     median: 33.5 (9%)     max: 44.2 fps
specvp12 maya-04 +
SPECviewperf 12 - specvp12 maya-04
min: 110     avg: 115     median: 116 (32%)     max: 119 fps
specvp12 energy-01 +
SPECviewperf 12 - specvp12 energy-01
min: 5.17     avg: 5.5     median: 5.6 (5%)     max: 5.72 fps
specvp12 creo-01 +
SPECviewperf 12 - specvp12 creo-01
min: 37.62     avg: 42     median: 42.8 (17%)     max: 45.6 fps
specvp12 catia-04 +
SPECviewperf 12 - specvp12 catia-04
min: 53     avg: 56.5     median: 57.3 (9%)     max: 59.1 fps
specvp12 3dsmax-05 +
SPECviewperf 12 - specvp12 3dsmax-05
min: 119     avg: 129.3     median: 134 (20%)     max: 135 fps
SPECviewperf 13 specvp13 sw-04 +
SPECviewperf 13 - specvp13 sw-04
min: 67.8     avg: 89.8     median: 98.5 (26%)     max: 103 fps
specvp13 snx-03 +
SPECviewperf 13 - specvp13 snx-03
min: 14.26     avg: 15.9     median: 16 (2%)     max: 17.4 fps
specvp13 showcase-02 +
SPECviewperf 13 - specvp13 showcase-02
min: 53.2     avg: 55.4     median: 56.5 (10%)     max: 56.6 fps
specvp13 medical-02 +
SPECviewperf 13 - specvp13 medical-02
min: 30.5     avg: 33.8     median: 35.4 (6%)     max: 35.6 fps
specvp13 maya-05 +
SPECviewperf 13 - specvp13 maya-05
min: 161     avg: 165.3     median: 167 (19%)     max: 168 fps
specvp13 energy-02 +
SPECviewperf 13 - specvp13 energy-02
min: 7.61     avg: 7.6     median: 7.6 (2%)     max: 7.64 fps
specvp13 creo-02 +
SPECviewperf 13 - specvp13 creo-02
min: 114     avg: 119     median: 120 (18%)     max: 123 fps
specvp13 catia-05 +
SPECviewperf 13 - specvp13 catia-05
min: 76.3     avg: 79     median: 79.4 (9%)     max: 81.2 fps
specvp13 3dsmax-06 +
SPECviewperf 13 - specvp13 3dsmax-06
min: 119     avg: 129     median: 133 (21%)     max: 135 fps
SPECviewperf 2020 specvp2020 solidworks-05 4k +
SPECviewperf 2020 - specvp2020 solidworks-05 4k
26.2 fps (6%)
specvp2020 snx-04 4k +
SPECviewperf 2020 - specvp2020 snx-04 4k
min: 10.64     avg: 11.6     median: 11.6 (1%)     max: 12.5 fps
specvp2020 medical-03 4k +
SPECviewperf 2020 - specvp2020 medical-03 4k
min: 4.96     avg: 5.6     median: 5.3 (3%)     max: 6.58 fps
specvp2020 maya-06 4k +
SPECviewperf 2020 - specvp2020 maya-06 4k
min: 85.6     avg: 87.9     median: 88.4 (13%)     max: 89.8 fps
specvp2020 energy-03 4k +
SPECviewperf 2020 - specvp2020 energy-03 4k
11 fps (2%)
specvp2020 creo-03 4k +
SPECviewperf 2020 - specvp2020 creo-03 4k
min: 43.66     avg: 45.9     median: 46.4 (21%)     max: 47.5 fps
specvp2020 catia-06 4k +
SPECviewperf 2020 - specvp2020 catia-06 4k
min: 13.3     avg: 13.4     median: 13.4 (9%)     max: 13.4 fps
specvp2020 3dsmax-07 4k +
SPECviewperf 2020 - specvp2020 3dsmax-07 4k
min: 27.5     avg: 28.8     median: 29.3 (10%)     max: 29.6 fps
LuxMark v2.0 64Bit - LuxMark v2.0 Room GPU
min: 1405     avg: 1411     median: 1410.5 (5%)     max: 1416 Samples/s
LuxMark v2.0 64Bit - LuxMark v2.0 Sala GPU
min: 2972     avg: 2994     median: 2993.5 (5%)     max: 3015 Samples/s
ComputeMark v2.1 - ComputeMark v2.1 Result
min: 9510     avg: 9521     median: 9521 (8%)     max: 9532 points
Power Consumption - Furmark Stress Test Power Consumption - external Monitor *
min: 225     avg: 226.9     median: 226.9 (31%)     max: 228.7 Watt
0153045607590105120135150165180195210225240Tooltip
Power Consumption - The Witcher 3 Power Consumption - external Monitor *
min: 220     avg: 230.4     median: 230.4 (32%)     max: 240.7 Watt
0153045607590105120135150165180195210225240255270Tooltip
Power Consumption - Power Efficiency - Witcher 3 ultra external Monitor
0.2 fps per Watt (15%)
Power Consumption - Cyberpunk 2077 Power Consumption - external Monitor *
278 Watt (35%)
020406080100120140160180200220240260280300Tooltip
Clock Speed - GPU Clock Speed Furmark
1740 MHz (69%)
- Range of benchmark values
red legend - Average benchmark values
* Smaller numbers mean a higher performance

v1.33
log 11. 10:05:54

#0 ran 0s before starting gpusingle class +0s ... 0s

#1 no ids found in url (should be separated by "_") +0s ... 0s

#2 not redirecting to Ajax server +0s ... 0s

#3 did not recreate cache, as it is less than 5 days old! Created at Thu, 10 Jul 2025 05:37:28 +0200 +0.001s ... 0.001s

#4 getting avg benchmarks for device 10646 +0.02s ... 0.021s

#5 got single benchmarks 10646 +0.018s ... 0.039s

#6 got avg benchmarks for devices +0s ... 0.039s

#7 min, max, avg, median took s +1.022s ... 1.061s

#8 return log +0s ... 1.061s

Game Benchmarks

The following benchmarks stem from our benchmarks of review laptops. The performance depends on the used graphics memory, clock rate, processor, system settings, drivers, and operating systems. So the results don't have to be representative for all laptops with this GPU. For detailed information on the benchmark results, click on the fps number.

F1 25

F1 25

2025
low 1920x1080
143  fps    + Compare
med. 1920x1080
90.5  fps    + Compare
high 1920x1080
67.3  fps    + Compare
» With all tested laptops playable in detail settings high.
low 1920x1080
37.1  fps    + Compare + 📈 Graph
med. 1920x1080
24.5  fps    + Compare + 📈 Graph
high 1920x1080
15.4  fps    + Compare + 📈 Graph
» With all tested laptops playable in detail settings low.
low 1920x1080
203  fps    + Compare + 📈 Graph
med. 1920x1080
112  fps    + Compare + 📈 Graph
high 1920x1080
52  fps    + Compare + 📈 Graph
QHD 2560x1440
32.4  fps    + Compare + 📈 Graph
4K 3840x2160
15.7  fps    + Compare + 📈 Graph
» With all tested laptops playable in detail settings high.
low 1920x1080
20.4  fps    + Compare
med. 1920x1080
13.1  fps    + Compare
» The benchmarks indicate that the game is not playable in the tested settings.
low 1920x1080
56.9  fps    + Compare + 📈 Graph
med. 1920x1080
40.9  fps    + Compare + 📈 Graph
high 1920x1080
31.5  fps    + Compare + 📈 Graph
ultra 1920x1080
20.8  fps    + Compare + 📈 Graph
» With all tested laptops playable in detail settings med..
Stalker 2

Stalker 2

2024
low 1920x1080
8.2  fps    + Compare + 📈 Graph
med. 1920x1080
7.3  fps    + Compare + 📈 Graph
» The benchmarks indicate that the game is not playable in the tested settings.
Additional Benchmarks
Low Preset 1280x720
16.3
low 1920x1080
47  fps    + Compare
med. 1920x1080
43  fps    + Compare
high 1920x1080
26  fps    + Compare
ultra 1920x1080
9  fps    + Compare
» With all tested laptops playable in detail settings med..
Additional Benchmarks
Minimum Preset 1280x720
81
low 1920x1080
85.3  fps    + Compare + 📈 Graph
med. 1920x1080
49.4  fps    + Compare + 📈 Graph
high 1920x1080
33.3  fps    + Compare + 📈 Graph
ultra 1920x1080
21.3  fps    + Compare + 📈 Graph
» With all tested laptops playable in detail settings med..
Additional Benchmarks
Low Preset 1280x720
113.8
low 1920x1080
55.5  fps    + Compare + 📈 Graph
med. 1920x1080
7  fps    + Compare + 📈 Graph
» With all tested laptops playable in detail settings low.
Additional Benchmarks
Low Preset TAA 1280x720
79.6
low 1920x1080
31.7  fps    + Compare + 📈 Graph
med. 1920x1080
30.7  fps    + Compare + 📈 Graph
high 1920x1080
26.7  fps    + Compare + 📈 Graph
ultra 1920x1080
23.2  fps    + Compare + 📈 Graph
» The benchmarks indicate that the game is not playable in the tested settings.
Additional Benchmarks
Low Preset (Super Resolution off) 1280x720
53.1
low 1920x1080
25  fps    + Compare + 📈 Graph
med. 1920x1080
10.4  fps    + Compare + 📈 Graph
» The benchmarks indicate that the game is not playable in the tested settings.
Additional Benchmarks
Low Preset TAA 1280x720
81.6
low 1920x1080 cinem.
20.3  fps    + Compare + 📈 Graph
med. 1920x1080 cinem.
17.5  fps    + Compare + 📈 Graph
high 1920x1080 cinem.
14.3  fps    + Compare + 📈 Graph
ultra 1920x1080 cinem.
10.5  fps    + Compare + 📈 Graph
» The benchmarks indicate that the game is not playable in the tested settings.
Additional Benchmarks
low 1280x720 cinem.
29.5
low 1920x1080
37  fps    + Compare
med. 1920x1080
22  fps    + Compare
high 1920x1080
15  fps    + Compare
ultra 1920x1080
5  fps    + Compare
» With all tested laptops playable in detail settings low.
Additional Benchmarks
low TSR 100 1280x720
66
low 1920x1080
97.5  fps    + Compare + 📈 Graph
med. 1920x1080
67.4  fps    + Compare + 📈 Graph
high 1920x1080
50.7  fps    + Compare + 📈 Graph
ultra 1920x1080
45.3  fps    + Compare + 📈 Graph
QHD 2560x1440
28.9  fps    + Compare + 📈 Graph
4K 3840x2160
10  fps    + Compare + 📈 Graph
» With all tested laptops playable in detail settings ultra.
Additional Benchmarks
Very Low Preset 1280x720
191.9
low 1920x1080
90.2  fps    + Compare + 📈 Graph
med. 1920x1080
54.5  fps    + Compare + 📈 Graph
high 1920x1080
42.4  fps    + Compare + 📈 Graph
ultra 1920x1080
32.4  fps    + Compare + 📈 Graph
QHD 2560x1440
15.3  fps    + Compare + 📈 Graph
» With all tested laptops playable in detail settings high.
Additional Benchmarks
Low Preset 1280x720
125.1
F1 24

F1 24

2024
low 1920x1080
153.9  fps    + Compare
med. 1920x1080
128.7  fps    + Compare
high 1920x1080
90.3  fps    + Compare
» With all tested laptops playable in detail settings high.
low 1920x1080
14  fps    + Compare + 📈 Graph
med. 1920x1080
12.8  fps    + Compare + 📈 Graph
high 1920x1080
5  fps    + Compare + 📈 Graph
» The benchmarks indicate that the game is not playable in the tested settings.
low 1920x1080
56.8  fps    + Compare + 📈 Graph
med. 1920x1080
44.9  fps    + Compare + 📈 Graph
high 1920x1080
36.1  fps    + Compare + 📈 Graph
ultra 1920x1080
23.9  fps    + Compare + 📈 Graph
» With all tested laptops playable in detail settings high.
low 1920x1080
48.4  fps    + Compare + 📈 Graph
med. 1920x1080
36.7  fps    + Compare + 📈 Graph
high 1920x1080
22.7  fps    + Compare + 📈 Graph
ultra 1920x1080
15.3  fps    + Compare + 📈 Graph
QHD 2560x1440
13  fps    + Compare + 📈 Graph
» With all tested laptops playable in detail settings med..
Additional Benchmarks
Very Low Preset 1280x720
92.1
low 1920x1080
135.4  fps    + Compare + 📈 Graph
med. 1920x1080
104.3  fps    + Compare + 📈 Graph
high 1920x1080
86.2  fps    + Compare + 📈 Graph
ultra 1920x1080
22  fps    + Compare + 📈 Graph
» With all tested laptops playable in detail settings high.
Additional Benchmarks
Low Preset 1280x720
249
low 1920x1080
31  fps    + Compare + 📈 Graph
high 1920x1080
26.3  fps    + Compare + 📈 Graph
QHD 2560x1440
18.4  fps    + Compare + 📈 Graph
» The benchmarks indicate that the game is not playable in the tested settings.
Additional Benchmarks
Low Preset 1280x720
42.8
low 1920x1080
128.6  fps    + Compare + 📈 Graph
med. 1920x1080
99.2  fps    + Compare + 📈 Graph
high 1920x1080
83.6  fps    + Compare + 📈 Graph
ultra 1920x1080
51.6  fps    + Compare + 📈 Graph
QHD 2560x1440
32.4  fps    + Compare + 📈 Graph
4K 3840x2160
14.4  fps    + Compare + 📈 Graph
» With all tested laptops playable in detail settings ultra.
Additional Benchmarks
Very Low Preset 1280x720
298
low 1920x1080
67  fps    + Compare
med. 1920x1080
59  fps    + Compare
high 1920x1080
45  fps    + Compare
ultra 1920x1080
39  fps    + Compare
QHD 2560x1440
27  fps    + Compare
4K 3840x2160
13  fps    + Compare
4K FSR 3840x2160
22  fps    + Compare
» With all tested laptops playable in detail settings ultra.
Additional Benchmarks
Low Preset TAA 1280x720
91
low 1920x1080
48.8  fps    + Compare + 📈 Graph
med. 1920x1080
37.4  fps    + Compare + 📈 Graph
high 1920x1080
29.7  fps    + Compare + 📈 Graph
ultra 1920x1080
29  fps    + Compare + 📈 Graph
QHD 2560x1440
20.8  fps    + Compare + 📈 Graph
» With all tested laptops playable in detail settings med..
Additional Benchmarks
Low Preset 1280x720
112.1
low 1920x1080
35.1  fps    + Compare + 📈 Graph
med. 1920x1080
30.7  fps    + Compare + 📈 Graph
high 1920x1080
20.5  fps    + Compare + 📈 Graph
ultra 1920x1080
17.1  fps    + Compare + 📈 Graph
» With all tested laptops playable in detail settings low.
Additional Benchmarks
Max. Performance 1280x720
63.7
Palworld

Palworld

2024
low 1920x1080
70.9  fps    + Compare + 📈 Graph
med. 1920x1080
53.4  fps    + Compare + 📈 Graph
high 1920x1080
51.3  fps    + Compare + 📈 Graph
ultra 1920x1080
47.4  fps    + Compare + 📈 Graph
QHD 2560x1440
26  fps    + Compare + 📈 Graph
4K 3840x2160
11.8  fps    + Compare + 📈 Graph
» With all tested laptops playable in detail settings ultra.
Additional Benchmarks
Very Low Preset 1280x720
120.1
med. 1920x1080
359  fps    + Compare + 📈 Graph
high 1920x1080
296  fps    + Compare + 📈 Graph
ultra 1920x1080
282  fps    + Compare + 📈 Graph
QHD 2560x1440
169.8  fps    + Compare + 📈 Graph
4K 3840x2160
83  fps    + Compare + 📈 Graph
» With all tested laptops playable in detail settings ultra.
low 1920x1080
118.1  fps    + Compare + 📈 Graph
med. 1920x1080
100.8  fps    + Compare + 📈 Graph
high 1920x1080
94.7  fps    + Compare + 📈 Graph
ultra 1920x1080
49  fps    + Compare + 📈 Graph
QHD 2560x1440
26.8  fps    + Compare + 📈 Graph
4K 3840x2160
5.6  fps    + Compare + 📈 Graph
» With all tested laptops playable in detail settings ultra.
low 1920x1080
142.1  fps    + Compare + 📈 Graph
med. 1920x1080
98.9  fps    + Compare + 📈 Graph
high 1920x1080
85.9  fps    + Compare + 📈 Graph
ultra 1920x1080
61.3  fps    + Compare + 📈 Graph
QHD 2560x1440
35.9  fps    + Compare + 📈 Graph
4K 3840x2160
11.1  fps    + Compare + 📈 Graph
» With all tested laptops playable in detail settings ultra.
Additional Benchmarks
Low Preset 1280x720
246
low 1920x1080
40  fps    + Compare
med. 1920x1080
36  fps    + Compare
high 1920x1080
29  fps    + Compare
ultra 1920x1080
21  fps    + Compare
QHD 2560x1440
16  fps    + Compare
4K 3840x2160
5  fps    + Compare
» With all tested laptops playable in detail settings med..
Additional Benchmarks
Low Preset TAA 1280x720
56
low 1920x1080
66  fps    + Compare
med. 1920x1080
59  fps    + Compare
high 1920x1080
44  fps    + Compare
ultra 1920x1080
34  fps    + Compare
QHD 2560x1440
23  fps    + Compare
» With all tested laptops playable in detail settings high.
Additional Benchmarks
Minimum Preset 1280x720
113
low 1920x1080
71.3  fps    + Compare + 📈 Graph
med. 1920x1080
55.3  fps    + Compare + 📈 Graph
high 1920x1080
31.4  fps    + Compare + 📈 Graph
ultra 1920x1080
27.4  fps    + Compare + 📈 Graph
QHD 2560x1440
10.7  fps    + Compare + 📈 Graph
» With all tested laptops playable in detail settings med..
Additional Benchmarks
Ultra Low Preset LowAA 1280x720
161.5
low 1920x1080
33.9  fps    + Compare + 📈 Graph
med. 1920x1080
28.3  fps    + Compare + 📈 Graph
high 1920x1080
25.7  fps    + Compare + 📈 Graph
QHD 2560x1440
16.5  fps    + Compare + 📈 Graph
» The benchmarks indicate that the game is not playable in the tested settings.
Additional Benchmarks
Low Preset 1280x720
57.4
low 1920x1080
45.6  fps    + Compare + 📈 Graph
med. 1920x1080
34.4  fps    + Compare + 📈 Graph
high 1920x1080
24.1  fps    + Compare + 📈 Graph
ultra 1920x1080
15.8  fps    + Compare + 📈 Graph
QHD 2560x1440
8.7  fps    + Compare + 📈 Graph
» With all tested laptops playable in detail settings low.
Additional Benchmarks
Low Preset 1280x720
74.8
low 1920x1080
201.9  fps    + Compare
med. 1920x1080
136.5  fps    + Compare
high 1920x1080
75.4  fps    + Compare
ultra 1920x1080
59.5  fps    + Compare
QHD 2560x1440
38.7  fps    + Compare
4K 3840x2160
19.2  fps    + Compare
» With all tested laptops playable in detail settings ultra.
Additional Benchmarks
Low Preset 1280x720
360.3
low 1920x1080
68  fps    + Compare
med. 1920x1080
62  fps    + Compare
high 1920x1080
51  fps    + Compare
ultra 1920x1080
35  fps    + Compare
QHD 2560x1440
28  fps    + Compare
4K 3840x2160
14  fps    + Compare
» With all tested laptops playable in detail settings high.
Additional Benchmarks
Low Preset (Adaptive Quality Off) 1280x720
104
low 1920x1080
157.3  fps    + Compare + 📈 Graph
med. 1920x1080
144  fps    + Compare + 📈 Graph
high 1920x1080
114.6  fps    + Compare + 📈 Graph
ultra 1920x1080
103.5  fps    + Compare + 📈 Graph
QHD 2560x1440
65.8  fps    + Compare + 📈 Graph
4K 3840x2160
7.5  fps    + Compare + 📈 Graph
» With all tested laptops playable in detail settings ultra.
Additional Benchmarks
Low Preset 1280x720
255
low 1920x1080
248  fps    + Compare + 📈 Graph
med. 1920x1080
201  fps    + Compare + 📈 Graph
high 1920x1080
117.2  fps    + Compare + 📈 Graph
ultra 1920x1080
74.3  fps    + Compare + 📈 Graph
QHD 2560x1440
51.8  fps    + Compare + 📈 Graph
4K 3840x2160
19.7  fps    + Compare + 📈 Graph
» With all tested laptops playable in detail settings ultra.
Additional Benchmarks
Low Preset 1280x720
323
low 1920x1080
61.2  fps    + Compare
med. 1920x1080
48.3  fps    + Compare
high 1920x1080
39  fps    + Compare
ultra 1920x1080
35.2  fps    + Compare
QHD 2560x1440
20.2  fps    + Compare
4K 3840x2160
3.4  fps    + Compare
» With all tested laptops playable in detail settings ultra.
Additional Benchmarks
Low Preset (FSR off) 1280x720
95.9
Steam Deck 1280x800
100.5
Ultra Preset (FSR2 on) 1920x1080
40
30min Start Ultra Preset (FSR off) 1920x1080
29.1
low 1920x1080
61.8  fps    + Compare + 📈 Graph
med. 1920x1080
49.1  fps    + Compare + 📈 Graph
high 1920x1080
40.1  fps    + Compare + 📈 Graph
ultra 1920x1080
39.3  fps    + Compare + 📈 Graph
QHD 2560x1440
26.2  fps    + Compare + 📈 Graph
4K 3840x2160
3.5  fps    + Compare + 📈 Graph
» With all tested laptops playable in detail settings ultra.
Additional Benchmarks
Low Preset SMAA 1280x720
93.4
Lies of P

Lies of P

2023
low 1920x1080
94.3  fps    + Compare + 📈 Graph
med. 1920x1080
81.8  fps    + Compare + 📈 Graph
high 1920x1080
69.7  fps    + Compare + 📈 Graph
ultra 1920x1080
61  fps    + Compare + 📈 Graph
QHD 2560x1440
35.6  fps    + Compare + 📈 Graph
4K 3840x2160
9  fps    + Compare + 📈 Graph
» With all tested laptops playable in detail settings ultra.
Additional Benchmarks
Low Preset 1280x720
161.5
Starfield

Starfield

2023
low 1920x1080
24  fps    + Compare + 📈 Graph
med. 1920x1080
20  fps    + Compare + 📈 Graph
high 1920x1080
13  fps    + Compare + 📈 Graph
ultra 1920x1080
10  fps    + Compare + 📈 Graph
QHD 2560x1440
6.1  fps    + Compare + 📈 Graph
» The benchmarks indicate that the game is not playable in the tested settings.
Additional Benchmarks
Low Preset 1280x720
46.2
low 1920x1080
94.2  fps    + Compare + 📈 Graph
med. 1920x1080
75.8  fps    + Compare + 📈 Graph
high 1920x1080
68.3  fps    + Compare + 📈 Graph
ultra 1920x1080
28.7  fps    + Compare + 📈 Graph
QHD 2560x1440
22.8  fps    + Compare + 📈 Graph
4K 3840x2160
12.3  fps    + Compare + 📈 Graph
» With all tested laptops playable in detail settings high.
Additional Benchmarks
Low Preset 1280x720
117.9
low 1920x1080
21.6  fps    + Compare + 📈 Graph
high 1920x1080
15.5  fps    + Compare + 📈 Graph
» The benchmarks indicate that the game is not playable in the tested settings.
Additional Benchmarks
Low 1280x720
37.5
low 1920x1080
73.5  fps    + Compare + 📈 Graph
med. 1920x1080
68.5  fps    + Compare + 📈 Graph
high 1920x1080
63.2  fps    + Compare + 📈 Graph
ultra 1920x1080
44  fps    + Compare + 📈 Graph
QHD 2560x1440
29.9  fps    + Compare + 📈 Graph
4K 3840x2160
13  fps    + Compare + 📈 Graph
» With all tested laptops playable in detail settings ultra.
Additional Benchmarks
Low Preset 1280x720
115.3
low 1920x1080
45  fps    + Compare + 📈 Graph
med. 1920x1080
38.4  fps    + Compare + 📈 Graph
high 1920x1080
29.5  fps    + Compare + 📈 Graph
ultra 1920x1080
22.8  fps    + Compare + 📈 Graph
QHD 2560x1440
12.2  fps    + Compare + 📈 Graph
4K 3840x2160
6.7  fps    + Compare + 📈 Graph
» With all tested laptops playable in detail settings med..
Additional Benchmarks
Very Low Preset 1280x720
63.7
F1 23

F1 23

2023
low 1920x1080
162.7  fps    + Compare
med. 1920x1080
140  fps    + Compare
high 1920x1080
93.4  fps    + Compare
ultra 1920x1080
42.9  fps    + Compare
QHD 2560x1440
29  fps    + Compare
4K 3840x2160
14.3  fps    + Compare
» With all tested laptops playable in detail settings ultra.
Additional Benchmarks
Ultra Low Preset TAA 1280x720
296
Diablo 4

Diablo 4

2023
low 1920x1080
124.8  fps    + Compare + 📈 Graph
med. 1920x1080
108.4  fps    + Compare + 📈 Graph
high 1920x1080
97.1  fps    + Compare + 📈 Graph
ultra 1920x1080
82.1  fps    + Compare + 📈 Graph
QHD 2560x1440
55.3  fps    + Compare + 📈 Graph
4K 3840x2160
27.2  fps    + Compare + 📈 Graph
» With all tested laptops playable in detail settings ultra.
Additional Benchmarks
Low Preset 1280x720
243
low 1920x1080
43.6  fps    + Compare + 📈 Graph
med. 1920x1080
34.7  fps    + Compare + 📈 Graph
high 1920x1080
32.9  fps    + Compare + 📈 Graph
ultra 1920x1080
28.8  fps    + Compare + 📈 Graph
QHD 2560x1440
15.4  fps    + Compare + 📈 Graph
4K 3840x2160
5.2  fps    + Compare + 📈 Graph
» With all tested laptops playable in detail settings low.
Additional Benchmarks
Low Preset 1280x720
77.8
low 1920x1080
142.2  fps    + Compare + 📈 Graph
med. 1920x1080
119.4  fps    + Compare + 📈 Graph
high 1920x1080
64.4  fps    + Compare + 📈 Graph
ultra 1920x1080
54.2  fps    + Compare + 📈 Graph
QHD 2560x1440
39.2  fps    + Compare + 📈 Graph
4K 3840x2160
10.3  fps    + Compare + 📈 Graph
» With all tested laptops playable in detail settings ultra.
Additional Benchmarks
Low Preset Low TAA 1280x720
251
low 1920x1080
53.1  fps    + Compare + 📈 Graph
med. 1920x1080
40.8  fps    + Compare + 📈 Graph
high 1920x1080
35.7  fps    + Compare + 📈 Graph
ultra 1920x1080
26.7  fps    + Compare + 📈 Graph
QHD 2560x1440
15.9  fps    + Compare + 📈 Graph
» With all tested laptops playable in detail settings high.
Additional Benchmarks
Low Preset 1280x720
79.2
low 1920x1080
71.4  fps    + Compare + 📈 Graph
med. 1920x1080
46.4  fps    + Compare + 📈 Graph
high 1920x1080
39.6  fps    + Compare + 📈 Graph
ultra 1920x1080
17.8  fps    + Compare + 📈 Graph
QHD 2560x1440
14.7  fps    + Compare + 📈 Graph
4K 3840x2160
9.2  fps    + Compare + 📈 Graph
» With all tested laptops playable in detail settings high.
Additional Benchmarks
Prioritize Performance Preset 1280x720
120.5
low 1920x1080
62.8  fps    + Compare
med. 1920x1080
52.8  fps    + Compare
high 1920x1080
46.9  fps    + Compare
ultra 1920x1080
42.7  fps    + Compare
QHD 2560x1440
30.5  fps    + Compare
4K 3840x2160
18.1  fps    + Compare
» With all tested laptops playable in detail settings ultra.
Additional Benchmarks
Minimum Settings 1280x720
109.2
low 1920x1080
57.8  fps    + Compare + 📈 Graph
med. 1920x1080
41.7  fps    + Compare + 📈 Graph
high 1920x1080
39.3  fps    + Compare + 📈 Graph
ultra 1920x1080
39  fps    + Compare + 📈 Graph
QHD 2560x1440
26.7  fps    + Compare + 📈 Graph
4K 3840x2160
14.5  fps    + Compare + 📈 Graph
» With all tested laptops playable in detail settings ultra.
Additional Benchmarks
Ultra Low Preset 1280x720
88.9
low 1920x1080
98.9  fps    + Compare + 📈 Graph
med. 1920x1080
73.4  fps    + Compare + 📈 Graph
high 1920x1080
42.4  fps    + Compare + 📈 Graph
ultra 1920x1080
33.2  fps    + Compare + 📈 Graph
QHD 2560x1440
24  fps    + Compare + 📈 Graph
4K 3840x2160
10.1  fps    + Compare + 📈 Graph
» With all tested laptops playable in detail settings high.
Additional Benchmarks
Low Preset 1280x720
160.1
Returnal

Returnal

2023
low 1920x1080
52  fps    + Compare
med. 1920x1080
48  fps    + Compare
high 1920x1080
43  fps    + Compare
ultra 1920x1080
30  fps    + Compare
QHD 2560x1440
21  fps    + Compare
4K 3840x2160
10  fps    + Compare
» With all tested laptops playable in detail settings high.
Additional Benchmarks
Low Preset 1280x720
68
low 1920x1080
72.4  fps    + Compare + 📈 Graph
med. 1920x1080
54.3  fps    + Compare + 📈 Graph
high 1920x1080
41.4  fps    + Compare + 📈 Graph
ultra 1920x1080
33.4  fps    + Compare + 📈 Graph
QHD 2560x1440
22.4  fps    + Compare + 📈 Graph
4K 3840x2160
6.8  fps    + Compare + 📈 Graph
» With all tested laptops playable in detail settings high.
Additional Benchmarks
Low Preset Low TAA 1280x720
120.2
low 1920x1080
46.5  fps    + Compare + 📈 Graph
med. 1920x1080
41.9  fps    + Compare + 📈 Graph
high 1920x1080
32.9  fps    + Compare + 📈 Graph
ultra 1920x1080
30.3  fps    + Compare + 📈 Graph
QHD 2560x1440
5.2  fps    + Compare + 📈 Graph
» With all tested laptops playable in detail settings med..
Additional Benchmarks
Low Preset TAA 1280x720
76.4
low 1920x1080
112.6  fps    + Compare + 📈 Graph
med. 1920x1080
83.9  fps    + Compare + 📈 Graph
high 1920x1080
70.4  fps    + Compare + 📈 Graph
ultra 1920x1080
56.1  fps    + Compare + 📈 Graph
QHD 2560x1440
37.2  fps    + Compare + 📈 Graph
4K 3840x2160
13.5  fps    + Compare + 📈 Graph
» With all tested laptops playable in detail settings ultra.
Additional Benchmarks
Low Preset / Off 1280x720
187.3
low 1920x1080
139.4  fps    + Compare + 📈 Graph
med. 1920x1080
76.9  fps    + Compare + 📈 Graph
high 1920x1080
60.1  fps    + Compare + 📈 Graph
ultra 1920x1080
50.7  fps    + Compare + 📈 Graph
QHD 2560x1440
31.3  fps    + Compare + 📈 Graph
4K 3840x2160
7.8  fps    + Compare + 📈 Graph
» With all tested laptops playable in detail settings ultra.
Additional Benchmarks
Low Preset 1280x720
227
low 1920x1080
85.4  fps    + Compare
med. 1920x1080
58.1  fps    + Compare
high 1920x1080
34.3  fps    + Compare
ultra 1920x1080
31.9  fps    + Compare
QHD 2560x1440
17.5  fps    + Compare
4K 3840x2160
7.9  fps    + Compare
» With all tested laptops playable in detail settings med..
Additional Benchmarks
Low Preset (without FSR Upscaling) 1280x720
141.7
low 1920x1080
90.2  fps    + Compare + 📈 Graph
med. 1920x1080
68.4  fps    + Compare + 📈 Graph
high 1920x1080
50.7  fps    + Compare + 📈 Graph
ultra 1920x1080
35.4  fps    + Compare + 📈 Graph
QHD 2560x1440
23.7  fps    + Compare + 📈 Graph
4K 3840x2160
11.4  fps    + Compare + 📈 Graph
» With all tested laptops playable in detail settings ultra.
Additional Benchmarks
Low Preset 1280x720
138.2
low 1920x1080
75.8  fps    + Compare + 📈 Graph
med. 1920x1080
65.8  fps    + Compare + 📈 Graph
high 1920x1080
54.9  fps    + Compare + 📈 Graph
ultra 1920x1080
43.4  fps    + Compare + 📈 Graph
QHD 2560x1440
27.6  fps    + Compare + 📈 Graph
4K 3840x2160
15.8  fps    + Compare + 📈 Graph
» With all tested laptops playable in detail settings ultra.
Additional Benchmarks
Very Low Preset 1280x720
104.8
low 1920x1080
79  fps    + Compare
med. 1920x1080
46  fps    + Compare
high 1920x1080
48  fps    + Compare
ultra 1920x1080
42  fps    + Compare
QHD 2560x1440
29  fps    + Compare
4K 3840x2160
17  fps    + Compare
» With all tested laptops playable in detail settings ultra.
Additional Benchmarks
Basic Quality Preset T2X SMAA 1280x720
122
low 1920x1080
50.9  fps    + Compare + 📈 Graph
med. 1920x1080
45  fps    + Compare + 📈 Graph
high 1920x1080
28.7  fps    + Compare + 📈 Graph
ultra 1920x1080
26.5  fps    + Compare + 📈 Graph
QHD 2560x1440
13.2  fps    + Compare + 📈 Graph
» With all tested laptops playable in detail settings med..
Additional Benchmarks
Low Preset 1280x720
73.9
low 1920x1080
60.4  fps    + Compare + 📈 Graph
med. 1920x1080
44.7  fps    + Compare + 📈 Graph
high 1920x1080
32.2  fps    + Compare + 📈 Graph
ultra 1920x1080
23.9  fps    + Compare + 📈 Graph
QHD 2560x1440
14.1  fps    + Compare + 📈 Graph
4K 3840x2160
6.8  fps    + Compare + 📈 Graph
» With all tested laptops playable in detail settings med..
Additional Benchmarks
Low Preset 1280x720
84.7
FIFA 23

FIFA 23

2022
low 1920x1080
172.2  fps    + Compare + 📈 Graph
med. 1920x1080
160.4  fps    + Compare + 📈 Graph
high 1920x1080
105  fps    + Compare + 📈 Graph
ultra 1920x1080
103.2  fps    + Compare + 📈 Graph
QHD 2560x1440
37.2  fps    + Compare + 📈 Graph
4K 3840x2160
7.9  fps    + Compare + 📈 Graph
» With all tested laptops playable in detail settings ultra.
Additional Benchmarks
Low Rendering Quality 1280x720
276
low 1920x1080
79 80.1 ~ 80 fps    + Compare + 📈 Graph
med. 1920x1080
55.7 56.5 ~ 56 fps    + Compare + 📈 Graph
high 1920x1080
44.6 58.2 ~ 51 fps    + Compare + 📈 Graph
ultra 1920x1080
23.8 33.1 ~ 28 fps    + Compare + 📈 Graph
QHD 2560x1440
11.7 17.6 ~ 15 fps    + Compare + 📈 Graph
4K 3840x2160
4.2 4.3 ~ 4 fps    + Compare + 📈 Graph
» With all tested laptops playable in detail settings high.
Additional Benchmarks
Low Preset 1280x720
119.5
F1 22

F1 22

2022
low 1920x1080
161.6 173.4 ~ 168 fps    + Compare
med. 1920x1080
142.8 154.1 ~ 148 fps    + Compare
high 1920x1080
103 107.9 ~ 105 fps    + Compare
ultra 1920x1080
72.1 81.4 ~ 77 fps    + Compare
QHD 2560x1440
51 55.9 ~ 53 fps    + Compare
4K 3840x2160
25.5 28.4 ~ 27 fps    + Compare
» With all tested laptops playable in detail settings ultra.
Additional Benchmarks
Ultra Low Preset 16xAF TAA 1280x720
285
300
low 1920x1080
193.7  fps    + Compare + 📈 Graph
med. 1920x1080
104.3  fps    + Compare + 📈 Graph
high 1920x1080
100.8  fps    + Compare + 📈 Graph
ultra 1920x1080
95.8  fps    + Compare + 📈 Graph
QHD 2560x1440
53.1  fps    + Compare + 📈 Graph
4K 3840x2160
20.9  fps    + Compare + 📈 Graph
» With all tested laptops playable in detail settings ultra.
Additional Benchmarks
Low Preset 1280x720
322
low 1920x1080
73.3  fps    + Compare + 📈 Graph
med. 1920x1080
76.8  fps    + Compare + 📈 Graph
high 1920x1080
75.8  fps    + Compare + 📈 Graph
ultra 1920x1080
75.2  fps    + Compare + 📈 Graph
QHD 2560x1440
45.1  fps    + Compare + 📈 Graph
4K 3840x2160
15.1  fps    + Compare + 📈 Graph
» With all tested laptops playable in detail settings ultra.
Additional Benchmarks
Lowest Settings 1280x720
137.9
low 1920x1080
99.2 107.4 109.1 ~ 105 fps    + Compare
med. 1920x1080
76 79.9 85.7 ~ 81 fps    + Compare
high 1920x1080
49.8 50.3 54.8 ~ 52 fps    + Compare
ultra 1920x1080
33.4 35.2 ~ 34 fps    + Compare
QHD 2560x1440
21.4 22.1 ~ 22 fps    + Compare
4K 3840x2160
8.5 10.8 ~ 10 fps    + Compare
» With all tested laptops playable in detail settings high.
Additional Benchmarks
Lowest Preset (DX12) 1280x720
191.3
214
low 1920x1080
59.3 67.4 ~ 63 fps    + Compare
med. 1920x1080
46.6 53.3 ~ 50 fps    + Compare
high 1920x1080
38.7 41.1 ~ 40 fps    + Compare
ultra 1920x1080
32.1 35 ~ 34 fps    + Compare
QHD 2560x1440
18.5 20.9 ~ 20 fps    + Compare
4K 3840x2160
3.1 3.3 ~ 3 fps    + Compare
» With all tested laptops playable in detail settings high.
Additional Benchmarks
Low Preset 1280x720
83.7
92.3
Elex 2

Elex 2

2022
low 1920x1080
60.9  fps    + Compare + 📈 Graph
med. 1920x1080
54.8  fps    + Compare + 📈 Graph
high 1920x1080
47.1  fps    + Compare + 📈 Graph
QHD 2560x1440
25.9  fps    + Compare + 📈 Graph
4K 3840x2160
9.9 36.2 ~ 23 fps    + Compare + 📈 Graph
» With all tested laptops playable in detail settings high.
Additional Benchmarks
Low / Off 1280x720
80.6
low 1920x1080
170 172.6 202 ~ 182 fps    + Compare
med. 1920x1080
116 126.3 147.3 ~ 130 fps    + Compare
high 1920x1080
96 99.3 113.1 ~ 103 fps    + Compare
ultra 1920x1080
66 71.8 78 ~ 72 fps    + Compare
QHD 2560x1440
50 54.9 56.6 ~ 54 fps    + Compare
4K 3840x2160
25 26.7 30.7 ~ 27 fps    + Compare
» With all tested laptops playable in detail settings ultra.
Additional Benchmarks
Low Preset 1280x720
230
282
low 1920x1080
58.9  fps    + Compare + 📈 Graph
med. 1920x1080
52.2  fps    + Compare + 📈 Graph
high 1920x1080
45  fps    + Compare + 📈 Graph
ultra 1920x1080
37.2  fps    + Compare + 📈 Graph
QHD 2560x1440
27.6  fps    + Compare + 📈 Graph
4K 3840x2160
14.4  fps    + Compare + 📈 Graph
» With all tested laptops playable in detail settings ultra.
low 1920x1080
69.1  fps    + Compare + 📈 Graph
med. 1920x1080
34.8  fps    + Compare + 📈 Graph
high 1920x1080
28.2  fps    + Compare + 📈 Graph
QHD 2560x1440
18.5  fps    + Compare + 📈 Graph
4K 3840x2160
8.6  fps    + Compare + 📈 Graph
» With all tested laptops playable in detail settings low.
Additional Benchmarks
Low Quality 1280x720
96.7
low 1920x1080
99  fps    + Compare
med. 1920x1080
91  fps    + Compare
high 1920x1080
88  fps    + Compare
ultra 1920x1080
68  fps    + Compare
QHD 2560x1440
31  fps    + Compare
4K 3840x2160
17  fps    + Compare
» With all tested laptops playable in detail settings ultra.
Additional Benchmarks
Ultra Low Preset (with Fixed Resolution Quality) 1280x720
173
low 1920x1080
66.1 76.4 76.6 ~ 73 fps    + Compare + 📈 Graph
med. 1920x1080
53.4 63.2 63.3 ~ 60 fps    + Compare + 📈 Graph
high 1920x1080
42.3 46.3 48.3 ~ 46 fps    + Compare + 📈 Graph
ultra 1920x1080
27.2 27.6 28.4 ~ 28 fps    + Compare + 📈 Graph
QHD 2560x1440
19.3 20.8 21.4 ~ 21 fps    + Compare + 📈 Graph
4K 3840x2160
5.1 8.1 8.4 ~ 7 fps    + Compare + 📈 Graph
» With all tested laptops playable in detail settings high.
Additional Benchmarks
Low Preset 1280x720
101
113.4
med. 1920x1080
73.4  fps    + Compare + 📈 Graph
high 1920x1080
71.3  fps    + Compare + 📈 Graph
ultra 1920x1080
68.9  fps    + Compare + 📈 Graph
QHD 2560x1440
63.6  fps    + Compare + 📈 Graph
4K 3840x2160
36.3  fps    + Compare + 📈 Graph
» With all tested laptops playable in detail settings ultra.
Additional Benchmarks
Low Preset 1920x1080
84.9
low 1280x720
294  fps    + Compare + 📈 Graph
med. 1920x1080
136  fps    + Compare + 📈 Graph
high 1920x1080
102  fps    + Compare + 📈 Graph
ultra 1920x1080
79.4  fps    + Compare + 📈 Graph
QHD 2560x1440
58.6  fps    + Compare + 📈 Graph
4K 3840x2160
34.8  fps    + Compare + 📈 Graph
» With all tested laptops playable in detail settings ultra.
Additional Benchmarks
Low Preset 1920x1080
245
low 1280x720
133  fps    + Compare + 📈 Graph
med. 1920x1080
74.2  fps    + Compare + 📈 Graph
high 1920x1080
62.2  fps    + Compare + 📈 Graph
ultra 1920x1080
20.1  fps    + Compare + 📈 Graph
QHD 2560x1440
4.9  fps    + Compare + 📈 Graph
» With all tested laptops playable in detail settings high.
Additional Benchmarks
Low Preset 1920x1080
86.7
low 1280x720
180 194 195 ~ 190 fps    + Compare
med. 1920x1080
88 93 97 ~ 93 fps    + Compare
high 1920x1080
77 82 85 ~ 81 fps    + Compare
ultra 1920x1080
30 31 32 ~ 31 fps    + Compare
QHD 2560x1440
26 27 27 ~ 27 fps    + Compare
4K 3840x2160
18 18 19 ~ 18 fps    + Compare
» With all tested laptops playable in detail settings high.
Additional Benchmarks
Low Preset 1920x1080
110
119
low 1280x720
85.7  fps    + Compare + 📈 Graph
med. 1920x1080
63.1  fps    + Compare + 📈 Graph
high 1920x1080
74.6  fps    + Compare + 📈 Graph