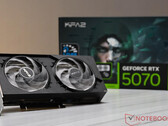
Notebookcheck Logo

NVIDIA GeForce RTX 5070

NVIDIA GeForce RTX 5070

The Nvidia GeForce RTX 5070 is a fast desktop graphics card utilizing the GB205 chip based on the Blackwell architecture. The model offers 6144 CUDA cores, and 12 GB GDDR7 graphics memory with a 192-bit memory bus (672 GB/s). The base clock of the GPU (reference model) is specified at 2.16 GHz, while the boost clock can reach 2.51 GHz.

Architecture

Nvidia GeForce RTX 5070 features new Tensor (5th Gen) and RT-cores (4th Gen), with 988 AI TOPS and 94 TFLOPS performance respectively. Blackwell architecture is the first to feature the new DLSS 4 Multi Frame generation, which, thanks to enhanced AI capabilities can generate more frames per second while using less memory and delivering better picture quality. Nvidia also managed to improve the performance and output quality of DLSS, Frame Generation, and Ray Reconstruction features (also available for the previous RTX 4000 series). Additionally, the new models now support Reflex 2 low latency mode and Frame Warp.

Performance

Thanks to the new Tensor and RT-cores, as well as some bump in CUDA cores, the card is promised (by Nvidia) to offer as much as 2x better performance compared to the previous RTX 4070 (thanks to the new DLSS 4 MFG feature). According to Nvidia's presentation, the card can even reach the performance level of the RTX 4090. The RTX 5070 is expected to be among the faster graphics cards of 2025 and, presumably, will deliver good performance in games at high resolution.

Our own tests show that the card is 4% faster than the RTX 4070 Ti in the synthetic benchmarks and almost identical to the Radeon RX 7900XT in games (RTX 5070 is 1% slower at 4K, 1080p, and 2K). 

Power consumption

According to Nvidia, the GB205 chip is manufactured using the modern 4N FinFET process at TSMC and is specified with a TGP (Total Graphics Power) of 250 watts (50 W higher than RTX 4070). Nvidia now also specifies maximum GPU temperature, which is stated at 85 ℃ for RTX 5070. The model also requires at least 650W PSU.


GeForce RTX 5000 Desktop GPU Series

GeForce RTX 5090 compare 21760 @ 2.01 - 2.41 GHz512 Bit @ 28000 MHz
GeForce RTX 5080 compare 10752 @ 2.3 - 2.62 GHz256 Bit @ 30000 MHz
GeForce RTX 5070 Ti compare 8960 @ 2.3 - 2.45 GHz256 Bit @ 28000 MHz
GeForce RTX 5070 6144 @ 2.33 - 2.51 GHz192 Bit
GeForce RTX 5060 Ti compare 4608 @ 2.41 - 2.57 GHz128 Bit
GeForce RTX 5060 compare 3840 @ 2.28 - 2.5 GHz128 Bit
ArchitectureBlackwell
Pipelines6144 - unified
TMUs192
ROPs80
Raytracing Cores48
Tensor / AI Cores192
Core Speed2325 - 2510 (Boost) MHz
Memory Bus Width192 Bit
Memory TypeGDDR7
Max. Amount of Memory12 GB
Shared Memoryno
Memory Bandwidth672 GB/s
APIDirectX 12 Ultimate, OpenGL 4.6, Vulkan 1.4
technology5 nm
PCIe5.0
Displays4 Displays (max.), HDMI 2.1b, DisplayPort 2.1b
Features4K at 480Hz or 8K at 120Hz with DSC DLSS 4: Super Resolution, DLAA, Ray Reconstruction, Frame Generation, Multi Frame Generation NVIDIA Reflex 2: Low Latency Mode, Frame Warp
Date of Announcement07.01.2025
PredecessorNVIDIA GeForce RTX 4070

Benchmarks

Performance Rating - 3DMark 11 + Fire Strike + Time Spy
21.1 pt (63%)
Restrict / Search: Model: Max. age: years
3DMark - 3DMark Time Spy Score
min: 21110     avg: 21650     median: 21650 (58%)     max: 22190 Points
3DMark - 3DMark Time Spy Graphics
min: 22096     avg: 22260     median: 22259.5 (45%)     max: 22423 Points
Restrict / Search: Model: Max. age: years
3DMark - 3DMark Ice Storm Unlimited Graphics
862499 Points (87%)
3DMark - 3DMark Ice Storm Extreme Graphics
650205 Points (76%)
3DMark - 3DMark Cloud Gate Score
94074 Points (89%)
3DMark - 3DMark Cloud Gate Graphics
258137 Points (64%)
3DMark - 3DMark Fire Strike Standard Score
min: 43889     avg: 45676     median: 45675.5 (69%)     max: 47462 Points
3DMark - 3DMark Fire Strike Standard Graphics
min: 54517     avg: 56472     median: 56471.5 (52%)     max: 58426 Points
3DMark - 3DMark Ice Storm Graphics
730073 Points (81%)
3DMark - 3DMark Night Raid
91701 Points (87%)
3DMark - 3DMark Night Raid Graphics Score
214203 Points (82%)
3DMark 11 - 3DM11 Performance Score
59246 Points (72%)
3DMark 11 - 3DM11 Performance GPU
71642 Points (55%)
Restrict / Search: Model: Max. age: years
3DMark Vantage
3DM Vant. Perf. total +
3DMark Vantage - 3DM Vant. Perf. total
137827 Points (40%)
3DM Vant. Perf. GPU no PhysX +
3DMark Vantage - 3DM Vant. Perf. GPU no PhysX
151920 Points (83%)
Restrict / Search: Model: Max. age: years
3DMark 05 - 3DMark 05 - Standard
85743 Points (94%)
Restrict / Search: Model: Max. age: years
3DMark 06 3DMark 06 - Standard 1280x1024 +
3DMark 06
67026 Points (88%)
Unigine Valley 1.0 - Unigine Valley 1.0 DX
min: 248.9     avg: 249.4     median: 249.4 (76%)     max: 249.9 fps
Blender - Blender 3.3 Classroom CUDA *
22 Seconds (3%)
Blender - Blender 3.3 Classroom OPTIX *
min: 12     avg: 12.5     median: 12.5 (5%)     max: 13 Seconds
SPECviewperf 12
specvp12 sw-03 +
SPECviewperf 12 - specvp12 sw-03
103 fps (26%)
specvp12 snx-02 +
SPECviewperf 12 - specvp12 snx-02
20.5 fps (3%)
specvp12 showcase-01 +
SPECviewperf 12 - specvp12 showcase-01
285 fps (50%)
specvp12 mediacal-01 +
SPECviewperf 12 - specvp12 mediacal-01
150 fps (38%)
specvp12 maya-04 +
SPECviewperf 12 - specvp12 maya-04
302 fps (82%)
specvp12 energy-01 +
SPECviewperf 12 - specvp12 energy-01
42.8 fps (38%)
specvp12 creo-01 +
SPECviewperf 12 - specvp12 creo-01
98.4 fps (39%)
specvp12 3dsmax-05 +
SPECviewperf 12 - specvp12 3dsmax-05
456 fps (69%)
SPECviewperf 13 specvp13 sw-04 +
SPECviewperf 13 - specvp13 sw-04
164 fps (44%)
specvp13 snx-03 +
SPECviewperf 13 - specvp13 snx-03
36.9 fps (4%)
specvp13 showcase-02 +
SPECviewperf 13 - specvp13 showcase-02
287 fps (49%)
specvp13 medical-02 +
SPECviewperf 13 - specvp13 medical-02
115 fps (20%)
specvp13 maya-05 +
SPECviewperf 13 - specvp13 maya-05
608 fps (69%)
specvp13 energy-02 +
SPECviewperf 13 - specvp13 energy-02
72 fps (23%)
specvp13 creo-02 +
SPECviewperf 13 - specvp13 creo-02
451 fps (66%)
specvp13 3dsmax-06 +
SPECviewperf 13 - specvp13 3dsmax-06
444 fps (69%)
SPECviewperf 2020 specvp2020 snx-04 1080p +
SPECviewperf 2020 - specvp2020 snx-04 1080p
36.5 fps (4%)
specvp2020 medical-03 1080p +
SPECviewperf 2020 - specvp2020 medical-03 1080p
56 fps (15%)
specvp2020 maya-06 1080p +
SPECviewperf 2020 - specvp2020 maya-06 1080p
713 fps (76%)
specvp2020 energy-03 1080p +
SPECviewperf 2020 - specvp2020 energy-03 1080p
72.3 fps (12%)
specvp2020 creo-03 1080p +
SPECviewperf 2020 - specvp2020 creo-03 1080p
135 fps (46%)
specvp2020 catia-06 1080p +
SPECviewperf 2020 - specvp2020 catia-06 1080p
110 fps (54%)
specvp2020 3dsmax-07 1080p +
SPECviewperf 2020 - specvp2020 3dsmax-07 1080p
219 fps (58%)
specvp2020 snx-04 4k +
SPECviewperf 2020 - specvp2020 snx-04 4k
30.5 fps (3%)
specvp2020 medical-03 4k +
SPECviewperf 2020 - specvp2020 medical-03 4k
23.2 fps (15%)
specvp2020 maya-06 4k +
SPECviewperf 2020 - specvp2020 maya-06 4k
414 fps (59%)
specvp2020 energy-03 4k +
SPECviewperf 2020 - specvp2020 energy-03 4k
70.8 fps (10%)
specvp2020 creo-03 4k +
SPECviewperf 2020 - specvp2020 creo-03 4k
117 fps (52%)
specvp2020 catia-06 4k +
SPECviewperf 2020 - specvp2020 catia-06 4k
62.5 fps (41%)
specvp2020 3dsmax-07 4k +
SPECviewperf 2020 - specvp2020 3dsmax-07 4k
148 fps (50%)
Basemark GPU 1.2 - Basemark GPU 1.2 Vulkan Official Medium Offscreen 1080
2377 fps (58%)
Basemark GPU 1.2 - Basemark GPU 1.2 Vulkan Official High Offscreen 2160
234 fps (43%)
Geekbench 6.4 - Geekbench 6.4 GPU OpenCL
189865 points (49%)
Geekbench 6.4 - Geekbench 6.4 GPU Vulkan
190532 points (47%)
LuxMark v2.0 64Bit - LuxMark v2.0 Room GPU
min: 8551     avg: 8809     median: 8809 (32%)     max: 9067 Samples/s
LuxMark v2.0 64Bit - LuxMark v2.0 Sala GPU
min: 19548     avg: 20024     median: 20024 (35%)     max: 20500 Samples/s
ComputeMark v2.1 - ComputeMark v2.1 Result
min: 45944     avg: 46643     median: 46643 (39%)     max: 47342 points
Power Consumption - Furmark Stress Test Power Consumption - external Monitor *
min: 353     avg: 358.5     median: 358.5 (48%)     max: 364 Watt
0255075100125150175200225250275300325350375400Tooltip
Power Consumption - The Witcher 3 Power Consumption - external Monitor *
min: 357     avg: 369.5     median: 369.5 (52%)     max: 382 Watt
0255075100125150175200225250275300325350375400Tooltip
Power Consumption - Power Efficiency - Witcher 3 ultra external Monitor
min: 0.552     avg: 0.6     median: 0.6 (47%)     max: 0.585 fps per Watt
Power Consumption - Cyberpunk 2077 Power Consumption - external Monitor *
min: 382     avg: 439     median: 439 (56%)     max: 496 Watt
0306090120150180210240270300330360390420450480Tooltip
Power Consumption - Power Efficiency - Cyberpunk 2077 ultra
min: 0.2897     avg: 0.4     median: 0.4 (1%)     max: 0.4118 fps per Watt
Emissions Witcher 3 Fan Noise +
Emissions - Witcher 3 Fan Noise
44 dB(A) (63%)
- Range of benchmark values
red legend - Average benchmark values
* Smaller numbers mean a higher performance

Game Benchmarks

The following benchmarks stem from our benchmarks of review laptops. The performance depends on the used graphics memory, clock rate, processor, system settings, drivers, and operating systems. So the results don't have to be representative for all laptops with this GPU. For detailed information on the benchmark results, click on the fps number.

low 1920x1080
125.5  fps    + Compare + 📈 Graph
med. 1920x1080
109.5  fps    + Compare + 📈 Graph
high 1920x1080
102.5  fps    + Compare + 📈 Graph
ultra 1920x1080
99.3  fps    + Compare + 📈 Graph
QHD 2560x1440
70.3  fps    + Compare + 📈 Graph
4K 3840x2160
38.6  fps    + Compare + 📈 Graph
4K DLSS 3840x2160
58.9  fps    + Compare + 📈 Graph
QHD DLSS 2560x1440
96.4  fps    + Compare + 📈 Graph
» With all tested laptops playable in detail settings ultra.
low 1920x1080
205  fps    + Compare + 📈 Graph
med. 1920x1080
158.1  fps    + Compare + 📈 Graph
high 1920x1080
103.7  fps    + Compare + 📈 Graph
ultra 1920x1080
52.2  fps    + Compare + 📈 Graph
QHD 2560x1440
37.7  fps    + Compare + 📈 Graph
4K 3840x2160
22.2  fps    + Compare + 📈 Graph
4K DLSS 3840x2160
35  fps    + Compare + 📈 Graph
QHD DLSS 2560x1440
56.1  fps    + Compare + 📈 Graph
» With all tested laptops playable in detail settings ultra.
low 1920x1080
111  fps    + Compare
med. 1920x1080
100  fps    + Compare
high 1920x1080
87  fps    + Compare
ultra 1920x1080
66  fps    + Compare
QHD 2560x1440
53  fps    + Compare
4K 3840x2160
37  fps    + Compare
4K DLSS 3840x2160
50  fps    + Compare
QHD DLSS 2560x1440
61  fps    + Compare
» With all tested laptops playable in detail settings ultra.
Additional Benchmarks
Ultra High + GI + DLSS Quality + FG 2560x1440
94
Ultra High + GI + DLSS Quality + FG 3840x2160
70
low 1920x1080
555  fps    + Compare + 📈 Graph
med. 1920x1080
404  fps    + Compare + 📈 Graph
high 1920x1080
298  fps    + Compare + 📈 Graph
QHD 2560x1440
188  fps    + Compare + 📈 Graph
4K 3840x2160
87.7  fps    + Compare + 📈 Graph
» With all tested laptops playable in detail settings high.
low 1920x1080
120.4  fps    + Compare
med. 1920x1080
102.1  fps    + Compare
ultra 1920x1080
81.9  fps    + Compare
QHD 2560x1440
64.1  fps    + Compare
» With all tested laptops playable in detail settings ultra.
low 1920x1080
269  fps    + Compare + 📈 Graph
med. 1920x1080
208  fps    + Compare + 📈 Graph
high 1920x1080
167.6  fps    + Compare + 📈 Graph
ultra 1920x1080
116.7  fps    + Compare + 📈 Graph
QHD 2560x1440
85.2  fps    + Compare + 📈 Graph
4K 3840x2160
48  fps    + Compare + 📈 Graph
4K DLSS 3840x2160
65.3  fps    + Compare + 📈 Graph
QHD DLSS 2560x1440
106.9  fps    + Compare + 📈 Graph
» With all tested laptops playable in detail settings ultra.
low 1920x1080
196.9  fps    + Compare + 📈 Graph
high 1920x1080
147.2  fps    + Compare + 📈 Graph
ultra 1920x1080
130.8 131 ~ 131 fps    + Compare + 📈 Graph
QHD 2560x1440
103.6 103.6 ~ 104 fps    + Compare + 📈 Graph
4K 3840x2160
53.8 54 ~ 54 fps    + Compare + 📈 Graph
QHD DLSS 2560x1440
122.2  fps    + Compare + 📈 Graph
» With all tested laptops playable in detail settings ultra.
Stalker 2

Stalker 2

2024
low 1920x1080
132.9  fps    + Compare + 📈 Graph
med. 1920x1080
115.3  fps    + Compare + 📈 Graph
high 1920x1080
97.4  fps    + Compare + 📈 Graph
ultra 1920x1080
79.7 81.2 ~ 80 fps    + Compare + 📈 Graph
QHD 2560x1440
61.3 61.8 ~ 62 fps    + Compare + 📈 Graph
4K 3840x2160
35.7 37.2 ~ 36 fps    + Compare + 📈 Graph
4K DLSS 3840x2160
77.5 78.6 ~ 78 fps    + Compare + 📈 Graph
QHD DLSS 2560x1440
126.5 128.8 ~ 128 fps    + Compare + 📈 Graph
» With all tested laptops playable in detail settings ultra.
Additional Benchmarks
Low Preset 1280x720
169.6
Epic Preset DLSS 1920x1080
97.1
low 1920x1080
220  fps    + Compare
med. 1920x1080
209  fps    + Compare
high 1920x1080
147  fps    + Compare
ultra 1920x1080
139  fps    + Compare
QHD 2560x1440
103  fps    + Compare
4K 3840x2160
64  fps    + Compare
4K DLSS 3840x2160
67  fps    + Compare
QHD DLSS 2560x1440
112  fps    + Compare
» With all tested laptops playable in detail settings ultra.
Additional Benchmarks
Minimum Preset 1280x720
239
low 1920x1080
189  fps    + Compare + 📈 Graph
med. 1920x1080
170.1  fps    + Compare + 📈 Graph
high 1920x1080
122.9  fps    + Compare + 📈 Graph
ultra 1920x1080
92.7  fps    + Compare + 📈 Graph
QHD 2560x1440
66.9  fps    + Compare + 📈 Graph
4K 3840x2160
37.6  fps    + Compare + 📈 Graph
4K DLSS 3840x2160
54.6  fps    + Compare + 📈 Graph
QHD DLSS 2560x1440
86.6  fps    + Compare + 📈 Graph
» With all tested laptops playable in detail settings ultra.
Additional Benchmarks
Low Preset 1280x720
178.5
low 1920x1080
261  fps    + Compare + 📈 Graph
med. 1920x1080
221  fps    + Compare + 📈 Graph
high 1920x1080
199.4  fps    + Compare + 📈 Graph
ultra 1920x1080
186.7  fps    + Compare + 📈 Graph
QHD 2560x1440
141.1  fps    + Compare + 📈 Graph
4K 3840x2160
81.5  fps    + Compare + 📈 Graph
4K DLSS 3840x2160
122.2  fps    + Compare + 📈 Graph
QHD DLSS 2560x1440
190.9  fps    + Compare + 📈 Graph
» With all tested laptops playable in detail settings ultra.
Additional Benchmarks
Low Preset TAA 1280x720
348
low 1920x1080
138.1  fps    + Compare + 📈 Graph
med. 1920x1080
134.7  fps    + Compare + 📈 Graph
high 1920x1080
116.5  fps    + Compare + 📈 Graph
ultra 1920x1080
107.1  fps    + Compare + 📈 Graph
QHD 2560x1440
74.4  fps    + Compare + 📈 Graph
4K 3840x2160
42.2  fps    + Compare + 📈 Graph
4K DLSS 3840x2160
63.5  fps    + Compare + 📈 Graph
QHD DLSS 2560x1440
106.8  fps    + Compare + 📈 Graph
» With all tested laptops playable in detail settings ultra.
Additional Benchmarks
Low Preset (Super Resolution off) 1280x720
198.1
Ultra Preset + Quality DLSS FG 2560x1440
168.4
Ultra Preset + Quality DLSS FG 3840x2160
98.9
low 1920x1080
151.6  fps    + Compare + 📈 Graph
med. 1920x1080
142  fps    + Compare + 📈 Graph
high 1920x1080
139.7  fps    + Compare + 📈 Graph
ultra 1920x1080
139  fps    + Compare + 📈 Graph
QHD 2560x1440
109.6  fps    + Compare + 📈 Graph
4K 3840x2160
58.4  fps    + Compare + 📈 Graph
4K DLSS 3840x2160
91.6  fps    + Compare + 📈 Graph
QHD DLSS 2560x1440
140.9  fps    + Compare + 📈 Graph
» With all tested laptops playable in detail settings ultra.
Additional Benchmarks
Low Preset TAA 1280x720
150.6
low 1920x1080 cinem.
109.3  fps    + Compare + 📈 Graph
med. 1920x1080 cinem.
102.4  fps    + Compare + 📈 Graph
high 1920x1080 cinem.
88  fps    + Compare + 📈 Graph
ultra 1920x1080 cinem.
72.4 74.5 ~ 73 fps    + Compare + 📈 Graph
QHD 2560x1440 cinem.
54.2 56.2 ~ 55 fps    + Compare + 📈 Graph
4K 3840x2160 cinem.
32.5 32.7 ~ 33 fps    + Compare + 📈 Graph
4K DLSS 3840x2160 cinem.
46.9 48 ~ 47 fps    + Compare + 📈 Graph
QHD DLSS 2560x1440 cinem.
72.9 74.7 ~ 74 fps    + Compare + 📈 Graph
» With all tested laptops playable in detail settings ultra.
Additional Benchmarks
ultra, RT ultra, DLSS, FG RR 2560x1440 cinem.
80.9
79
ultra, RT ultra, DLSS, FG RR 3840x2160 cinem.
48.4
47.3
low 1280x720 cinem.
116.2
ultra DLSS 1920x1080 cinem.
79.3
ultra, RT ultra, DLSS, FG 4x, RR 3840x2160 cinem.
87.1
86.5
low 1920x1080
166  fps    + Compare
med. 1920x1080
123  fps    + Compare
high 1920x1080
96  fps    + Compare
ultra 1920x1080
56 57 ~ 57 fps    + Compare
QHD 2560x1440
42 43 ~ 43 fps    + Compare
4K 3840x2160
25 25 ~ 25 fps    + Compare
4K DLSS 3840x2160
42 43 ~ 43 fps    + Compare
QHD DLSS 2560x1440
61 63 ~ 62 fps    + Compare
» With all tested laptops playable in detail settings ultra.
Additional Benchmarks
low TSR 100 1280x720
237
cinematic RT: Very High DLSS 68 FG 3840x2160
39
39
cinematic RT: Very High DLSS 68 FG 2560x1440
70
70
low 1920x1080
300  fps    + Compare + 📈 Graph
med. 1920x1080
183.9  fps    + Compare + 📈 Graph
high 1920x1080
157.8  fps    + Compare + 📈 Graph
ultra 1920x1080
132.8  fps    + Compare + 📈 Graph
QHD 2560x1440
93.9  fps    + Compare + 📈 Graph
4K 3840x2160
53.1  fps    + Compare + 📈 Graph
4K DLSS 3840x2160
51.7  fps    + Compare + 📈 Graph
» With all tested laptops playable in detail settings ultra.
Additional Benchmarks
Low Preset 1280x720
350
Ultra Preset + Ultra Ray Tracing + DLSS Quality 2560x1440
85.5
F1 24

F1 24

2024
low 1920x1080
489  fps    + Compare
med. 1920x1080
478  fps    + Compare
high 1920x1080
380  fps    + Compare
ultra 1920x1080
138.2 138.8 ~ 139 fps    + Compare
QHD 2560x1440
88.3 90.1 ~ 89 fps    + Compare
4K 3840x2160
43.3 45.1 ~ 44 fps    + Compare
4K DLSS 3840x2160
75.4 77.3 ~ 76 fps    + Compare
QHD DLSS 2560x1440
138.7 140 ~ 139 fps    + Compare
» With all tested laptops playable in detail settings ultra.
low 1920x1080
367  fps    + Compare + 📈 Graph
med. 1920x1080
305  fps    + Compare + 📈 Graph
high 1920x1080
288  fps    + Compare + 📈 Graph
ultra 1920x1080
226  fps    + Compare + 📈 Graph
QHD 2560x1440
142.4  fps    + Compare + 📈 Graph
4K 3840x2160
55.8  fps    + Compare + 📈 Graph
4K DLSS 3840x2160
122.6  fps    + Compare + 📈 Graph
» With all tested laptops playable in detail settings ultra.
Additional Benchmarks
Low Preset 1280x720
323
low 1920x1080
160  fps    + Compare
med. 1920x1080
147  fps    + Compare
high 1920x1080
127  fps    + Compare
ultra 1920x1080
94 96 ~ 95 fps    + Compare + 📈 Graph
QHD 2560x1440
63 63.2 ~ 63 fps    + Compare + 📈 Graph
4K 3840x2160
32 32.1 ~ 32 fps    + Compare + 📈 Graph
4K DLSS 3840x2160
56 56 ~ 56 fps    + Compare + 📈 Graph
» With all tested laptops playable in detail settings ultra.
Additional Benchmarks
Low Preset TAA 1280x720
226
low 1920x1080
127.1  fps    + Compare + 📈 Graph
med. 1920x1080
120.9  fps    + Compare + 📈 Graph
high 1920x1080
107.5 112.7 ~ 110 fps    + Compare + 📈 Graph
QHD 2560x1440
73.7 77.7 ~ 76 fps    + Compare + 📈 Graph
4K 3840x2160
39 40 ~ 40 fps    + Compare + 📈 Graph
4K DLSS 3840x2160
54.5 57 ~ 56 fps    + Compare + 📈 Graph
» With all tested laptops playable in detail settings high.
Additional Benchmarks
Low Preset 1280x720
185.2
High Preset + High Ray Tracing 1920x1080
53.8
56
High Preset + High Ray Tracing 3840x2160
12
16.6
High Preset + Ultra Ray Tracing 3840x2160
10.4
15.5
High Preset + Ultra Ray Tracing + Quality DLSS 3840x2160
27.9
29.9
High Preset + Ultra Ray Tracing + Quality DLSS + FG 2x 3840x2160
42.9
52.9
High Preset + Ultra Ray Tracing + Quality DLSS + FG 4x 3840x2160
90
95.9
low 1920x1080
170.3  fps    + Compare + 📈 Graph
med. 1920x1080
158.2  fps    + Compare + 📈 Graph
high 1920x1080
132.6  fps    + Compare + 📈 Graph
ultra 1920x1080
109.3  fps    + Compare + 📈 Graph
QHD 2560x1440
79.2  fps    + Compare + 📈 Graph
4K 3840x2160
44.8  fps    + Compare + 📈 Graph
4K DLSS 3840x2160
77.6  fps    + Compare + 📈 Graph
» With all tested laptops playable in detail settings ultra.
Additional Benchmarks
Low Preset 1280x720
236
ultra 1920x1080
163  fps    + Compare
QHD 2560x1440
126  fps    + Compare
4K 3840x2160
78  fps    + Compare
4K DLSS 3840x2160
106  fps    + Compare
» With all tested laptops playable in detail settings ultra.
low 1920x1080
262  fps    + Compare
med. 1920x1080
219  fps    + Compare
high 1920x1080
187.6  fps    + Compare
ultra 1920x1080
164.7 170.3 ~ 168 fps    + Compare
QHD 2560x1440
107.6 111.8 ~ 110 fps    + Compare
4K 3840x2160
47.4 49.2 ~ 48 fps    + Compare + 📈 Graph
4K DLSS 3840x2160
72.5 72.5 ~ 73 fps    + Compare
QHD DLSS 2560x1440
128.3 128.7 ~ 129 fps    + Compare
» With all tested laptops playable in detail settings ultra.
Additional Benchmarks
Low Preset (FSR off) 1280x720
282
Ray Tracing Ultra Preset (DLSS off) 1920x1080
75
75
Ray Tracing Ultra Preset (DLSS off, no Path Tracing) 3840x2160
22.5
22.2
30min Start Ultra Preset (FSR off) 1920x1080
143.7
157.3
Ray Tracing Overdrive Preset (no DLSS, no FG) 3840x2160
9.9
Ray Tracing Overdrive Preset + DLSS 4 Transformer Quality (no FG) 3840x2160
24.2
24.5
Ray Tracing Overdrive Preset + DLSS 4 Transformer Quality + Frame Generation (M)FG 2x 3840x2160
43.9
42.9
Ray Tracing Overdrive Preset + DLSS 4 Transformer Quality + Frame Generation MFG 4x 3840x2160
81.1
76.9
low 1920x1080
281  fps    + Compare + 📈 Graph
med. 1920x1080
222  fps    + Compare + 📈 Graph
high 1920x1080
194  fps    + Compare + 📈 Graph
ultra 1920x1080
186.8 190.6 ~ 189 fps    + Compare + 📈 Graph
QHD 2560x1440
132 138.3 ~ 135 fps    + Compare + 📈 Graph
4K 3840x2160
70.9 74.5 ~ 73 fps    + Compare + 📈 Graph
4K DLSS 3840x2160
115.4 118.5 ~ 117 fps    + Compare + 📈 Graph
» With all tested laptops playable in detail settings ultra.
Additional Benchmarks
Low Preset SMAA 1280x720
380
Lies of P

Lies of P

2023
low 1920x1080
382  fps    + Compare + 📈 Graph
med. 1920x1080
340  fps    + Compare + 📈 Graph
high 1920x1080
293  fps    + Compare + 📈 Graph
ultra 1920x1080
267  fps    + Compare + 📈 Graph
QHD 2560x1440
180  fps    + Compare + 📈 Graph
4K 3840x2160
93.7  fps    + Compare + 📈 Graph
4K DLSS 3840x2160
148.3  fps    + Compare + 📈 Graph
» With all tested laptops playable in detail settings ultra.
Additional Benchmarks
Low Preset 1280x720
458
low 1920x1080
227  fps    + Compare + 📈 Graph
med. 1920x1080
197.7  fps    + Compare + 📈 Graph
high 1920x1080
157.5  fps    + Compare + 📈 Graph
ultra 1920x1080
120.8  fps    + Compare + 📈 Graph
QHD 2560x1440
89.3  fps    + Compare + 📈 Graph
4K 3840x2160
51.5  fps    + Compare + 📈 Graph
4K DLSS 3840x2160
63  fps    + Compare + 📈 Graph
» With all tested laptops playable in detail settings ultra.
Additional Benchmarks
Low Preset Low TAA 1280x720
226
Ultra Preset + Full Ray Tracing High TAA 1920x1080
66.4
Ultra Preset + Full Ray Tracing High TAA 3840x2160
34.4
Ultra Preset + Full Ray Tracing + DLSS4 Quality + FG 4x High TAA 3840x2160
111.9
low 1920x1080
418  fps    + Compare + 📈 Graph
med. 1920x1080
363  fps    + Compare + 📈 Graph
high 1920x1080
315  fps    + Compare + 📈 Graph
ultra 1920x1080
261  fps    + Compare + 📈 Graph
QHD 2560x1440
191.5  fps    + Compare + 📈 Graph
4K 3840x2160
96.9  fps    + Compare + 📈 Graph
» With all tested laptops playable in detail settings ultra.
Additional Benchmarks
Low Preset / Off 1280x720
421
RT Ultra Preset / On FXAA 1920x1080
67.8
low 1920x1080
483  fps    + Compare
med. 1920x1080
385  fps    + Compare
high 1920x1080
253  fps    + Compare
ultra 1920x1080
199.5  fps    + Compare
QHD 2560x1440
140.3  fps    + Compare
4K 3840x2160
73.5  fps    + Compare
» With all tested laptops playable in detail settings ultra.
Additional Benchmarks
Lowest Preset (DX12) 1280x720
558
low 1920x1080
291  fps    + Compare + 📈 Graph
med. 1920x1080
244  fps    + Compare + 📈 Graph
high 1920x1080
196.7  fps    + Compare + 📈 Graph
ultra 1920x1080
141.4  fps    + Compare + 📈 Graph
QHD 2560x1440
121.9  fps    + Compare + 📈 Graph
4K 3840x2160
81  fps    + Compare + 📈 Graph
» With all tested laptops playable in detail settings ultra.
Additional Benchmarks
Low Preset 1280x720
369
low 1280x720
423  fps    + Compare + 📈 Graph
med. 1920x1080
369  fps    + Compare + 📈 Graph
high 1920x1080
330  fps    + Compare + 📈 Graph
ultra 1920x1080
314  fps    + Compare + 📈 Graph
QHD 2560x1440
297  fps    + Compare + 📈 Graph
4K 3840x2160
185.4  fps    + Compare + 📈 Graph
» With all tested laptops playable in detail settings ultra.
Additional Benchmarks
Low Preset 1920x1080
430
low 1280x720
465  fps    + Compare
med. 1920x1080
329  fps    + Compare
high 1920x1080
299  fps    + Compare
ultra 1920x1080
188  fps    + Compare
QHD 2560x1440
161  fps    + Compare
4K 3840x2160
114  fps    + Compare
» With all tested laptops playable in detail settings ultra.
Additional Benchmarks
Low Preset 1920x1080
378
Far Cry 6

Far Cry 6

2021
low 1280x720
305  fps    + Compare + 📈 Graph
med. 1920x1080
273  fps    + Compare + 📈 Graph
high 1920x1080
247  fps    + Compare + 📈 Graph
ultra 1920x1080
220  fps    + Compare + 📈 Graph
QHD 2560x1440
168.9  fps    + Compare + 📈 Graph
4K 3840x2160
93.4  fps    + Compare + 📈 Graph
» With all tested laptops playable in detail settings ultra.
Additional Benchmarks
Low Graphics Quality 1920x1080
300
Ultra Graphics Quality + HD Textures + DXR TAA 1920x1080
177.6
low 1280x720
319  fps    + Compare
med. 1920x1080
286  fps    + Compare
high 1920x1080
243  fps    + Compare
ultra 1920x1080
197.7  fps    + Compare
QHD 2560x1440
144.2  fps    + Compare
4K 3840x2160
76.7  fps    + Compare
» With all tested laptops playable in detail settings ultra.
Additional Benchmarks
Very Low Overall Quality (DX11) 1920x1080
313
Anno 1800

Anno 1800

2019
low 1280x720
288  fps    + Compare + 📈 Graph
med. 1920x1080
275  fps    + Compare + 📈 Graph
high 1920x1080
232  fps    + Compare + 📈 Graph
QHD 2560x1440
142 146.8 ~ 144 fps    + Compare + 📈 Graph
4K 3840x2160
117.8  fps    + Compare + 📈 Graph
» With all tested laptops playable in detail settings high.
low 1280x720
333  fps    + Compare + 📈 Graph
med. 1920x1080
286  fps    + Compare + 📈 Graph
high 1920x1080
275  fps    + Compare + 📈 Graph
ultra 1920x1080
247  fps    + Compare + 📈 Graph
QHD 2560x1440
210  fps    + Compare + 📈 Graph
4K 3840x2160
118  fps    + Compare + 📈 Graph
» With all tested laptops playable in detail settings ultra.
Strange Brigade

Strange Brigade

2018
low 1280x720
672  fps    + Compare
med. 1920x1080
562  fps    + Compare
high 1920x1080
491  fps    + Compare
ultra 1920x1080
437  fps    + Compare
QHD 2560x1440
318  fps    + Compare
4K 3840x2160
162.7  fps    + Compare
» With all tested laptops playable in detail settings ultra.
Far Cry 5

Far Cry 5

2018
low 1280x720
386  fps    + Compare + 📈 Graph
med. 1920x1080
322  fps    + Compare + 📈 Graph
high 1920x1080
306  fps    + Compare + 📈 Graph
ultra 1920x1080
290  fps    + Compare + 📈 Graph
QHD 2560x1440
222  fps    + Compare + 📈 Graph
4K 3840x2160
116  fps    + Compare + 📈 Graph
» With all tested laptops playable in detail settings ultra.
Additional Benchmarks
Low Preset TAA 1920x1080
359
low 1280x720
231  fps    + Compare
med. 1920x1080
212  fps    + Compare
high 1920x1080
150.6 183.9 ~ 167 fps    + Compare
4K 3840x2160
120.2 144.6 ~ 132 fps    + Compare
» With all tested laptops playable in detail settings high.
low 1280x720
235  fps    + Compare
med. 1920x1080
236  fps    + Compare
high 1920x1080
206  fps    + Compare
QHD 2560x1440
162.4  fps    + Compare
4K 3840x2160
93.4  fps    + Compare
» With all tested laptops playable in detail settings high.
low 1280x720
360  fps    + Compare
med. 1366x768
326  fps    + Compare
high 1920x1080
312  fps    + Compare
ultra 1920x1080
289  fps    + Compare
4K 3840x2160
222  fps    + Compare
» With all tested laptops playable in detail settings ultra.
low 1024x768
771  fps    + Compare + 📈 Graph
med. 1366x768
658  fps    + Compare + 📈 Graph
high 1920x1080
436  fps    + Compare + 📈 Graph
ultra 1920x1080
209 211 ~ 210 fps    + Compare + 📈 Graph
QHD 2560x1440
162.7 169.3 ~ 166 fps    + Compare + 📈 Graph
4K 3840x2160
146.2 153.7 ~ 150 fps    + Compare + 📈 Graph
» With all tested laptops playable in detail settings ultra.
Additional Benchmarks
Ultra Graphics & Postprocessing (HBAO+) 3840x2160
96.4
99.2
Medium Graphics & Postprocessing 1920x1080
506
lowmed.highultraQHD4K
Doom: The Dark Ages125.5109.5102.599.370.338.6
The Elder Scrolls IV Oblivion Remastered205158.1103.752.237.722.2
Assassin's Creed Shadows11110087665337
Civilization 755540429818887.7
Monster Hunter Wilds120.4102.181.964.1
Kingdom Come Deliverance 2269208167.6116.785.248
Indiana Jones and the Great Circle196.9147.213110454
Stalker 2132.9115.397.4806236
Call of Duty Black Ops 622020914713910364
Until Dawn189170.1122.992.766.937.6
God of War Ragnarök261221199.4186.7141.181.5
Final Fantasy XVI138.1134.7116.5107.174.442.2
Space Marine 2151.6142139.7139109.658.4
Star Wars Outlaws109.3102.488735533
Black Myth: Wukong16612396574325
The First Descendant300183.9157.8132.893.953.1
F1 244894783801398944
Alone in the Dark367305288226142.455.8
Avatar Frontiers of Pandora160147127956332
Alan Wake 2127.1120.91107640
Lords of the Fallen170.3158.2132.6109.379.244.8
Assassin's Creed Mirage16312678
Cyberpunk 2077 2.2 Phantom Liberty262219187.616811048
Baldur's Gate 328122219418913573
Lies of P38234029326718093.7
Hogwarts Legacy227197.7157.5120.889.351.5
The Witcher 3 v4418363315261191.596.9
Tiny Tina's Wonderlands483385253199.5140.373.5
God of War291244196.7141.4121.981
Farming Simulator 22423369330314297185.4
Forza Horizon 5465329299188161114
Far Cry 6305273247220168.993.4
Borderlands 3319286243197.7144.276.7
Anno 1800288275232144117.8
Far Cry New Dawn333286275247210118
Strange Brigade672562491437318162.7
Far Cry 5386322306290222116
X-Plane 11.11231212167132
Final Fantasy XV Benchmark235236206162.493.4
Dota 2 Reborn360326312289222
The Witcher 3771658436210166150
lowmed.highultraQHD4K
< 30 fps
< 60 fps
< 120 fps
≥ 120 fps


2
38


5
34


8
31

2
10
24

4
16
19
2
17
16
5

For more games that might be playable and a list of all games and graphics cards visit our Gaming List

Add one or more devices and compare

In the following list you can select (and also search for) devices that should be added to the comparison. You can select more than one device.

search for model:
v1.33
log 30. 06:30:39

#0 ran 0s before starting gpusingle class +0s ... 0s

#1 no ids found in url (should be separated by "_") +0s ... 0s

#2 not redirecting to Ajax server +0s ... 0s

#3 did not recreate cache, as it is less than 5 days old! Created at Mon, 28 Jul 2025 05:39:32 +0200 +0.002s ... 0.002s

#4 composed specs +0.031s ... 0.034s

#5 did output specs +0s ... 0.034s

#6 start showIntegratedCPUs +0s ... 0.034s

#7 getting avg benchmarks for device 12952 +0.033s ... 0.067s

#8 got single benchmarks 12952 +0.015s ... 0.082s

#9 got avg benchmarks for devices +0s ... 0.082s

#10 min, max, avg, median took s +1.228s ... 1.31s

#11 before gaming benchmark output +0s ... 1.31s

#12 Got 317 rows for game benchmarks. +0.061s ... 1.371s

#13 composed SQL query for gamebenchmarks +0s ... 1.371s

#14 got data and put it in $dataArray +0.039s ... 1.41s

#15 benchmarks composed for output. +0.615s ... 2.025s

#16 return log +0.008s ... 2.033s

Please share our article, every link counts!
Mail Logo

» Comparison of GPUs
Detailed list of all laptop GPUs sorted by class and performance.

» Benchmark List
Sort and restrict laptop GPUs based on performance in synthetic benchmarks.

» Notebook Gaming List
Playable games for each graphics card and their average FPS results.

Class 1

Class 2

Class 3

Class 4

* Approximate position of the graphics adapter

Klaus Hinum (Update: 2025-03-18)