Notebook reviews with Intel Arc 7-Core iGPU graphics card
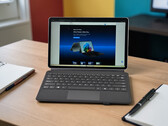
Alldocube iWork GT Ultra convertible review: Alternative to Android tablets with true PC performance
With the iWork GT Ultra, Alldocube offers a versatile Windows convertible with Intel Core Ultra 5 125H. The stylus and keyboard cover are available as a complete package for around $920. But how does the device perform in everyday use in terms of performance, mobility, and battery life? Our test answers the most important questions.
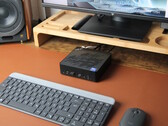
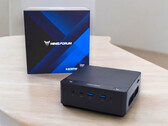
Intel Core Ultra 5 125H, Arc 7-Core, 13", 870 gMinix Elite EU512-AI review: A particularly energy-efficient Core Ultra Mini PC
Mini PCs from the Far East often advertise low prices but come with underpowered processors like the Intel N100. That’s not the case with the Elite series from Minix - these models are equipped with Intel Core Ultra CPUs, yet prices start at just €668 ($780) or €829 ($967). We’re putting this AI-powered mini PC to the review to see what it really offers.
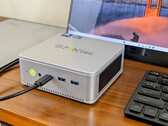
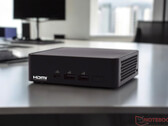
Intel Core Ultra 5 125H, Arc 7-Core, 772 gGMK NucBox K9 mini PC review: Core Ultra 5 125H with Arc 7 graphics
The Core Ultra 5 125H may make for a smarter PC, but that doesn't necessarily mean a faster one. Raw performance sits behind the older and cheaper Ryzen 7 7840HS by decent margins.
Intel Core Ultra 5 125H, Arc 7-Core, 528 gAsus NUC 14 Pro review: NUC mini PC with Intel Core Ultra 5 125H, fast Intel Arc iGPU and 2x Thunderbolt 4
Asus has taken over Intel's NUC division and now offers the popular mini PCs with Intel's Meteor Lake processors. This not only gives small desktop computers more CPU power but can also significantly increase 3D performance thanks to the revised iGPU. We have tested the Asus NUC 14 Pro with Intel Core Ultra 5 125H in detail and evaluated the performance based on numerous measurements and benchmarks.
Intel Core Ultra 5 125H, Arc 7-Core, 525 gMinisforum UH125 Pro review: AI mini-PC with Intel Core Ultra 5 125H, 32 GB DDR5 RAM and 1 TB SSD comes at a price
Minisforum is renewing its model range based on the Intel Meteor Lake processors: The UH125 Pro is being launched based on the Intel Core Ultra 5 125H. You can also look forward to a wealth of connectivity, which is currently among the most modern with USB4 and OCuLink. We took a detailed look at the device and analyzed its performance based on numerous measurements and benchmarks.
Intel Core Ultra 5 125H, Arc 7-Core, 797 gLenovo ThinkBook 13x G4 21KR0008GE: Intel Core Ultra 5 125H, 13.50", 1.2 kg
Review » Lenovo ThinkBook 13x G4 laptop review: One of the best subnotebooks apart from the keyboard
Samsung Galaxy Book4 Pro 360: Intel Core Ultra 5 125H, 16.00", 1.7 kg
Review » Samsung Galaxy Book4 Pro 360 - An extremely slim 2-in-1 with the Core Ultra 5 and 120 Hz AMOLED
Lenovo IdeaPad Slim 5 14IMH9: Intel Core Ultra 5 125H, 14.00", 1.4 kg
Review » Lenovo IdeaPad Slim 5 14 laptop review: A successful allrounder with an OLED display
Acer Aspire 5 A514-54H, Core 5 125H: Intel Core Ultra 5 125H, 14.00", 1.2 kg
External Review » Acer Aspire 5 A514-54H, Core 5 125H - Reviews and Specs
Honor MagicBook X 16 (2026): Intel Core Ultra 5 125H, 16.00", 1.8 kg
External Review » Honor MagicBook X 16 (2026)
Asus ExpertBook B3405: Intel Core Ultra 5 125H, 14.00", 1.4 kg
External Review » Asus ExpertBook B3405
Acer Aspire Lite 16 AI AL16-71P: Intel Core Ultra 5 125H, 16.00", 1.6 kg
External Review » Acer Aspire Lite 16 AI AL16-71P
Acer Aspire 16 A16-71M: Intel Core Ultra 5 125H, 16.00", 1.6 kg
External Review » Acer Aspire 16 A16-71M
MSI Modern 15 H AI C1MG, Ultra 5 125H: Intel Core Ultra 5 125H, 15.60", 1.9 kg
External Review » MSI Modern 15 H AI C1MG, Ultra 5 125H
Dynabook Portégé X30L-M: Intel Core Ultra 5 125H, 13.30", 0.9 kg
External Review » Dynabook Portégé X30L-M
Asus Zenbook 14 OLED Q415MA: Intel Core Ultra 5 125H, 14.00", 1.3 kg
External Review » Asus Zenbook 14 OLED Q415MA
Lenovo ThinkBook 13x G4 21KR0008GE: Intel Core Ultra 5 125H, 13.50", 1.2 kg
External Review » Lenovo ThinkBook 13x G4 21KR0008GE
Lenovo ThinkBook 16 G7 IML, Ultra 5 125H: Intel Core Ultra 5 125H, 16.00", 1.7 kg
External Review » Lenovo ThinkBook 16 G7 IML, Ultra 5 125H
HP Pavilion Plus 14-ew1000: Intel Core Ultra 5 125H, 14.00", 1.4 kg
External Review » HP Pavilion Plus 14-ew1000
LG gram 14 2-in-1 14T90S: Intel Core Ultra 5 125H, 14.00", 1.3 kg
External Review » LG gram 14 2-in-1 14T90S
Lenovo Yoga 7 14IML9, Ultra 5 125H: Intel Core Ultra 5 125H, 14.00", 1.5 kg
External Review » Lenovo Yoga 7 14IML9, Ultra 5 125H
Acer Swift Go 14 SFG14-72, Ultra 5 125H: Intel Core Ultra 5 125H, 14.00", 1.3 kg
External Review » Acer Swift Go 14 SFG14-72, Ultra 5 125H
MSI Prestige 14 AI Evo C1MG: Intel Core Ultra 5 125H, 14.00", 1.7 kg
External Review » MSI Prestige 14 AI Evo C1MG
MSI Prestige 13 AI Evo, Ultra 5: Intel Core Ultra 5 125H, 13.30", 1 kg
External Review » MSI Prestige 13 AI Evo, Ultra 5
Asus VivoBook S 14 OLED S5406MA: Intel Core Ultra 5 125H, 14.00", 1.3 kg
External Review » Asus VivoBook S 14 OLED S5406MA
Lenovo IdeaPad Slim 5 14IMH9: Intel Core Ultra 5 125H, 14.00", 1.4 kg
External Review » Lenovo IdeaPad Slim 5 14IMH9
Asus ZenBook 14 UX3405MA, Ultra 5: Intel Core Ultra 5 125H, 14.00", 1.3 kg
External Review » Asus ZenBook 14 UX3405MA, Ultra 5
Lenovo ThinkBook 13x IMH G4: Intel Core Ultra 5 125H, 13.50", 1.2 kg
External Review » Lenovo ThinkBook 13x IMH G4
Samsung Galaxy Book4 Pro 360: Intel Core Ultra 5 125H, 16.00", 1.7 kg
External Review » Samsung Galaxy Book4 Pro 360
Alldocube iWork GT Ultra: Intel Core Ultra 5 125H, 13.00", 0.9 kg
» Windows convertible/tablet under 800 euros: iWork GT Ultra - price-performance tip or compromise device?
Lenovo ThinkBook 13x G4 21KR0008GE: Intel Core Ultra 5 125H, 13.50", 1.2 kg
» The ThinkBook 13x G4 could be one of the best ultrabooks if it were not for the keyboard