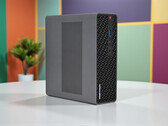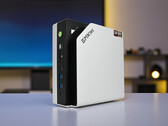


AMD Ryzen AI Max+ 395 with 128 GB RAM in a cube: Is the Acemagic M1A Pro+ the new performance king among mini PCs?
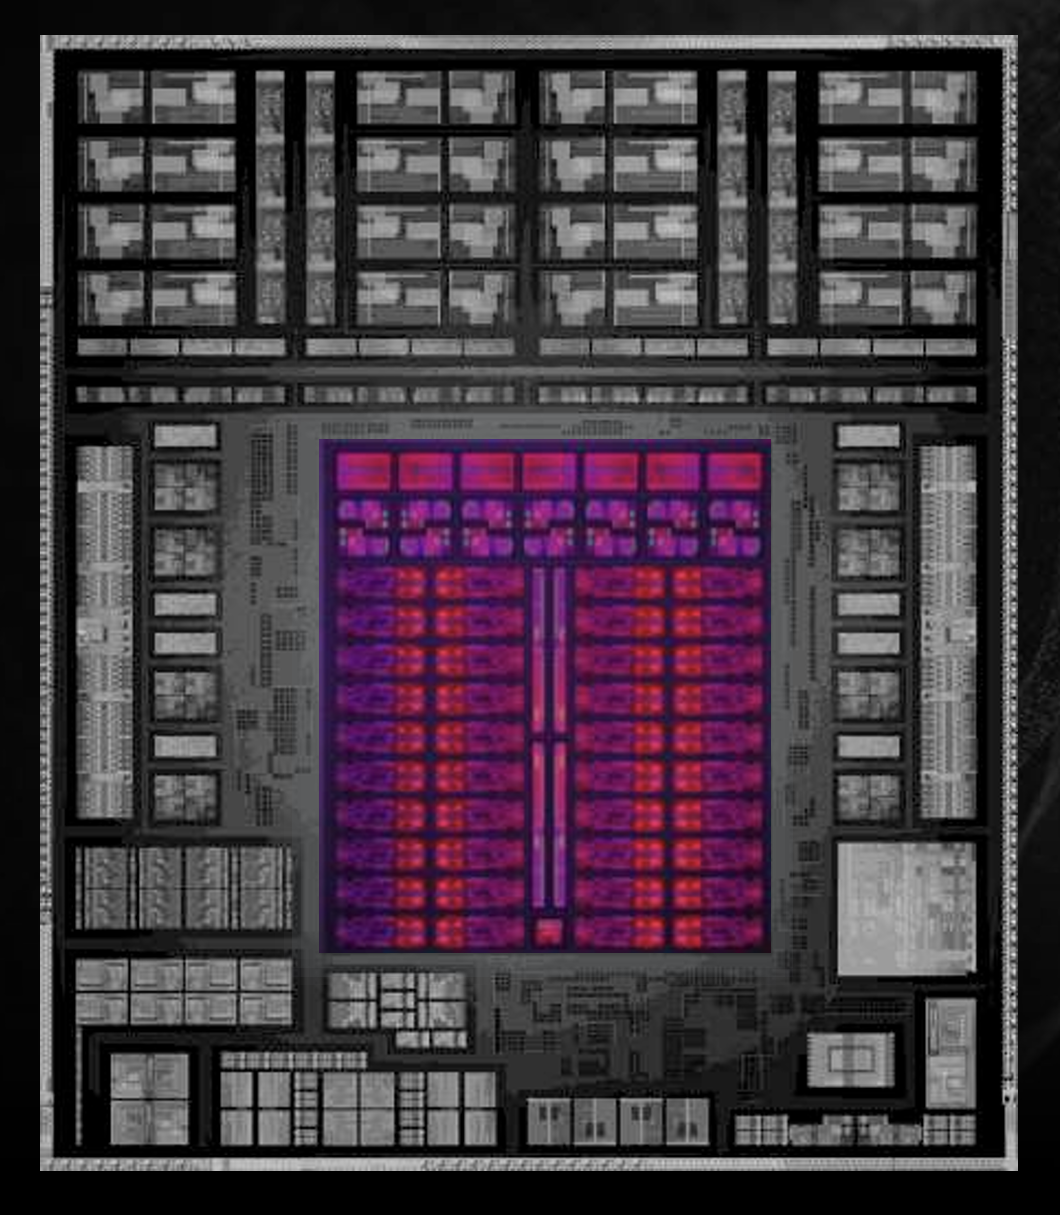
The Acemagic M1A Pro+ combines powerful high-end hardware with an eye-catching case: Equipped with the AMD Ryzen AI Max+ 395, 128 GB RAM and a powerful Radeon graphics unit, the mini PC offers plenty of performance for gaming and professional workloads. In this test, we show how the system performs in benchmarks, games and under continuous load - and whether it is one of the most powerful mini PCs in its class.
AMD Ryzen AI Max+ 395, Radeon 8060S, 1.9 kg