Verdict - ProArt PX13 GoPro Edition offers massive CPU performance, but the 60 Hz screen is a problem
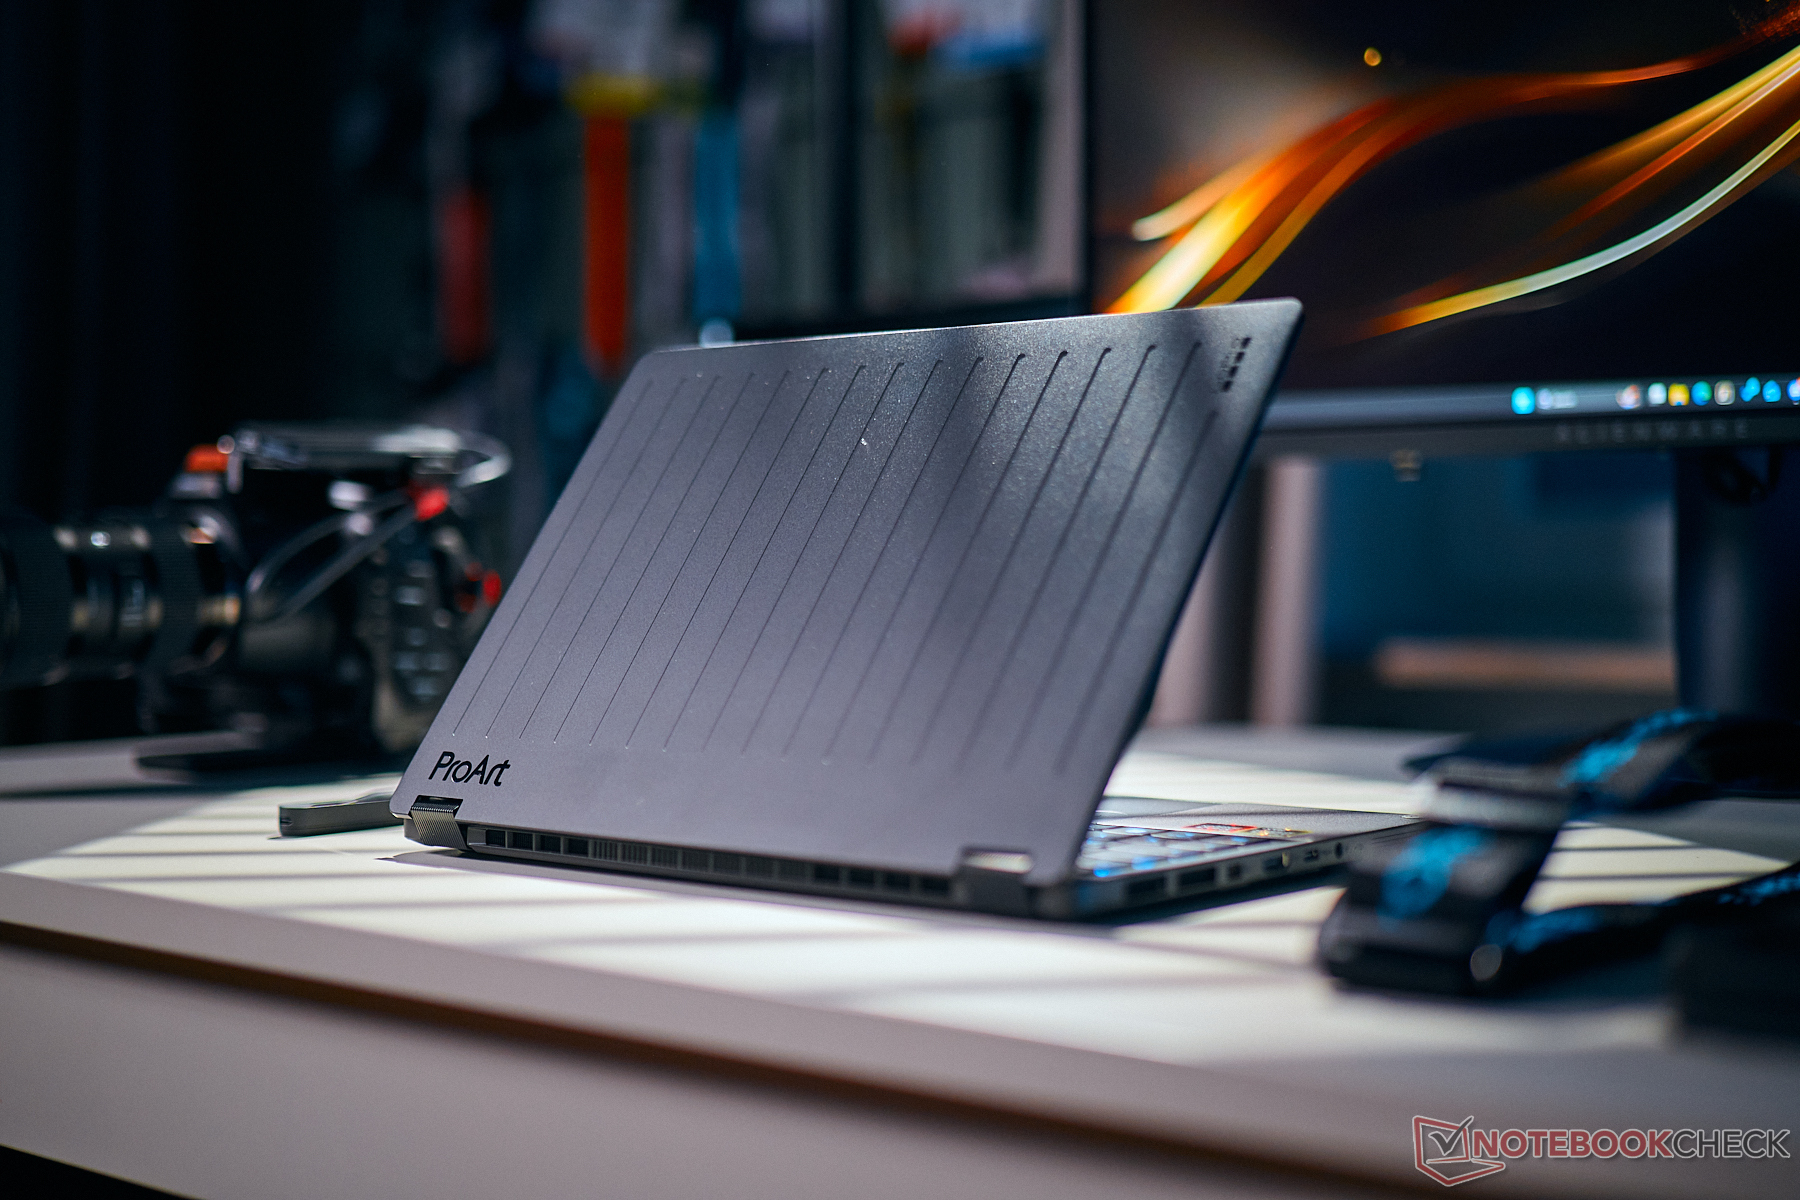
The GoPro Edition of the Asus ProArt PX13 is one of the most powerful 13-inch laptops you can buy and the addition of the fastest AMD Strix Halo chip results in a massive improvement of multi-core CPU performance as well as RAM capacity. This can also be beneficial for the Radeon 8060s iGPU, but the raw performance is actually on par with the old RTX 4070. The GoPro edition also offers some design changes. The new lid design in particular looks very nice and there are some subtle blue visual highlights.
The performance is very good overall, but the fans will be very loud when you stress the system and we also noticed some coil whine on our unit. The biggest issue, however, is the screen, because Asus still uses the OLED panel from the previous version. Besides the slightly grainy image on brighter contents, it only offers a refresh rate of 60 Hz. This was already a criticism in 2024 and is very hard to justify for a premium product in 2026. The factory calibration on the other hand is still excellent.
All in all, the new ProArt PX13 GoPro edition is a very stylish and powerful 13-inch convertible, but considering the high price, the 60 Hz screen is a tough pill to swallow.
Pros
Cons
Price and Availability
We have no information about the pricing and availability of our review configuration yet.
- $3,514.00HIDevolution [2026] ASUS ProArt PX13 HN7306EA Black 13.3" 3K OLED Touch, 3.0 GHz Ryzen Al Max+ 395, AMD Radeon, 64 GB LPDDR5X RAM, 2 TB PCIe SSD, Windows 11 Pro
- $3,249.00HIDevolution [2026] ASUS ProArt PX13 HN7306EA Black 13.3" 3K OLED Touch, 3.0 GHz Ryzen Al Max+ 395, AMD Radeon, 64 GB LPDDR5X RAM, 1 TB PCIe SSD, Windows 11 Pro
- $3,499.00HIDevolution [2026] ASUS ProArt PX13 GoPro HN7306EAC Black 13.3" 3K OLED Touch, 3.0 GHz Ryzen Al Max+ 395, AMD Radeon, 128 GB LPDDR5X RAM, 1 TB PCIe SSD, Windows 11 Pro
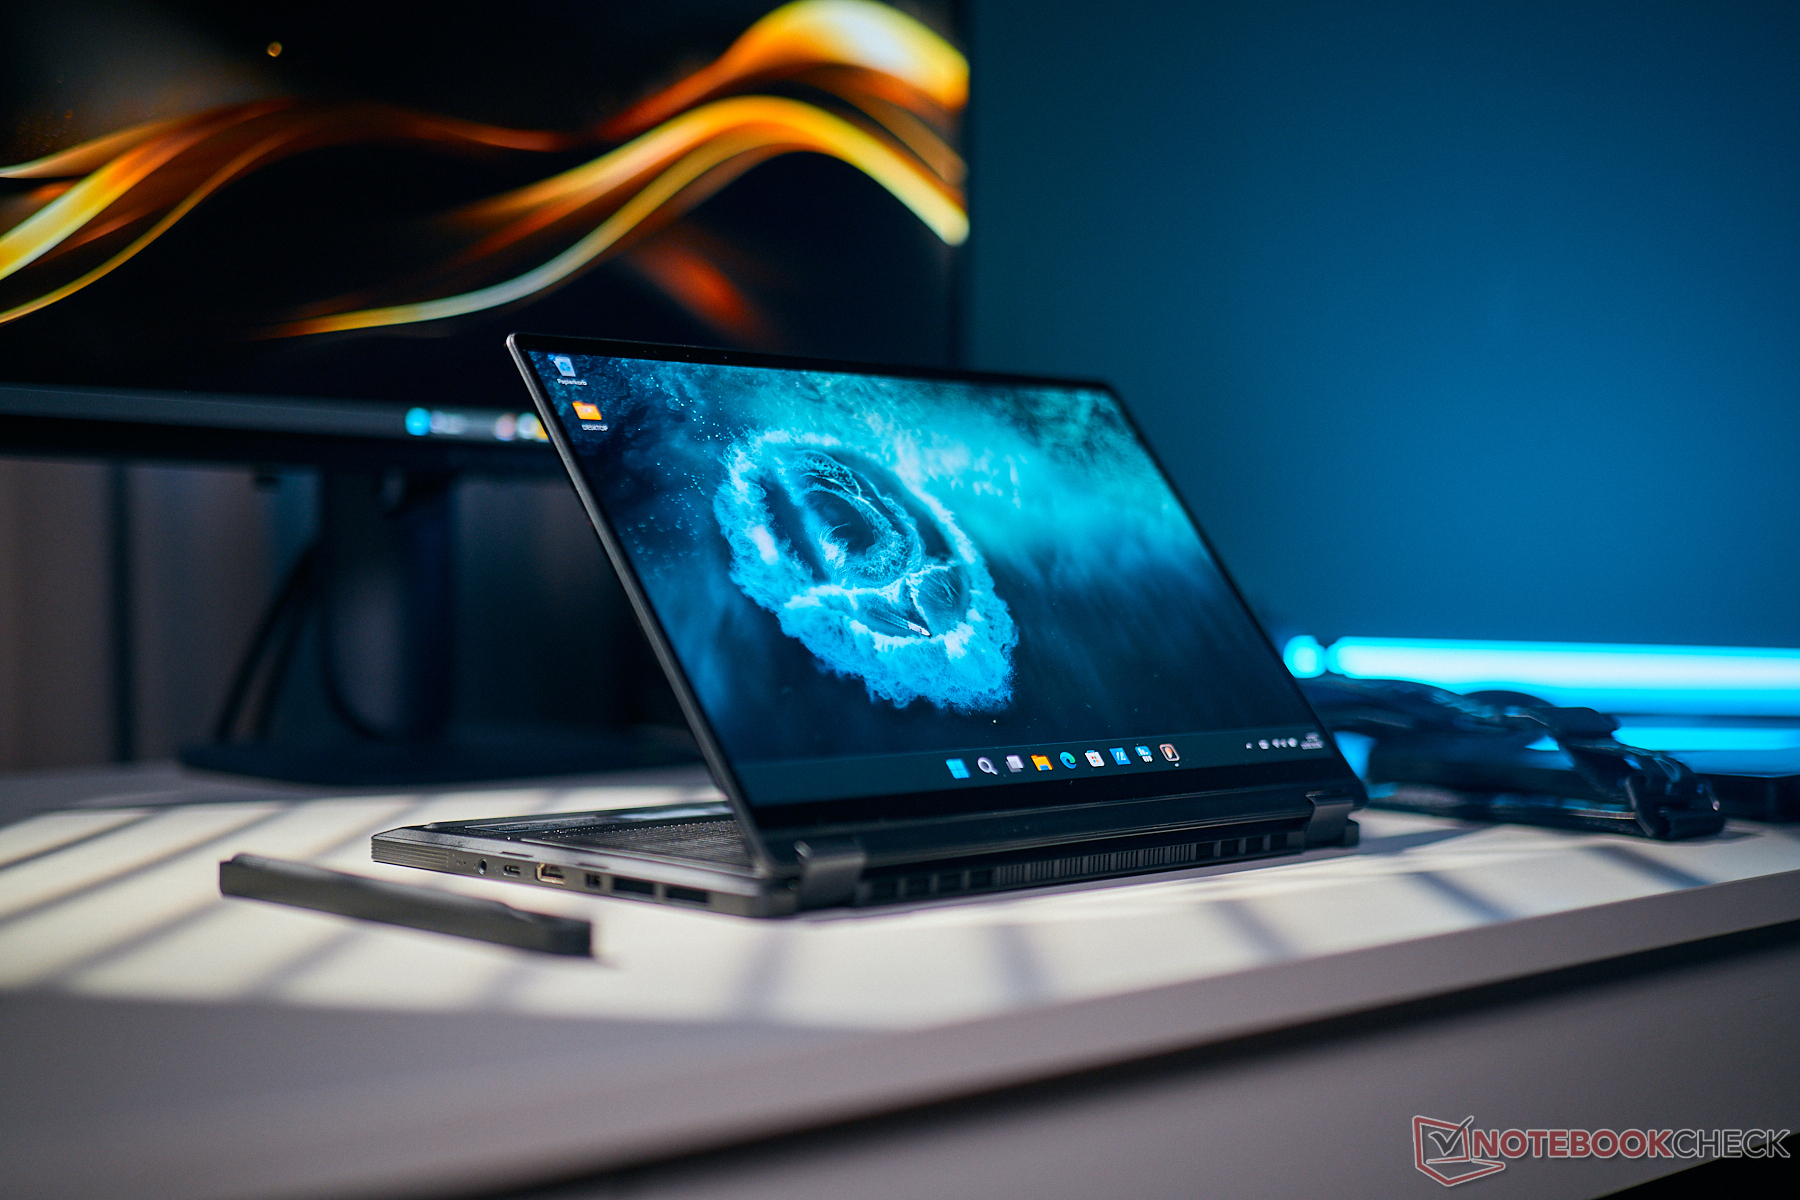
Asus refreshes its compact 13-inch convertible ProArt PX13 and also offers a special GoPro version with a new design. It also ditches the Ryzen 9 HX 370 and GeForce RTX 4070 combination in favor of the AMD Strix Halo chip Ryzen AI Max+ 395 with the powerful Radeon 8060s and up to 128 GB RAM. The display on the other hand did not change and you still get a 2.8K OLED touchscreen with a refresh rate of 60 Hz.
Specifications
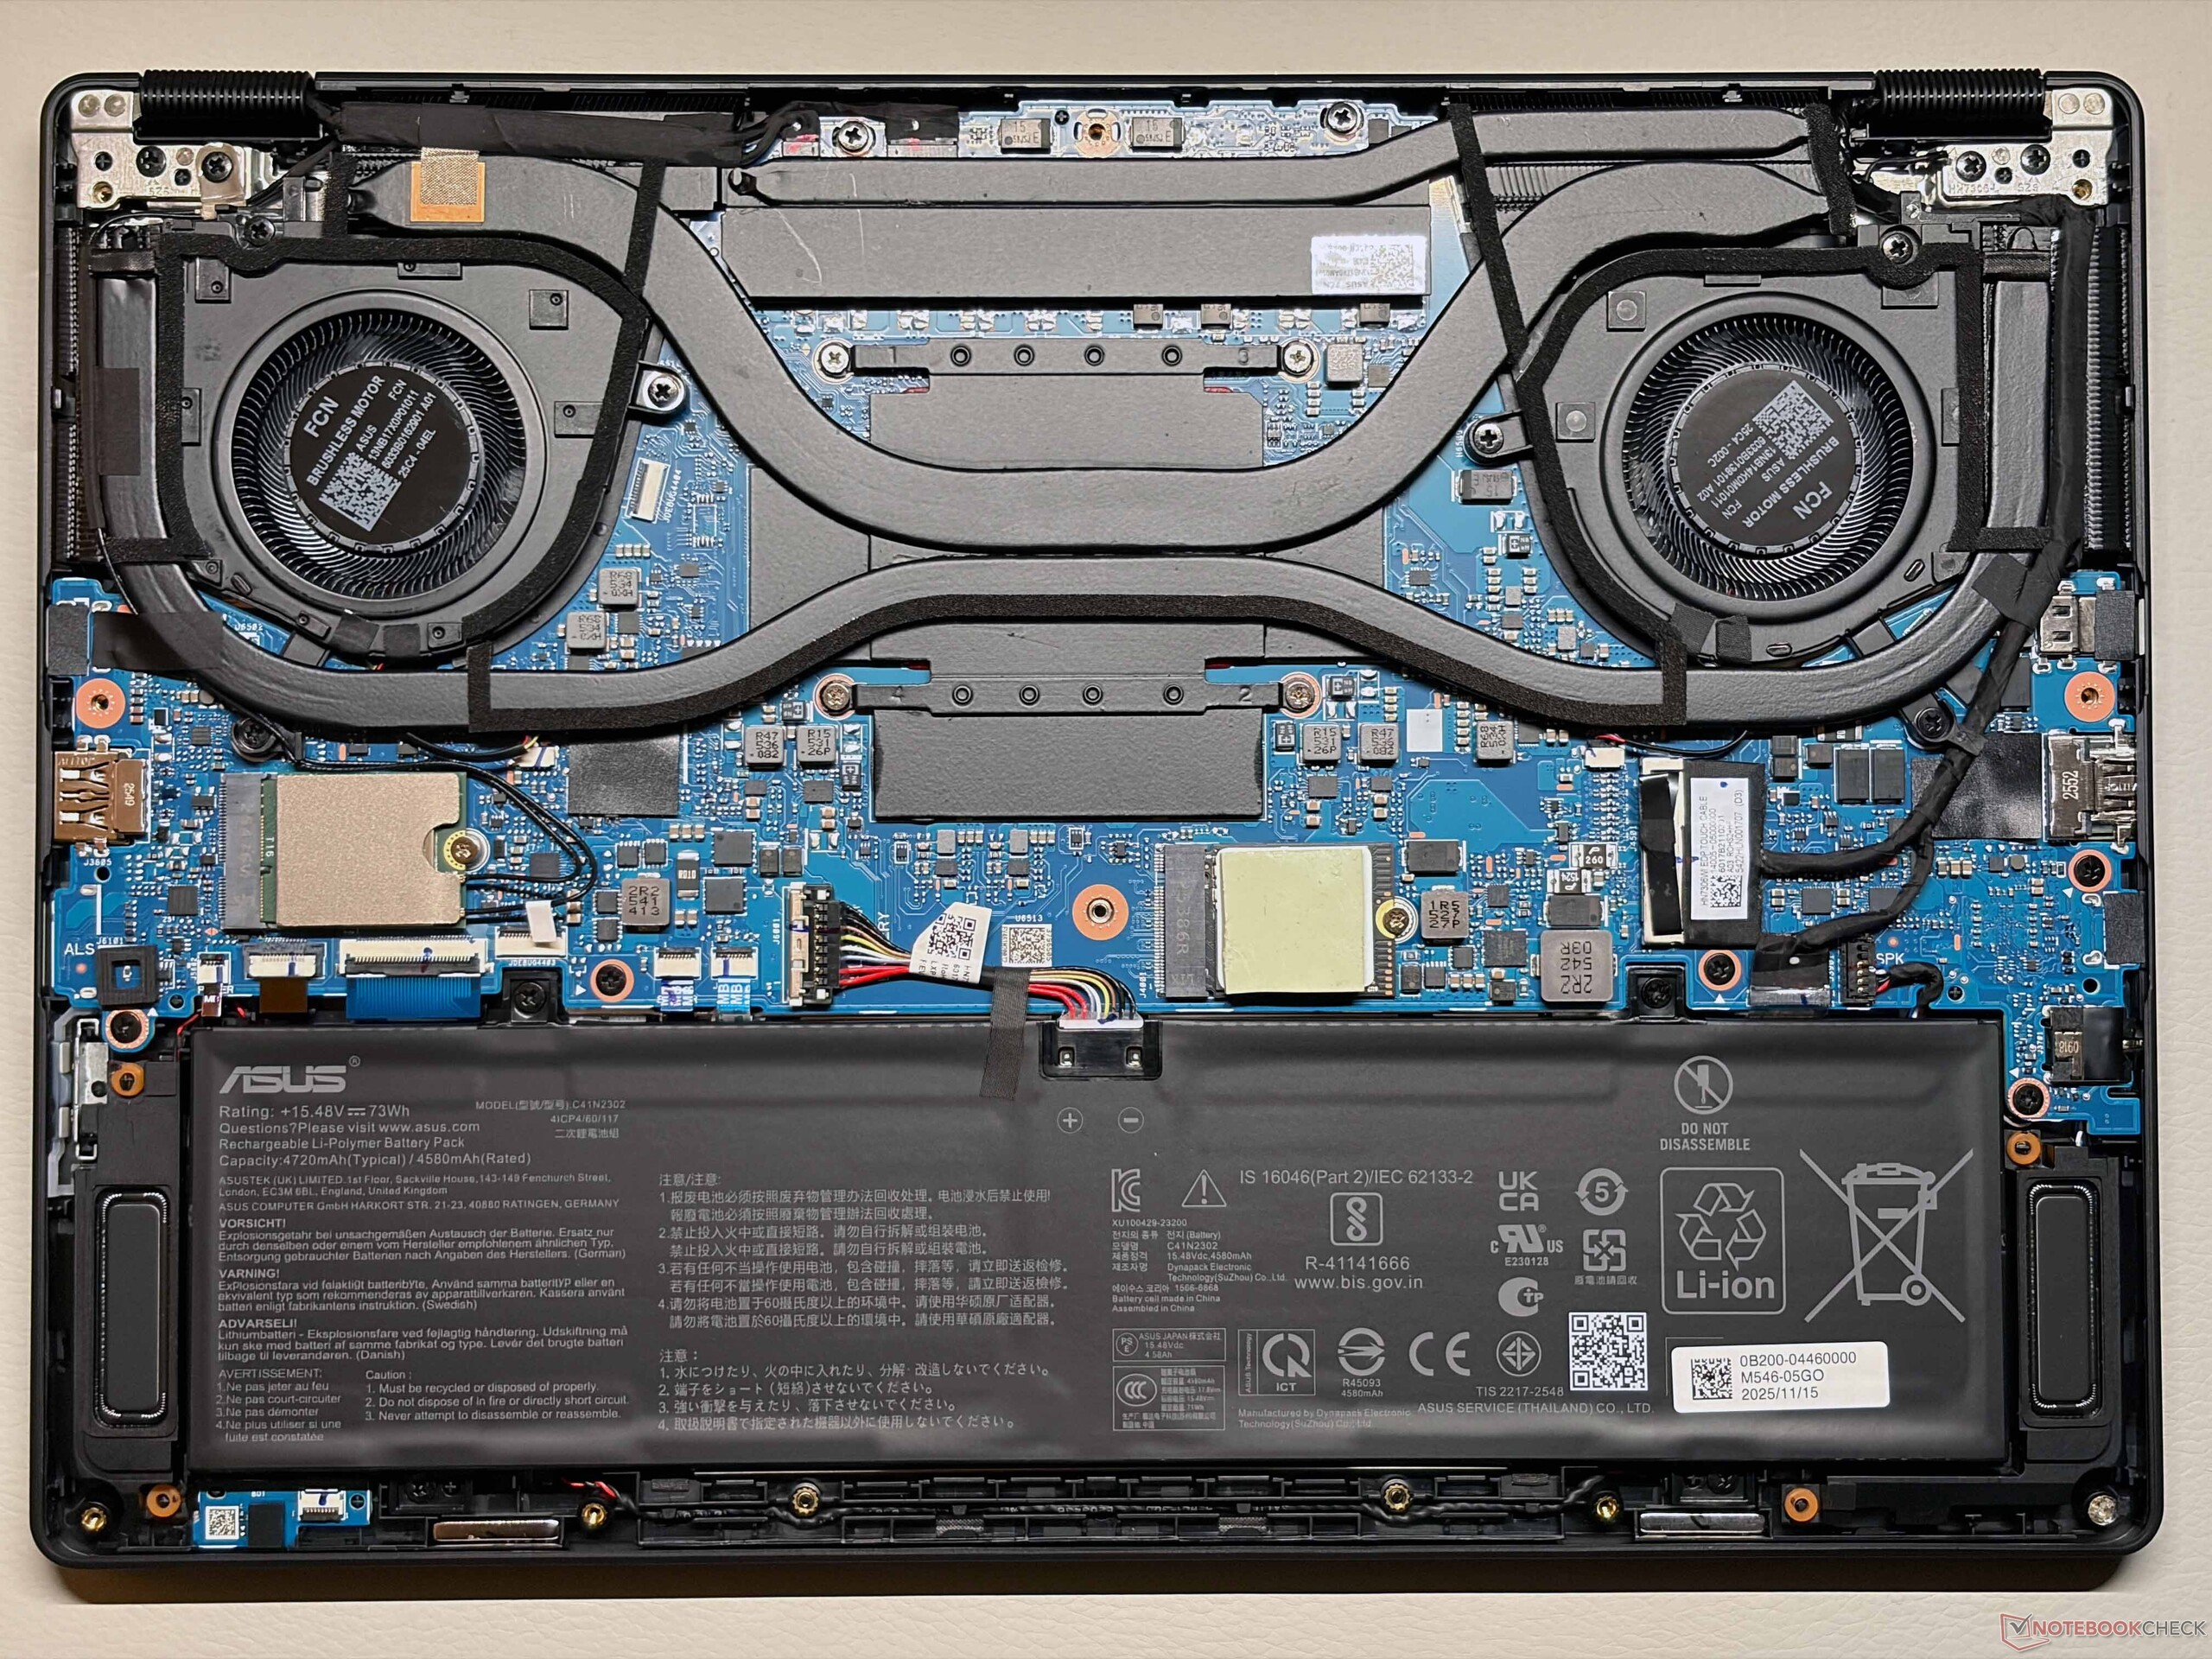
Case and Connectivity
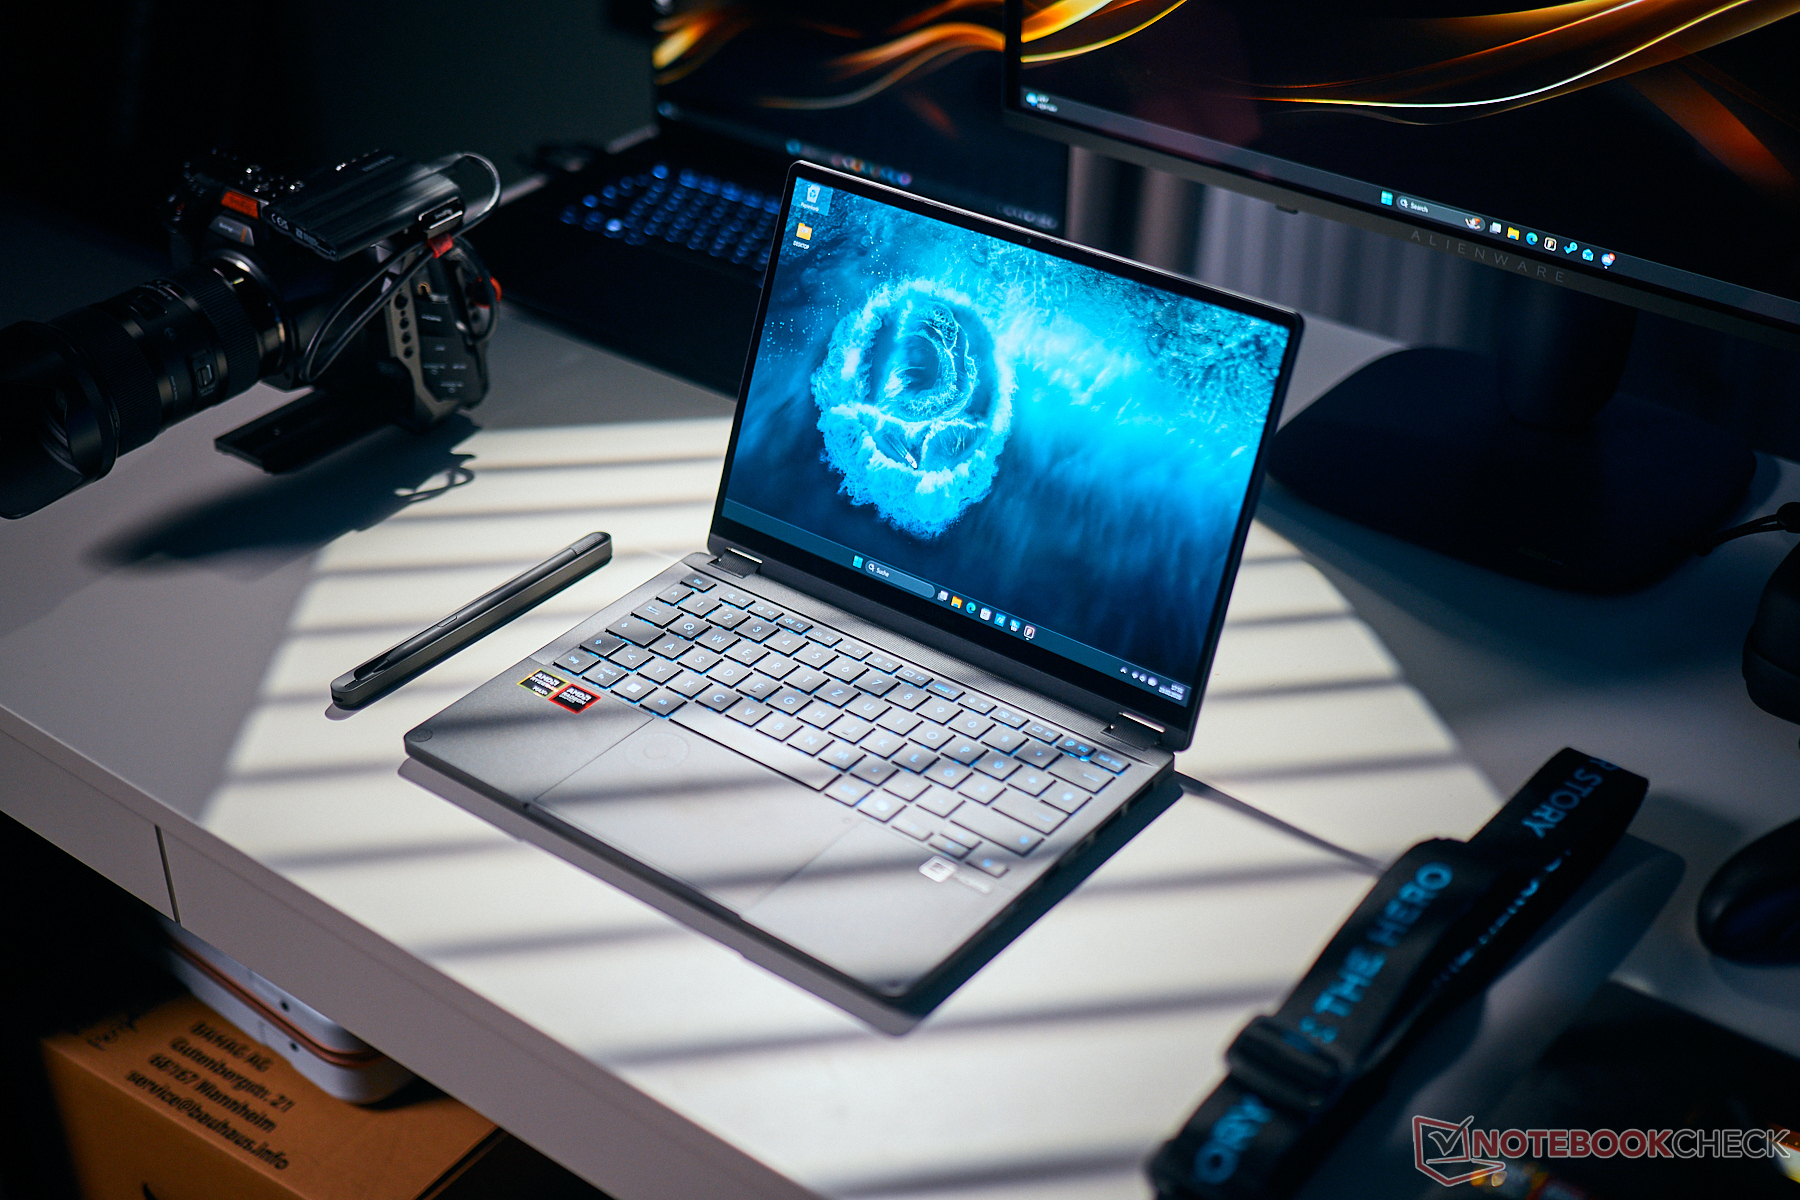
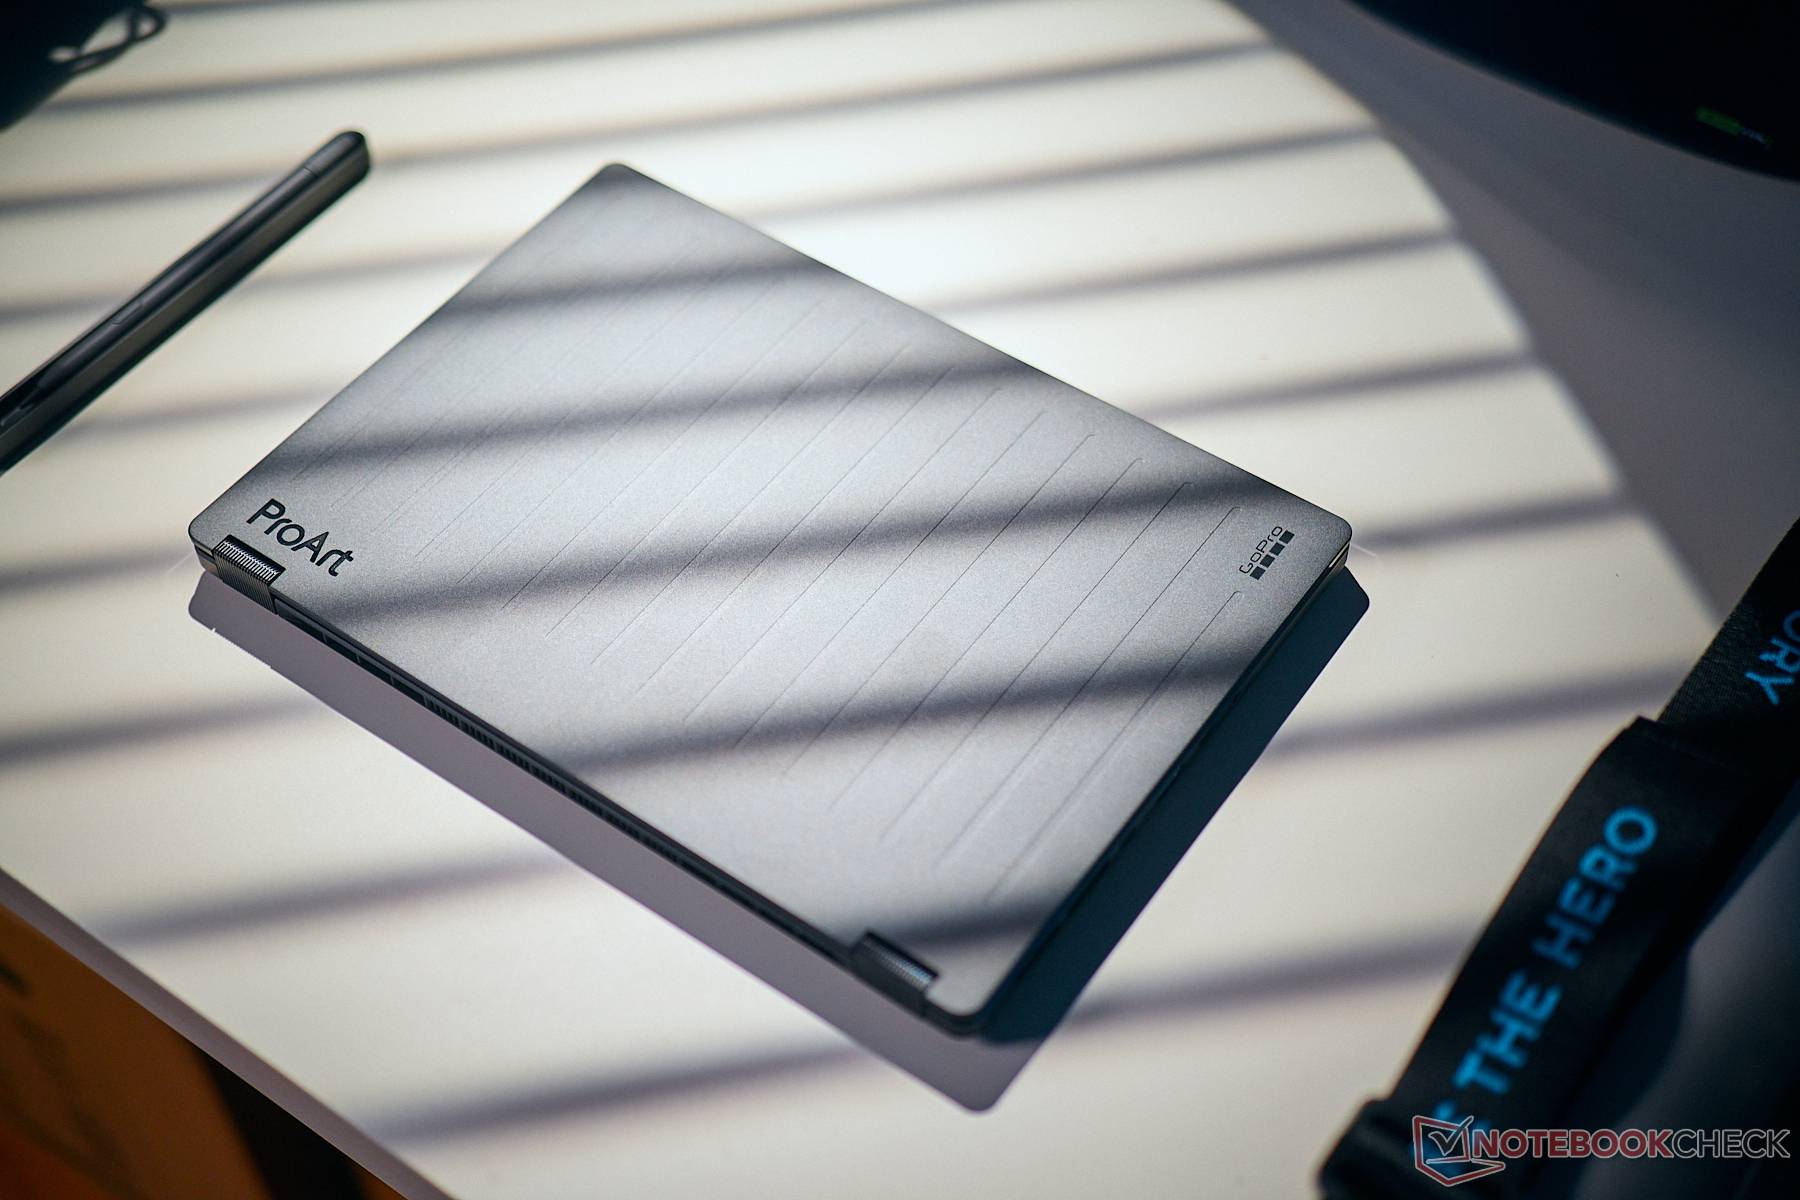
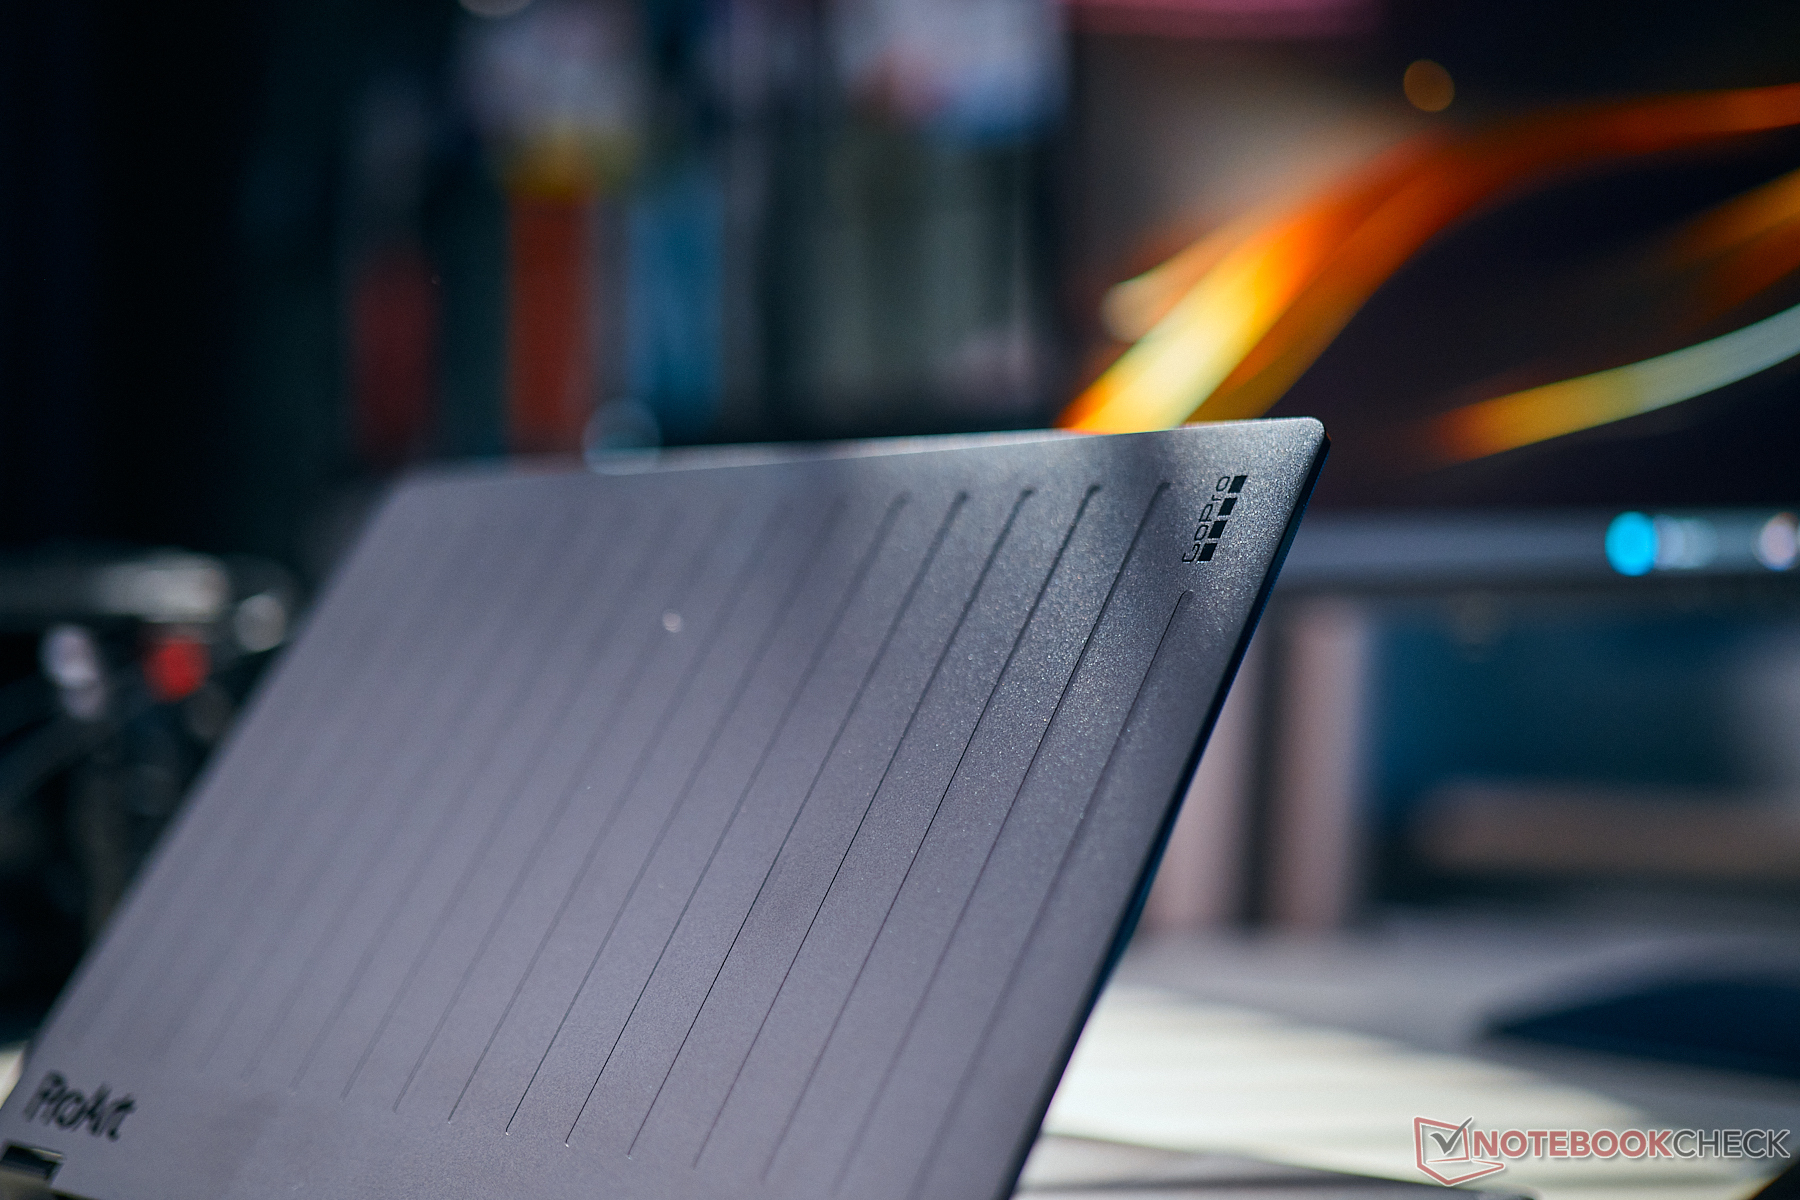
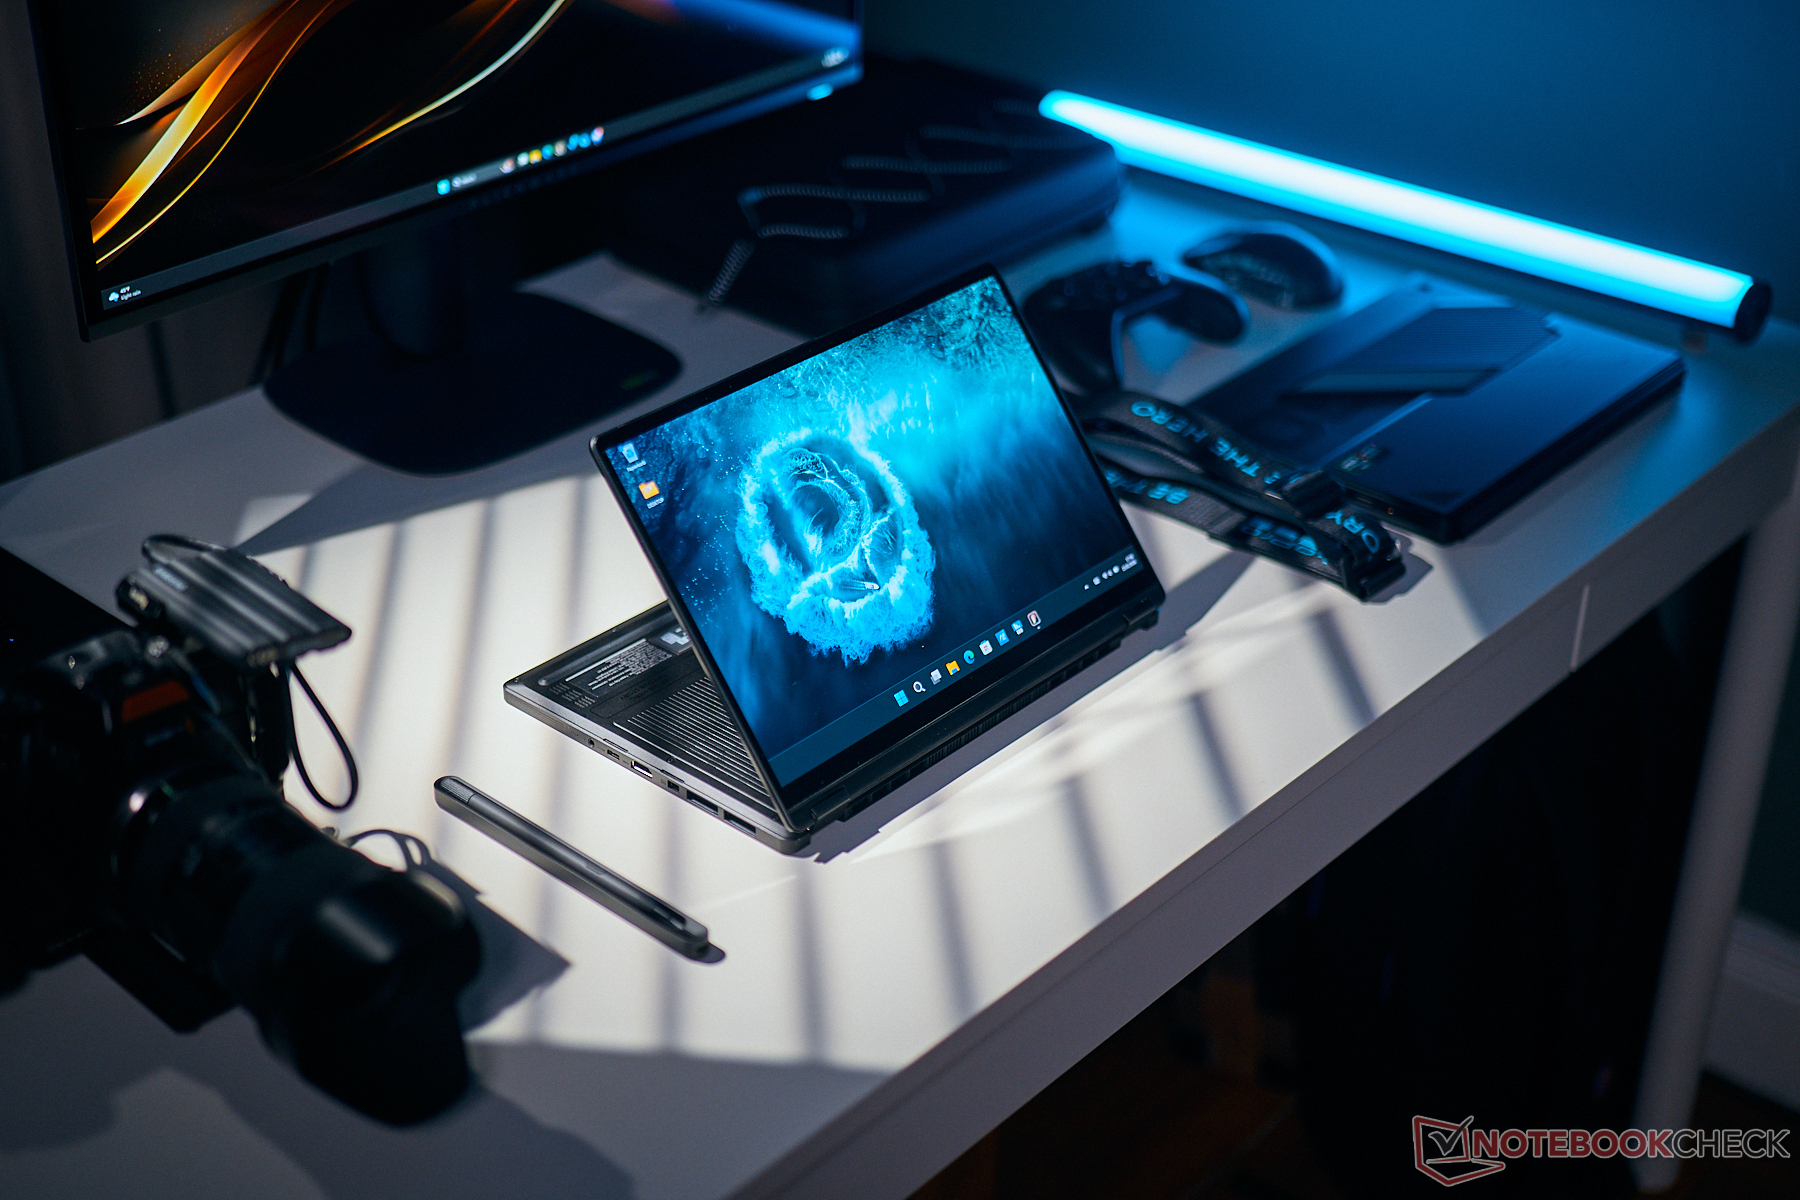
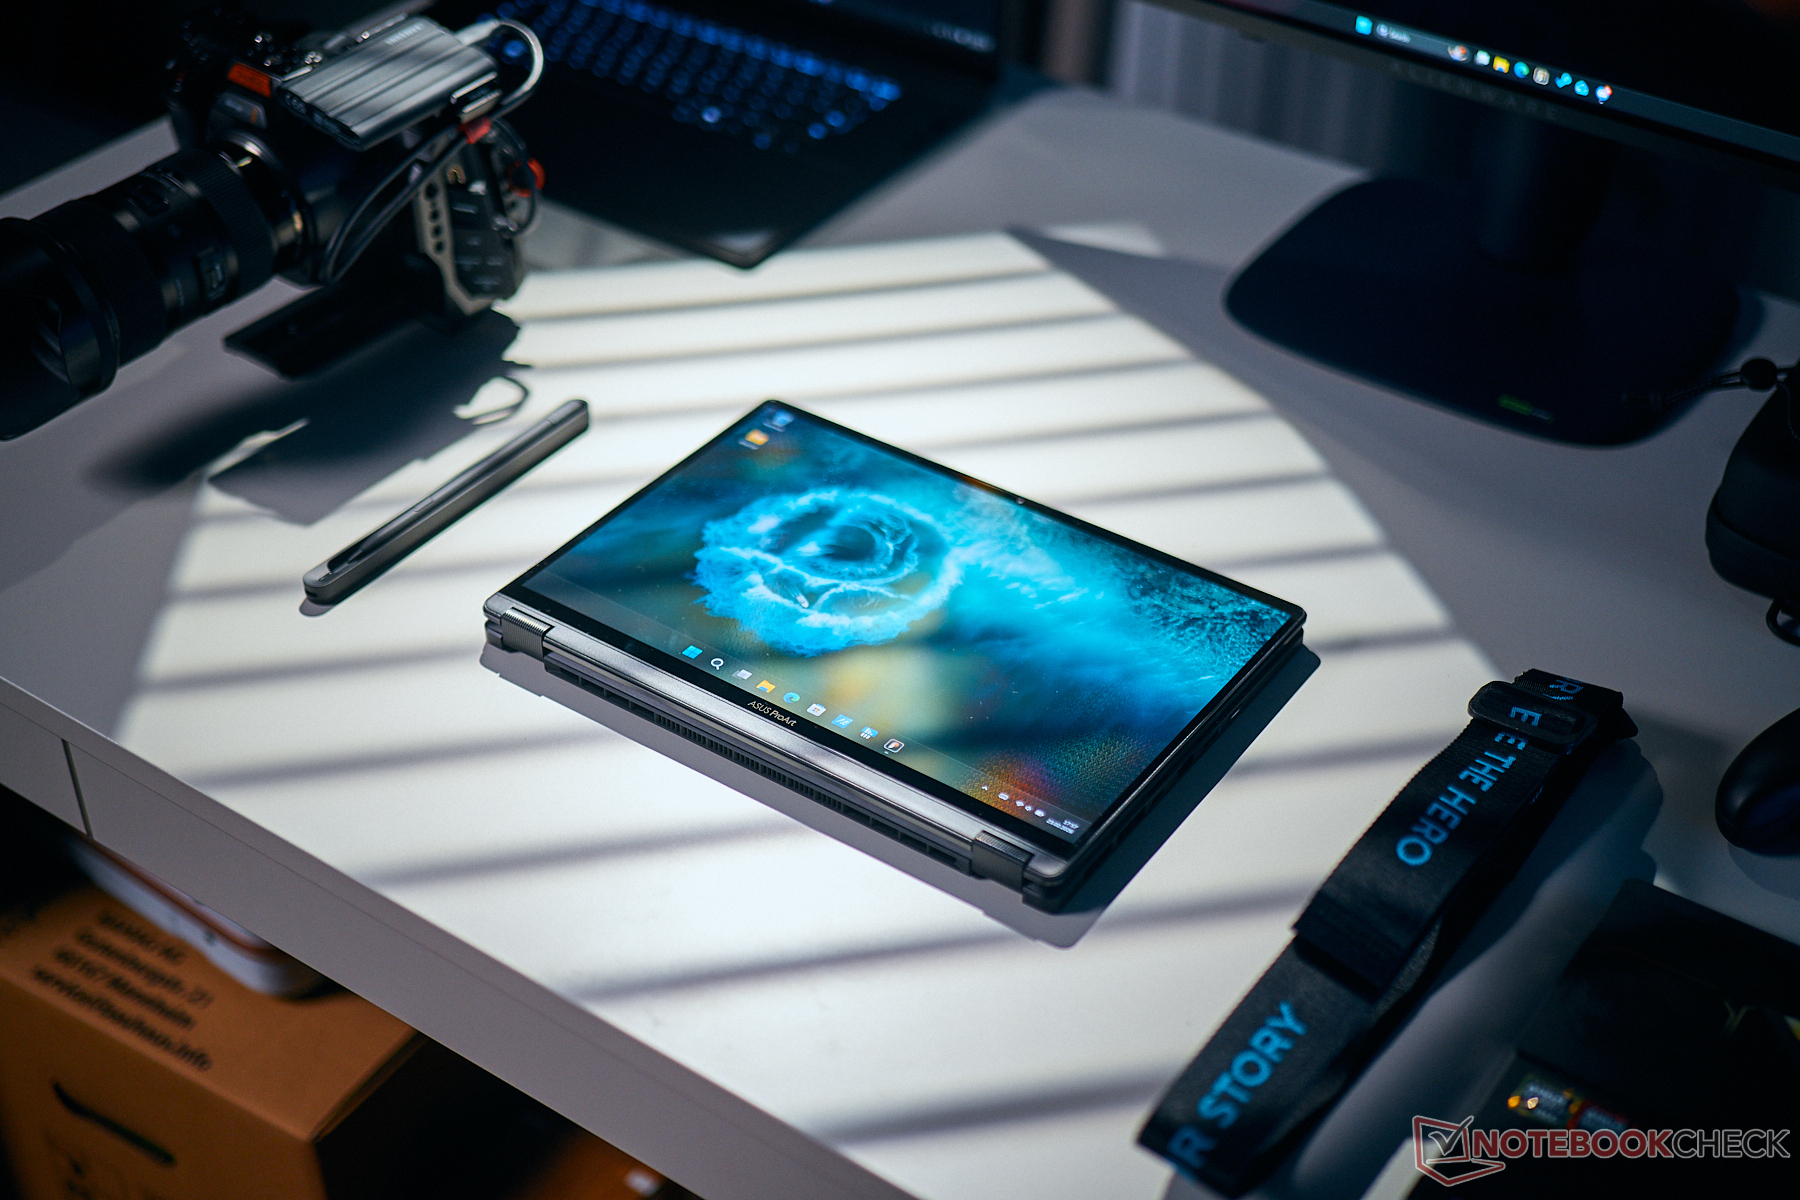
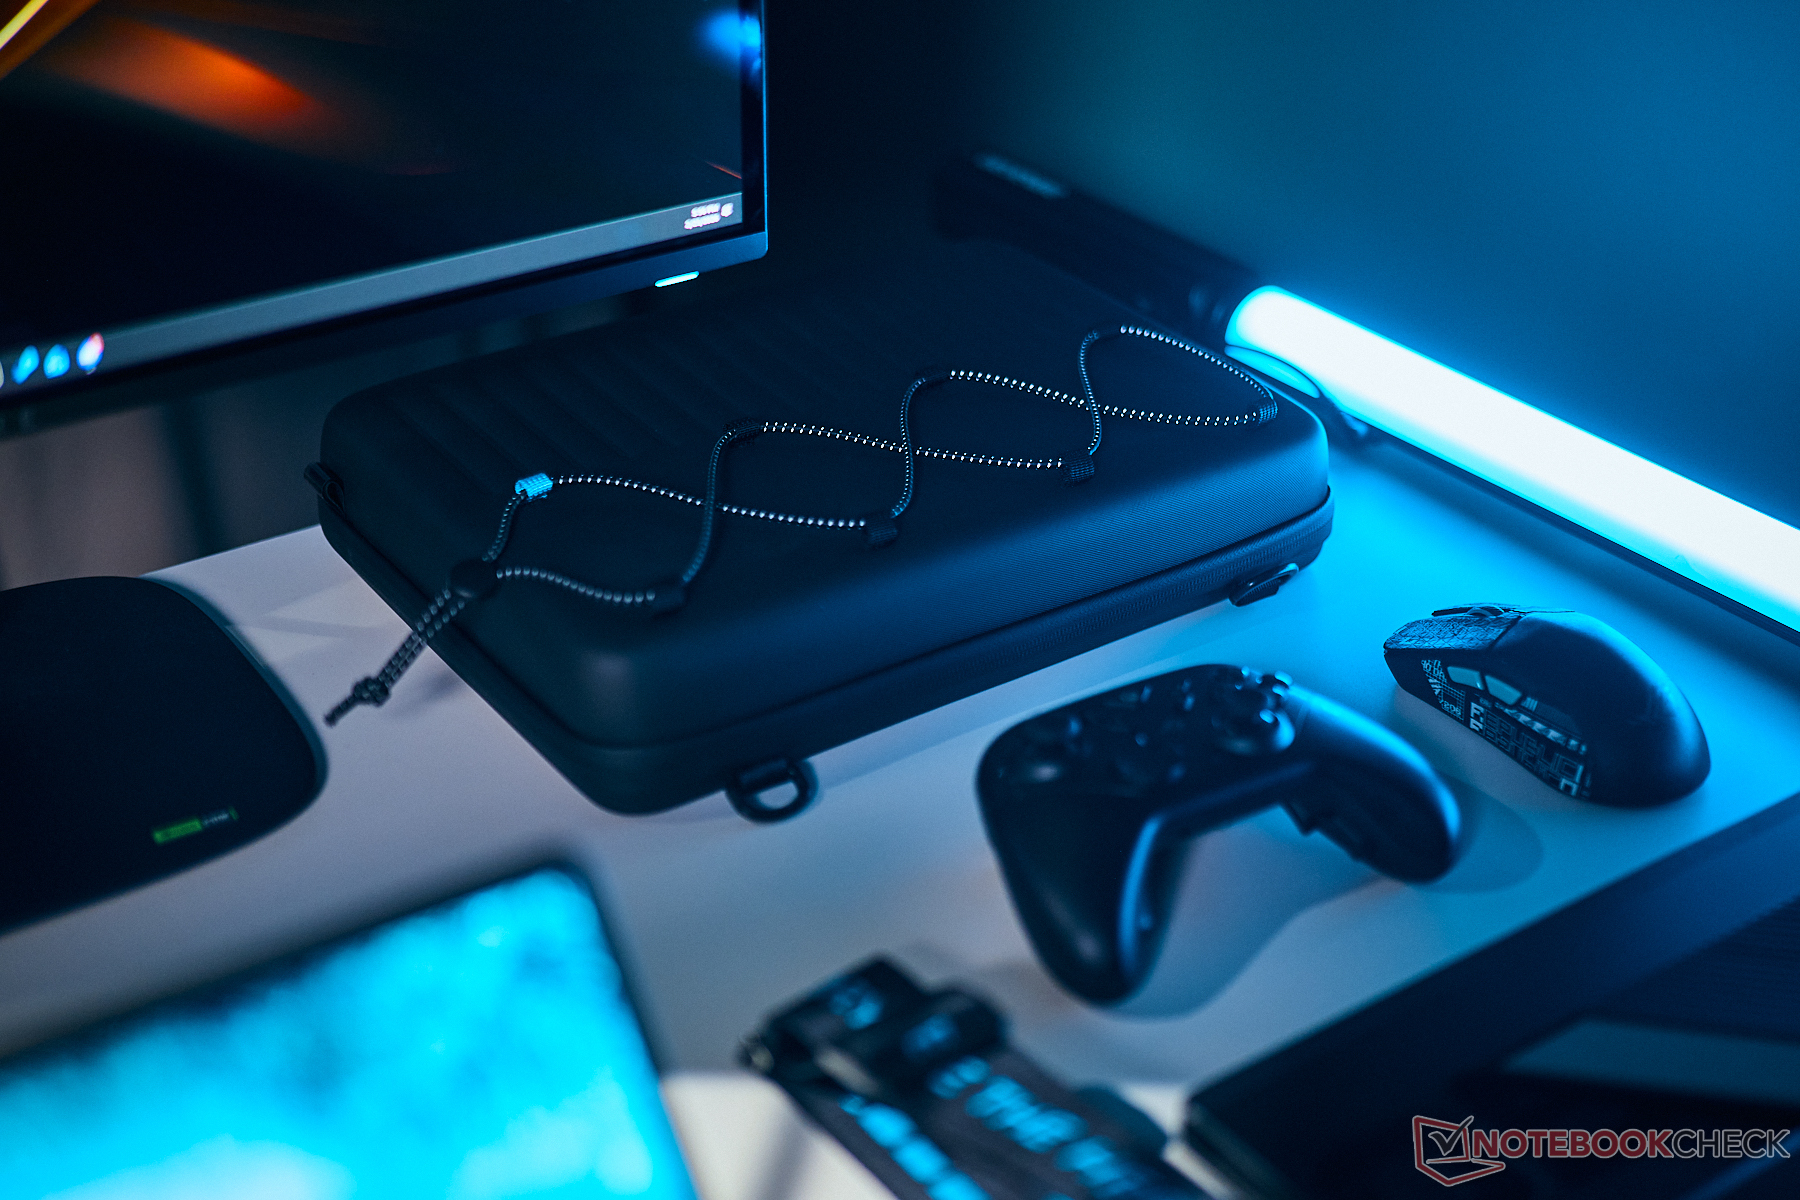
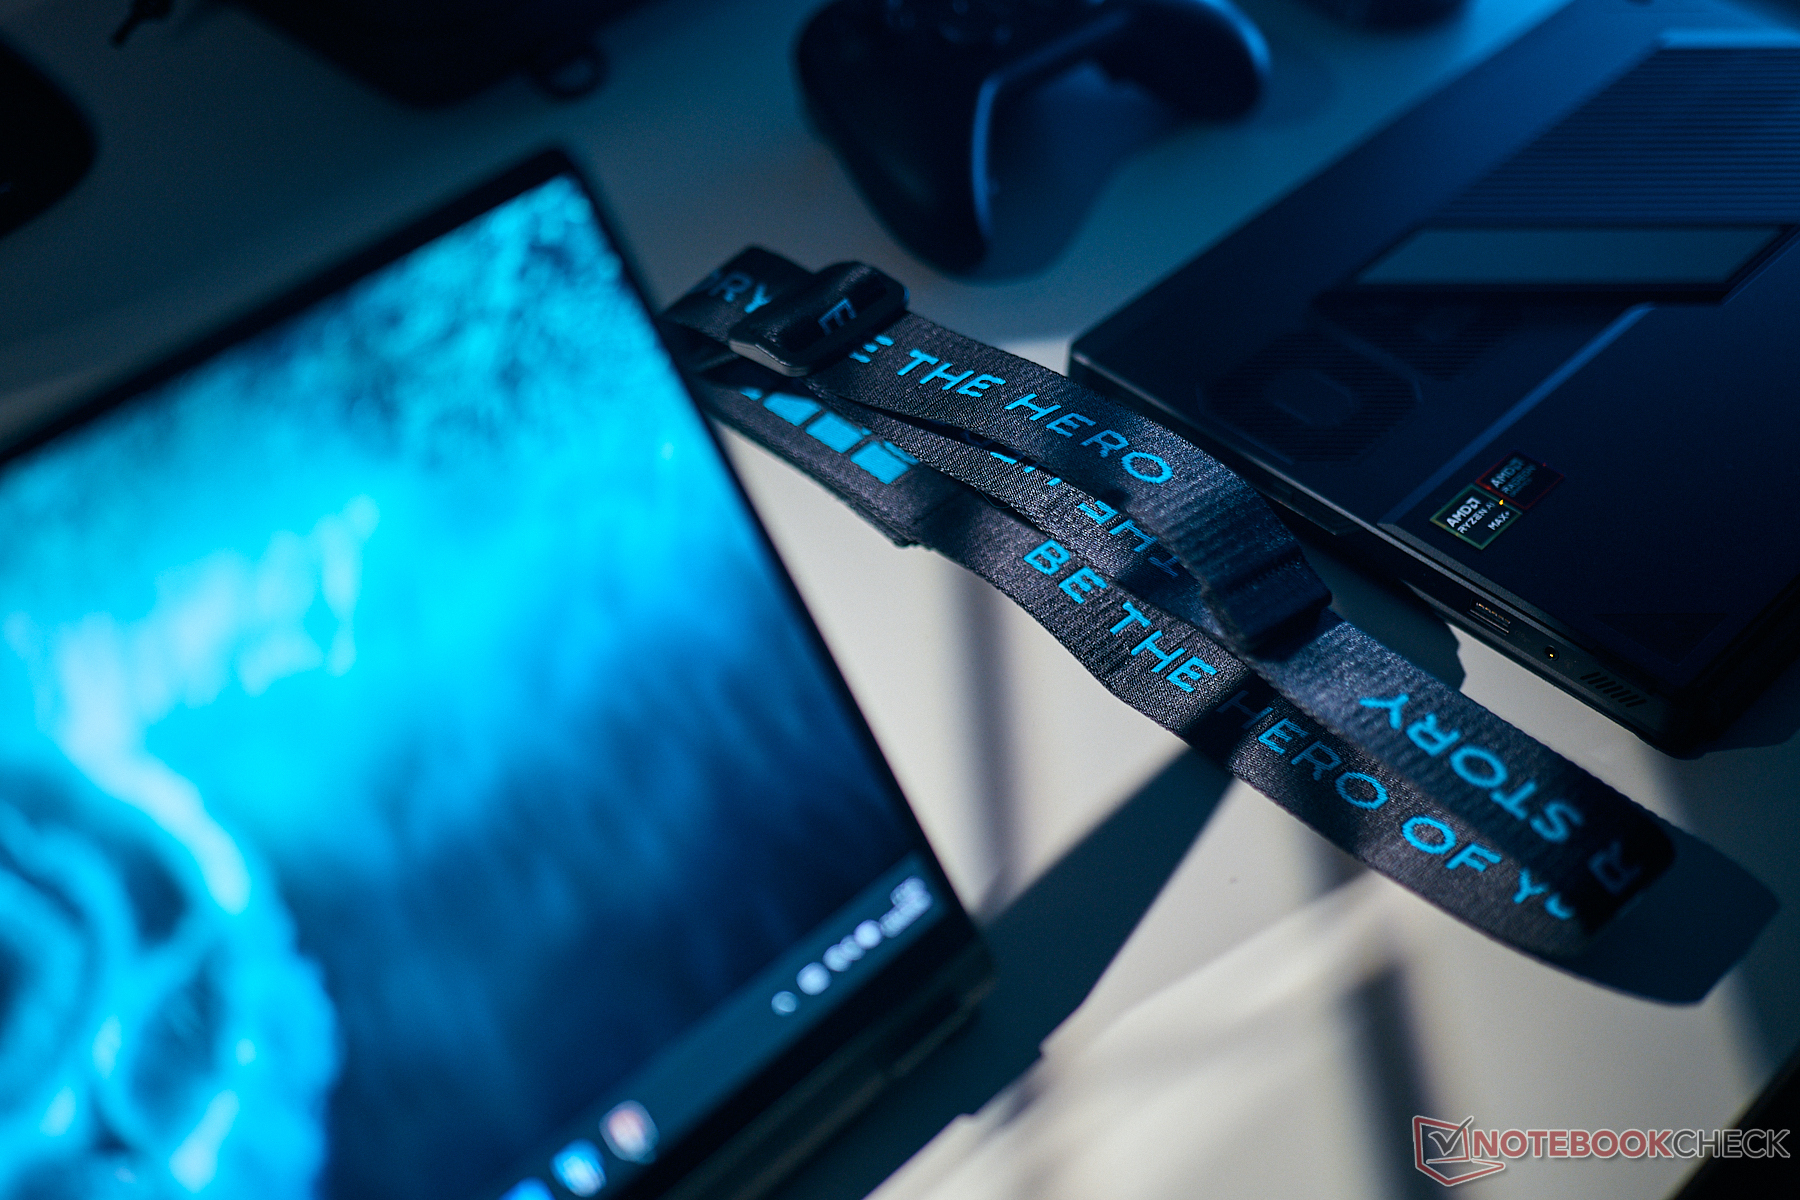
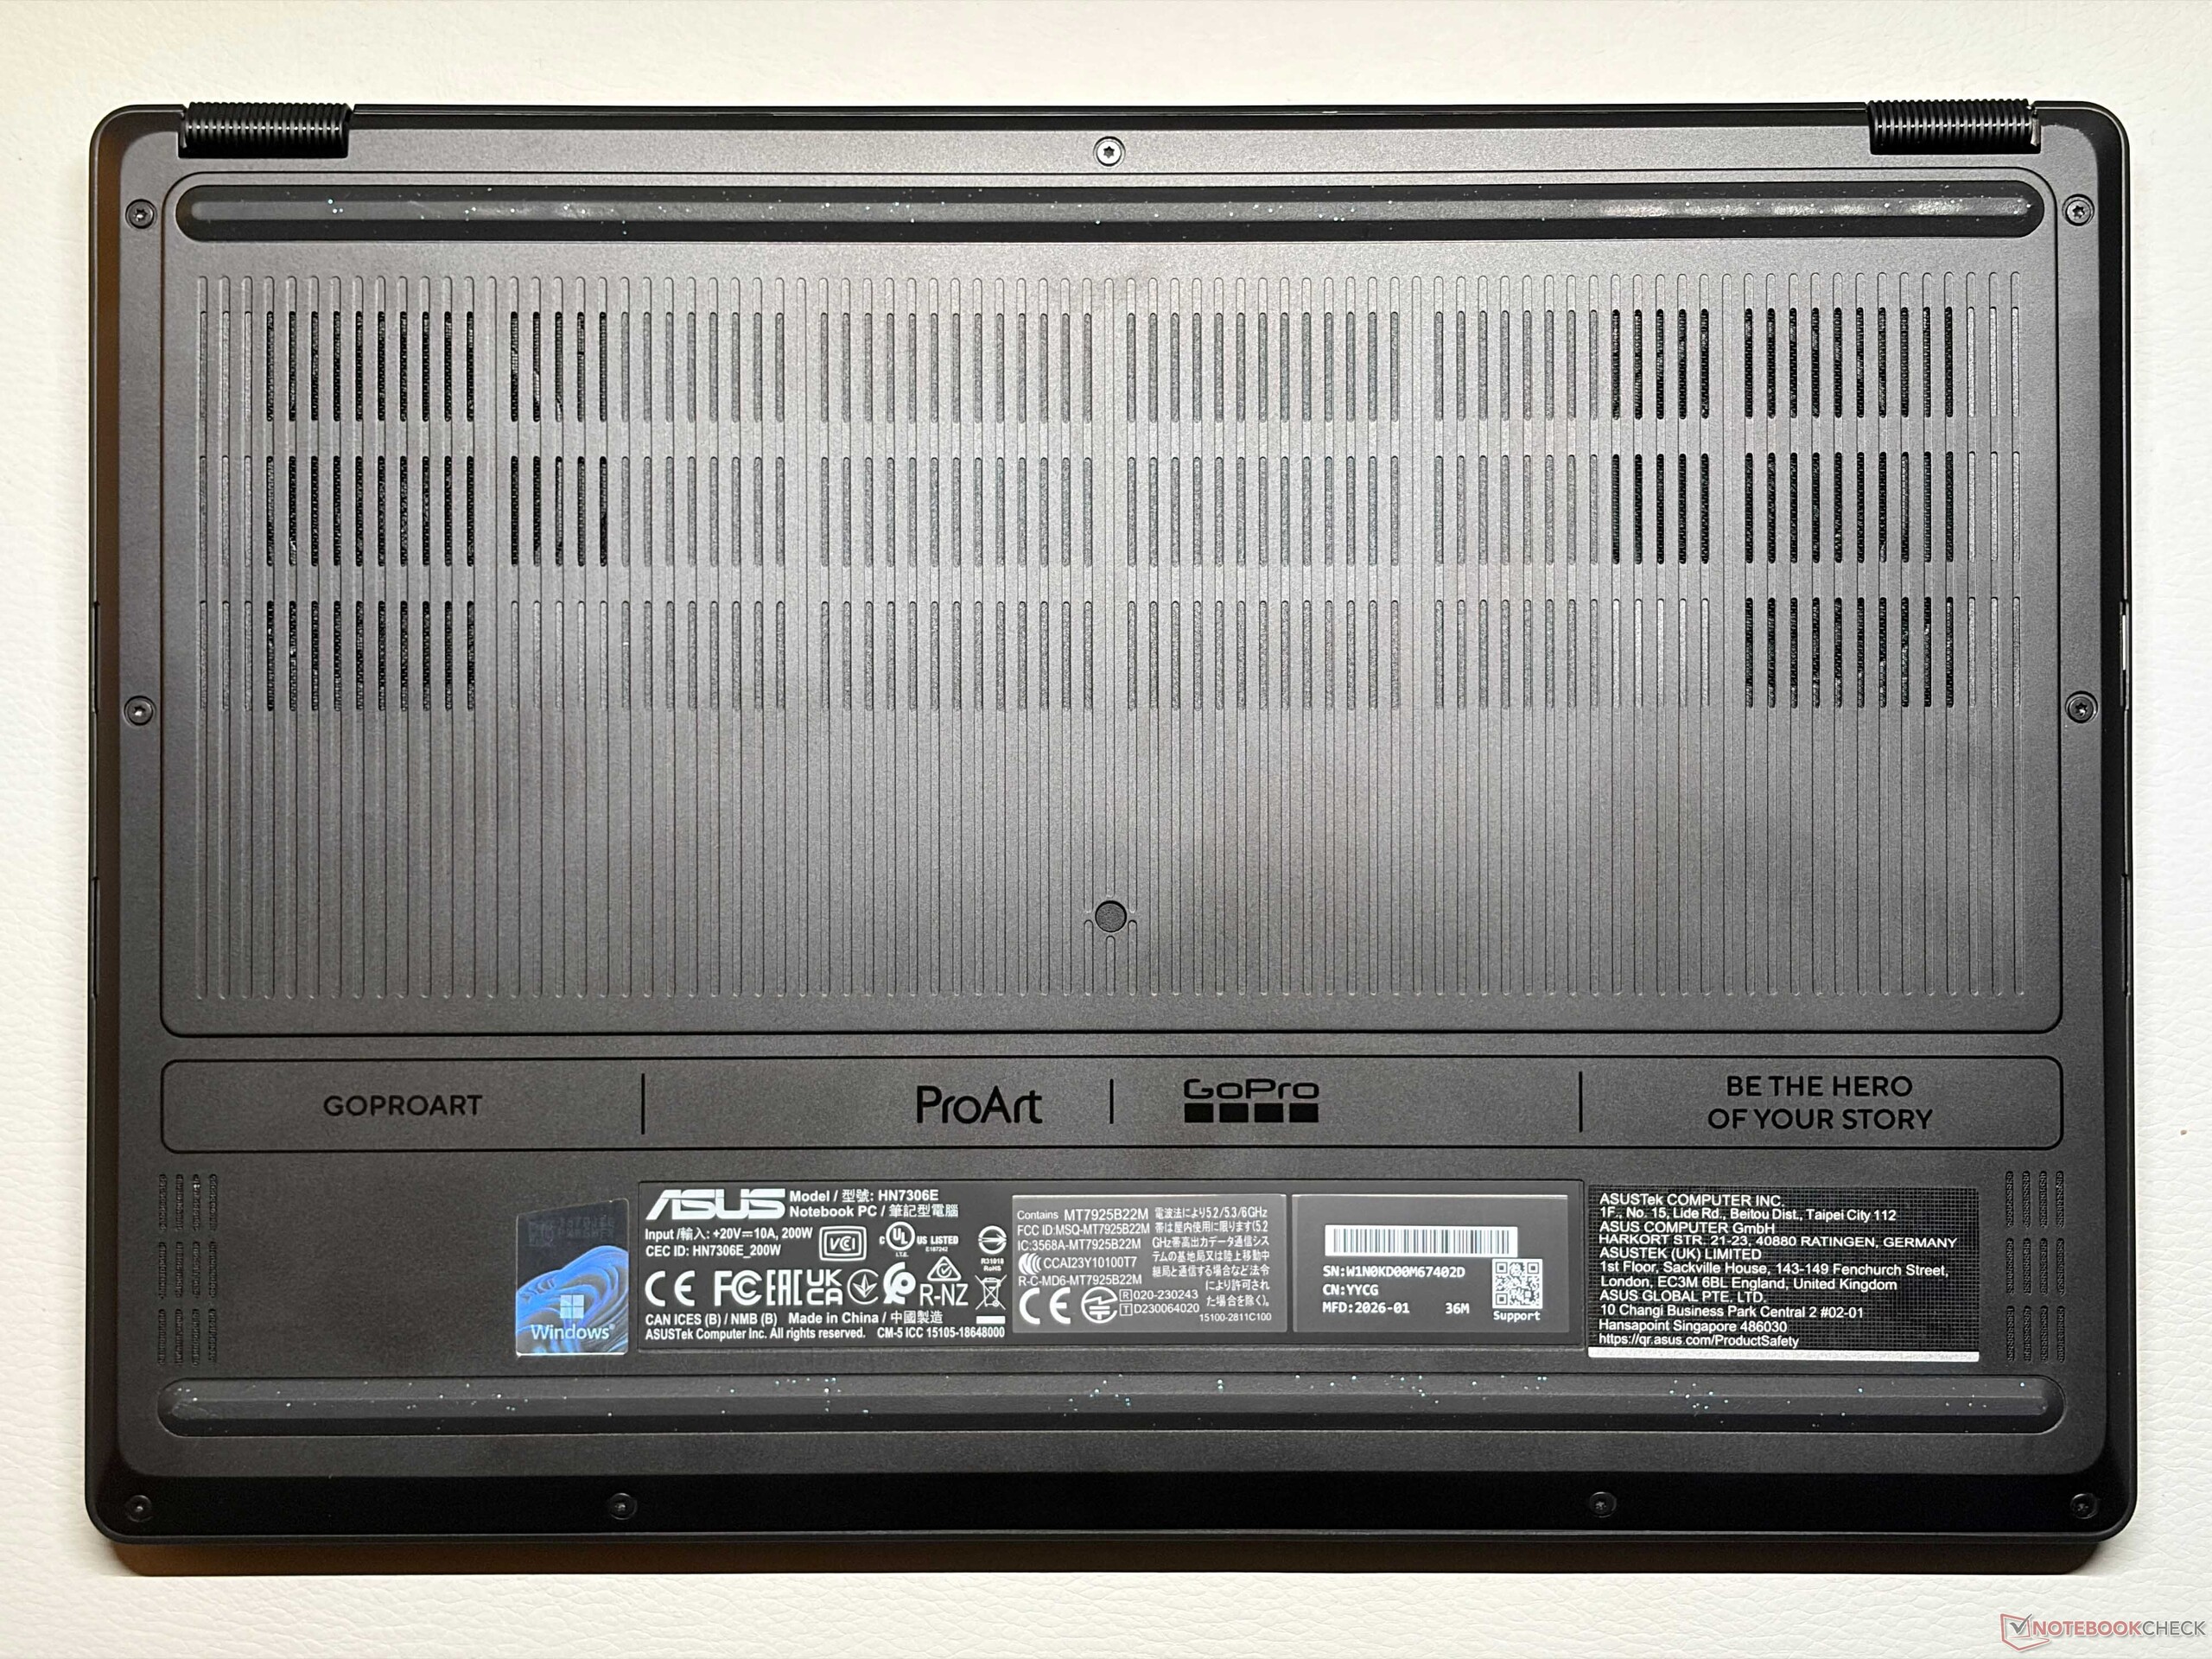
While the basic chassis construction is similar to the predecessor, the new GoPro edition gets some visual adjustments and subtle blue highlights. We particularly like the new design pattern on the lid with the matte texture. They are noticeable, yet at the same time not too flashy. The base unit still offers the familiar smooth surface, which attracts fingerprints more easily compared to the lid. The overall quality impression (build quality and stability) is once again excellent. You can obviously flip the screen of the convertible, which makes it very versatile. At ~1.4 kg, the PX13 is one of the lightest devices in our comparison group of very powerful compact laptops.
Connectivity remains unchanged from before, which means you get three USB ports (2x USB 4.0) as well as HDMI. The microSD-card reader manages good transfer rates, but faster SD Express cards are not supported. We record high transfer rates for the Wi-Fi 7 module and the 1080p webcam does its job, but image quality is not great.


| SD Card Reader | |
| average JPG Copy Test (av. of 3 runs) | |
| Apple MacBook Pro 14 2024 M4 Pro (Angelbird AV Pro V60) | |
| Asus ProArt PX13 HN7306EA (Angelbird AV Pro V60) | |
| Asus ROG Flow Z13 GZ302EA-RU073W (Angelbird AV Pro V60) | |
| Average of class Convertible (28.1 - 197, n=23, last 2 years) | |
| Asus ProArt PX13 HN7306 (Angelbird AV Pro V60) | |
| maximum AS SSD Seq Read Test (1GB) | |
| Asus ProArt PX13 HN7306 (Angelbird AV Pro V60) | |
| Asus ProArt PX13 HN7306EA (Angelbird AV Pro V60) | |
| Asus ROG Flow Z13 GZ302EA-RU073W (Angelbird AV Pro V60) | |
| Apple MacBook Pro 14 2024 M4 Pro (Angelbird AV Pro V60) | |
| Average of class Convertible (28.9 - 254, n=22, last 2 years) | |
| Networking | |
| Asus ProArt PX13 HN7306EA | |
| iperf3 transmit AXE11000 | |
| iperf3 receive AXE11000 | |
| Asus ZenBook Duo UX8407AA | |
| iperf3 transmit AXE11000 | |
| iperf3 receive AXE11000 | |
| Dell XPS 14 Core Ultra X7 358H | |
| iperf3 transmit AXE11000 | |
| iperf3 receive AXE11000 | |
| iperf3 transmit AXE11000 6GHz | |
| iperf3 receive AXE11000 6GHz | |
| Asus ROG Flow Z13 GZ302EA-RU073W | |
| iperf3 transmit AXE11000 | |
| iperf3 receive AXE11000 | |
| Asus ProArt PX13 HN7306 | |
| iperf3 transmit AXE11000 | |
| iperf3 receive AXE11000 | |
| Apple MacBook Pro 14 2024 M4 Pro | |
| iperf3 transmit AXE11000 | |
| iperf3 receive AXE11000 | |


Accessories

The GoPro Edition gets a special hard-case packaging as well as a softer case, which can later be used for your GoPro cameras and accessories. You also get a 12-month Premium+ subscription for GoPro's service. The familiar Asus Storycube app now also supports all your GoPro footage.
Input Devices
The typing experience is once again very comfortable thanks to generous 1.7 mm key travel and crisp feedback similar to the previous model. The GoPro edition gets a new special key that automatically launches the GoPro viewer and the keyboard illumination is blue. The click pad was also slightly adjusted. The DialPad wheel in the upper left corner is still easy to use, but mechanical clicks are very deep and require some force, which takes some time getting used to. You can obviously use the capacitive touchscreen as well. The new Asus Pen 3.0 with 4096 pressure levels (and a handy charging dock) feels good in the hand and supports the latest MPP 2.6 protocol.


Display - 60 Hz OLED
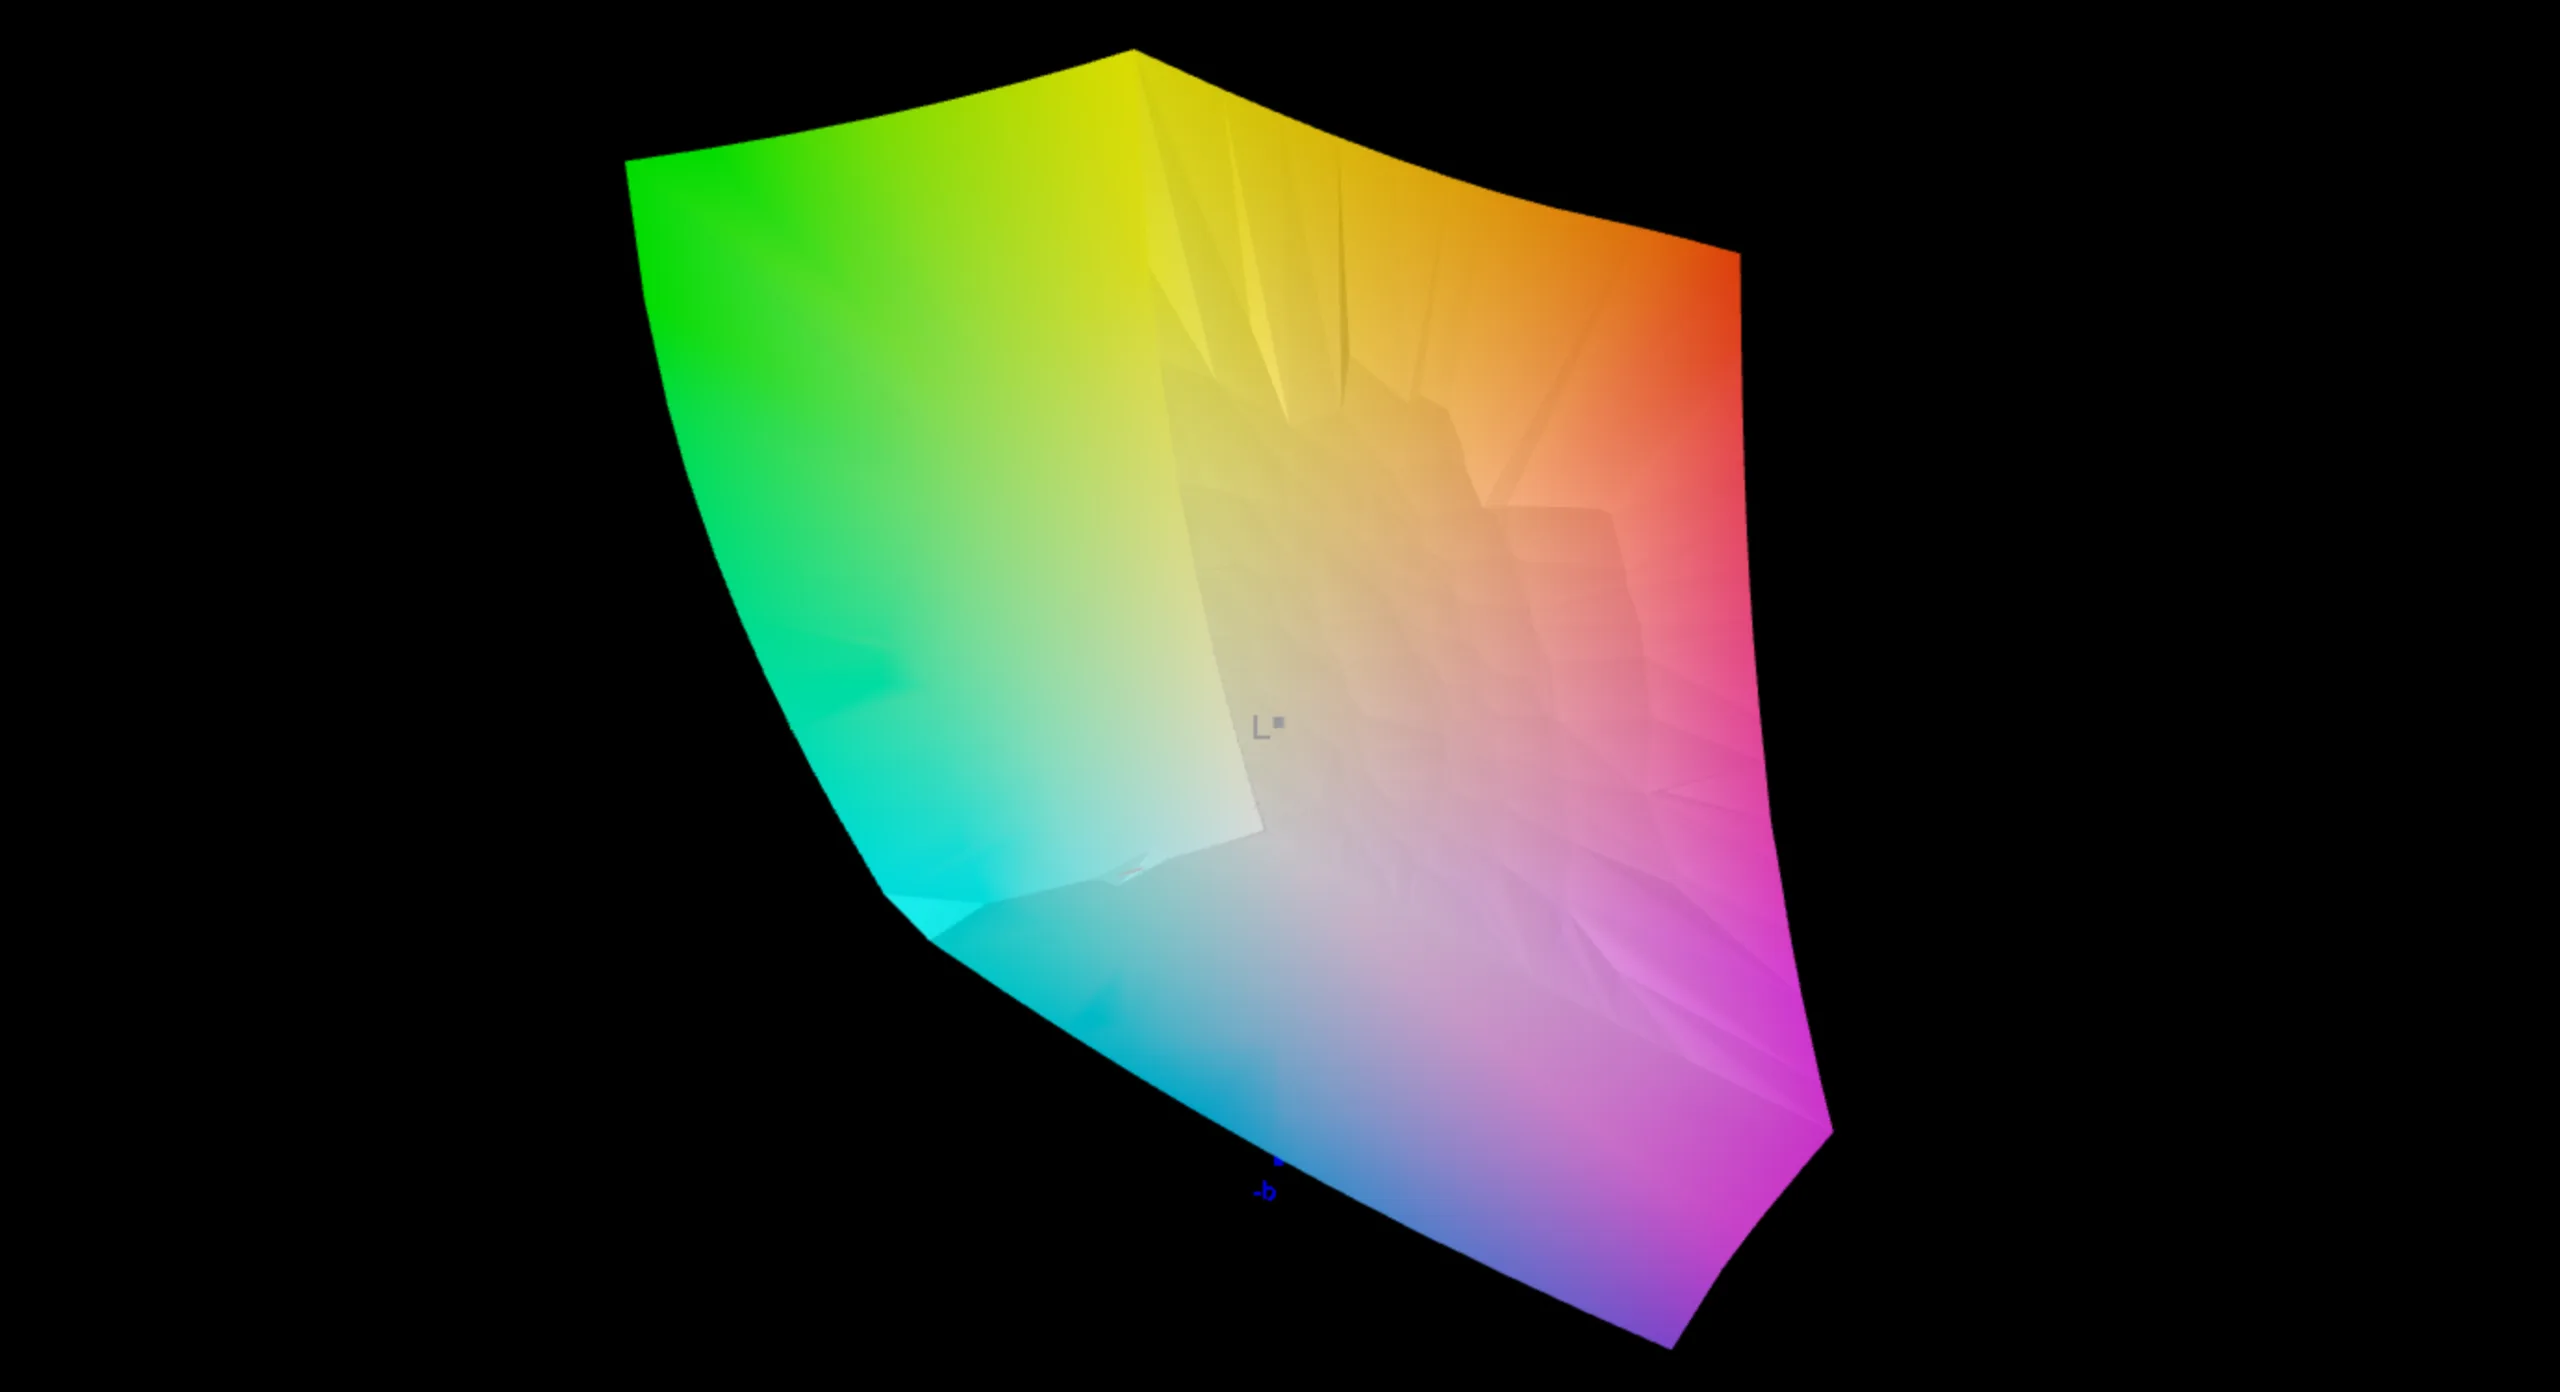
Asus did not change the display compared to the predecessor and it is still the same panel from Samsung. With 2880 x 1800 pixels you get sharp images, but bright contents appear a bit grainy due to the touch layer. You also benefit from deep blacks, rich colors and fast response times, but the problem is once again the refresh rate of just 60 Hz, which is simply not enough for a high-end product in 2026.
This also translates to the brightness. The SDR results are marginally better than before with ~380 nits on average, but this si still not great for a modern OLED. The maximum HDR brightness is 628 nits (535 nits full-screen), which is okay, but again, other panels easily reach more than 1,000 nits.
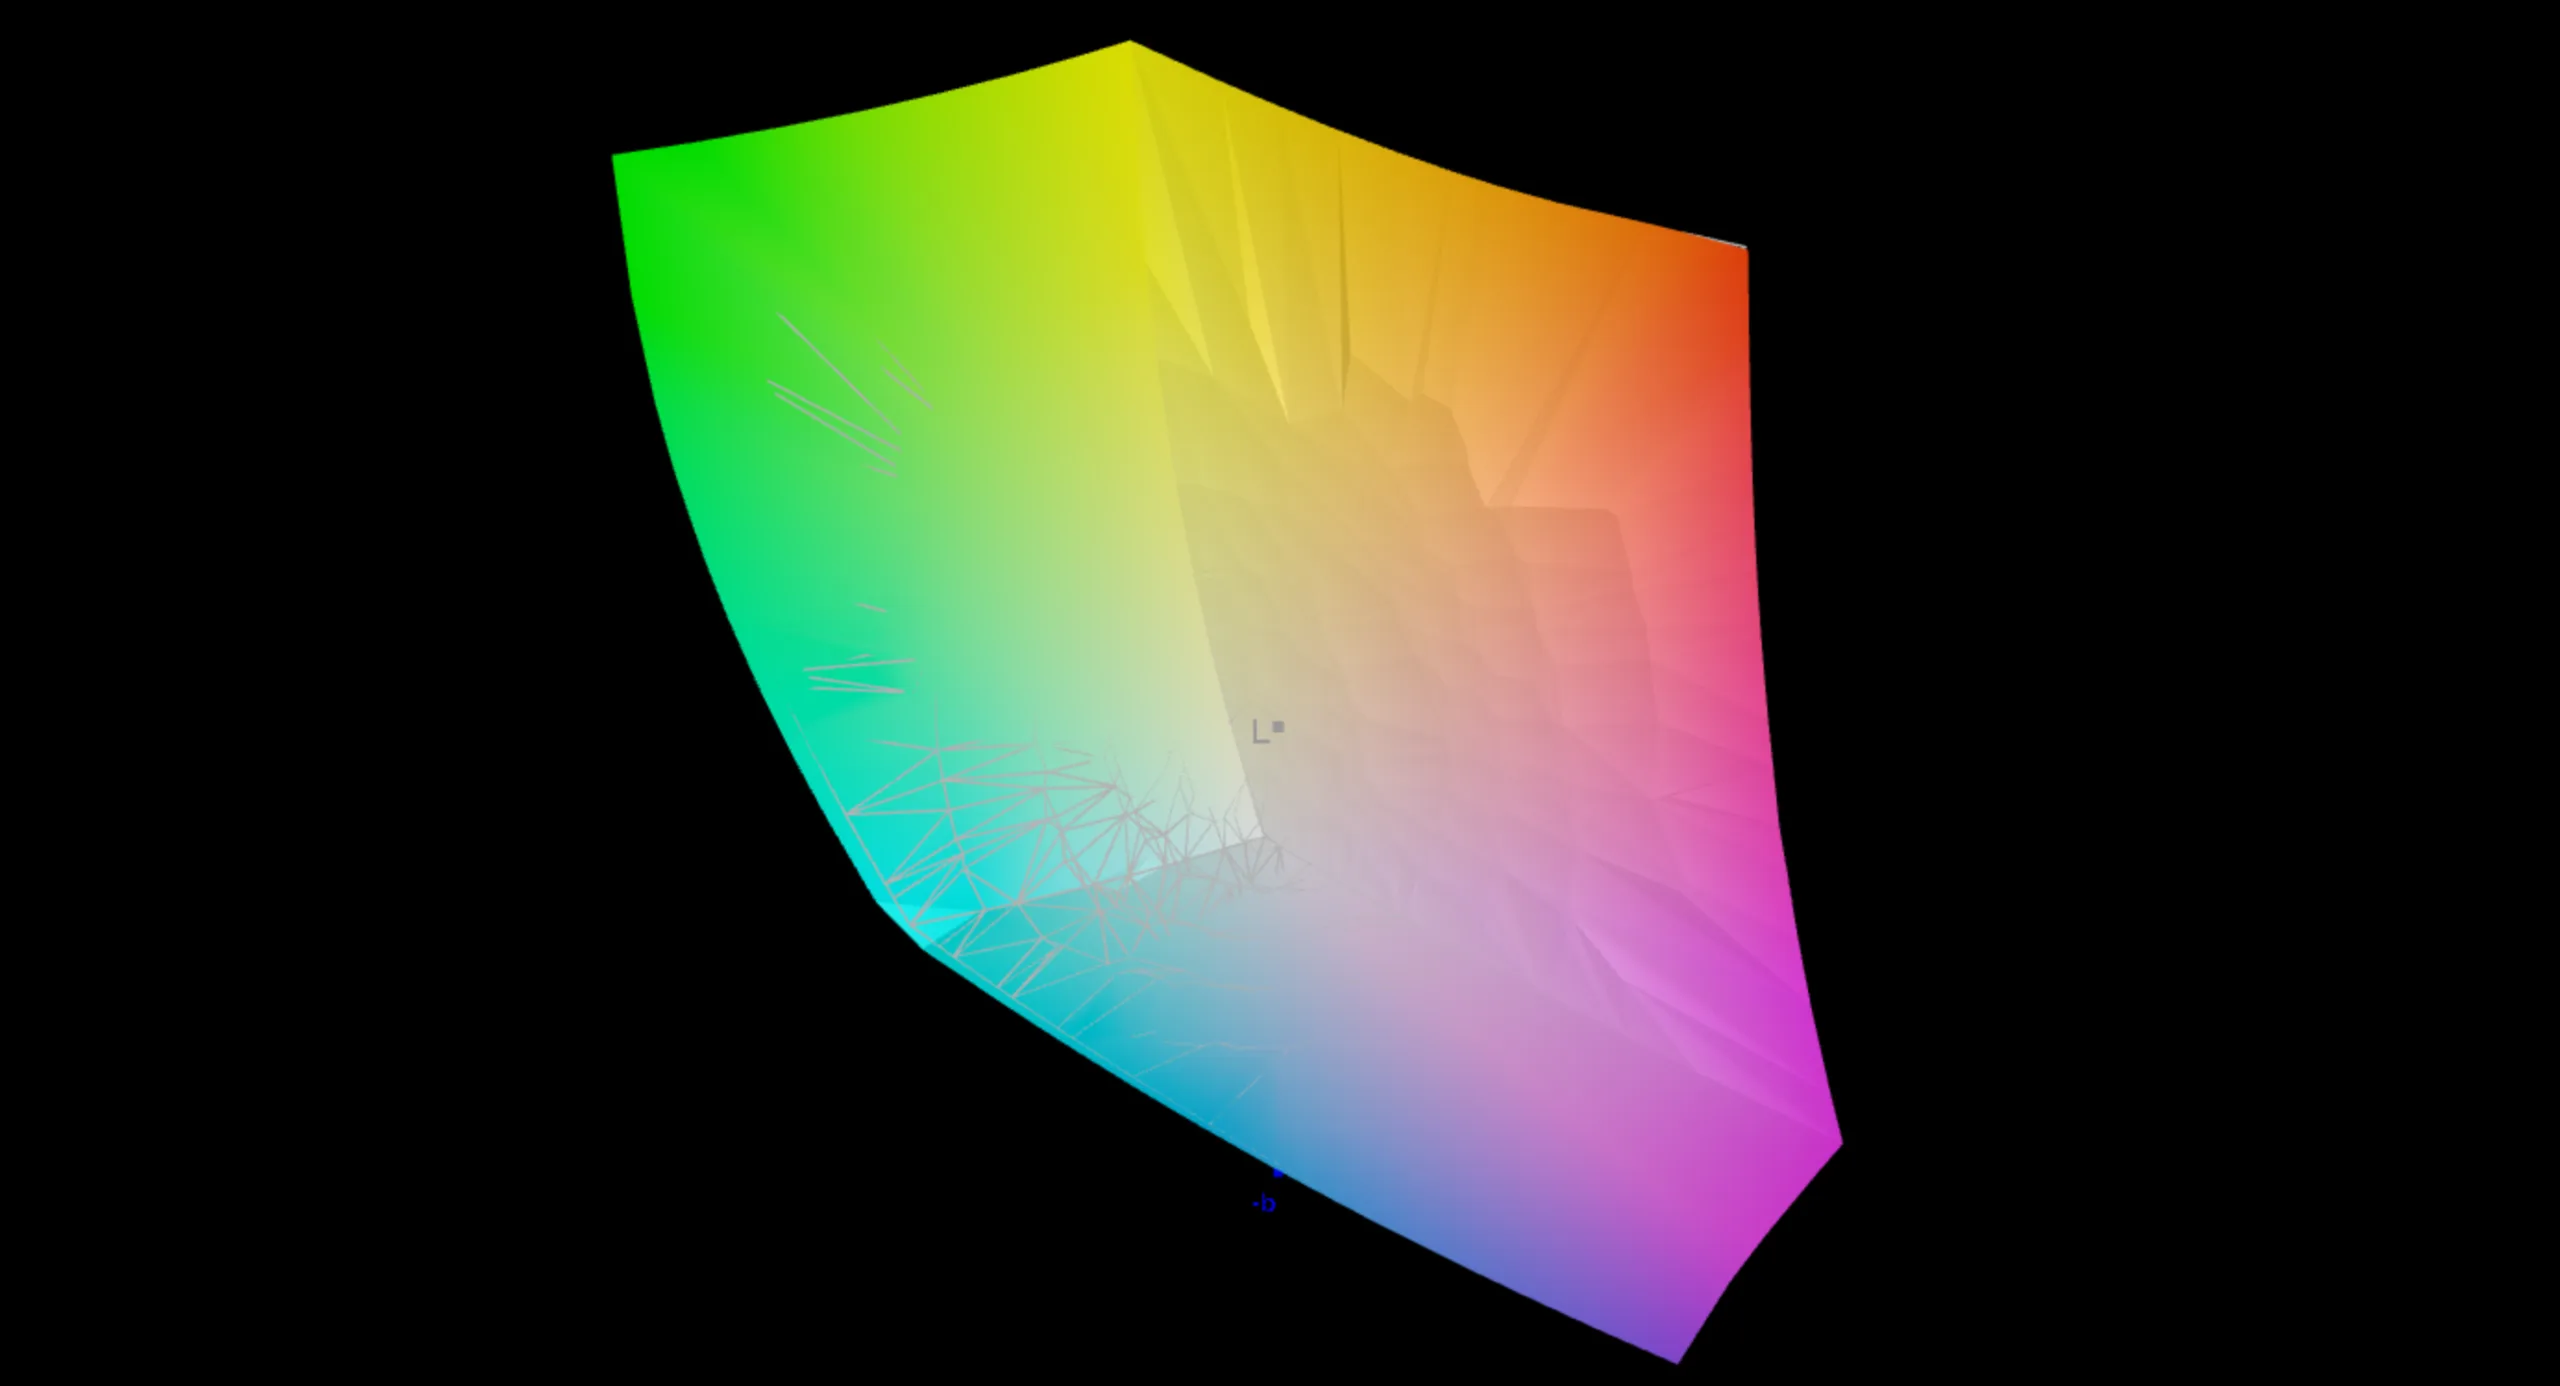
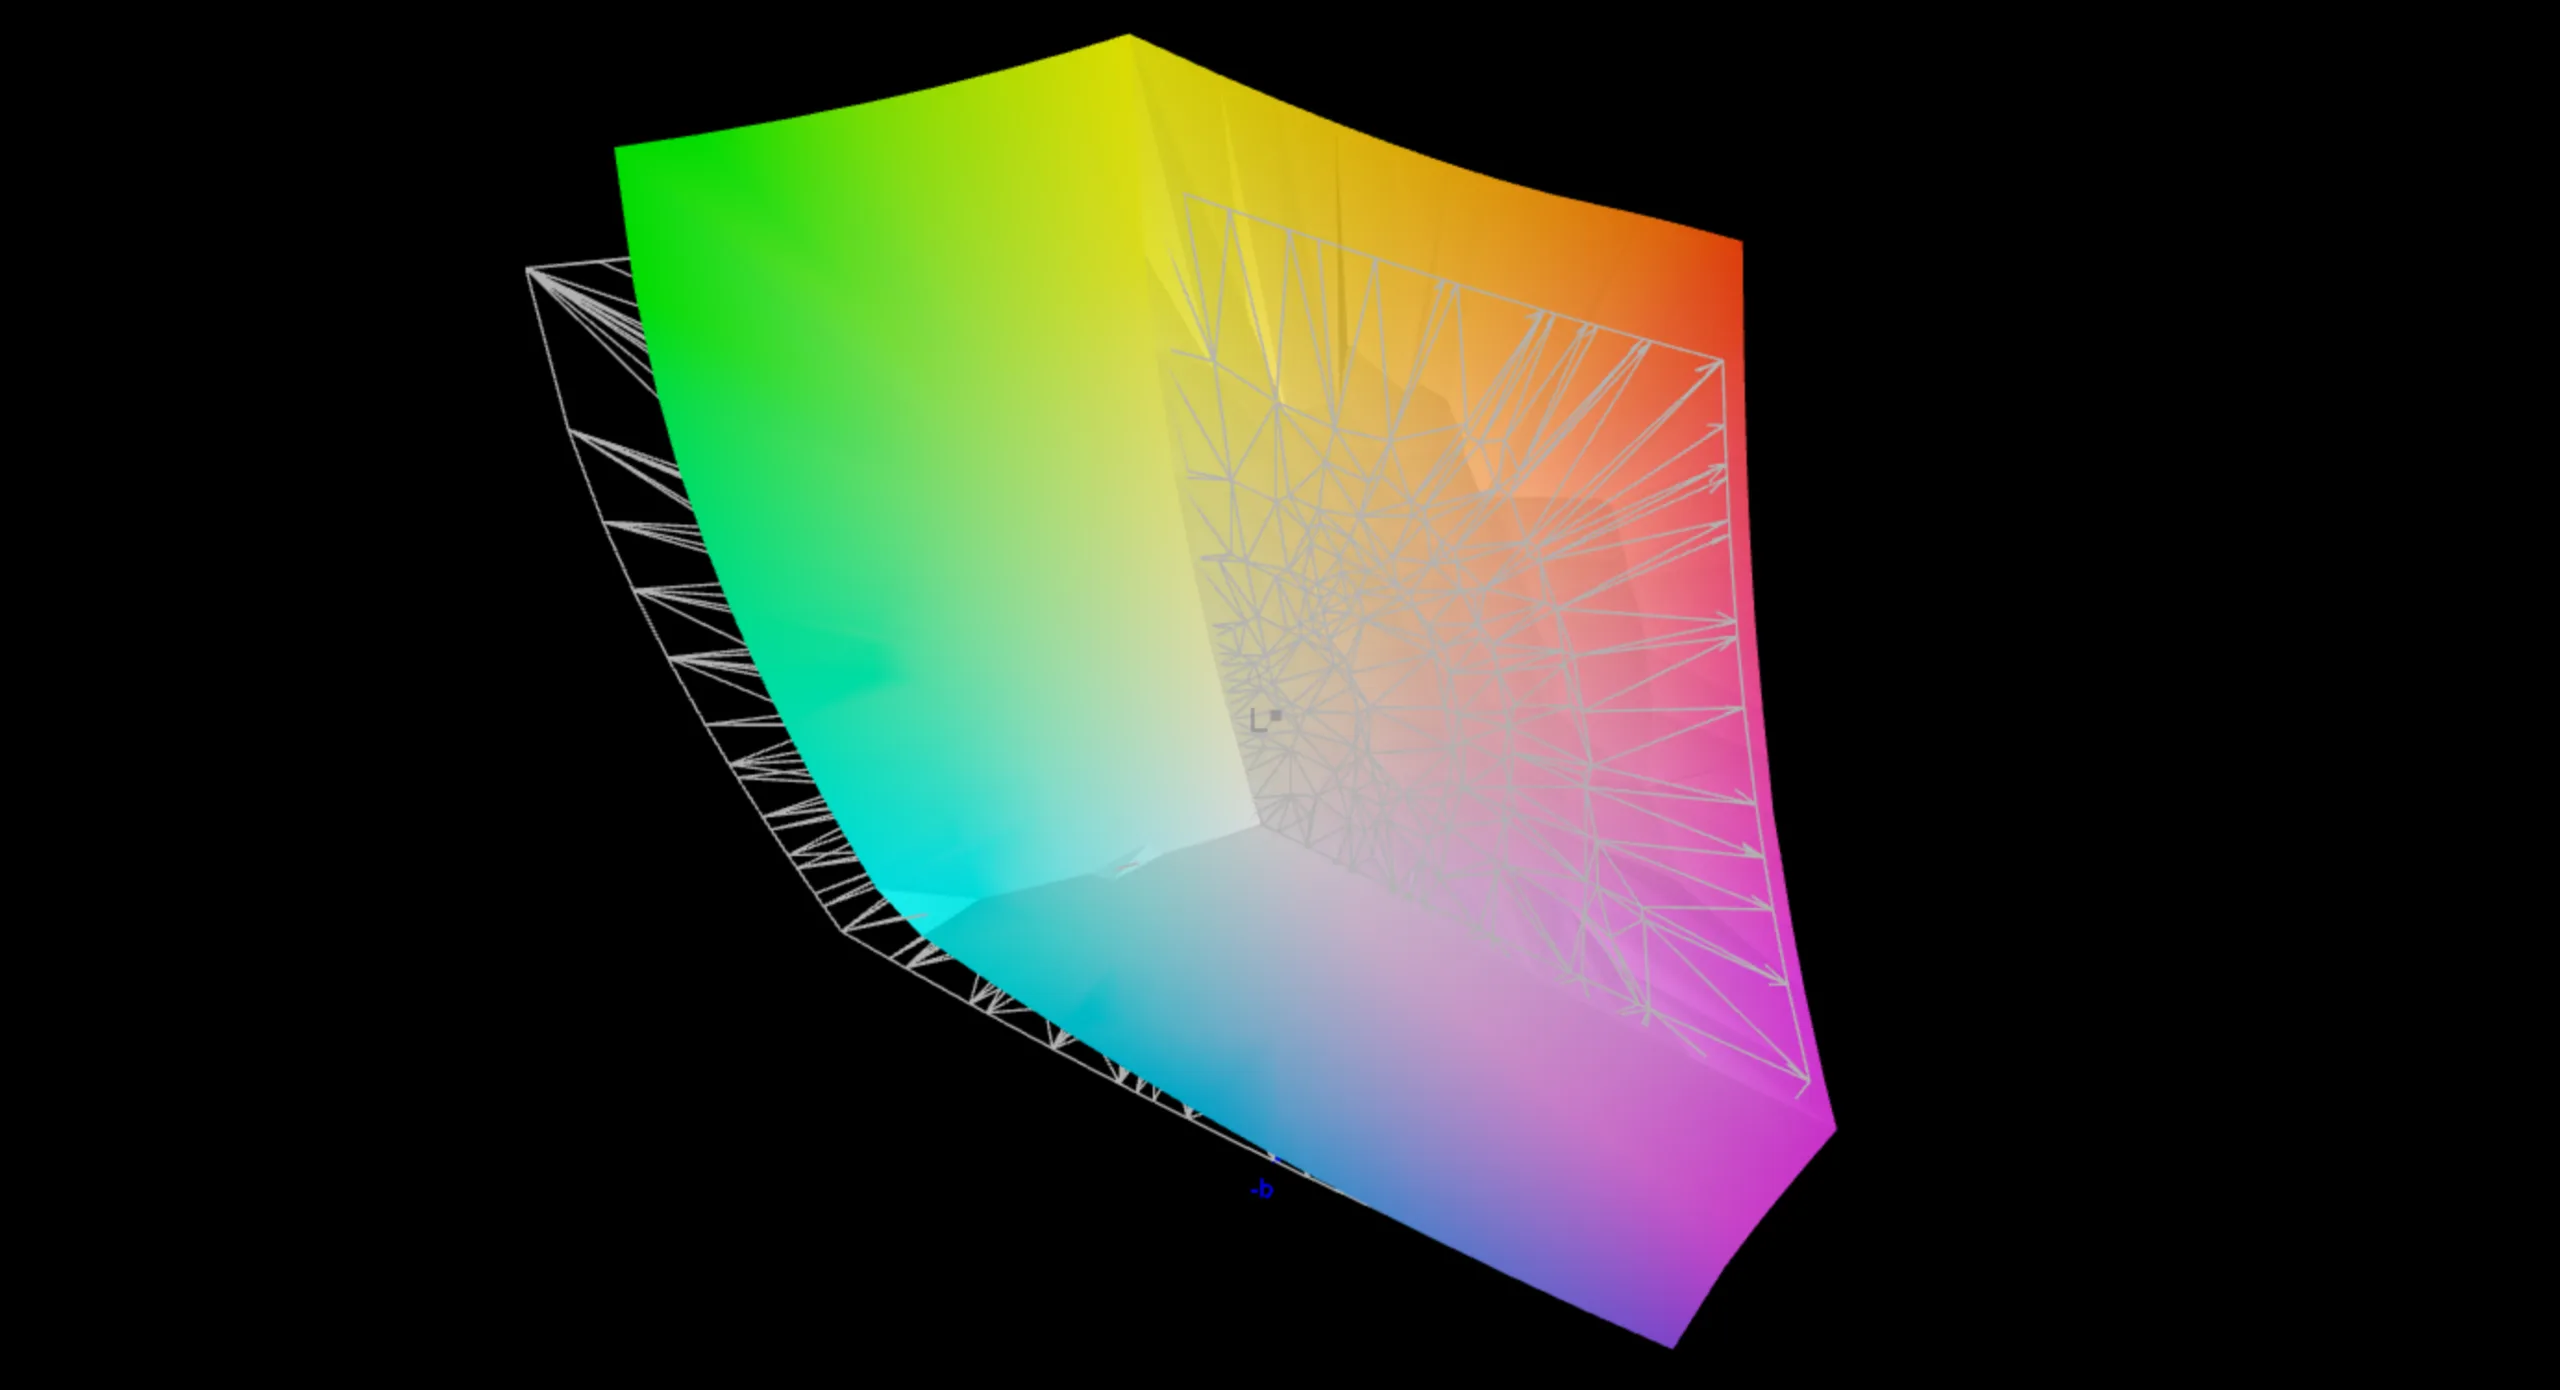
The factory calibration is once again excellent in our analysis with the professional CalMAN software and you also get an accurate sRGB profile, so the PX13 is very well-suited for picture and video editing (P3 and sRGB color gamut). We can detect PWM flickering, but Asus includes a software solution to reduce the issues. Please see our review of the predecessor for more information.
| |||||||||||||||||||||||||
Brightness Distribution: 98 %
Center on Battery: 381 cd/m²
Contrast: ∞:1 (Black: 0 cd/m²)
ΔE ColorChecker Calman: 1.1 | ∀{0.5-29.43 Ø4.72}
ΔE Greyscale Calman: 1.3 | ∀{0.09-98 Ø4.97}
89.9% AdobeRGB 1998 (Argyll 3D)
100% sRGB (Argyll 3D)
99.8% Display P3 (Argyll 3D)
Gamma: 2.15
CCT: 6555 K
| Asus ProArt PX13 HN7306EA ATNA33AA08-0, OLED, 2880x1800, 13.3", 60 Hz | Asus ZenBook Duo UX8407AA NB140B9M-T01, OLED, 2880x1800, 14", 144 Hz | Dell XPS 14 Core Ultra X7 358H LG Philips 140WT2, OLED, 2880x1800, 14", 120 Hz | Asus ROG Flow Z13 GZ302EA-RU073W TL134ADXP03, IPS, 2560x1600, 13.4", 180 Hz | Asus ProArt PX13 HN7306 ATNA33AA08-0, OLED, 2880x1800, 13.3", 60 Hz | Apple MacBook Pro 14 2024 M4 Pro MiniLED, 3024x1964, 14.2", 120 Hz | |
|---|---|---|---|---|---|---|
| Display | -0% | 3% | -2% | -0% | -0% | |
| Display P3 Coverage (%) | 99.8 | 99.5 0% | 99.7 0% | 95.1 -5% | 99.4 0% | 99.6 0% |
| sRGB Coverage (%) | 100 | 100 0% | 100 0% | 99.6 0% | 100 0% | 100 0% |
| AdobeRGB 1998 Coverage (%) | 89.9 | 88.7 -1% | 98.2 9% | 89.7 0% | 88.9 -1% | 89 -1% |
| Response Times | 39% | 43% | -201% | -8% | -3093% | |
| Response Time Grey 50% / Grey 80% * (ms) | 1.73 ? | 0.26 ? 85% | 0.75 ? 57% | 5.4 ? -212% | 1.94 ? -12% | 77.2 ? -4362% |
| Response Time Black / White * (ms) | 1.45 ? | 0.4 ? 72% | 1.03 ? 29% | 4.2 ? -190% | 1.63 ? -12% | 71.6 ? -4838% |
| PWM Frequency (Hz) | 240 ? | 720 ? | 240.62 ? | 240 ? | 14880 ? | |
| PWM Amplitude * (%) | 50 | 70 -40% | 29 42% | 50 -0% | 90 -80% | |
| Screen | -32% | -21% | -16% | -5% | 40% | |
| Brightness middle (cd/m²) | 381 | 497 30% | 393.8 3% | 518 36% | 360 -6% | 638 67% |
| Brightness (cd/m²) | 385 | 495 29% | 389 1% | 489 27% | 358 -7% | 621 61% |
| Brightness Distribution (%) | 98 | 96 -2% | 96 -2% | 91 -7% | 98 0% | 95 -3% |
| Black Level * (cd/m²) | 0.3 | 0.02 | ||||
| Colorchecker dE 2000 * | 1.1 | 1.6 -45% | 1.27 -15% | 1.5 -36% | 1.1 -0% | 0.6 45% |
| Colorchecker dE 2000 max. * | 2.1 | 4.5 -114% | 3.35 -60% | 4 -90% | 2.3 -10% | 1.4 33% |
| Greyscale dE 2000 * | 1.3 | 2.5 -92% | 2 -54% | 1.6 -23% | 1.4 -8% | 0.8 38% |
| Gamma | 2.15 102% | 2.19 100% | 2.19 100% | 2.23 99% | 2.16 102% | 2.22 99% |
| CCT | 6555 99% | 6567 99% | 6379 102% | 6536 99% | 6554 99% | 6430 101% |
| Colorchecker dE 2000 calibrated * | 1.5 | 0.71 | 1.1 | |||
| Contrast (:1) | 1727 | 18000 | ||||
| Total Average (Program / Settings) | 2% /
-7% | 8% /
1% | -73% /
-45% | -4% /
-5% | -1018% /
-753% |
* ... smaller is better


Display Response Times
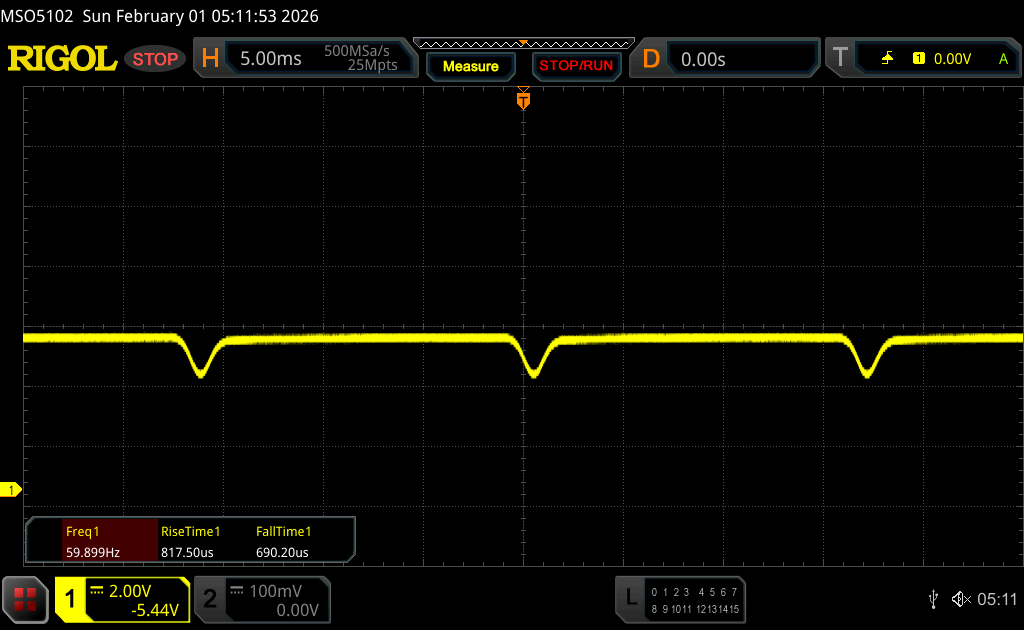
| ↔ Response Time Black to White | ||
|---|---|---|
| 1.45 ms ... rise ↗ and fall ↘ combined | ↗ 0.78 ms rise | 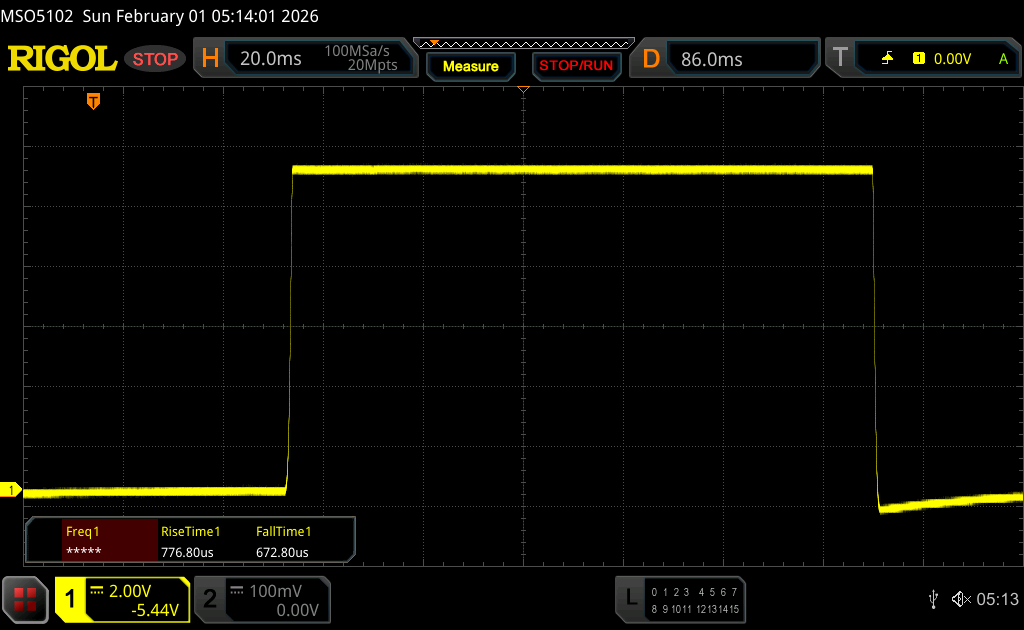 |
| ↘ 0.67 ms fall | ||
| The screen shows very fast response rates in our tests and should be very well suited for fast-paced gaming. In comparison, all tested devices range from 0.1 (minimum) to 240 (maximum) ms. » 9 % of all devices are better. This means that the measured response time is better than the average of all tested devices (19.8 ms). | ||
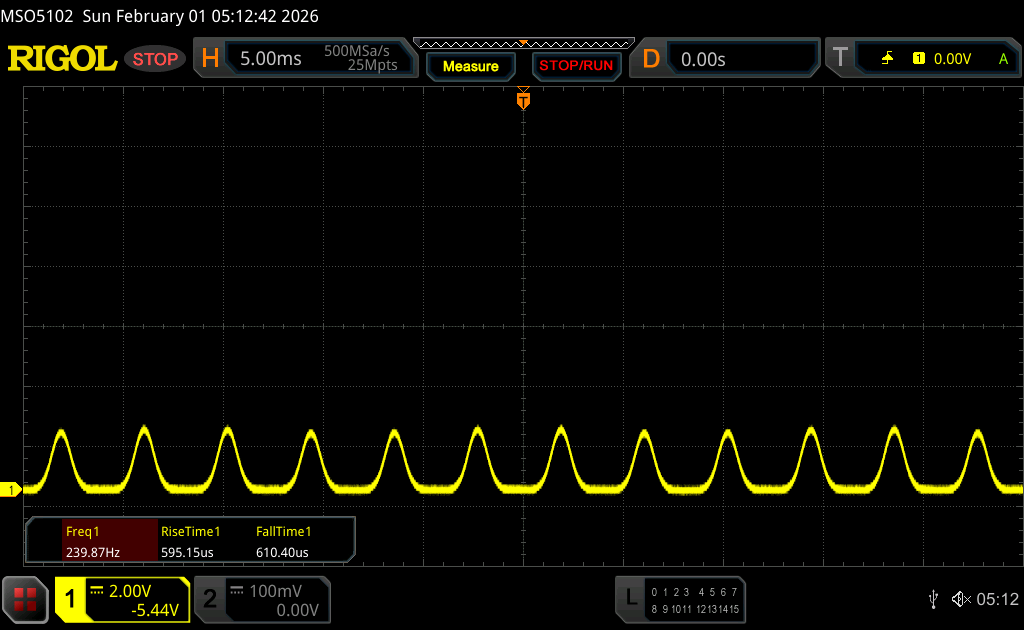
| ↔ Response Time 50% Grey to 80% Grey | ||
| 1.73 ms ... rise ↗ and fall ↘ combined | ↗ 0.91 ms rise | 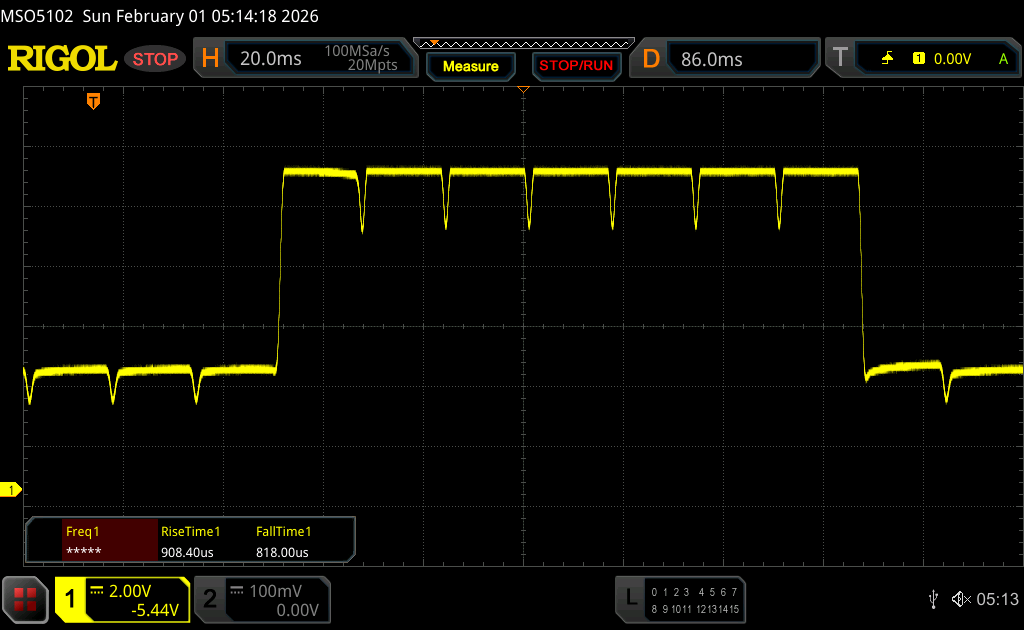 |
| ↘ 0.82 ms fall | ||
| The screen shows very fast response rates in our tests and should be very well suited for fast-paced gaming. In comparison, all tested devices range from 0.165 (minimum) to 636 (maximum) ms. » 9 % of all devices are better. This means that the measured response time is better than the average of all tested devices (31 ms). | ||
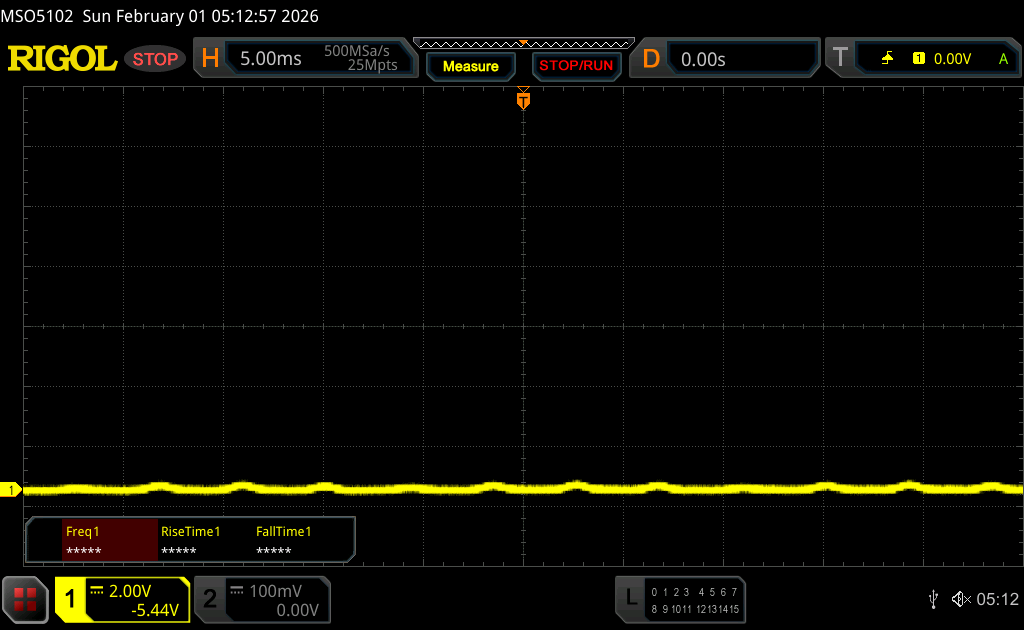
Screen Flickering / PWM (Pulse-Width Modulation)
| Screen flickering / PWM detected | 240 Hz Amplitude: 50 % | ≤ 50 % brightness setting | 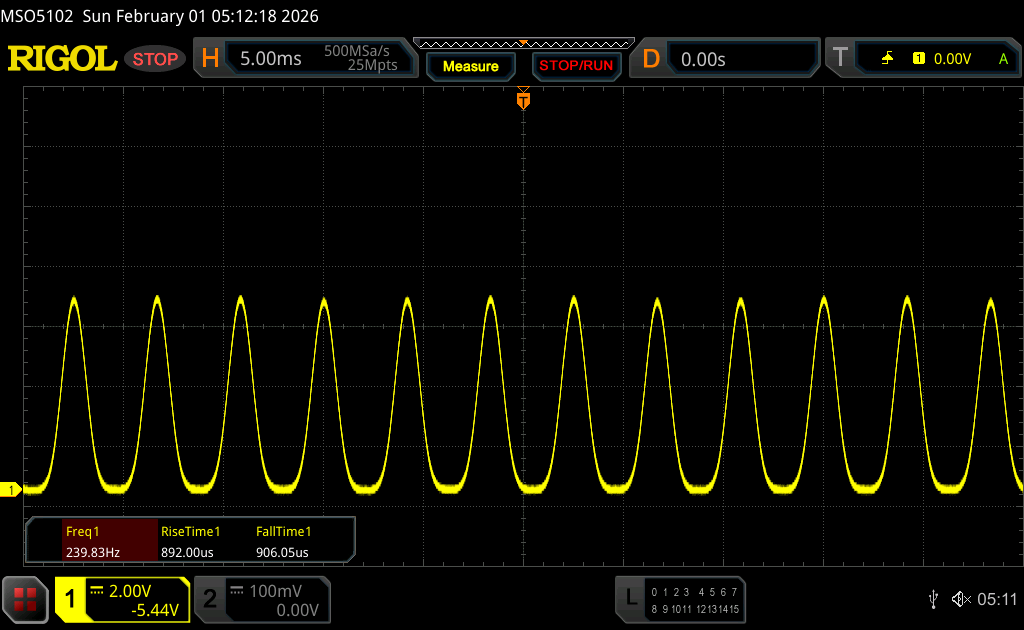 |
The display backlight flickers at 240 Hz (worst case, e.g., utilizing PWM) Flickering detected at a brightness setting of 50 % and below. There should be no flickering or PWM above this brightness setting. The frequency of 240 Hz is relatively low, so sensitive users will likely notice flickering and experience eyestrain at the stated brightness setting and below. In comparison: 52 % of all tested devices do not use PWM to dim the display. If PWM was detected, an average of 7763 (minimum: 5 - maximum: 343500) Hz was measured. | |||


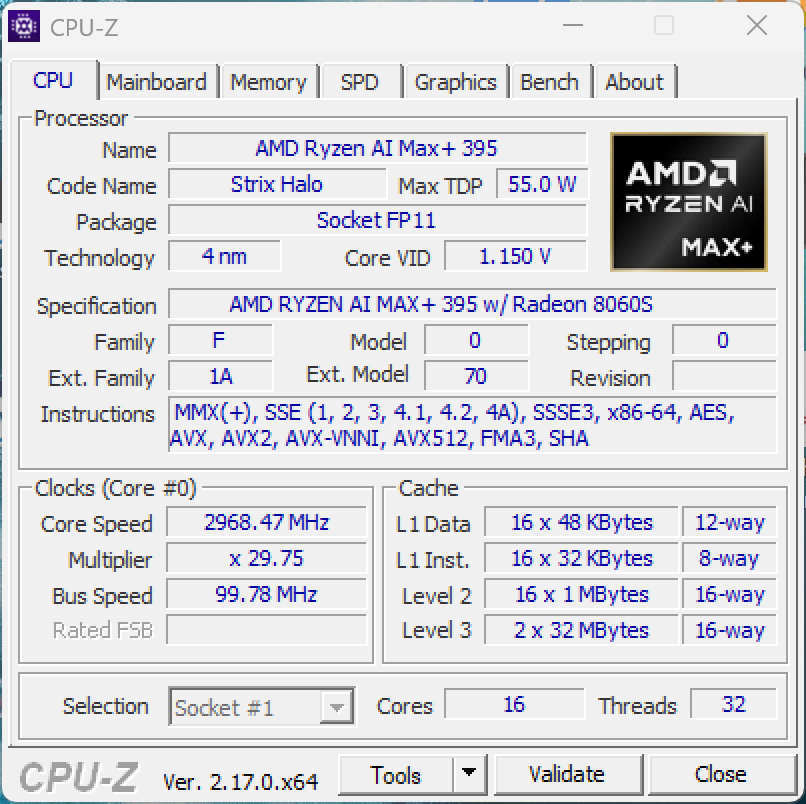
Performance - AMD Strix Halo
Testing Conditions
Asus offers the familiar power modes, which can be quickly changed via key combination (Fn+F). We used the Performance mode for our testing.
| Energy profile | TDP | CB2024 Multi | Time Spy Graphics | Cyberpunk 2077 1080p Ultra |
max. fan noise |
|---|---|---|---|---|---|
| Silent | 50/40W | 1063 points | 6811 points | 54 fps | 40.3 dB(A) |
| Standard | 65/55W | 1518 points | 9334 points | 71.9 fps | 47.2 dB(A) |
| Performance | 85/70W | 1672 points | 10434 points | 79.5 fps | 53.4 dB(A) |
| Battery (Standard) | 60/55W | 1405 points | 9231 points | 67.5 fps | 47.2 dB(A) |
Processor
The Ryzen AI Max+ 395 offers 16 full-fledged Zen 5 cores and therefore offers a considerable increase in multi-core CPU performance (30-50 % depending on the benchmark) over the previous model with the Ryzen AI 9 HX 370. It is also much faster compared to the new Lunar Lake Core Ultra X7 358H in multi-core tests, but falls behind in single-core scenarios.
Cinebench R15 Multi Loop
Cinebench 2024: CPU Multi Core | CPU Single Core
Cinebench R23: Multi Core | Single Core
Cinebench R20: CPU (Multi Core) | CPU (Single Core)
Cinebench R15: CPU Multi 64Bit | CPU Single 64Bit
Blender: v2.79 BMW27 CPU
7-Zip 18.03: 7z b 4 | 7z b 4 -mmt1
Geekbench 6.7: Multi-Core | Single-Core
Geekbench 5.5: Multi-Core | Single-Core
HWBOT x265 Benchmark v2.2: 4k Preset
LibreOffice : 20 Documents To PDF
R Benchmark 2.5: Overall mean
| CPU Performance rating | |
| Apple MacBook Pro 14 2024 M4 Pro -11! | |
| Average AMD Ryzen AI Max+ 395 | |
| Asus ProArt PX13 HN7306EA | |
| Asus ROG Flow Z13 GZ302EA-RU073W | |
| Asus ZenBook Duo UX8407AA | |
| Asus ProArt PX13 HN7306 | |
| Dell XPS 14 Core Ultra X7 358H | |
| Average of class Convertible | |
| Cinebench 2024 / CPU Multi Core | |
| Average AMD Ryzen AI Max+ 395 (1648 - 1912, n=9) | |
| Asus ProArt PX13 HN7306EA | |
| Apple MacBook Pro 14 2024 M4 Pro | |
| Asus ROG Flow Z13 GZ302EA-RU073W | |
| Asus ZenBook Duo UX8407AA | |
| Asus ProArt PX13 HN7306 | |
| Dell XPS 14 Core Ultra X7 358H | |
| Average of class Convertible (271 - 1673, n=49, last 2 years) | |
| Cinebench 2024 / CPU Single Core | |
| Apple MacBook Pro 14 2024 M4 Pro | |
| Asus ZenBook Duo UX8407AA | |
| Dell XPS 14 Core Ultra X7 358H | |
| Asus ROG Flow Z13 GZ302EA-RU073W | |
| Asus ProArt PX13 HN7306EA | |
| Asus ProArt PX13 HN7306 | |
| Average AMD Ryzen AI Max+ 395 (114 - 116.8, n=9) | |
| Average of class Convertible (88 - 129.8, n=43, last 2 years) | |
| Cinebench R23 / Multi Core | |
| Average AMD Ryzen AI Max+ 395 (29063 - 37423, n=9) | |
| Asus ProArt PX13 HN7306EA | |
| Asus ROG Flow Z13 GZ302EA-RU073W | |
| Apple MacBook Pro 14 2024 M4 Pro | |
| Asus ProArt PX13 HN7306 | |
| Asus ZenBook Duo UX8407AA | |
| Dell XPS 14 Core Ultra X7 358H | |
| Average of class Convertible (1317 - 30959, n=51, last 2 years) | |
| Cinebench R23 / Single Core | |
| Apple MacBook Pro 14 2024 M4 Pro | |
| Asus ZenBook Duo UX8407AA | |
| Dell XPS 14 Core Ultra X7 358H | |
| Asus ProArt PX13 HN7306EA | |
| Average AMD Ryzen AI Max+ 395 (2027 - 2052, n=9) | |
| Asus ProArt PX13 HN7306 | |
| Asus ROG Flow Z13 GZ302EA-RU073W | |
| Average of class Convertible (740 - 2188, n=51, last 2 years) | |
| Cinebench R20 / CPU (Multi Core) | |
| Average AMD Ryzen AI Max+ 395 (11357 - 14641, n=9) | |
| Asus ProArt PX13 HN7306EA | |
| Asus ROG Flow Z13 GZ302EA-RU073W | |
| Asus ProArt PX13 HN7306 | |
| Asus ZenBook Duo UX8407AA | |
| Dell XPS 14 Core Ultra X7 358H | |
| Average of class Convertible (595 - 12102, n=51, last 2 years) | |
| Cinebench R20 / CPU (Single Core) | |
| Asus ZenBook Duo UX8407AA | |
| Asus ProArt PX13 HN7306 | |
| Asus ProArt PX13 HN7306EA | |
| Average AMD Ryzen AI Max+ 395 (791 - 803, n=9) | |
| Dell XPS 14 Core Ultra X7 358H | |
| Asus ROG Flow Z13 GZ302EA-RU073W | |
| Average of class Convertible (273 - 834, n=51, last 2 years) | |
| Cinebench R15 / CPU Multi 64Bit | |
| Average AMD Ryzen AI Max+ 395 (4739 - 5881, n=9) | |
| Asus ProArt PX13 HN7306EA | |
| Asus ROG Flow Z13 GZ302EA-RU073W | |
| Asus ProArt PX13 HN7306 | |
| Asus ZenBook Duo UX8407AA | |
| Dell XPS 14 Core Ultra X7 358H | |
| Apple MacBook Pro 14 2024 M4 Pro | |
| Average of class Convertible (478 - 4940, n=50, last 2 years) | |
| Cinebench R15 / CPU Single 64Bit | |
| Asus ROG Flow Z13 GZ302EA-RU073W | |
| Average AMD Ryzen AI Max+ 395 (313 - 318, n=9) | |
| Asus ProArt PX13 HN7306EA | |
| Dell XPS 14 Core Ultra X7 358H | |
| Asus ProArt PX13 HN7306 | |
| Asus ZenBook Duo UX8407AA | |
| Average of class Convertible (149.8 - 317, n=50, last 2 years) | |
| Blender / v2.79 BMW27 CPU | |
| Average of class Convertible (105 - 1051, n=50, last 2 years) | |
| Dell XPS 14 Core Ultra X7 358H | |
| Asus ZenBook Duo UX8407AA | |
| Asus ProArt PX13 HN7306 | |
| Asus ROG Flow Z13 GZ302EA-RU073W | |
| Asus ProArt PX13 HN7306EA | |
| Average AMD Ryzen AI Max+ 395 (86 - 107, n=7) | |
| 7-Zip 18.03 / 7z b 4 | |
| Average AMD Ryzen AI Max+ 395 (116237 - 136872, n=7) | |
| Asus ROG Flow Z13 GZ302EA-RU073W | |
| Asus ProArt PX13 HN7306EA | |
| Asus ProArt PX13 HN7306 | |
| Asus ZenBook Duo UX8407AA | |
| Dell XPS 14 Core Ultra X7 358H | |
| Average of class Convertible (12977 - 121368, n=50, last 2 years) | |
| 7-Zip 18.03 / 7z b 4 -mmt1 | |
| Asus ZenBook Duo UX8407AA | |
| Asus ROG Flow Z13 GZ302EA-RU073W | |
| Dell XPS 14 Core Ultra X7 358H | |
| Average AMD Ryzen AI Max+ 395 (6474 - 6540, n=7) | |
| Asus ProArt PX13 HN7306EA | |
| Asus ProArt PX13 HN7306 | |
| Average of class Convertible (3672 - 6655, n=50, last 2 years) | |
| Geekbench 6.7 / Multi-Core | |
| Apple MacBook Pro 14 2024 M4 Pro | |
| Asus ROG Flow Z13 GZ302EA-RU073W | |
| Asus ProArt PX13 HN7306EA | |
| Average AMD Ryzen AI Max+ 395 (16510 - 22157, n=7) | |
| Asus ZenBook Duo UX8407AA | |
| Dell XPS 14 Core Ultra X7 358H | |
| Asus ProArt PX13 HN7306 | |
| Average of class Convertible (2291 - 21269, n=52, last 2 years) | |
| Geekbench 6.7 / Single-Core | |
| Apple MacBook Pro 14 2024 M4 Pro | |
| Asus ZenBook Duo UX8407AA | |
| Asus ROG Flow Z13 GZ302EA-RU073W | |
| Asus ProArt PX13 HN7306EA | |
| Dell XPS 14 Core Ultra X7 358H | |
| Average AMD Ryzen AI Max+ 395 (2791 - 2978, n=7) | |
| Asus ProArt PX13 HN7306 | |
| Average of class Convertible (1003 - 3020, n=53, last 2 years) | |
| Geekbench 5.5 / Multi-Core | |
| Asus ROG Flow Z13 GZ302EA-RU073W | |
| Asus ProArt PX13 HN7306EA | |
| Average AMD Ryzen AI Max+ 395 (16535 - 24593, n=7) | |
| Asus ZenBook Duo UX8407AA | |
| Dell XPS 14 Core Ultra X7 358H | |
| Asus ProArt PX13 HN7306 | |
| Average of class Convertible (1608 - 22023, n=50, last 2 years) | |
| Geekbench 5.5 / Single-Core | |
| Asus ROG Flow Z13 GZ302EA-RU073W | |
| Asus ProArt PX13 HN7306EA | |
| Average AMD Ryzen AI Max+ 395 (2184 - 2275, n=7) | |
| Asus ZenBook Duo UX8407AA | |
| Dell XPS 14 Core Ultra X7 358H | |
| Asus ProArt PX13 HN7306 | |
| Average of class Convertible (806 - 2275, n=50, last 2 years) | |
| HWBOT x265 Benchmark v2.2 / 4k Preset | |
| Asus ROG Flow Z13 GZ302EA-RU073W | |
| Asus ProArt PX13 HN7306EA | |
| Average AMD Ryzen AI Max+ 395 (31.8 - 40.3, n=7) | |
| Asus ProArt PX13 HN7306 | |
| Asus ZenBook Duo UX8407AA | |
| Dell XPS 14 Core Ultra X7 358H | |
| Average of class Convertible (3.43 - 36.2, n=50, last 2 years) | |
| LibreOffice / 20 Documents To PDF | |
| Asus ProArt PX13 HN7306 | |
| Average of class Convertible (42.5 - 84.3, n=50, last 2 years) | |
| Average AMD Ryzen AI Max+ 395 (45.8 - 58.4, n=7) | |
| Asus ProArt PX13 HN7306EA | |
| Dell XPS 14 Core Ultra X7 358H | |
| Asus ROG Flow Z13 GZ302EA-RU073W | |
| Asus ZenBook Duo UX8407AA | |
| R Benchmark 2.5 / Overall mean | |
| Average of class Convertible (0.3915 - 0.84, n=50, last 2 years) | |
| Dell XPS 14 Core Ultra X7 358H | |
| Asus ProArt PX13 HN7306 | |
| Asus ZenBook Duo UX8407AA | |
| Average AMD Ryzen AI Max+ 395 (0.3915 - 0.4094, n=7) | |
| Asus ROG Flow Z13 GZ302EA-RU073W | |
| Asus ProArt PX13 HN7306EA | |
* ... smaller is better
AIDA64: FP32 Ray-Trace | FPU Julia | CPU SHA3 | CPU Queen | FPU SinJulia | FPU Mandel | CPU AES | CPU ZLib | FP64 Ray-Trace | CPU PhotoWorxx | CPU CheckMate
| Performance rating | |
| Average AMD Ryzen AI Max+ 395 | |
| Asus ProArt PX13 HN7306EA -1! | |
| Asus ROG Flow Z13 GZ302EA-RU073W -1! | |
| Asus ProArt PX13 HN7306 -1! | |
| Dell XPS 14 Core Ultra X7 358H | |
| Average of class Convertible | |
| Asus ZenBook Duo UX8407AA -1! | |
| AIDA64 / FP32 Ray-Trace | |
| Average AMD Ryzen AI Max+ 395 (62222 - 82725, n=8) | |
| Asus ROG Flow Z13 GZ302EA-RU073W (v6.92.6600) | |
| Asus ProArt PX13 HN7306EA (v6.92.6600) | |
| Asus ProArt PX13 HN7306 (v6.92.6600) | |
| Dell XPS 14 Core Ultra X7 358H (v8.20.8100) | |
| Average of class Convertible (1480 - 64158, n=50, last 2 years) | |
| Asus ZenBook Duo UX8407AA (v6.92.6600) | |
| AIDA64 / FPU Julia | |
| Average AMD Ryzen AI Max+ 395 (183760 - 363782, n=8) | |
| Asus ProArt PX13 HN7306EA (v6.92.6600) | |
| Asus ROG Flow Z13 GZ302EA-RU073W (v6.92.6600) | |
| Asus ProArt PX13 HN7306 (v6.92.6600) | |
| Dell XPS 14 Core Ultra X7 358H (v8.20.8100) | |
| Average of class Convertible (11392 - 184800, n=50, last 2 years) | |
| Asus ZenBook Duo UX8407AA (v6.92.6600) | |
| AIDA64 / CPU SHA3 | |
| Average AMD Ryzen AI Max+ 395 (8151 - 9475, n=8) | |
| Asus ProArt PX13 HN7306EA (v6.92.6600) | |
| Asus ROG Flow Z13 GZ302EA-RU073W (v6.92.6600) | |
| Asus ProArt PX13 HN7306 (v6.92.6600) | |
| Asus ZenBook Duo UX8407AA (v6.92.6600) | |
| Dell XPS 14 Core Ultra X7 358H (v8.20.8100) | |
| Average of class Convertible (797 - 8291, n=50, last 2 years) | |
| AIDA64 / CPU Queen | |
| Average AMD Ryzen AI Max+ 395 (145339 - 154404, n=7) | |
| Asus ProArt PX13 HN7306EA (v6.92.6600) | |
| Asus ROG Flow Z13 GZ302EA-RU073W (v6.92.6600) | |
| Asus ProArt PX13 HN7306 (v6.92.6600) | |
| Asus ZenBook Duo UX8407AA (v6.92.6600) | |
| Dell XPS 14 Core Ultra X7 358H (v6.92.6600) | |
| Average of class Convertible (14686 - 148874, n=41, last 2 years) | |
| AIDA64 / FPU SinJulia | |
| Average AMD Ryzen AI Max+ 395 (29096 - 31931, n=8) | |
| Asus ROG Flow Z13 GZ302EA-RU073W (v6.92.6600) | |
| Asus ProArt PX13 HN7306EA (v6.92.6600) | |
| Asus ProArt PX13 HN7306 (v6.92.6600) | |
| Average of class Convertible (1120 - 29155, n=50, last 2 years) | |
| Dell XPS 14 Core Ultra X7 358H (v8.20.8100) | |
| Asus ZenBook Duo UX8407AA (v6.92.6600) | |
| AIDA64 / FPU Mandel | |
| Average AMD Ryzen AI Max+ 395 (96454 - 192994, n=8) | |
| Asus ROG Flow Z13 GZ302EA-RU073W (v6.92.6600) | |
| Asus ProArt PX13 HN7306EA (v6.92.6600) | |
| Asus ProArt PX13 HN7306 (v6.92.6600) | |
| Dell XPS 14 Core Ultra X7 358H (v8.20.8100) | |
| Average of class Convertible (4929 - 97193, n=50, last 2 years) | |
| Asus ZenBook Duo UX8407AA (v6.92.6600) | |
| AIDA64 / CPU AES | |
| Asus ProArt PX13 HN7306EA (v6.92.6600) | |
| Average AMD Ryzen AI Max+ 395 (133256 - 190280, n=7) | |
| Asus ROG Flow Z13 GZ302EA-RU073W (v6.92.6600) | |
| Asus ProArt PX13 HN7306 (v6.92.6600) | |
| Dell XPS 14 Core Ultra X7 358H (v8.20.8100) | |
| Average of class Convertible (5271 - 190280, n=50, last 2 years) | |
| Asus ZenBook Duo UX8407AA (v6.92.6600) | |
| AIDA64 / CPU ZLib | |
| Asus ProArt PX13 HN7306EA (v6.92.6600) | |
| Asus ROG Flow Z13 GZ302EA-RU073W (v6.92.6600) | |
| Average AMD Ryzen AI Max+ 395 (2017 - 2431, n=8) | |
| Asus ProArt PX13 HN7306 (v6.92.6600) | |
| Asus ZenBook Duo UX8407AA (v6.92.6600) | |
| Dell XPS 14 Core Ultra X7 358H (v8.20.8100) | |
| Average of class Convertible (218 - 2017, n=50, last 2 years) | |
| AIDA64 / FP64 Ray-Trace | |
| Average AMD Ryzen AI Max+ 395 (34220 - 43587, n=8) | |
| Asus ROG Flow Z13 GZ302EA-RU073W (v6.92.6600) | |
| Asus ProArt PX13 HN7306EA (v6.92.6600) | |
| Asus ProArt PX13 HN7306 (v6.92.6600) | |
| Dell XPS 14 Core Ultra X7 358H (v8.20.8100) | |
| Average of class Convertible (1169 - 34297, n=50, last 2 years) | |
| Asus ZenBook Duo UX8407AA (v6.92.6600) | |
| AIDA64 / CPU PhotoWorxx | |
| Average AMD Ryzen AI Max+ 395 (81626 - 96843, n=8) | |
| Dell XPS 14 Core Ultra X7 358H (v8.20.8100) | |
| Asus ProArt PX13 HN7306EA (v6.92.6600) | |
| Asus ROG Flow Z13 GZ302EA-RU073W (v6.92.6600) | |
| Asus ProArt PX13 HN7306 (v6.92.6600) | |
| Average of class Convertible (14193 - 85327, n=50, last 2 years) | |
| Asus ZenBook Duo UX8407AA (v6.92.6600) | |
| AIDA64 / CPU CheckMate | |
| Average AMD Ryzen AI Max+ 395 (n=1) | |
| Dell XPS 14 Core Ultra X7 358H (v8.20.8100) | |
| Average of class Convertible (1413 - 6105, n=9, last 2 years) | |
System Performance
The subjective performance impression is excellent and all inputs are executed without any noticeable delays. We did not experience any stability issues during our review period, either.
PCMark 10: Score | Essentials | Productivity | Digital Content Creation
CrossMark: Overall | Productivity | Creativity | Responsiveness
WebXPRT 3: Overall
WebXPRT 4: Overall
Mozilla Kraken 1.1: Total
| Performance rating | |
| Apple MacBook Pro 14 2024 M4 Pro -4! | |
| Asus ZenBook Duo UX8407AA | |
| Asus ROG Flow Z13 GZ302EA-RU073W | |
| Asus ProArt PX13 HN7306EA | |
| Dell XPS 14 Core Ultra X7 358H | |
| Average AMD Ryzen AI Max+ 395, AMD Radeon 8060S | |
| Asus ProArt PX13 HN7306 | |
| Average of class Convertible | |
| PCMark 10 / Score | |
| Asus ZenBook Duo UX8407AA | |
| Asus ProArt PX13 HN7306EA | |
| Dell XPS 14 Core Ultra X7 358H | |
| Asus ROG Flow Z13 GZ302EA-RU073W | |
| Average AMD Ryzen AI Max+ 395, AMD Radeon 8060S (8732 - 10111, n=7) | |
| Asus ProArt PX13 HN7306 | |
| Average of class Convertible (3229 - 10123, n=47, last 2 years) | |
| PCMark 10 / Essentials | |
| Asus ROG Flow Z13 GZ302EA-RU073W | |
| Average AMD Ryzen AI Max+ 395, AMD Radeon 8060S (10949 - 12005, n=7) | |
| Dell XPS 14 Core Ultra X7 358H | |
| Asus ProArt PX13 HN7306EA | |
| Asus ZenBook Duo UX8407AA | |
| Average of class Convertible (7233 - 12222, n=47, last 2 years) | |
| Asus ProArt PX13 HN7306 | |
| PCMark 10 / Productivity | |
| Asus ZenBook Duo UX8407AA | |
| Dell XPS 14 Core Ultra X7 358H | |
| Asus ProArt PX13 HN7306EA | |
| Average AMD Ryzen AI Max+ 395, AMD Radeon 8060S (9762 - 16652, n=7) | |
| Asus ROG Flow Z13 GZ302EA-RU073W | |
| Asus ProArt PX13 HN7306 | |
| Average of class Convertible (5062 - 17914, n=47, last 2 years) | |
| PCMark 10 / Digital Content Creation | |
| Asus ROG Flow Z13 GZ302EA-RU073W | |
| Average AMD Ryzen AI Max+ 395, AMD Radeon 8060S (15152 - 16981, n=7) | |
| Asus ProArt PX13 HN7306EA | |
| Asus ZenBook Duo UX8407AA | |
| Dell XPS 14 Core Ultra X7 358H | |
| Asus ProArt PX13 HN7306 | |
| Average of class Convertible (2496 - 16551, n=47, last 2 years) | |
| CrossMark / Overall | |
| Asus ROG Flow Z13 GZ302EA-RU073W | |
| Apple MacBook Pro 14 2024 M4 Pro | |
| Asus ProArt PX13 HN7306EA | |
| Asus ZenBook Duo UX8407AA | |
| Average AMD Ryzen AI Max+ 395, AMD Radeon 8060S (1948 - 2274, n=7) | |
| Dell XPS 14 Core Ultra X7 358H | |
| Asus ProArt PX13 HN7306 | |
| Average of class Convertible (524 - 2274, n=51, last 2 years) | |
| CrossMark / Productivity | |
| Apple MacBook Pro 14 2024 M4 Pro | |
| Average AMD Ryzen AI Max+ 395, AMD Radeon 8060S (1701 - 2790, n=7) | |
| Asus ZenBook Duo UX8407AA | |
| Asus ROG Flow Z13 GZ302EA-RU073W | |
| Asus ProArt PX13 HN7306EA | |
| Dell XPS 14 Core Ultra X7 358H | |
| Asus ProArt PX13 HN7306 | |
| Average of class Convertible (554 - 1942, n=51, last 2 years) | |
| CrossMark / Creativity | |
| Asus ROG Flow Z13 GZ302EA-RU073W | |
| Asus ProArt PX13 HN7306EA | |
| Average AMD Ryzen AI Max+ 395, AMD Radeon 8060S (2331 - 2949, n=7) | |
| Asus ZenBook Duo UX8407AA | |
| Apple MacBook Pro 14 2024 M4 Pro | |
| Dell XPS 14 Core Ultra X7 358H | |
| Asus ProArt PX13 HN7306 | |
| Average of class Convertible (550 - 2949, n=51, last 2 years) | |
| CrossMark / Responsiveness | |
| Asus ROG Flow Z13 GZ302EA-RU073W | |
| Asus ZenBook Duo UX8407AA | |
| Average AMD Ryzen AI Max+ 395, AMD Radeon 8060S (1533 - 1719, n=7) | |
| Asus ProArt PX13 HN7306EA | |
| Dell XPS 14 Core Ultra X7 358H | |
| Apple MacBook Pro 14 2024 M4 Pro | |
| Average of class Convertible (381 - 1719, n=51, last 2 years) | |
| Asus ProArt PX13 HN7306 | |
| WebXPRT 3 / Overall | |
| Apple MacBook Pro 14 2024 M4 Pro | |
| Asus ROG Flow Z13 GZ302EA-RU073W | |
| Asus ZenBook Duo UX8407AA | |
| Dell XPS 14 Core Ultra X7 358H | |
| Asus ProArt PX13 HN7306EA | |
| Average AMD Ryzen AI Max+ 395, AMD Radeon 8060S (302 - 358, n=7) | |
| Average of class Convertible (171 - 426, n=51, last 2 years) | |
| Asus ProArt PX13 HN7306 | |
| WebXPRT 4 / Overall | |
| Apple MacBook Pro 14 2024 M4 Pro | |
| Asus ROG Flow Z13 GZ302EA-RU073W | |
| Asus ZenBook Duo UX8407AA | |
| Dell XPS 14 Core Ultra X7 358H | |
| Average AMD Ryzen AI Max+ 395, AMD Radeon 8060S (252 - 317, n=7) | |
| Asus ProArt PX13 HN7306EA | |
| Average of class Convertible (91.2 - 317, n=50, last 2 years) | |
| Asus ProArt PX13 HN7306 | |
| Mozilla Kraken 1.1 / Total | |
| Average of class Convertible (386 - 1089, n=54, last 2 years) | |
| Asus ProArt PX13 HN7306EA | |
| Asus ProArt PX13 HN7306 | |
| Dell XPS 14 Core Ultra X7 358H | |
| Average AMD Ryzen AI Max+ 395, AMD Radeon 8060S (424 - 470, n=7) | |
| Asus ZenBook Duo UX8407AA | |
| Asus ROG Flow Z13 GZ302EA-RU073W | |
| Apple MacBook Pro 14 2024 M4 Pro | |
* ... smaller is better
| PCMark 10 Score | 10111 points | |
Help | ||
| AIDA64 / Memory Copy | |
| Asus ProArt PX13 HN7306EA | |
| Asus ROG Flow Z13 GZ302EA-RU073W | |
| Average AMD Ryzen AI Max+ 395 (148904 - 163031, n=8) | |
| Dell XPS 14 Core Ultra X7 358H | |
| Asus ZenBook Duo UX8407AA | |
| Asus ProArt PX13 HN7306 | |
| Average of class Convertible (23880 - 161475, n=50, last 2 years) | |
| AIDA64 / Memory Read | |
| Asus ZenBook Duo UX8407AA | |
| Average AMD Ryzen AI Max+ 395 (121832 - 123769, n=8) | |
| Asus ROG Flow Z13 GZ302EA-RU073W | |
| Asus ProArt PX13 HN7306EA | |
| Dell XPS 14 Core Ultra X7 358H | |
| Asus ProArt PX13 HN7306 | |
| Average of class Convertible (19931 - 131960, n=50, last 2 years) | |
| AIDA64 / Memory Write | |
| Asus ROG Flow Z13 GZ302EA-RU073W | |
| Asus ProArt PX13 HN7306EA | |
| Average AMD Ryzen AI Max+ 395 (209523 - 216896, n=8) | |
| Asus ZenBook Duo UX8407AA | |
| Dell XPS 14 Core Ultra X7 358H | |
| Asus ProArt PX13 HN7306 | |
| Average of class Convertible (17473 - 216896, n=50, last 2 years) | |
| AIDA64 / Memory Latency | |
| Average AMD Ryzen AI Max+ 395 (131.9 - 140.5, n=8) | |
| Asus ProArt PX13 HN7306EA | |
| Asus ROG Flow Z13 GZ302EA-RU073W | |
| Average of class Convertible (6.9 - 536, n=49, last 2 years) | |
| Asus ProArt PX13 HN7306 | |
| Dell XPS 14 Core Ultra X7 358H | |
| Asus ZenBook Duo UX8407AA | |
* ... smaller is better
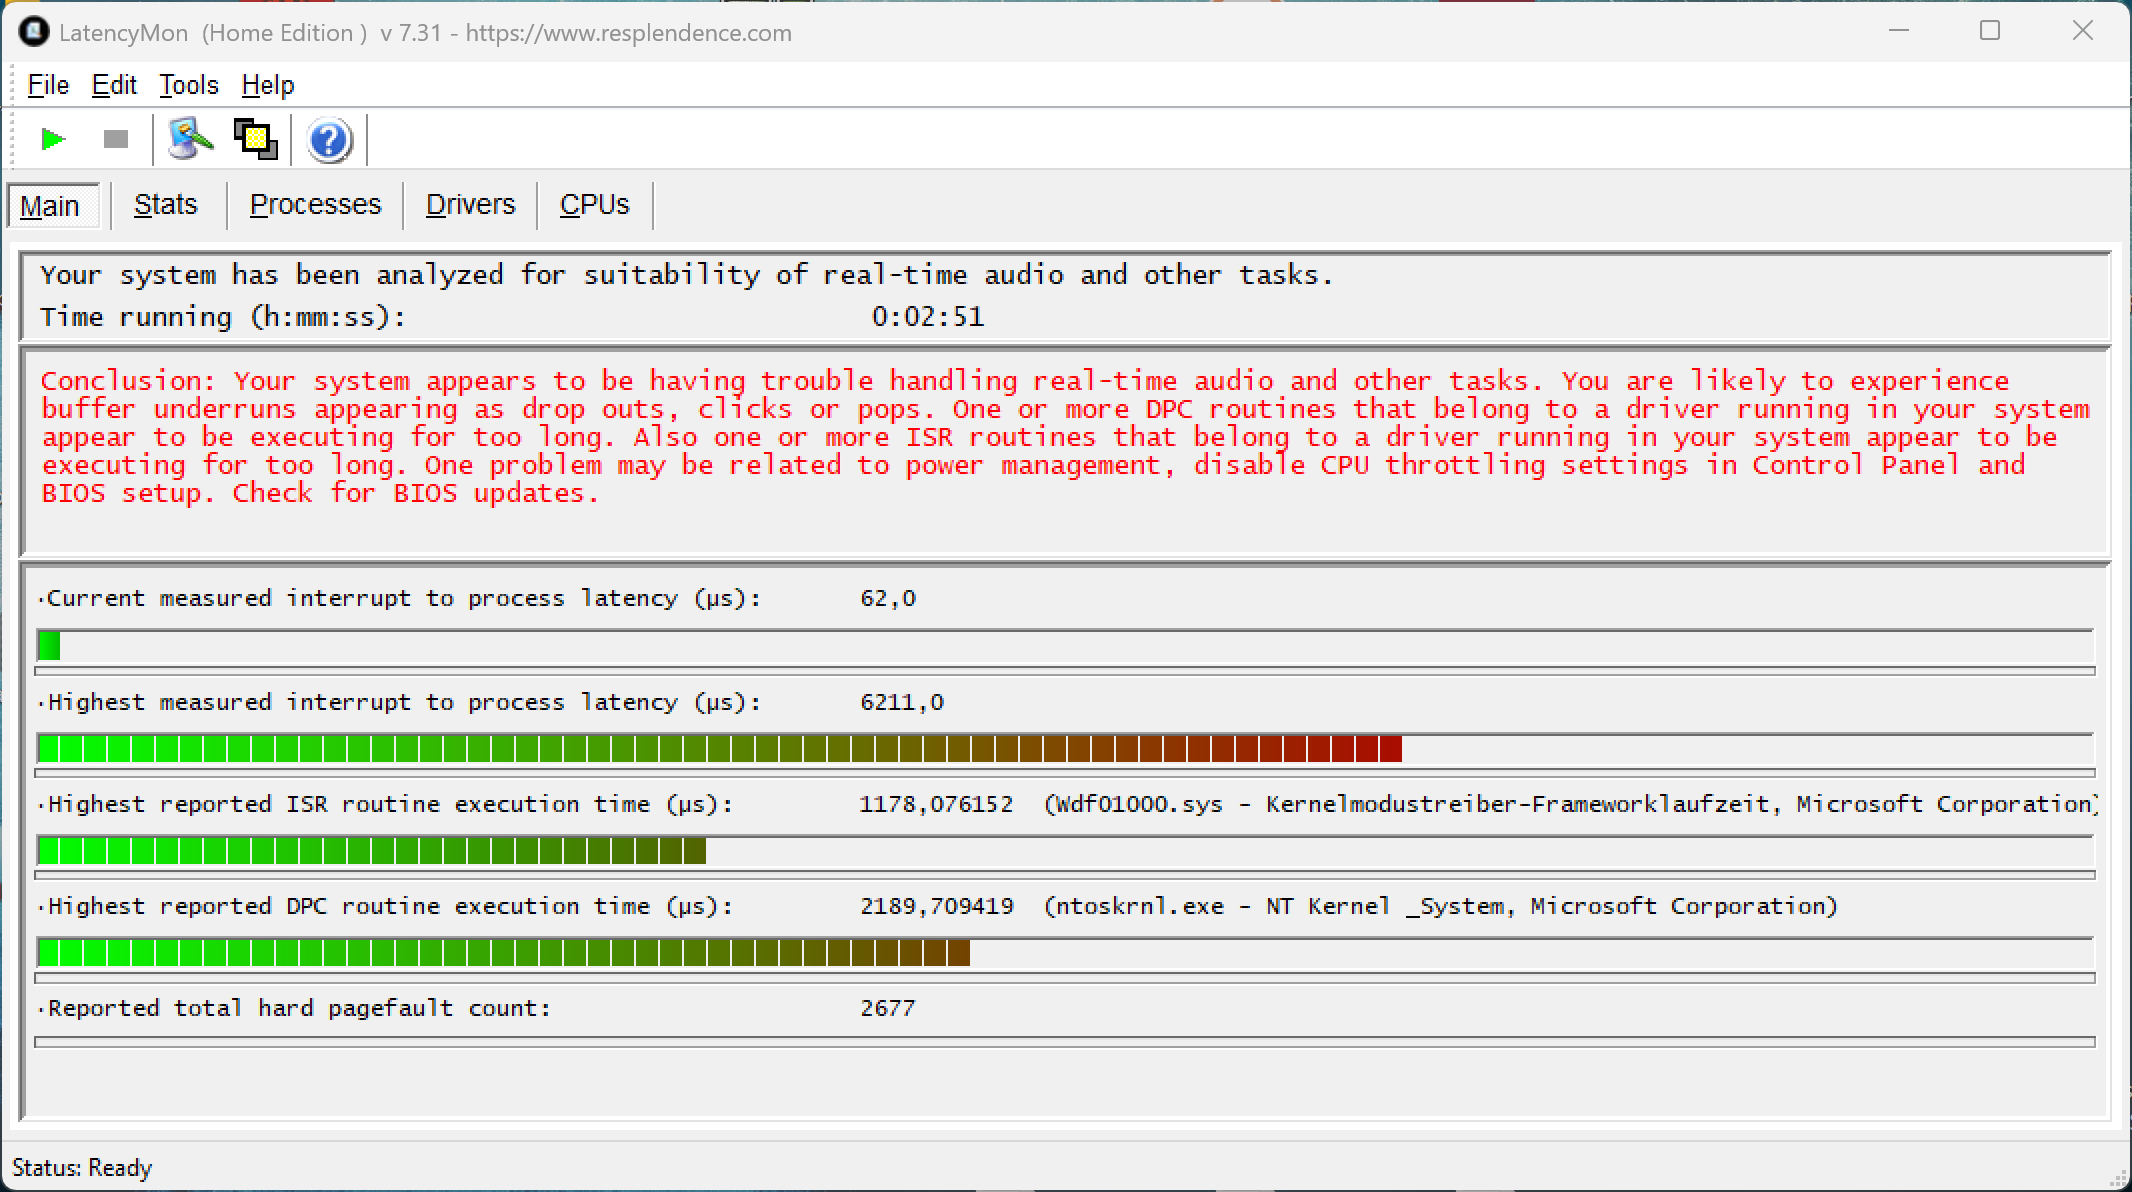
DPC Latency
Our standardized DPC latency test reveals some issues for the use of real-time audio software.
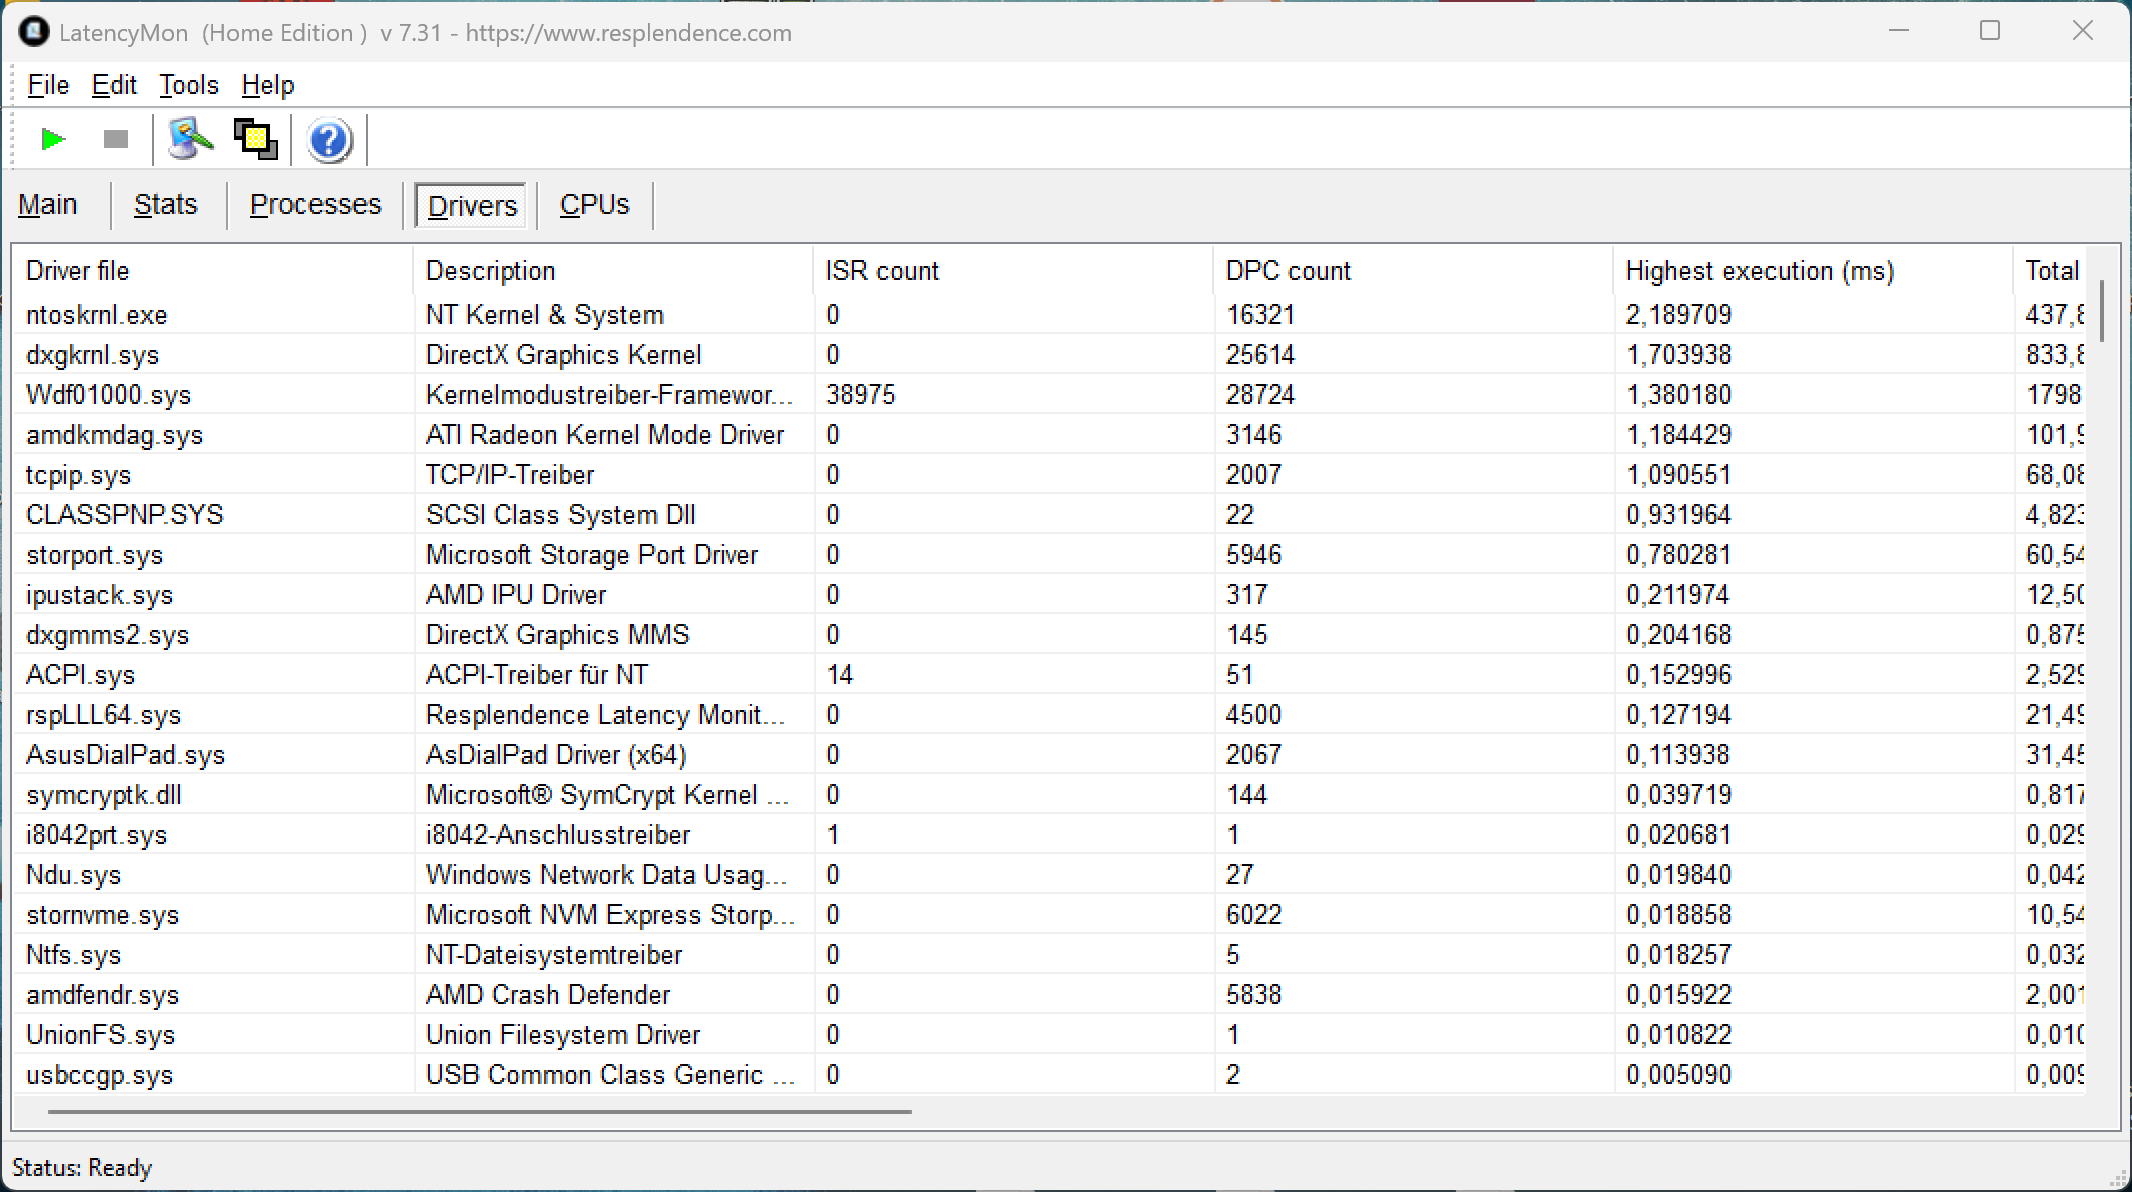
| DPC Latencies / LatencyMon - interrupt to process latency (max), Web, Youtube, Prime95 | |
| Asus ProArt PX13 HN7306EA | |
| Dell XPS 14 Core Ultra X7 358H | |
| Asus ZenBook Duo UX8407AA | |
| Asus ROG Flow Z13 GZ302EA-RU073W | |
* ... smaller is better
Storage Devices
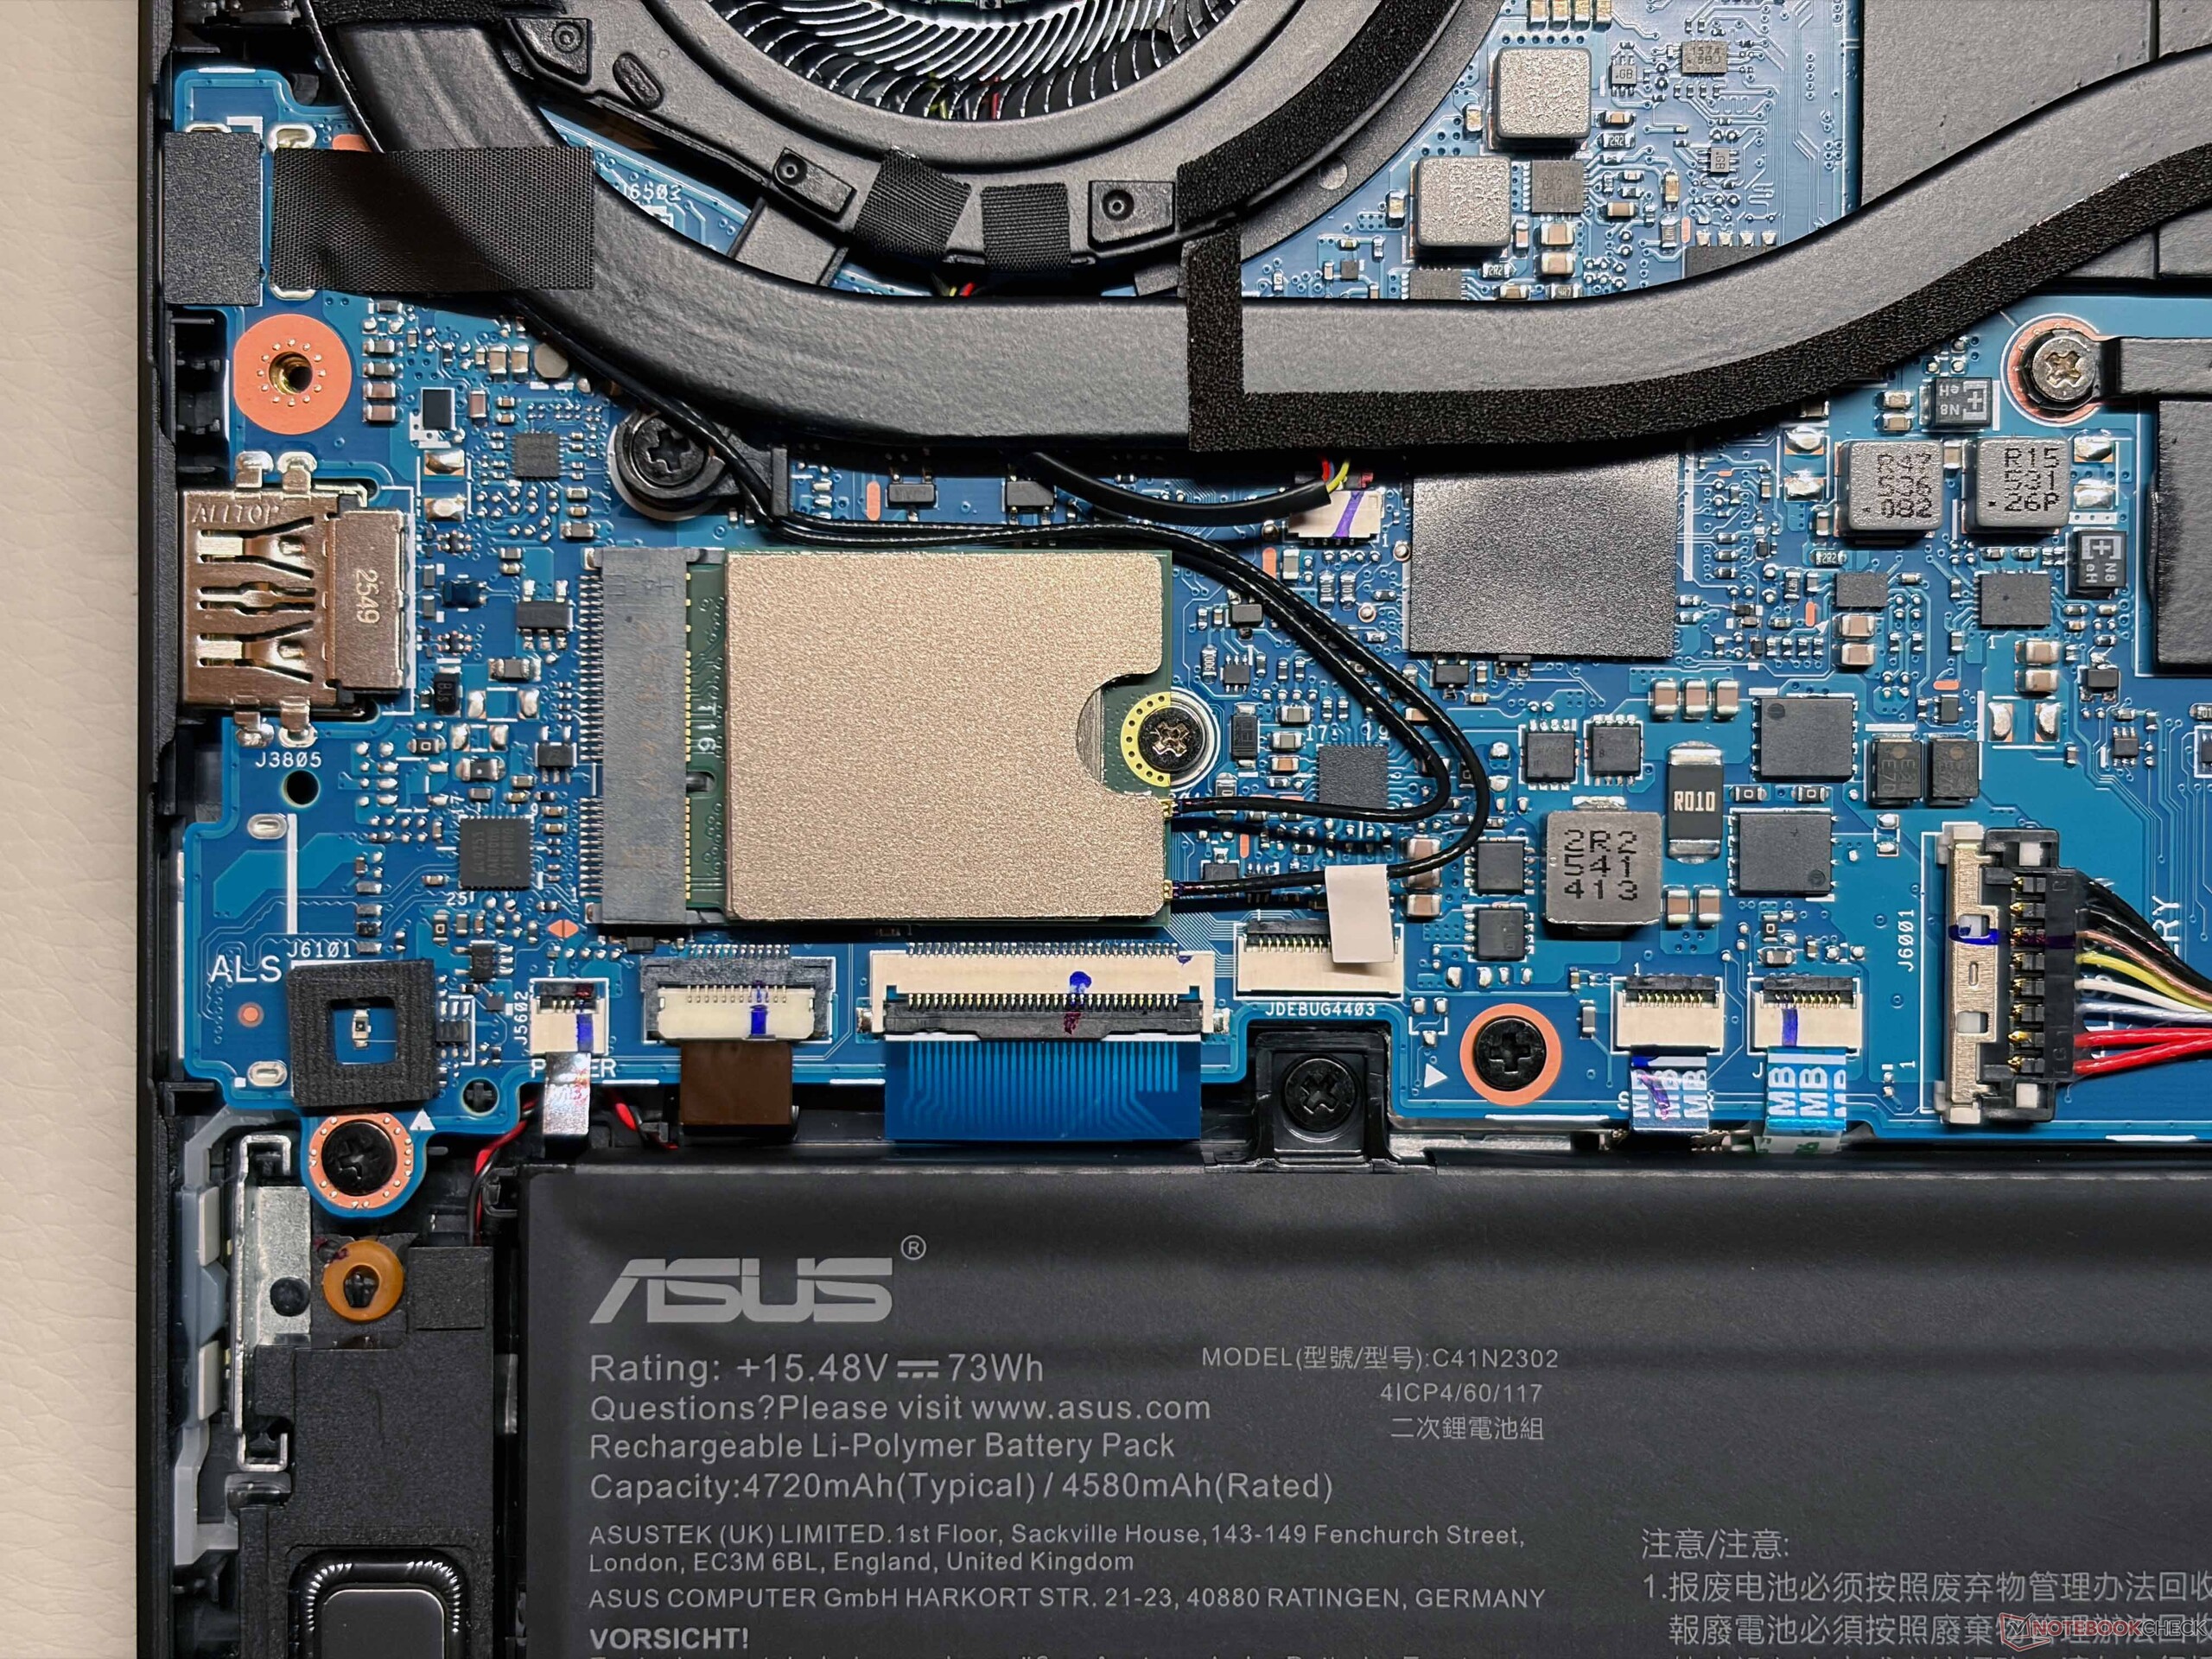
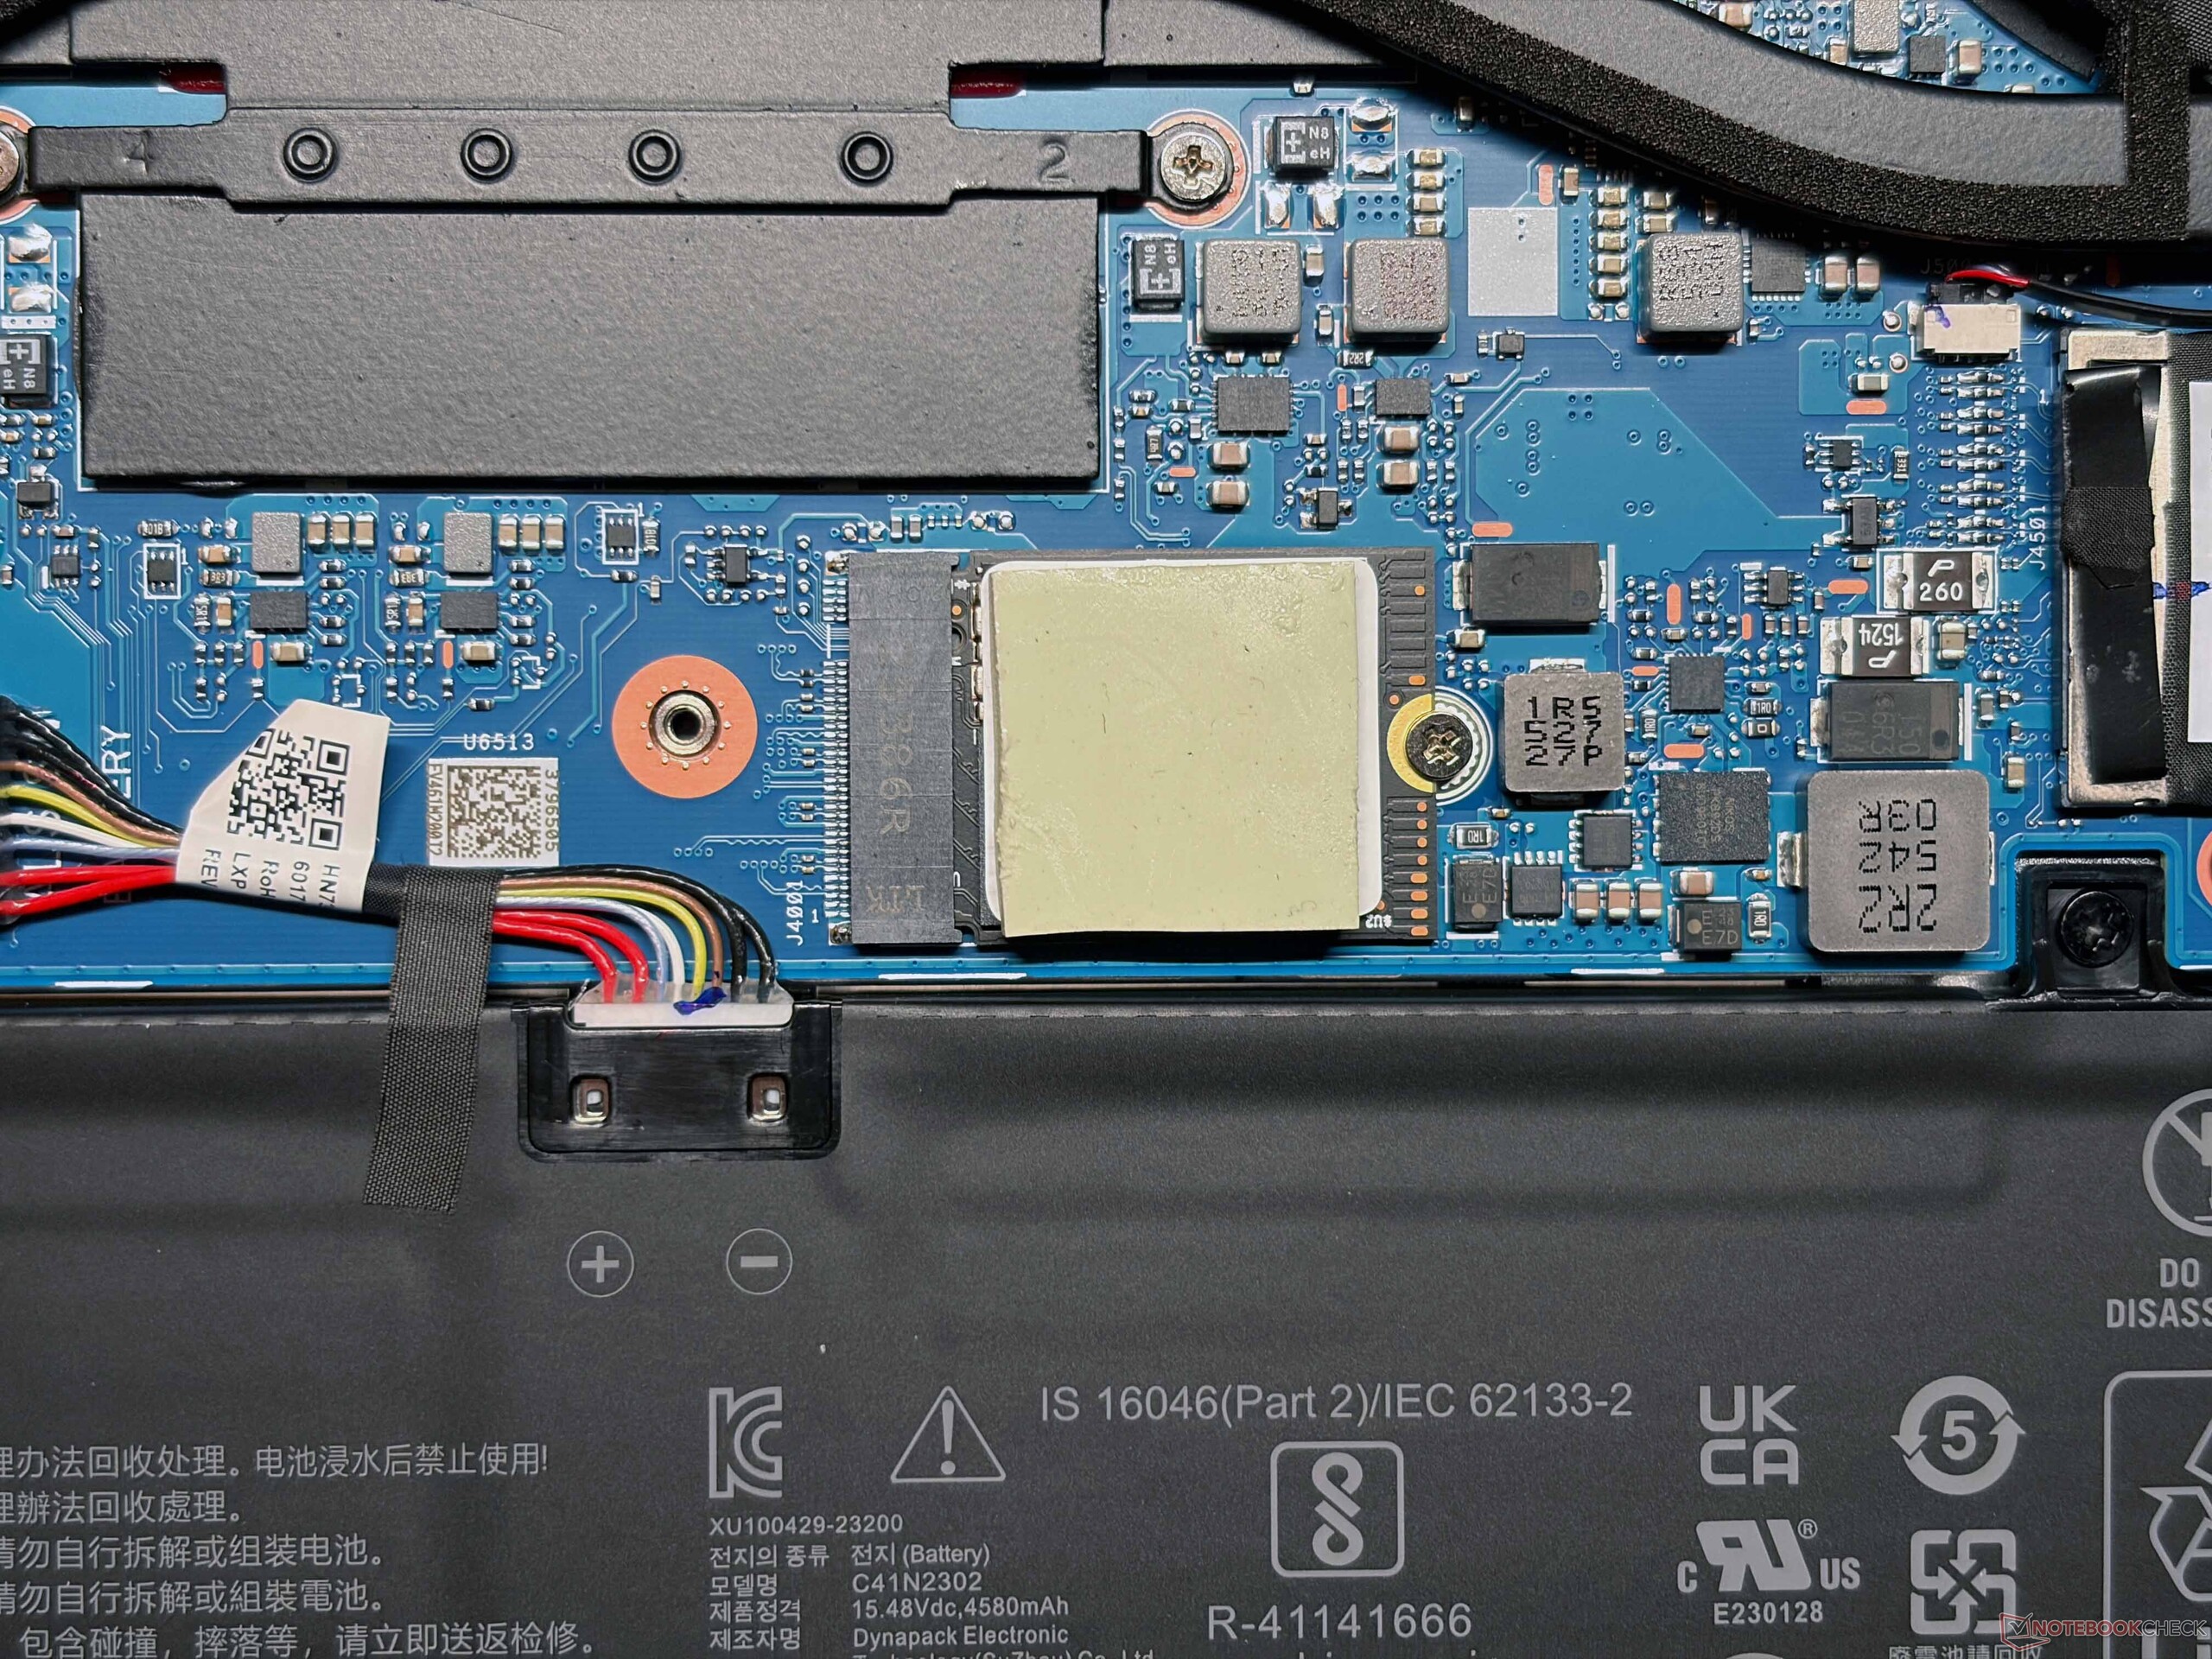
The PX13 is still limited a a single M.2-2230 SSD (PCIe 4.0). Our review unit is equipped with a 2 TB drive (1.7 TB free) from SanDisk and the performance with transfer rates of more than 6 GB/s is excellent. There is no performance drop under sustained workloads, either.

* ... smaller is better
Disk Throttling: DiskSpd Read Loop, Queue Depth 8
GPU Performance
The Radeon 8060s is the fastest iGPU on the market and also outperforms the new Panther Lake Arc B390 by a considerable margin. However, the more interesting comparison is the previous PX13 with the RTX 4070. Looking at the benchmarks, the Radeon 8060s is actually just marginally faster and both models are pretty much on par in our gaming tests as well.
The AMD still has the advantage of shared memory and while the system can automatically adjust the VRAM, you can also allocate a dedicated amount of RAM to the GPU (all the way up to 96 GB). This can be beneficial for image and video editing, where 8 GB VRAM of the RTX 4070 can become an issue.
| 3DMark 11 Performance | 31617 points | |
| 3DMark Fire Strike Score | 24438 points | |
| 3DMark Time Spy Score | 10469 points | |
| 3DMark Steel Nomad Score | 2019 points | |
| 3DMark Steel Nomad Light Score | 9866 points | |
Help | ||
| Blender / v3.3 Classroom OPTIX/RTX | |
| Asus ProArt PX13 HN7306 | |
| Blender / v3.3 Classroom CUDA | |
| Asus ProArt PX13 HN7306 | |
| Blender / v3.3 Classroom CPU | |
| Average of class Convertible (159 - 2067, n=51, last 2 years) | |
| Dell XPS 14 Core Ultra X7 358H | |
| Asus ZenBook Duo UX8407AA | |
| Asus ROG Flow Z13 GZ302EA-RU073W | |
| Asus ProArt PX13 HN7306EA | |
| Average AMD Radeon 8060S (132 - 163, n=9) | |
| Blender / v3.3 Classroom oneAPI/Intel | |
| Average of class Convertible (147 - 423, n=18, last 2 years) | |
| Dell XPS 14 Core Ultra X7 358H | |
* ... smaller is better
| GTA V - 1920x1080 Highest AA:4xMSAA + FX AF:16x | |
| Asus ProArt PX13 HN7306 | |
| Asus ProArt PX13 HN7306EA | |
| Asus ROG Flow Z13 GZ302EA-RU073W | |
| Asus ZenBook Duo UX8407AA | |
| Dell XPS 14 Core Ultra X7 358H | |
| Average of class Convertible (7.14 - 90.6, n=42, last 2 years) | |
| Final Fantasy XV Benchmark - 1920x1080 High Quality | |
| Asus ProArt PX13 HN7306 | |
| Asus ROG Flow Z13 GZ302EA-RU073W | |
| Asus ProArt PX13 HN7306EA | |
| Asus ZenBook Duo UX8407AA | |
| Dell XPS 14 Core Ultra X7 358H | |
| Average of class Convertible (4.48 - 86.6, n=47, last 2 years) | |
| Strange Brigade - 1920x1080 ultra AA:ultra AF:16 | |
| Asus ProArt PX13 HN7306 | |
| Asus ProArt PX13 HN7306EA | |
| Asus ROG Flow Z13 GZ302EA-RU073W | |
| Asus ZenBook Duo UX8407AA | |
| Dell XPS 14 Core Ultra X7 358H | |
| Average of class Convertible (10.8 - 176.8, n=46, last 2 years) | |
| Dota 2 Reborn - 1920x1080 ultra (3/3) best looking | |
| Asus ROG Flow Z13 GZ302EA-RU073W | |
| Asus ProArt PX13 HN7306EA | |
| Asus ProArt PX13 HN7306 | |
| Asus ZenBook Duo UX8407AA | |
| Dell XPS 14 Core Ultra X7 358H | |
| Average of class Convertible (18.8 - 142, n=51, last 2 years) | |
Cyberpunk 2077 ultra FPS Chart
| low | med. | high | ultra | QHD | 4K | |
|---|---|---|---|---|---|---|
| GTA V (2015) | 90.6 | 68.6 | ||||
| Dota 2 Reborn (2015) | 213 | 178.3 | 158.9 | 138.3 | 88.5 | |
| Final Fantasy XV Benchmark (2018) | 198.8 | 121.9 | 84.9 | 63.3 | 36.1 | |
| X-Plane 11.11 (2018) | 123.7 | 102.8 | 72.7 | 57.8 | ||
| Strange Brigade (2018) | 484 | 224 | 198.2 | 176.8 | 113.1 | 58.6 |
| Baldur's Gate 3 (2023) | 90.5 | 60.8 | 29.4 | |||
| Cyberpunk 2077 (2023) | 133.3 | 108.3 | 87.6 | 79.5 | 49.4 | 20 |
| F1 24 (2024) | 225 | 208 | 168.2 | 52.5 | 34.4 |
Emissions & Power Consumption
System Noise

All this performance is a small 13-inch chassis is a challenge for the cooling solution and the fans are loud (up to 53.2 dB(A)) when you stress the system, but the fan curve was improved and the system is generally quieter in everyday situations compared to the previous model. We also noticed some coil whine from our review unit.
Noise level
| Idle |
| 24.3 / 24.3 / 24.3 dB(A) |
| Load |
| 43.2 / 53.4 dB(A) |
 | ||
30 dB silent 40 dB(A) audible 50 dB(A) loud |
||
min: | ||
| Asus ProArt PX13 HN7306EA Ryzen AI Max+ 395, Radeon 8060S | Asus ZenBook Duo UX8407AA Ultra X9 388H, Arc B390 Panther Lake iGPU | Dell XPS 14 Core Ultra X7 358H Ultra X7 358H, Arc B390 Panther Lake iGPU | Asus ROG Flow Z13 GZ302EA-RU073W Ryzen AI Max+ 395, Radeon 8060S | Asus ProArt PX13 HN7306 Ryzen AI 9 HX 370, GeForce RTX 4070 Laptop GPU | Apple MacBook Pro 14 2024 M4 Pro M4 Pro 14-Core, M4 Pro 20-Core GPU | |
|---|---|---|---|---|---|---|
| Noise | 5% | 10% | 8% | -7% | 10% | |
| off / environment * (dB) | 24.3 | 25 -3% | 22.9 6% | 23.6 3% | 24.7 -2% | 23.9 2% |
| Idle Minimum * (dB) | 24.3 | 25 -3% | 23.3 4% | 23.6 3% | 24.7 -2% | 23.9 2% |
| Idle Average * (dB) | 24.3 | 25 -3% | 23.3 4% | 23.6 3% | 28.4 -17% | 23.9 2% |
| Idle Maximum * (dB) | 24.3 | 25 -3% | 23.3 4% | 23.6 3% | 30.9 -27% | 23.9 2% |
| Load Average * (dB) | 43.2 | 36.4 16% | 34 21% | 37.5 13% | 43 -0% | 30.2 30% |
| Cyberpunk 2077 ultra * (dB) | 53.4 | 45.9 14% | 43.5 19% | 45.4 15% | 53.3 -0% | 44.5 17% |
| Load Maximum * (dB) | 53.4 | 45.9 14% | 45.7 14% | 45.4 15% | 53.3 -0% | 44.5 17% |
* ... smaller is better
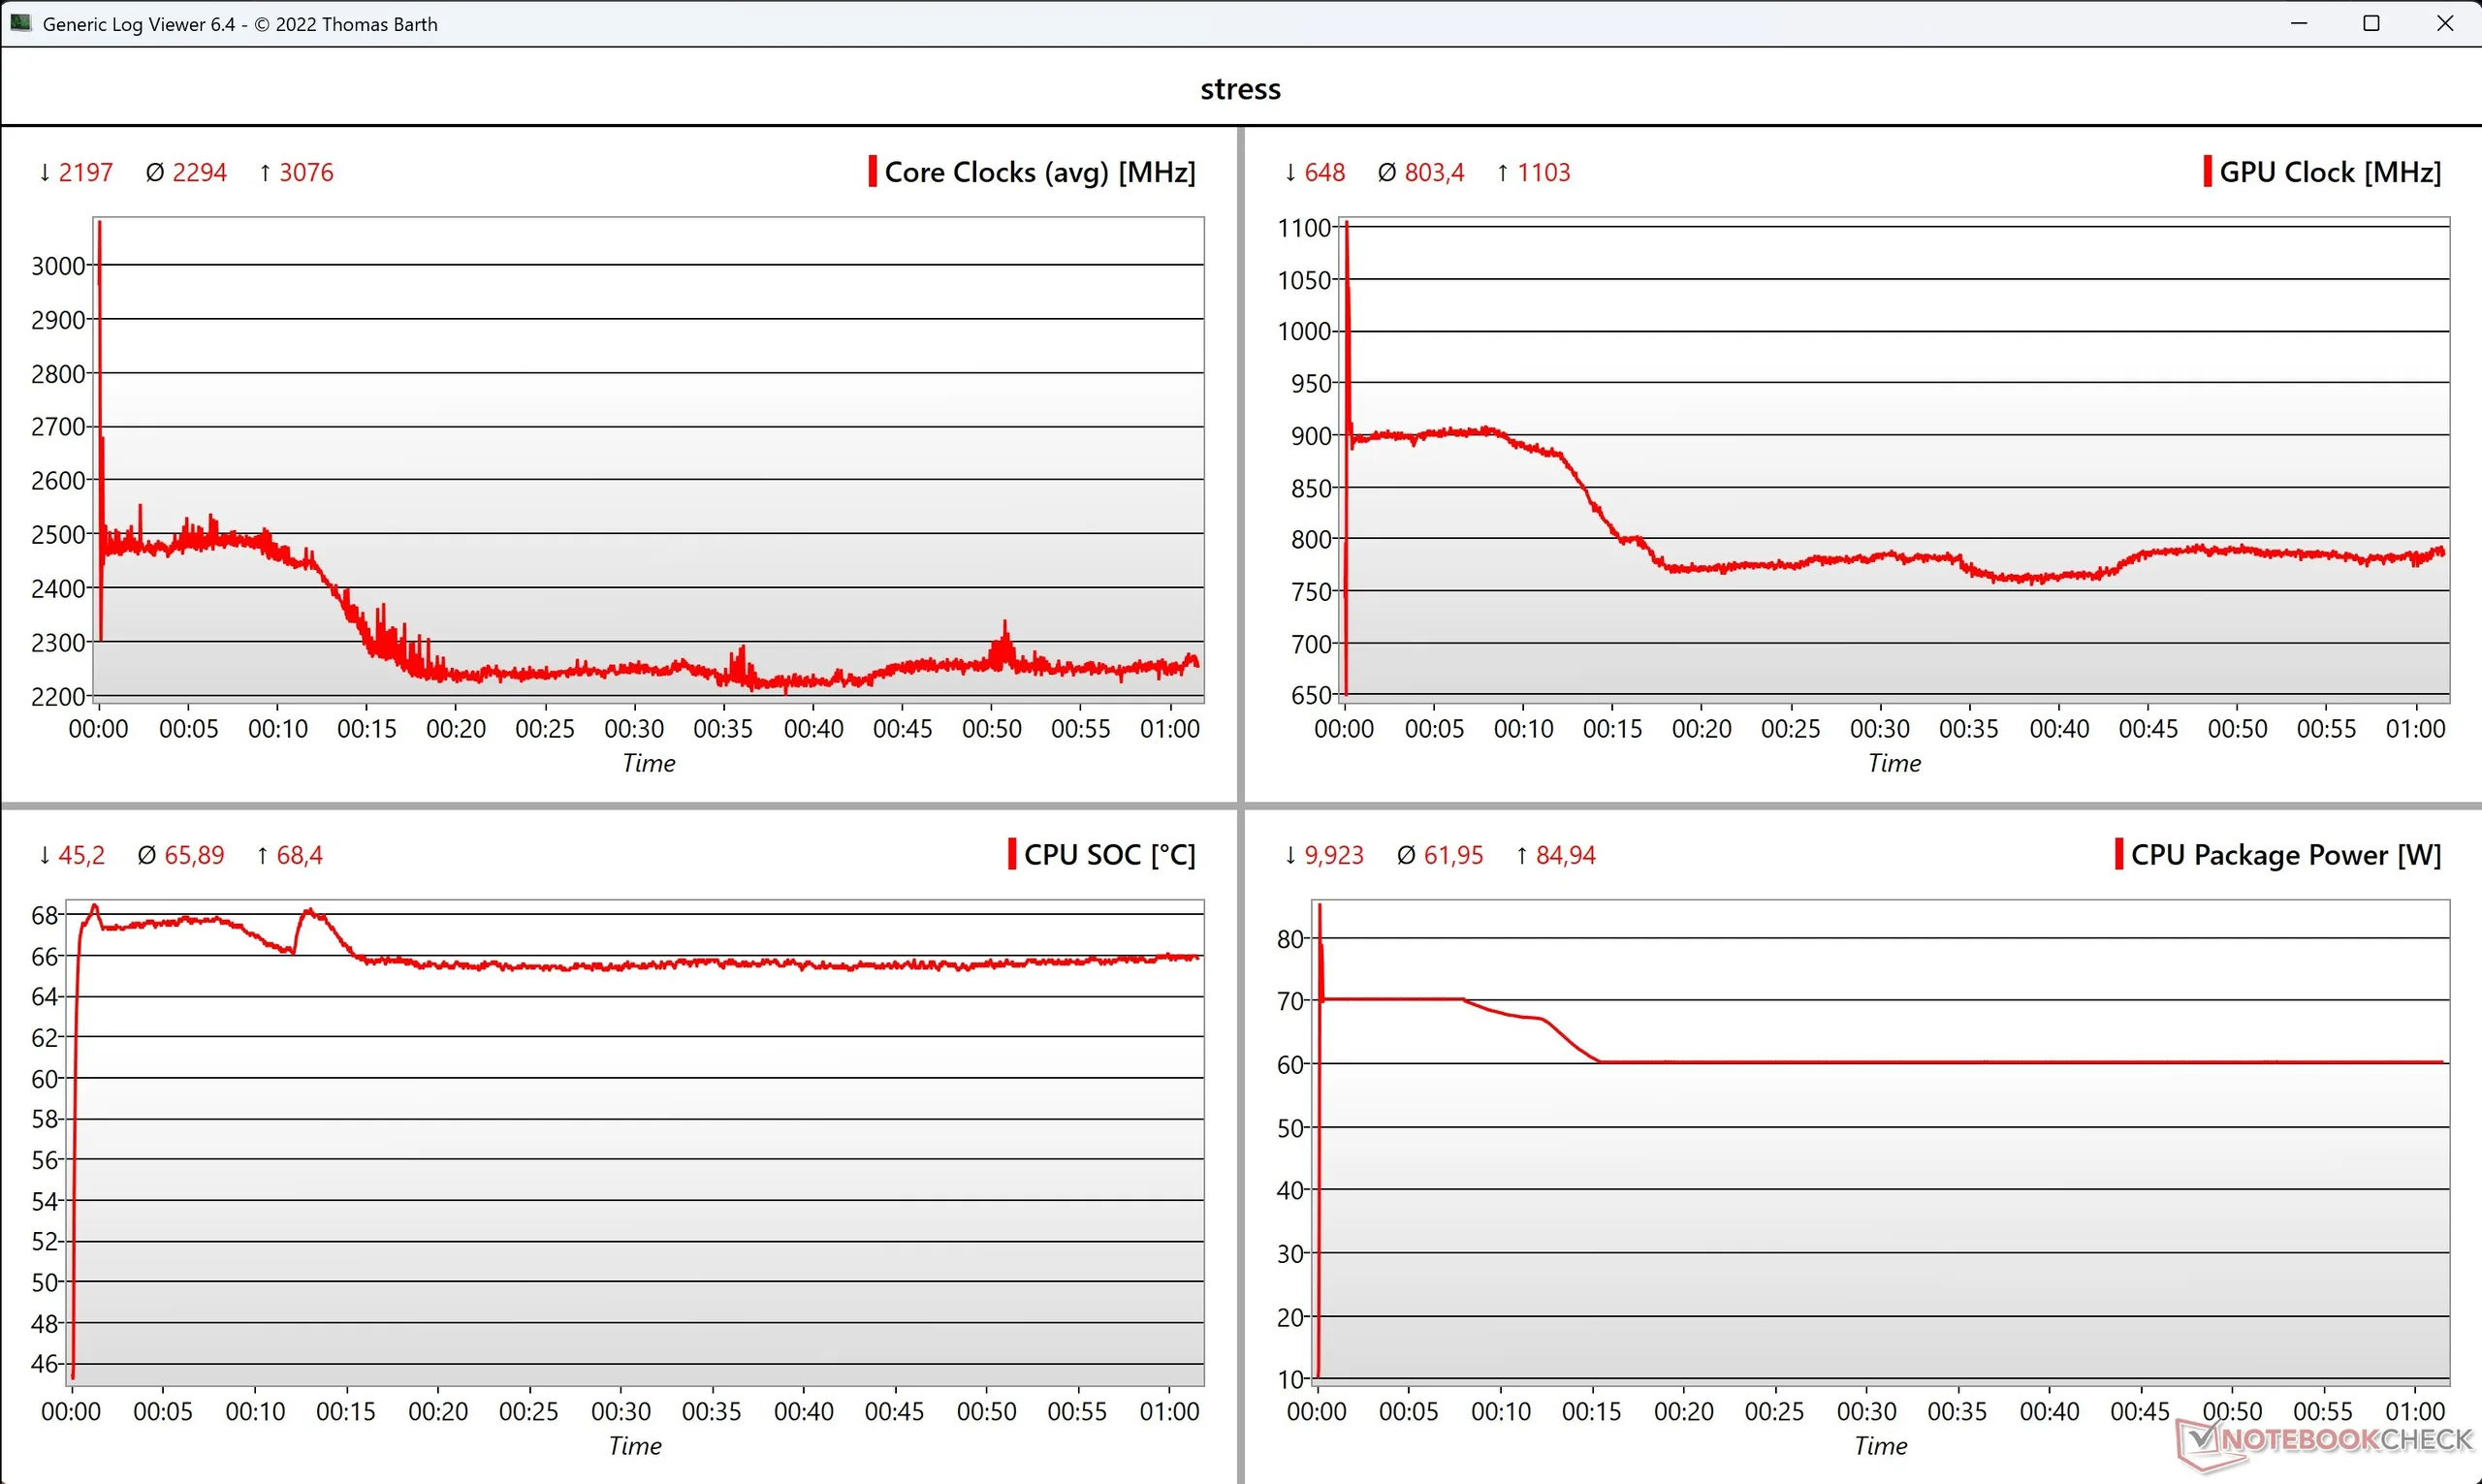
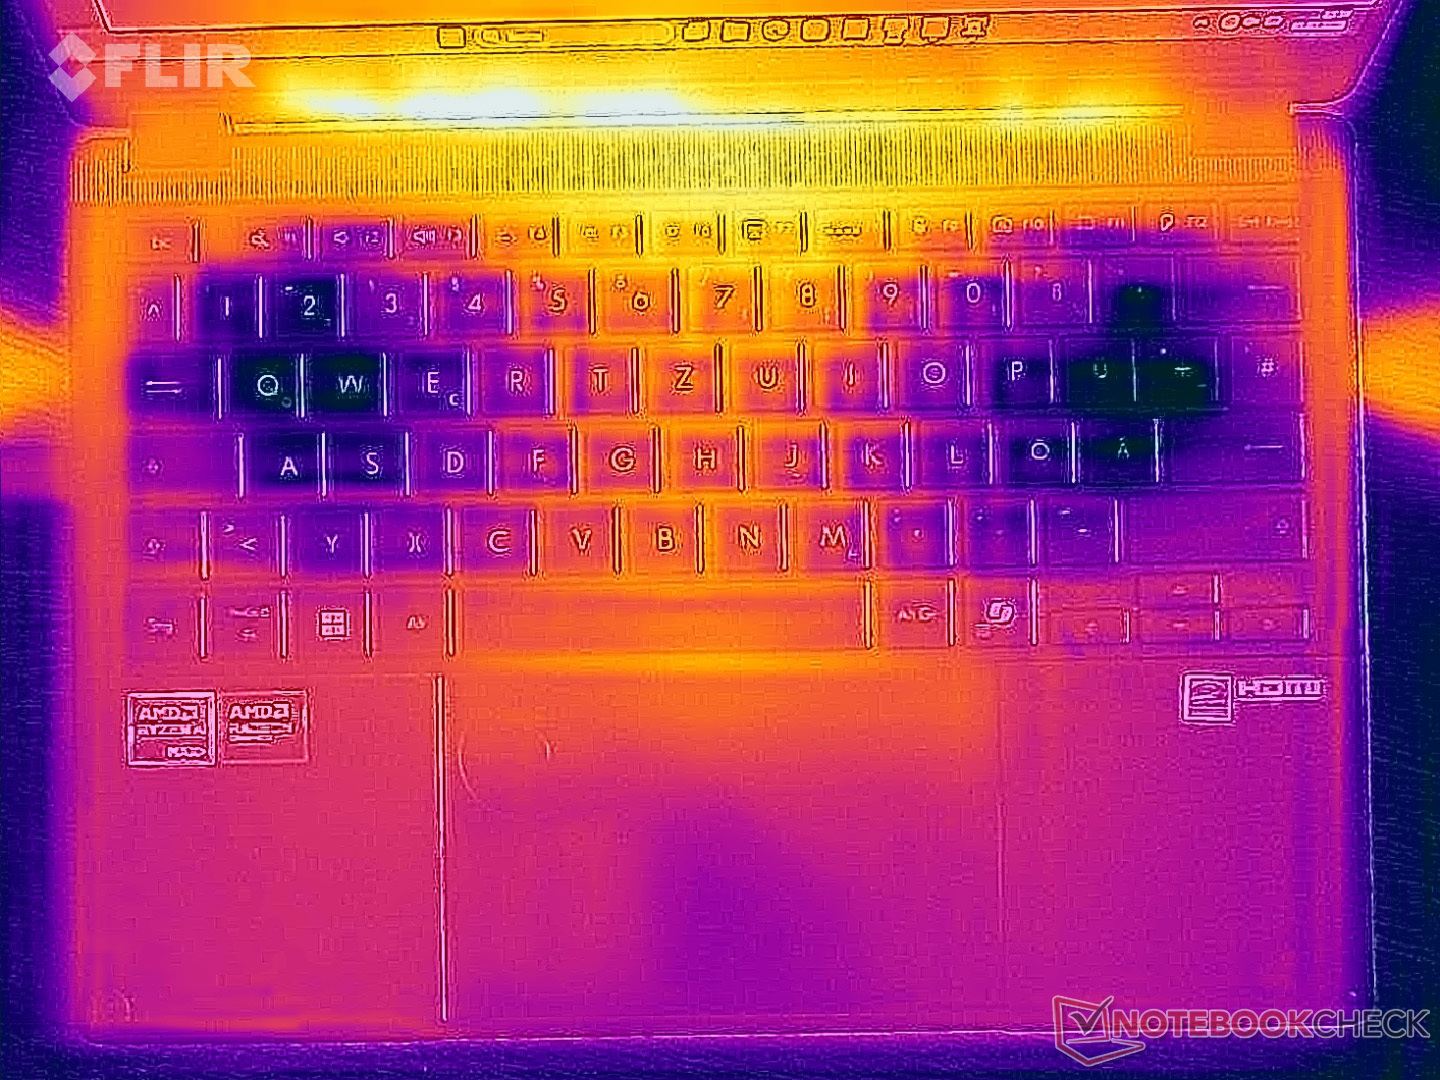
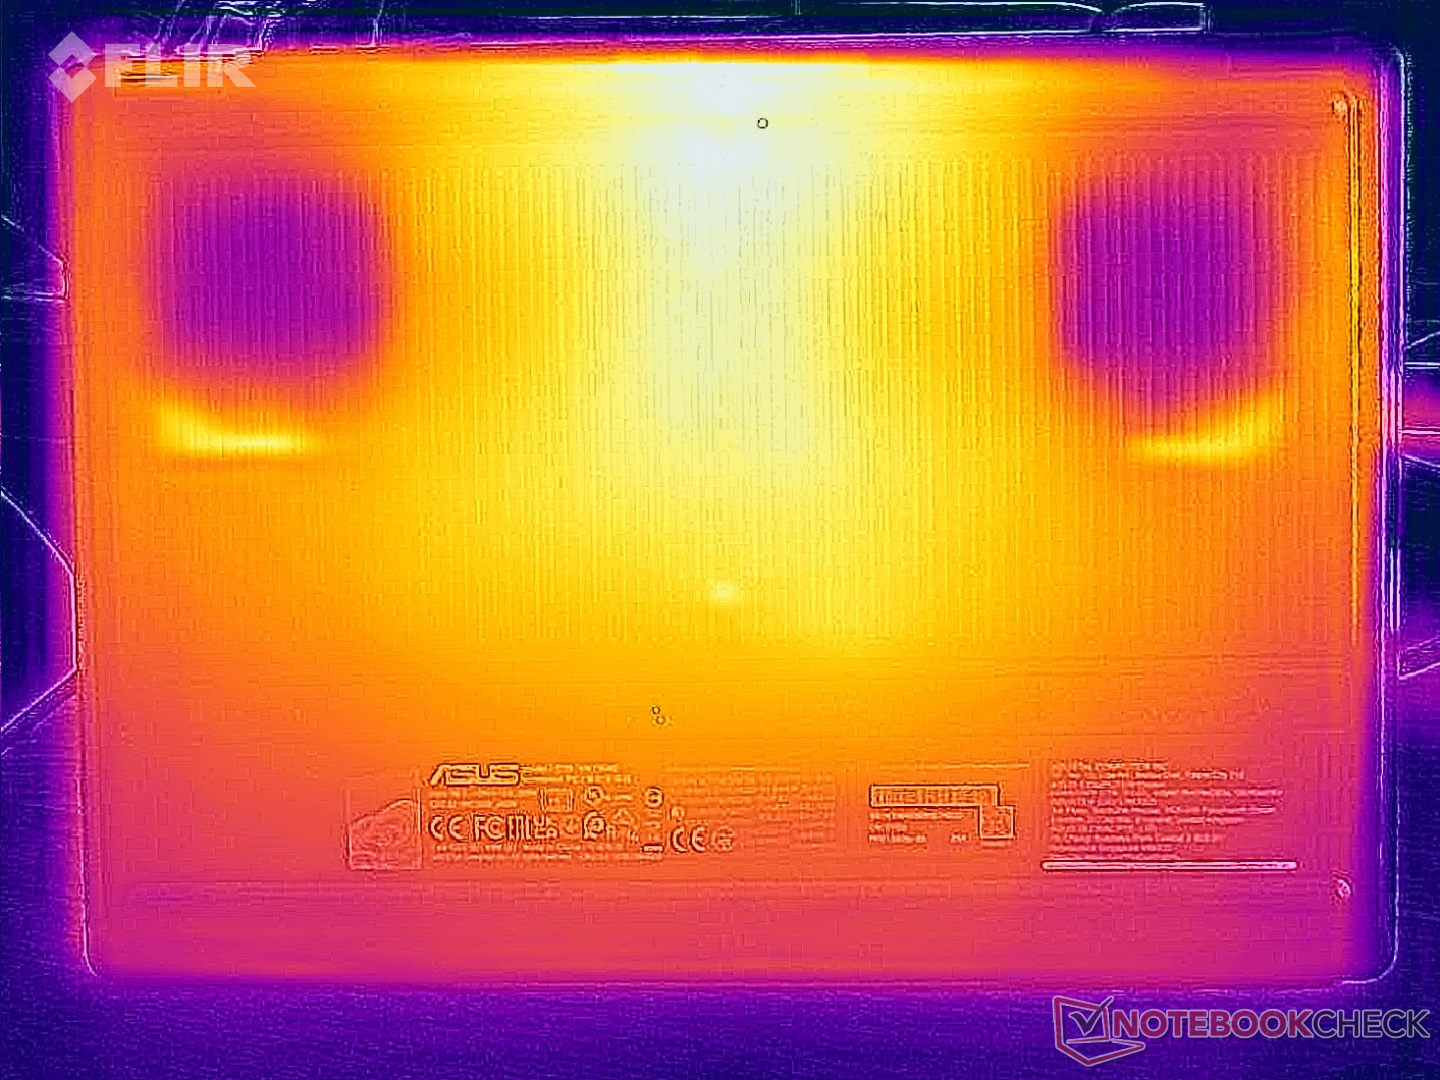
Temperature
Surface temperatures are no issue even under high loads. We measure up to 45 °C at the bottom (upper center area), so you can still use it on your lap. During our stress test with combined CPU/GPU load, the Ryzen AI Max+ 395 runs at 70 Watts for about 8 minutes and then drops to ~61 Watts.
(±) The maximum temperature on the upper side is 41.5 °C / 107 F, compared to the average of 35.4 °C / 96 F, ranging from 19.6 to 60 °C for the class Convertible.
(-) The bottom heats up to a maximum of 45.7 °C / 114 F, compared to the average of 36.9 °C / 98 F
(+) In idle usage, the average temperature for the upper side is 25.2 °C / 77 F, compared to the device average of 30.3 °C / 87 F.
(±) 3: The average temperature for the upper side is 32.9 °C / 91 F, compared to the average of 30.3 °C / 87 F for the class Convertible.
(+) The palmrests and touchpad are cooler than skin temperature with a maximum of 30.7 °C / 87.3 F and are therefore cool to the touch.
(-) The average temperature of the palmrest area of similar devices was 28 °C / 82.4 F (-2.7 °C / -4.9 F).
| Asus ProArt PX13 HN7306EA Ryzen AI Max+ 395, Radeon 8060S | Asus ZenBook Duo UX8407AA Ultra X9 388H, Arc B390 Panther Lake iGPU | Dell XPS 14 Core Ultra X7 358H Ultra X7 358H, Arc B390 Panther Lake iGPU | Asus ROG Flow Z13 GZ302EA-RU073W Ryzen AI Max+ 395, Radeon 8060S | Asus ProArt PX13 HN7306 Ryzen AI 9 HX 370, GeForce RTX 4070 Laptop GPU | Apple MacBook Pro 14 2024 M4 Pro M4 Pro 14-Core, M4 Pro 20-Core GPU | |
|---|---|---|---|---|---|---|
| Heat | 5% | 11% | -6% | -9% | 5% | |
| Maximum Upper Side * (°C) | 41.5 | 35.3 15% | 34 18% | 42.5 -2% | 45.3 -9% | 47.3 -14% |
| Maximum Bottom * (°C) | 45.7 | 44.3 3% | 35.8 22% | 44.9 2% | 47.9 -5% | 44.2 3% |
| Idle Upper Side * (°C) | 25.8 | 25.5 1% | 25.6 1% | 29.6 -15% | 28.5 -10% | 22.1 14% |
| Idle Bottom * (°C) | 26.8 | 26.7 -0% | 26.4 1% | 29.5 -10% | 29.9 -12% | 22.1 18% |
* ... smaller is better
Speakers
The sound quality is okay and much better compared to the ROG Flow Z13, but not on the same level as competitors like the Zenbook Duo, XPS 14 or MacBook Pro.
Asus ProArt PX13 HN7306EA audio analysis
(±) | speaker loudness is average but good (79.5 dB)
Bass 100 - 315 Hz
(±) | reduced bass - on average 8.2% lower than median
(±) | linearity of bass is average (10.1% delta to prev. frequency)
Mids 400 - 2000 Hz
(±) | higher mids - on average 8.3% higher than median
(+) | mids are linear (4.8% delta to prev. frequency)
Highs 2 - 16 kHz
(+) | balanced highs - only 3.8% away from median
(+) | highs are linear (4.7% delta to prev. frequency)
Overall 100 - 16.000 Hz
(±) | linearity of overall sound is average (15.2% difference to median)
Compared to same class
» 24% of all tested devices in this class were better, 5% similar, 71% worse
» The best had a delta of 6%, average was 20%, worst was 57%
Compared to all devices tested
» 22% of all tested devices were better, 4% similar, 74% worse
» The best had a delta of 4%, average was 23%, worst was 134%
Asus ZenBook Duo UX8407AA audio analysis
(+) | speakers can play relatively loud (83.7 dB)
Bass 100 - 315 Hz
(±) | reduced bass - on average 6.6% lower than median
(±) | linearity of bass is average (8.3% delta to prev. frequency)
Mids 400 - 2000 Hz
(+) | balanced mids - only 4.4% away from median
(+) | mids are linear (5% delta to prev. frequency)
Highs 2 - 16 kHz
(+) | balanced highs - only 3% away from median
(+) | highs are linear (3.8% delta to prev. frequency)
Overall 100 - 16.000 Hz
(+) | overall sound is linear (9.8% difference to median)
Compared to same class
» 6% of all tested devices in this class were better, 1% similar, 94% worse
» The best had a delta of 6%, average was 20%, worst was 57%
Compared to all devices tested
» 4% of all tested devices were better, 1% similar, 95% worse
» The best had a delta of 4%, average was 23%, worst was 134%
Dell XPS 14 Core Ultra X7 358H audio analysis
(+) | speakers can play relatively loud (87 dB)
Bass 100 - 315 Hz
(±) | reduced bass - on average 7.6% lower than median
(+) | bass is linear (5.9% delta to prev. frequency)
Mids 400 - 2000 Hz
(+) | balanced mids - only 3.2% away from median
(+) | mids are linear (3.6% delta to prev. frequency)
Highs 2 - 16 kHz
(+) | balanced highs - only 3.3% away from median
(+) | highs are linear (5.8% delta to prev. frequency)
Overall 100 - 16.000 Hz
(+) | overall sound is linear (7.3% difference to median)
Compared to same class
» 6% of all tested devices in this class were better, 1% similar, 94% worse
» The best had a delta of 5%, average was 17%, worst was 45%
Compared to all devices tested
» 1% of all tested devices were better, 0% similar, 99% worse
» The best had a delta of 4%, average was 23%, worst was 134%
Asus ROG Flow Z13 GZ302EA-RU073W audio analysis
(±) | speaker loudness is average but good (79.9 dB)
Bass 100 - 315 Hz
(±) | reduced bass - on average 10.7% lower than median
(±) | linearity of bass is average (10.6% delta to prev. frequency)
Mids 400 - 2000 Hz
(±) | higher mids - on average 6.7% higher than median
(+) | mids are linear (6.3% delta to prev. frequency)
Highs 2 - 16 kHz
(±) | higher highs - on average 9.2% higher than median
(±) | linearity of highs is average (9.7% delta to prev. frequency)
Overall 100 - 16.000 Hz
(±) | linearity of overall sound is average (23.7% difference to median)
Compared to same class
» 72% of all tested devices in this class were better, 4% similar, 24% worse
» The best had a delta of 6%, average was 20%, worst was 57%
Compared to all devices tested
» 71% of all tested devices were better, 6% similar, 23% worse
» The best had a delta of 4%, average was 23%, worst was 134%
Apple MacBook Pro 14 2024 M4 Pro audio analysis
(+) | speakers can play relatively loud (84.9 dB)
Bass 100 - 315 Hz
(+) | good bass - only 4.6% away from median
(±) | linearity of bass is average (7.3% delta to prev. frequency)
Mids 400 - 2000 Hz
(+) | balanced mids - only 1.5% away from median
(+) | mids are linear (2.1% delta to prev. frequency)
Highs 2 - 16 kHz
(+) | balanced highs - only 2.6% away from median
(+) | highs are linear (3.9% delta to prev. frequency)
Overall 100 - 16.000 Hz
(+) | overall sound is linear (5.9% difference to median)
Compared to same class
» 3% of all tested devices in this class were better, 0% similar, 97% worse
» The best had a delta of 5%, average was 17%, worst was 45%
Compared to all devices tested
» 0% of all tested devices were better, 0% similar, 100% worse
» The best had a delta of 4%, average was 23%, worst was 134%
Power Consumption
Our consumption measurements do not reveal any surprises. At full load, the system consumes up to 130 Watts and levels out at around 110 Watt, so the 200W power adapter is more than sufficient. The Strix Halo system is also more efficient compared to the previous model with the GeForce GPU.
| Off / Standby | |
| Idle | |
| Load |
|
Key:
min: | |
| Asus ProArt PX13 HN7306EA Ryzen AI Max+ 395, Radeon 8060S, SanDisk PC SN5100S 2TB, OLED, 2880x1800, 13.3" | Asus ZenBook Duo UX8407AA Ultra X9 388H, Arc B390 Panther Lake iGPU, Samsung PM9C1b MZVL82T0HBL1, OLED, 2880x1800, 14" | Dell XPS 14 Core Ultra X7 358H Ultra X7 358H, Arc B390 Panther Lake iGPU, Samsung PM9C1b MZVL81T0HFLB-00BH1, OLED, 2880x1800, 14" | Asus ROG Flow Z13 GZ302EA-RU073W Ryzen AI Max+ 395, Radeon 8060S, Kioxia BG6 KBG60ZNS1T02, IPS, 2560x1600, 13.4" | Asus ProArt PX13 HN7306 Ryzen AI 9 HX 370, GeForce RTX 4070 Laptop GPU, WD PC SN740 SDDPTQD-1T00, OLED, 2880x1800, 13.3" | Apple MacBook Pro 14 2024 M4 Pro M4 Pro 14-Core, M4 Pro 20-Core GPU, Apple SSD AP2048Z, MiniLED, 3024x1964, 14.2" | Average AMD Radeon 8060S | Average of class Convertible | |
|---|---|---|---|---|---|---|---|---|
| Power Consumption | 8% | 34% | -57% | -23% | 2% | -39% | 20% | |
| Idle Minimum * (Watt) | 5.3 | 4.8 9% | 3.1 42% | 10.4 -96% | 7.5 -42% | 2.17 59% | 7.31 ? -38% | 4.22 ? 20% |
| Idle Average * (Watt) | 7 | 9.8 -40% | 3.6 49% | 17 -143% | 9.3 -33% | 10.9 -56% | 9.71 ? -39% | 6.97 ? -0% |
| Idle Maximum * (Watt) | 7.2 | 10.2 -42% | 10 -39% | 17.3 -140% | 9.6 -33% | 11 -53% | 13.2 ? -83% | 8.63 ? -20% |
| Load Average * (Watt) | 88.1 | 47.3 46% | 39.2 56% | 92.9 -5% | 74.1 16% | 74.3 16% | 83.6 ? 5% | 43.9 ? 50% |
| Cyberpunk 2077 ultra external monitor * (Watt) | 103.5 | 75.3 27% | 51.2 51% | 113.2 -9% | 121.5 -17% | 80.5 22% | ||
| Cyberpunk 2077 ultra * (Watt) | 113.7 | 76.3 33% | 51.4 55% | 109.3 4% | 121.6 -7% | |||
| Load Maximum * (Watt) | 128.4 | 96 25% | 101.4 21% | 138.1 -8% | 185 -44% | 98.1 24% | 179.4 ? -40% | 67.1 ? 48% |
* ... smaller is better
Power Consumption Cyberpunk / Stress Test
Power Consumption external Monitor
Battery Life
Battery capacity remains unchanged at 73 Wh and the recorded runtimes are a bit better compared to the old PX13. At 150 nits, our Wi-Fi test runs for almost 9.5 hours, which is clearly beaten by most competitors. At max SDR brightness, the runtime of 7.5 hours is more competitive.

Notebookcheck Rating
Asus ProArt PX13 HN7306EA
- 02/24/2026 v8
Andreas Osthoff
 Total Sustainability Score:
 Potential Competitors in Comparison
Image | Model / Review | Price | Weight | Height | Display |
|---|---|---|---|---|---|
1. 86.5%  | Asus ProArt PX13 HN7306EA AMD Ryzen AI Max+ 395 ⎘ AMD Radeon 8060S ⎘ 128 GB Memory, 2048 GB SSD | Amazon: List Price: 3900€ | 1.4 kg | 17.7 mm | 13.30" 2880x1800 255 PPI OLED |
2. 88.5% 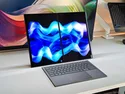 | Asus ZenBook Duo UX8407AA Intel Core Ultra X9 388H ⎘ Intel Arc B390 12 Xe3 Panther Lake iGPU ⎘ 32 GB Memory, 2048 GB SSD | Amazon: $2,833.76 List Price: 2599€ | 1.7 kg | 23.4 mm | 14.00" 2880x1800 243 PPI OLED |
3. 87.4% 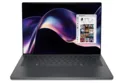 | Dell XPS 14 Core Ultra X7 358H Intel Core Ultra X7 358H ⎘ Intel Arc B390 12 Xe3 Panther Lake iGPU ⎘ 32 GB Memory, 1000 GB SSD | Amazon: 1. $1,899.99 Dell XPS 14 Premium Laptop D... 2. $2,399.99 Dell Premium 16 (Previously ... 3. $841.97 Dell Pro 14 PC14250 14" Note... List Price: 2200 USD | 1.4 kg | 14.62 mm | 14.00" 2880x1800 243 PPI OLED |
4. 86.8%  | Asus ROG Flow Z13 GZ302EA-RU073W AMD Ryzen AI Max+ 395 ⎘ AMD Radeon 8060S ⎘ 32 GB Memory, 512 GB SSD | Amazon: 1. $109.99 ROG 200W Charger for Asus RO... 2. $1,799.99 ASUS ROG Flow Z13 (2025) Gam... 3. $69.99 ROG 200W 20V Charger for Asu... List Price: 2499€ | 1.6 kg | 14.9 mm | 13.40" 2560x1600 225 PPI IPS |
5. 86%  | Asus ProArt PX13 HN7306 AMD Ryzen AI 9 HX 370 ⎘ NVIDIA GeForce RTX 4070 Laptop GPU ⎘ 32 GB Memory, 1024 GB SSD | Amazon: List Price: 2999€ | 1.4 kg | 17.7 mm | 13.30" 2880x1800 255 PPI OLED |
6. 91.8%  | Apple MacBook Pro 14 2024 M4 Pro Apple M4 Pro 14-Core ⎘ Apple M4 Pro 20-Core GPU ⎘ 48 GB Memory, 2048 GB SSD | Amazon: List Price: 3989 Euro | 1.6 kg | 15.5 mm | 14.20" 3024x1964 254 PPI MiniLED |
Transparency
The selection of devices to be reviewed is made by our editorial team. The test sample was provided to the author as a loan by the manufacturer or retailer for the purpose of this review. The lender had no influence on this review, nor did the manufacturer receive a copy of this review before publication. There was no obligation to publish this review. As an independent media company, Notebookcheck is not subjected to the authority of manufacturers, retailers or publishers.
This is how Notebookcheck is testing
Every year, Notebookcheck independently reviews hundreds of laptops and smartphones using standardized procedures to ensure that all results are comparable. We have continuously developed our test methods for around 20 years and set industry standards in the process. In our test labs, high-quality measuring equipment is utilized by experienced technicians and editors. These tests involve a multi-stage validation process. Our complex rating system is based on hundreds of well-founded measurements and benchmarks, which maintains objectivity. Further information on our test methods can be found here.
