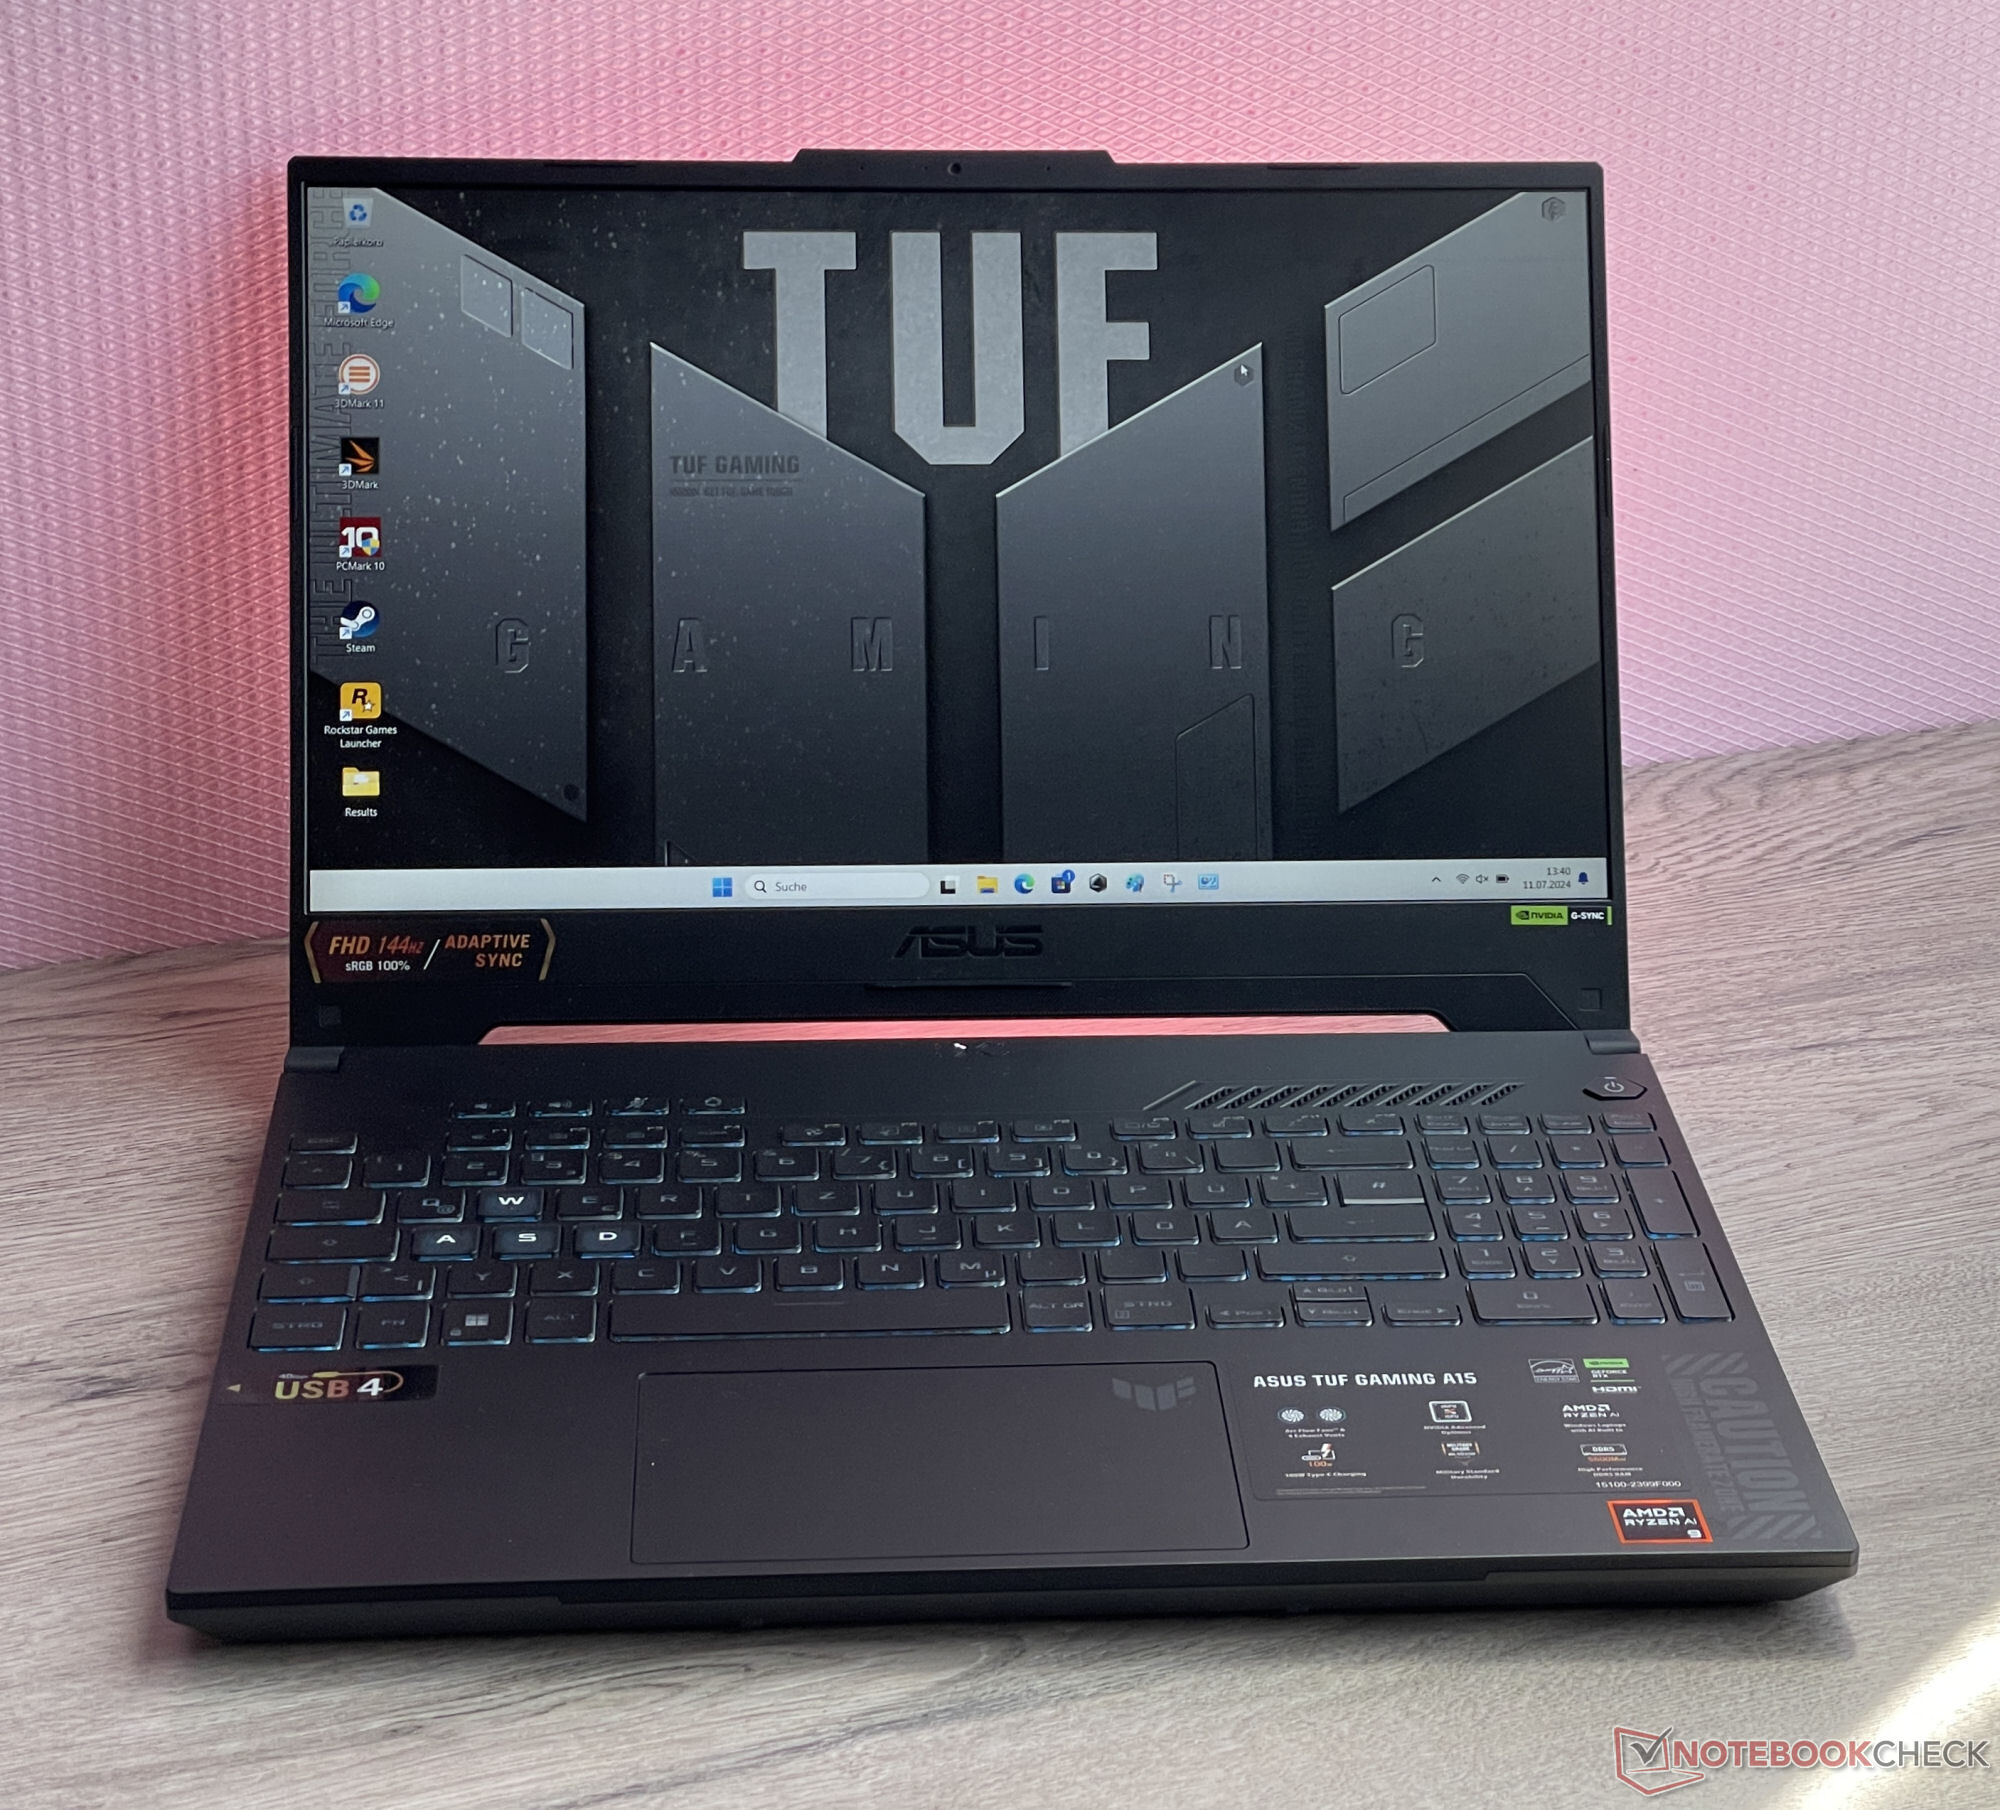
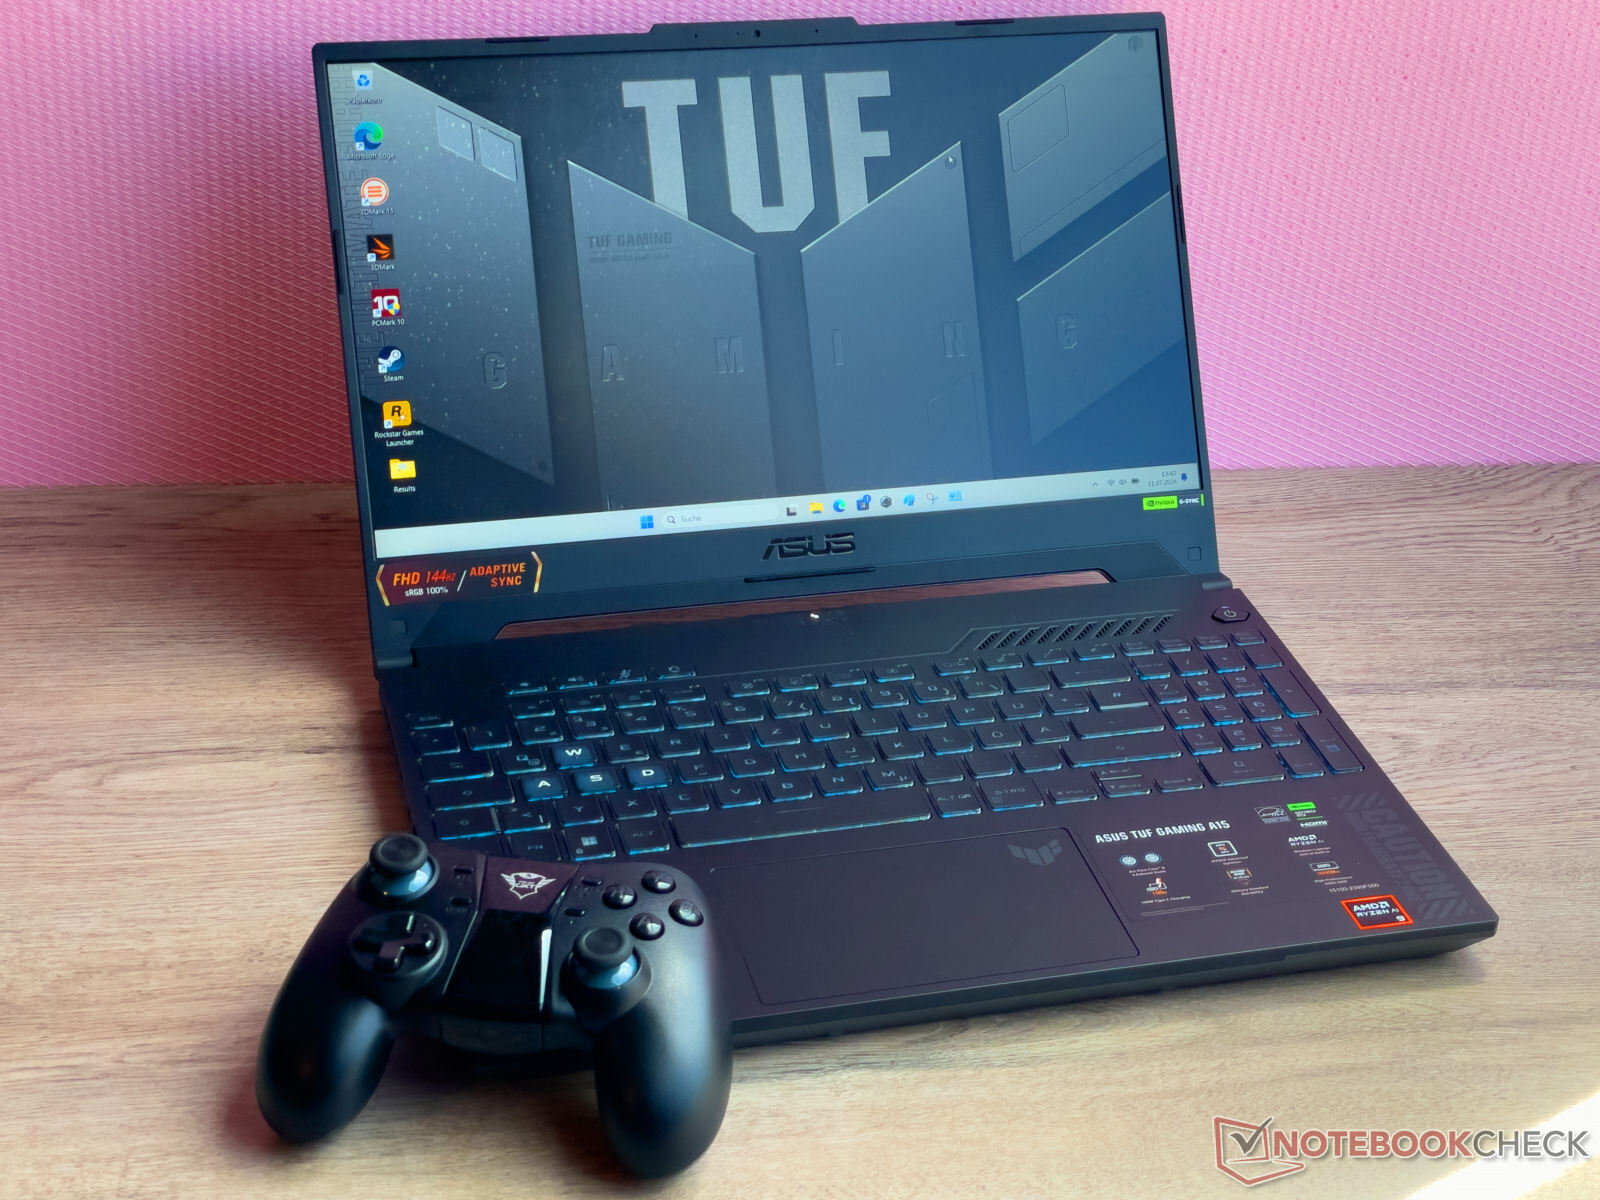
Asus TUF Gaming A15 (2024) review: RTX 4060 power, moderate price, long battery life

"TUF Gaming“ is a synonym for gaming laptops at the lower end of the price scale: Ryzen 9 8945H, GeForce RTX 4060, 16 GB of RAM, a 512 GB SSD and a price of around $1,399 add up to an affordable mid-range gaming laptop. Competition can be found in the form of devices such as the Lenovo LOQ 15IRX9, the Gigabyte G6X 9KG (2024), the Dell G16, the XMG Core 15 (M24) and the HP Victus 16 (2024).
This is identical to the previous year’s sister model, the A15 we reviewed last year. The primary difference is the switch from Ryzen 7000 to Ryzen 8000.
Possible competitors compared
Rating | Version | Date | Model | Weight | Height | Size | Resolution | Price |
|---|---|---|---|---|---|---|---|---|
| 80.3 % | v8 | 07 / 2024 | Asus TUF Gaming A15 FA507UV R9 8945H, GeForce RTX 4060 Laptop GPU | 2.1 kg | 22.4 mm | 15.60" | 1920x1080 | |
| 79 % | v8 | 07 / 2024 | Lenovo LOQ 15IRX9 i5-13450HX, GeForce RTX 4060 Laptop GPU | 2.4 kg | 23.9 mm | 15.60" | 1920x1080 | |
| 84.3 % v7 (old) | v7 (old) | 05 / 2024 | HP Victus 16 (2024) i7-14700HX, GeForce RTX 4060 Laptop GPU | 2.4 kg | 23.9 mm | 16.10" | 1920x1080 | |
| 83.2 % v7 (old) | v7 (old) | 03 / 2024 | Gigabyte G6X 9KG (2024) i7-13650HX, GeForce RTX 4060 Laptop GPU | 2.6 kg | 25.1 mm | 16.00" | 1920x1200 | |
| 83.7 % | v8 | 06 / 2024 | Schenker XMG Core 15 (M24) R7 8845HS, GeForce RTX 4060 Laptop GPU | 2.1 kg | 21.9 mm | 15.30" | 2560x1600 | |
| 85.5 % v7 (old) | v7 (old) | 02 / 2024 | Dell G16, i7-13650HX, RTX 4060 i7-13650HX, GeForce RTX 4060 Laptop GPU | 2.8 kg | 25.65 mm | 16.00" | 2560x1600 |
Note: We have recently updated our rating system and the results of version 8 are not comparable with the results of version 7. More information is available here.
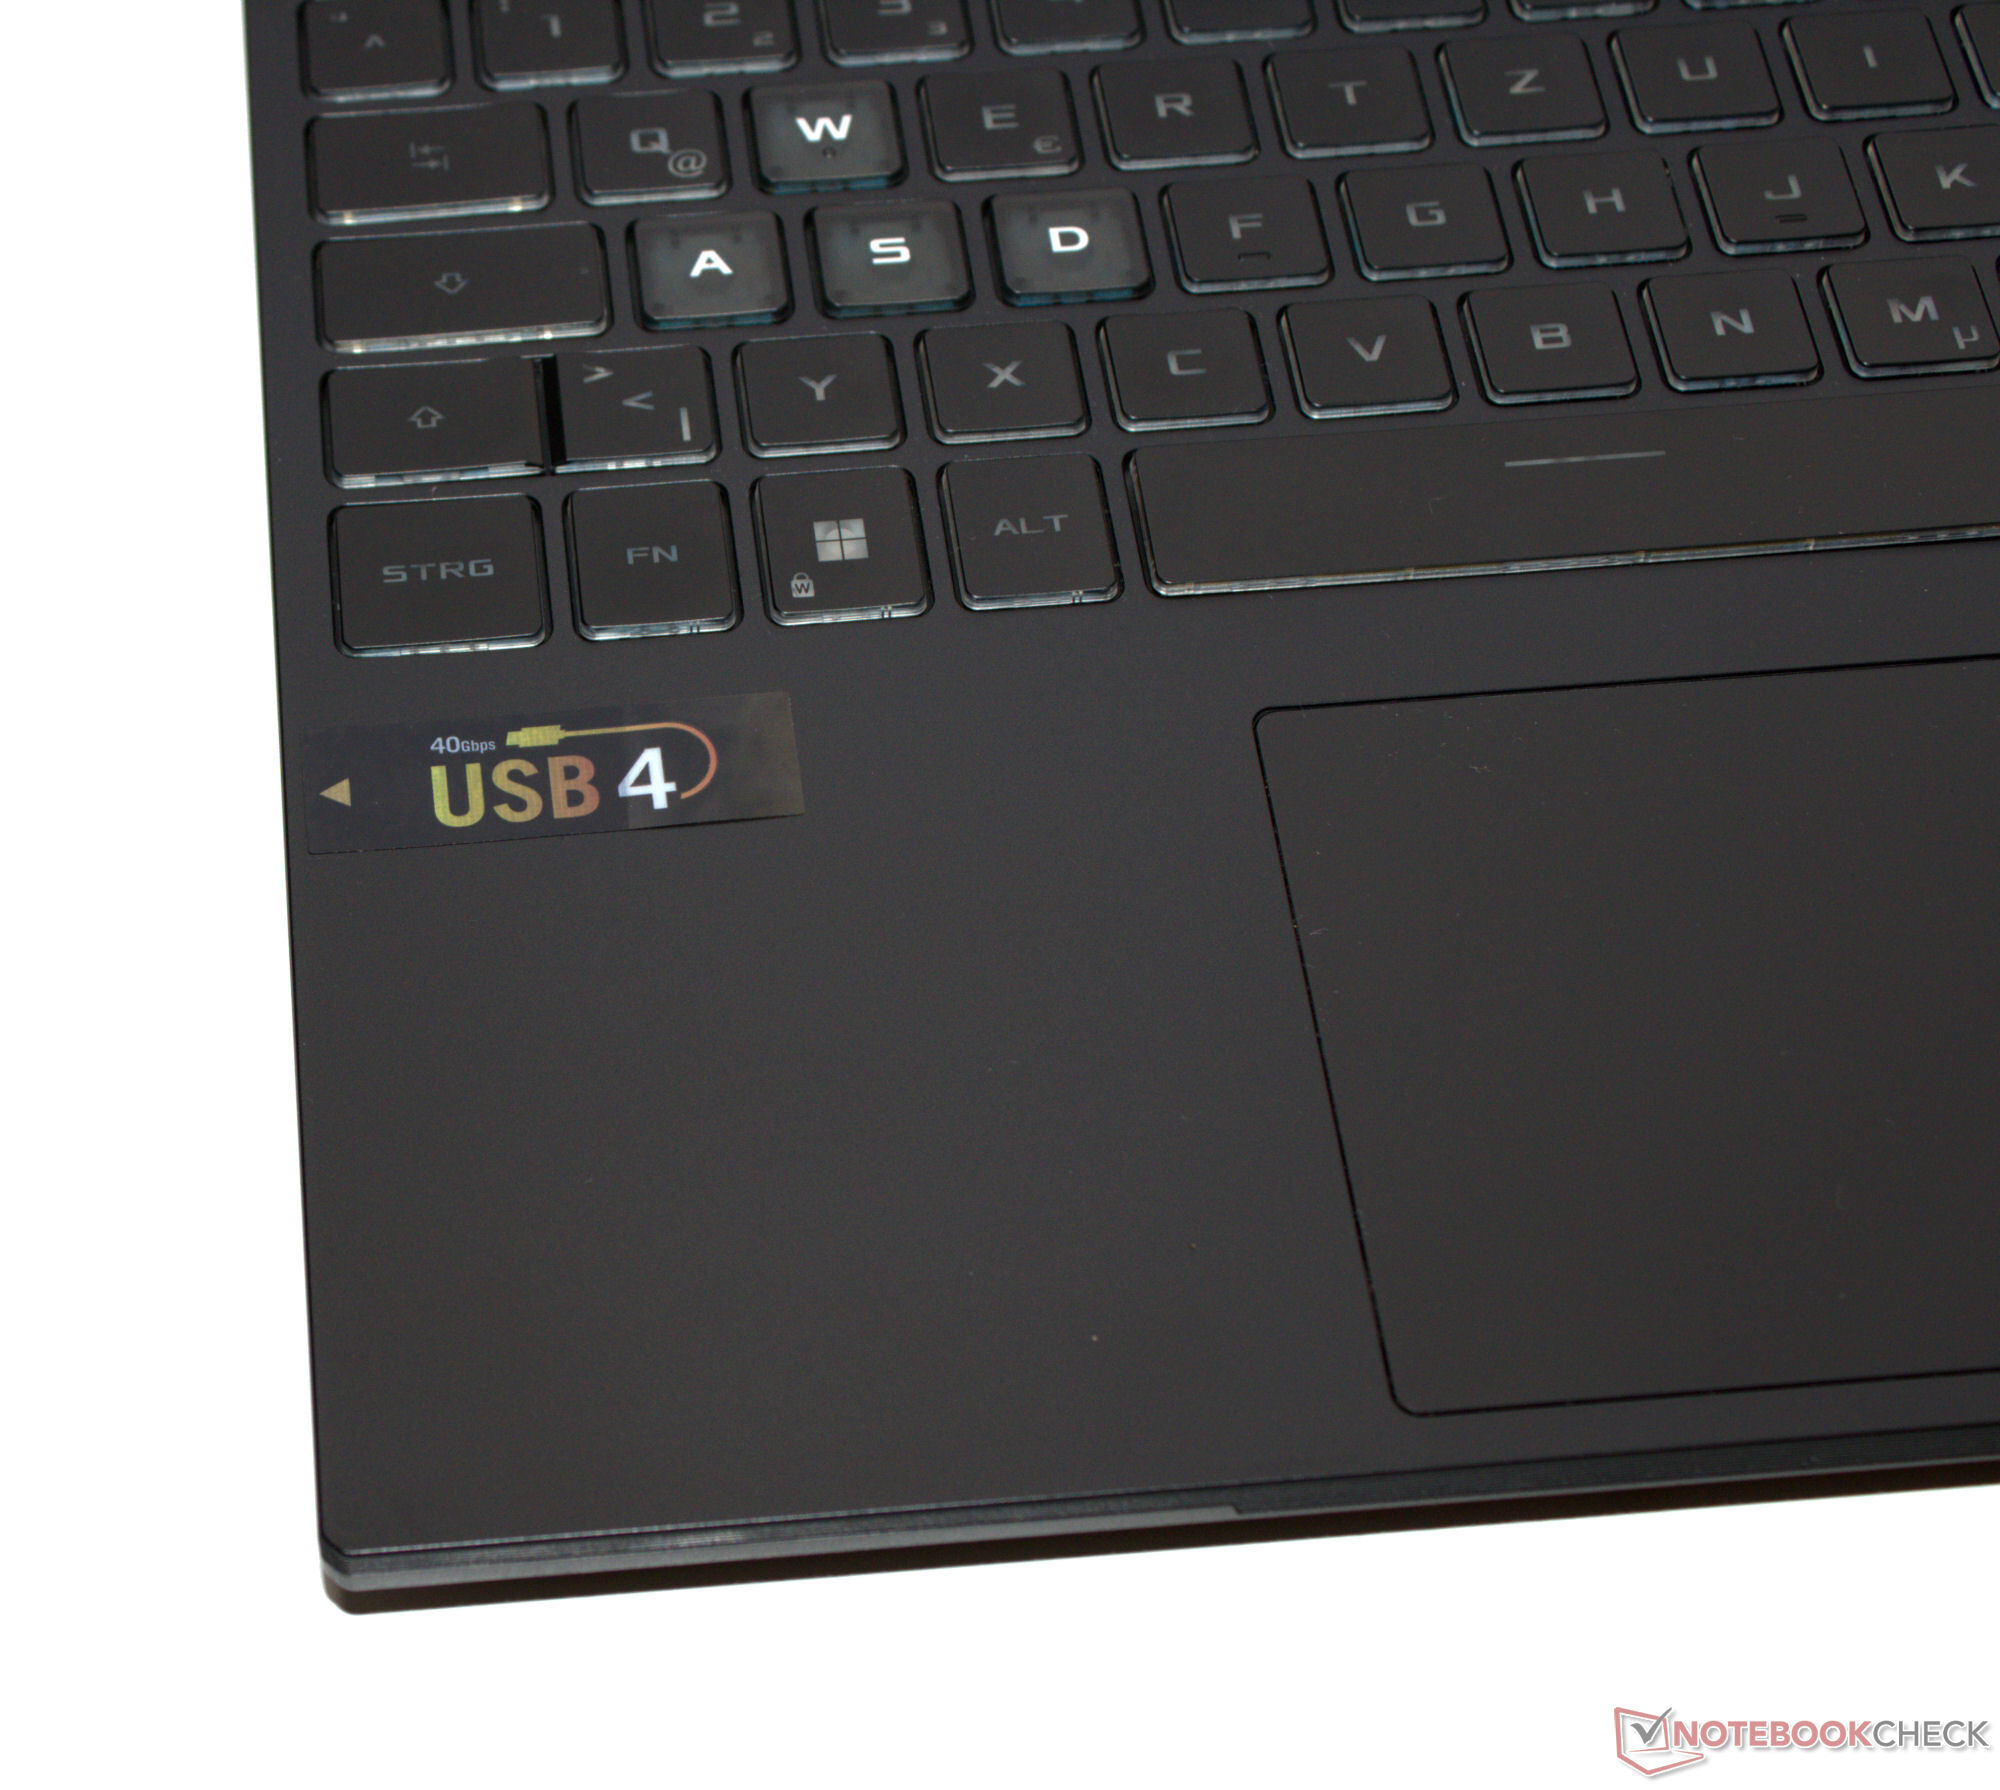
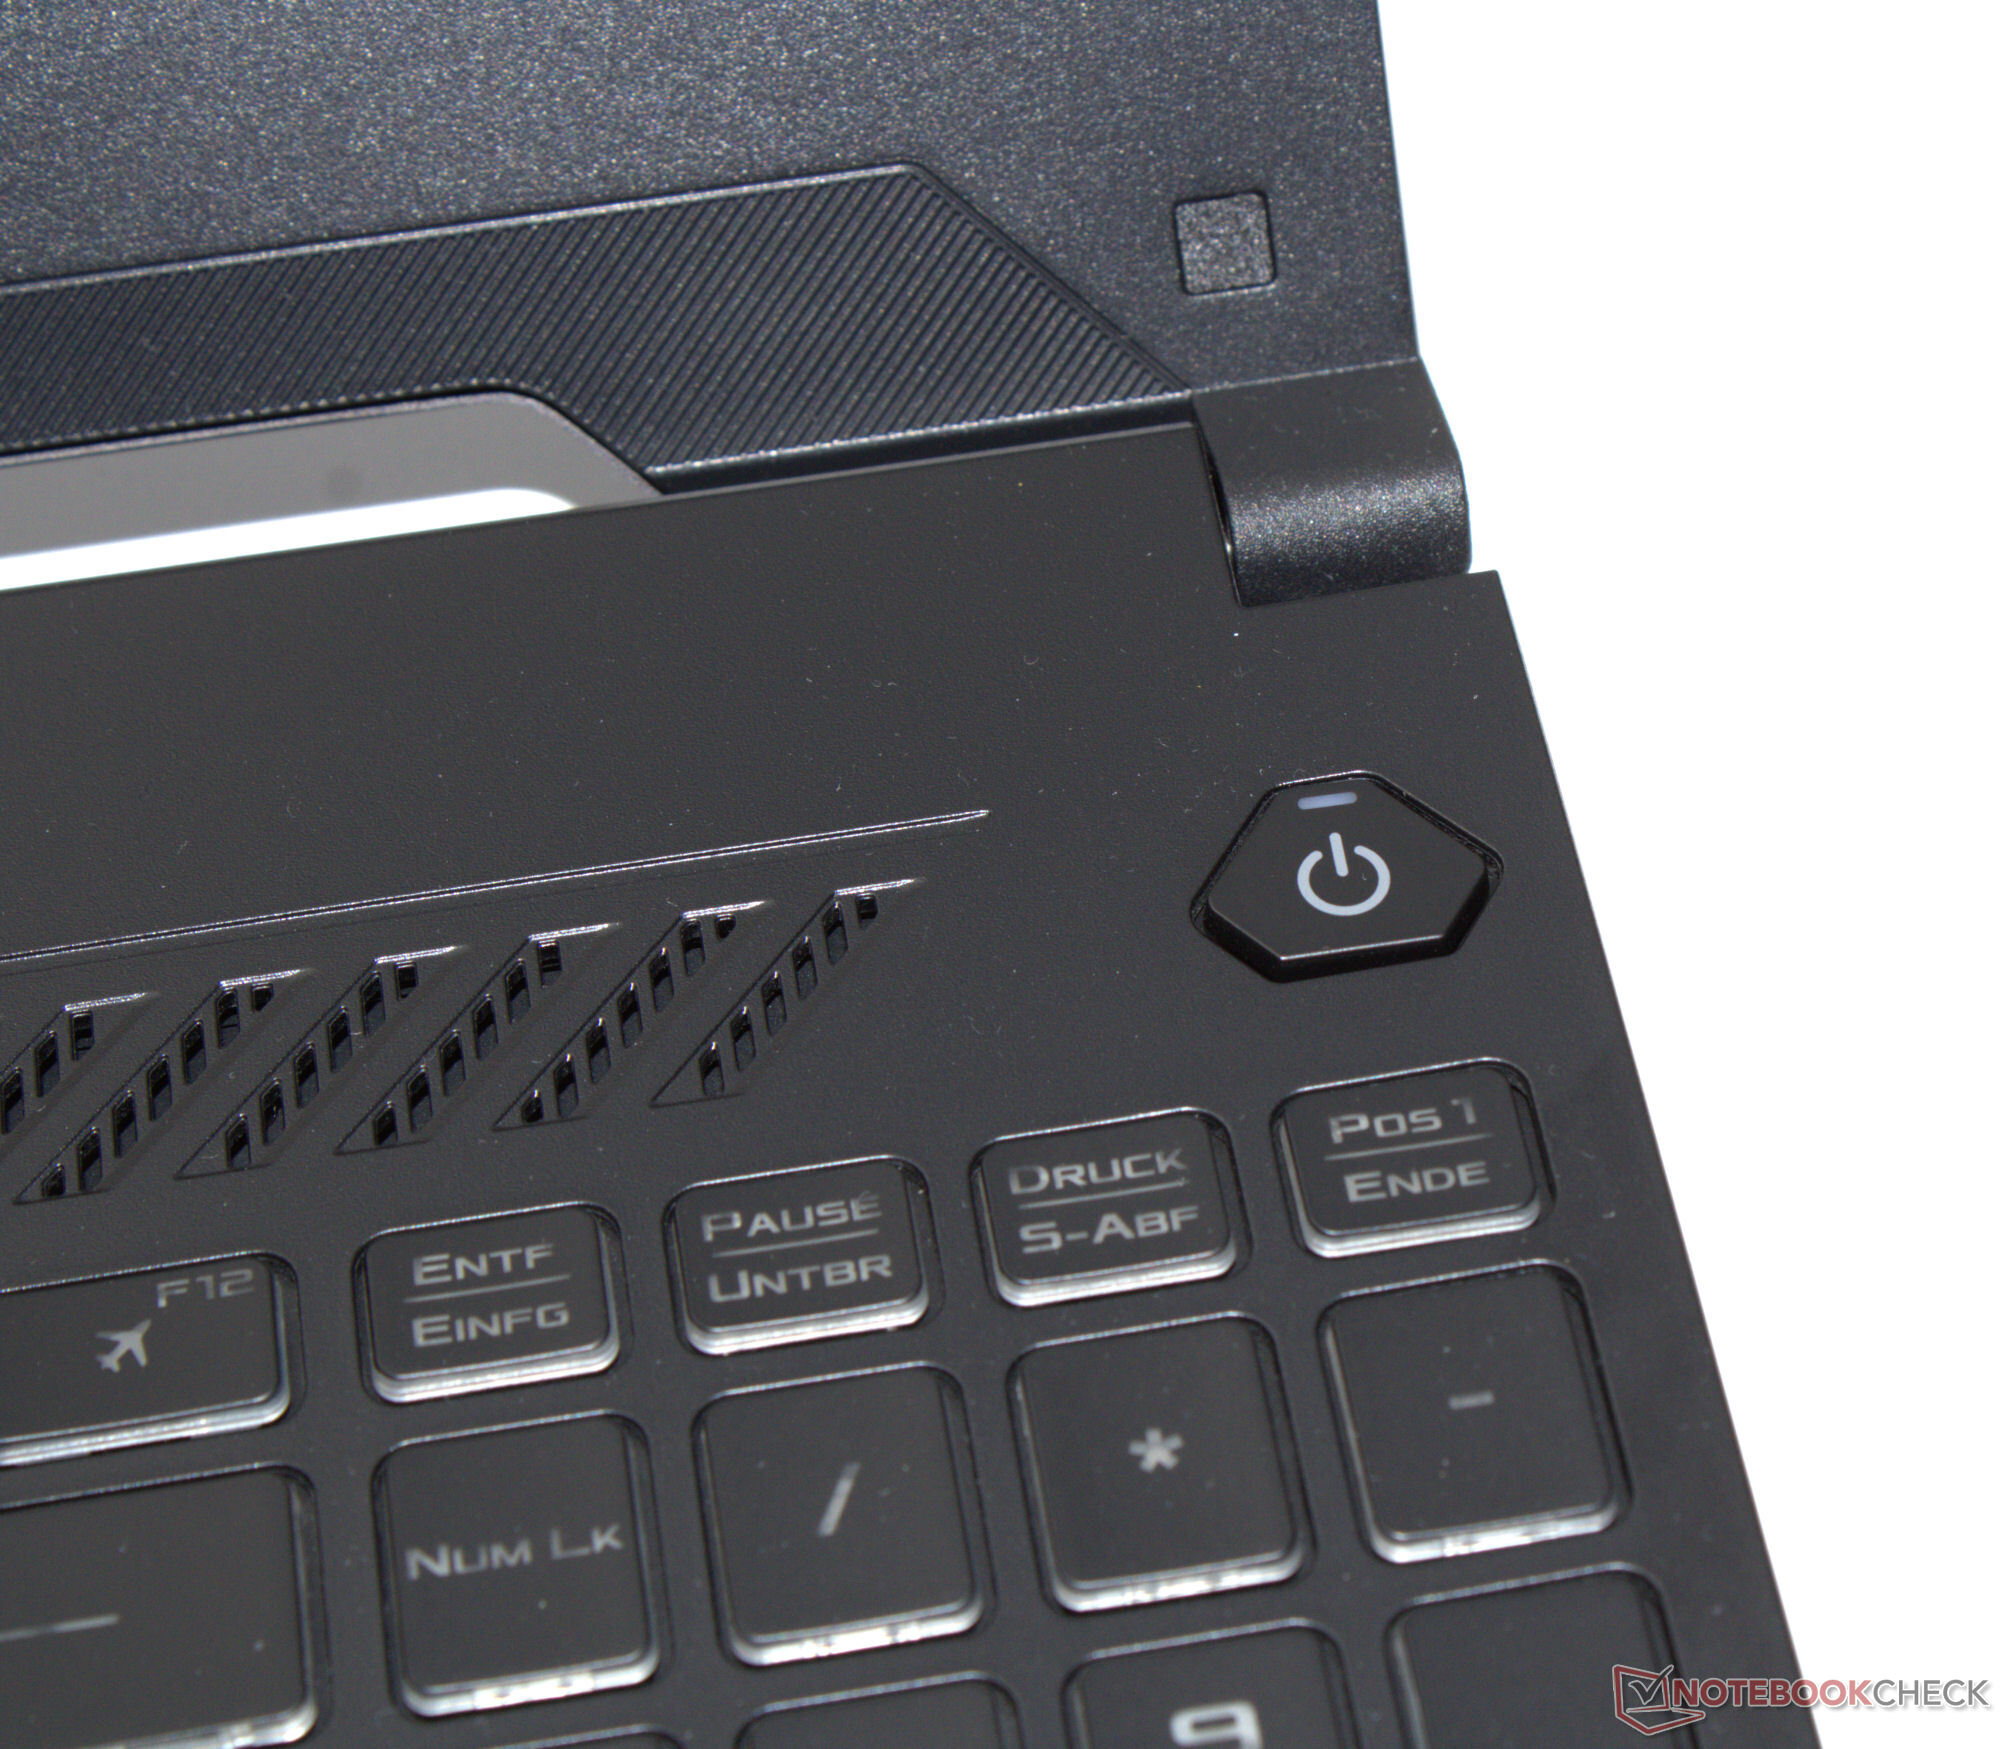
Case and features - Asus TUF and USB 4
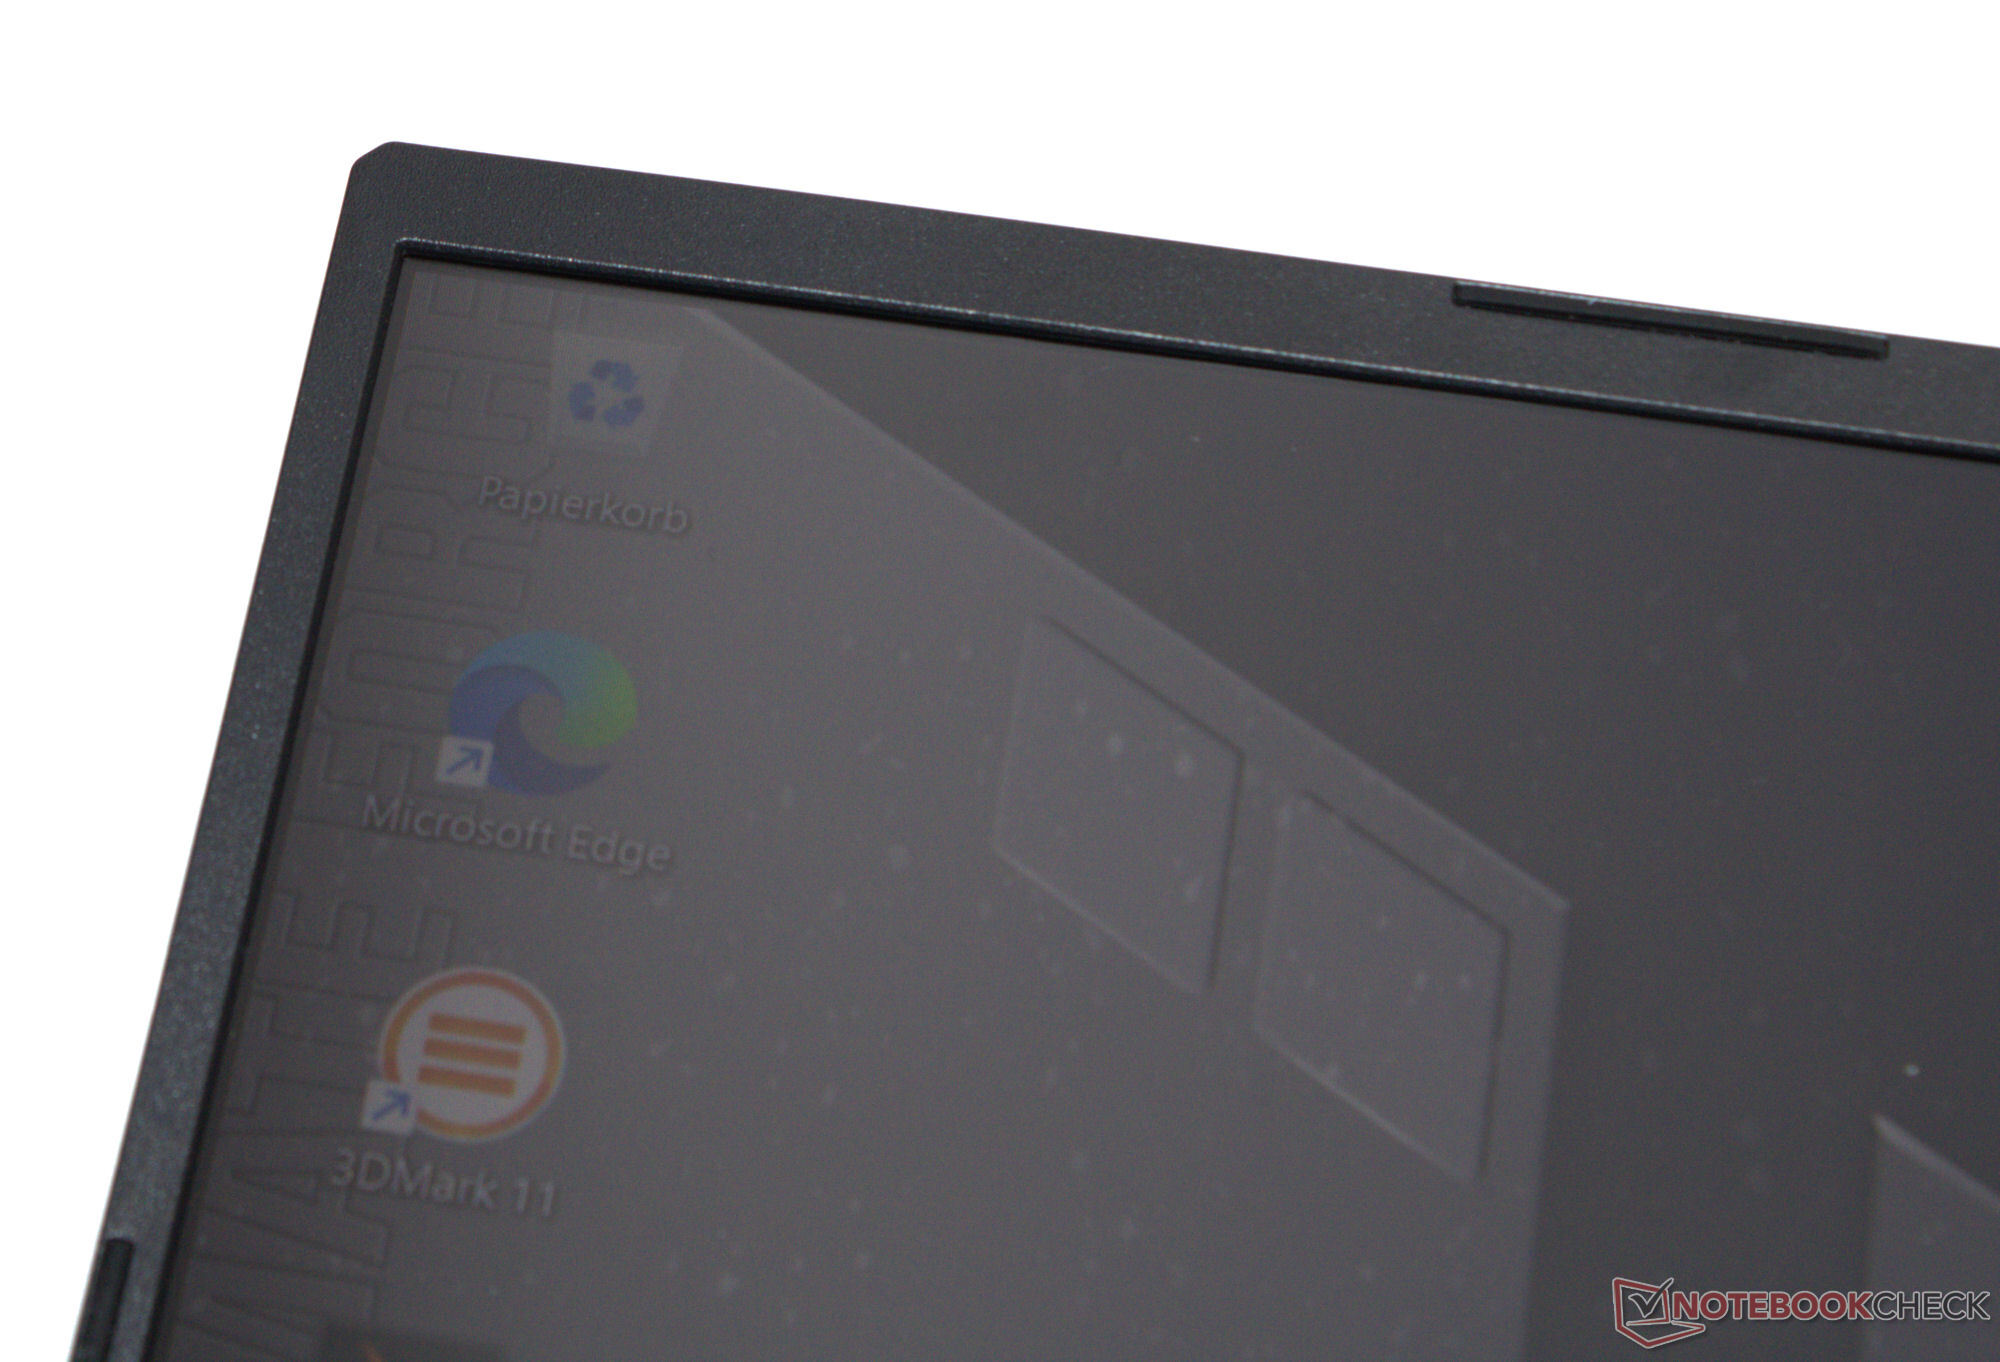
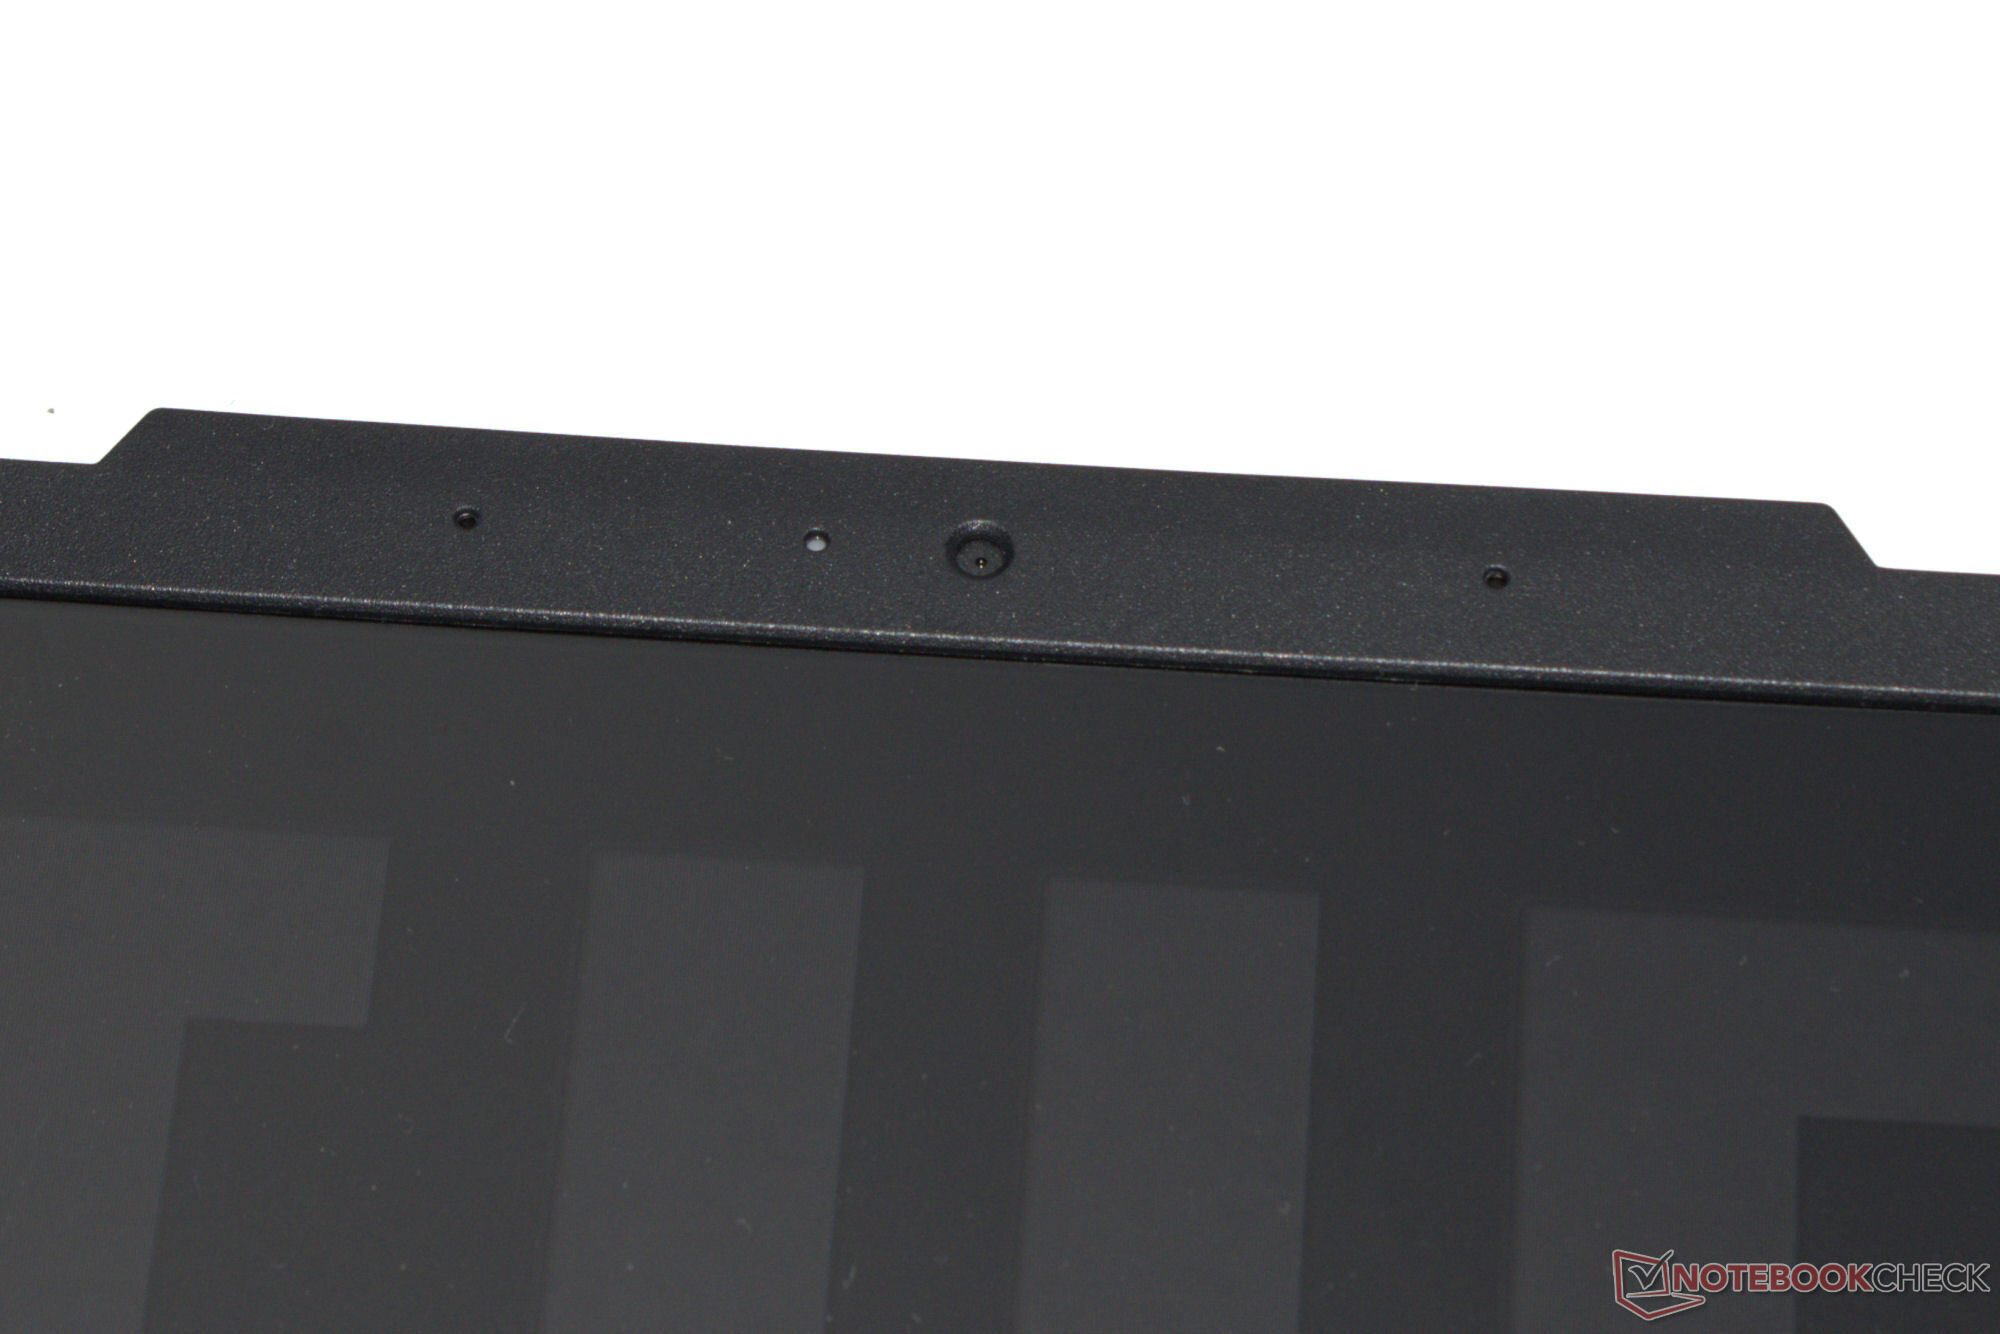
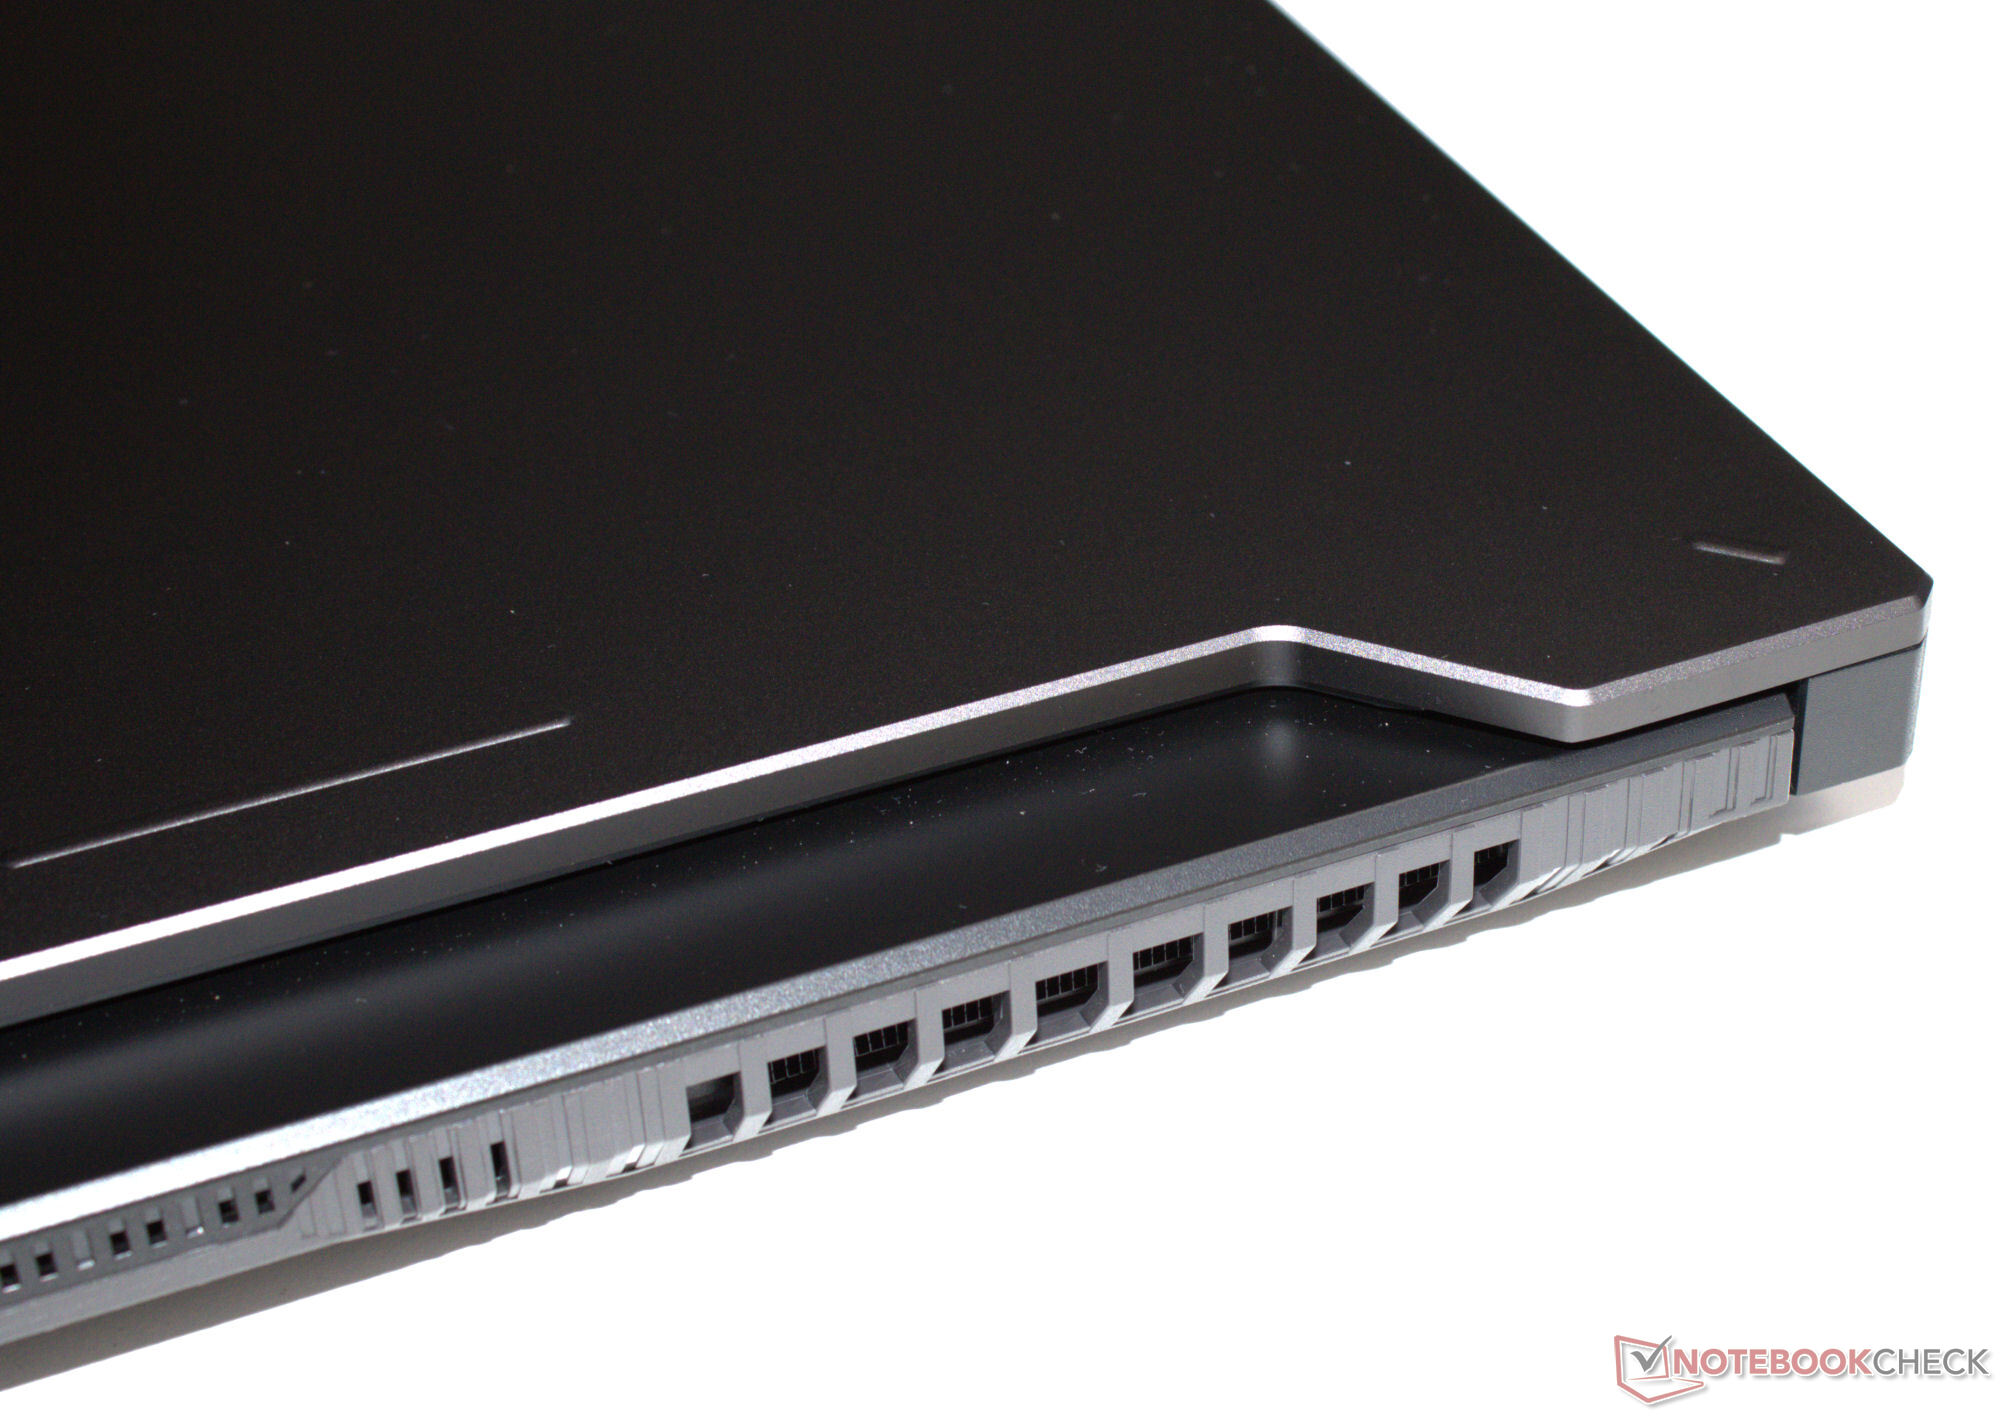
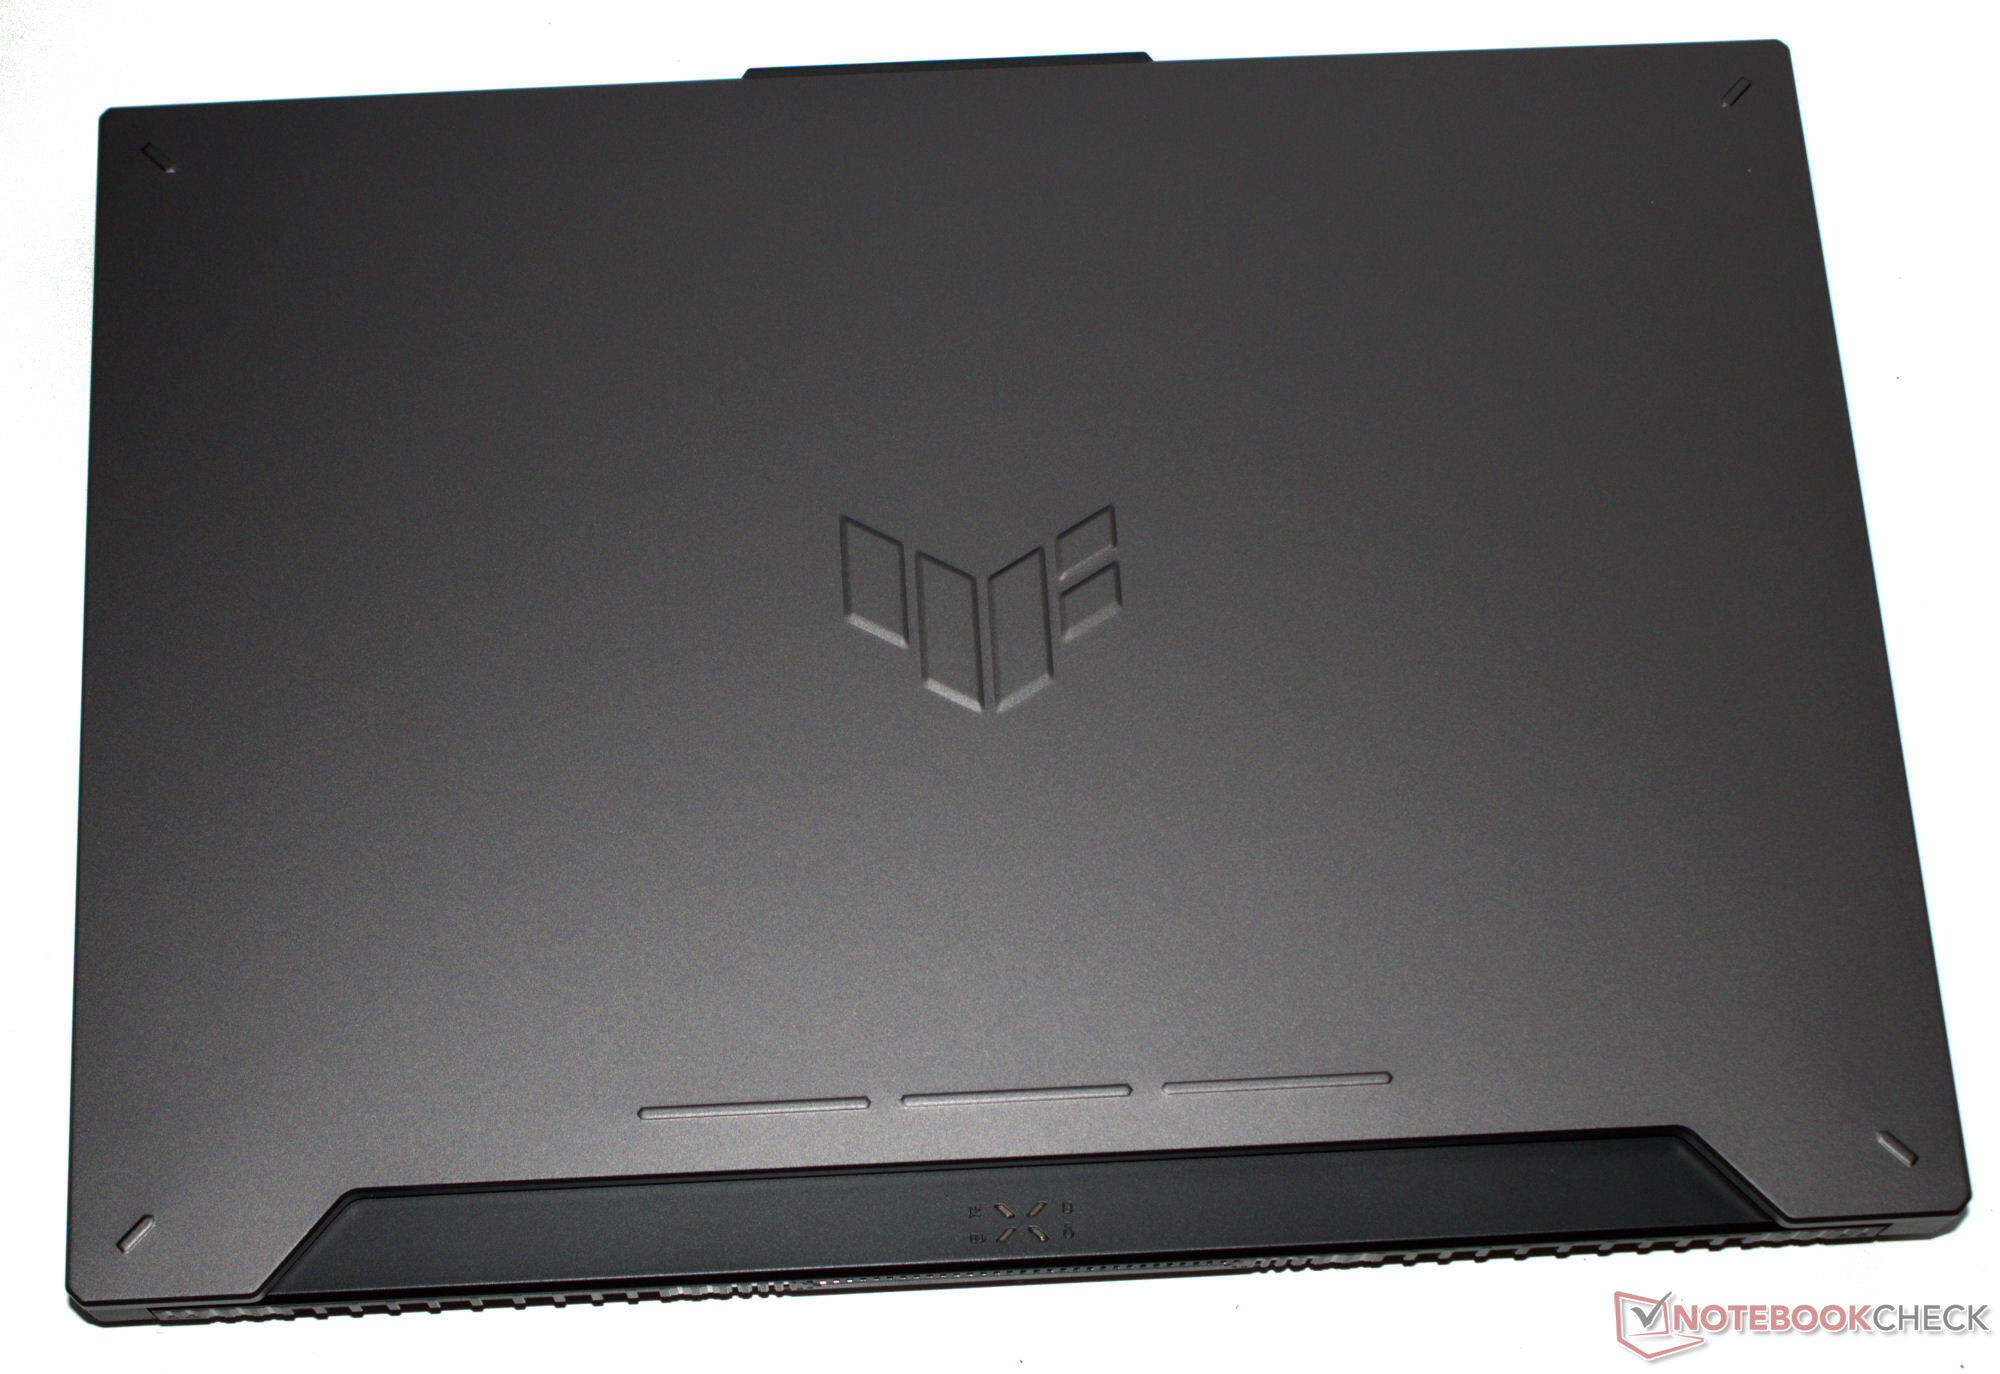
The gray (Mecha Gray), matte, smooth surfaced chassis is already well-known from last year’s A15. There are no stability problems and the base unit (plastic) and lid (metal rear) can be twisted within acceptable limits. The lid has a maximum opening angle of around 130 degrees.
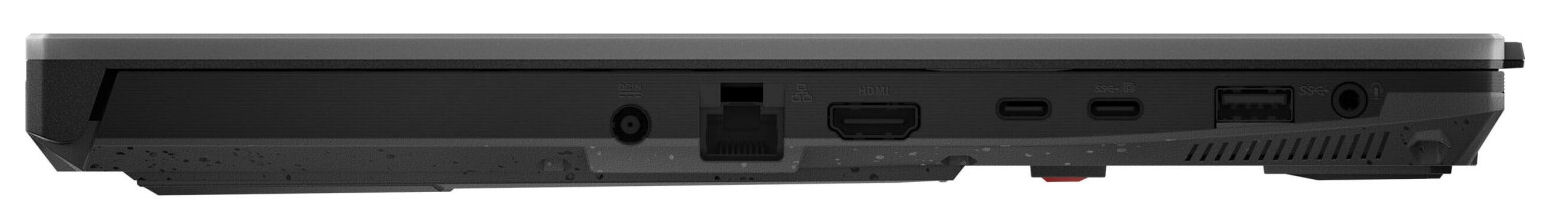
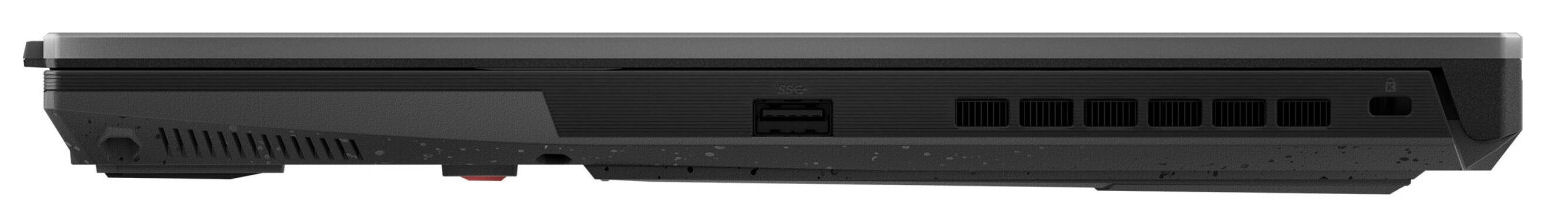
Most of the ports have been allocated space on the left-hand side of the computer. Among those are two USB-A ports (USB 3.2 Gen 1) and two USB-C connectors (1x USB 3.2 Gen 2, 1x USB 4). The latter supports DisplayPort Alt Mode and, in addition, the USB 3.2 port offers Power Delivery. This means the TUF has three video outputs (1x HDMI, 2x DP). The images produced by the webcam (0.9 MP, no shutter) won’t win any prizes. The A15 isn’t home to a memory card reader.
The Asus computer joins the ranks of entry-level laptops which use Realtek’s RTL8852BE chip (WiFi 6). The wireless chip delivers decent transfer speeds, falls short of reaching its potential and doesn’t manage to achieve the speeds seen in the competing Intel module. A Gigabit Ethernet controller (Realtek RTL8168/8111) is responsible for wired connections.

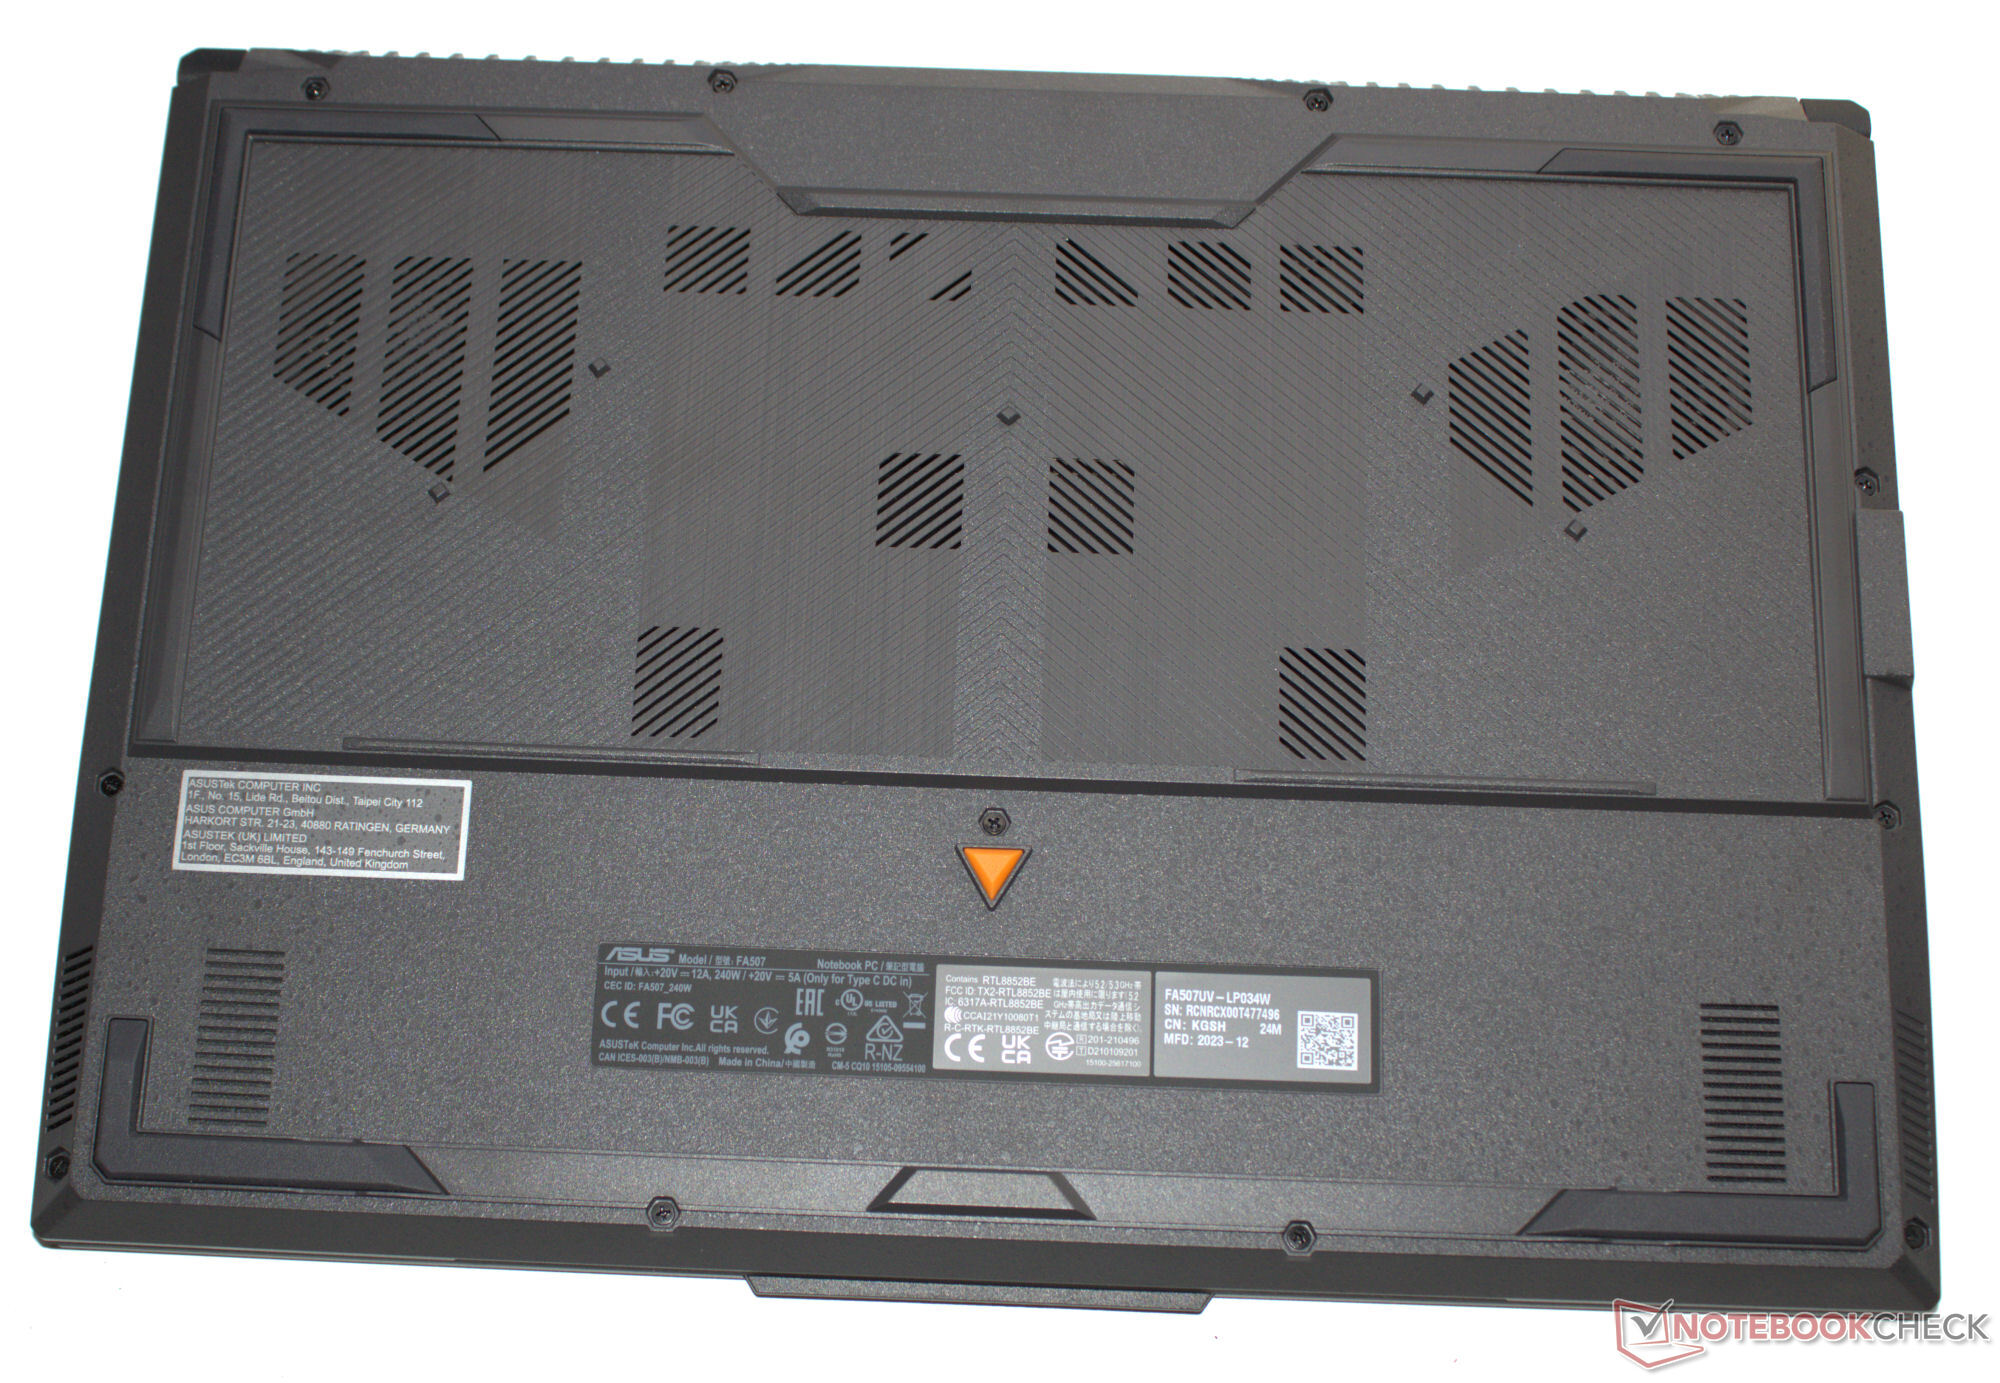


Sustainability
Inside the laptop box, you will mostly find cardboard and not a lot of plastic. The laptop is housed in a plastic fibre bag with a transparent case protecting the PSU from scratches. Last, but not least, there is also an insert which protects the display from scratches. In all three cases, the implemented plastics are specified.
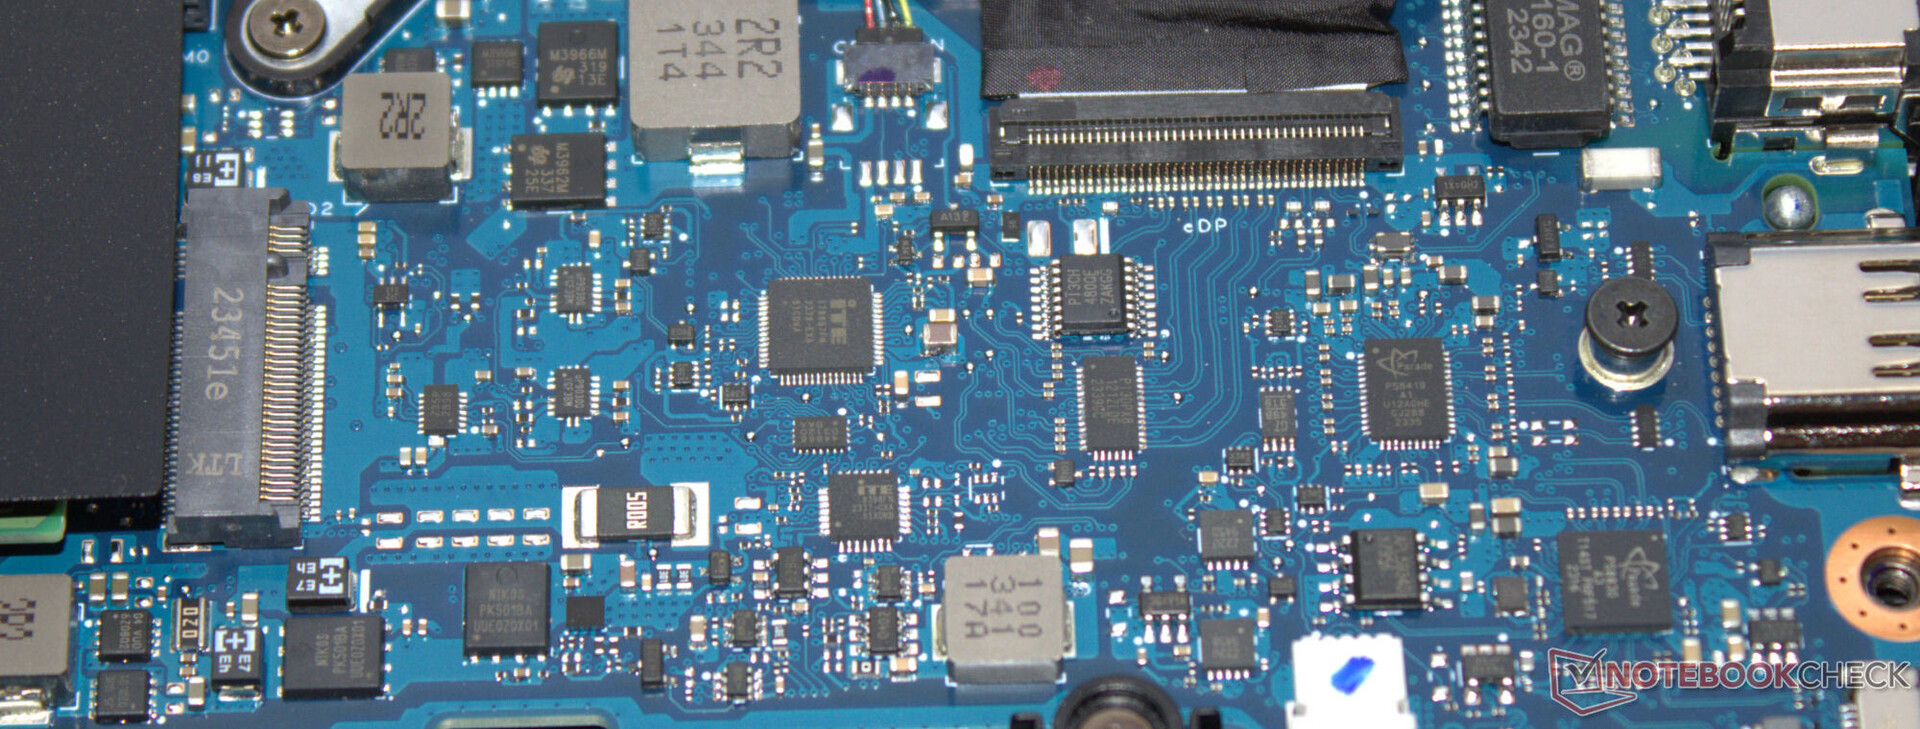
It ought to be easy to carry out repairs thanks to the removable base plate - the entire hardware is accessible. We weren’t confronted with any glued pasts inside the device. Software updates shouldn’t be an issue in the coming years. The laptop itself has an EPEAT bronze label.
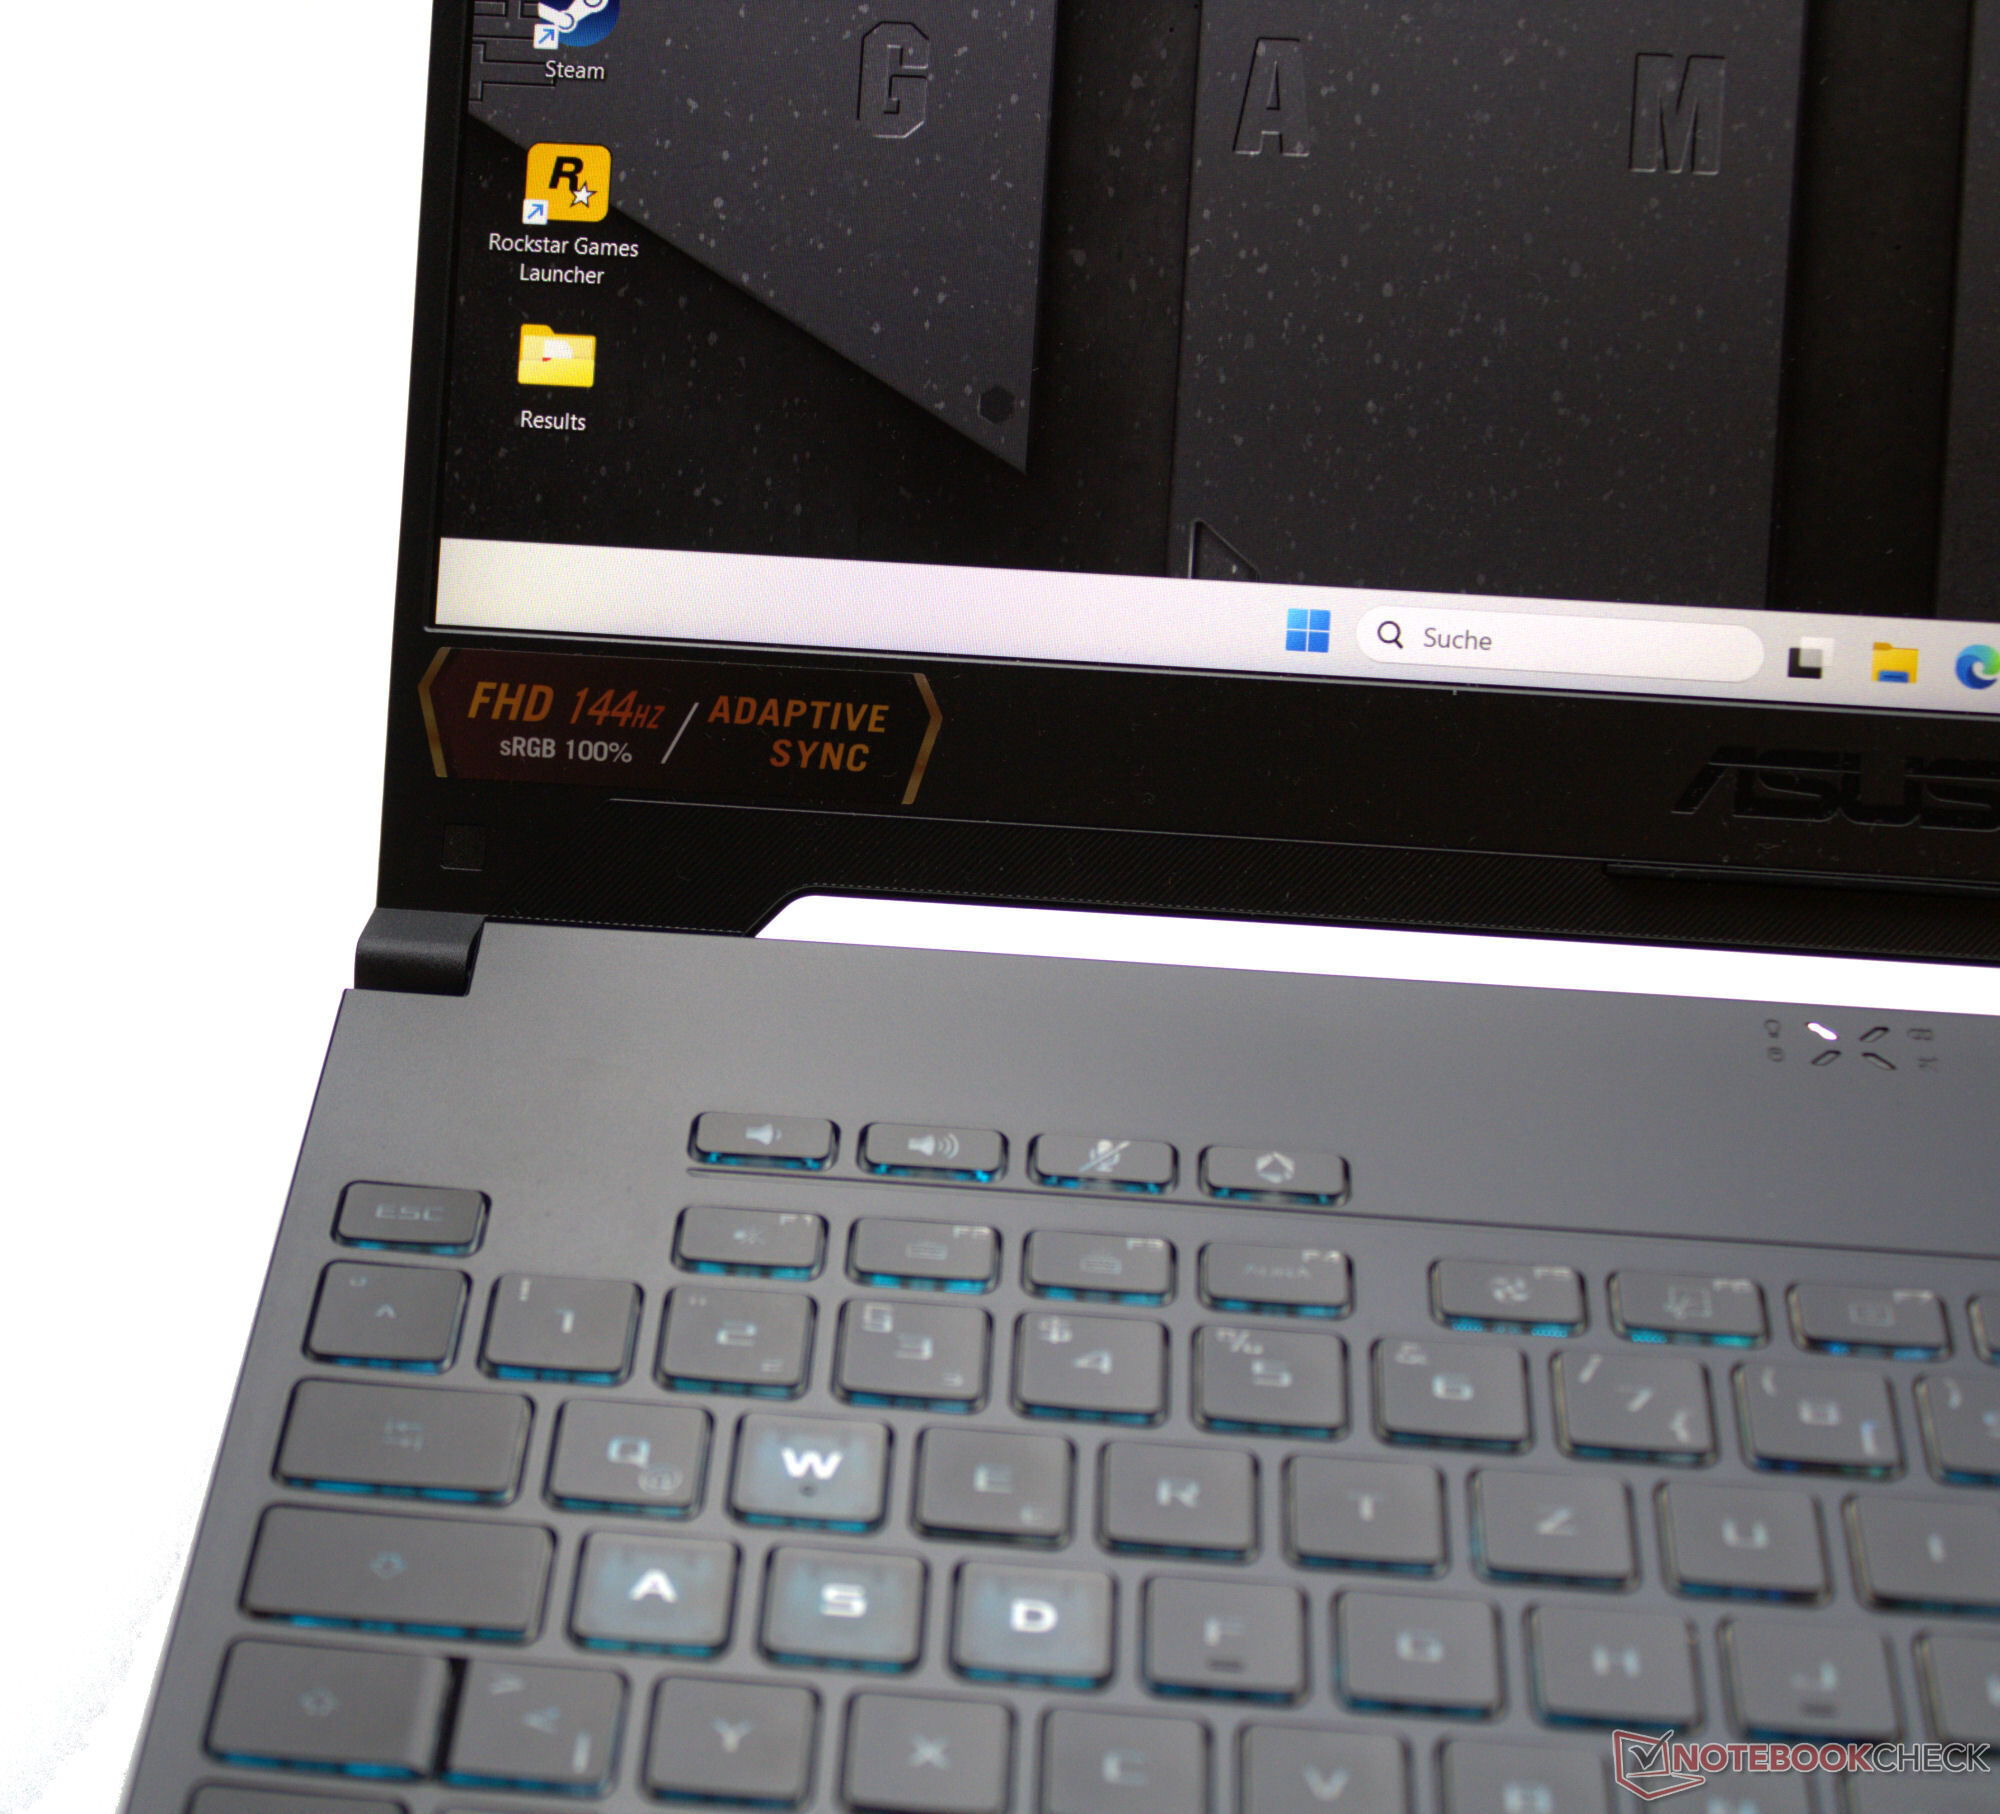
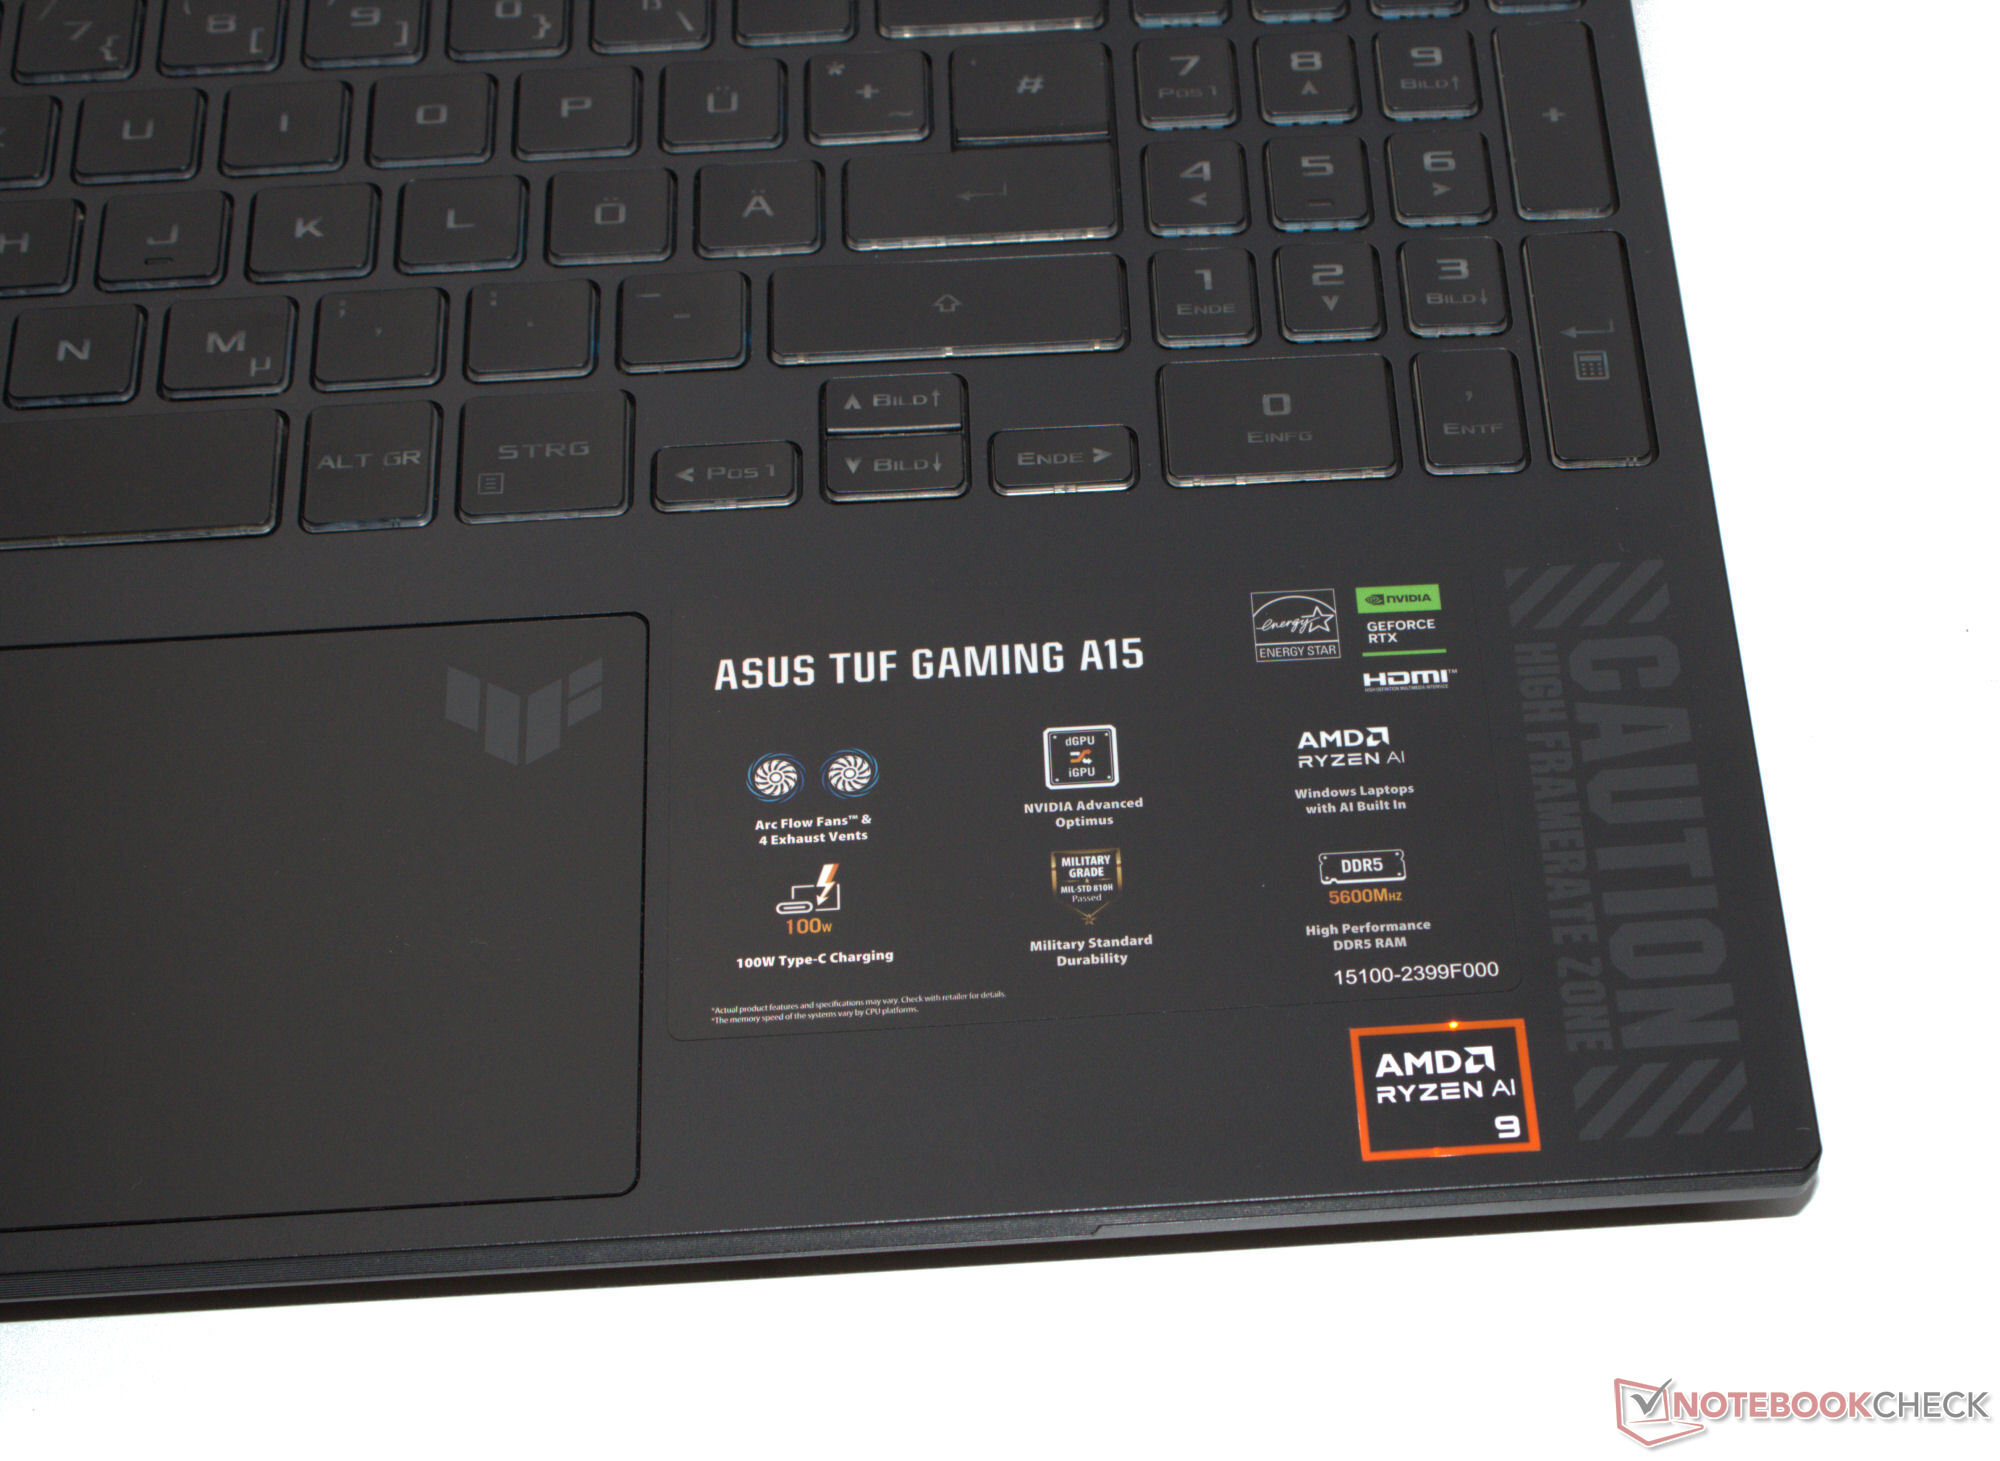
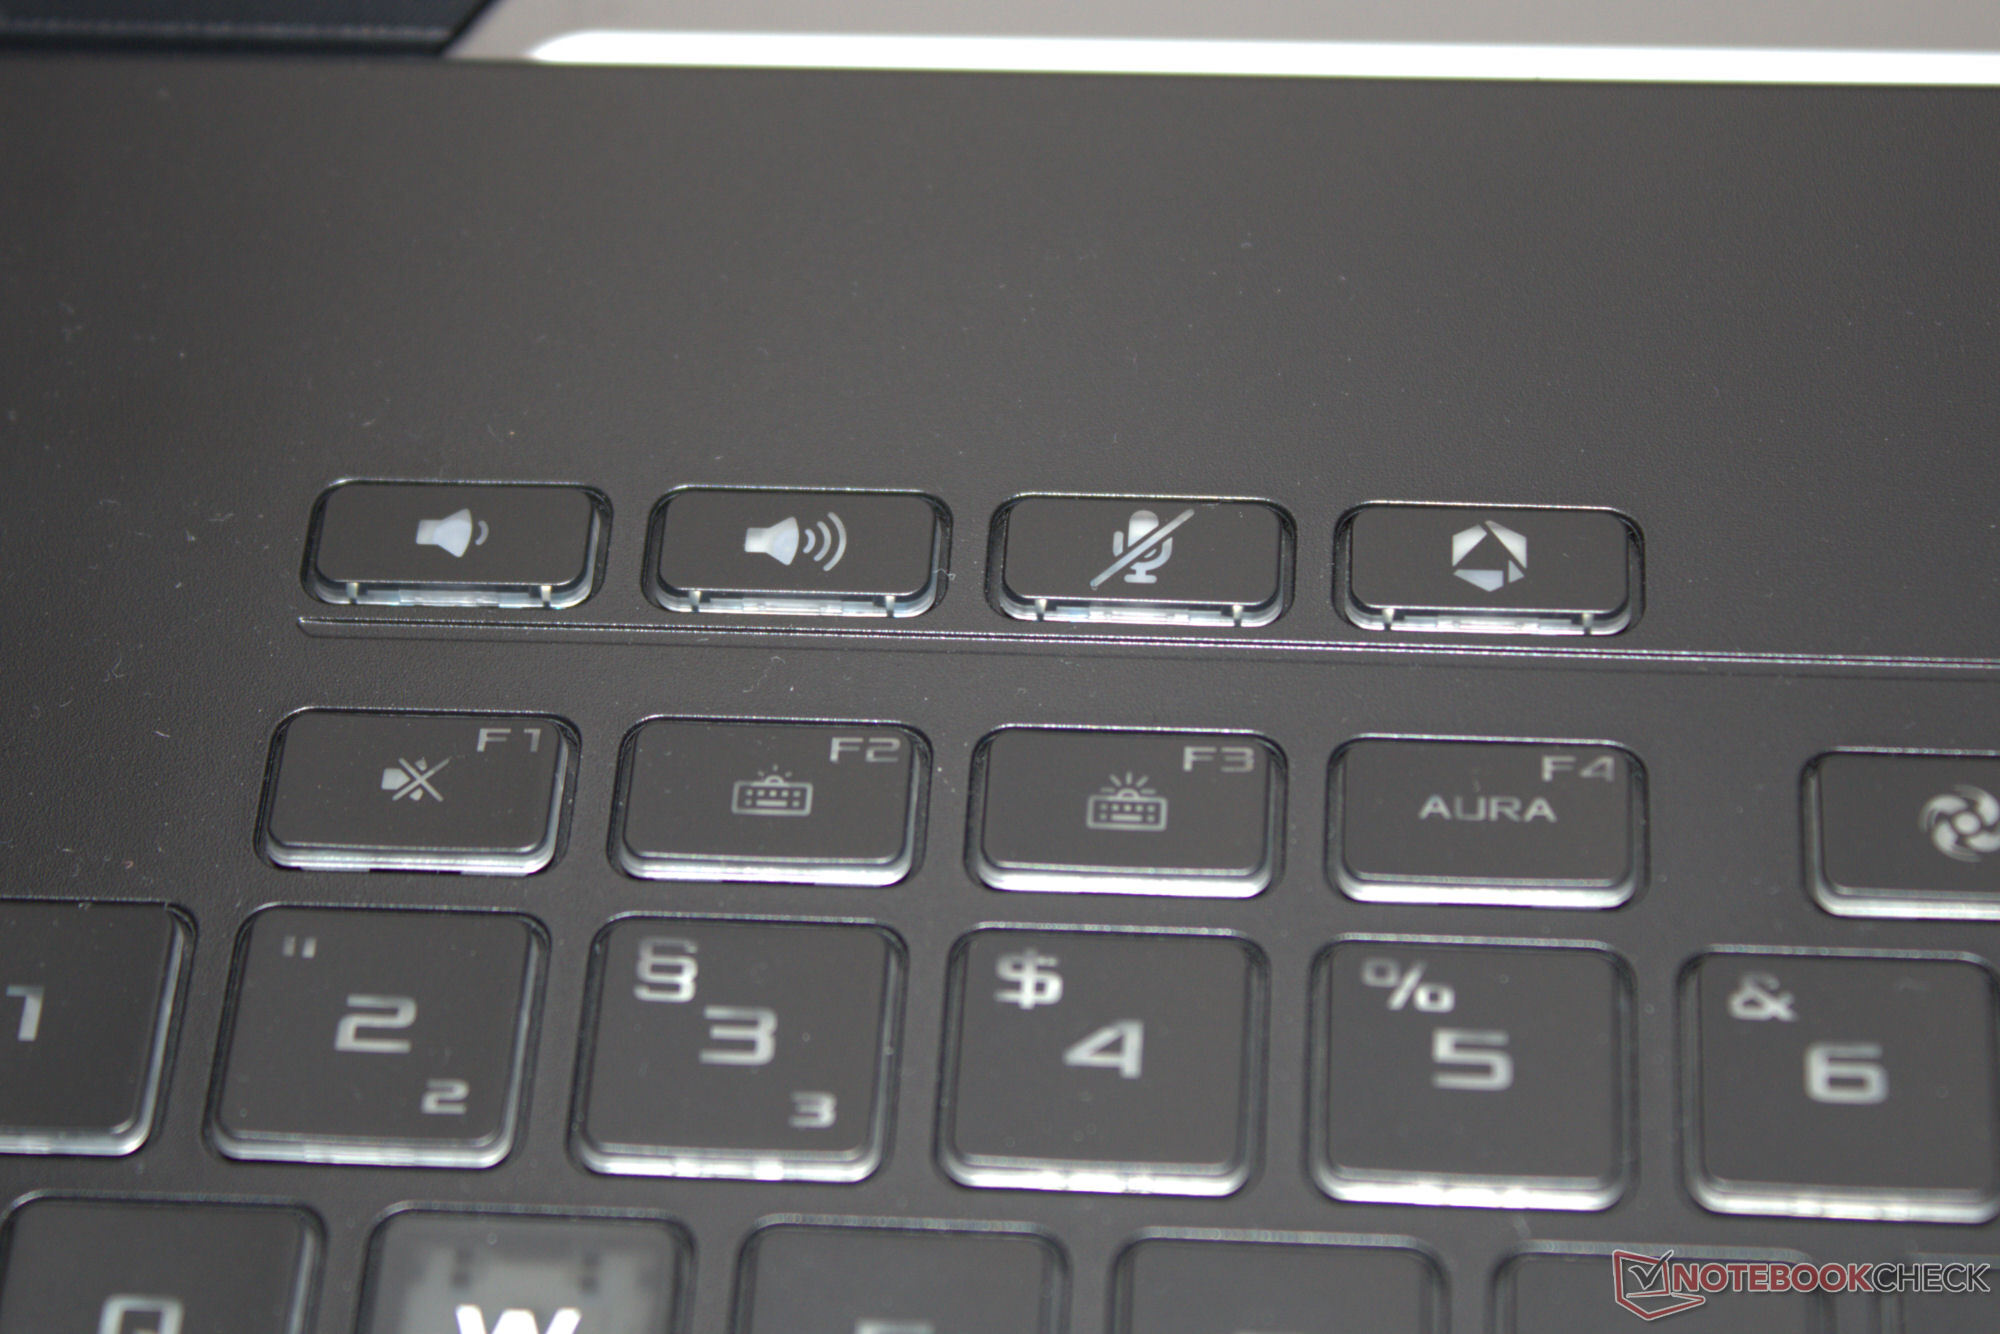
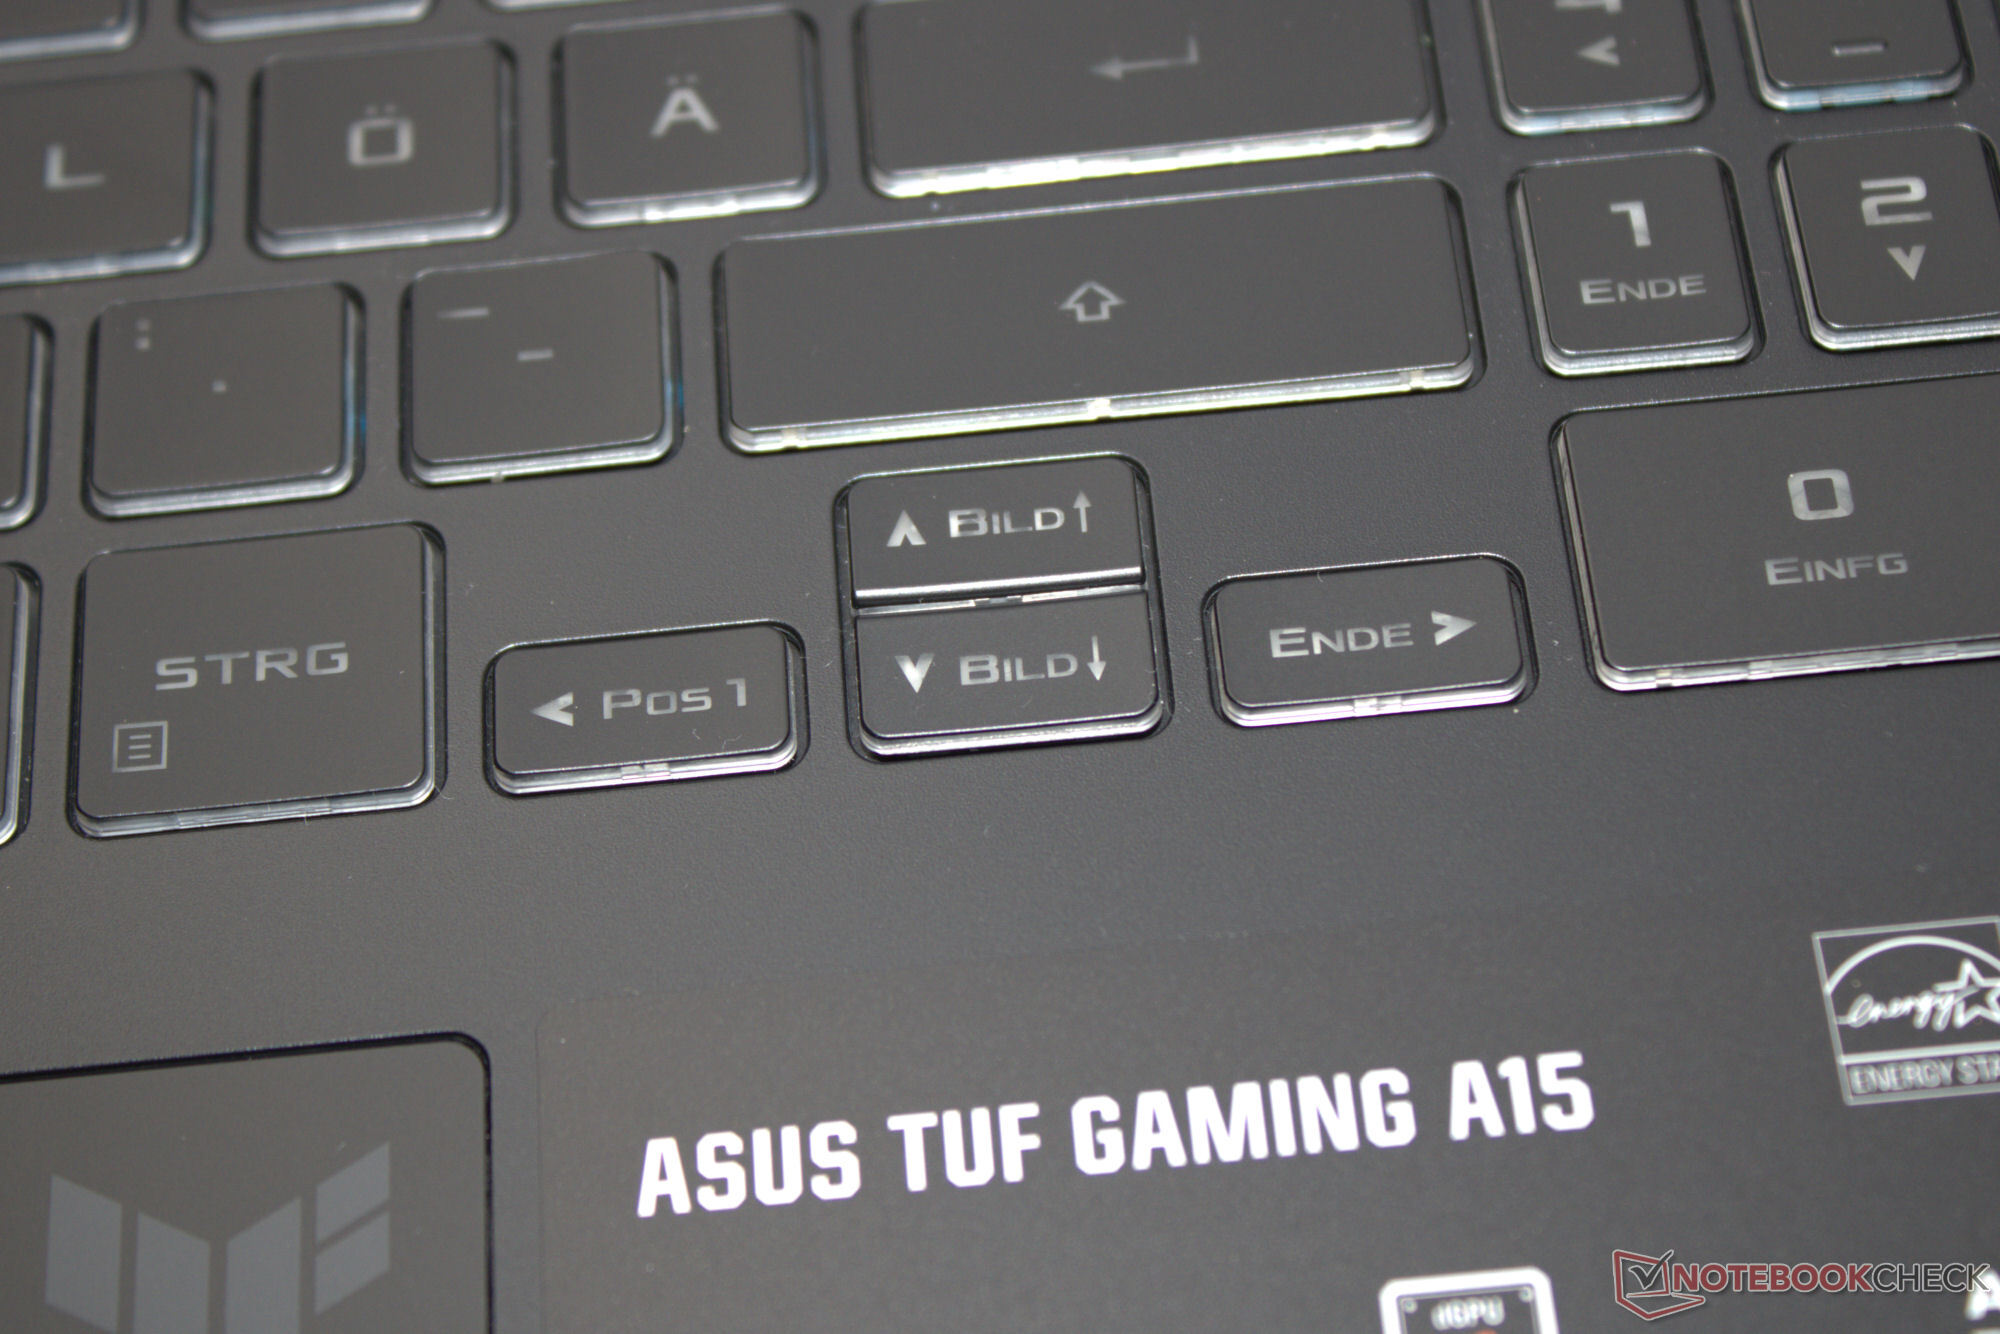
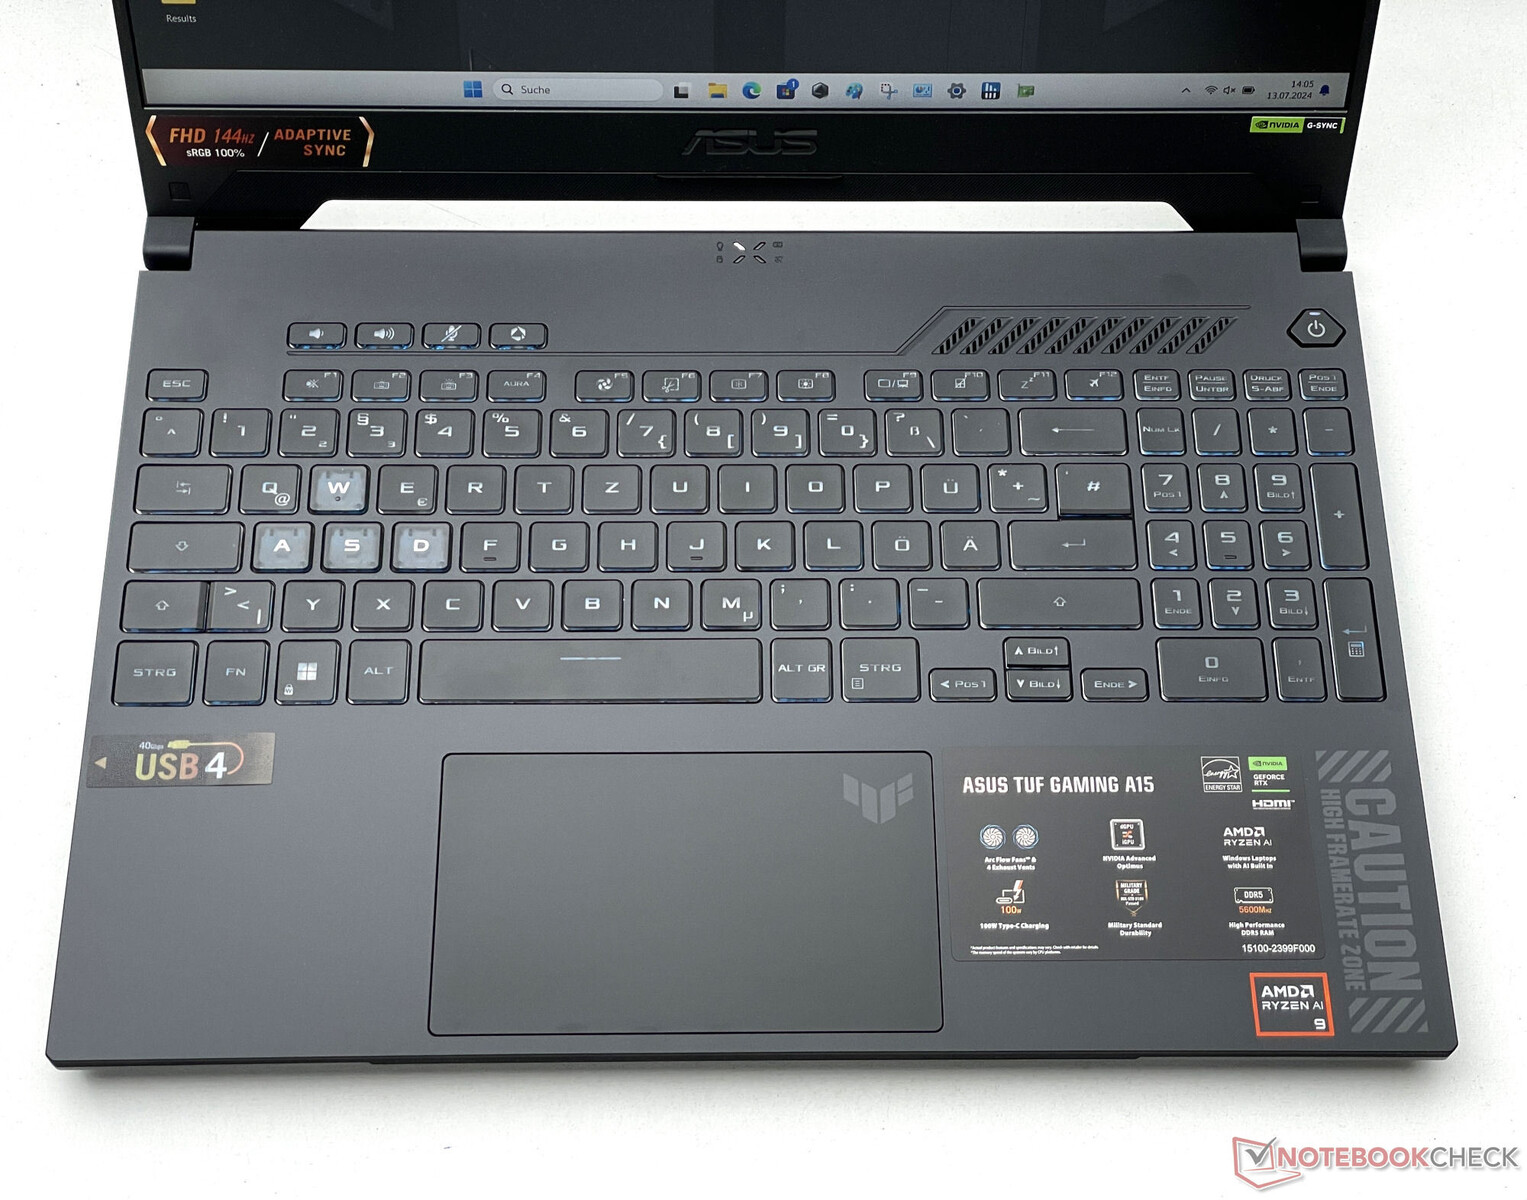
Input devices - The A15 has small arrow keys
Asus uses the full width of the device for the backlit chiclet keyboard (RGB) - this means there is space for a numerical pad. Its smooth keys have medium travel and a distinct pressure point. The key resistance is decent. When typing, the keyboard doesn’t flex. What is noticeable is that the arrow key and the "Enter" key are small and the control keys (W, A, S, D) are a different color. The multitouch clickpad (around 13 x 7.7 cm) has short travel, a distinct pressure point and serves as a replacement mouse.
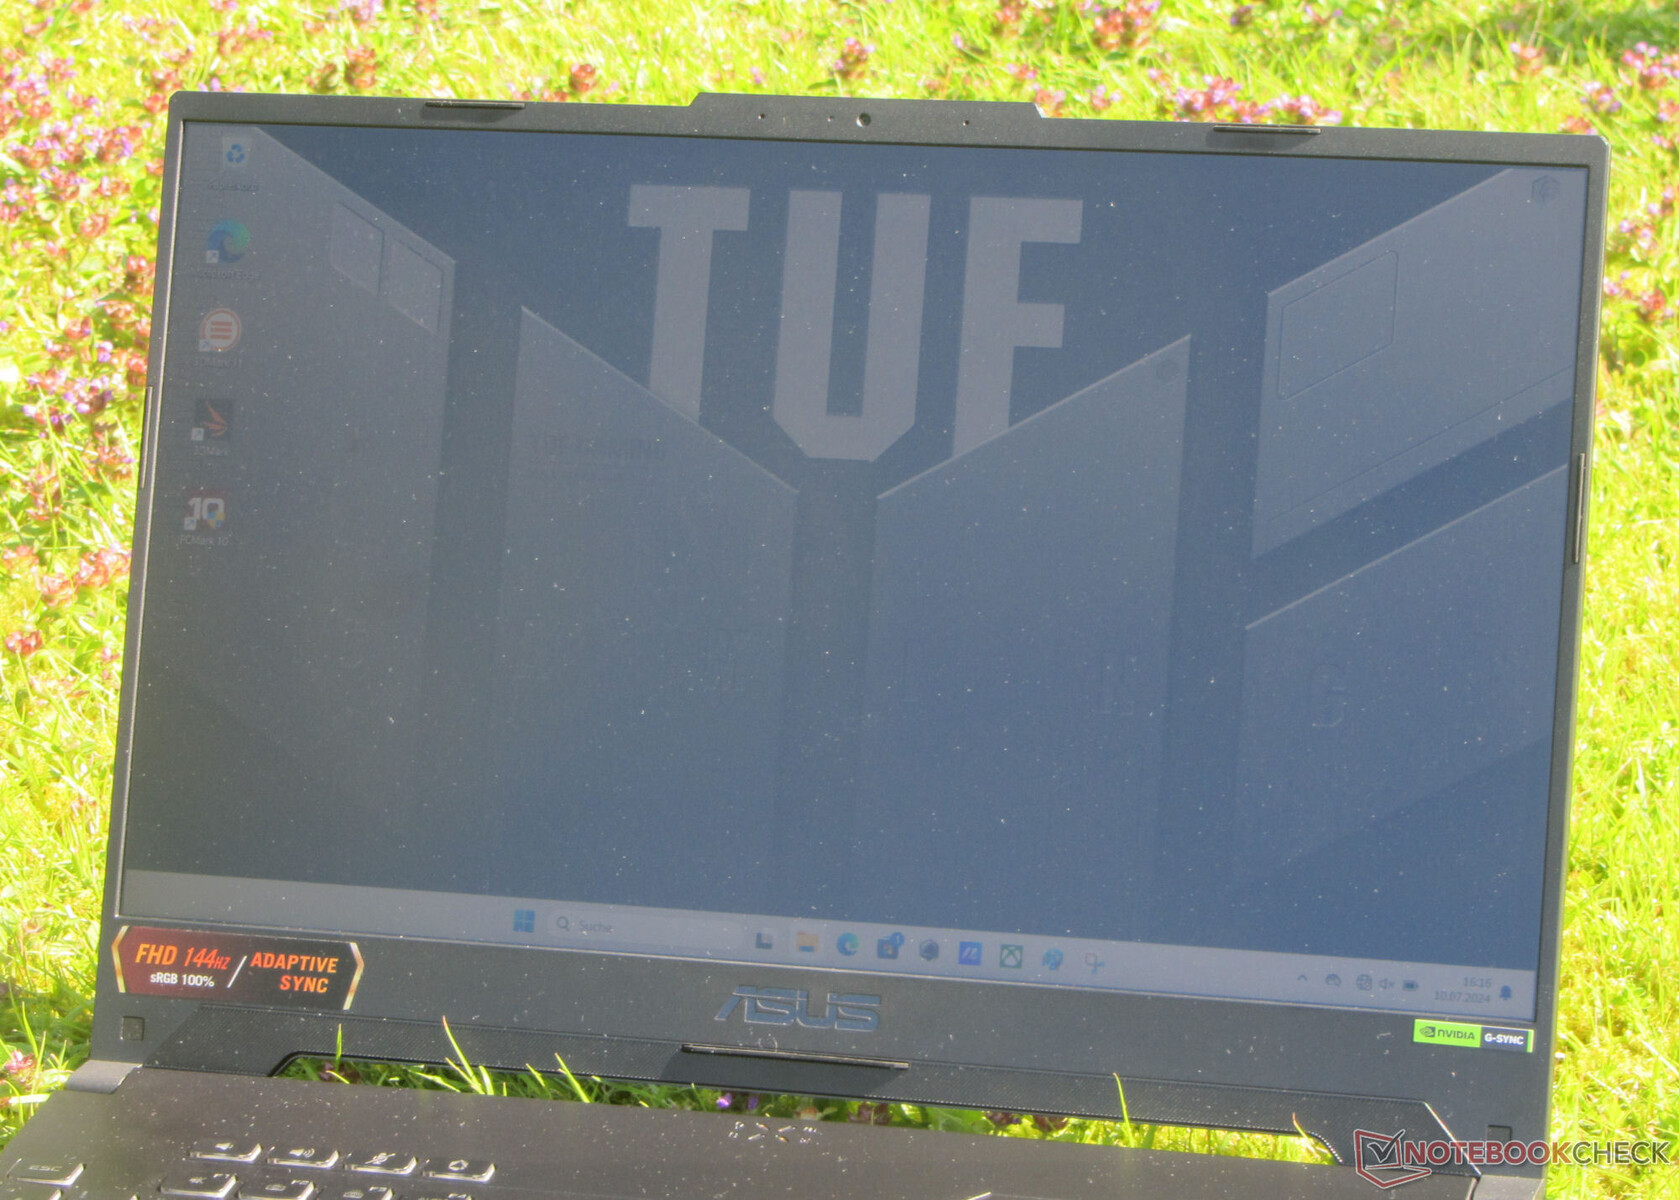
Display - IPS on board
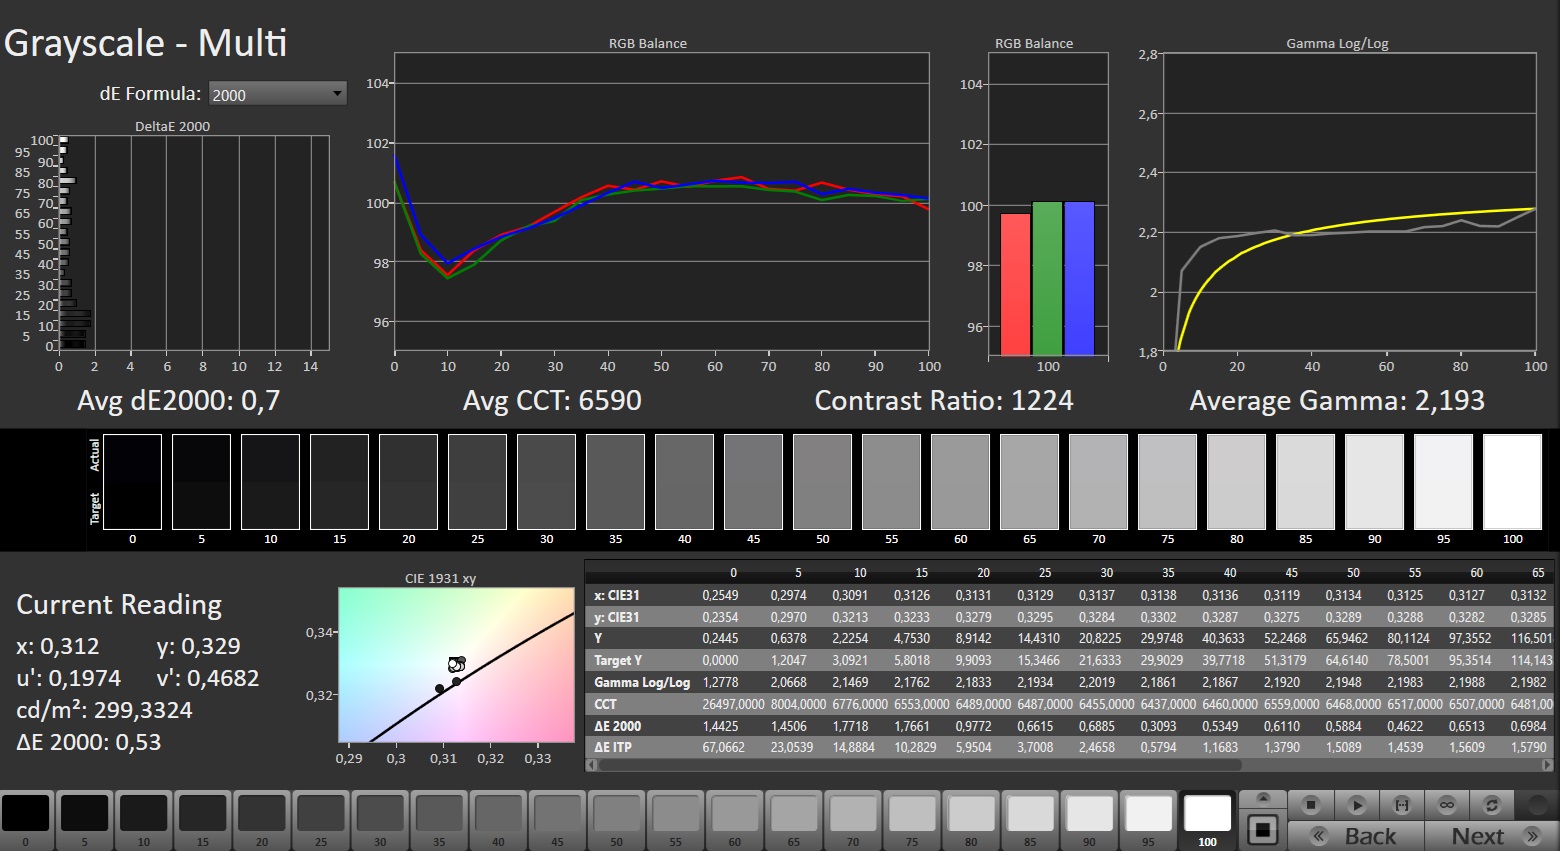
Asus has fitted the device with a 16:9, matte, 15.6-inch display (FHD, IPS, 144 Hz, G-Sync) that has stable viewing angles. When it comes to brightness and contrast, the panel doesn't deliver best-in-class figures but it still does what it should and this makes it predestined for indoor use. Reading outdoors would be possible in any conditions other than bright sunlight. We were unable to detect any PWM flickering.

| |||||||||||||||||||||||||
Brightness Distribution: 90 %
Center on Battery: 315 cd/m²
Contrast: 1260:1 (Black: 0.25 cd/m²)
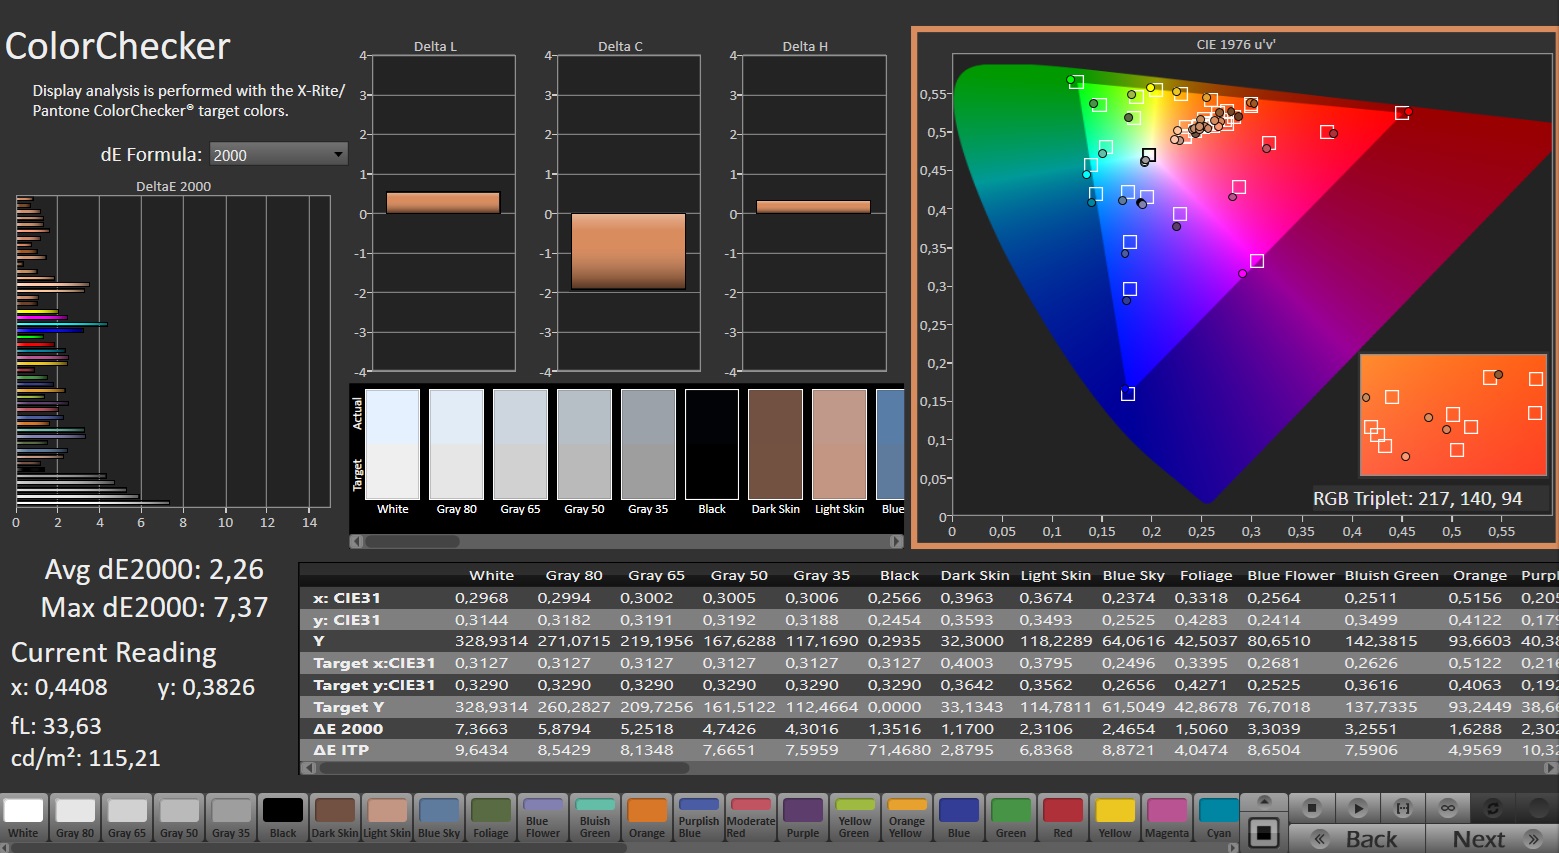
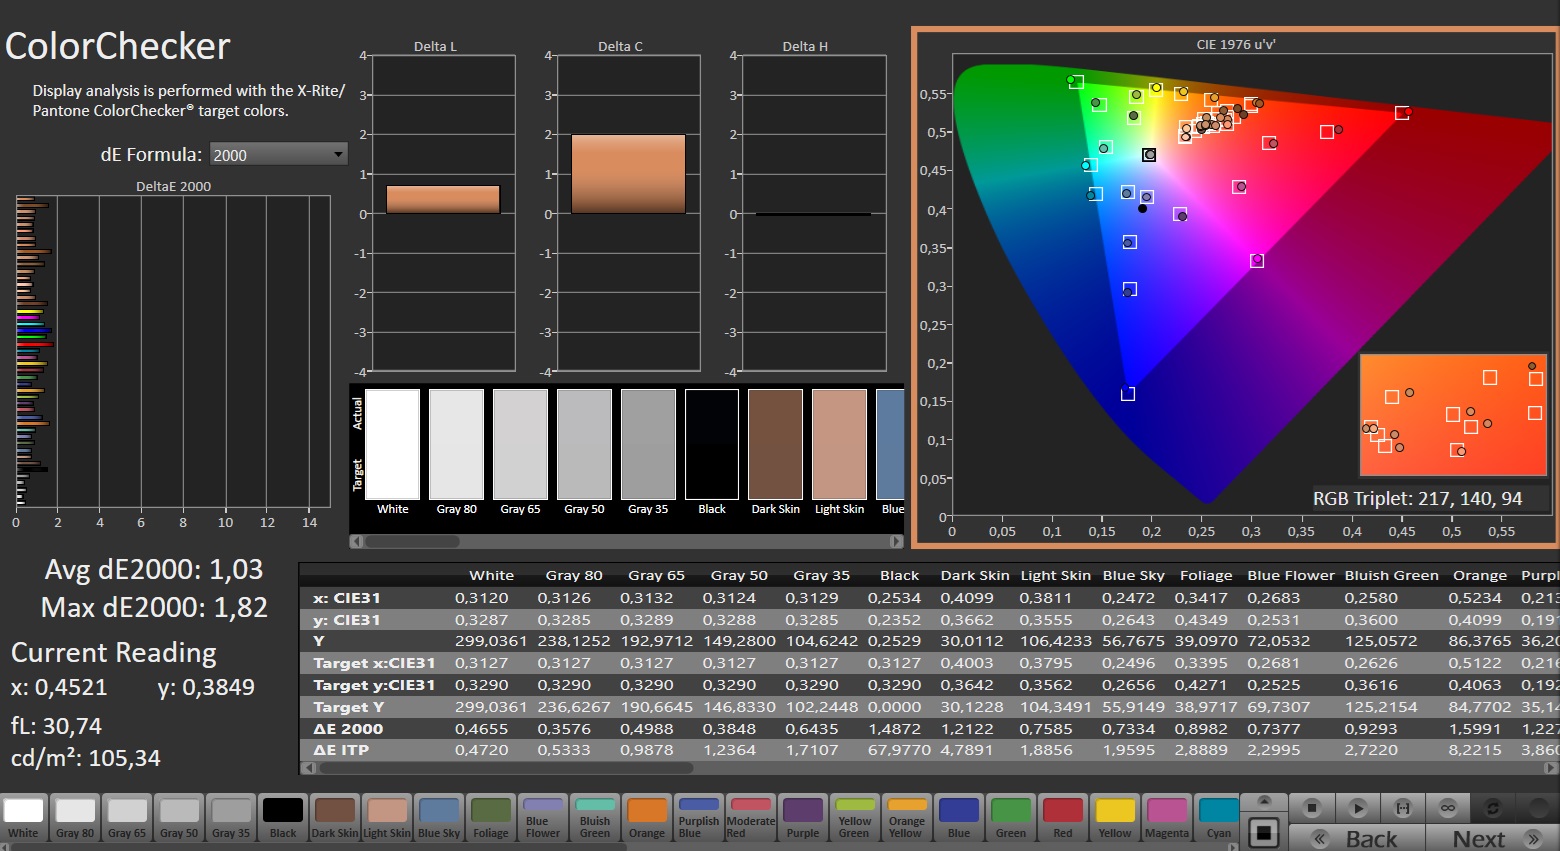
ΔE ColorChecker Calman: 2.26 | ∀{0.5-29.43 Ø4.72}
calibrated: 1.03
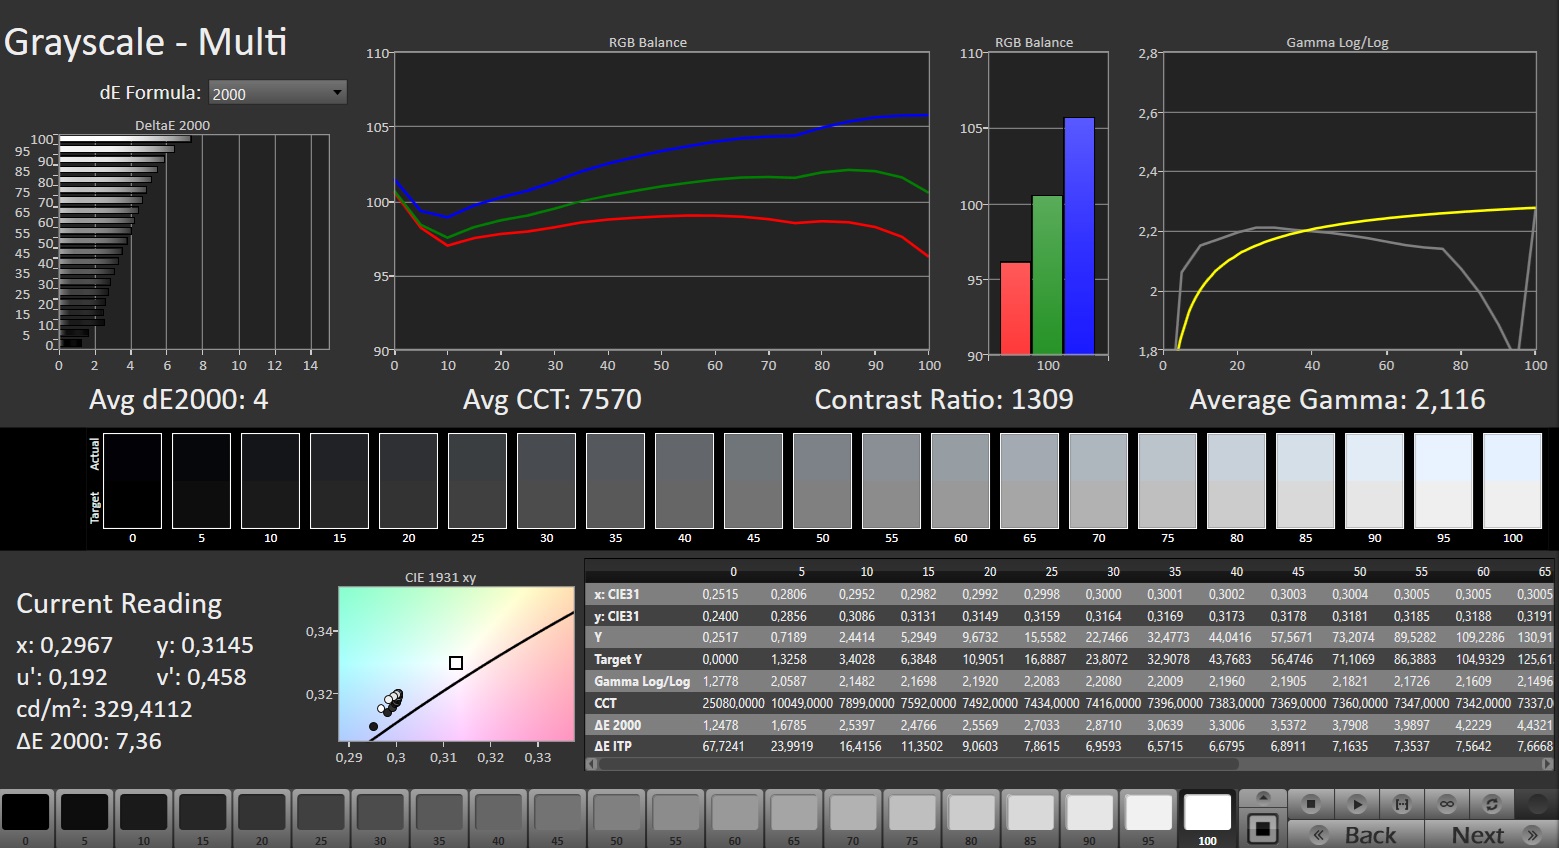
ΔE Greyscale Calman: 4 | ∀{0.09-98 Ø4.97}
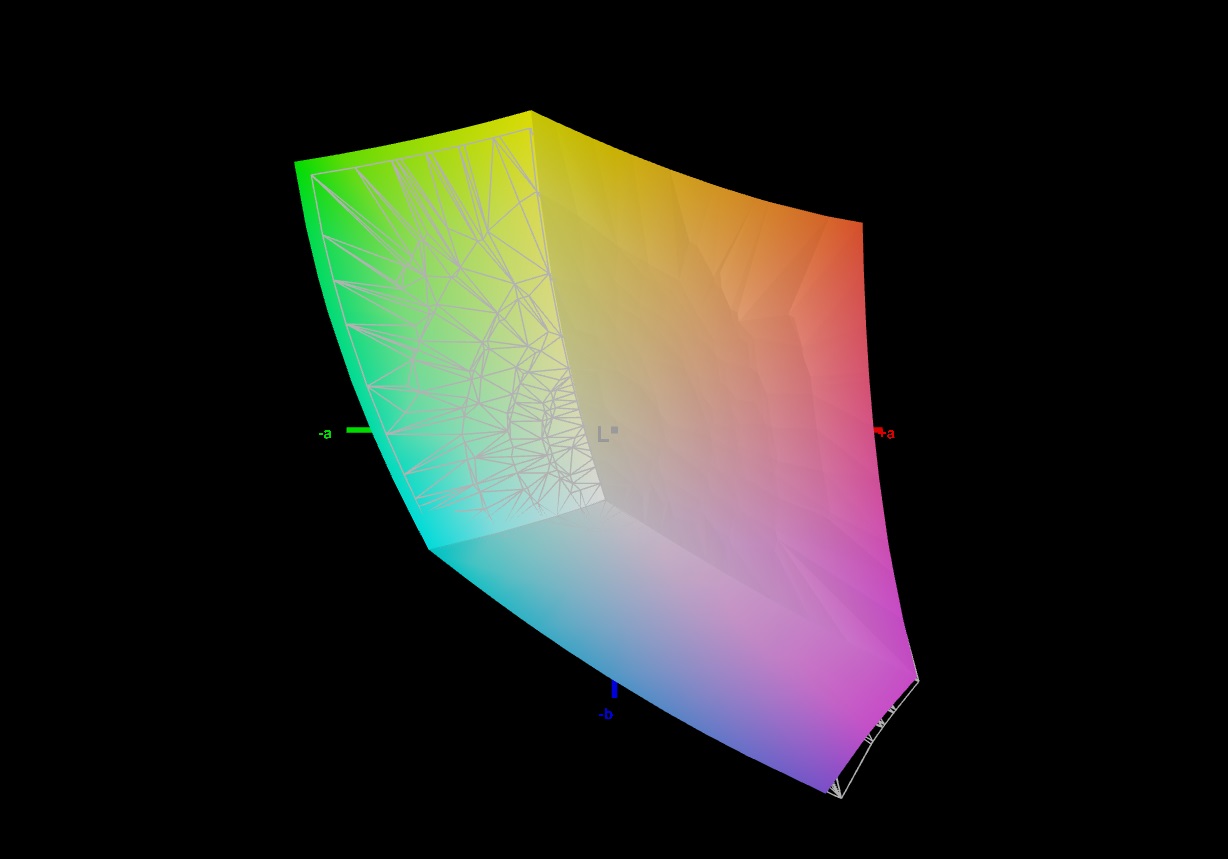
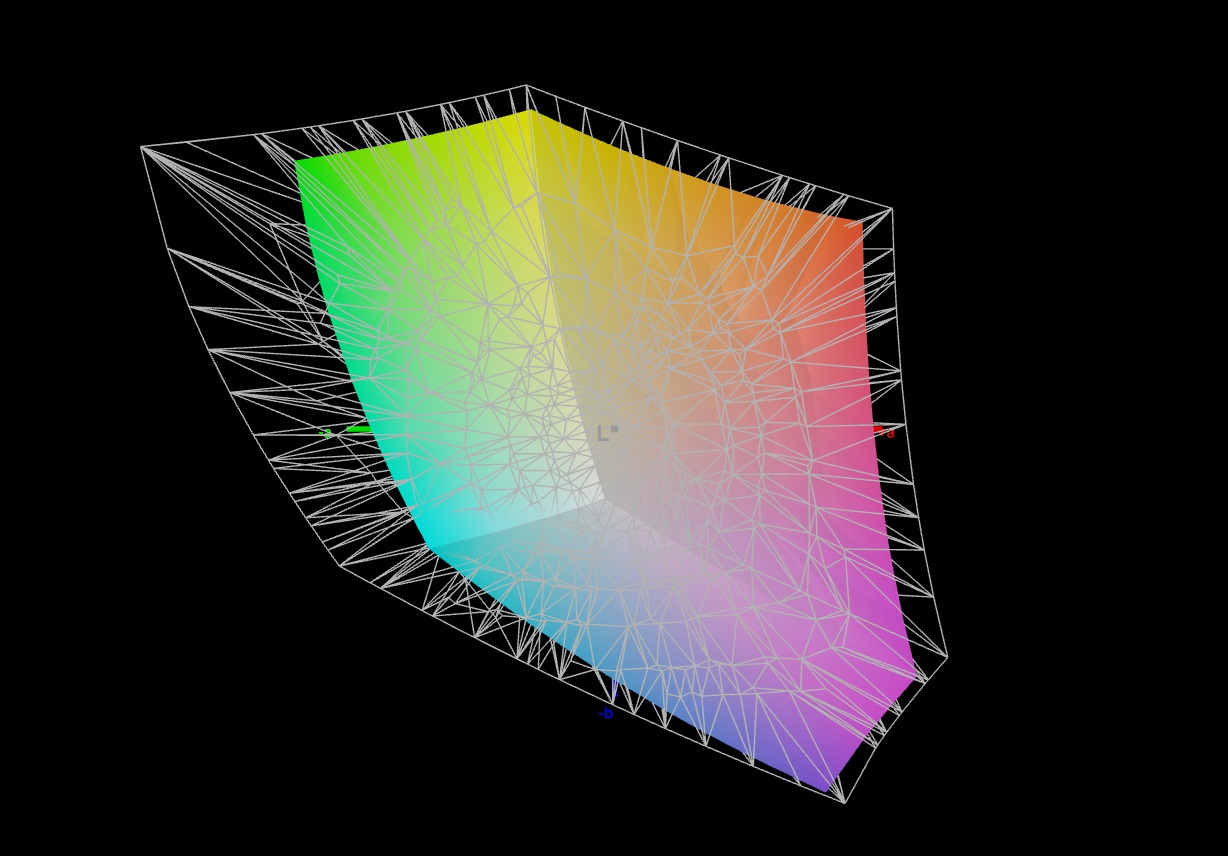
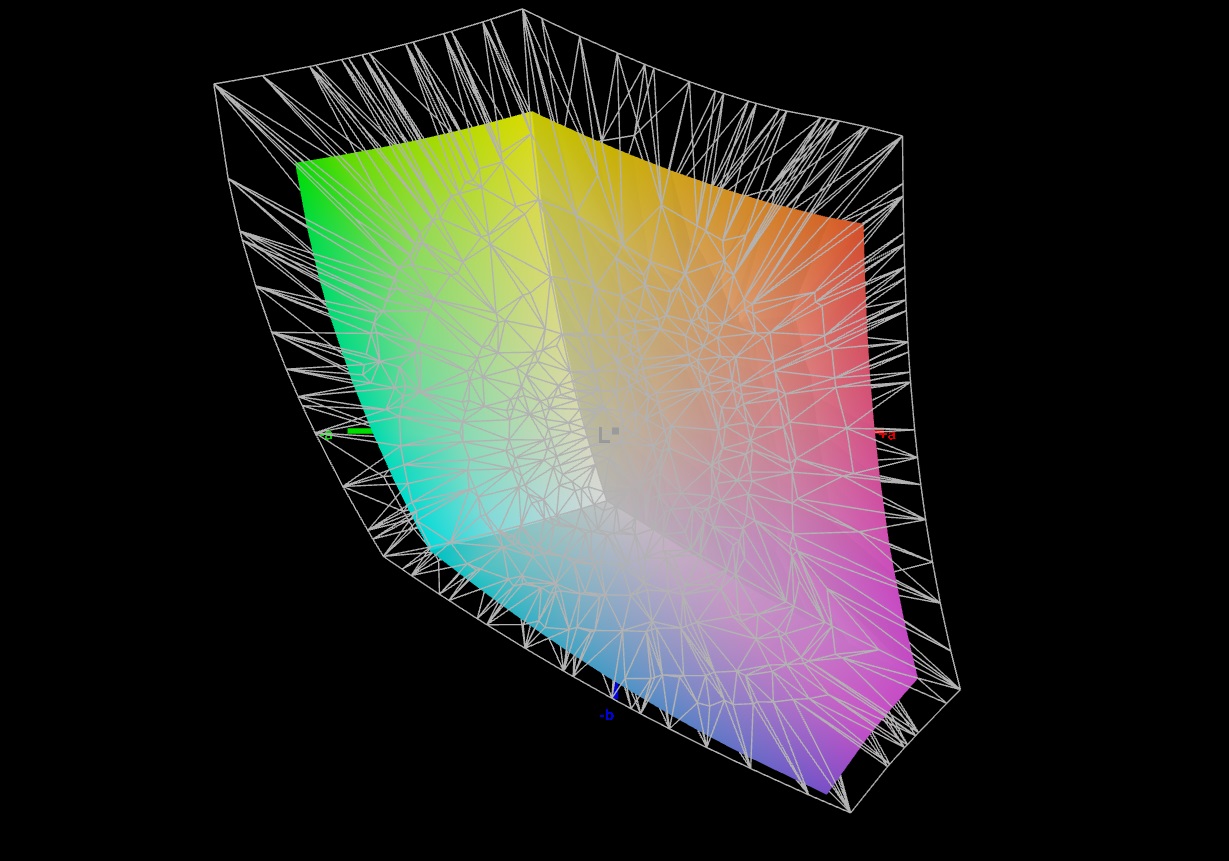
72.7% AdobeRGB 1998 (Argyll 3D)
98.5% sRGB (Argyll 3D)
70.5% Display P3 (Argyll 3D)
Gamma: 2.116
CCT: 7570 K
| Asus TUF Gaming A15 FA507UV AU Optronics B156HAN15.H, IPS, 1920x1080, 15.6" | Lenovo LOQ 15IRX9 BOE NJ NE156FHM-NX9, IPS, 1920x1080, 15.6" | HP Victus 16 (2024) Chi Mei CMN163E, IPS, 1920x1080, 16.1" | Gigabyte G6X 9KG (2024) BOE NE160WUM-NX6, IPS, 1920x1200, 16" | Schenker XMG Core 15 (M24) BOE NJ NE153QDM-NZ1 (BOE0C8E), IPS, 2560x1600, 15.3" | Dell G16, i7-13650HX, RTX 4060 Chi Mei CMN161D (160GME), IPS, 2560x1600, 16" | Asus TUF A15 FA507 N156HMA-GA1, IPS, 1920x1080, 15.6" | |
|---|---|---|---|---|---|---|---|
| Display | 2% | -40% | -39% | 3% | -3% | -6% | |
| Display P3 Coverage (%) | 70.5 | 73.7 5% | 41.3 -41% | 41.8 -41% | 73.2 4% | 67.5 -4% | 64.9 -8% |
| sRGB Coverage (%) | 98.5 | 99.1 1% | 61.7 -37% | 62.4 -37% | 100 2% | 98.5 0% | 96.5 -2% |
| AdobeRGB 1998 Coverage (%) | 72.7 | 72.6 0% | 42.7 -41% | 43.3 -40% | 74.6 3% | 69.3 -5% | 66.6 -8% |
| Response Times | -16% | 14% | -11% | 65% | 66% | 7% | |
| Response Time Grey 50% / Grey 80% * (ms) | 31.7 ? | 42.2 ? -33% | 28.6 ? 10% | 40.5 ? -28% | 9.6 ? 70% | 7.6 ? 76% | 30.4 ? 4% |
| Response Time Black / White * (ms) | 22.9 ? | 22.6 ? 1% | 18.7 ? 18% | 21.6 ? 6% | 9.2 ? 60% | 10.4 ? 55% | 20.8 ? 9% |
| PWM Frequency (Hz) | |||||||
| Screen | 6% | -62% | -54% | 14% | -9% | 18% | |
| Brightness middle (cd/m²) | 315 | 306 -3% | 287 -9% | 353 12% | 635 102% | 369 17% | 288 -9% |
| Brightness (cd/m²) | 303 | 287 -5% | 288 -5% | 318 5% | 604 99% | 344 14% | 271 -11% |
| Brightness Distribution (%) | 90 | 88 -2% | 86 -4% | 81 -10% | 91 1% | 89 -1% | 91 1% |
| Black Level * (cd/m²) | 0.25 | 0.21 16% | 0.19 24% | 0.21 16% | 0.64 -156% | 0.26 -4% | 0.17 32% |
| Contrast (:1) | 1260 | 1457 16% | 1511 20% | 1681 33% | 992 -21% | 1419 13% | 1694 34% |
| Colorchecker dE 2000 * | 2.26 | 2.25 -0% | 5.46 -142% | 5.21 -131% | 1.89 16% | 3.04 -35% | 1.9 16% |
| Colorchecker dE 2000 max. * | 7.37 | 4.84 34% | 20.36 -176% | 19.95 -171% | 3.14 57% | 5.56 25% | 3.3 55% |
| Colorchecker dE 2000 calibrated * | 1.03 | 1.45 -41% | 3.52 -242% | 3.61 -250% | 1.14 -11% | 2.35 -128% | 0.9 13% |
| Greyscale dE 2000 * | 4 | 2.4 40% | 4.8 -20% | 3.6 10% | 2.53 37% | 3.38 15% | 2.7 32% |
| Gamma | 2.116 104% | 2.259 97% | 2.108 104% | 2.367 93% | 2.36 93% | 2.47 89% | 2.32 95% |
| CCT | 7570 86% | 6790 96% | 6442 101% | 7138 91% | 6434 101% | 6040 108% | 6535 99% |
| Total Average (Program / Settings) | -3% /
2% | -29% /
-46% | -35% /
-45% | 27% /
19% | 18% /
3% | 6% /
11% |
* ... smaller is better
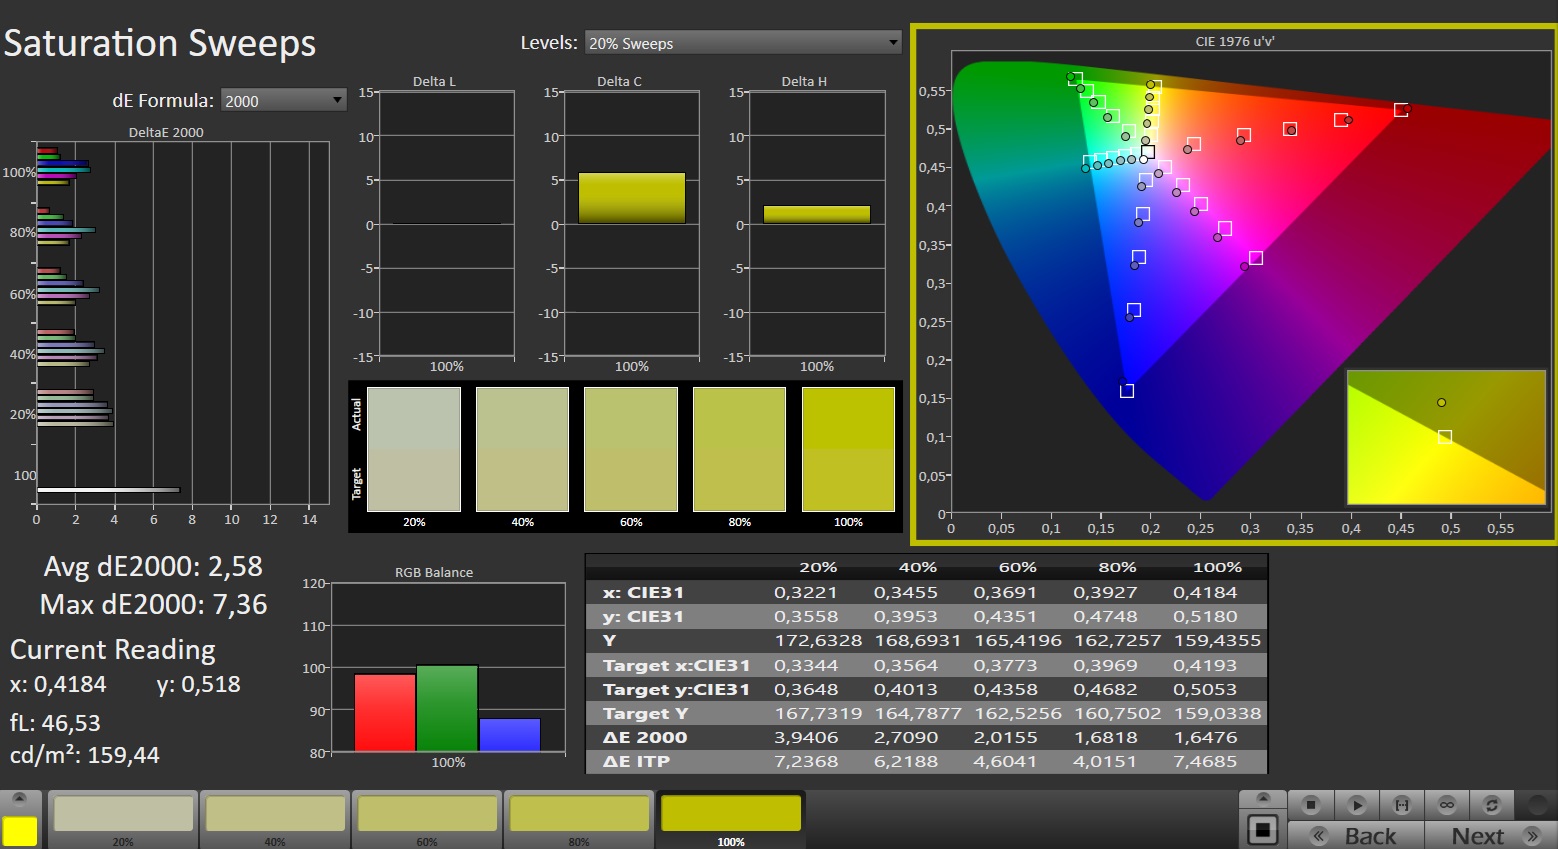
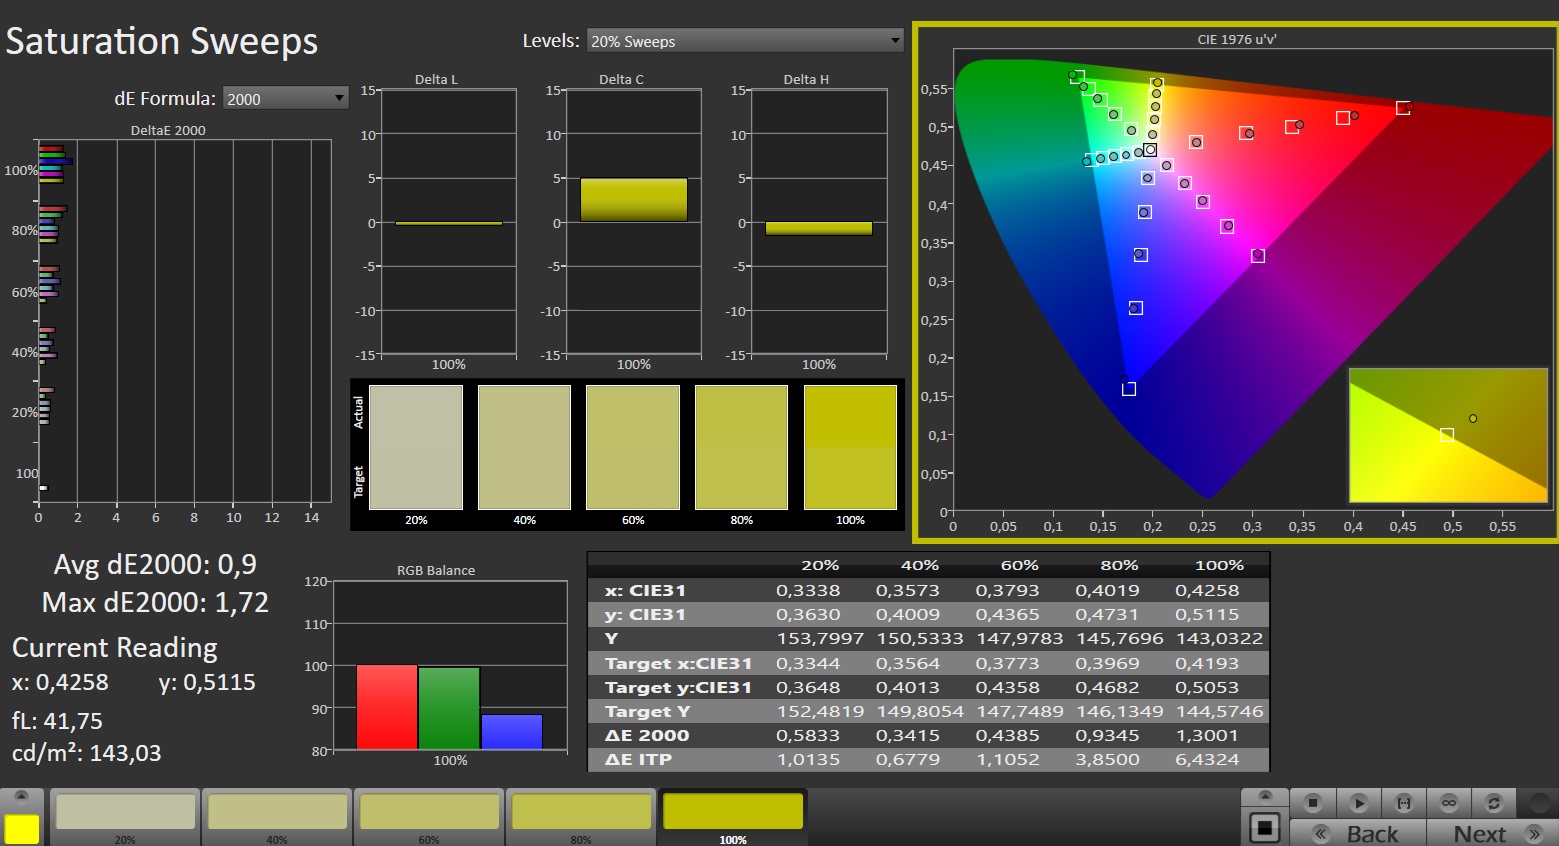
Out-of-the-box, the panel comes with a very low color deviation of around 2.26 (target: DeltaE < 3). A calibration reduces this figure to 1.03. As is the case with screens found in most of the competition, this panel covers the sRGB color space (almost) completely but not the color spaces AdobeRGB and DCI P3.
Display Response Times
| ↔ Response Time Black to White | ||
|---|---|---|
| 22.9 ms ... rise ↗ and fall ↘ combined | ↗ 11.7 ms rise | 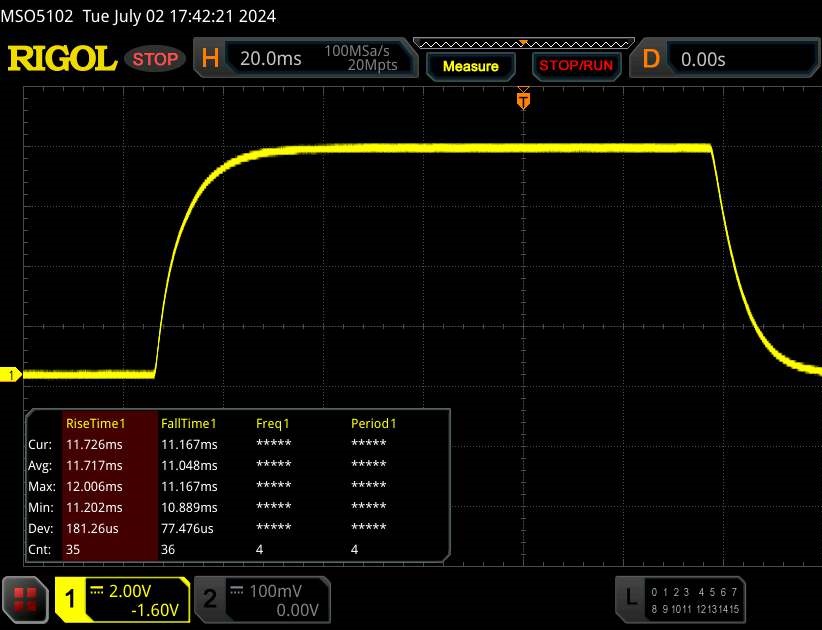 |
| ↘ 11.2 ms fall | ||
| The screen shows good response rates in our tests, but may be too slow for competitive gamers. In comparison, all tested devices range from 0.1 (minimum) to 240 (maximum) ms. » 52 % of all devices are better. This means that the measured response time is worse than the average of all tested devices (19.8 ms). | ||
| ↔ Response Time 50% Grey to 80% Grey | ||
| 31.7 ms ... rise ↗ and fall ↘ combined | ↗ 14.7 ms rise | 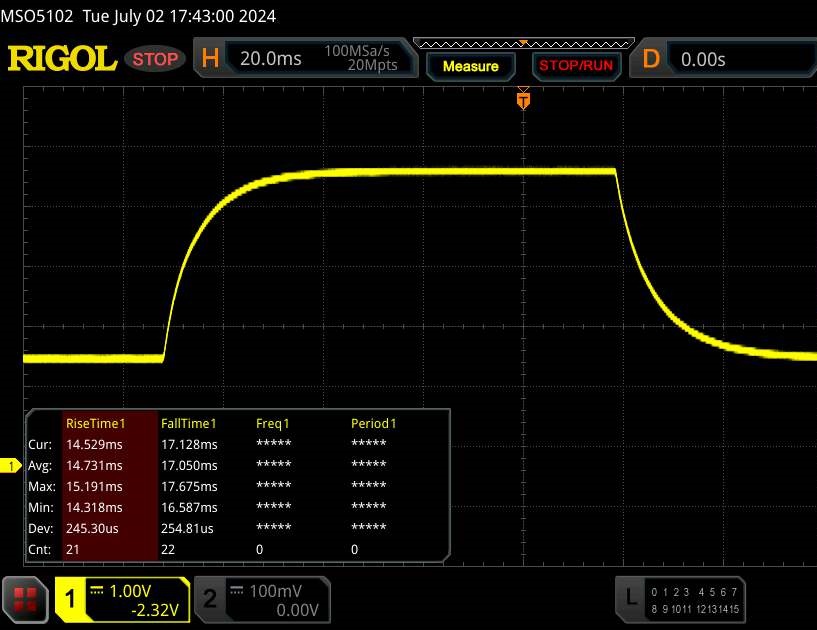 |
| ↘ 17 ms fall | ||
| The screen shows slow response rates in our tests and will be unsatisfactory for gamers. In comparison, all tested devices range from 0.165 (minimum) to 636 (maximum) ms. » 43 % of all devices are better. This means that the measured response time is similar to the average of all tested devices (31 ms). | ||
Screen Flickering / PWM (Pulse-Width Modulation)
| Screen flickering / PWM not detected |  | ||
In comparison: 52 % of all tested devices do not use PWM to dim the display. If PWM was detected, an average of 7763 (minimum: 5 - maximum: 343500) Hz was measured. | |||
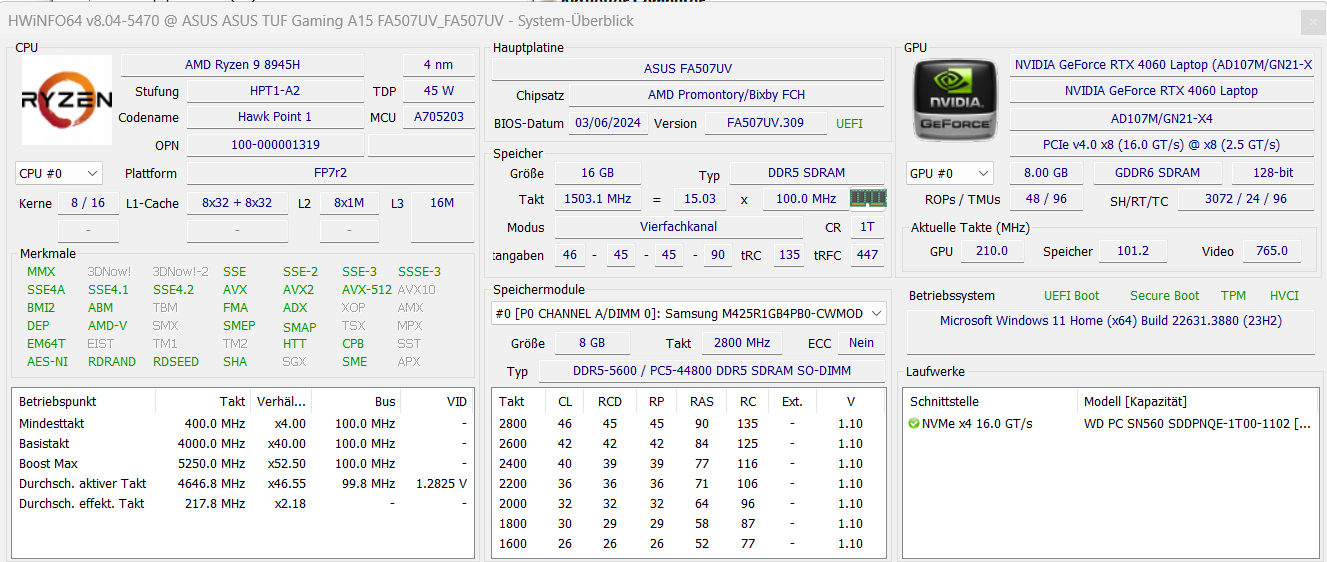
Performance - Hawk Point and Ada Lovelace power the computer
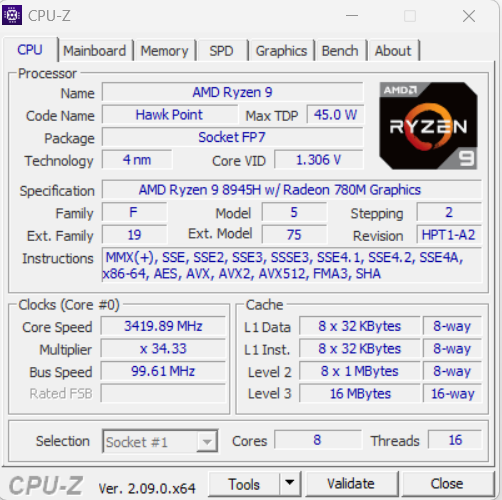
With the TUF Gaming A15 FA507UV, Asus is offering a midrange gaming laptop in the lower price segment. The hardware necessary for the computational tasks comes from AMD (Hawk Point, Zen 4) and Nvidia (Ada Lovelace). The review device will set you back around $1,399.
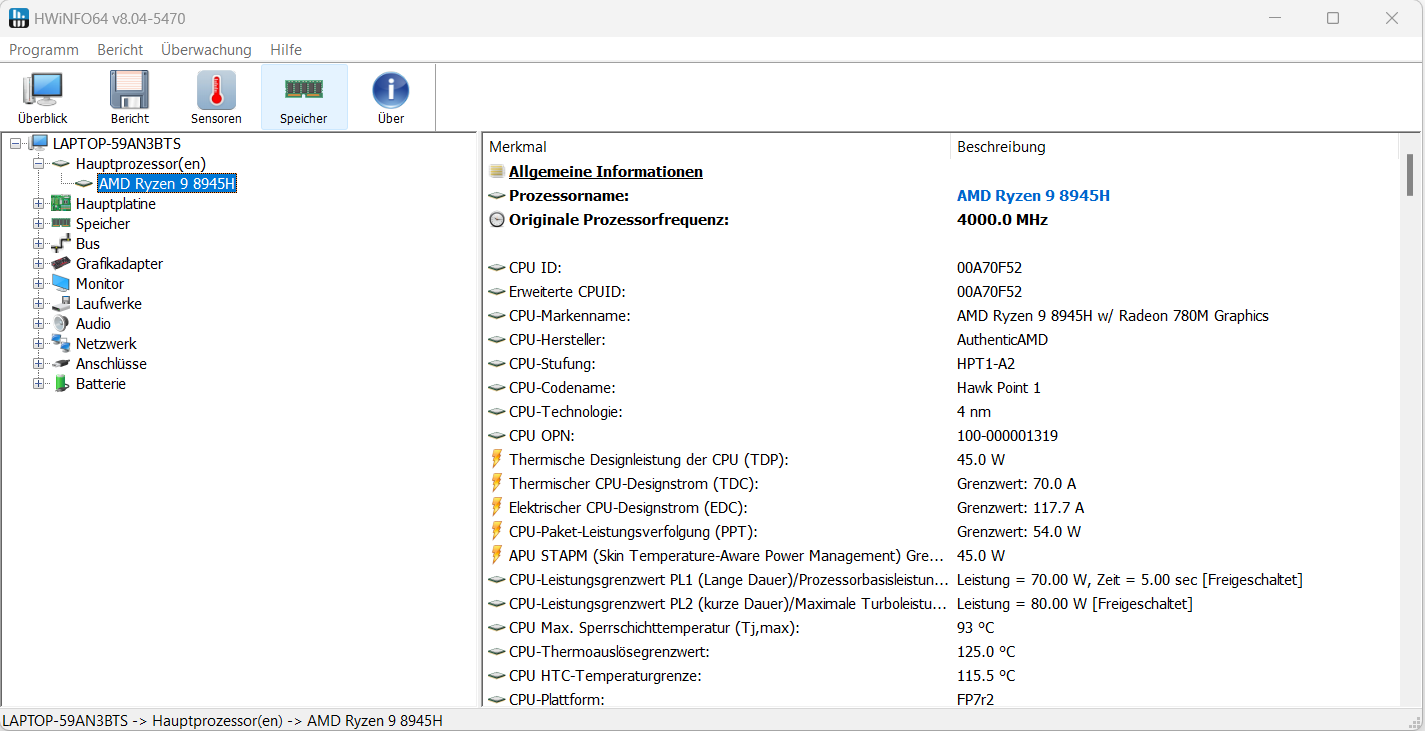
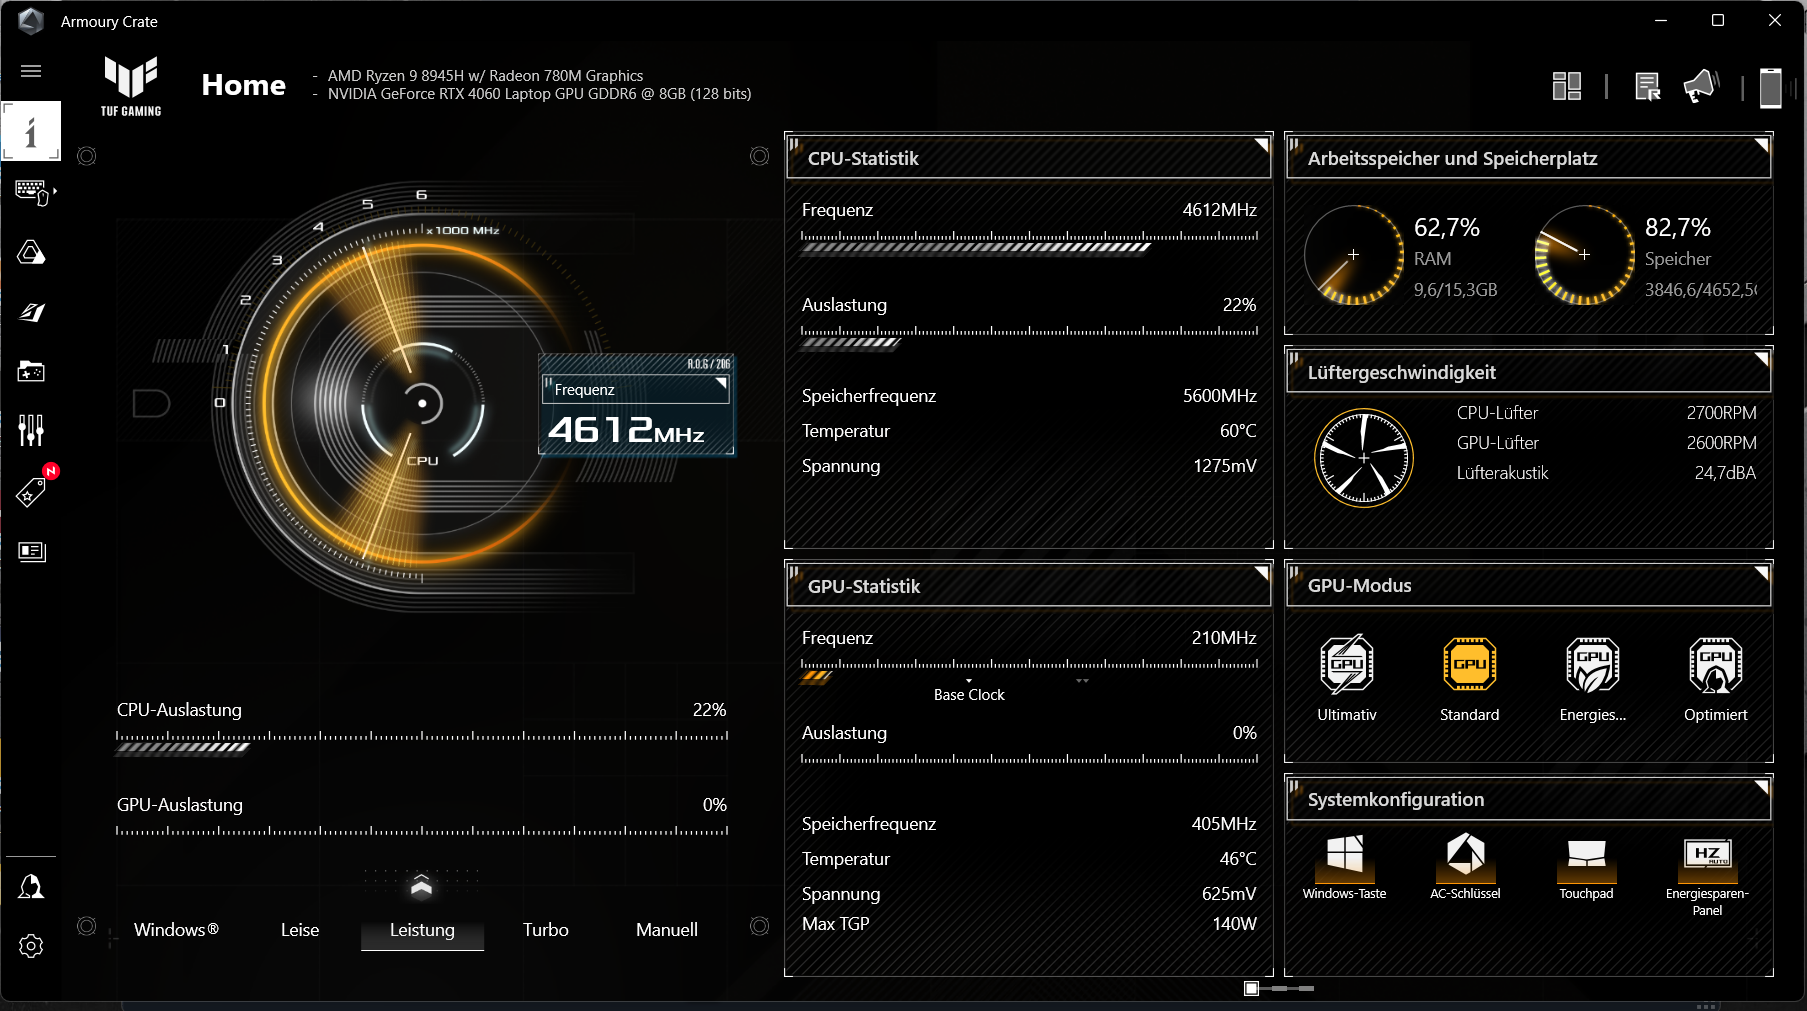
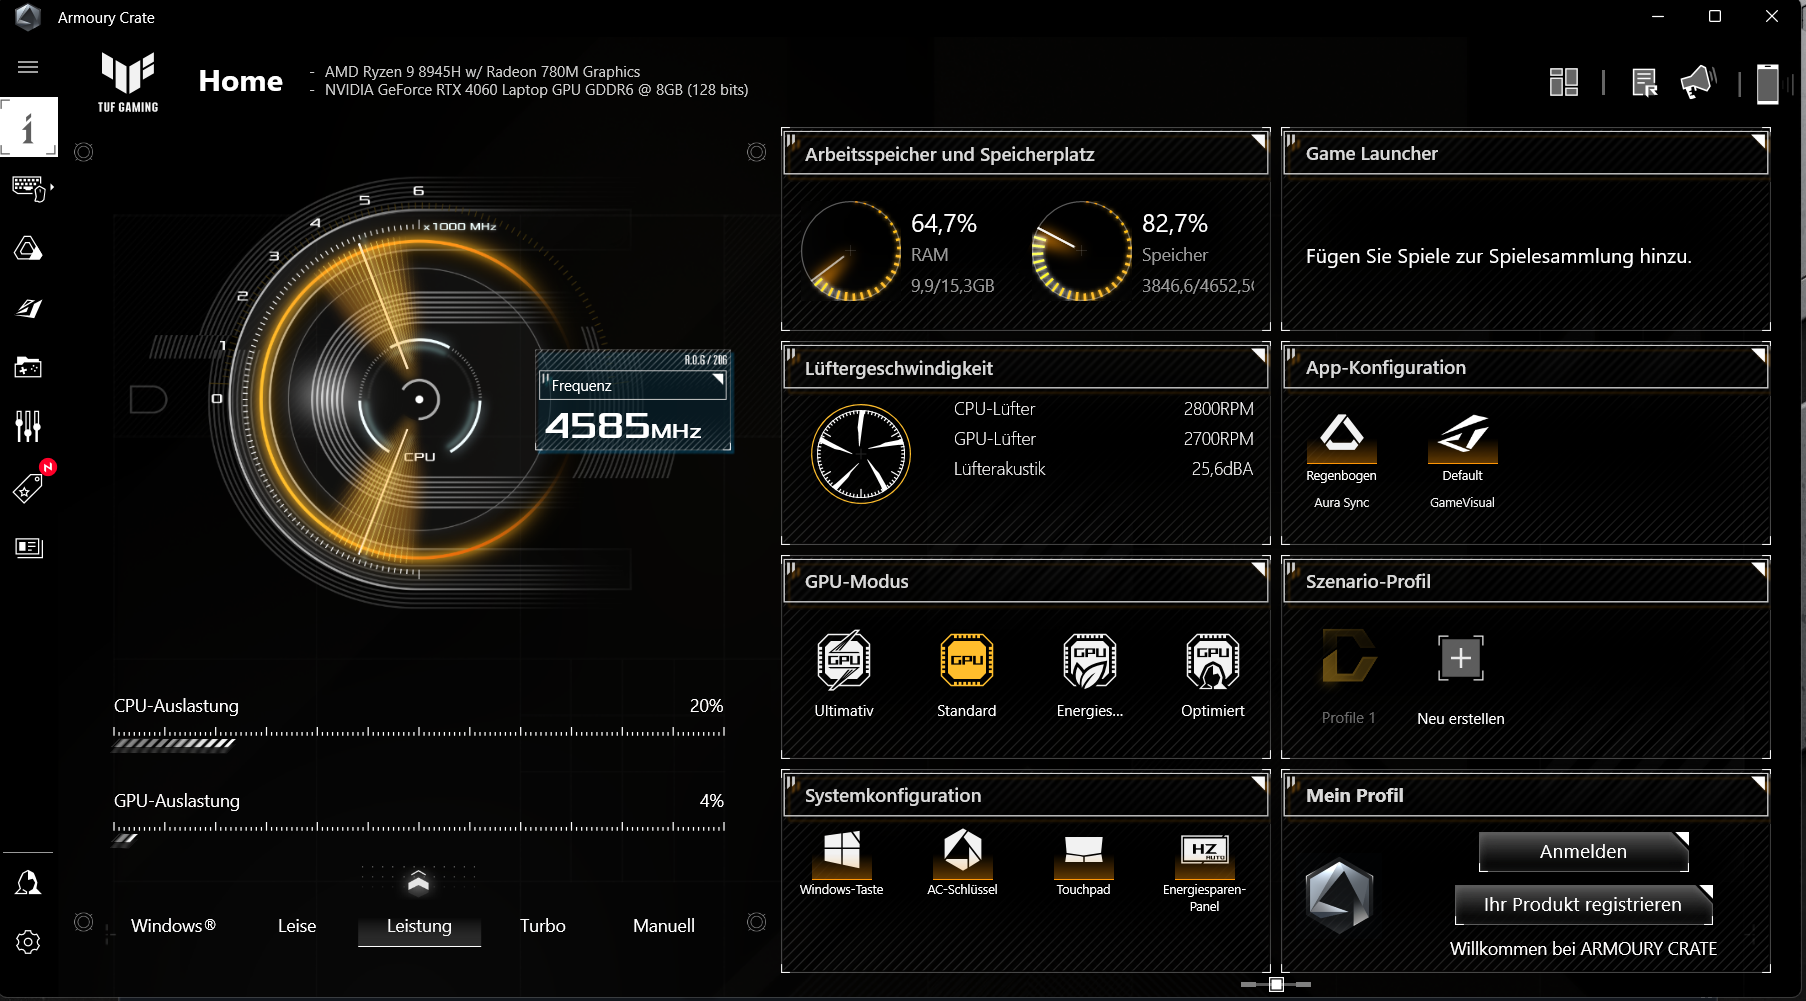
Test conditions
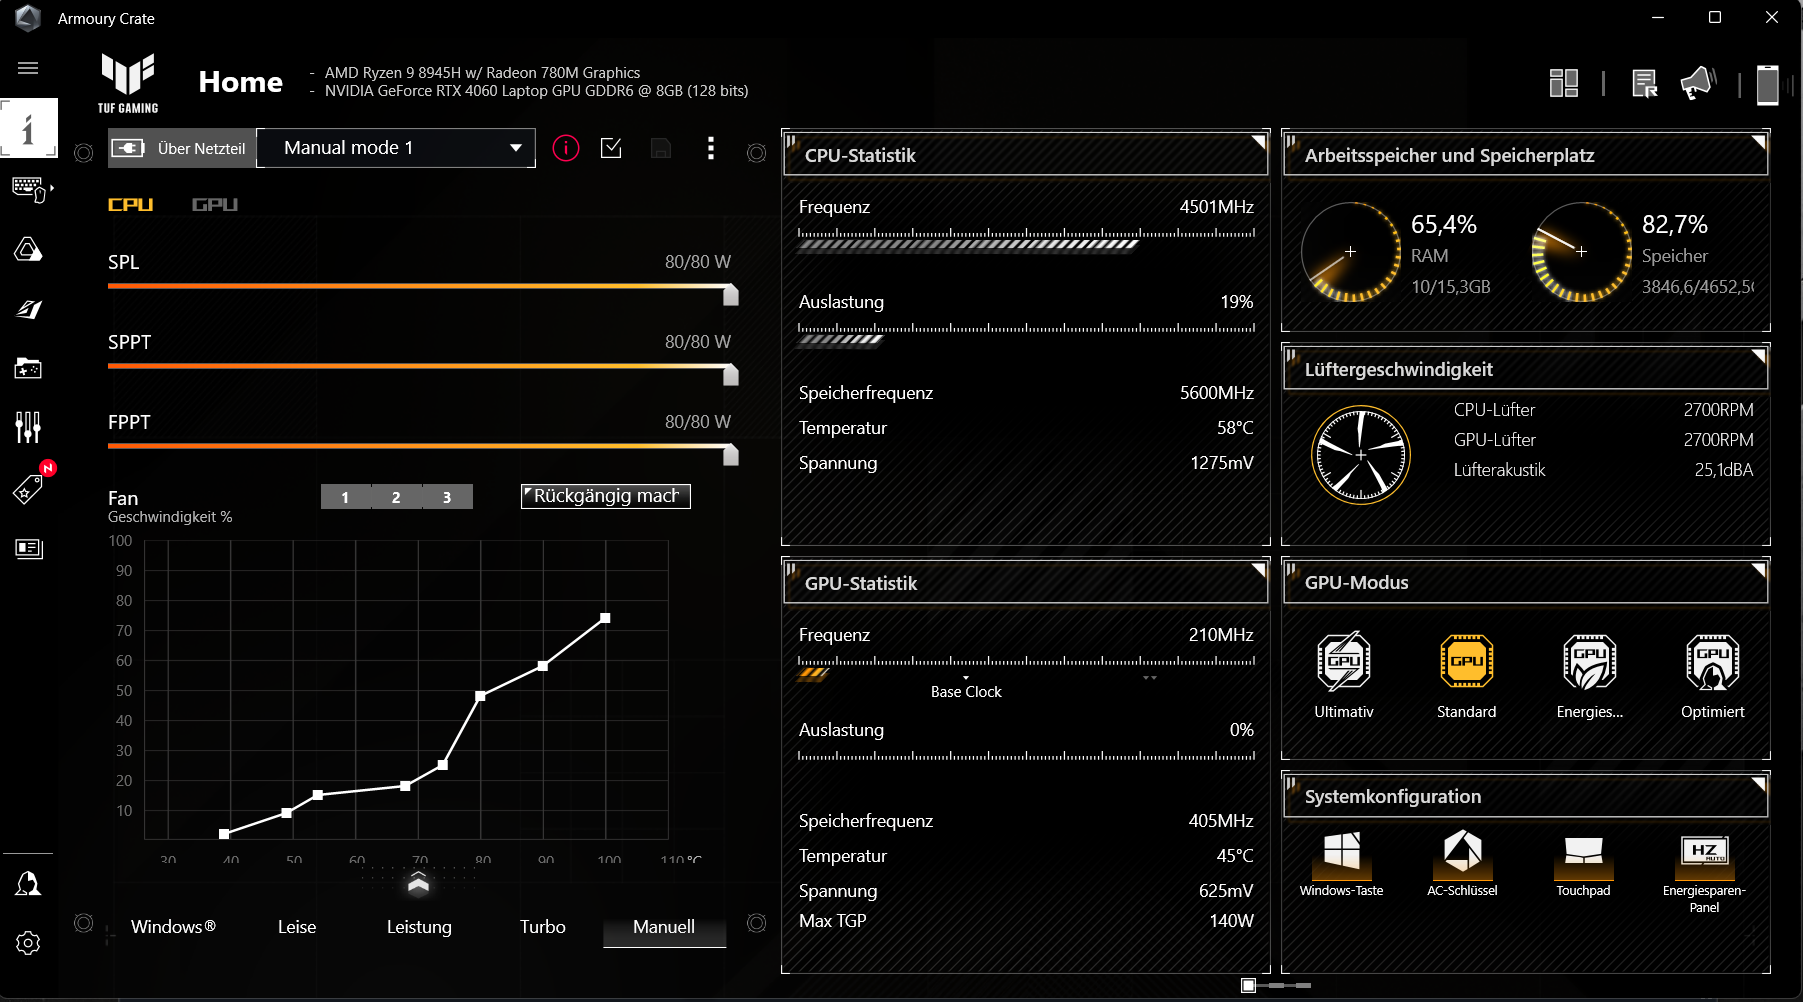
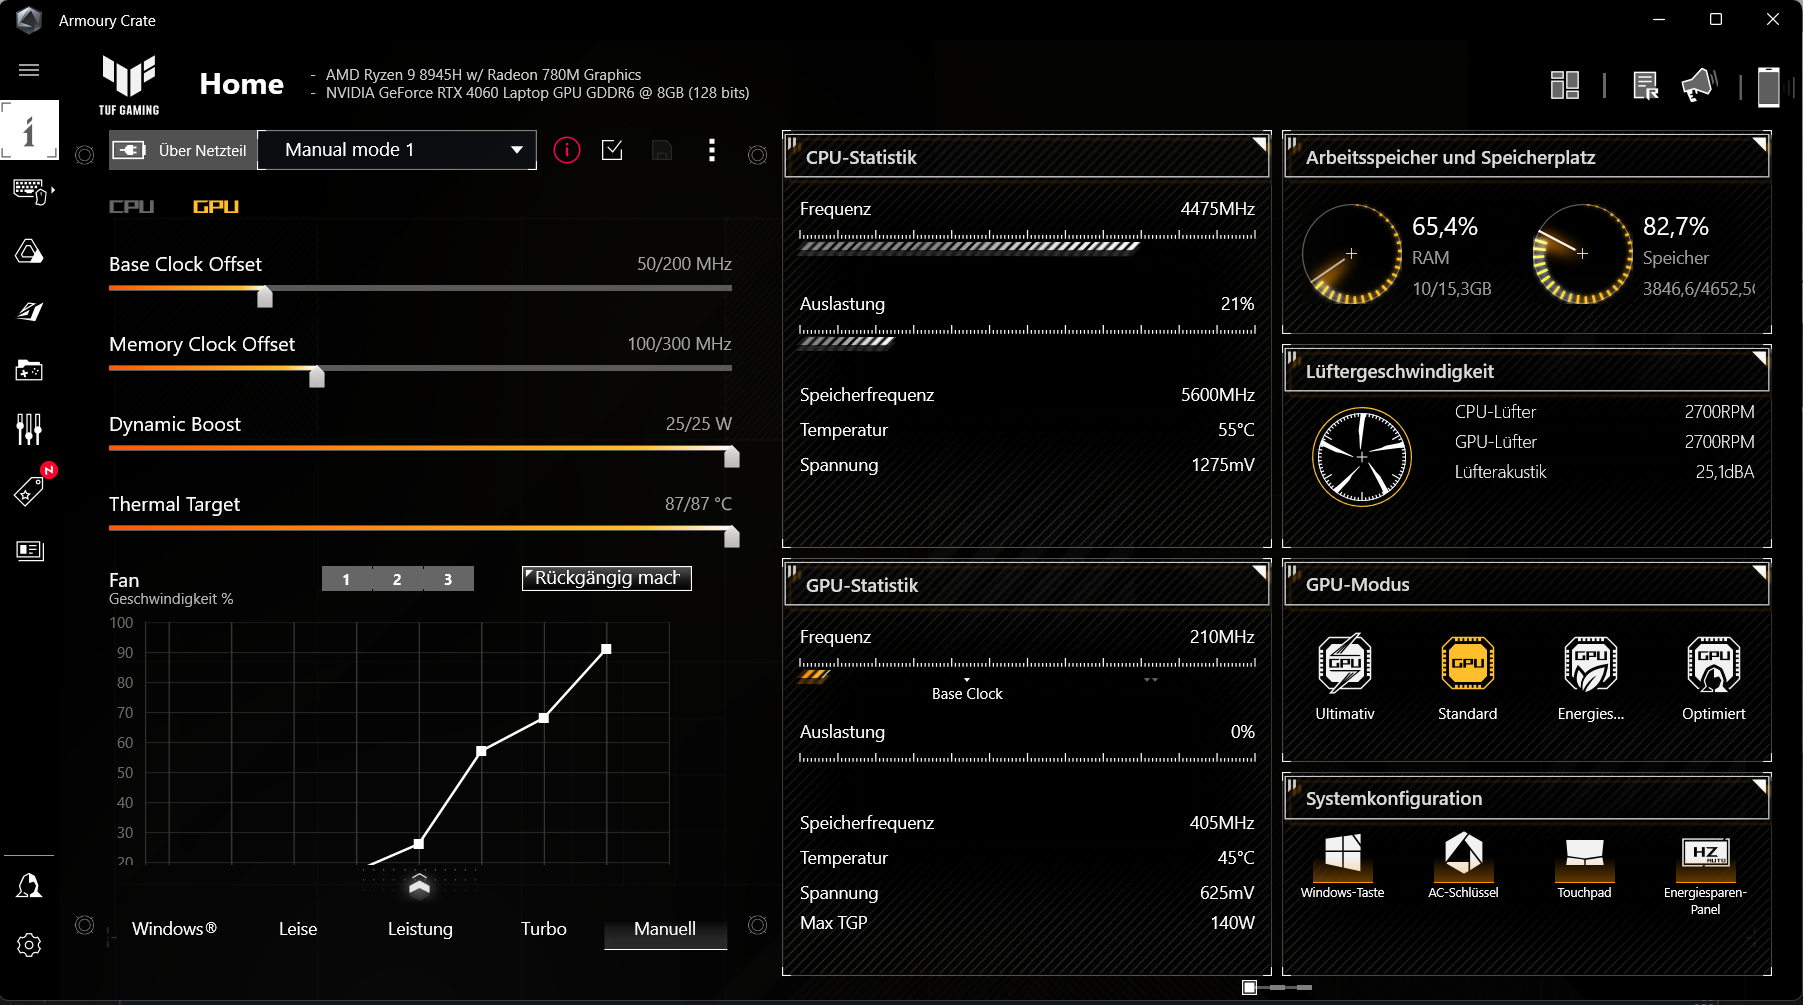
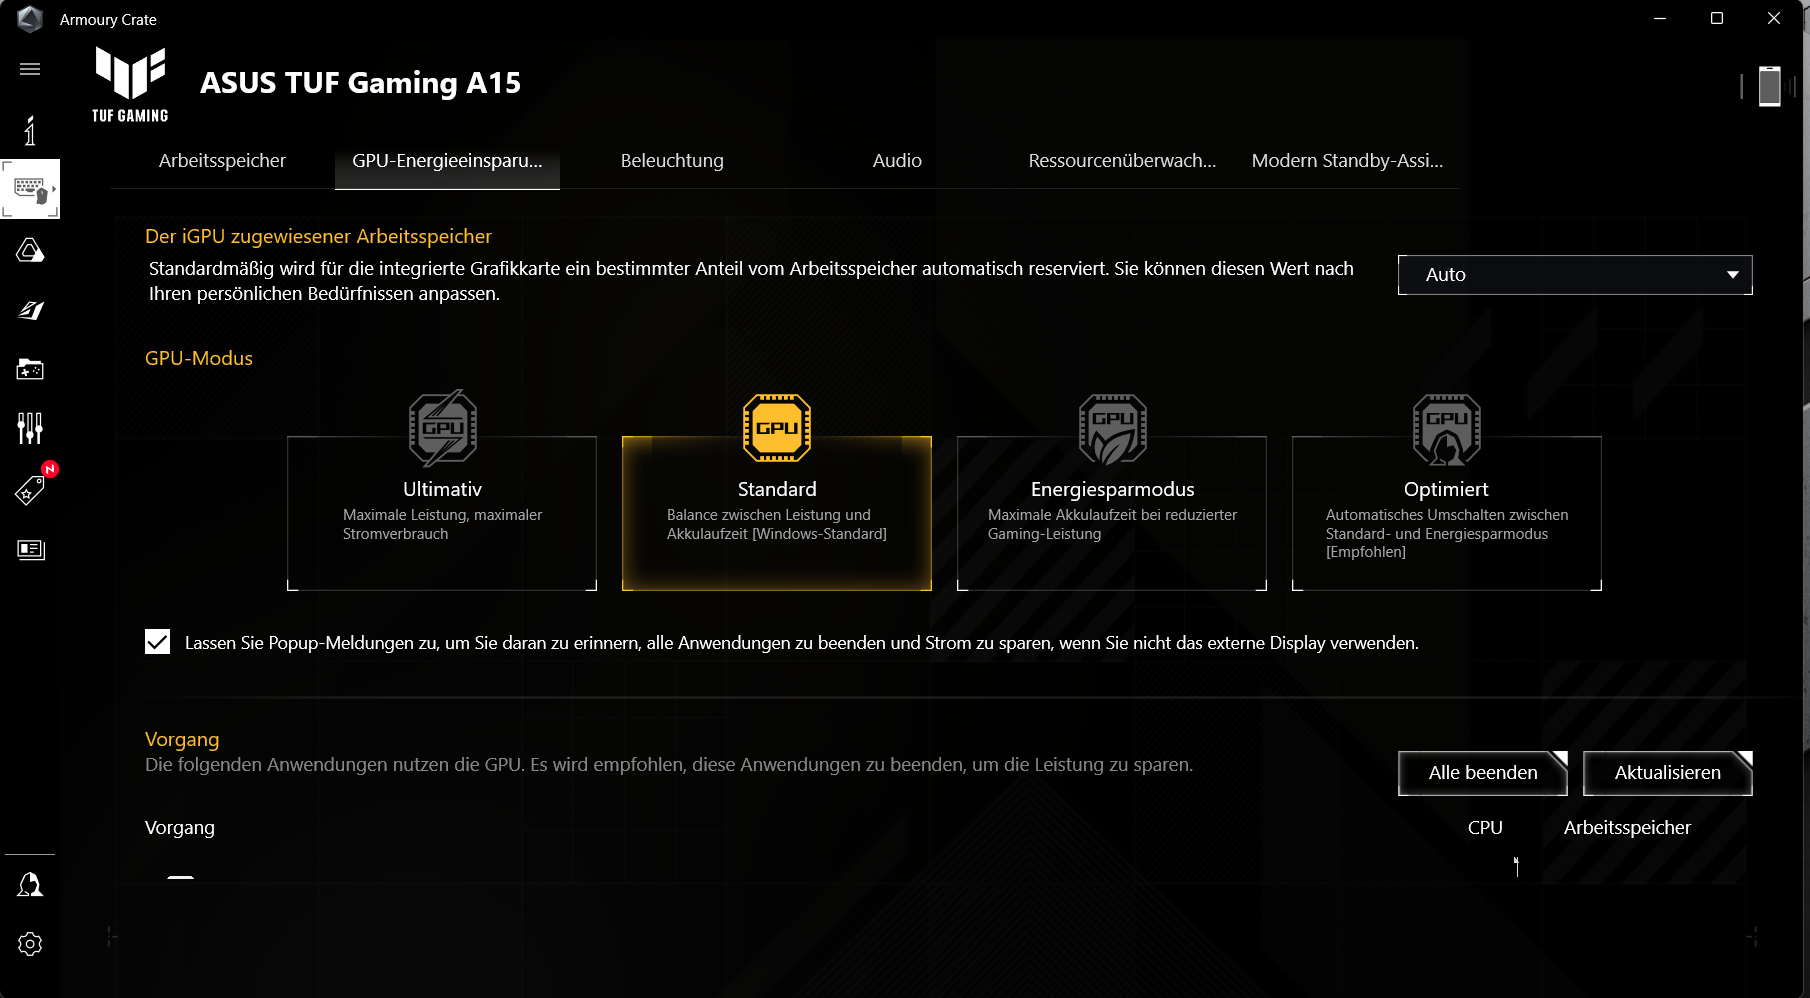
The laptop has three manufacturer-specific performance profiles (see table) which can be switched via the "Fn" + "F5" key combination. We used the "Performance" (benchmarks) and "Quiet" (battery test) profiles. The GPU mode was set to "Standard". The laptop's control center ("Armoury Crate") allows you to set a custom profile ("Manual") as well as define the power limits, dynamic boost and fan curves.
| Performance | Turbo | Quiet | |
|---|---|---|---|
| Powerlimit 1 (HWInfo) | 70 watts | 80 watts | 54 watts |
| Powerlimit 2 (HWInfo) | 80 watts | 80 watts | 65 watts |
| Noise (CP 2077 Phantom) | 45 dB(A) | 56 dB(A) | 41 dB(A) |
| Performance (CP 2077 Phantom) | 64fps | 70fps | 56fps |
Processor
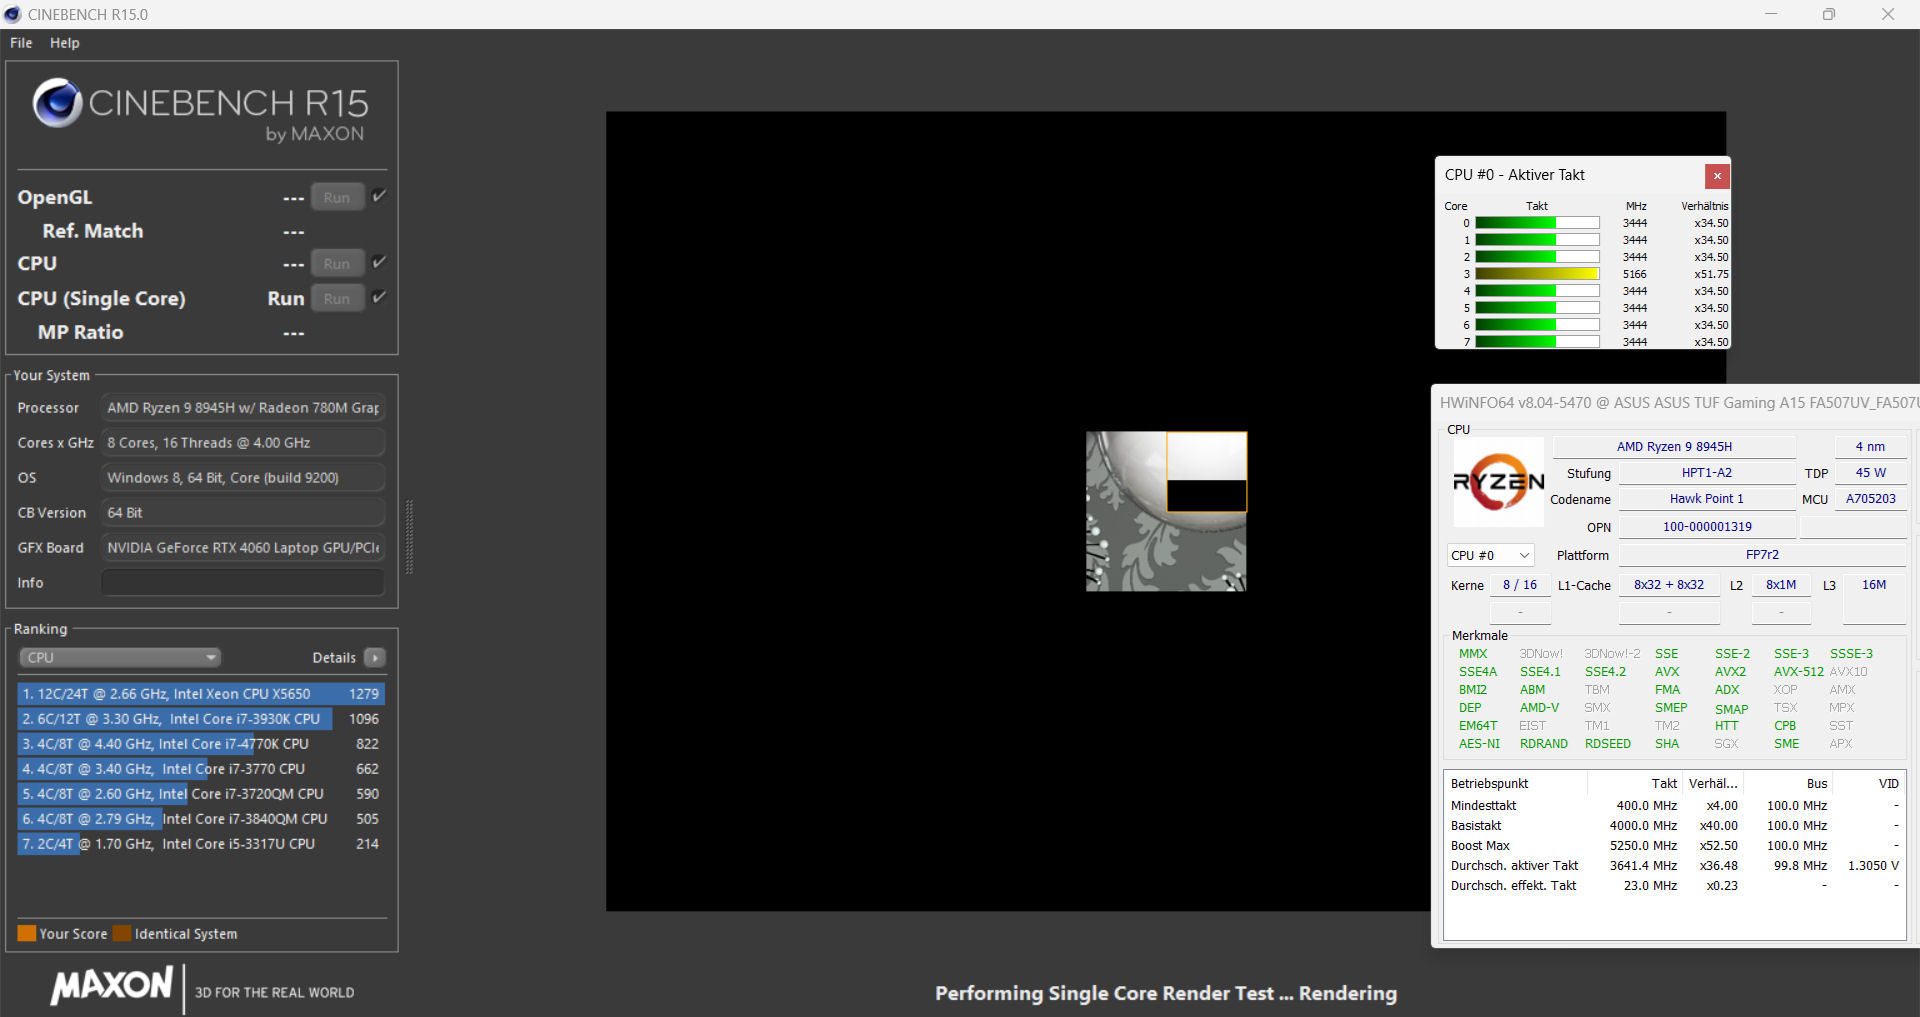
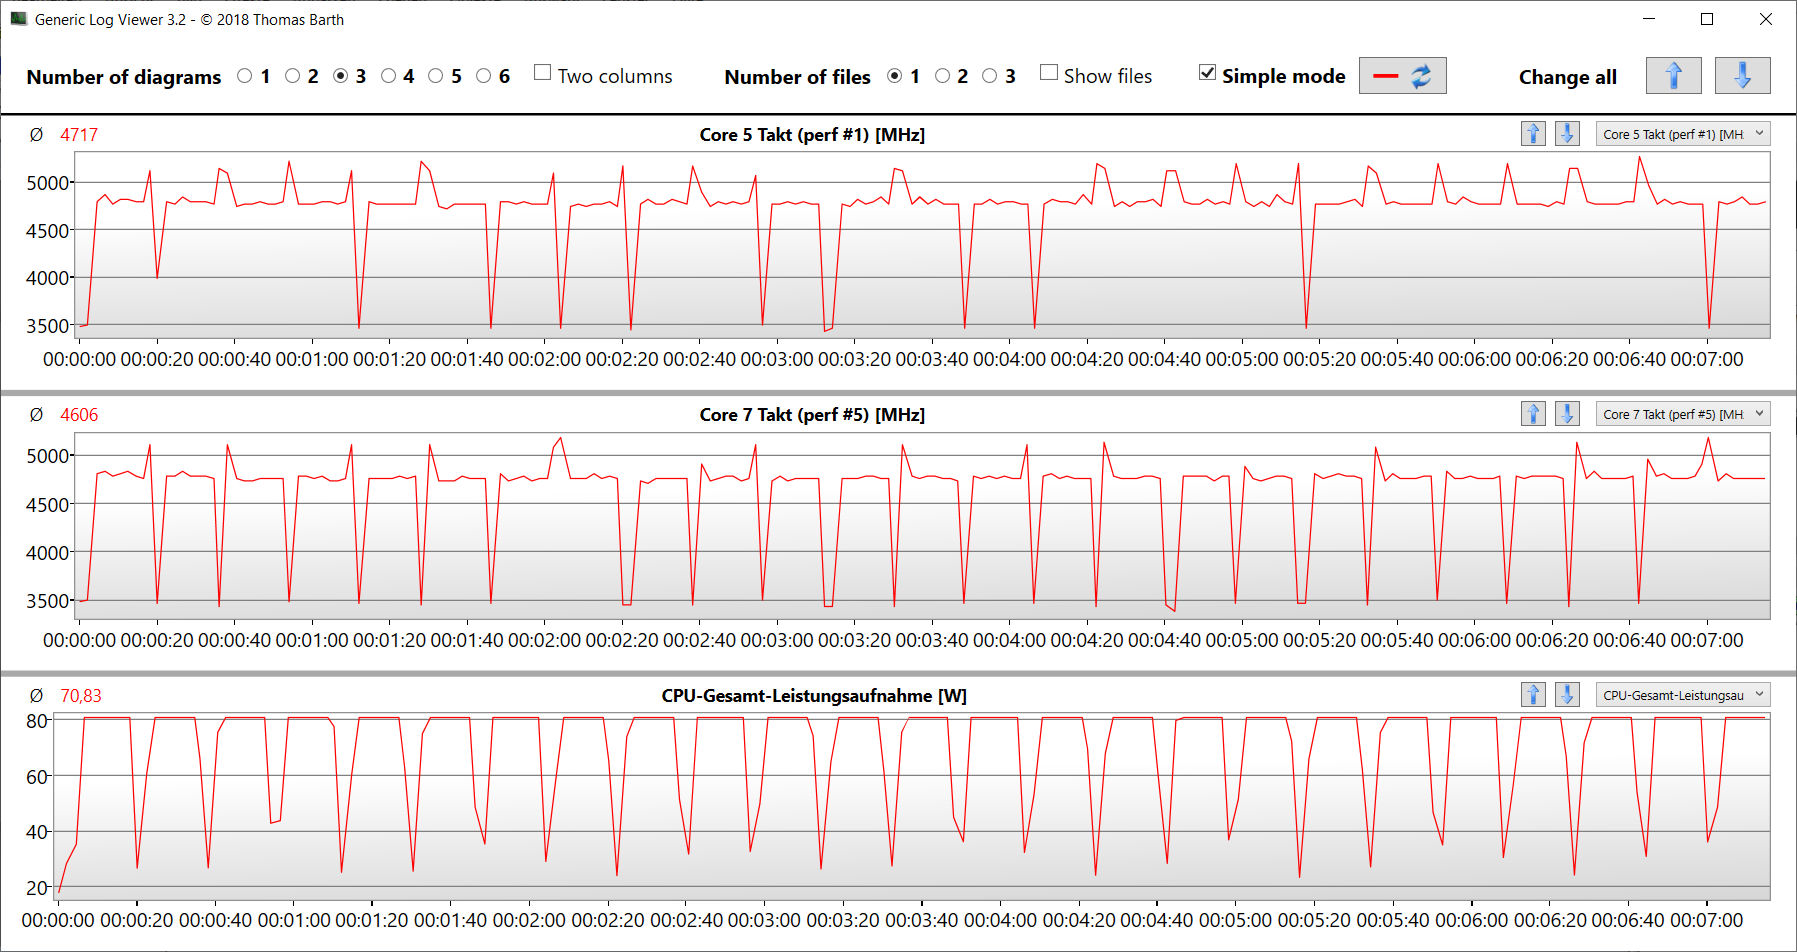
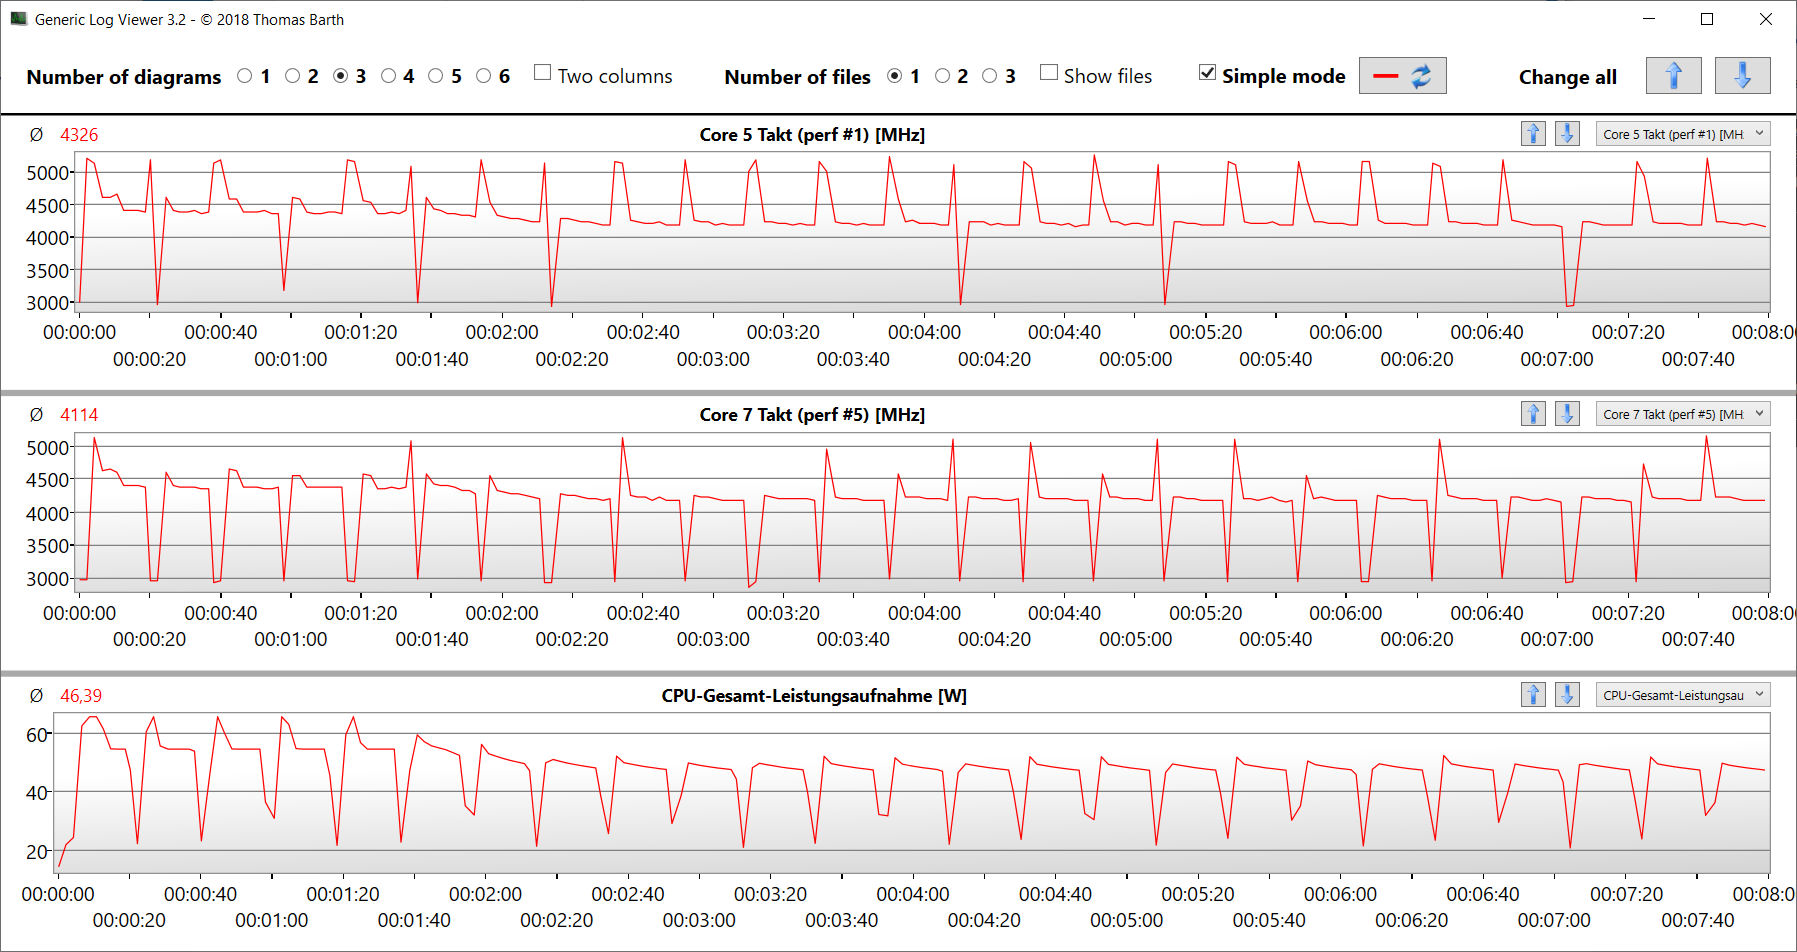
Ryzen 9 8945H (Hawk Point, Zen 4) offers eight CPU cores with a total of 16 threads at a maximum clock speed of 5.25 GHz (one core). The CPU responds to sustained multi-thread load (CB15 loop) with a consistently high turbo speed. The CPU performance varies with the selected energy profile and the differences are quite small. The benchmark results sit on the same level as a similarly specced Ryzen 9 8945HS APU.
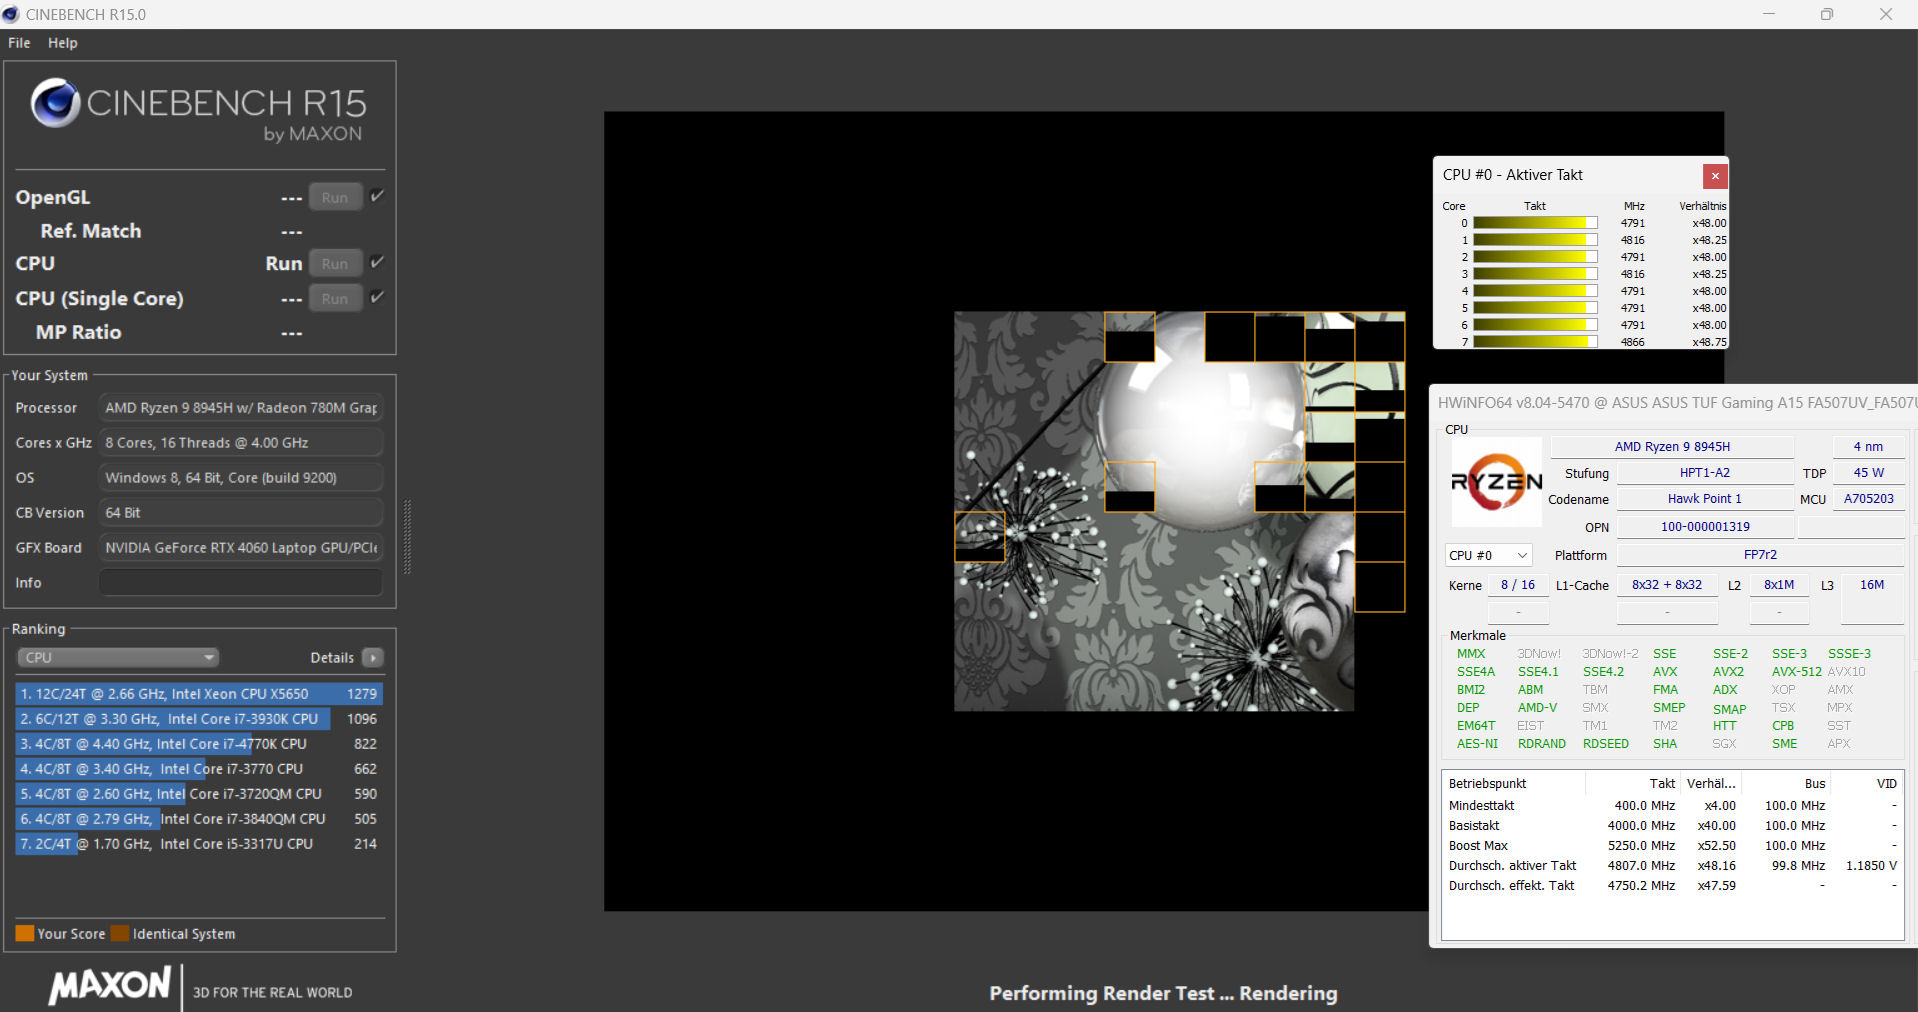
Cinebench R15 Multi Continuous Test

| Geekbench 6.7 | |
| Multi-Core | |
| Average of class Gaming (6625 - 22104, n=109, last 2 years) | |
| HP Victus 16 (2024) (6.2.1) | |
| Schenker XMG Core 15 (M24) (6.2.1) | |
| Dell G16, i7-13650HX, RTX 4060 (6.2.1) | |
| Gigabyte G6X 9KG (2024) (6.2.1) | |
| Lenovo LOQ 15IRX9 (6.2.1) | |
| Asus TUF Gaming A15 FA507UV (6.2.1) | |
| Average AMD Ryzen 9 8945H (12638 - 12662, n=2) | |
| Asus TUF Gaming A15 FA507UV (6.2.1 Turbo) | |
| Single-Core | |
| Average of class Gaming (1490 - 3259, n=109, last 2 years) | |
| Asus TUF Gaming A15 FA507UV (6.2.1) | |
| Average AMD Ryzen 9 8945H (2692 - 2711, n=2) | |
| Asus TUF Gaming A15 FA507UV (6.2.1, Turbo) | |
| Schenker XMG Core 15 (M24) (6.2.1) | |
| Dell G16, i7-13650HX, RTX 4060 (6.2.1) | |
| Gigabyte G6X 9KG (2024) (6.2.1) | |
| Lenovo LOQ 15IRX9 (6.2.1) | |
| HP Victus 16 (2024) (6.2.1) | |
| LibreOffice - 20 Documents To PDF | |
| Lenovo LOQ 15IRX9 (6.3.4.2) | |
| HP Victus 16 (2024) (6.3.4.2) | |
| Dell G16, i7-13650HX, RTX 4060 (6.3.4.2) | |
| Asus TUF A15 FA507 | |
| Average of class Gaming (19 - 88.8, n=108, last 2 years) | |
| Schenker XMG Core 15 (M24) (6.3.4.2) | |
| Asus TUF Gaming A15 FA507UV (6.3.4.2) | |
| Average AMD Ryzen 9 8945H (44.2 - 47.5, n=2) | |
| Asus TUF Gaming A15 FA507UV (6.3.4.2, Turbo) | |
| Gigabyte G6X 9KG (2024) (6.3.4.2) | |
* ... smaller is better
AIDA64: FP32 Ray-Trace | FPU Julia | CPU SHA3 | CPU Queen | FPU SinJulia | FPU Mandel | CPU AES | CPU ZLib | FP64 Ray-Trace | CPU PhotoWorxx
| Performance rating | |
| Average of class Gaming | |
| Asus TUF Gaming A15 FA507UV | |
| Schenker XMG Core 15 (M24) | |
| Average AMD Ryzen 9 8945H | |
| Asus TUF Gaming A15 FA507UV | |
| Dell G16, i7-13650HX, RTX 4060 | |
| HP Victus 16 (2024) | |
| Asus TUF A15 FA507 | |
| Gigabyte G6X 9KG (2024) | |
| Lenovo LOQ 15IRX9 | |
| AIDA64 / FP32 Ray-Trace | |
| Average of class Gaming (10227 - 85542, n=107, last 2 years) | |
| Schenker XMG Core 15 (M24) (v6.92.6600) | |
| Asus TUF Gaming A15 FA507UV (v6.92.6600, Turbo) | |
| Average AMD Ryzen 9 8945H (28698 - 29423, n=2) | |
| Asus TUF Gaming A15 FA507UV (v6.92.6600) | |
| Dell G16, i7-13650HX, RTX 4060 (v6.92.6600) | |
| HP Victus 16 (2024) (v6.92.6600) | |
| Asus TUF A15 FA507 (v6.85.6300) | |
| Lenovo LOQ 15IRX9 (v6.92.6600) | |
| Gigabyte G6X 9KG (2024) (v6.92.6600) | |
| AIDA64 / FPU Julia | |
| Average of class Gaming (51376 - 238426, n=107, last 2 years) | |
| Schenker XMG Core 15 (M24) (v6.92.6600) | |
| Asus TUF Gaming A15 FA507UV (v6.92.6600, Turbo) | |
| Average AMD Ryzen 9 8945H (122466 - 125008, n=2) | |
| Asus TUF Gaming A15 FA507UV (v6.92.6600) | |
| Asus TUF A15 FA507 (v6.85.6300) | |
| Dell G16, i7-13650HX, RTX 4060 (v6.92.6600) | |
| HP Victus 16 (2024) (v6.92.6600) | |
| Lenovo LOQ 15IRX9 (v6.92.6600) | |
| Gigabyte G6X 9KG (2024) (v6.92.6600) | |
| AIDA64 / CPU SHA3 | |
| Average of class Gaming (2180 - 9817, n=107, last 2 years) | |
| Asus TUF Gaming A15 FA507UV (v6.92.6600, Turbo) | |
| Schenker XMG Core 15 (M24) (v6.92.6600) | |
| Average AMD Ryzen 9 8945H (5113 - 5209, n=2) | |
| Asus TUF Gaming A15 FA507UV (v6.92.6600) | |
| Dell G16, i7-13650HX, RTX 4060 (v6.92.6600) | |
| HP Victus 16 (2024) (v6.92.6600) | |
| Lenovo LOQ 15IRX9 (v6.92.6600) | |
| Asus TUF A15 FA507 (v6.85.6300) | |
| Gigabyte G6X 9KG (2024) (v6.92.6600) | |
| AIDA64 / CPU Queen | |
| HP Victus 16 (2024) (v6.92.6600) | |
| Asus TUF Gaming A15 FA507UV (v6.92.6600) | |
| Average AMD Ryzen 9 8945H (124401 - 125950, n=2) | |
| Schenker XMG Core 15 (M24) (v6.92.6600) | |
| Asus TUF Gaming A15 FA507UV (v6.92.6600, Turbo) | |
| Average of class Gaming (49785 - 173351, n=94, last 2 years) | |
| Gigabyte G6X 9KG (2024) (v6.92.6600) | |
| Dell G16, i7-13650HX, RTX 4060 (v6.92.6600) | |
| Asus TUF A15 FA507 (v6.85.6300) | |
| Lenovo LOQ 15IRX9 (v6.92.6600) | |
| AIDA64 / FPU SinJulia | |
| Asus TUF Gaming A15 FA507UV (v6.92.6600, Turbo) | |
| Average AMD Ryzen 9 8945H (15856 - 15889, n=2) | |
| Asus TUF Gaming A15 FA507UV (v6.92.6600) | |
| Schenker XMG Core 15 (M24) (v6.92.6600) | |
| Average of class Gaming (4424 - 33636, n=107, last 2 years) | |
| Asus TUF A15 FA507 (v6.85.6300) | |
| HP Victus 16 (2024) (v6.92.6600) | |
| Dell G16, i7-13650HX, RTX 4060 (v6.92.6600) | |
| Lenovo LOQ 15IRX9 (v6.92.6600) | |
| Gigabyte G6X 9KG (2024) (v6.92.6600) | |
| AIDA64 / FPU Mandel | |
| Average of class Gaming (25115 - 128721, n=107, last 2 years) | |
| Schenker XMG Core 15 (M24) (v6.92.6600) | |
| Asus TUF Gaming A15 FA507UV (v6.92.6600, Turbo) | |
| Average AMD Ryzen 9 8945H (65523 - 67020, n=2) | |
| Asus TUF Gaming A15 FA507UV (v6.92.6600) | |
| Asus TUF A15 FA507 (v6.85.6300) | |
| Dell G16, i7-13650HX, RTX 4060 (v6.92.6600) | |
| HP Victus 16 (2024) (v6.92.6600) | |
| Lenovo LOQ 15IRX9 (v6.92.6600) | |
| Gigabyte G6X 9KG (2024) (v6.92.6600) | |
| AIDA64 / CPU AES | |
| Average of class Gaming (39258 - 247074, n=107, last 2 years) | |
| Schenker XMG Core 15 (M24) (v6.92.6600) | |
| Asus TUF Gaming A15 FA507UV (v6.92.6600, Turbo) | |
| Average AMD Ryzen 9 8945H (90481 - 91871, n=2) | |
| Asus TUF Gaming A15 FA507UV (v6.92.6600) | |
| Dell G16, i7-13650HX, RTX 4060 (v6.92.6600) | |
| HP Victus 16 (2024) (v6.92.6600) | |
| Lenovo LOQ 15IRX9 (v6.92.6600) | |
| Asus TUF A15 FA507 (v6.85.6300) | |
| Gigabyte G6X 9KG (2024) (v6.92.6600) | |
| AIDA64 / CPU ZLib | |
| Average of class Gaming (574 - 2531, n=107, last 2 years) | |
| Dell G16, i7-13650HX, RTX 4060 (v6.92.6600) | |
| HP Victus 16 (2024) (v6.92.6600) | |
| Asus TUF Gaming A15 FA507UV (v6.92.6600, Turbo) | |
| Average AMD Ryzen 9 8945H (1150 - 1164, n=2) | |
| Asus TUF Gaming A15 FA507UV (v6.92.6600) | |
| Gigabyte G6X 9KG (2024) (v6.92.6600) | |
| Lenovo LOQ 15IRX9 (v6.92.6600) | |
| Schenker XMG Core 15 (M24) (v6.92.6600) | |
| Asus TUF A15 FA507 (v6.85.6300) | |
| AIDA64 / FP64 Ray-Trace | |
| Average of class Gaming (5509 - 45446, n=107, last 2 years) | |
| Schenker XMG Core 15 (M24) (v6.92.6600) | |
| Asus TUF Gaming A15 FA507UV (v6.92.6600, Turbo) | |
| Average AMD Ryzen 9 8945H (15513 - 15727, n=2) | |
| Asus TUF Gaming A15 FA507UV (v6.92.6600) | |
| Dell G16, i7-13650HX, RTX 4060 (v6.92.6600) | |
| HP Victus 16 (2024) (v6.92.6600) | |
| Asus TUF A15 FA507 (v6.85.6300) | |
| Lenovo LOQ 15IRX9 (v6.92.6600) | |
| Gigabyte G6X 9KG (2024) (v6.92.6600) | |
| AIDA64 / CPU PhotoWorxx | |
| Average of class Gaming (12271 - 89891, n=107, last 2 years) | |
| Schenker XMG Core 15 (M24) (v6.92.6600) | |
| HP Victus 16 (2024) (v6.92.6600) | |
| Gigabyte G6X 9KG (2024) (v6.92.6600) | |
| Lenovo LOQ 15IRX9 (v6.92.6600) | |
| Dell G16, i7-13650HX, RTX 4060 (v6.92.6600) | |
| Asus TUF Gaming A15 FA507UV (v6.92.6600) | |
| Average AMD Ryzen 9 8945H (33327 - 33410, n=2) | |
| Asus TUF Gaming A15 FA507UV (v6.92.6600, Turbo) | |
| Asus TUF A15 FA507 (v6.85.6300) | |
System performance
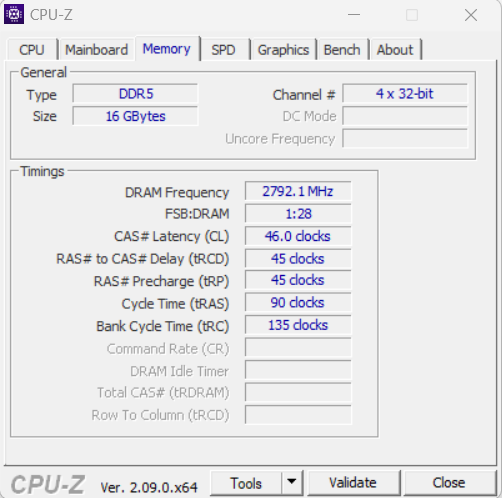
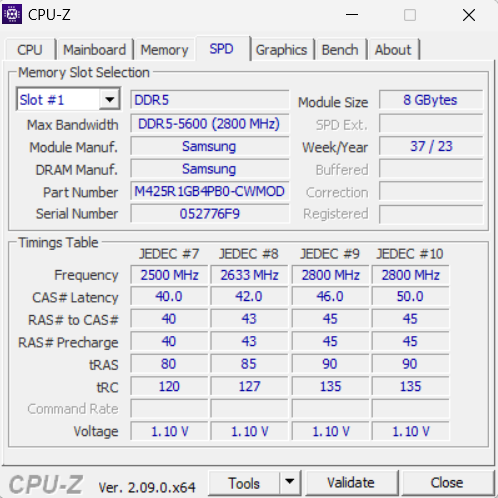
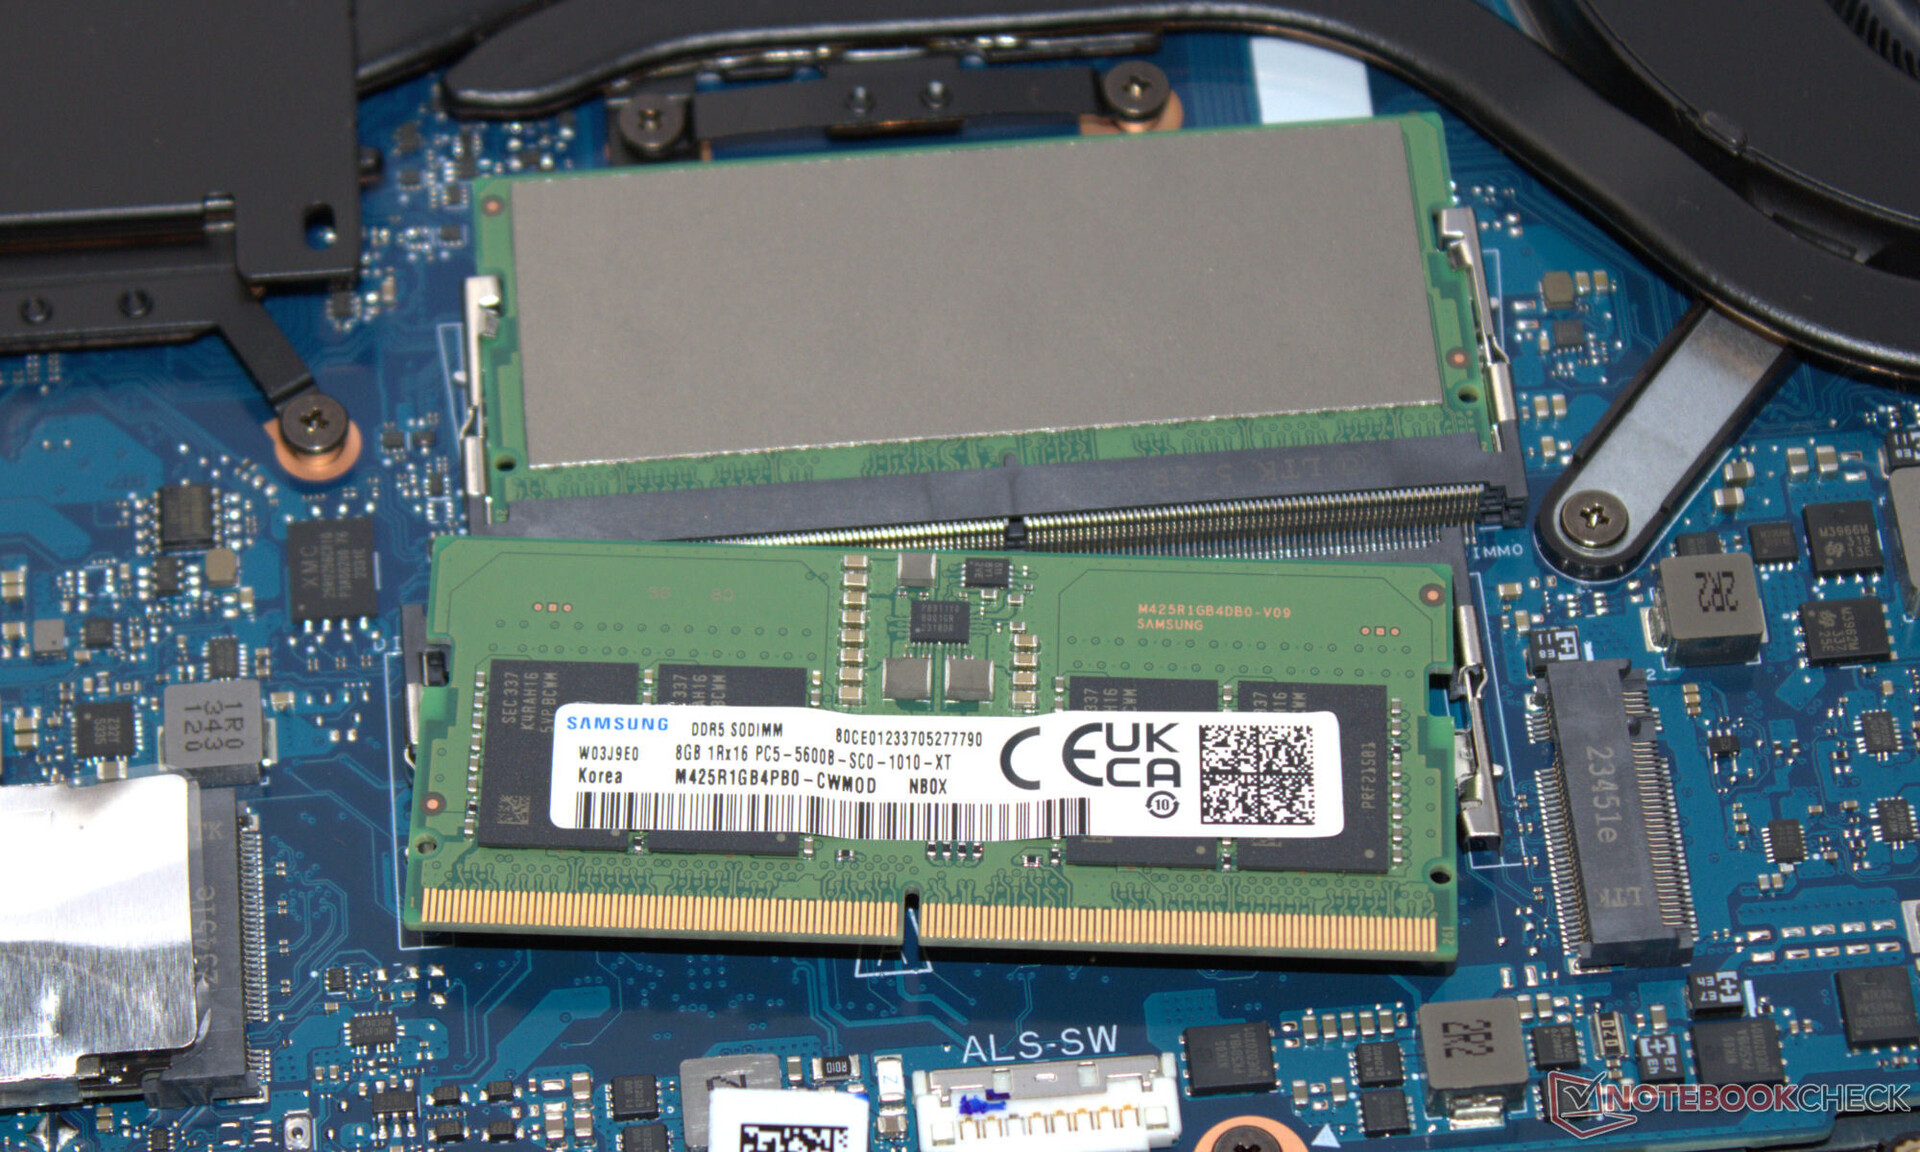
The smooth-running system delivers sufficient power for rendering, streaming and gaming - this is confirmed by the good PC Mark results. The RAM's transfer speeds are on a normal level for DDR5 5600 RAM.
CrossMark: Overall | Productivity | Creativity | Responsiveness
WebXPRT 3: Overall
WebXPRT 4: Overall
Mozilla Kraken 1.1: Total
| PCMark 10 / Score | |
| Schenker XMG Core 15 (M24) | |
| Average of class Gaming (5828 - 11574, n=95, last 2 years) | |
| Asus TUF Gaming A15 FA507UV | |
| Average AMD Ryzen 9 8945H, NVIDIA GeForce RTX 4060 Laptop GPU (n=1) | |
| Gigabyte G6X 9KG (2024) | |
| HP Victus 16 (2024) | |
| Dell G16, i7-13650HX, RTX 4060 | |
| Asus TUF A15 FA507 | |
| Lenovo LOQ 15IRX9 | |
| PCMark 10 / Essentials | |
| Asus TUF Gaming A15 FA507UV | |
| Average AMD Ryzen 9 8945H, NVIDIA GeForce RTX 4060 Laptop GPU (n=1) | |
| HP Victus 16 (2024) | |
| Average of class Gaming (8810 - 12600, n=99, last 2 years) | |
| Asus TUF A15 FA507 | |
| Gigabyte G6X 9KG (2024) | |
| Schenker XMG Core 15 (M24) | |
| Dell G16, i7-13650HX, RTX 4060 | |
| Lenovo LOQ 15IRX9 | |
| PCMark 10 / Productivity | |
| Schenker XMG Core 15 (M24) | |
| Average of class Gaming (6845 - 21327, n=97, last 2 years) | |
| Asus TUF Gaming A15 FA507UV | |
| Average AMD Ryzen 9 8945H, NVIDIA GeForce RTX 4060 Laptop GPU (n=1) | |
| Gigabyte G6X 9KG (2024) | |
| Dell G16, i7-13650HX, RTX 4060 | |
| HP Victus 16 (2024) | |
| Asus TUF A15 FA507 | |
| Lenovo LOQ 15IRX9 | |
| PCMark 10 / Digital Content Creation | |
| Average of class Gaming (7602 - 19657, n=97, last 2 years) | |
| Schenker XMG Core 15 (M24) | |
| Asus TUF Gaming A15 FA507UV | |
| Average AMD Ryzen 9 8945H, NVIDIA GeForce RTX 4060 Laptop GPU (n=1) | |
| Dell G16, i7-13650HX, RTX 4060 | |
| Gigabyte G6X 9KG (2024) | |
| Lenovo LOQ 15IRX9 | |
| HP Victus 16 (2024) | |
| Asus TUF A15 FA507 | |
| CrossMark / Overall | |
| Average of class Gaming (1366 - 2409, n=96, last 2 years) | |
| Gigabyte G6X 9KG (2024) | |
| HP Victus 16 (2024) | |
| Schenker XMG Core 15 (M24) | |
| Dell G16, i7-13650HX, RTX 4060 | |
| Lenovo LOQ 15IRX9 | |
| Asus TUF Gaming A15 FA507UV | |
| Average AMD Ryzen 9 8945H, NVIDIA GeForce RTX 4060 Laptop GPU (n=1) | |
| Asus TUF A15 FA507 | |
| CrossMark / Productivity | |
| Gigabyte G6X 9KG (2024) | |
| Average of class Gaming (1386 - 2254, n=96, last 2 years) | |
| Schenker XMG Core 15 (M24) | |
| HP Victus 16 (2024) | |
| Asus TUF Gaming A15 FA507UV | |
| Average AMD Ryzen 9 8945H, NVIDIA GeForce RTX 4060 Laptop GPU (n=1) | |
| Dell G16, i7-13650HX, RTX 4060 | |
| Lenovo LOQ 15IRX9 | |
| Asus TUF A15 FA507 | |
| CrossMark / Creativity | |
| Average of class Gaming (1343 - 2729, n=96, last 2 years) | |
| HP Victus 16 (2024) | |
| Schenker XMG Core 15 (M24) | |
| Gigabyte G6X 9KG (2024) | |
| Dell G16, i7-13650HX, RTX 4060 | |
| Asus TUF Gaming A15 FA507UV | |
| Average AMD Ryzen 9 8945H, NVIDIA GeForce RTX 4060 Laptop GPU (n=1) | |
| Lenovo LOQ 15IRX9 | |
| Asus TUF A15 FA507 | |
| CrossMark / Responsiveness | |
| Gigabyte G6X 9KG (2024) | |
| HP Victus 16 (2024) | |
| Lenovo LOQ 15IRX9 | |
| Average of class Gaming (1226 - 2334, n=96, last 2 years) | |
| Dell G16, i7-13650HX, RTX 4060 | |
| Schenker XMG Core 15 (M24) | |
| Asus TUF Gaming A15 FA507UV | |
| Average AMD Ryzen 9 8945H, NVIDIA GeForce RTX 4060 Laptop GPU (n=1) | |
| Asus TUF A15 FA507 | |
| WebXPRT 3 / Overall | |
| Average of class Gaming (220 - 532, n=100, last 2 years) | |
| Asus TUF Gaming A15 FA507UV | |
| Average AMD Ryzen 9 8945H, NVIDIA GeForce RTX 4060 Laptop GPU (n=1) | |
| Schenker XMG Core 15 (M24) | |
| Gigabyte G6X 9KG (2024) | |
| Asus TUF A15 FA507 | |
| HP Victus 16 (2024) | |
| Dell G16, i7-13650HX, RTX 4060 | |
| Lenovo LOQ 15IRX9 | |
| WebXPRT 4 / Overall | |
| Average of class Gaming (165 - 354, n=101, last 2 years) | |
| Schenker XMG Core 15 (M24) | |
| Asus TUF Gaming A15 FA507UV | |
| Average AMD Ryzen 9 8945H, NVIDIA GeForce RTX 4060 Laptop GPU (n=1) | |
| Gigabyte G6X 9KG (2024) | |
| HP Victus 16 (2024) | |
| Lenovo LOQ 15IRX9 | |
| Asus TUF A15 FA507 | |
| Mozilla Kraken 1.1 / Total | |
| Asus TUF A15 FA507 | |
| Lenovo LOQ 15IRX9 | |
| HP Victus 16 (2024) | |
| Gigabyte G6X 9KG (2024) | |
| Dell G16, i7-13650HX, RTX 4060 | |
| Asus TUF Gaming A15 FA507UV | |
| Average AMD Ryzen 9 8945H, NVIDIA GeForce RTX 4060 Laptop GPU (n=1) | |
| Schenker XMG Core 15 (M24) | |
| Average of class Gaming (391 - 590, n=104, last 2 years) | |
* ... smaller is better
| PCMark 10 Score | 7943 points | |
Help | ||
| AIDA64 / Memory Copy | |
| Average of class Gaming (21750 - 129946, n=107, last 2 years) | |
| Schenker XMG Core 15 (M24) | |
| HP Victus 16 (2024) | |
| Average AMD Ryzen 9 8945H (61823 - 63192, n=2) | |
| Asus TUF Gaming A15 FA507UV | |
| Gigabyte G6X 9KG (2024) | |
| Dell G16, i7-13650HX, RTX 4060 | |
| Lenovo LOQ 15IRX9 | |
| Asus TUF A15 FA507 | |
| AIDA64 / Memory Read | |
| HP Victus 16 (2024) | |
| Average of class Gaming (22956 - 118858, n=107, last 2 years) | |
| Gigabyte G6X 9KG (2024) | |
| Lenovo LOQ 15IRX9 | |
| Dell G16, i7-13650HX, RTX 4060 | |
| Average AMD Ryzen 9 8945H (61696 - 61810, n=2) | |
| Asus TUF Gaming A15 FA507UV | |
| Schenker XMG Core 15 (M24) | |
| Asus TUF A15 FA507 | |
| AIDA64 / Memory Write | |
| Schenker XMG Core 15 (M24) | |
| Average AMD Ryzen 9 8945H (78716 - 79615, n=2) | |
| Asus TUF Gaming A15 FA507UV | |
| Average of class Gaming (22297 - 135096, n=107, last 2 years) | |
| HP Victus 16 (2024) | |
| Gigabyte G6X 9KG (2024) | |
| Lenovo LOQ 15IRX9 | |
| Dell G16, i7-13650HX, RTX 4060 | |
| Asus TUF A15 FA507 | |
| AIDA64 / Memory Latency | |
| Average of class Gaming (75.3 - 259, n=107, last 2 years) | |
| HP Victus 16 (2024) | |
| Lenovo LOQ 15IRX9 | |
| Asus TUF Gaming A15 FA507UV | |
| Average AMD Ryzen 9 8945H (92 - 92.6, n=2) | |
| Dell G16, i7-13650HX, RTX 4060 | |
| Gigabyte G6X 9KG (2024) | |
| Schenker XMG Core 15 (M24) | |
| Asus TUF A15 FA507 | |
* ... smaller is better
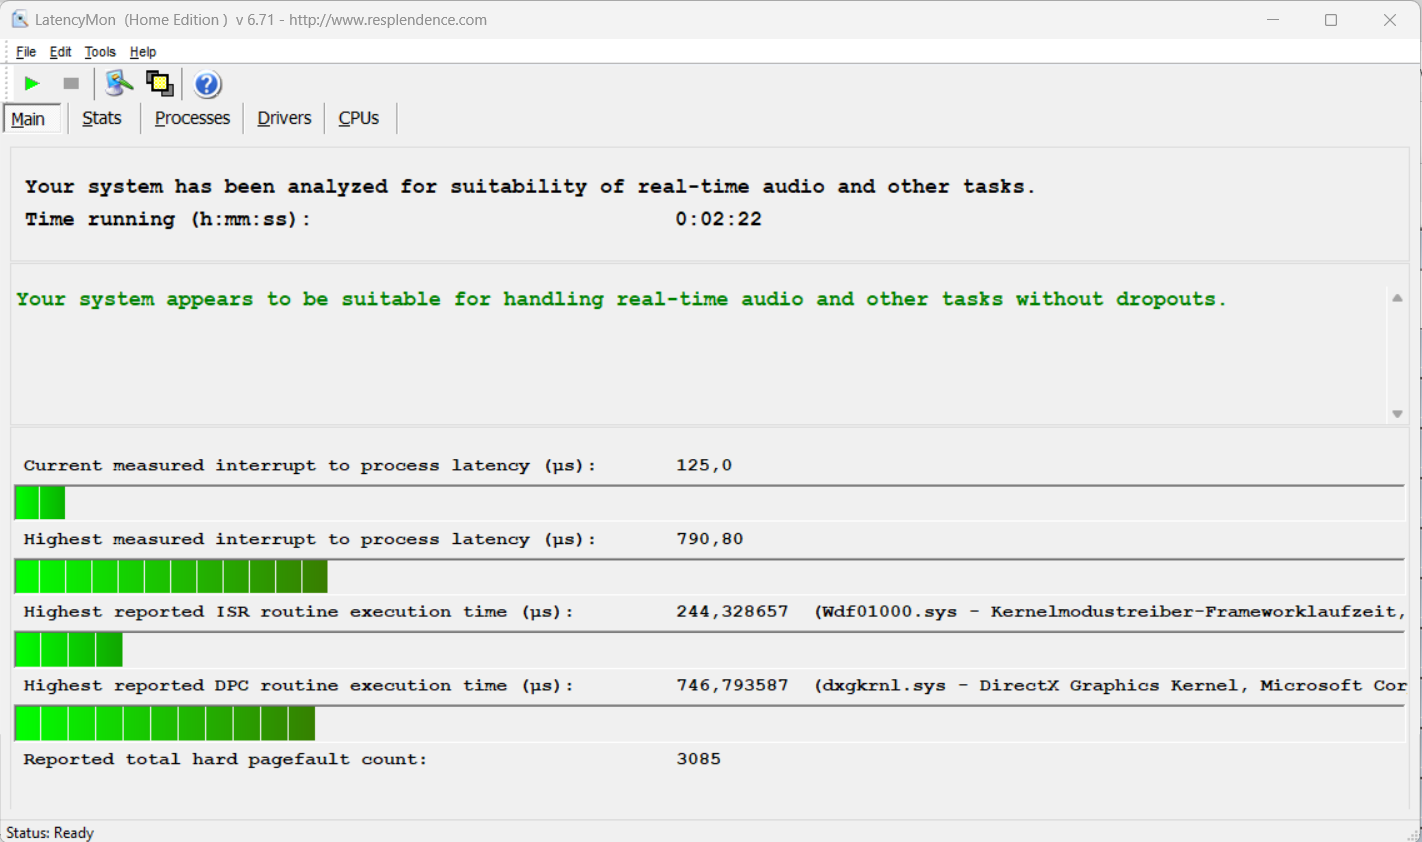
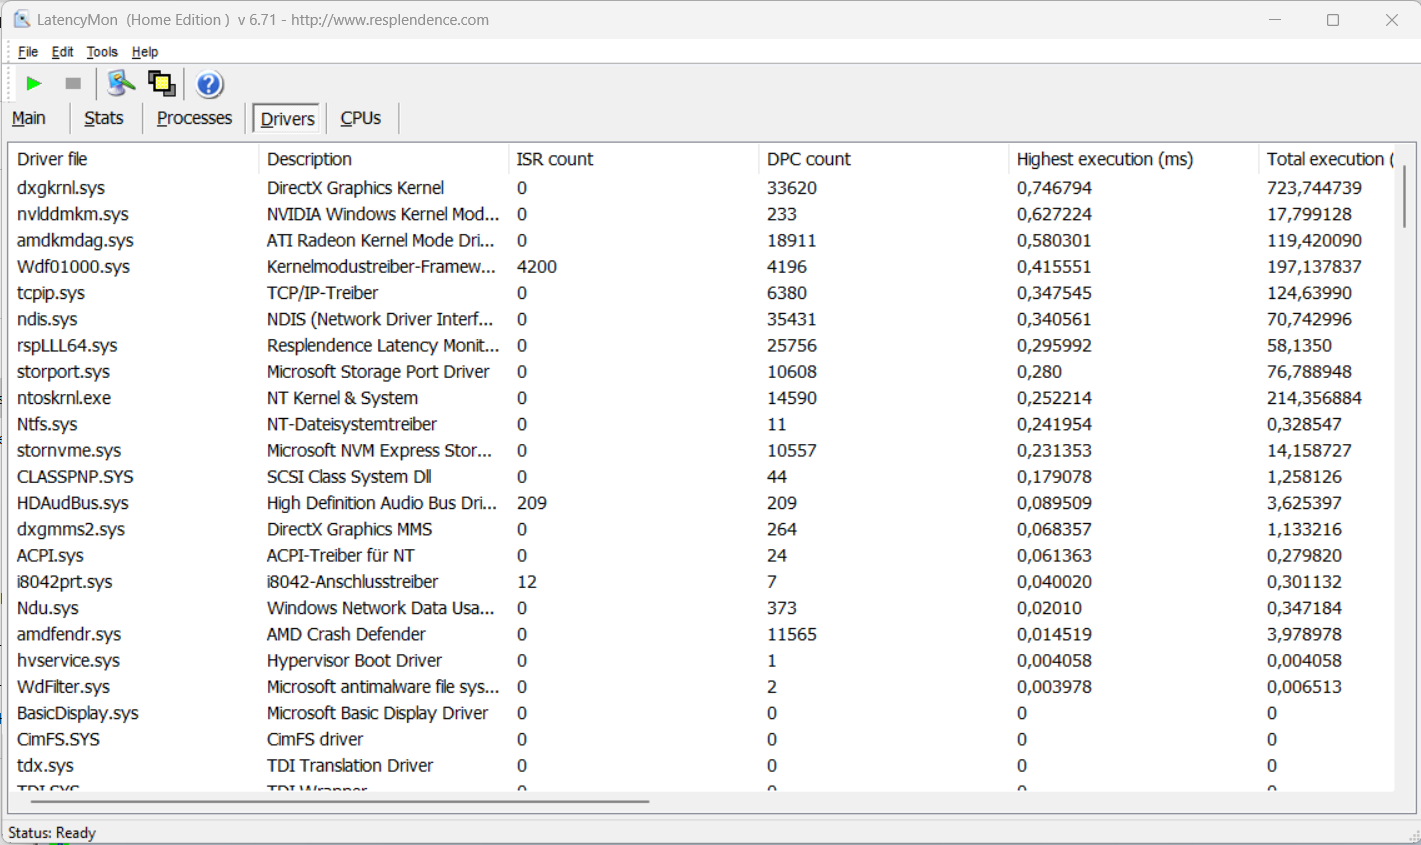
DPC latencies
The latency test (surfing the internet, 4k video playback, Prime95 high load) revealed no anomalies. The system appears to be well-suited to real-time video and audio editing. Future software updates could either improve or worsen this area.
| DPC Latencies / LatencyMon - interrupt to process latency (max), Web, Youtube, Prime95 | |
| Gigabyte G6X 9KG (2024) | |
| Lenovo LOQ 15IRX9 | |
| Schenker XMG Core 15 (M24) | |
| Dell G16, i7-13650HX, RTX 4060 | |
| HP Victus 16 (2024) | |
| Asus TUF Gaming A15 FA507UV | |
* ... smaller is better
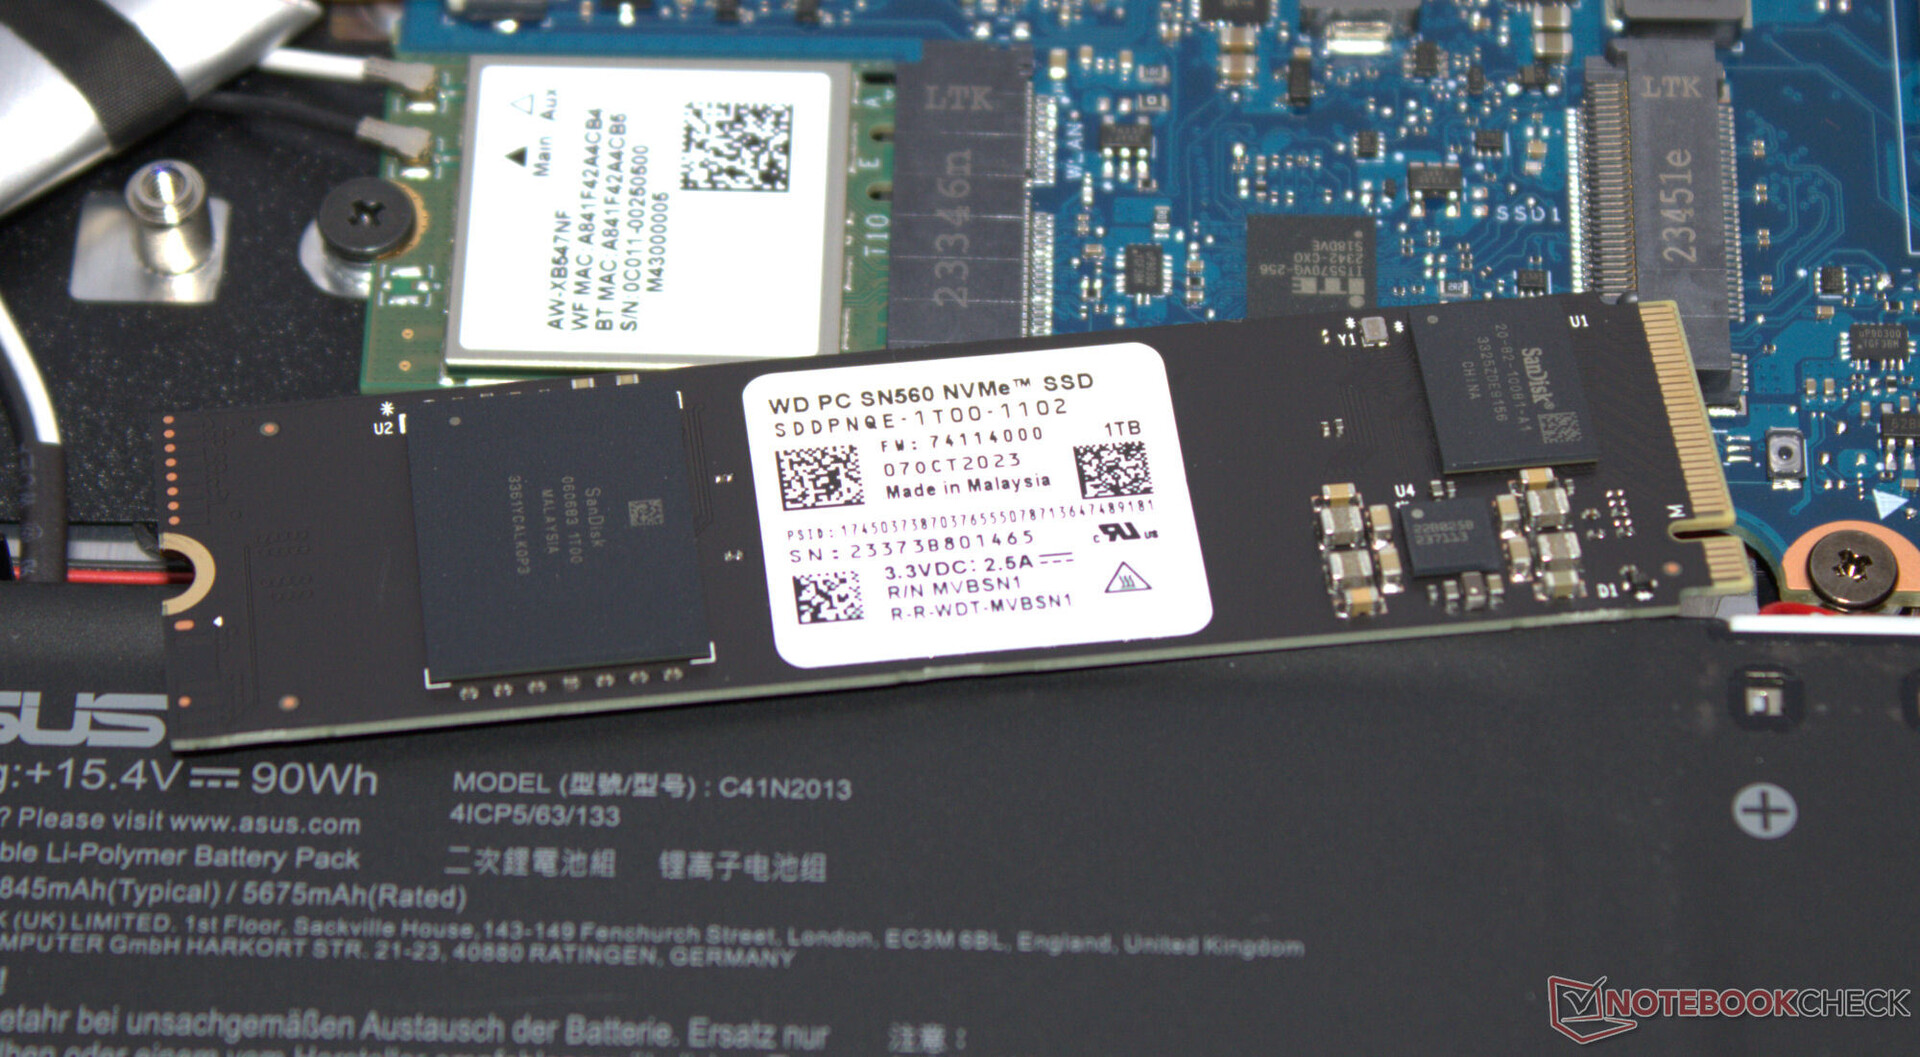
Mass storage
Two PCIe 4 SSDs (M.2 2280) can be accommodated inside the A15, one SSD is installed: The Western Digital storage device (1 TB, M.2 2280) delivers good data transfer speeds but doesn't belong to the top SSD models. In the latter stages of the DiskSpd loop, we observed thermally induced throttling.

* ... smaller is better
Continuous Performance Read: DiskSpd Read Loop, Queue Depth 8
Graphics card
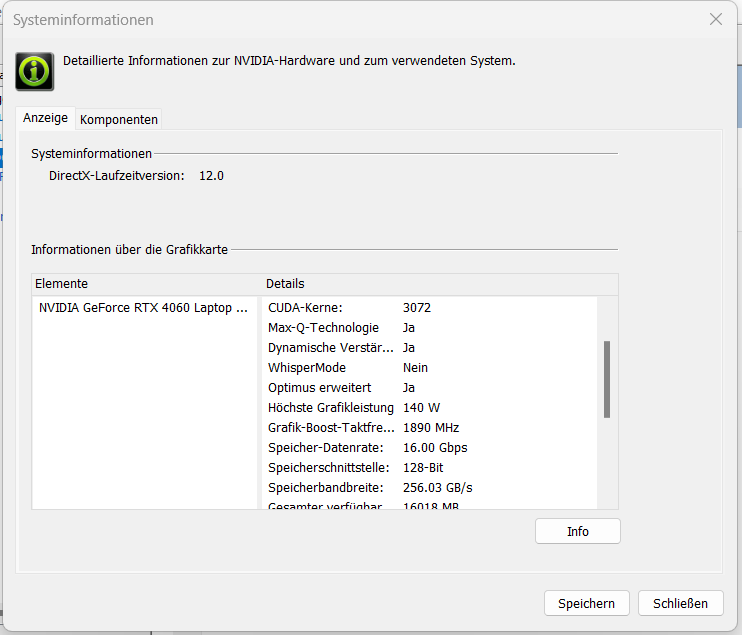
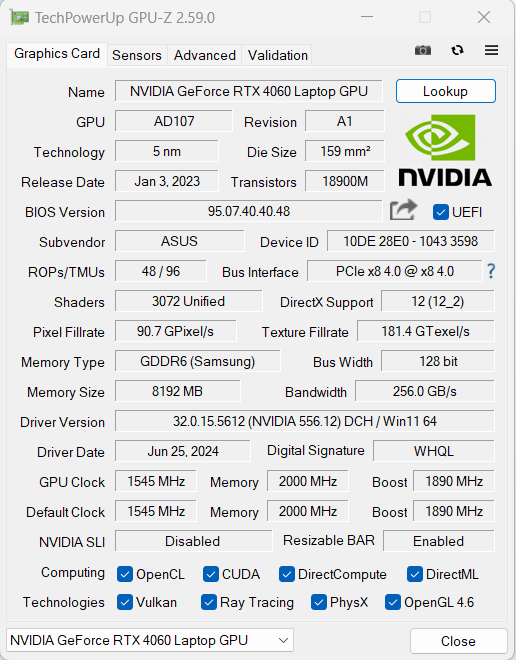
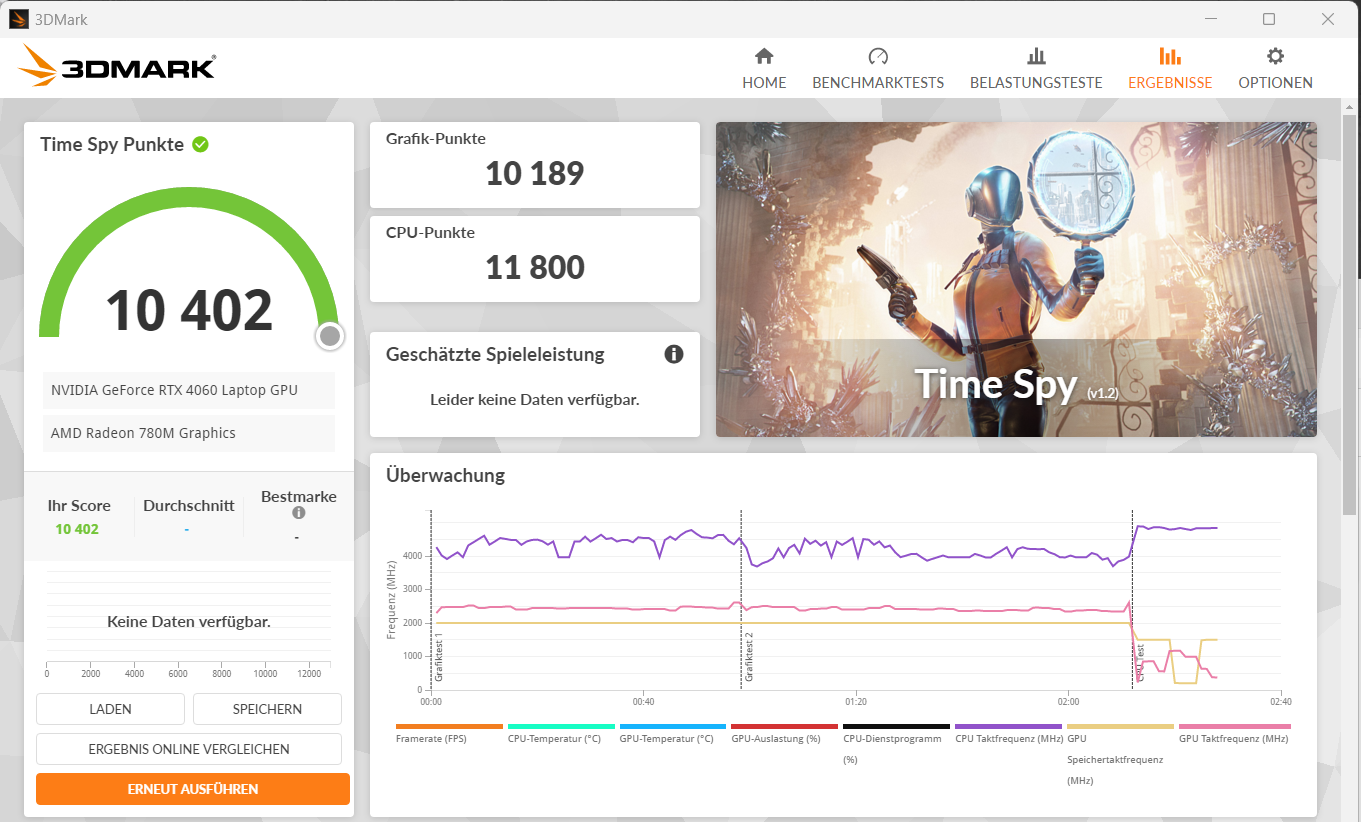
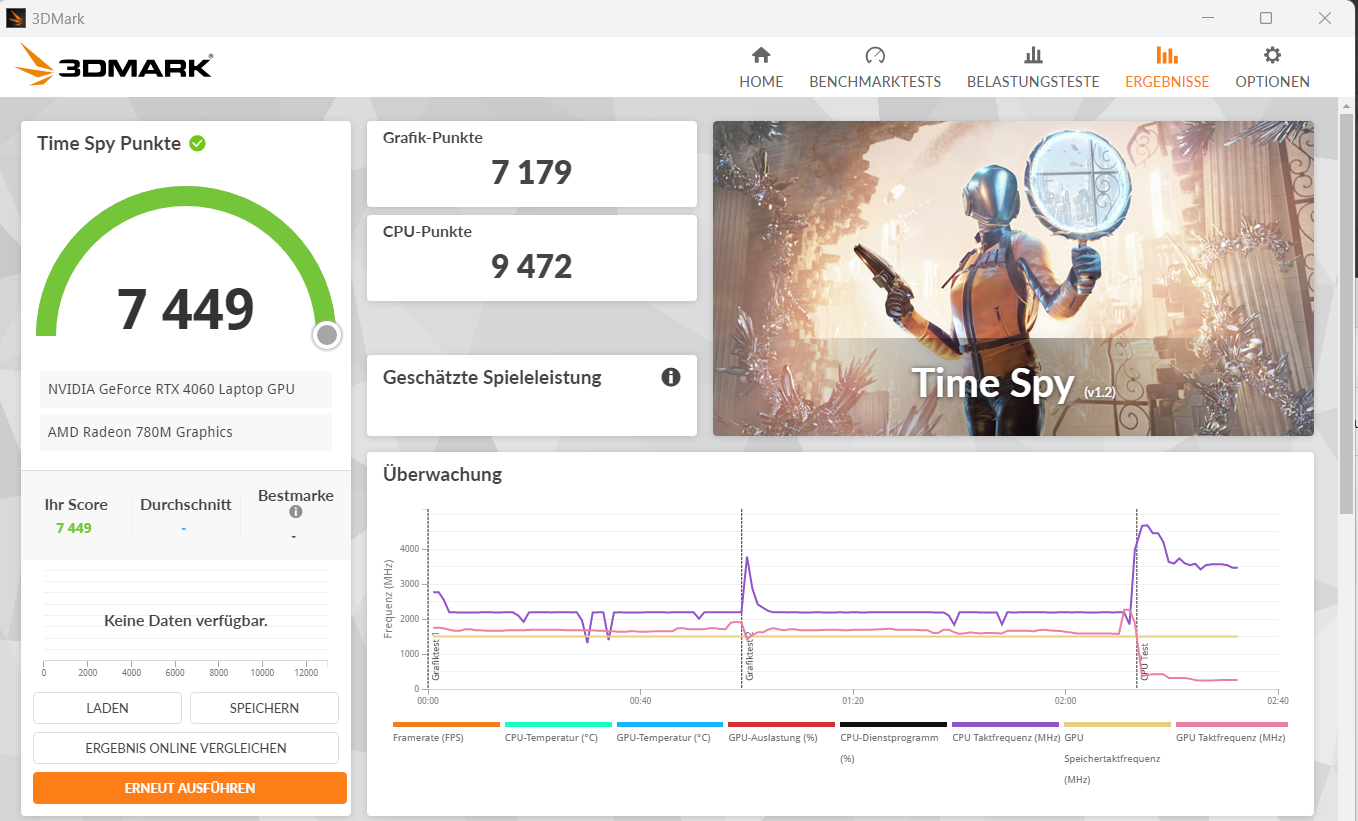
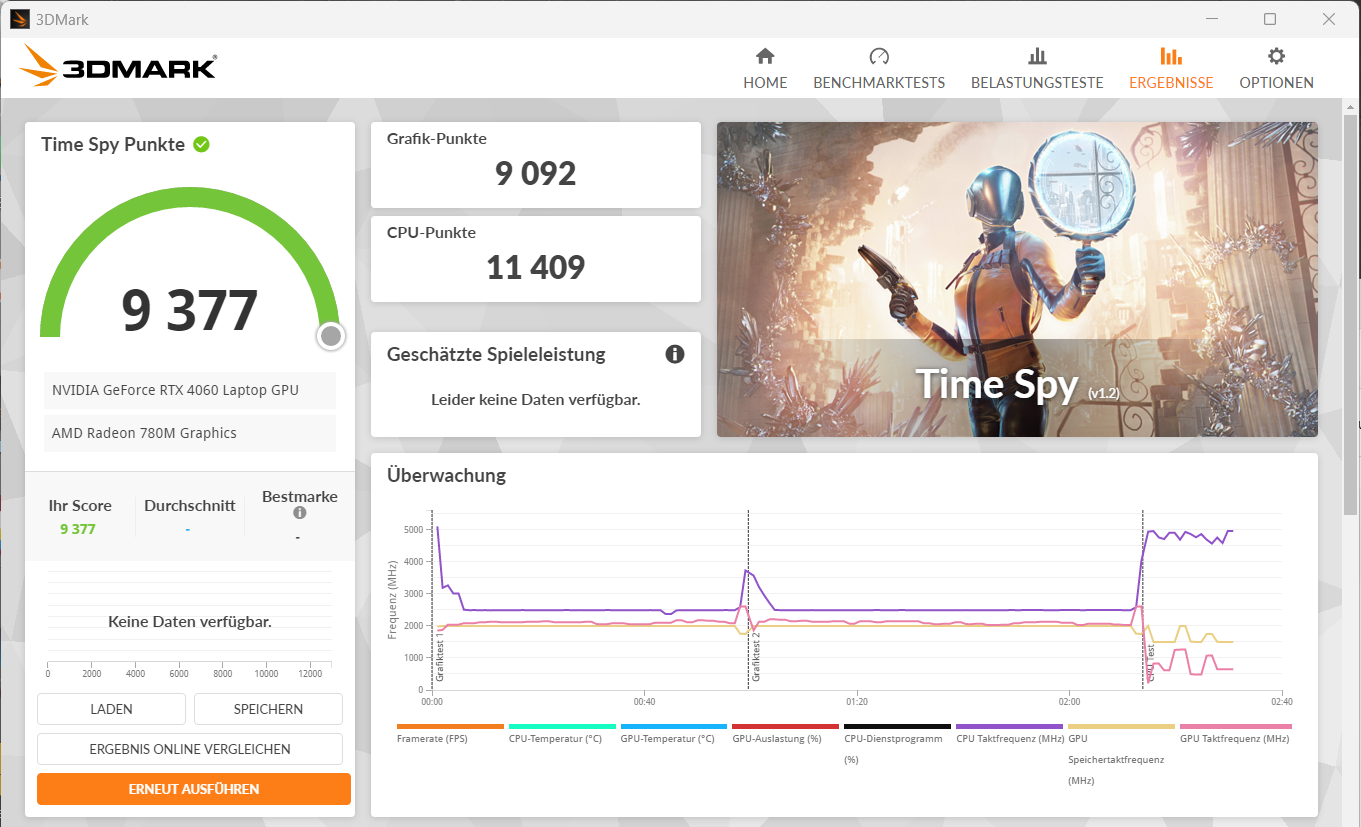
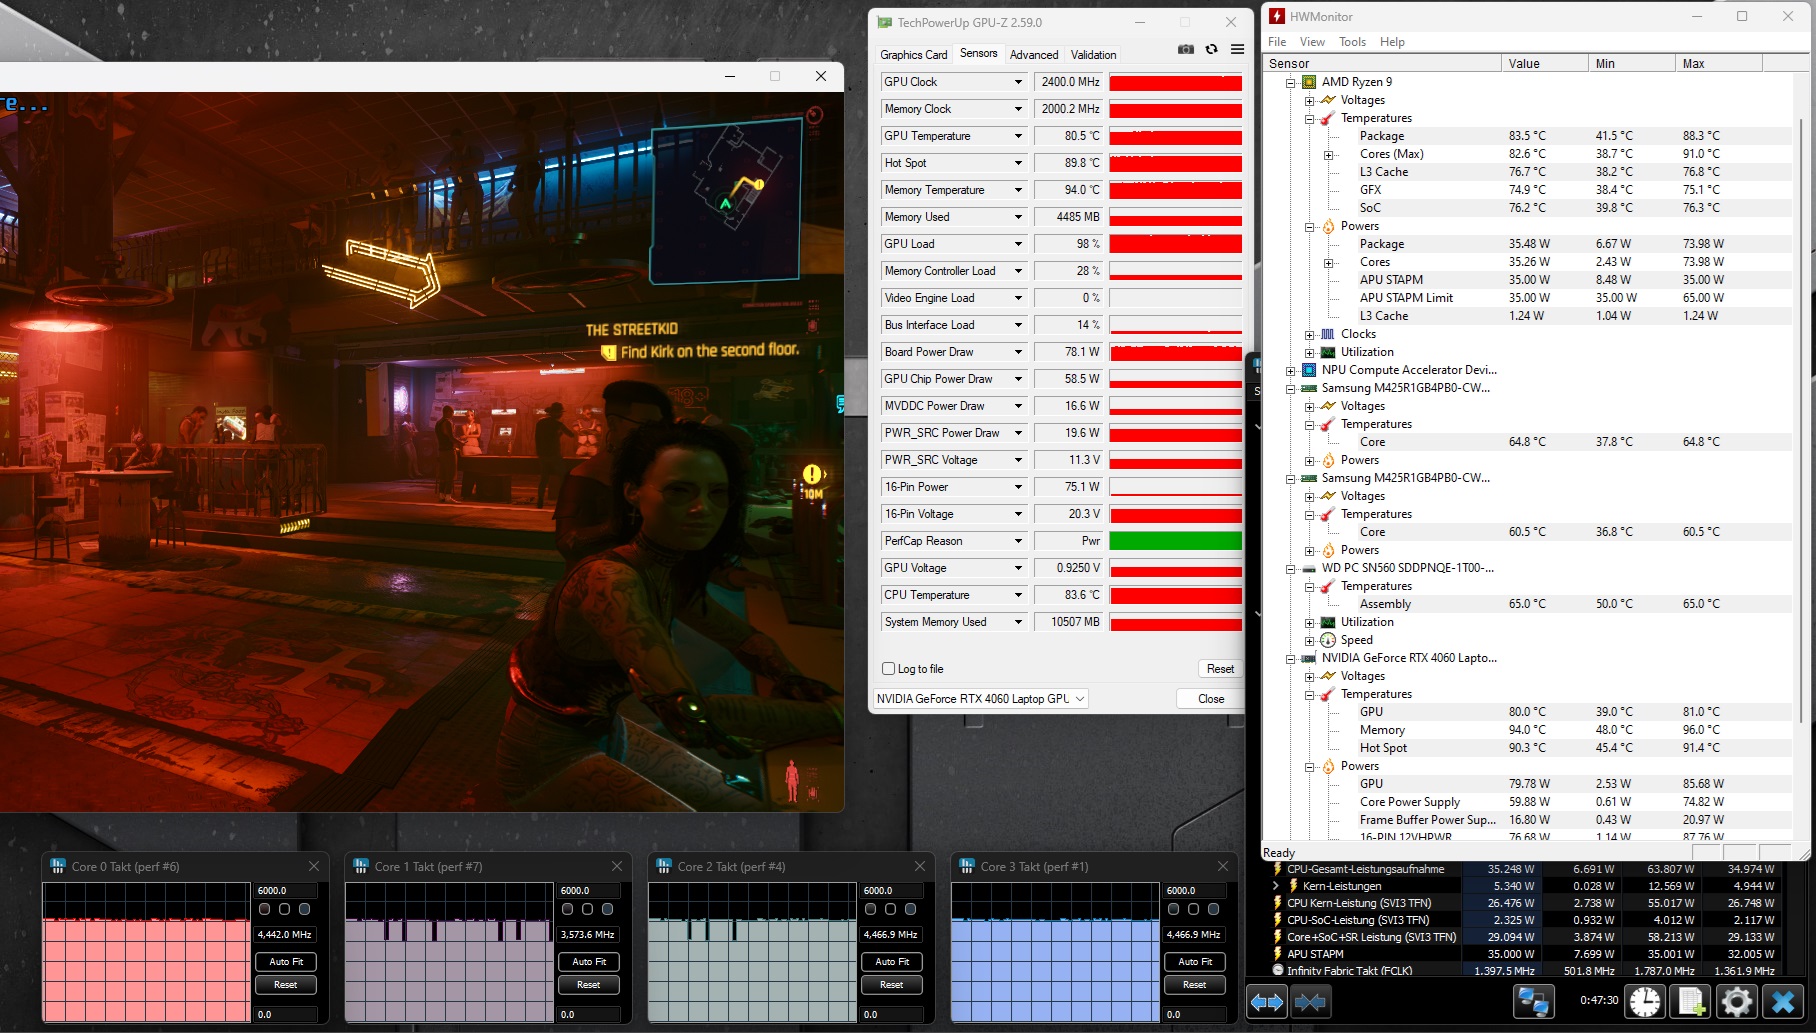
The GeForce RTX 4060 (3,072 shaders 128-bit bus, 8 GB GDDR6, 140-watt) is designed for FHD gaming at high to maximum settings. Benchmark scores and frame rates are on par with the RTX 4060 average ("Performance"). In some cases, the profile "Turbo" only results in a minimal increase. The switch between dGPU and Optimus doesn't require a reboot: Advanced Optimus is supported.

| 3DMark 06 Standard Score | 55024 points | |
| 3DMark 11 Performance | 31639 points | |
| 3DMark Fire Strike Score | 25032 points | |
| 3DMark Time Spy Score | 10402 points | |
| 3DMark Steel Nomad Score | 2200 points | |
Help | ||
| Geekbench 6.7 | |
| GPU OpenCL | |
| Average of class Gaming (67235 - 253130, n=106, last 2 years) | |
| Gigabyte G6X 9KG (2024) (6.2.1) | |
| Schenker XMG Core 15 (M24) (6.2.1) | |
| HP Victus 16 (2024) (6.2.1) | |
| Asus TUF Gaming A15 FA507UV (6.2.1 Turbo) | |
| Dell G16, i7-13650HX, RTX 4060 (6.2.1) | |
| Asus TUF Gaming A15 FA507UV (6.2.1) | |
| Average NVIDIA GeForce RTX 4060 Laptop GPU (76525 - 100831, n=39) | |
| Lenovo LOQ 15IRX9 (6.2.1) | |
| GPU Vulkan | |
| Average of class Gaming (7562 - 231659, n=59, last 2 years) | |
| Schenker XMG Core 15 (M24) (6.2.1) | |
| Asus TUF Gaming A15 FA507UV (6.2.1) | |
| Asus TUF Gaming A15 FA507UV (6.2.1 Turbo) | |
| Gigabyte G6X 9KG (2024) (6.2.1) | |
| Lenovo LOQ 15IRX9 (6.2.1) | |
| Average NVIDIA GeForce RTX 4060 Laptop GPU (75631 - 101001, n=24) | |
| HP Victus 16 (2024) (6.2.1) | |
| V-Ray Benchmark Next 4.10 | |
| GPU | |
| Average of class Gaming (427 - 1627, n=103, last 2 years) | |
| Schenker XMG Core 15 (M24) (v4.10.07 ) | |
| Asus TUF Gaming A15 FA507UV (v4.10.07, Turbo) | |
| Gigabyte G6X 9KG (2024) (v4.10.07 ) | |
| Asus TUF Gaming A15 FA507UV (v4.10.07 ) | |
| Average NVIDIA GeForce RTX 4060 Laptop GPU (483 - 715, n=46) | |
| HP Victus 16 (2024) (v4.10.07 ) | |
| Lenovo LOQ 15IRX9 (v4.10.07 ) | |
| Asus TUF A15 FA507 (v4.10.07 ) | |
| CPU | |
| Average of class Gaming (10048 - 45327, n=101, last 2 years) | |
| HP Victus 16 (2024) (v4.10.07 ) | |
| Average NVIDIA GeForce RTX 4060 Laptop GPU (12680 - 32360, n=46) | |
| Schenker XMG Core 15 (M24) (v4.10.07 ) | |
| Gigabyte G6X 9KG (2024) (v4.10.07 ) | |
| Asus TUF Gaming A15 FA507UV (v4.10.07, Turbo) | |
| Asus TUF Gaming A15 FA507UV (v4.10.07 ) | |
| Lenovo LOQ 15IRX9 (v4.10.07 ) | |
| Asus TUF A15 FA507 (v4.10.07 ) | |
* ... smaller is better
| Cyberpunk 2077 - 1920x1080 Ultra Preset (FSR off) | |
| Average of class Gaming (17.7 - 169.9, n=118, last 2 years) | |
| Schenker XMG Core 15 (M24) (2.12) | |
| Asus TUF Gaming A15 FA507UV (2.12) | |
| Asus TUF Gaming A15 FA507UV (2.12, Turbo) | |
| Average NVIDIA GeForce RTX 4060 Laptop GPU (56.4 - 93.1, n=31) | |
| Lenovo LOQ 15IRX9 (2.02) | |
| Dell G16, i7-13650HX, RTX 4060 (2.11) | |
| Gigabyte G6X 9KG (2024) (2.02) | |
| HP Victus 16 (2024) (2.02) | |
| Final Fantasy XV Benchmark - 1920x1080 High Quality | |
| Average of class Gaming (41 - 215, n=98, last 2 years) | |
| Schenker XMG Core 15 (M24) (1.3) | |
| Asus TUF Gaming A15 FA507UV (1.3, Turbo) | |
| Dell G16, i7-13650HX, RTX 4060 (1.3) | |
| Gigabyte G6X 9KG (2024) (1.3) | |
| Asus TUF Gaming A15 FA507UV (1.3) | |
| Lenovo LOQ 15IRX9 (1.3) | |
| HP Victus 16 (2024) (1.3) | |
| Average NVIDIA GeForce RTX 4060 Laptop GPU (75.1 - 109.8, n=51) | |
| Asus TUF A15 FA507 (1.3) | |
| Strange Brigade - 1920x1080 ultra AA:ultra AF:16 | |
| Average of class Gaming (76.3 - 456, n=88, last 2 years) | |
| Schenker XMG Core 15 (M24) (1.47.22.14 D3D12) | |
| Dell G16, i7-13650HX, RTX 4060 (1.47.22.14 D3D12) | |
| Asus TUF Gaming A15 FA507UV (1.47.22.14 D3D12, Turbo) | |
| Asus TUF Gaming A15 FA507UV (1.47.22.14 D3D12) | |
| Lenovo LOQ 15IRX9 (1.47.22.14 D3D12) | |
| Gigabyte G6X 9KG (2024) (1.47.22.14 D3D12) | |
| Average NVIDIA GeForce RTX 4060 Laptop GPU (135.3 - 210, n=50) | |
| HP Victus 16 (2024) (1.47.22.14 D3D12) | |
| Asus TUF A15 FA507 | |
| Baldur's Gate 3 - 1920x1080 Ultra Preset AA:T | |
| Average of class Gaming (59.4 - 246, n=105, last 2 years) | |
| Schenker XMG Core 15 (M24) | |
| Asus TUF Gaming A15 FA507UV | |
| Average NVIDIA GeForce RTX 4060 Laptop GPU (66.5 - 105.5, n=19) | |
| F1 24 - 1920x1080 Ultra High Preset AA:T AF:16x | |
| Average of class Gaming (46.1 - 157.8, n=57, last 2 years) | |
| Average NVIDIA GeForce RTX 4060 Laptop GPU (47.5 - 61.6, n=10) | |
| Asus TUF Gaming A15 FA507UV (1126333) | |
| Lenovo LOQ 15IRX9 (1122588) | |
| The First Descendant - 1920x1080 Ultra Preset | |
| Average NVIDIA GeForce RTX 4060 Laptop GPU (67.6 - 69.4, n=3) | |
| Asus TUF Gaming A15 FA507UV | |
| Average of class Gaming (15.4 - 78.6, n=3, last 2 years) | |
| Ghost of Tsushima - 1920x1080 Very High Preset AA:T | |
| Average of class Gaming (28.5 - 108.1, n=15, last 2 years) | |
| Asus TUF Gaming A15 FA507UV | |
| Lenovo LOQ 15IRX9 | |
| Average NVIDIA GeForce RTX 4060 Laptop GPU (55.6 - 63.4, n=5) | |
| Senua's Saga Hellblade 2 - 1920x1080 High Preset | |
| Average of class Gaming (33.9 - 86.1, n=13, last 2 years) | |
| Asus TUF Gaming A15 FA507UV | |
| Average NVIDIA GeForce RTX 4060 Laptop GPU (37.6 - 39.5, n=3) | |
| Lenovo LOQ 15IRX9 | |
| Dragon's Dogma 2 - 1920x1080 High Preset | |
| Average of class Gaming (61.5 - 99.3, n=6, last 2 years) | |
| HP Victus 16 (2024) | |
| Lenovo LOQ 15IRX9 | |
| Average NVIDIA GeForce RTX 4060 Laptop GPU (57.2 - 67.7, n=5) | |
| Asus TUF Gaming A15 FA507UV | |
Cyberpunk 2077 ultra FPS diagram
| low | med. | high | ultra | |
|---|---|---|---|---|
| GTA V (2015) | 182.6 | 177 | 168 | 107.2 |
| Dota 2 Reborn (2015) | 171.5 | 154.9 | 149.3 | 139.5 |
| Final Fantasy XV Benchmark (2018) | 210 | 138.8 | 100.7 | |
| X-Plane 11.11 (2018) | 135.3 | 117.5 | 91.7 | |
| Strange Brigade (2018) | 360 | 263 | 213 | 184.2 |
| Baldur's Gate 3 (2023) | 135 | 107.8 | 95.9 | 93.9 |
| Cyberpunk 2077 (2023) | 122.2 | 96.6 | 82.7 | 76.2 |
| Alone in the Dark (2024) | 159.1 | 150.1 | 143.8 | 126.9 |
| Dragon's Dogma 2 (2024) | 68.1 | 59.9 | ||
| Ghost of Tsushima (2024) | 94.1 | 83.9 | 76.9 | 62.1 |
| Senua's Saga Hellblade 2 (2024) | 66.1 | 55.1 | 39.5 | |
| F1 24 (2024) | 220 | 205 | 169.7 | 56.6 |
| The First Descendant (2024) | 155.5 | 96.8 | 79.1 | 67.6 |
Emissions & energy - A gaming laptop with very good battery life
Noise emissions
We are neither positively nor negatively surprised by the A15's noise production. Cyberpunk 2077 results in the noise level rising to a clearly audible 45 dB(A) ("Performance") and a very loud 56 dB(A) ("Turbo"). The "Quiet" mode is responsible for moderate noise levels at still playable frame rates. In everyday situations (office, internet) the two fans often operate at low speed and occasionally stand still.
Noise level
| Idle |
| 25 / 27 / 33 dB(A) |
| Load |
| 40 / 46 dB(A) |
 | ||
30 dB silent 40 dB(A) audible 50 dB(A) loud |
||
min: | ||
| Asus TUF Gaming A15 FA507UV GeForce RTX 4060 Laptop GPU, R9 8945H, WD PC SN560 SDDPNQE-1T00 | Lenovo LOQ 15IRX9 GeForce RTX 4060 Laptop GPU, i5-13450HX, Micron 2400 MTFDKCD1T0QFM | HP Victus 16 (2024) GeForce RTX 4060 Laptop GPU, i7-14700HX, Kioxia XG8 KXG80ZNV512G | Gigabyte G6X 9KG (2024) GeForce RTX 4060 Laptop GPU, i7-13650HX, Gigabyte AG450E1024-SI | Schenker XMG Core 15 (M24) GeForce RTX 4060 Laptop GPU, R7 8845HS, Samsung 990 Pro 1 TB | Dell G16, i7-13650HX, RTX 4060 GeForce RTX 4060 Laptop GPU, i7-13650HX, WD PC SN740 SDDPNQD-1T00 | Asus TUF A15 FA507 GeForce RTX 4050 Laptop GPU, R7 7735HS, Micron 2400 MTFDKBA512QFM | |
|---|---|---|---|---|---|---|---|
| Noise | -11% | -6% | -16% | 5% | 12% | 15% | |
| off / environment * (dB) | 25 | 25 -0% | 25 -0% | 26 -4% | 23 8% | 23 8% | 23.3 7% |
| Idle Minimum * (dB) | 25 | 26 -4% | 28 -12% | 30 -20% | 23 8% | 23 8% | 23.3 7% |
| Idle Average * (dB) | 27 | 34 -26% | 29 -7% | 32 -19% | 23 15% | 23 15% | 23.3 14% |
| Idle Maximum * (dB) | 33 | 36 -9% | 33 -0% | 35 -6% | 23 30% | 27.96 15% | 23.3 29% |
| Load Average * (dB) | 40 | 48 -20% | 45 -13% | 51 -27% | 38.92 3% | 27.96 30% | 29.6 26% |
| Cyberpunk 2077 ultra * (dB) | 45 | 48 -7% | 52.06 -16% | ||||
| Load Maximum * (dB) | 46 | 50 -9% | 48 -4% | 54 -17% | 52.09 -13% | 47.89 -4% | 43 7% |
| Witcher 3 ultra * (dB) | 43 | 51 | 50.96 | 47.89 | 43 |
* ... smaller is better
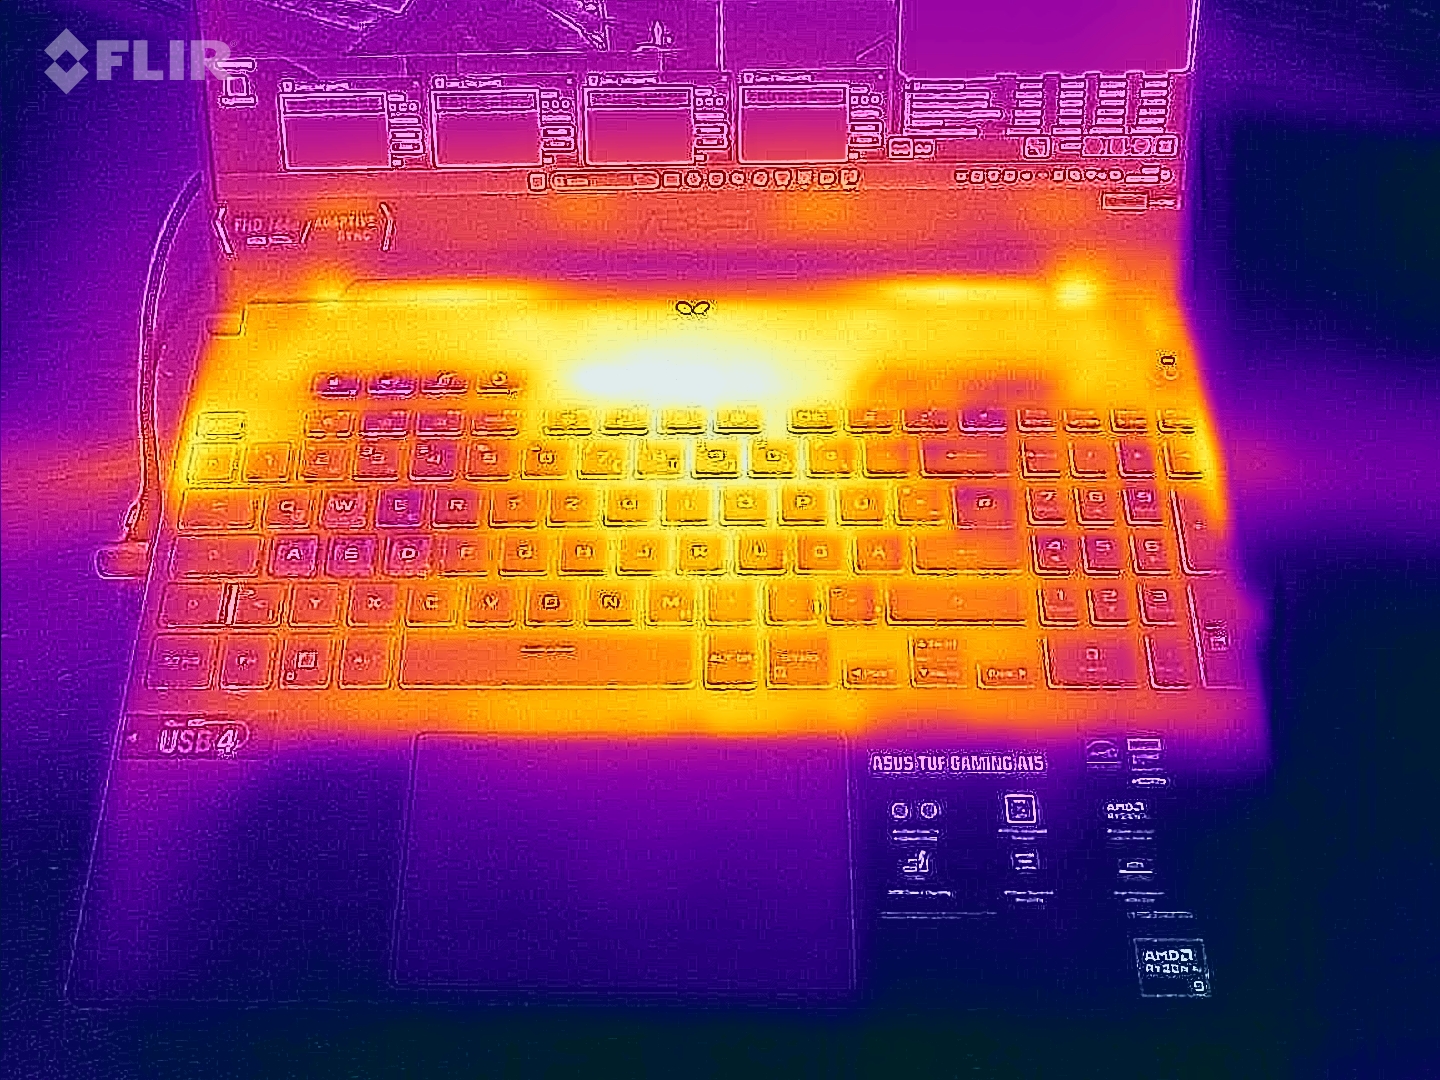
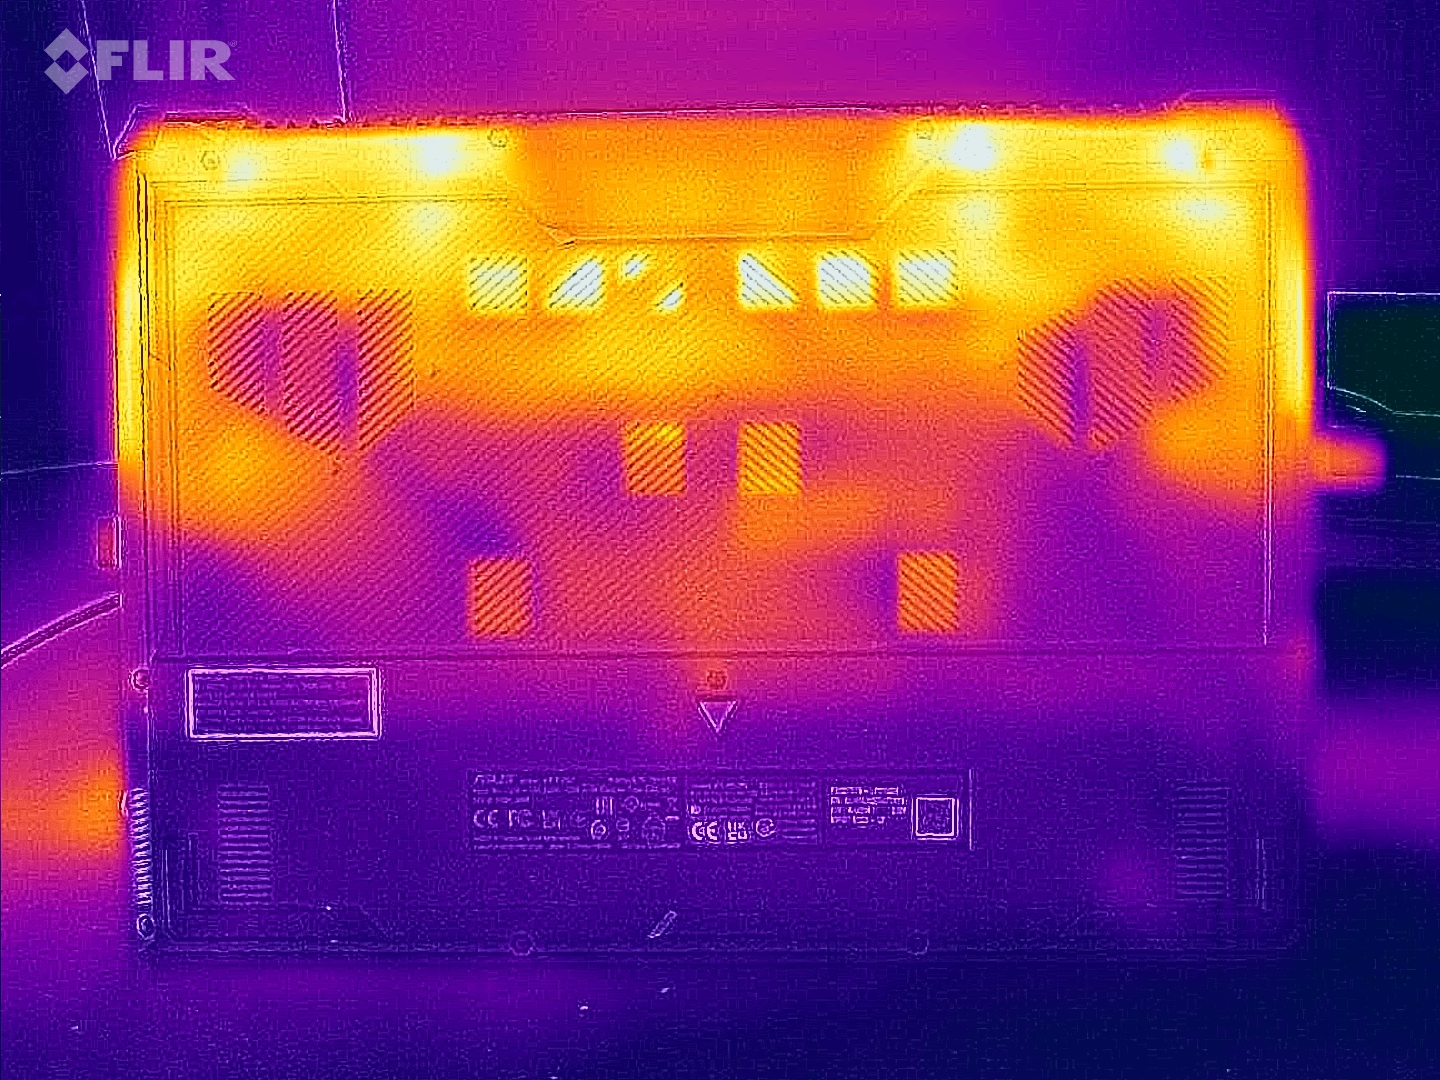
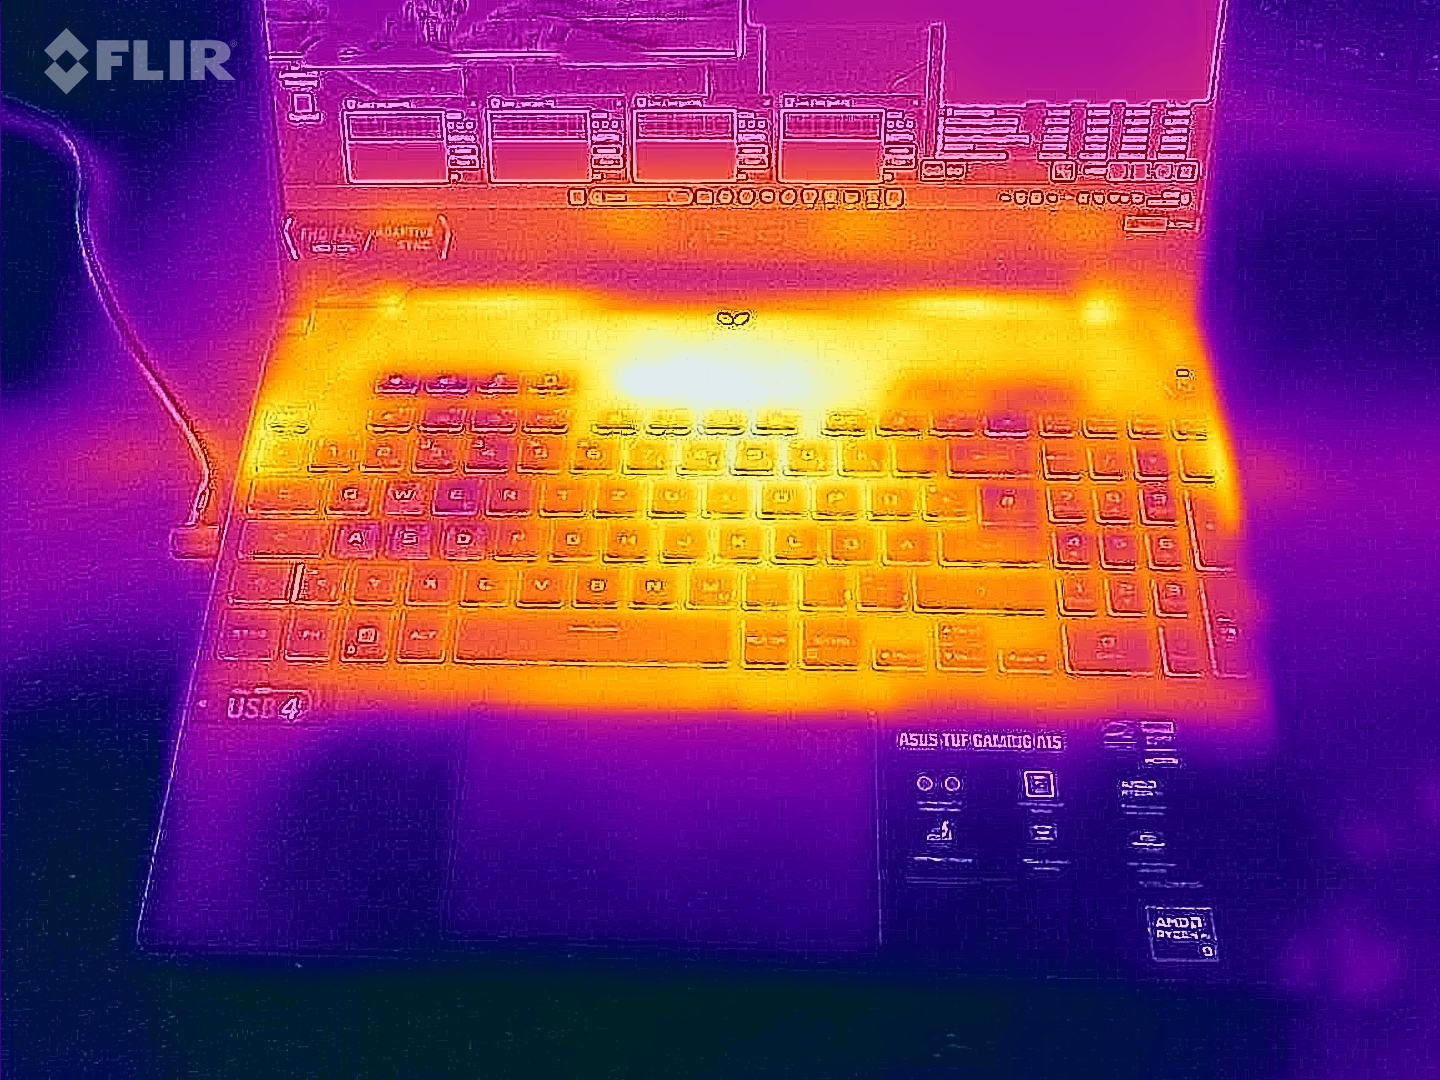
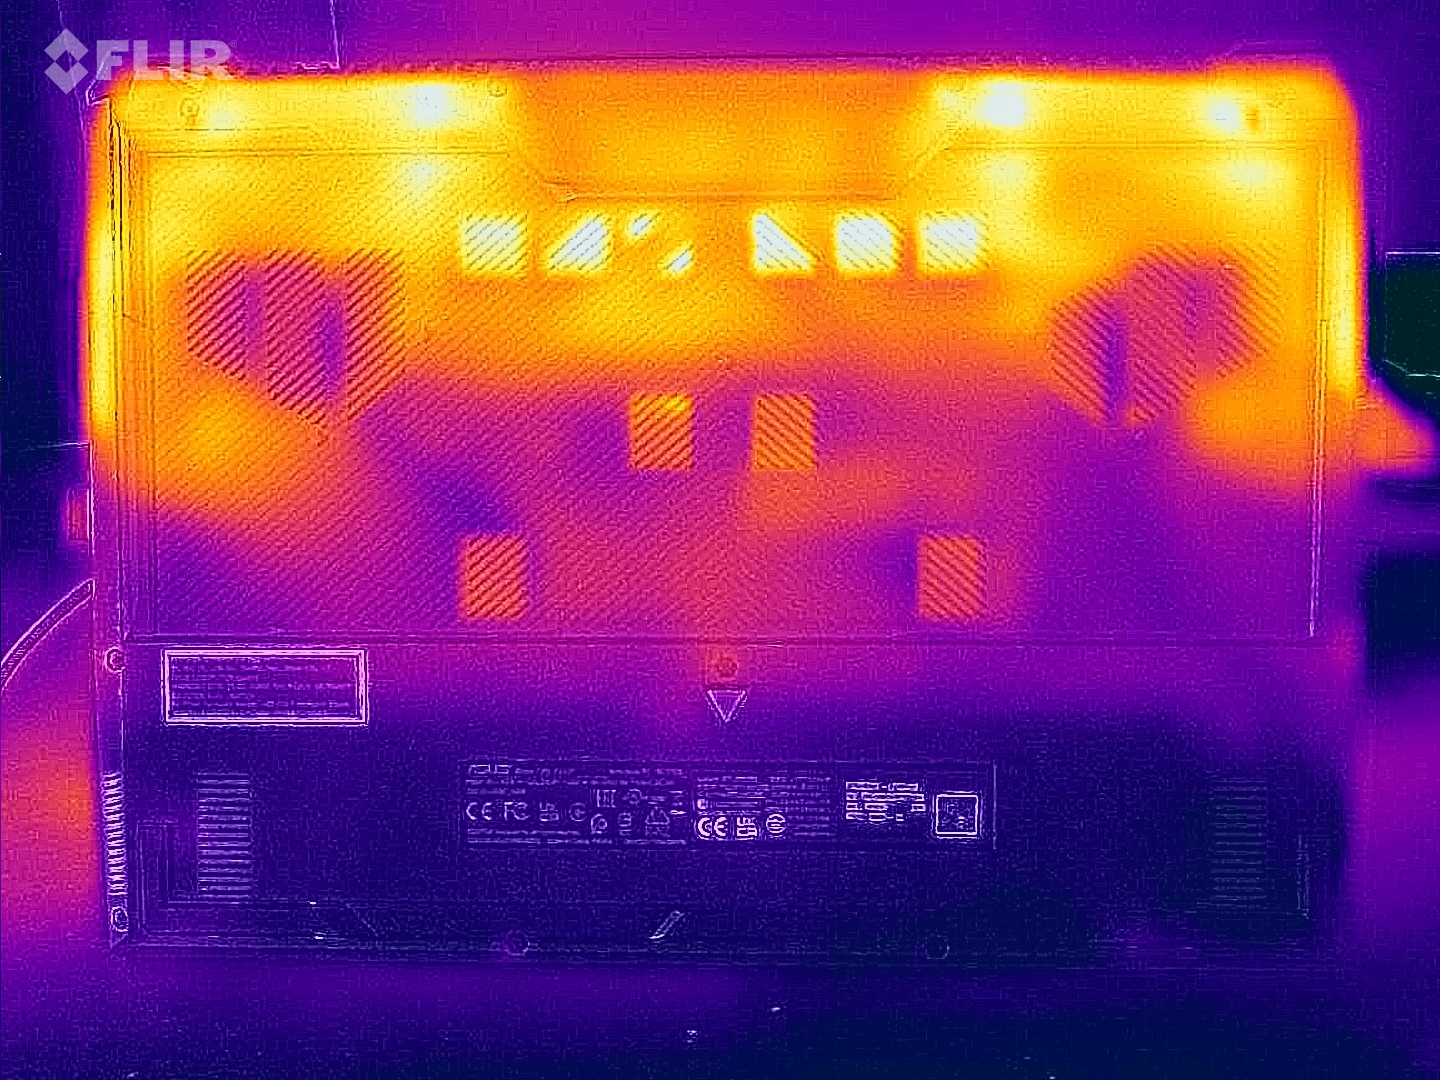
Temperature
The laptop gets noticeably warm: Cyberpunk and the stress test cause temperatures of more than 50 degrees Celsius in some areas. In everyday use cases (office, internet), above-average figures are achieved. The handrest temperatures are at a moderate level.
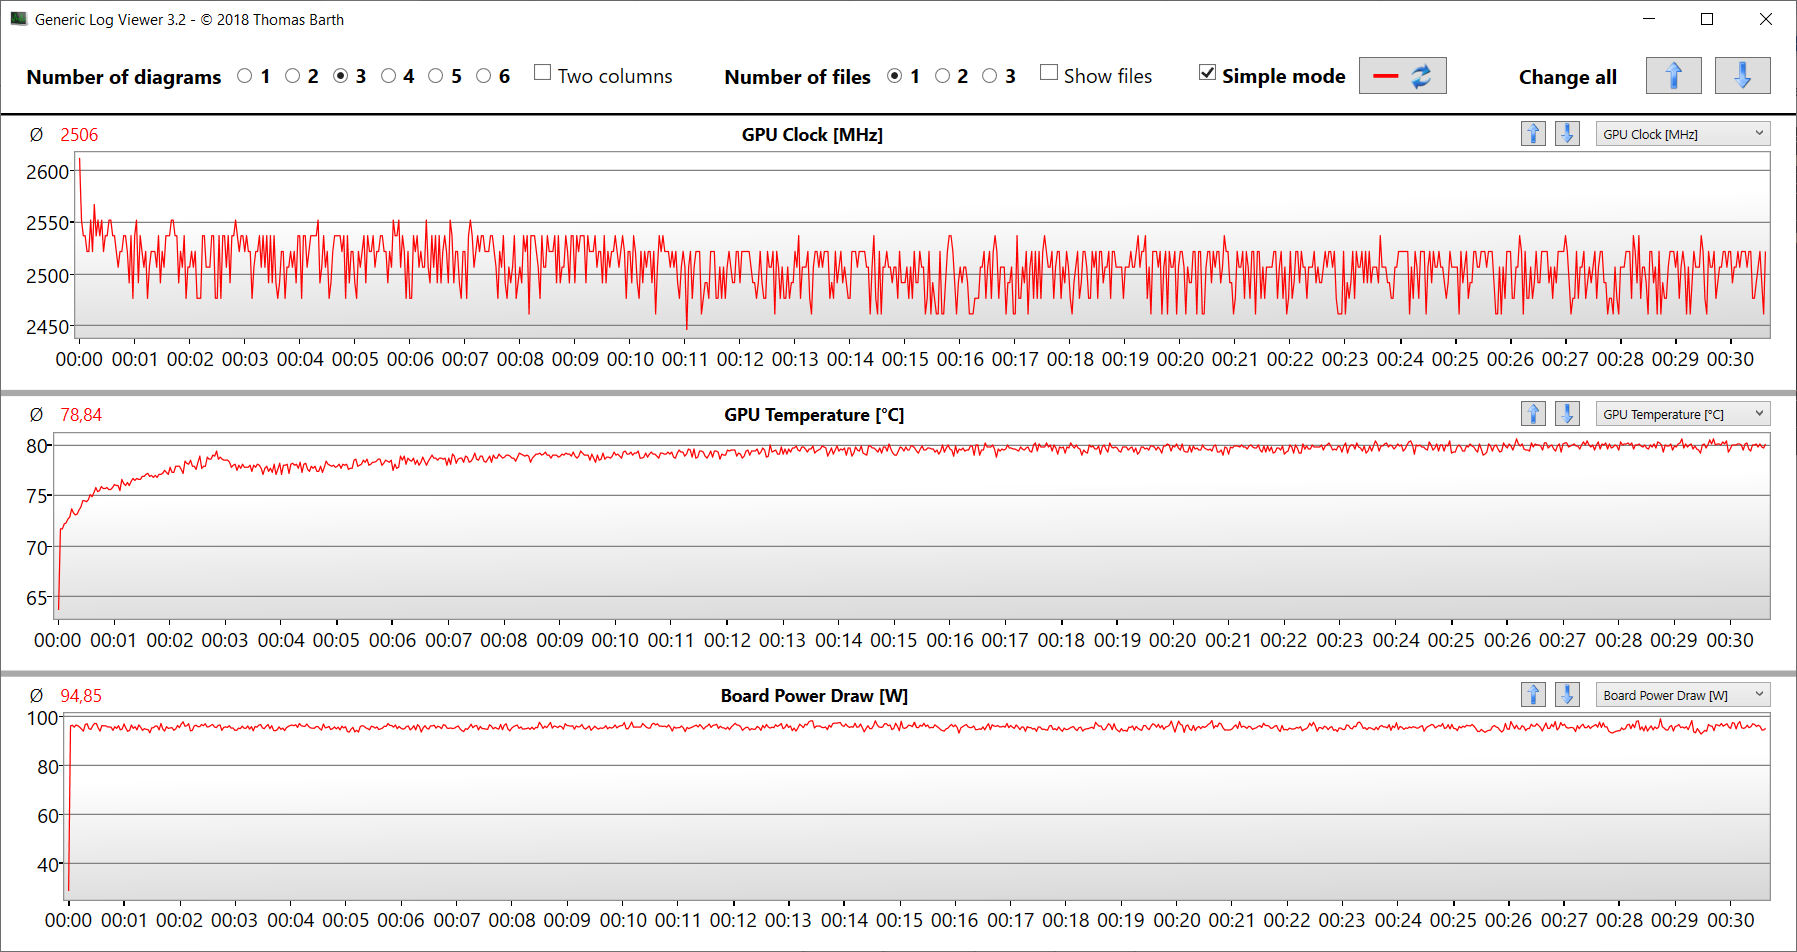
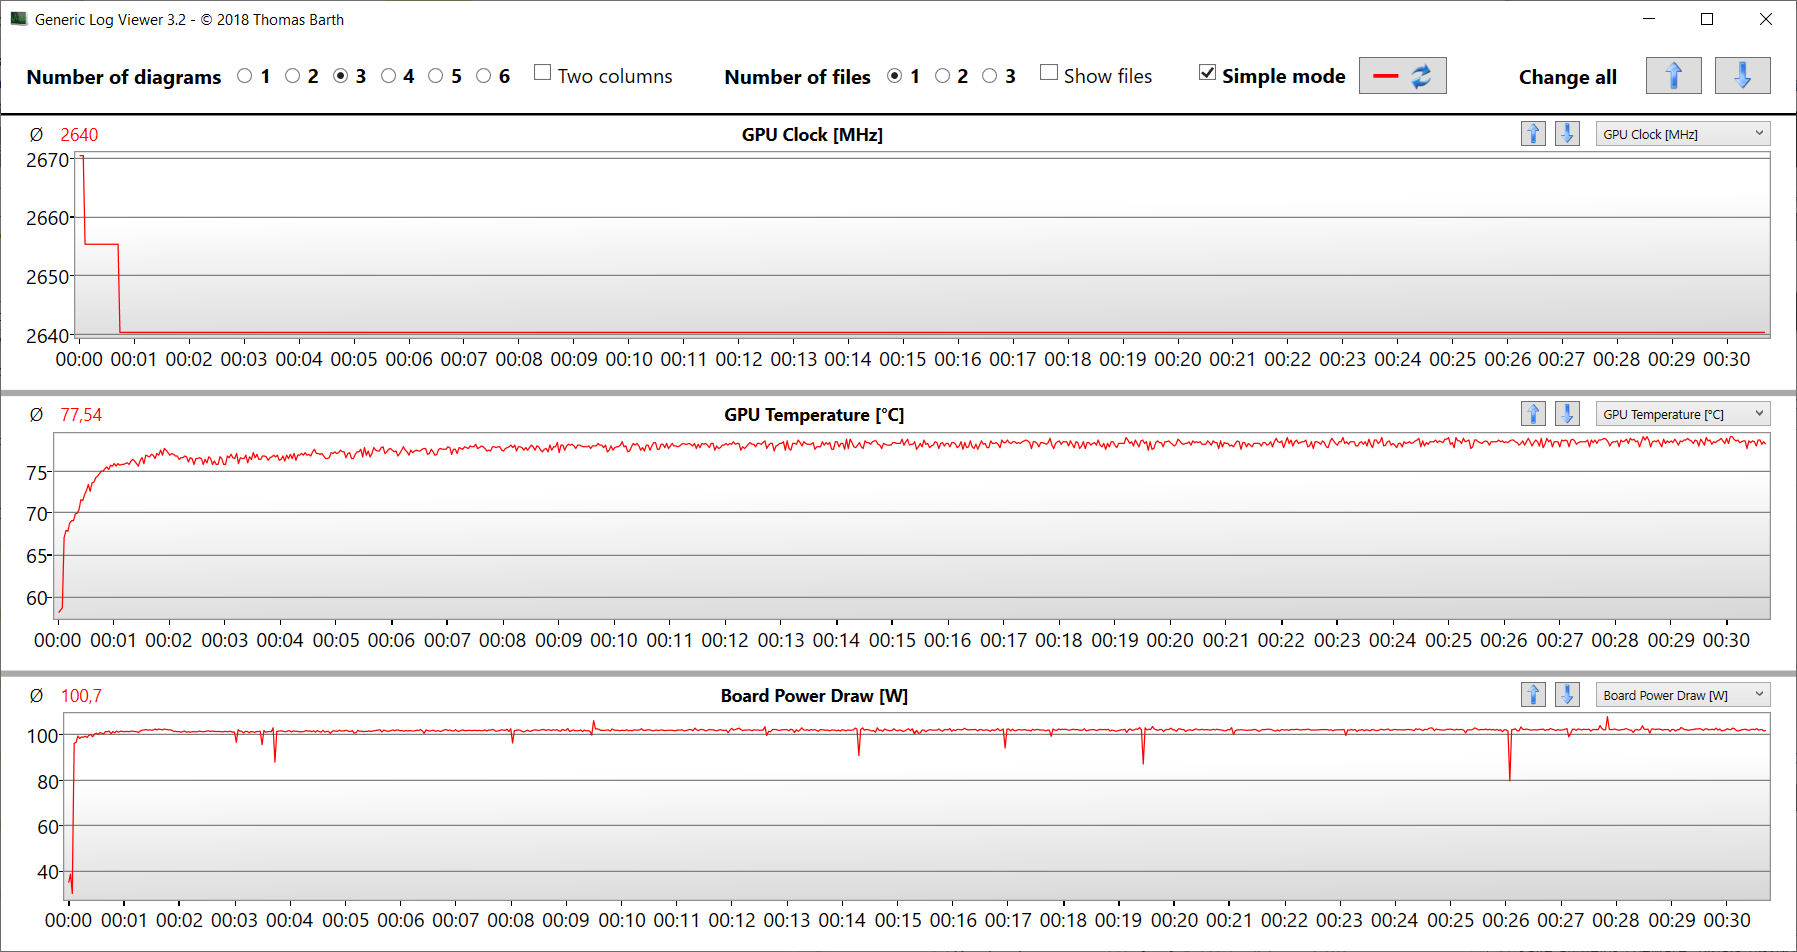
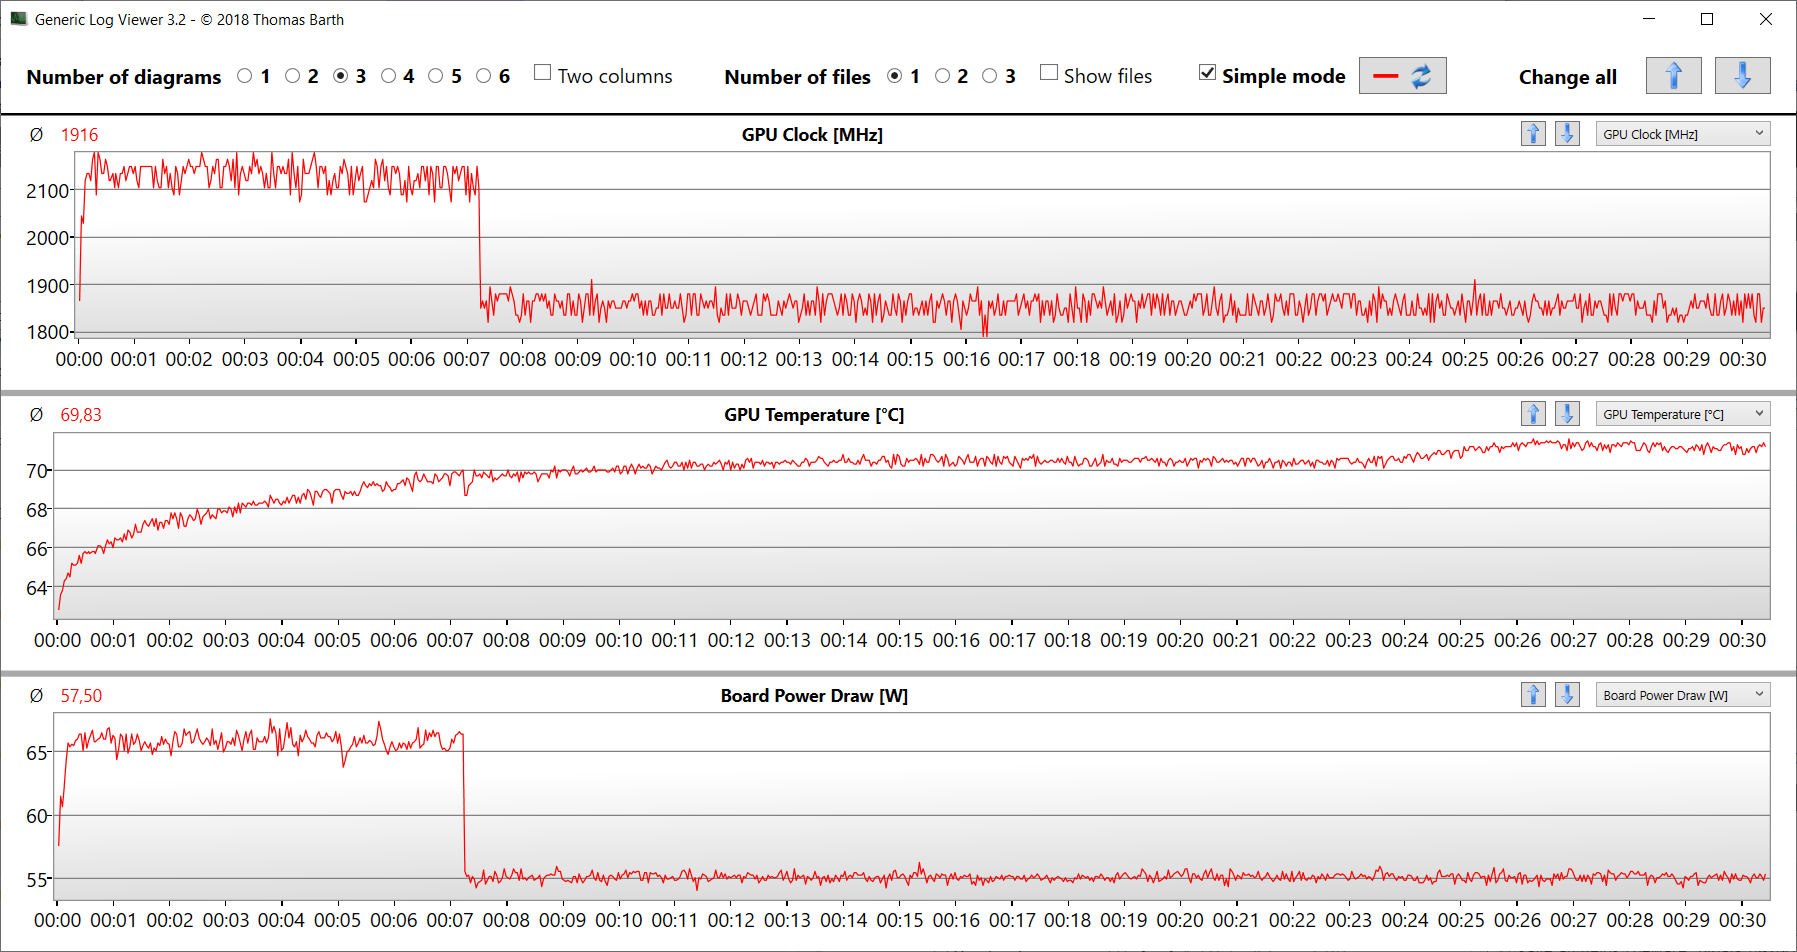
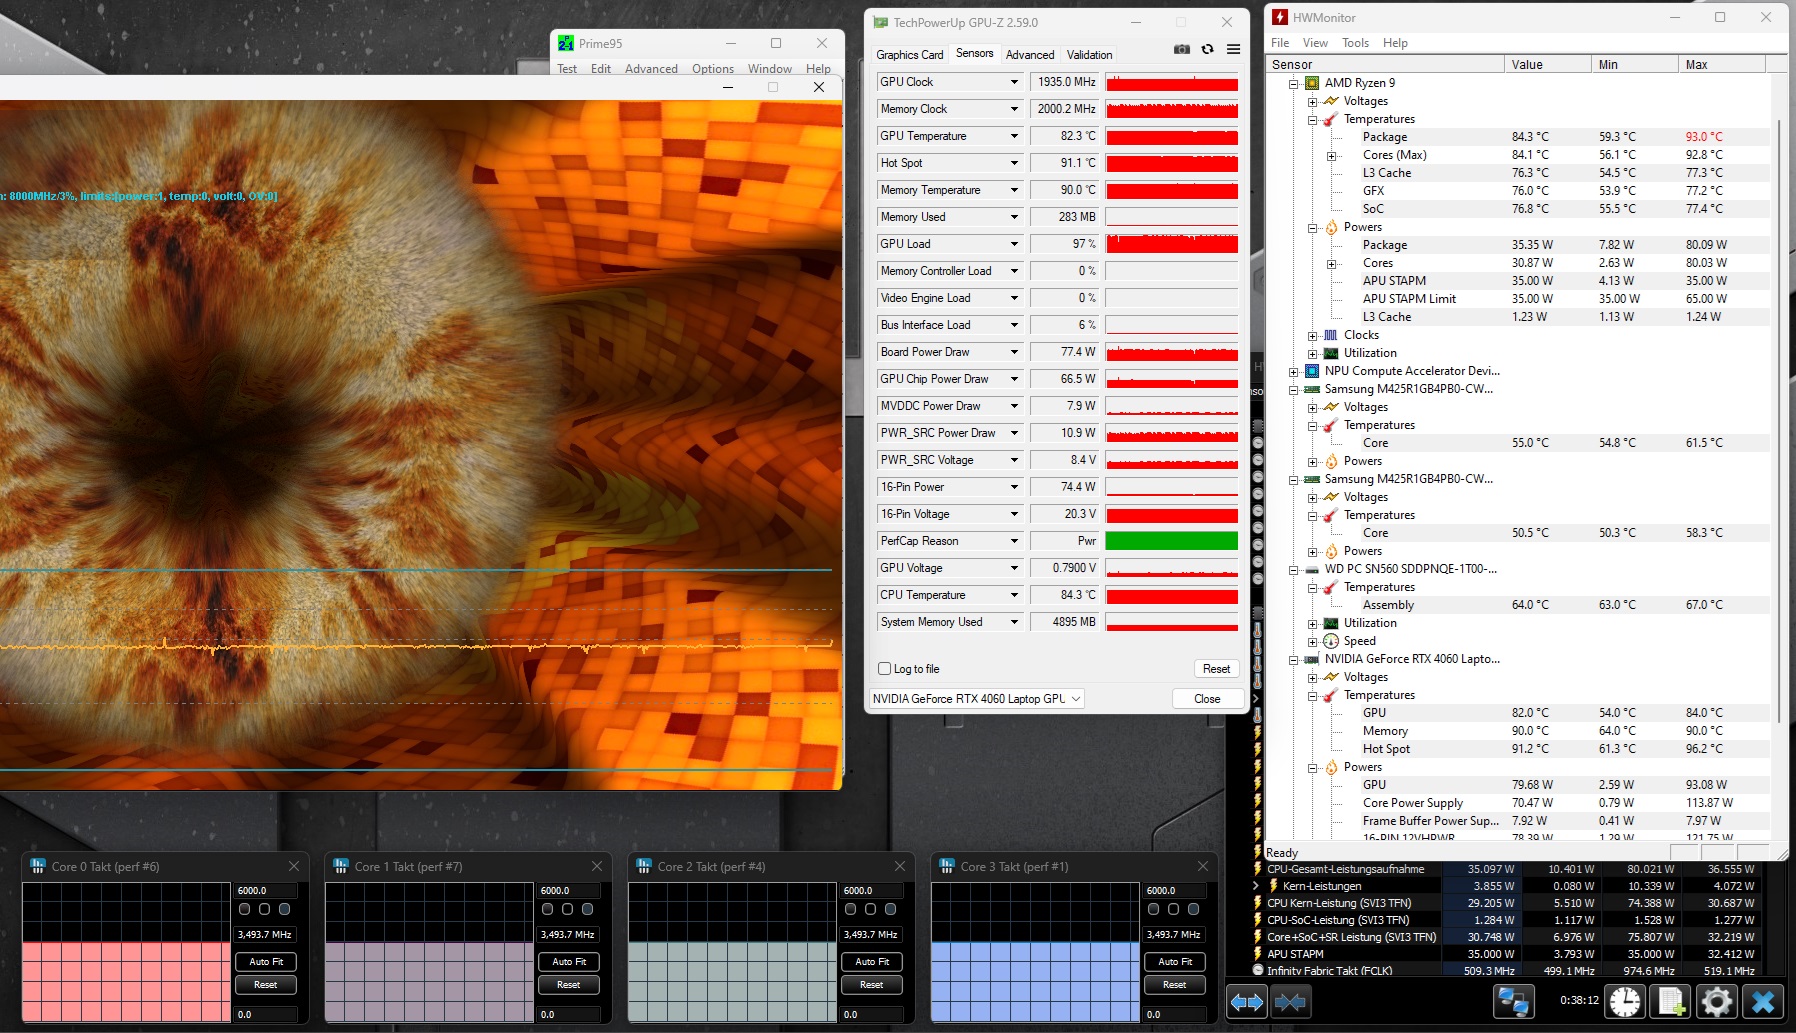
The extreme scenario stress test (Prime95 and Furmark in continuous operation) checks the system stability under full load. The initial high CPU and GPU clock speeds drop in the first minute of the test to 3.5 GHz (CPU) and 1.9 GHz (GPU), respectively and continue to remain at this level.
(-) The maximum temperature on the upper side is 53 °C / 127 F, compared to the average of 40.4 °C / 105 F, ranging from 21.2 to 68.8 °C for the class Gaming.
(-) The bottom heats up to a maximum of 46 °C / 115 F, compared to the average of 43.2 °C / 110 F
(+) In idle usage, the average temperature for the upper side is 29.9 °C / 86 F, compared to the device average of 33.9 °C / 93 F.
(-) 3: The average temperature for the upper side is 41.9 °C / 107 F, compared to the average of 33.9 °C / 93 F for the class Gaming.
(+) The palmrests and touchpad are reaching skin temperature as a maximum (35 °C / 95 F) and are therefore not hot.
(-) The average temperature of the palmrest area of similar devices was 28.8 °C / 83.8 F (-6.2 °C / -11.2 F).
| Asus TUF Gaming A15 FA507UV AMD Ryzen 9 8945H, NVIDIA GeForce RTX 4060 Laptop GPU | Lenovo LOQ 15IRX9 Intel Core i5-13450HX, NVIDIA GeForce RTX 4060 Laptop GPU | HP Victus 16 (2024) Intel Core i7-14700HX, NVIDIA GeForce RTX 4060 Laptop GPU | Gigabyte G6X 9KG (2024) Intel Core i7-13650HX, NVIDIA GeForce RTX 4060 Laptop GPU | Schenker XMG Core 15 (M24) AMD Ryzen 7 8845HS, NVIDIA GeForce RTX 4060 Laptop GPU | Dell G16, i7-13650HX, RTX 4060 Intel Core i7-13650HX, NVIDIA GeForce RTX 4060 Laptop GPU | Asus TUF A15 FA507 AMD Ryzen 7 7735HS, NVIDIA GeForce RTX 4050 Laptop GPU | |
|---|---|---|---|---|---|---|---|
| Heat | -5% | 11% | 5% | -14% | -8% | 11% | |
| Maximum Upper Side * (°C) | 53 | 47 11% | 50 6% | 41 23% | 52 2% | 49 8% | 48.9 8% |
| Maximum Bottom * (°C) | 46 | 58 -26% | 50 -9% | 43 7% | 61 -33% | 58 -26% | 44.6 3% |
| Idle Upper Side * (°C) | 32 | 32 -0% | 25 22% | 32 -0% | 35 -9% | 35 -9% | 27.1 15% |
| Idle Bottom * (°C) | 34 | 36 -6% | 26 24% | 37 -9% | 39 -15% | 35 -3% | 27.5 19% |
* ... smaller is better
Speakers
All in all, the stereo speakers produce decent sound. The bass could be somewhat more pronounced.
Asus TUF Gaming A15 FA507UV audio analysis
(+) | speakers can play relatively loud (82 dB)
Bass 100 - 315 Hz
(±) | reduced bass - on average 6.8% lower than median
(±) | linearity of bass is average (7.1% delta to prev. frequency)
Mids 400 - 2000 Hz
(±) | higher mids - on average 7.8% higher than median
(±) | linearity of mids is average (7% delta to prev. frequency)
Highs 2 - 16 kHz
(+) | balanced highs - only 2.4% away from median
(±) | linearity of highs is average (7.6% delta to prev. frequency)
Overall 100 - 16.000 Hz
(+) | overall sound is linear (13.1% difference to median)
Compared to same class
» 18% of all tested devices in this class were better, 4% similar, 78% worse
» The best had a delta of 6%, average was 18%, worst was 132%
Compared to all devices tested
» 13% of all tested devices were better, 3% similar, 84% worse
» The best had a delta of 4%, average was 24%, worst was 134%
Lenovo LOQ 15IRX9 audio analysis
(±) | speaker loudness is average but good (81 dB)
Bass 100 - 315 Hz
(±) | reduced bass - on average 14.6% lower than median
(±) | linearity of bass is average (9.6% delta to prev. frequency)
Mids 400 - 2000 Hz
(+) | balanced mids - only 2.1% away from median
(+) | mids are linear (3.6% delta to prev. frequency)
Highs 2 - 16 kHz
(±) | higher highs - on average 5.9% higher than median
(±) | linearity of highs is average (8.2% delta to prev. frequency)
Overall 100 - 16.000 Hz
(+) | overall sound is linear (14.7% difference to median)
Compared to same class
» 28% of all tested devices in this class were better, 7% similar, 64% worse
» The best had a delta of 6%, average was 18%, worst was 132%
Compared to all devices tested
» 19% of all tested devices were better, 4% similar, 77% worse
» The best had a delta of 4%, average was 24%, worst was 134%
Power consumption
When it comes to the power consumption, there is nothing strange to report. The values are at a normal level for the installed hardware. Cyberpunk and - later on - the stress test ran with consistent power consumption. The PSU (240-watt) is suitably sized.
| Off / Standby | |
| Idle | |
| Load |
|
Key:
min: | |
Power consumption Cyberpunk / stress test
Power consumption with an extrnal monitor
Battery life
The 15.6-inch device managed a runtime of 11 hours and 42 minutes in a real-world Wi-Fi test (image of the load when accessing websites running a script) - an excellent figure. This puts it on par with last year's A15 model.
Pros
Cons
Verdict - A gaming all-rounder

The focus is on FHD gaming but rendering and streaming also don’t present the device with any problems. Ryzen 9 8945H and GeForce RTX 4060 provide the necessary power and both chips can run at consistently high clock speeds. The installed 15.6-inch panel (FHD, 144 Hz, G-Sync, sRGB) has no serious weaknesses.
With the TUF Gaming A15 FA507UV, Asus has delivered a well-rounded FHD gaming laptop with impressive battery life.
In certain places, the computer heats up noticeably and gets quite loud. Selecting the mode will get you a good compromise between performance and noise and the resulting performance loss isn’t significant.
The poster child for the A15 is its tremendous battery life: Real-life figures of almost 12 hours are usually reserved for office laptops or subnotebooks. It is possible to provide the battery with power via a USB-C PSU - one of the two USB-C ports (USB 3.2 Gen 2, USB 4) supports Power Delivery meaning you don’t necessarily have to lug the proprietary PSU around.
One alternative could be the Lenovo LOQ 15IRX9. It offers slightly less computing power, USB 4 isn’t on board and delivers considerably worse battery life. However, it does have its nose in front when it comes to the price: The LOQ could be yours for just $999.
Price and availability
The Asus TUF Gaming A15 FA507UV is currently (as of 17.07.24) available for around $1,399 (512 GB SSD) on Amazon.
Note: We have recently updated our rating system and the results of version 8 are not comparable with the results of version 7. More information is available here.
Asus TUF Gaming A15 FA507UV
- 07/17/2024 v8
Sascha Mölck
 Total Sustainability Score:
 Transparency
The selection of devices to be reviewed is made by our editorial team. The test sample was provided to the author as a loan by the manufacturer or retailer for the purpose of this review. The lender had no influence on this review, nor did the manufacturer receive a copy of this review before publication. There was no obligation to publish this review. As an independent media company, Notebookcheck is not subjected to the authority of manufacturers, retailers or publishers.
This is how Notebookcheck is testing
Every year, Notebookcheck independently reviews hundreds of laptops and smartphones using standardized procedures to ensure that all results are comparable. We have continuously developed our test methods for around 20 years and set industry standards in the process. In our test labs, high-quality measuring equipment is utilized by experienced technicians and editors. These tests involve a multi-stage validation process. Our complex rating system is based on hundreds of well-founded measurements and benchmarks, which maintains objectivity. Further information on our test methods can be found here.
Price comparison

