Notebookcheck Logo

Alone in the Dark (2024) in review: Laptop and desktop benchmarks

Fickle technology.

Reboots, remasters, and remakes of popular game series are currently in high demand. The remake of Alone in the Dark has now been added to the long list. What about the hardware requirements and graphics in the horror adventure?
Alone in the Dark

Test systems

Asus ROG Zephyrus M16 (RTX 4090)
Razer Blade 16 Mid 23 (RTX 4080)
XMG Pro 15 E23 (RTX 4070)
Razer Blade 14 Mid 23 (RTX 4060)
Medion Erazer Scout E20 (RTX 4050)
Asus TUF Gaming Advantage A16 (RX 7600S & 780M)
Lenovo Yoga Pro 7 14 (Arc 8)
Philips Evnia 8000 Series 41,5" UHD OLED gaming monitor

We ran our gaming benchmarks on these devices. Clicking on the various images will take you to the respective producer's website. Further details on the devices' specifications are listed at the end of the article.

Tech

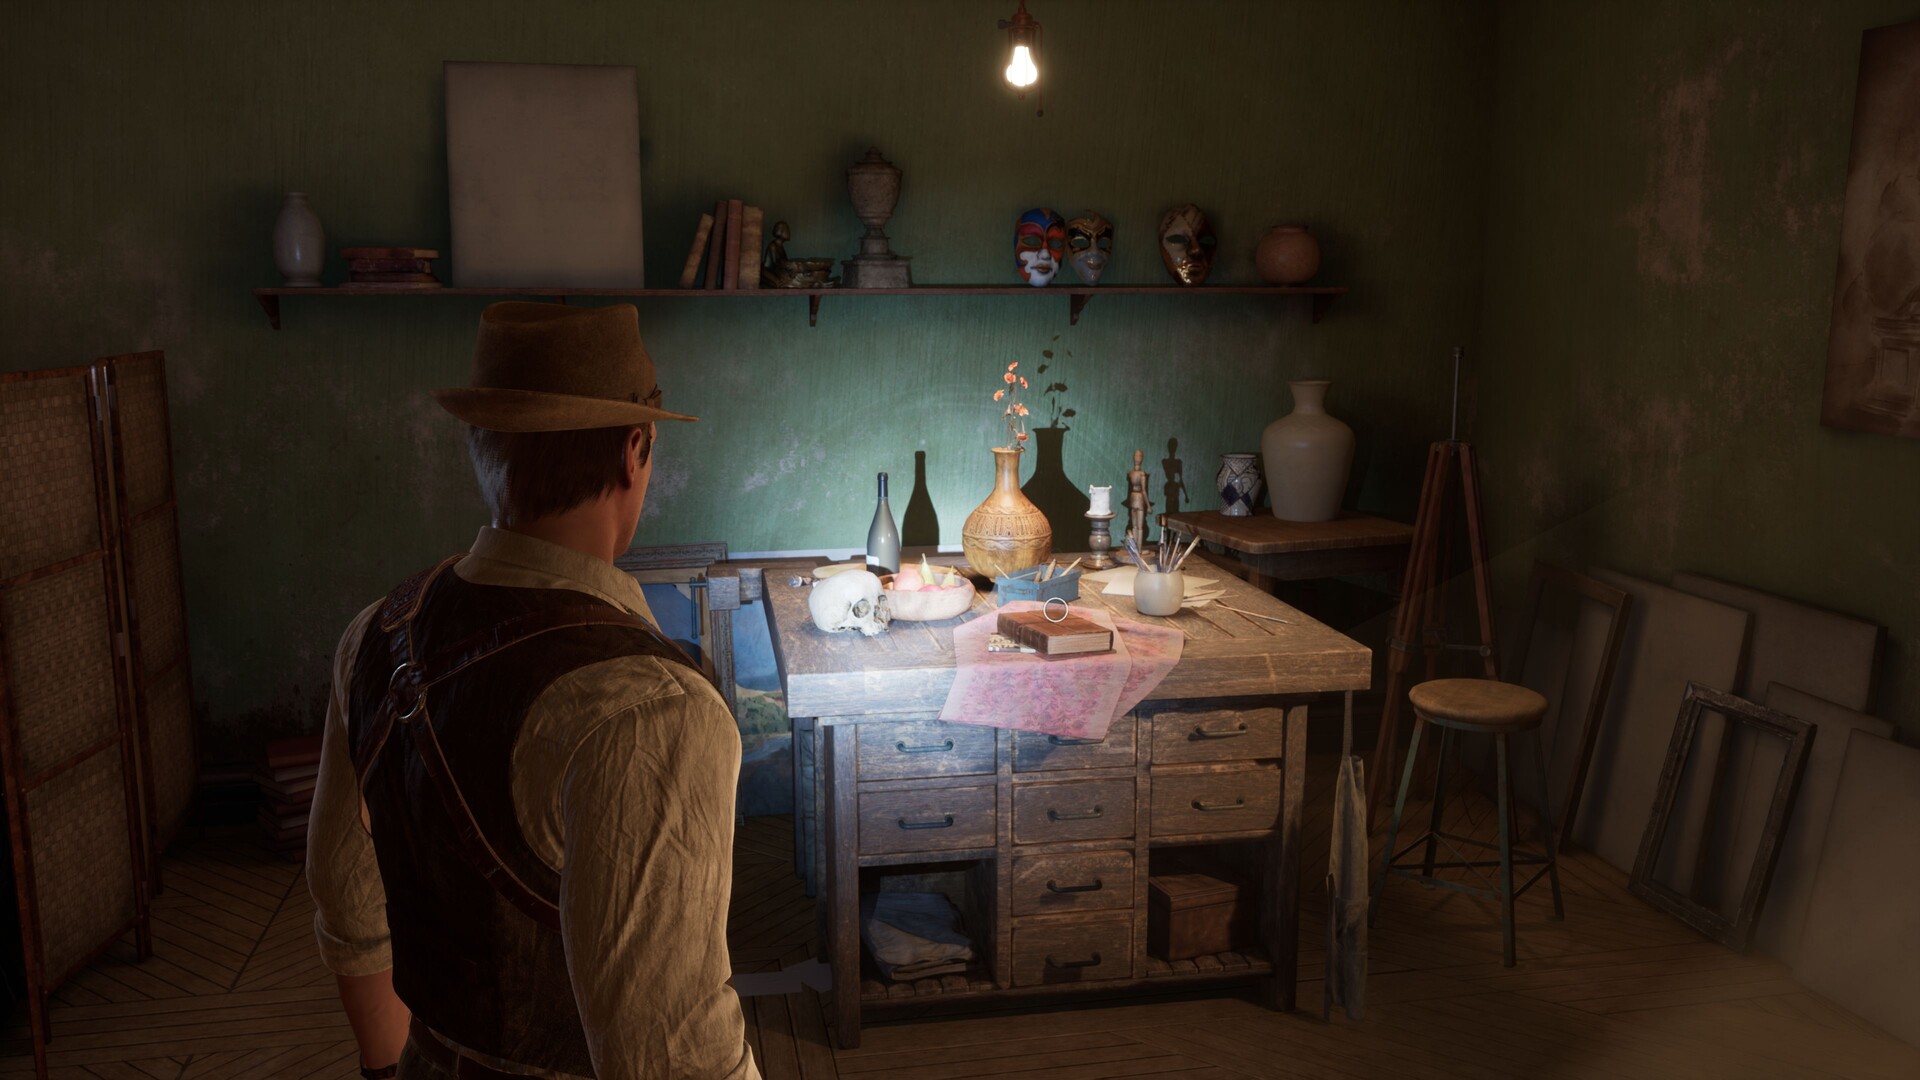
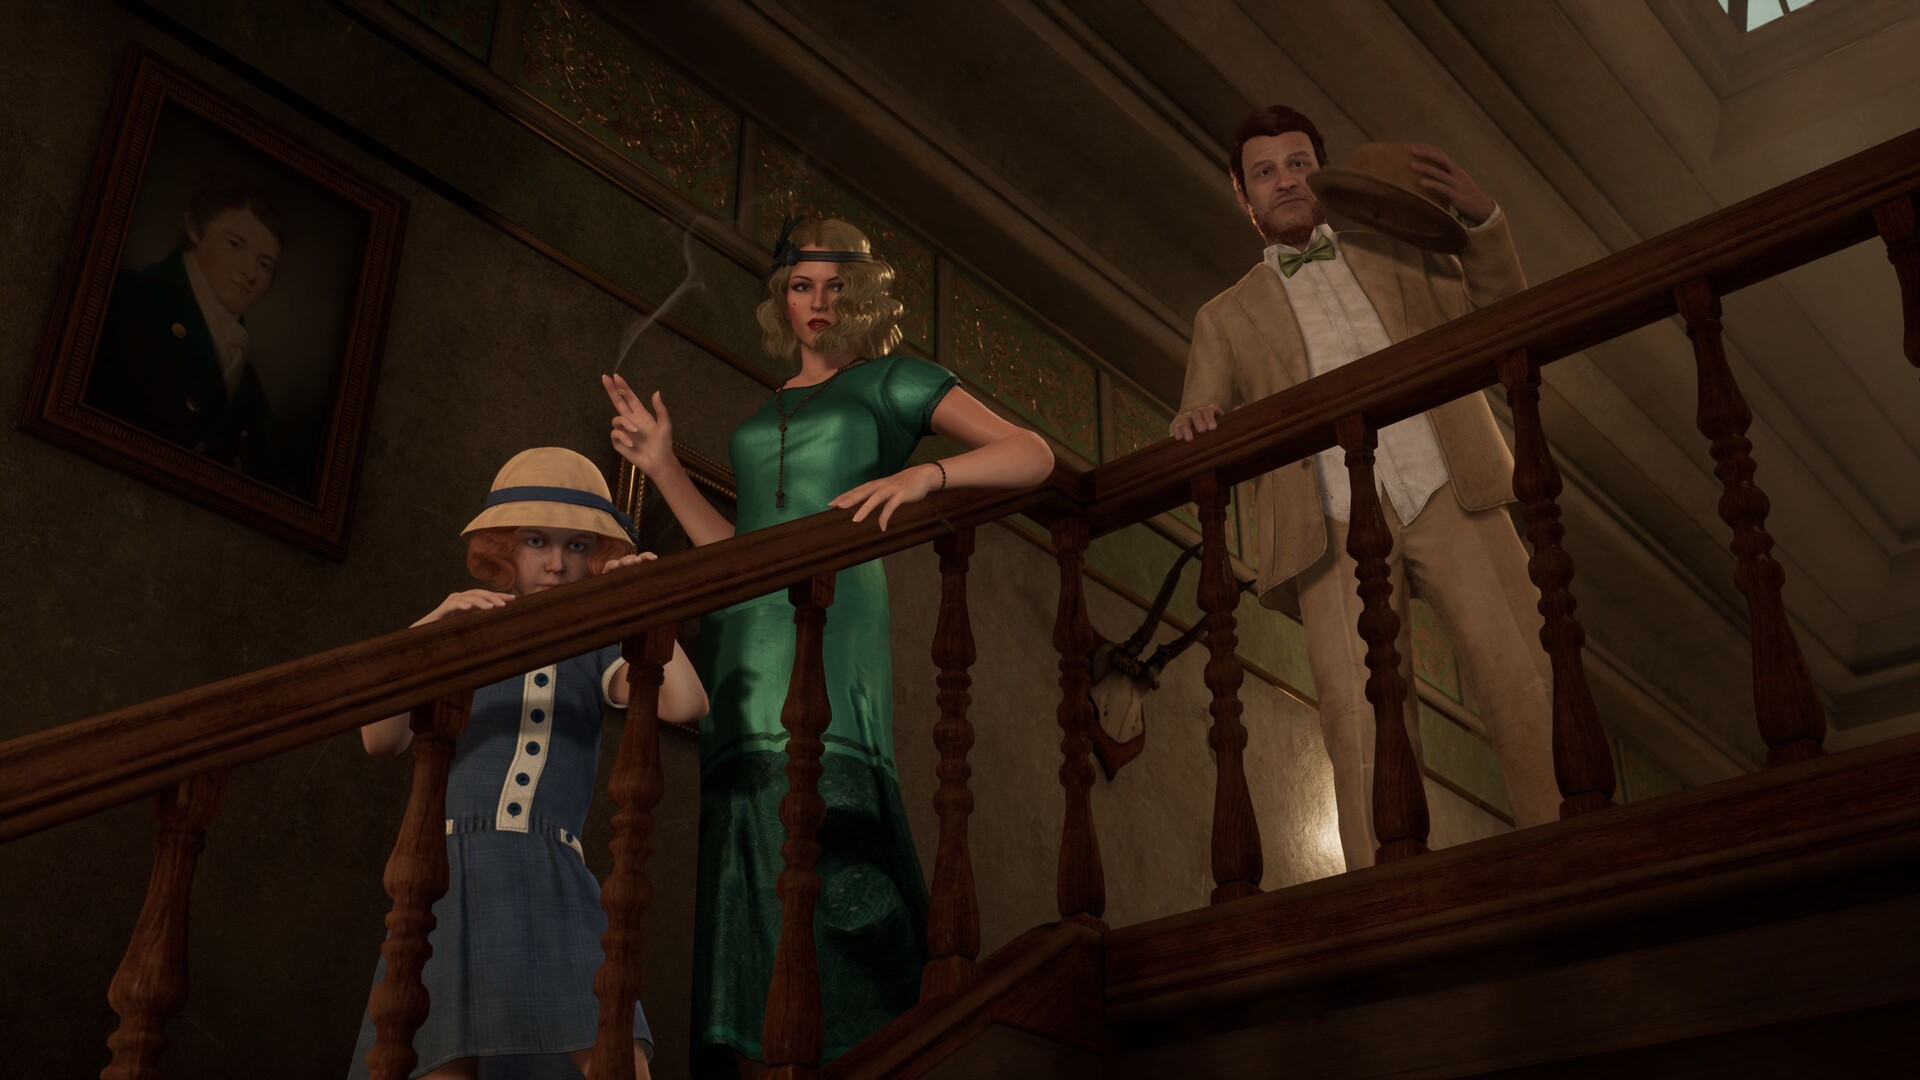
If press and user evaluations are any indication, the 2024 edition of Alone in the Dark does not appear to be a slam dunk in terms of content or an absolute flyer. While the atmosphere, characters, plot, and riddles are all realistic, the fighting sequences and overall horror/survival vibe aren't quite perfect.

Alone in the Dark
Alone in the Dark
Alone in the Dark
Alone in the Dark
Alone in the Dark
Alone in the Dark

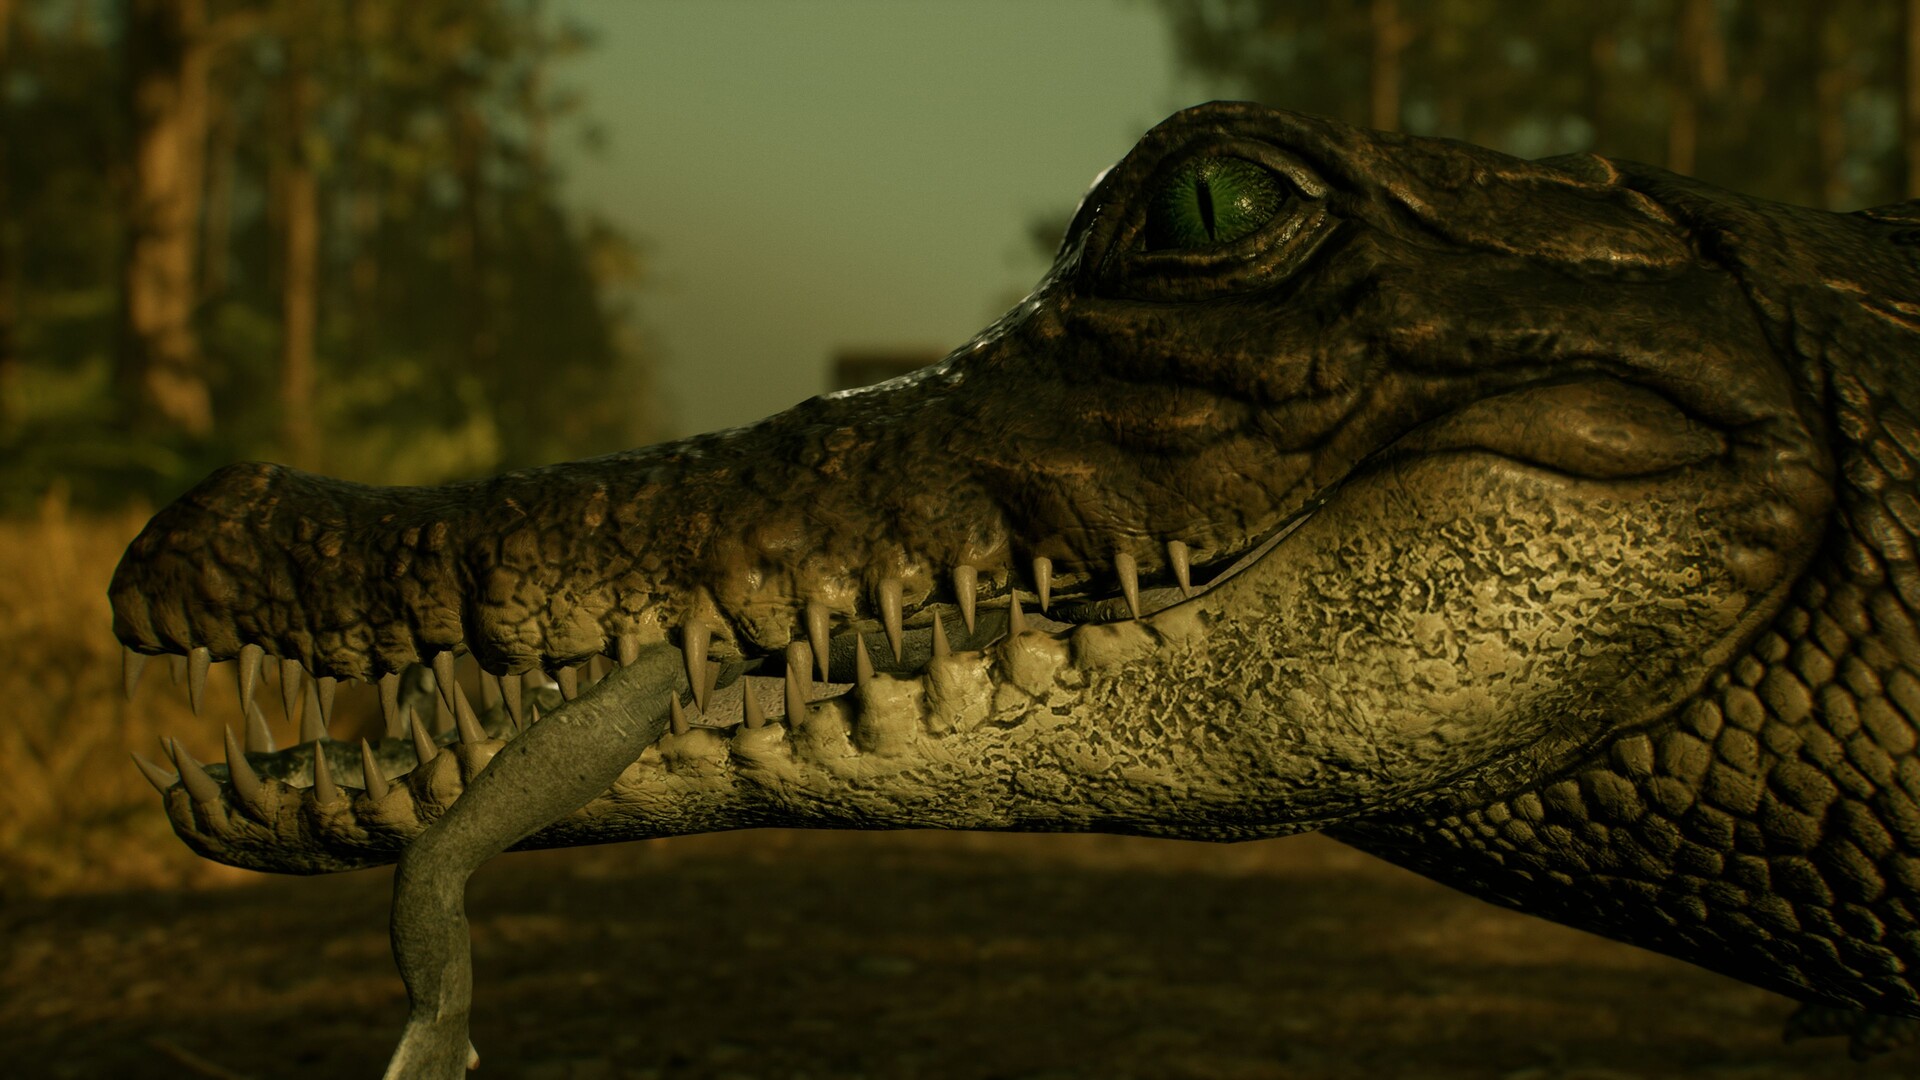
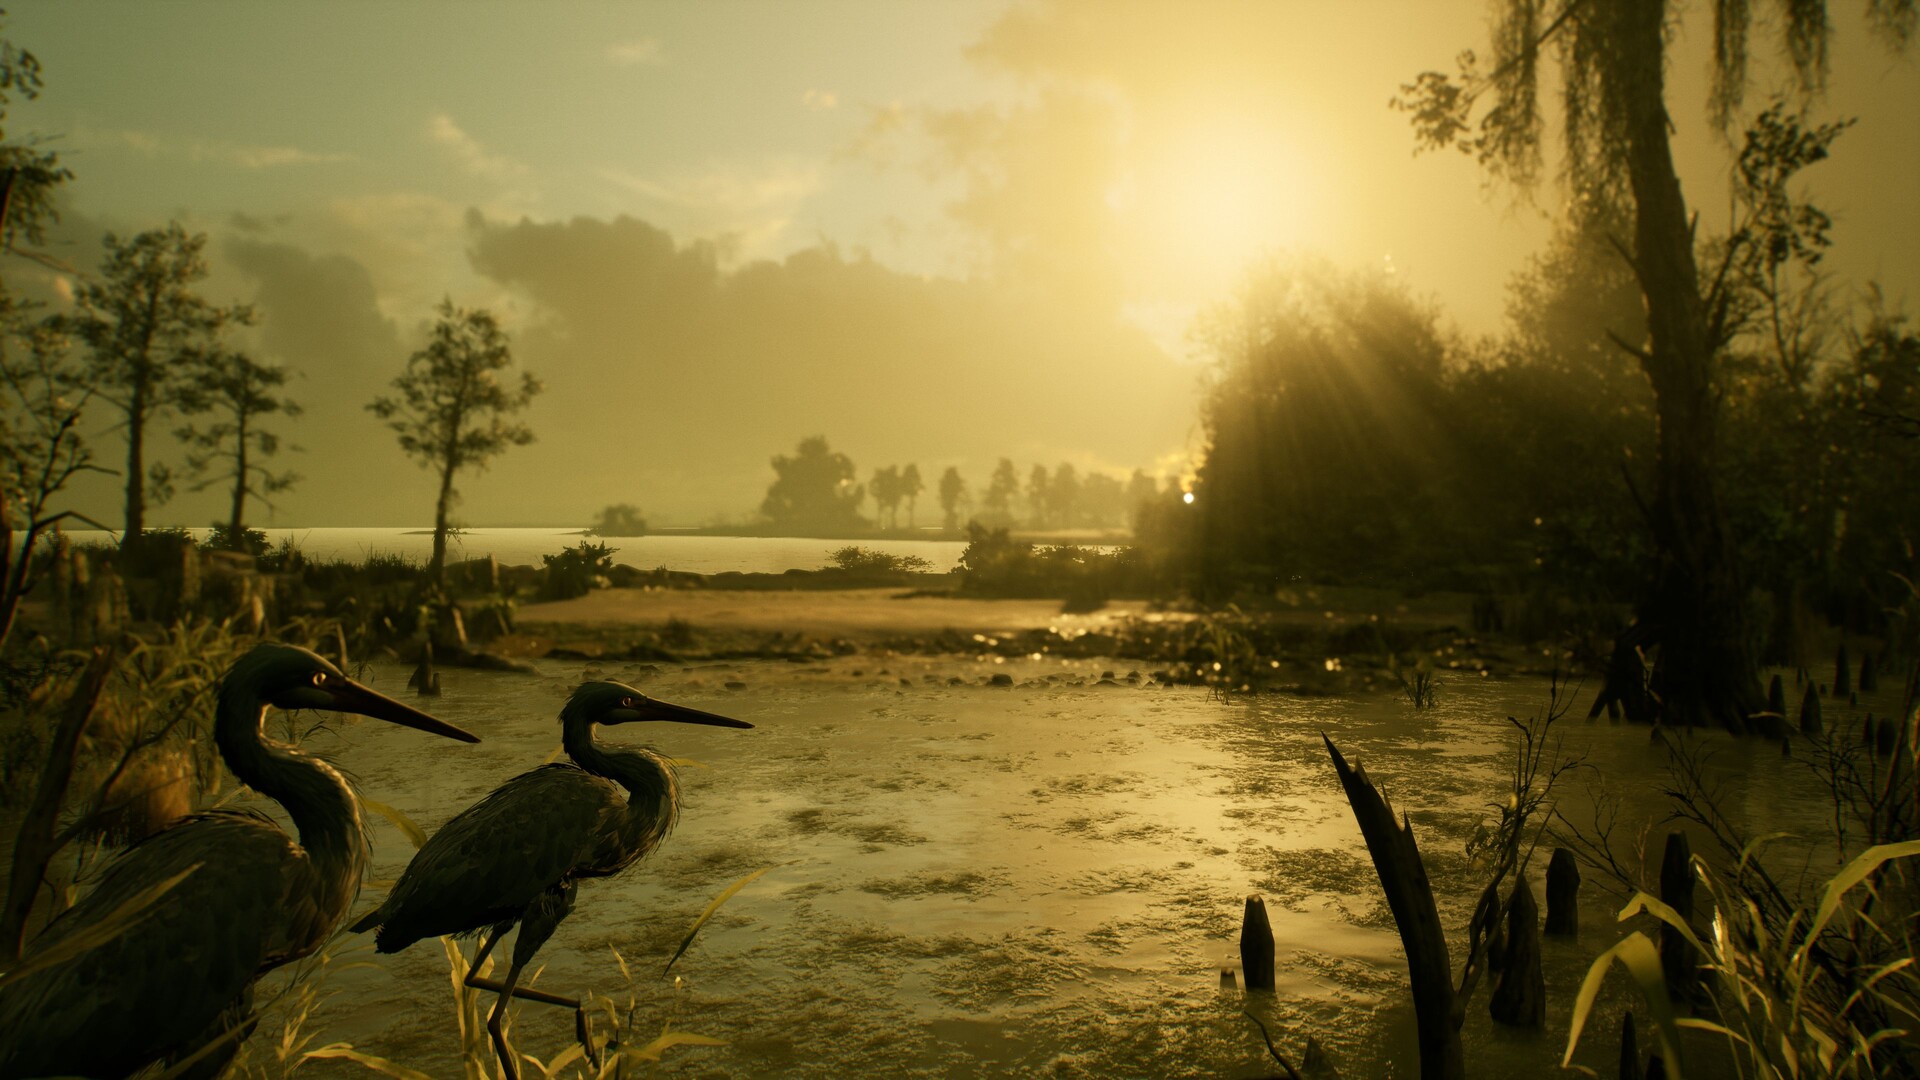
Technically, the title is based on the extremely successful Unreal Engine 4, offering more than solid visuals. Although it sometimes takes a while, especially on weaker computers, for the textures to load correctly, the level of detail and sharpness of the environments are otherwise very pleasing. However, we encountered one or two inconsistencies during testing. The fact that the game takes a while to start can still be tolerated. The developers should work on the phenomenon where there are often strange fluctuations in performance between benchmark runs. To obtain a comprehensible GPU ranking, we sometimes had to run measurements twice or three times, with average values then calculated.

Alone in the Dark
Alone in the Dark
Alone in the Dark
Alone in the Dark
Alone in the Dark
Alone in the Dark

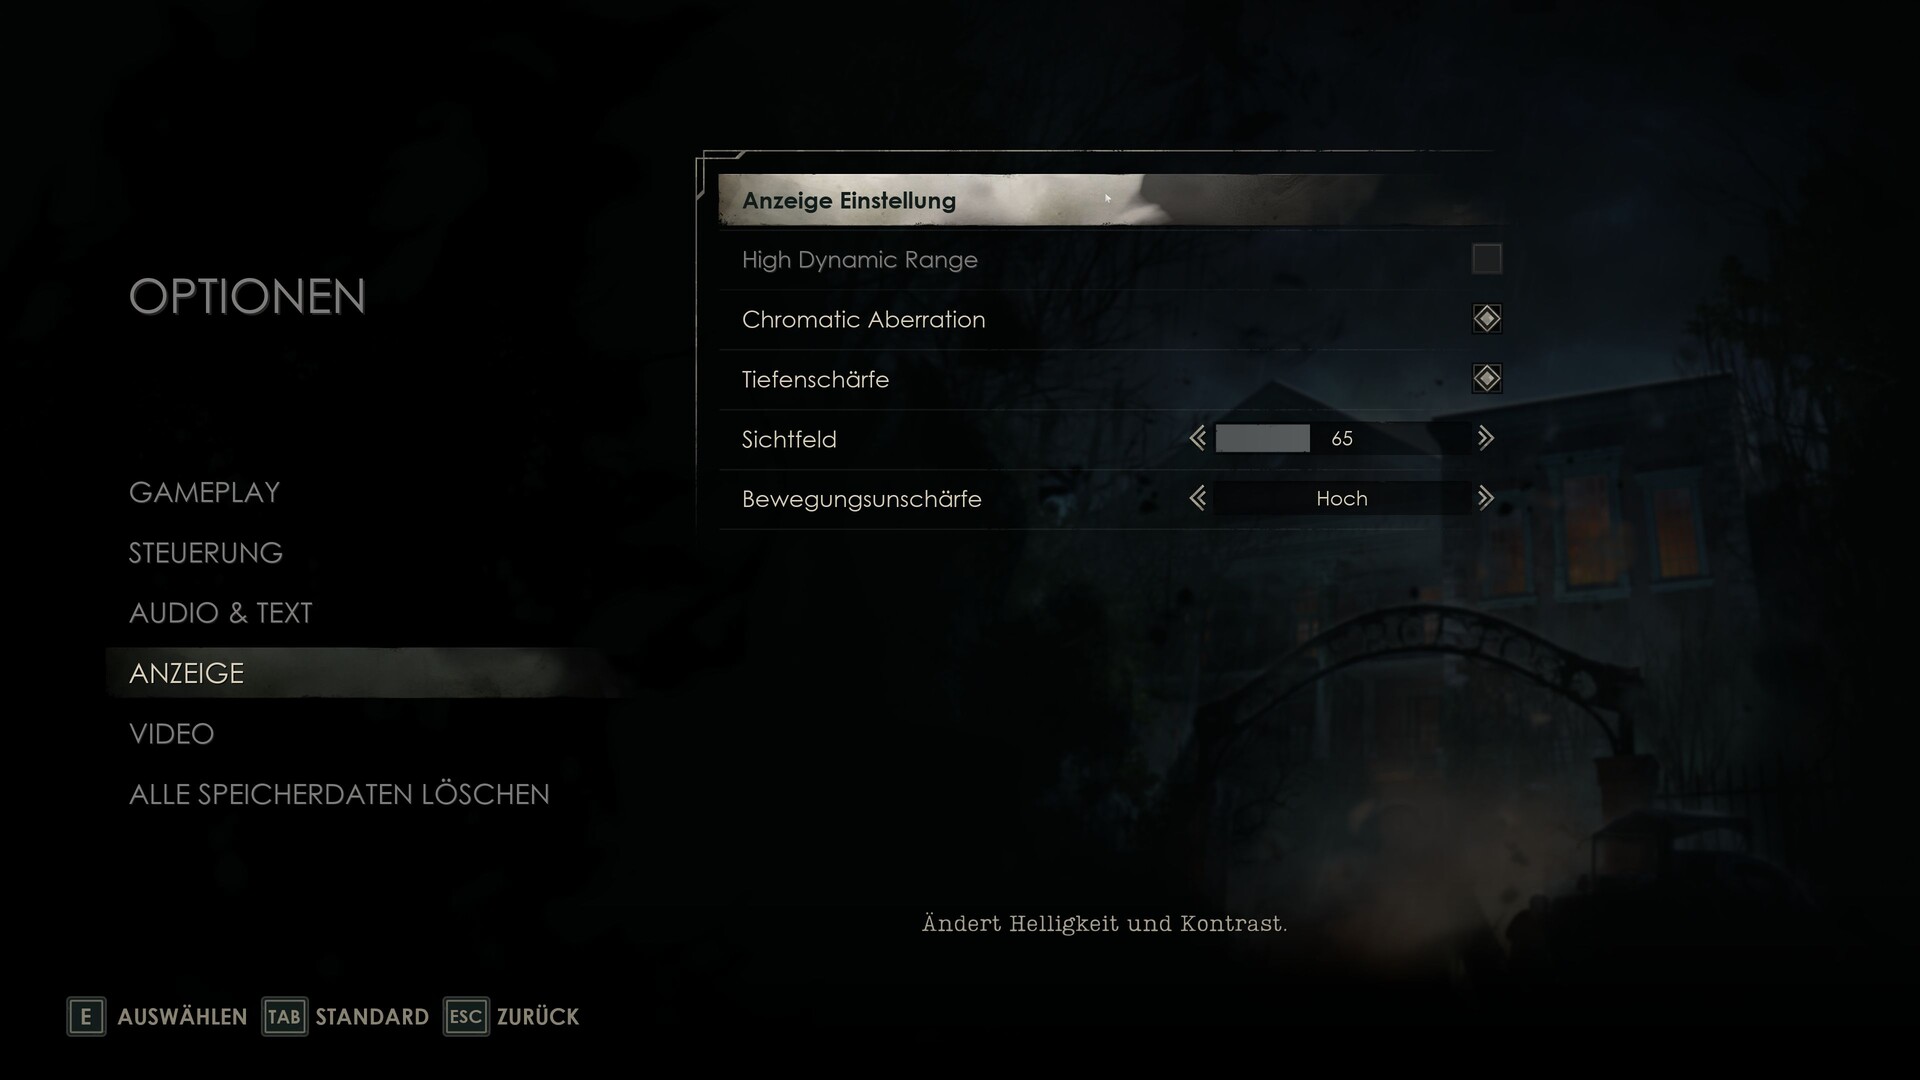
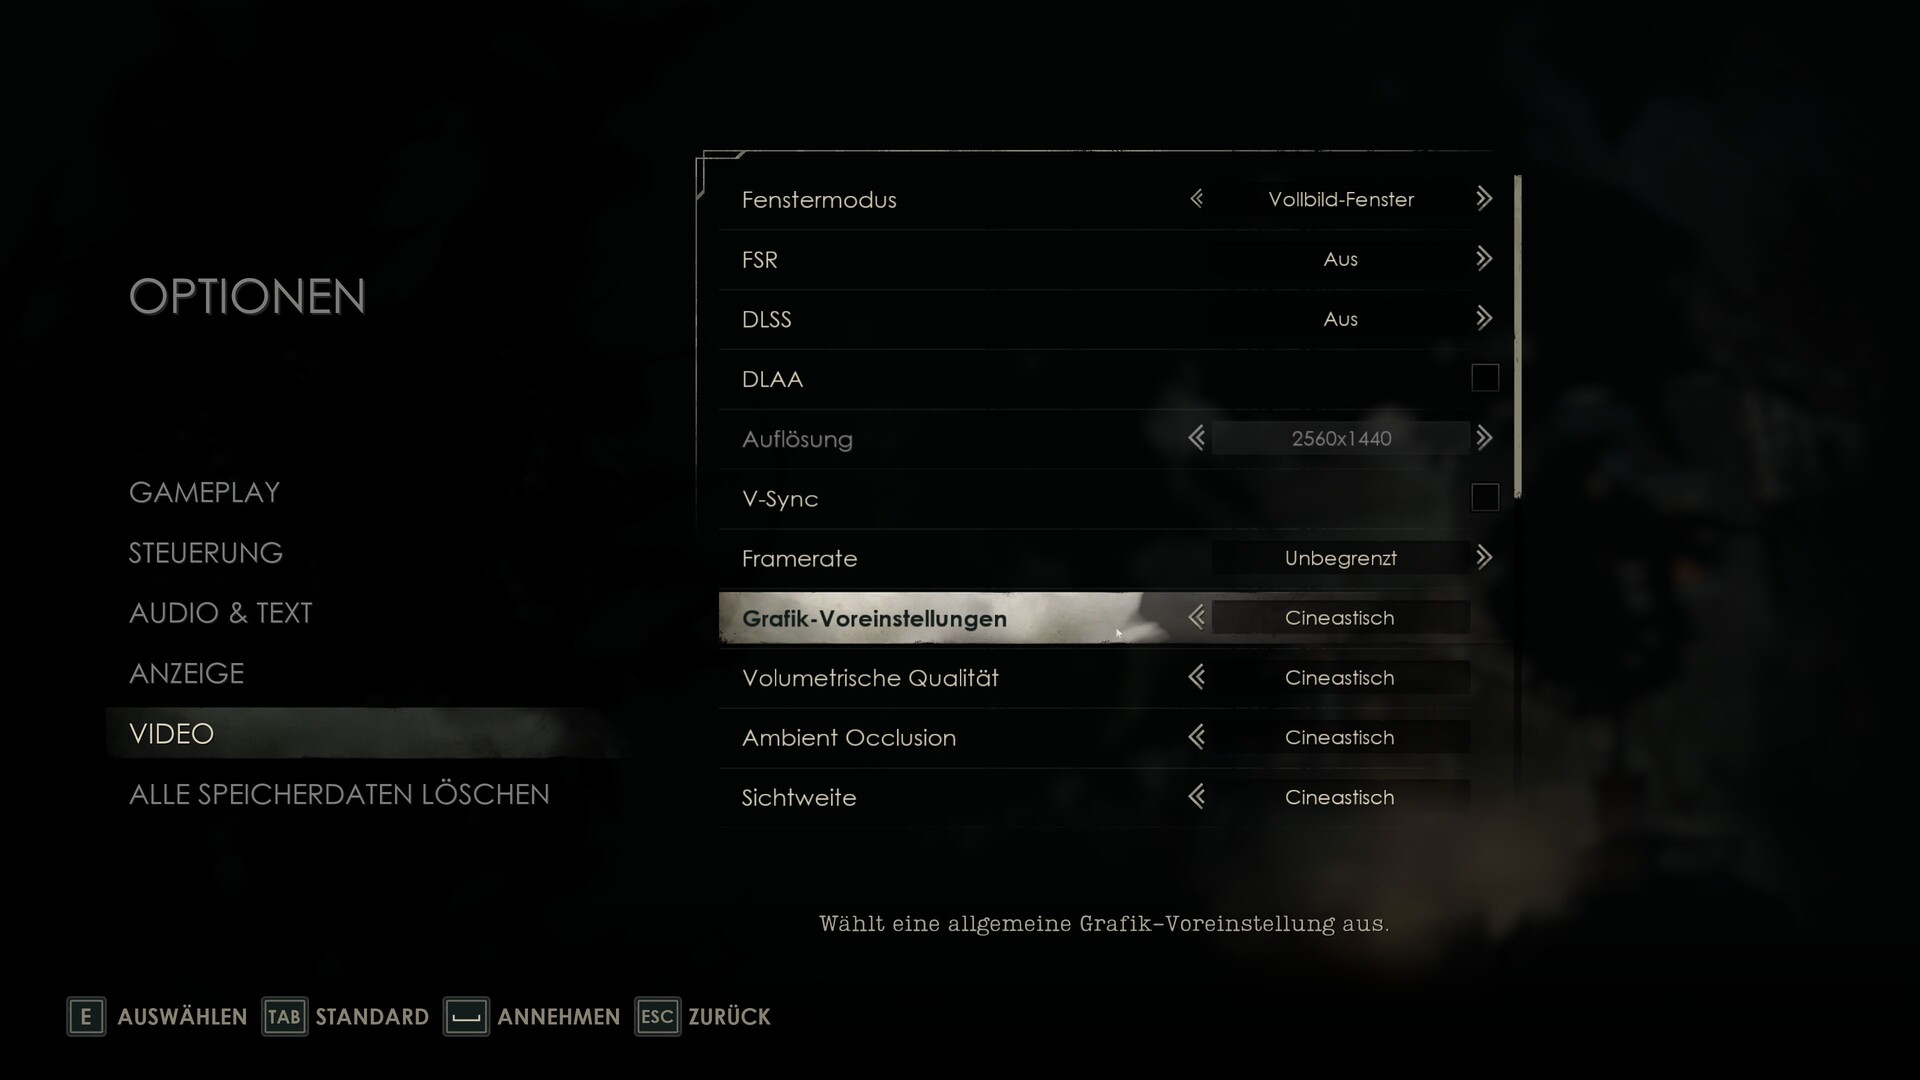
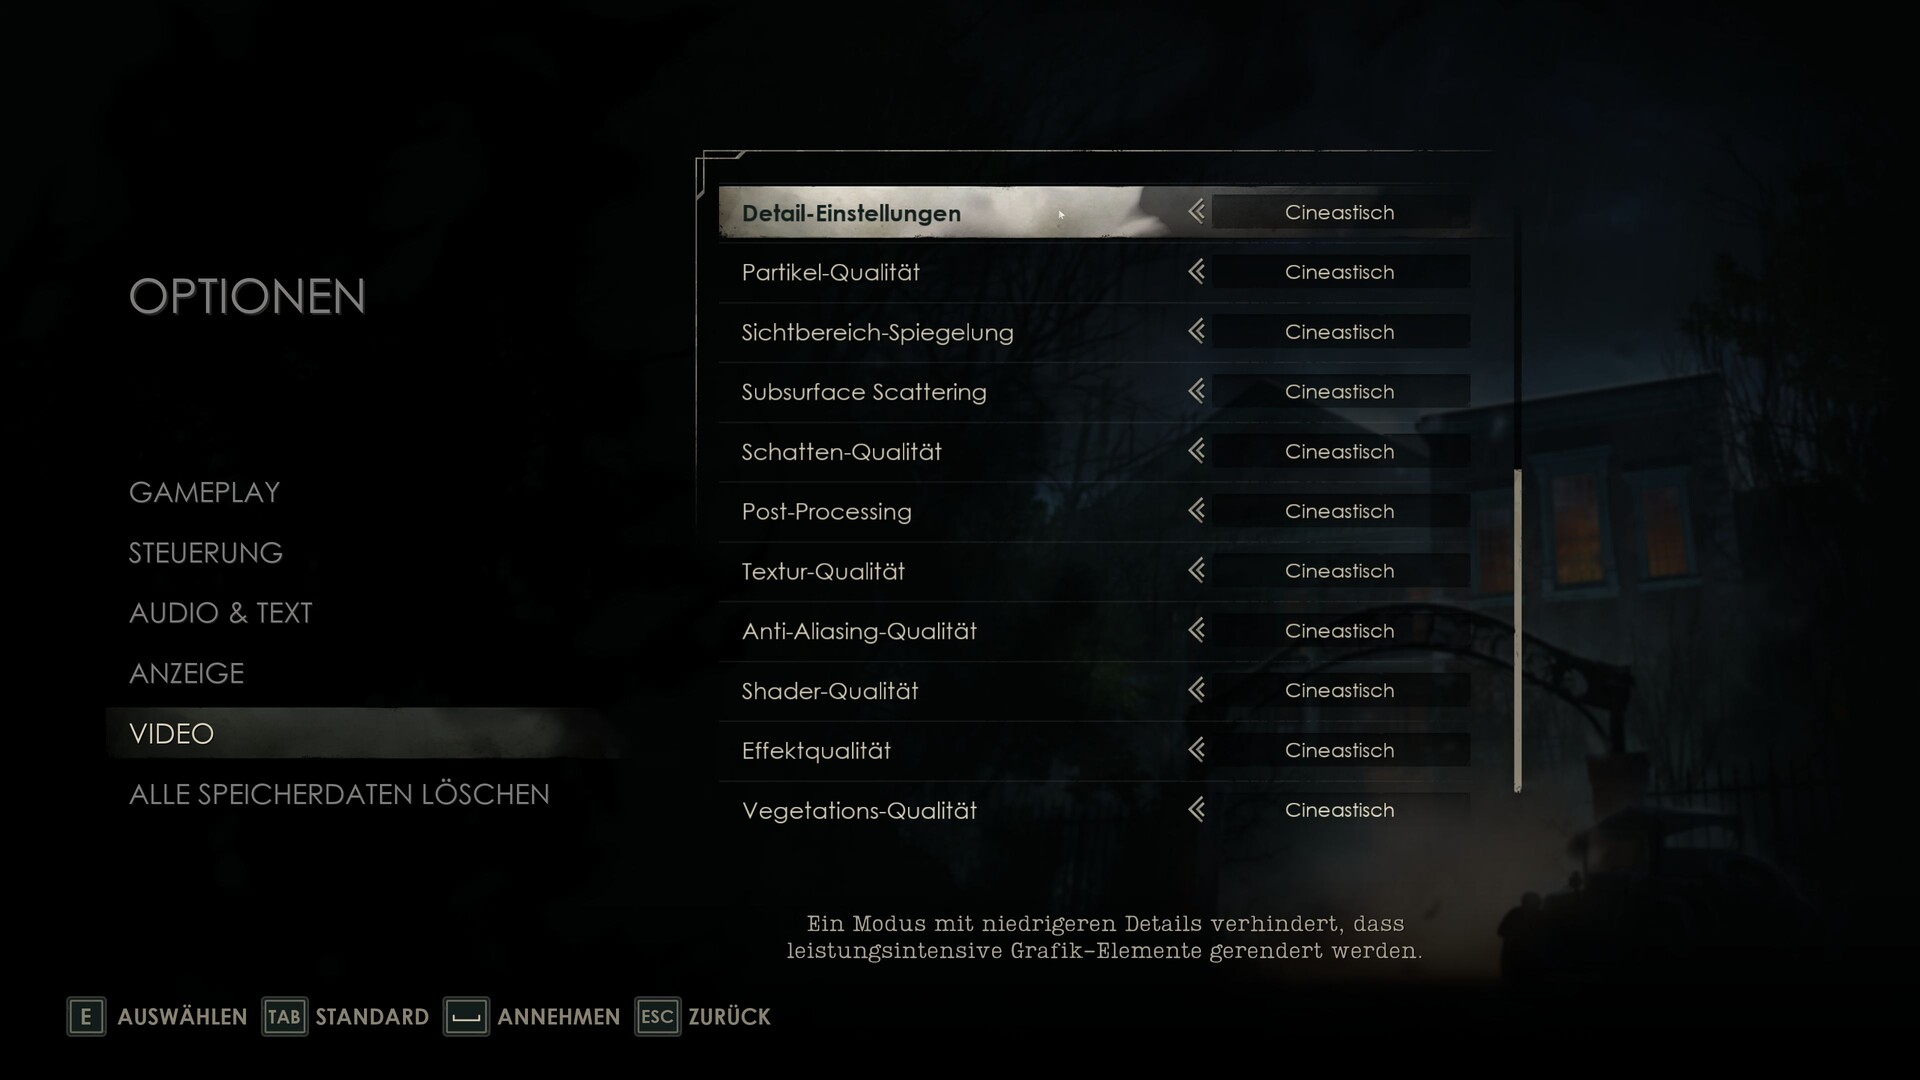
There is hardly anything to criticize about the graphics menu. In addition to the picture mode and resolution, you can activate upscaling in the form of FSR or DLSS in the upper area and optionally use DLAA. V-Sync and an FPS lock are also available upon request. There are also 5 presets that affect more than 10 individual settings. The highest level, called Cinematic, which was used for many measurements, is significantly more demanding than Epic, without any major visual differences being recognizable.

Alone in the Dark
Alone in the Dark
Alone in the Dark
Alone in the Dark
Alone in the Dark
Alone in the Dark

Nevertheless, users will be lacking useful comparison graphics and ray tracing, which are features seen in a lot of Ubisoft titles. On the other hand, setting changes are applied without restarting the game.

Alone in the Dark
Alone in the Dark
Alone in the Dark

Benchmark

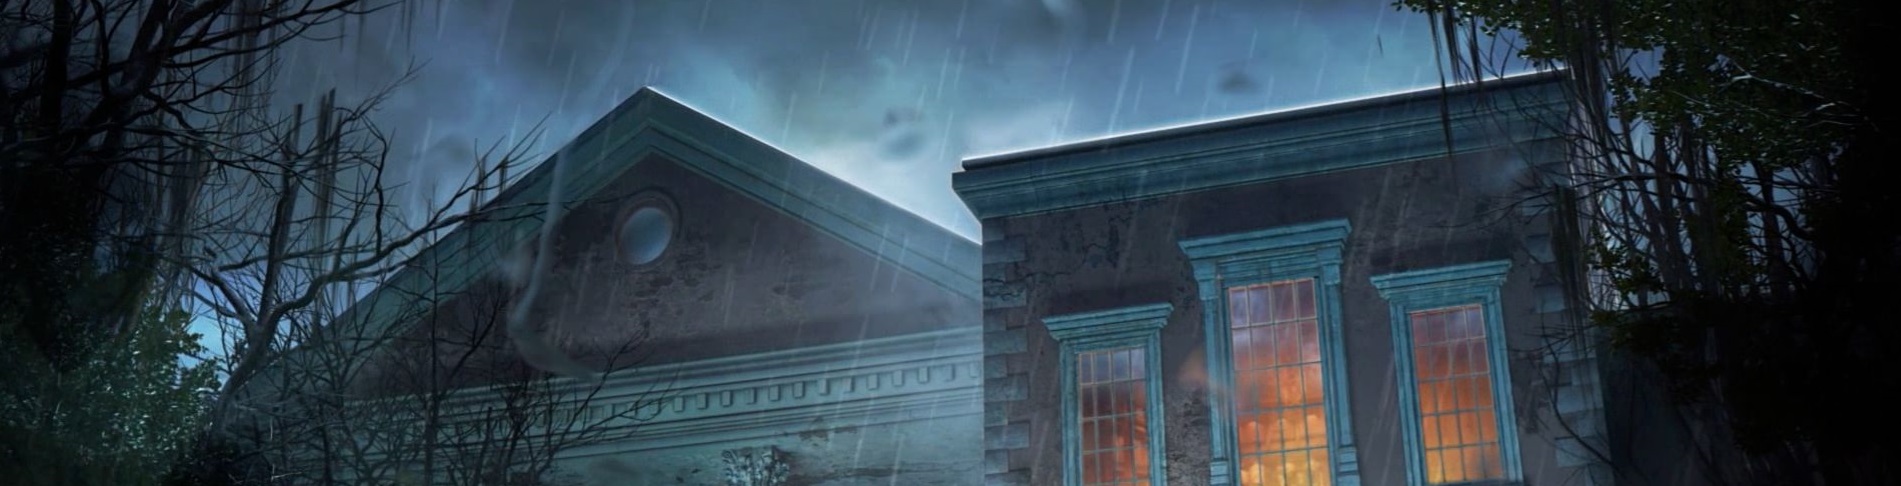
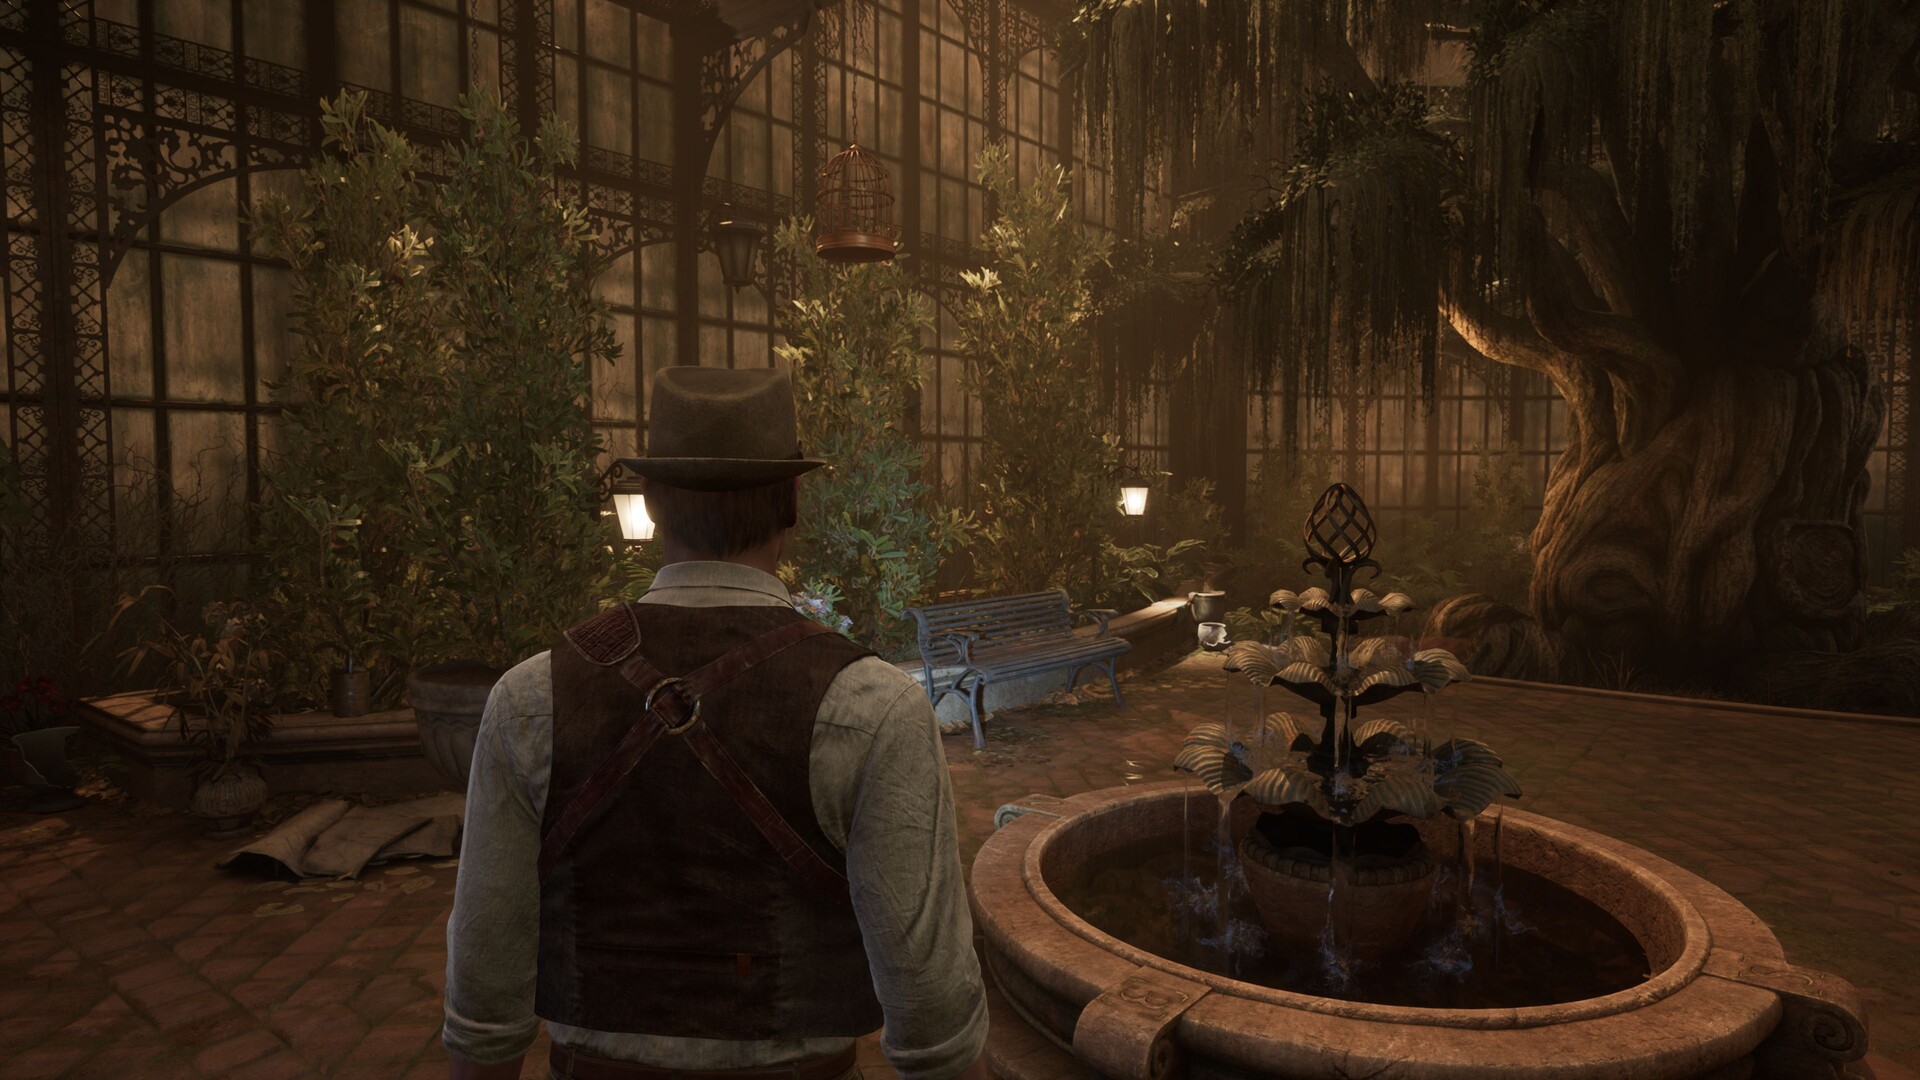
The greenhouse, which you encounter early after starting the game, serves as a benchmark scene. As demonstrated in the video below, we used the CapFrameX tool to capture a set route in slightly under 20 seconds. A playable frame rate ranges between 30 and 40 frames per second.

Results


FHD (1,920 x 1,080)

The Intel Arc 8 introduces a new and relatively powerful iGPU to our typical test setups. Similar to the Radeon 780M, this entry-level chip supports 1,920 x 1,080 pixels and the High preset. A GeForce RTX 4050 or above is recommended for optimum detail in Full HD.

Alone in the Dark
    1920x1080 Low Preset     1920x1080 Medium Preset     1920x1080 High Preset     1920x1080 Cinematic Preset
NVIDIA GeForce RTX 4080, i9-13900K
Desktop-PC Asus ROG Strix Z790-F
343 (86min) fps ∼100%
327 (157min) fps ∼100%
309 (62min) fps ∼100%
252 (25min) fps ∼100%
AMD Radeon RX 7900 XT, i9-13900K
Desktop-PC Asus ROG Strix Z790-F
249 (79min) fps ∼73%
227 (30min) fps ∼69%
221 (36min) fps ∼72%
169 (19min) fps ∼67%
NVIDIA GeForce RTX 4090 Laptop GPU, i9-13900H
Asus ROG Zephyrus M16
220 (36min) fps ∼64%
202 (23min) fps ∼62%
195 (88min) fps ∼63%
141 (26min) fps ∼56%
NVIDIA GeForce RTX 4080 Laptop GPU, i9-13950HX
Razer Blade 16 Mid 23
202 (67min) fps ∼59%
199 (59min) fps ∼61%
194 (29min) fps ∼63%
120 (26min) fps ∼48%
NVIDIA GeForce RTX 4070 Laptop GPU, i9-13900HX
XMG Pro 15 E23
212 (35min) fps ∼62%
191 (19min) fps ∼58%
178 (72min) fps ∼58%
114 (18min) fps ∼45%
NVIDIA GeForce RTX 4060 Laptop GPU, R9 7940HS
Razer Blade 14 Mid 23
206 (87min) fps ∼60%
176 (32min) fps ∼54%
157 (13min) fps ∼51%
74 (24min) fps ∼29%
AMD Radeon RX 7600S, R9 7940HS
Asus TUF Gaming Advantage A16
166 (92min) fps ∼48%
153 (24min) fps ∼47%
137 (39min) fps ∼44%
70 (38min) fps ∼28%
NVIDIA GeForce RTX 4050 Laptop GPU, i7-13700H
Medion Erazer Scout E20
173 (18min) fps ∼50%
157 (22min) fps ∼48%
137 (44min) fps ∼44%
54 (21min) fps ∼21%
Intel Arc 8-Core iGPU, Ultra 7 155H
Lenovo Yoga Pro 7 14
69 (28min) fps ∼20%
56 (20min) fps ∼17%
49 (8min) fps ∼16%
29 (7min) fps ∼12%
AMD Radeon 780M, R9 7940HS
Asus TUF Gaming Advantage A16
75 (25min) fps ∼22%
54 (21min) fps ∼17%
44 (25min) fps ∼14%
19 (7min) fps ∼8%

QHD (2,560 x 1,440)

For QHD monitors, an upper-mid-range representative would be ideal. Both the GeForce GeForce RTX 4060 and the Radeon RX 7600S can handle the Cinematic preset efficiently.

Alone in the Dark
    2560x1440 Cinematic Preset
NVIDIA GeForce RTX 4080, i9-13900K
Desktop-PC Asus ROG Strix Z790-F
163 (63min) fps ∼100%
AMD Radeon RX 7900 XT, i9-13900K
Desktop-PC Asus ROG Strix Z790-F
114 (56min) fps ∼70%
NVIDIA GeForce RTX 4090 Laptop GPU, i9-13900H
Asus ROG Zephyrus M16
99 (32min) fps ∼61%
NVIDIA GeForce RTX 4080 Laptop GPU, i9-13950HX
Razer Blade 16 Mid 23
86 (34min) fps ∼53%
NVIDIA GeForce RTX 4070 Laptop GPU, i9-13900HX
XMG Pro 15 E23
72 (29min) fps ∼44%
NVIDIA GeForce RTX 4060 Laptop GPU, R9 7940HS
Razer Blade 14 Mid 23
48 (21min) fps ∼29%
AMD Radeon RX 7600S, R9 7940HS
Asus TUF Gaming Advantage A16
43 (25min) fps ∼26%
NVIDIA GeForce RTX 4050 Laptop GPU, i7-13700H
Medion Erazer Scout E20
31 (9min) fps ∼19%

UHD (3,840 x 2,160)

Even the absolute best models begin to sweat at 4K resolution. When it comes to notebook GPUs, only the GeForce RTX 4090 currently produces enough frames to display full details on the screen without upscaling. You can start with a GeForce RTX 4070, which includes DLSS or FSR (quality).

Alone in the Dark
    3840x2160 Cinematic Preset     3840x2160 Cinematic Preset + Quality DLSS     3840x2160 Cinematic Preset + Quality FSR
NVIDIA GeForce RTX 4080, i9-13900K
Desktop-PC Asus ROG Strix Z790-F
54 (35min) fps ∼100%
144 (72min) fps ∼100%
AMD Radeon RX 7900 XT, i9-13900K
Desktop-PC Asus ROG Strix Z790-F
54 (31min) fps ∼100%
111 (31min) fps ∼100%
NVIDIA GeForce RTX 4090 Laptop GPU, i9-13900H
Asus ROG Zephyrus M16
37 (18min) fps ∼69%
81 (25min) fps ∼56%
NVIDIA GeForce RTX 4080 Laptop GPU, i9-13950HX
Razer Blade 16 Mid 23
25 (13min) fps ∼46%
74 (21min) fps ∼51%
NVIDIA GeForce RTX 4070 Laptop GPU, i9-13900HX
XMG Pro 15 E23
17 (4min) fps ∼31%
54 (24min) fps ∼38%
NVIDIA GeForce RTX 4060 Laptop GPU, R9 7940HS
Razer Blade 14 Mid 23
12 (3min) fps ∼22%
30 (14min) fps ∼21%
AMD Radeon RX 7600S, R9 7940HS
Asus TUF Gaming Advantage A16
9 (4min) fps ∼17%
27 (18min) fps ∼24%
NVIDIA GeForce RTX 4050 Laptop GPU, i7-13700H
Medion Erazer Scout E20
7 (7min) fps ∼13%
20 (2min) fps ∼14%

Overview

Show Restrictions
PosModel< PrevNext >Alone in the Dark
 Alone in the Dark (2024)
low
1920x1080
Low Preset
med.
1920x1080
Medium Preset
high
1920x1080
High Preset
ultra
1920x1080
Cinematic Preset
QHD
2560x1440
Cinematic Preset
4K
3840x2160
Cinematic Preset
NVIDIA GeForce RTX 5090
335
303
267
161.3
NVIDIA GeForce RTX 4090
328
318
312
286
222
48.7
NVIDIA GeForce RTX 5080
273
204
102.5
NVIDIA GeForce RTX 5070 Ti
327.5n2
302.5n2
299.5n2
243n2
165.2n2
71.3n2
AMD Radeon RX 7900 XTX
308
297
297
231
148
70.9
NVIDIA GeForce RTX 4080
343
327
309
252
163
54
AMD Radeon RX 7900 XT
249
227
221
169
114
54
NVIDIA GeForce RTX 5070
367
305
288
226
142.4
55.8
AMD Radeon RX 6950 XT
333
297
299
183.6
108.9
50.6
NVIDIA GeForce RTX 4090 Laptop GPU
219.5n2
209.5n2
205.5n2
165.45n2
116.3n2
37
NVIDIA GeForce RTX 3090
333
311
296
209
132.2
43.3
AMD Radeon RX 7800 XT
310
298
280
166.1
102.5
46.5
NVIDIA GeForce RTX 4080 Laptop GPU
225.5n2
214.5n2
204n2
148.2n2
88.8n2
25
NVIDIA GeForce RTX 5060
307
269
232
148.4
84.2
30.5
NVIDIA GeForce RTX 4070
321
296
262
180
58.2
15
AMD Radeon RX 6800
294
277
245
135.8
77.5
38.3
NVIDIA Titan RTX
313
272
233
137.9
84.2
22.3
NVIDIA GeForce RTX 3070 Ti
271
264
226
159.6
99.4
26
NVIDIA GeForce RTX 3080 Ti Laptop GPU
143.8
90.9
34.2
PosModel< PrevNext >Alone in the Dark
low med. high ultra QHD 4K
NVIDIA GeForce RTX 4070 Laptop GPU
212n5
191n5
178n5
124.7n5
72n5
17n3
AMD Radeon RX 6750 XT
281
248
210
107.5
57.5
20.1
AMD Radeon RX 6700 XT
274
245
198.8
102.2
56.3
24.6
NVIDIA GeForce RTX 3080 Laptop GPU
177.3n2
168.75n2
159.05n2
105.85n2
57.8n2
19.3n2
NVIDIA GeForce RTX 3060 Ti
306
259
221
132.3
67.1
14.1
Intel Arc B580
189.1
165.3
149.7
104.5
67.2
32.4
Intel Arc A770
188.4
162.7
145.4
83.5
52.1
22.6
NVIDIA GeForce RTX 4060
240
216
186.8
109.2
62.8
14.1
AMD Radeon RX 7600
268
228
187.1
90.8
48.4
9
NVIDIA GeForce RTX 4060 Laptop GPU
182.55n2
163.05n2
150.4n2
100.45n2
48
12
AMD Radeon RX 6650 XT
258
211
174.5
82.1
36.6
8.9
NVIDIA GeForce RTX 3070 Laptop GPU
172.9
156.8
149.9
102.4
51.5
16.1
AMD Radeon RX 7600M XT
196.9
167.4n2
84.2
50.3
8.2
Intel Arc A750
185.6
154.7
136.6
77
47
10.5
NVIDIA Titan X Pascal
230
193
159.2
89.2
54.1
22.9
NVIDIA GeForce RTX 2070 Super (Desktop)
258
208
174.1
95.1
46.2
13.1
AMD Radeon RX 5700 XT (Desktop)
221
183.8
154.8
80.3
43.8
AMD Radeon RX 7600S
166
153
137
70
43
9
Intel Arc A580
171.1
145.8
127.6
72.5
43.8
NVIDIA GeForce RTX 2060 Super (Desktop)
223
178.9
149.9
84.7
41.6
12.2
PosModel< PrevNext >Alone in the Dark
low med. high ultra QHD 4K
AMD Radeon RX 6600
207
167.4
138.2
67.7
34
11.4
AMD Radeon RX 5700 (Desktop)
210
155.2n2
74.6
35.8
AMD Radeon RX 5600 XT (Desktop)
184.3
151.7
127.9
69.1
34.5
NVIDIA GeForce GTX 1660 Super (Desktop)
168.4
132.4
109.4
38
15.9
AMD Radeon RX 6500 XT
143.6
112.9
93.5
18.7
AMD Radeon RX 5500 XT (Desktop)
133.4
109.9
92.4
46.9
25.2
NVIDIA GeForce RTX 4050 Laptop GPU
173
157
137
54
31
7
Intel Arc A730M
108.4
95.9
90.4
57.2
30.1
NVIDIA GeForce GTX 1660 (Desktop)
149.9
116.5
96.3
30.3
12.3
NVIDIA GeForce GTX 1650 Super (Desktop)
135.4
104.3
86.2
22
NVIDIA GeForce RTX 3050 4GB Laptop GPU
76.3
66.6
34.8
Intel Arc 8-Core iGPU
69
56
49
29
Intel Arc A380
84.6
71.6
59
29.5
AMD Radeon 780M
70.25n2
52.65n2
42.85n2
19.25n2
11.3
Intel UHD Graphics 770
31.2
21.5
16.7
13.6
(-) * Smaller values are better. / n123 Number of benchmarks for this median value / * Approximate position


Legend
5Stutters – This game is very likely to stutter and have poor frame rates. Based on all known benchmarks using the specified graphical settings, average frame rates are expected to fall below 25fps
May Stutter – This graphics card has not been explicitly tested on this game. Based on interpolated information from surrounding graphics cards of similar performance levels, stutters and poor frame rates are expected.
30Fluent – Based on all known benchmarks using the specified graphical settings, this game should run at or above 25fps
40Fluent – Based on all known benchmarks using the specified graphical settings, this game should run at or above 35fps
60Fluent – Based on all known benchmarks using the specified graphical settings, this game should run at or above 58fps
May Run Fluently – This graphics card has not been explicitly tested on this game. Based on interpolated information from surrounding graphics cards of similar performance levels, fluent frame rates are expected.
?Uncertain – This graphics card experienced unexpected performance issues during testing for this game. A slower card may be able to achieve better and more consistent frame rates than this particular GPU running the same benchmark scene.
Uncertain – This graphics card has not been explicitly tested on this game and no reliable interpolation can be made based on the performances of surrounding cards of the same class or family.
The value in the fields displays the average frame rate of all values in the database. Move your cursor over the value to see individual results.

Test system details

Notebook Graphics card Processor RAM
Asus ROG Zephyrus M16 Nvidia GeForce RTX 4090 @150 W TGP (16 GB GDDR6X) Intel Core i9-13900H 2 x 16 GB DDR5
Razer Blade 16 Mid 23 Nvidia GeForce RTX 4080 @175 W TGP (12 GB GDDR6X) Intel Core i9-13950HX 2 x 16 GB DDR5
XMG Pro 15 E23 Nvidia GeForce RTX 4070 @140 W TGP (8 GB GDDR6) Intel Core i9-13900HX 2 x 16 GB DDR5
Razer Blade 14 Mid 23 Nvidia GeForce RTX 4060 @140 W TGP (8 GB GDDR6) AMD Ryzen 9 7940HS 2 x 8 GB DDR5
Medion Erazer Scout E20 Nvidia GeForce RTX 4050 @100 W TGP (6 GB GDDR6) Intel Core i7-13700H 2 x 8 GB DDR5
Asus TUF Gaming Advantage A16 AMD Radeon RX 7600S (8 GB GDDR6) & AMD Radeon 780M AMD Ryzen 9 7940HS 2 x 8 GB DDR5
Lenovo Yoga Pro 7 14 Intel Arc 8 Intel Core Ultra 7 155H 2 x 16 GB DDR5
Tower PC Graphics card Processor RAM
Asus ROG Strix Z790-F Nvidia GeForce RTX 4080 (16 GB GDDR6X)
AMD Radeon RX 7900 XT (20 GB GDDR6)
Intel Core i9-13900K 2 x 24 GB DDR5 G.Skill
4K monitor Operating system Nvidia driver AMD driver Intel driver
Philips Evnia 42M2N8900 Windows 11 551.86 24.3.1 101.5379
Read all 2 comments / answer
static version load dynamic
Loading Comments
Comment on this article
Please share our article, every link counts!
Mail Logo
> Expert Reviews and News on Laptops, Smartphones and Tech Innovations > Reviews > Alone in the Dark (2024) in review: Laptop and desktop benchmarks
Florian Glaser, 2024-03-24 (Update: 2024-08-15)