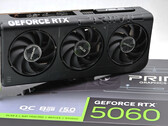


Nvidia GeForce RTX 5060 Low Profile from Zotac: Powerful Blackwell mini GPU for compact desktop PCs review
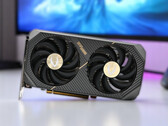
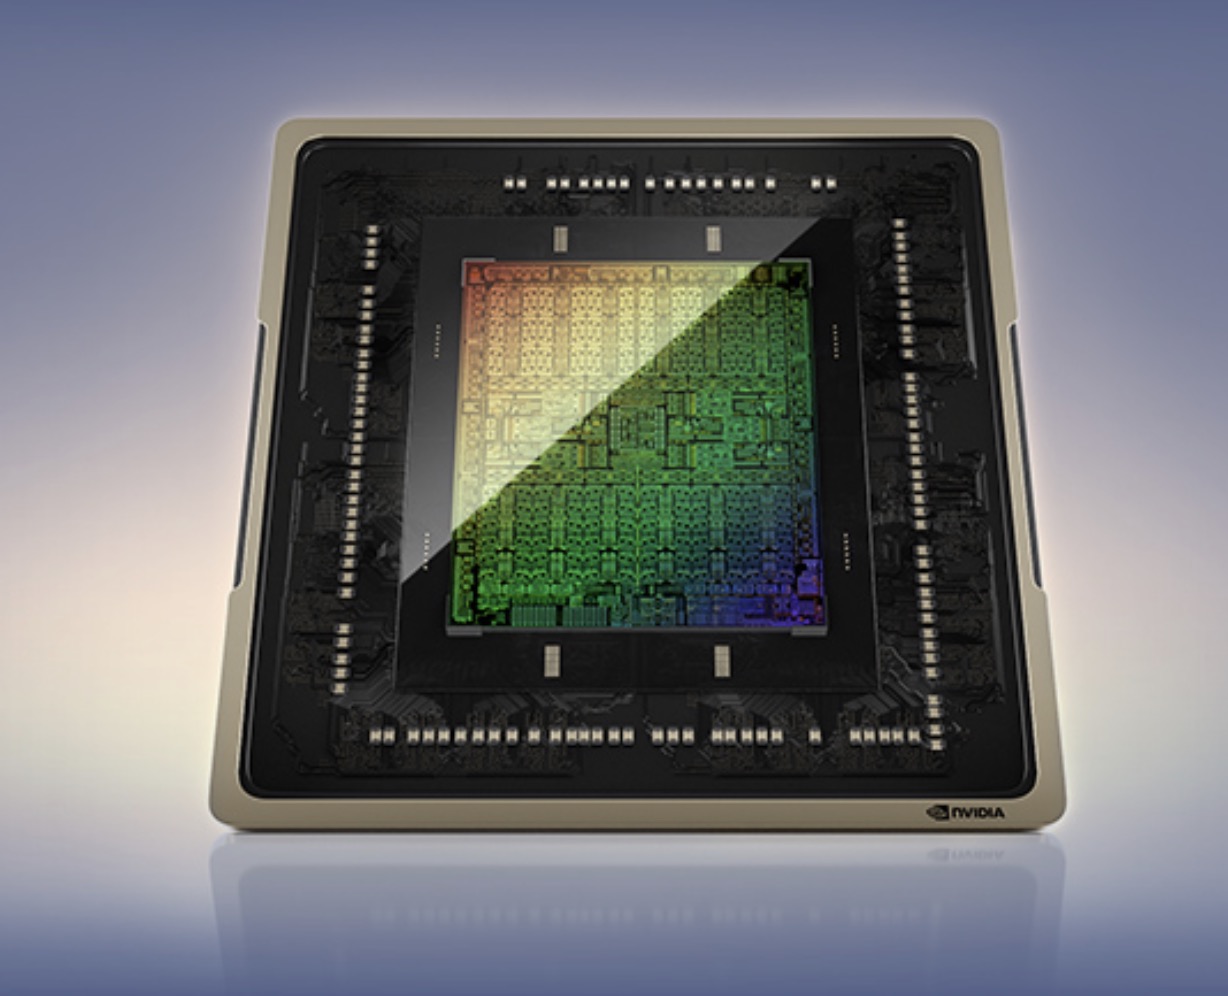
With the GeForce RTX 5060 Low Profile, Zotac offers a particularly space-saving mid-range GPU based on Nvidia's new Blackwell architecture. Despite its slim design, the card comes with modern features such as DLSS 4 and multi-frame generation, which should ensure smooth Full HD gaming. In this review, we will find out how the compact design works in practice - with all its advantages and disadvantages.
AMD Ryzen 7 9800X3D, NVIDIA GeForce RTX 5060, 347 g