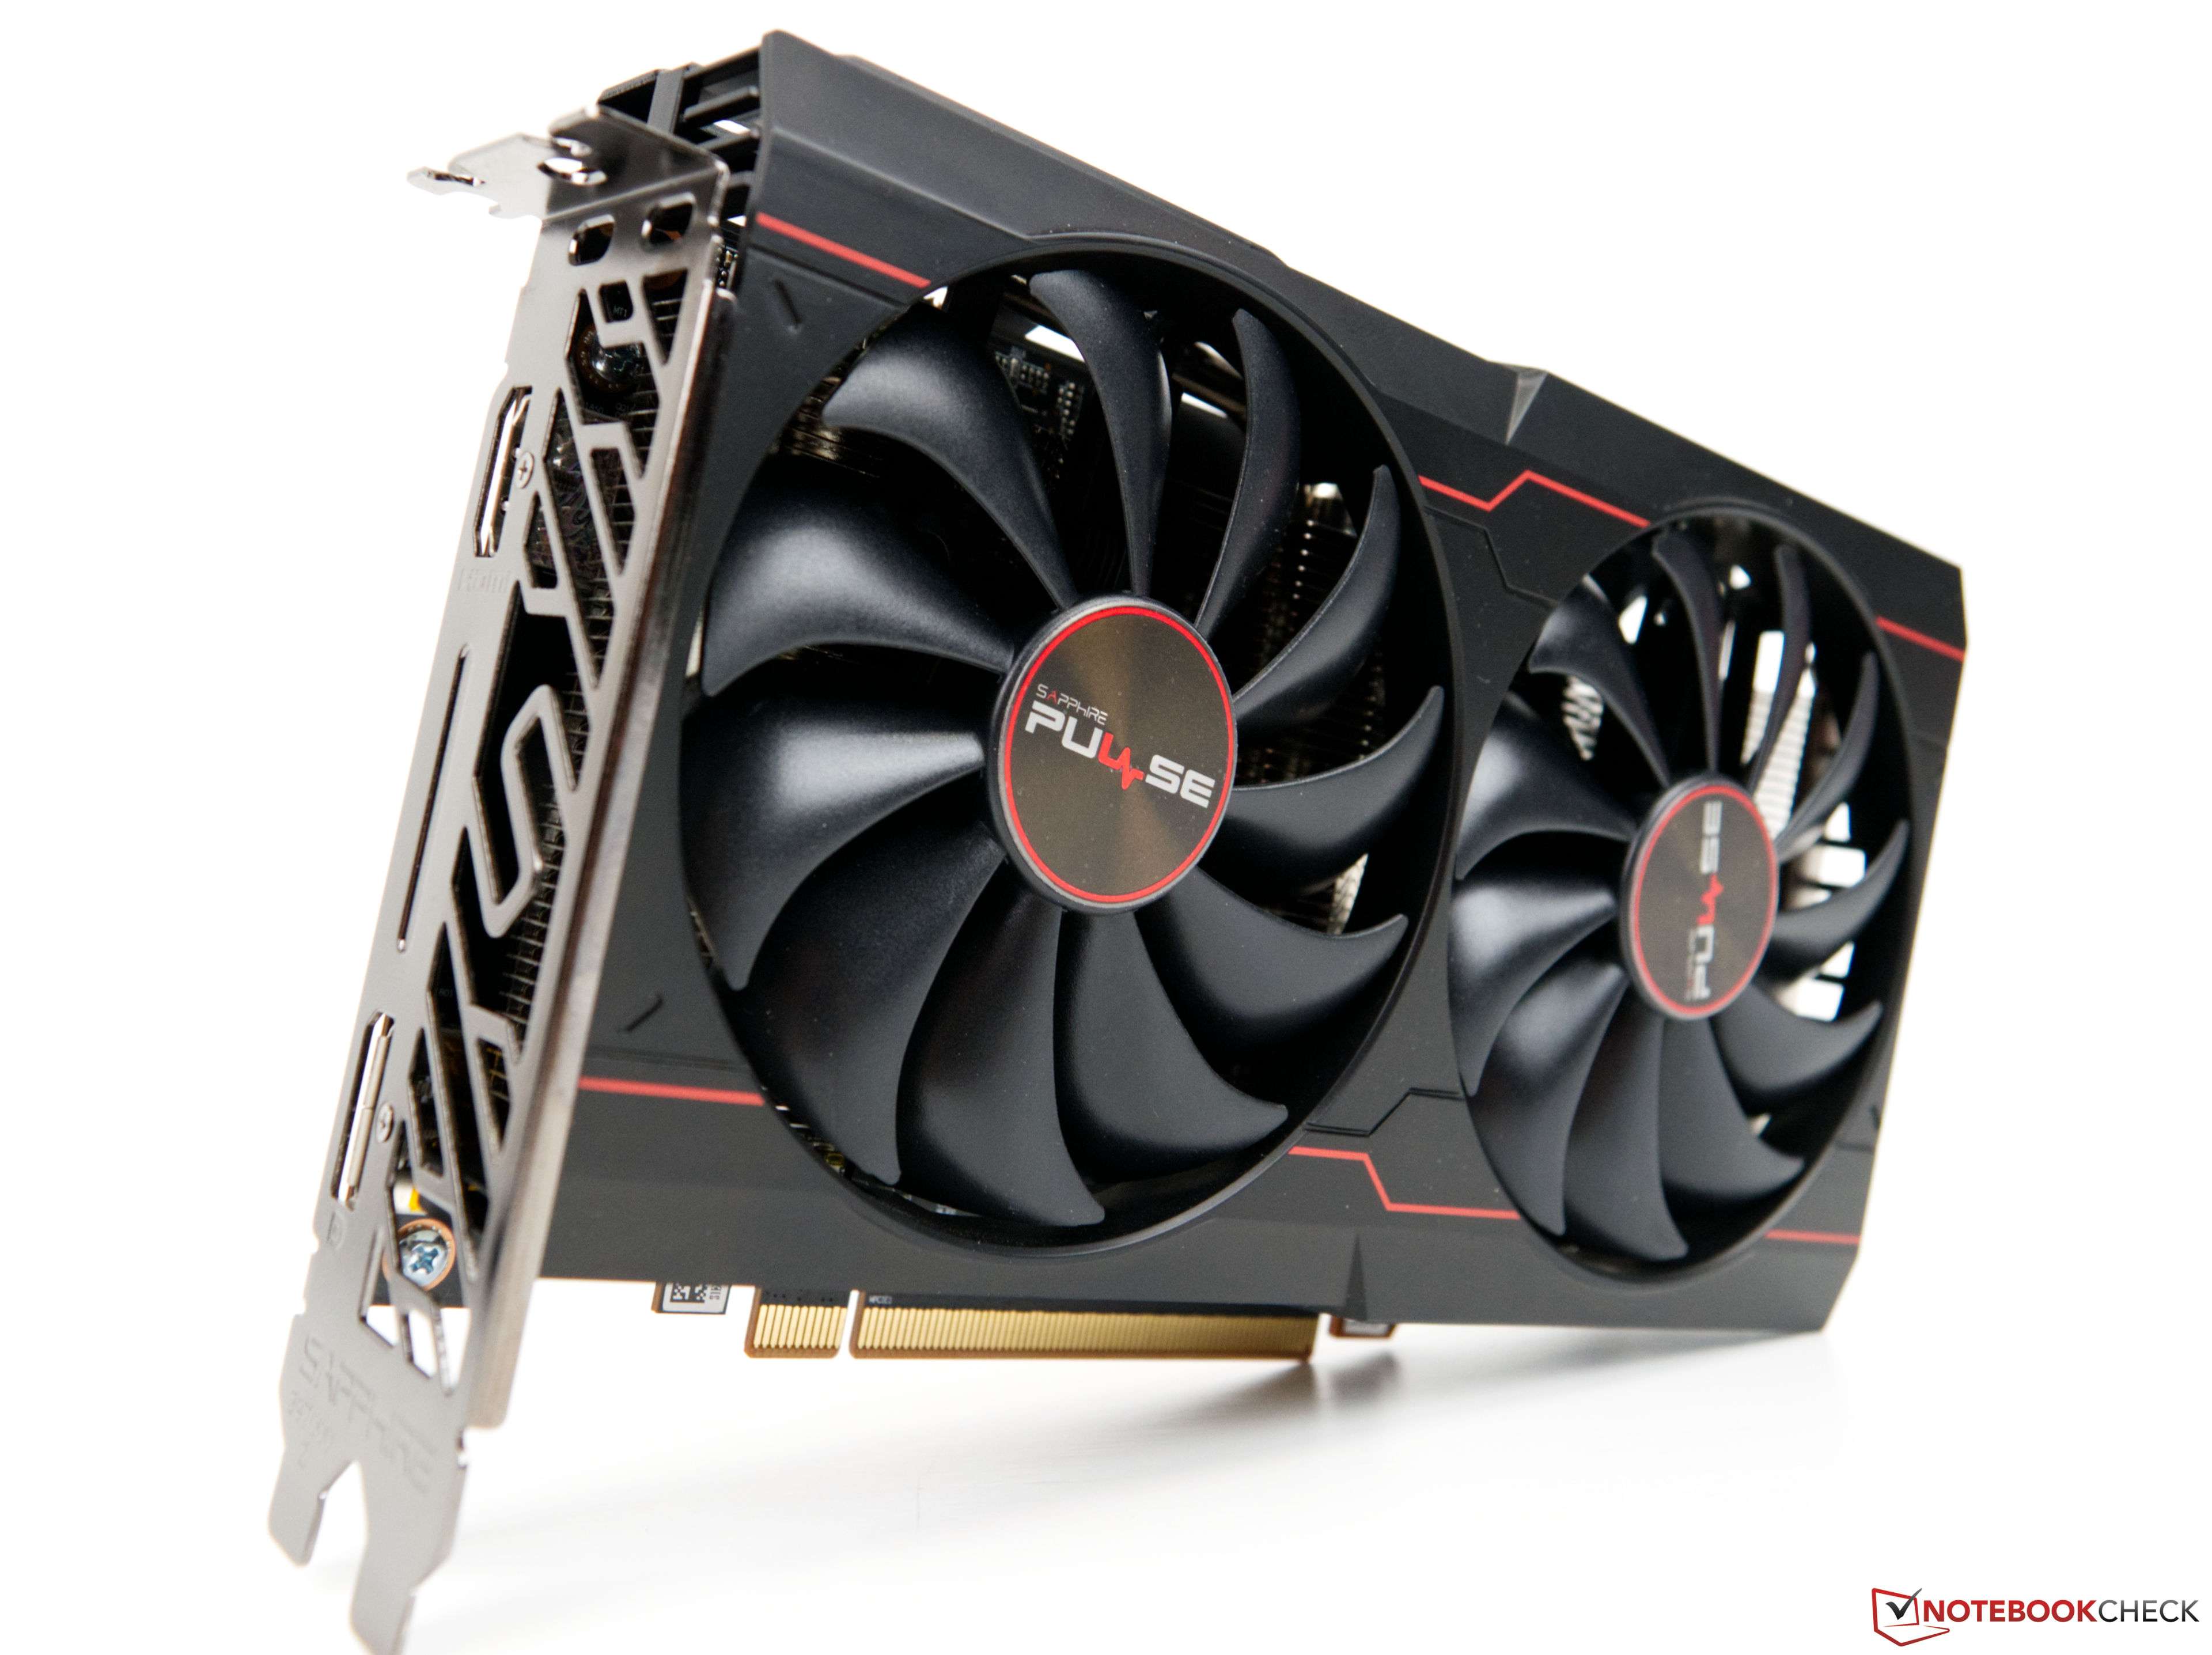
Notebookcheck Logo

AMD Radeon RX 6500 XT

AMD Radeon RX 6500 XT

The AMD Radeon RX 6500 XT is a mid range graphics card for desktop PCs. It is using the Navi 24 graphics chip which uses the RDNA 2 architecture and is manufactured in 6nm at TSMC. The 6500XT offers 16 compute units (CUs = 1,024 shaders) and 4 GB GDDR6 dedicated VRAM connected via a 64 Bit interface (143.9 GB/s max).

The performance of the Radeon RX 6500 XT is similar to a Nvidia GeForce GTX 1650 Super, but slower than an older Radeon RX 5500 XT. Therefore, the card is best suited for 1080p and high presets of 2021 games (see below for actual game benchmarks).

The power consumption is rated at 107 Watt (TGP) and therefore similar to a GTX 1650 Super (100 Watt).

ArchitectureNavi / RDNA2
Pipelines1024 - unified
TMUs64
ROPs32
Raytracing Cores16
Core Speed2310 MHz
Shader Speed2815 MHz
Memory Speed18000 MHz
Memory TypeGDDR6
Max. Amount of Memory4 GB
Shared Memoryno
APIDirectX 12_2, Shader 6.6, OpenGL 4.4, OpenCL 2.2, Vulkan 1.3
Power Consumption107 Watt
Transistor Count5.4 Billion
Die Size 107 mm²
technology7 nm
PCIe4.0 x4
Displays2 Displays (max.), HDMI 2.1, DisplayPort 1.4a
Date of Announcement19.01.2022

Benchmarks

Performance Rating - 3DMark 11 + Fire Strike + Time Spy
5.9 pt (18%)
Restrict / Search: Model: Max. age: years
3DMark - 3DMark Speed Way Score
197 Points (1%)
3DMark - 3DMark Fire Strike Standard Score
min: 13817     avg: 14096     median: 14222 (21%)     max: 14249 Points
3DMark - 3DMark Fire Strike Standard Graphics
min: 15344     avg: 15605     median: 15712 (14%)     max: 15760 Points
3DMark - 3DMark Ice Storm Graphics
min: 309951     avg: 404409     median: 405187 (45%)     max: 498088 Points
3DMark - 3DMark Time Spy Score
min: 5447     avg: 5521     median: 5536 (14%)     max: 5579 Points
3DMark - 3DMark Time Spy Graphics
min: 4942     avg: 4967     median: 4967 (10%)     max: 4993 Points
Restrict / Search: Model: Max. age: years
3DMark - 3DMark Ice Storm Unlimited Graphics
min: 318549     avg: 360045     median: 356129 (36%)     max: 405456 Points
3DMark - 3DMark Ice Storm Extreme Graphics
min: 271620     avg: 311268     median: 298854 (35%)     max: 363330 Points
3DMark - 3DMark Cloud Gate Score
min: 53226     avg: 57429     median: 58994 (56%)     max: 60067 Points
3DMark - 3DMark Cloud Gate Graphics
min: 89209     avg: 92127     median: 91909 (23%)     max: 95263 Points
3DMark - 3DMark Night Raid
49003 Points (46%)
3DMark - 3DMark Night Raid Graphics Score
64682 Points (25%)
3DMark 11 - 3DM11 Performance Score
min: 20343     avg: 22051     median: 22899 (28%)     max: 22911 Points
3DMark 11 - 3DM11 Performance GPU
min: 20419     avg: 22143     median: 22954 (18%)     max: 23055 Points
Restrict / Search: Model: Max. age: years
3DMark Vantage
3DM Vant. Perf. total +
3DMark Vantage - 3DM Vant. Perf. total
min: 67709     avg: 73974     median: 76445 (22%)     max: 77767 Points
3DM Vant. Perf. GPU no PhysX +
3DMark Vantage - 3DM Vant. Perf. GPU no PhysX
min: 64381     avg: 68766     median: 70590 (39%)     max: 71327 Points
Restrict / Search: Model: Max. age: years
3DMark 05 - 3DMark 05 - Standard
min: 49095     avg: 70267     median: 80654 (88%)     max: 81052 Points
Restrict / Search: Model: Max. age: years
3DMark 06 3DMark 06 - Standard 1280x1024 +
3DMark 06
min: 44184     avg: 57953     median: 64521 (84%)     max: 65154 Points
Unigine Valley 1.0 - Unigine Valley 1.0 DX
min: 54.2     avg: 54.7     median: 54.7 (17%)     max: 55.2 fps
SPECviewperf 12
specvp12 sw-03 +
SPECviewperf 12 - specvp12 sw-03
min: 111     avg: 140     median: 140 (35%)     max: 169 fps
specvp12 snx-02 +
SPECviewperf 12 - specvp12 snx-02
min: 41.9     avg: 86.5     median: 86.5 (13%)     max: 131 fps
specvp12 showcase-01 +
SPECviewperf 12 - specvp12 showcase-01
min: 56.2     avg: 67.1     median: 67.1 (12%)     max: 78 fps
specvp12 mediacal-01 +
SPECviewperf 12 - specvp12 mediacal-01
min: 39.2     avg: 57.6     median: 57.6 (15%)     max: 76 fps
specvp12 maya-04 +
SPECviewperf 12 - specvp12 maya-04
min: 79.9     avg: 110.5     median: 110.5 (30%)     max: 141 fps
specvp12 energy-01 +
SPECviewperf 12 - specvp12 energy-01
min: 7.81     avg: 59.9     median: 59.9 (53%)     max: 112 fps
specvp12 creo-01 +
SPECviewperf 12 - specvp12 creo-01
min: 84.3     avg: 90.8     median: 90.8 (36%)     max: 97.3 fps
specvp12 catia-04 +
SPECviewperf 12 - specvp12 catia-04
min: 137     avg: 150     median: 150 (25%)     max: 163 fps
specvp12 3dsmax-05 +
SPECviewperf 12 - specvp12 3dsmax-05
min: 141     avg: 156.5     median: 156.5 (24%)     max: 172 fps
SPECviewperf 13 specvp13 sw-04 +
SPECviewperf 13 - specvp13 sw-04
min: 142     avg: 153.5     median: 153.5 (41%)     max: 165 fps
specvp13 snx-03 +
SPECviewperf 13 - specvp13 snx-03
min: 76.4     avg: 156.7     median: 156.7 (17%)     max: 237 fps
specvp13 showcase-02 +
SPECviewperf 13 - specvp13 showcase-02
min: 56.3     avg: 67.2     median: 67.2 (11%)     max: 78 fps
specvp13 medical-02 +
SPECviewperf 13 - specvp13 medical-02
min: 58.8     avg: 62.3     median: 62.3 (11%)     max: 65.8 fps
specvp13 maya-05 +
SPECviewperf 13 - specvp13 maya-05
min: 168     avg: 190.5     median: 190.5 (22%)     max: 213 fps
specvp13 energy-02 +
SPECviewperf 13 - specvp13 energy-02
min: 13.8     avg: 18.7     median: 18.7 (6%)     max: 23.6 fps
specvp13 creo-02 +
SPECviewperf 13 - specvp13 creo-02
min: 153     avg: 159.5     median: 159.5 (23%)     max: 166 fps
specvp13 catia-05 +
SPECviewperf 13 - specvp13 catia-05
min: 217     avg: 232.5     median: 232.5 (26%)     max: 248 fps
specvp13 3dsmax-06 +
SPECviewperf 13 - specvp13 3dsmax-06
min: 141     avg: 147.5     median: 147.5 (23%)     max: 154 fps
SPECviewperf 2020 specvp2020 solidworks-05 4k +
SPECviewperf 2020 - specvp2020 solidworks-05 4k
28.4 fps (7%)
specvp2020 snx-04 4k +
SPECviewperf 2020 - specvp2020 snx-04 4k
min: 64     avg: 103.5     median: 103.5 (11%)     max: 143 fps
specvp2020 medical-03 4k +
SPECviewperf 2020 - specvp2020 medical-03 4k
min: 10     avg: 10.8     median: 10.8 (7%)     max: 11.6 fps
specvp2020 maya-06 4k +
SPECviewperf 2020 - specvp2020 maya-06 4k
min: 71.6     avg: 81.6     median: 81.6 (12%)     max: 91.6 fps
specvp2020 energy-03 4k +
SPECviewperf 2020 - specvp2020 energy-03 4k
min: 10.9     avg: 14.8     median: 14.8 (3%)     max: 18.7 fps
specvp2020 creo-03 4k +
SPECviewperf 2020 - specvp2020 creo-03 4k
min: 40.2     avg: 48.5     median: 48.5 (22%)     max: 56.8 fps
specvp2020 catia-06 4k +
SPECviewperf 2020 - specvp2020 catia-06 4k
min: 13.8     avg: 17.9     median: 17.9 (12%)     max: 22 fps
specvp2020 3dsmax-07 4k +
SPECviewperf 2020 - specvp2020 3dsmax-07 4k
min: 20.3     avg: 20.9     median: 20.9 (7%)     max: 21.4 fps
Geekbench 6.5 - Geekbench 6.5 GPU OpenCL
49744 points (13%)
Geekbench 6.5 - Geekbench 6.5 GPU Vulkan
58420 points (15%)
LuxMark v2.0 64Bit - LuxMark v2.0 Room GPU
min: 1152     avg: 1219     median: 1219 (4%)     max: 1286 Samples/s
LuxMark v2.0 64Bit - LuxMark v2.0 Sala GPU
min: 2690     avg: 3089     median: 3089 (5%)     max: 3488 Samples/s
ComputeMark v2.1 - ComputeMark v2.1 Result
min: 11529     avg: 13400     median: 13400 (11%)     max: 15271 points
Power Consumption - Furmark Stress Test Power Consumption - external Monitor *
min: 205     avg: 213     median: 213 (29%)     max: 221 Watt
0153045607590105120135150165180195210225240255Tooltip
Power Consumption - The Witcher 3 Power Consumption - external Monitor *
min: 196.8     avg: 207.9     median: 207.9 (29%)     max: 219 Watt
0153045607590105120135150165180195210225Tooltip
Power Consumption - Power Efficiency - Witcher 3 ultra external Monitor
0.3 fps per Watt (21%)
Power Consumption - Cyberpunk 2077 Power Consumption - external Monitor *
251 Watt (32%)
0153045607590105120135150165180195210225240255Tooltip
- Range of benchmark values
red legend - Average benchmark values
* Smaller numbers mean a higher performance

Game Benchmarks

The following benchmarks stem from our benchmarks of review laptops. The performance depends on the used graphics memory, clock rate, processor, system settings, drivers, and operating systems. So the results don't have to be representative for all laptops with this GPU. For detailed information on the benchmark results, click on the fps number.

F1 24

F1 24

2024
low 1920x1080
85.8  fps    + Compare
med. 1920x1080
56.6  fps    + Compare
high 1920x1080
36.9  fps    + Compare
ultra 1920x1080
10.4  fps    + Compare
QHD 2560x1440
6.8  fps    + Compare
» With all tested laptops playable in detail settings high.
low 1920x1080
8  fps    + Compare + 📈 Graph
med. 1920x1080
5.8  fps    + Compare + 📈 Graph
high 1920x1080
2.3  fps    + Compare + 📈 Graph
» The benchmarks indicate that the game is not playable in the tested settings.
low 1920x1080
59.7  fps    + Compare + 📈 Graph
med. 1920x1080
46.9  fps    + Compare + 📈 Graph
high 1920x1080
31.7  fps    + Compare + 📈 Graph
ultra 1920x1080
15.3  fps    + Compare + 📈 Graph
QHD 2560x1440
11.6  fps    + Compare + 📈 Graph
» With all tested laptops playable in detail settings med..
low 1920x1080
37.8  fps    + Compare + 📈 Graph
med. 1920x1080
30.2  fps    + Compare + 📈 Graph
high 1920x1080
12  fps    + Compare + 📈 Graph
ultra 1920x1080
11.4  fps    + Compare + 📈 Graph
» With all tested laptops playable in detail settings low.
Additional Benchmarks
Very Low Preset 1280x720
50.4
low 1920x1080
143.6  fps    + Compare + 📈 Graph
med. 1920x1080
112.9  fps    + Compare + 📈 Graph
high 1920x1080
93.5  fps    + Compare + 📈 Graph
ultra 1920x1080
18.7  fps    + Compare + 📈 Graph
» With all tested laptops playable in detail settings high.
Additional Benchmarks
Low Preset 1280x720
265
low 1920x1080
19.8  fps    + Compare + 📈 Graph
high 1920x1080
19.3  fps    + Compare + 📈 Graph
QHD 2560x1440
11.8  fps    + Compare + 📈 Graph
» The benchmarks indicate that the game is not playable in the tested settings.
Additional Benchmarks
Low Preset 1280x720
27.3
low 1920x1080
111  fps    + Compare + 📈 Graph
med. 1920x1080
89.2  fps    + Compare + 📈 Graph
high 1920x1080
74  fps    + Compare + 📈 Graph
ultra 1920x1080
54.5  fps    + Compare + 📈 Graph
QHD 2560x1440
30.6  fps    + Compare + 📈 Graph
4K 3840x2160
8.4  fps    + Compare + 📈 Graph
» With all tested laptops playable in detail settings ultra.
Additional Benchmarks
Very Low Preset 1280x720
295
low 1920x1080
63  fps    + Compare
med. 1920x1080
54  fps    + Compare
high 1920x1080
42  fps    + Compare
ultra 1920x1080
30  fps    + Compare
QHD 2560x1440
18  fps    + Compare
» With all tested laptops playable in detail settings high.
Additional Benchmarks
Low Preset TAA 1280x720
93
low 1920x1080
23.8  fps    + Compare + 📈 Graph
med. 1920x1080
12.8  fps    + Compare + 📈 Graph
high 1920x1080
12.9  fps    + Compare + 📈 Graph
ultra 1920x1080
12.3  fps    + Compare + 📈 Graph
» The benchmarks indicate that the game is not playable in the tested settings.
Additional Benchmarks
Low Preset 1280x720
29.3
low 1920x1080
37.7  fps    + Compare + 📈 Graph
med. 1920x1080
35.9  fps    + Compare + 📈 Graph
high 1920x1080
22.8  fps    + Compare + 📈 Graph
ultra 1920x1080
12.4  fps    + Compare + 📈 Graph
» With all tested laptops playable in detail settings med..
Additional Benchmarks
Max. Performance 1280x720
75.3
Palworld

Palworld

2024
low 1920x1080
68.7  fps    + Compare + 📈 Graph
med. 1920x1080
43.7  fps    + Compare + 📈 Graph
high 1920x1080
30.1  fps    + Compare + 📈 Graph
ultra 1920x1080
21.7  fps    + Compare + 📈 Graph
» With all tested laptops playable in detail settings med..
Additional Benchmarks
Very Low Preset 1280x720
145.1
med. 1920x1080
357  fps    + Compare + 📈 Graph
high 1920x1080
329  fps    + Compare + 📈 Graph
ultra 1920x1080
311  fps    + Compare + 📈 Graph
QHD 2560x1440
173.1  fps    + Compare + 📈 Graph
4K 3840x2160
82.6  fps    + Compare + 📈 Graph
» With all tested laptops playable in detail settings ultra.
low 1920x1080
81.1  fps    + Compare + 📈 Graph
med. 1920x1080
68.7  fps    + Compare + 📈 Graph
high 1920x1080
50.4  fps    + Compare + 📈 Graph
ultra 1920x1080
36.1  fps    + Compare + 📈 Graph
QHD 2560x1440
23.1  fps    + Compare + 📈 Graph
4K 3840x2160
6.2  fps    + Compare + 📈 Graph
» With all tested laptops playable in detail settings ultra.
low 1920x1080
107.8  fps    + Compare + 📈 Graph
med. 1920x1080
75.2  fps    + Compare + 📈 Graph
high 1920x1080
65.8  fps    + Compare + 📈 Graph
ultra 1920x1080
48.6  fps    + Compare + 📈 Graph
QHD 2560x1440
28.2  fps    + Compare + 📈 Graph
4K 3840x2160
6  fps    + Compare + 📈 Graph
» With all tested laptops playable in detail settings ultra.
Additional Benchmarks
Low Preset 1280x720
180.6
low 1920x1080
34  fps    + Compare
med. 1920x1080
30  fps    + Compare
high 1920x1080
22  fps    + Compare
ultra 1920x1080
17  fps    + Compare
QHD 2560x1440
12  fps    + Compare
4K 3840x2160
9.6  fps    + Compare
» The benchmarks indicate that the game is not playable in the tested settings.
Additional Benchmarks
Low Preset TAA 1280x720
47
low 1920x1080
84  fps    + Compare
med. 1920x1080
58  fps    + Compare
high 1920x1080
40  fps    + Compare
ultra 1920x1080
32  fps    + Compare
QHD 2560x1440
14  fps    + Compare
» With all tested laptops playable in detail settings high.
Additional Benchmarks
Minimum Preset 1280x720
163
low 1920x1080
80.3  fps    + Compare + 📈 Graph
med. 1920x1080
58.3  fps    + Compare + 📈 Graph
high 1920x1080
17.8  fps    + Compare + 📈 Graph
ultra 1920x1080
15.6  fps    + Compare + 📈 Graph
QHD 2560x1440
8.9  fps    + Compare + 📈 Graph
» With all tested laptops playable in detail settings med..
Additional Benchmarks
Ultra Low Preset LowAA 1280x720
172.3
low 1920x1080
34  fps    + Compare + 📈 Graph
med. 1920x1080
25.7  fps    + Compare + 📈 Graph
high 1920x1080
24  fps    + Compare + 📈 Graph
QHD 2560x1440
13.1  fps    + Compare + 📈 Graph
» The benchmarks indicate that the game is not playable in the tested settings.
Additional Benchmarks
Low Preset 1280x720
58.3
low 1920x1080
29  fps    + Compare + 📈 Graph
med. 1920x1080
21.1  fps    + Compare + 📈 Graph
high 1920x1080
14.4  fps    + Compare + 📈 Graph
ultra 1920x1080
9.8  fps    + Compare + 📈 Graph
» The benchmarks indicate that the game is not playable in the tested settings.
Additional Benchmarks
Low Preset 1280x720
42.4
low 1920x1080
188.9  fps    + Compare
med. 1920x1080
143.1  fps    + Compare
high 1920x1080
81.5  fps    + Compare
ultra 1920x1080
66  fps    + Compare
QHD 2560x1440
40.7  fps    + Compare
4K 3840x2160
16.9  fps    + Compare
» With all tested laptops playable in detail settings ultra.
Additional Benchmarks
Low Preset 1280x720
372.3
low 1920x1080
78  fps    + Compare
med. 1920x1080
63  fps    + Compare
high 1920x1080
39  fps    + Compare
ultra 1920x1080
27  fps    + Compare
QHD 2560x1440
21  fps    + Compare
4K 3840x2160
8  fps    + Compare
» With all tested laptops playable in detail settings high.
Additional Benchmarks
Low Preset (Adaptive Quality Off) 1280x720
130
low 1920x1080
161.4  fps    + Compare + 📈 Graph
med. 1920x1080
145.7  fps    + Compare + 📈 Graph
high 1920x1080
101.3  fps    + Compare + 📈 Graph
ultra 1920x1080
55.7  fps    + Compare + 📈 Graph
QHD 2560x1440
44.2  fps    + Compare + 📈 Graph
4K 3840x2160
28.8  fps    + Compare + 📈 Graph
» With all tested laptops playable in detail settings ultra.
Additional Benchmarks
Low Preset 1280x720
254
low 1920x1080
281  fps    + Compare + 📈 Graph
med. 1920x1080
194  fps    + Compare + 📈 Graph
high 1920x1080
94.5  fps    + Compare + 📈 Graph
ultra 1920x1080
69.2  fps    + Compare + 📈 Graph
QHD 2560x1440
35  fps    + Compare + 📈 Graph
4K 3840x2160
13.9  fps    + Compare + 📈 Graph
» With all tested laptops playable in detail settings ultra.
Additional Benchmarks
Low Preset 1280x720
358
low 1920x1080
64  fps    + Compare
med. 1920x1080
39.8  fps    + Compare
high 1920x1080
28.4  fps    + Compare
ultra 1920x1080
23.5  fps    + Compare
» With all tested laptops playable in detail settings med..
Additional Benchmarks
Low Preset (FSR off) 1280x720
99.4
Steam Deck 1280x800
73.7
30min Start Ultra Preset (FSR off) 1920x1080
24.6
low 1920x1080
68.2  fps    + Compare + 📈 Graph
med. 1920x1080
55.7  fps    + Compare + 📈 Graph
high 1920x1080
45.1  fps    + Compare + 📈 Graph
ultra 1920x1080
44.2  fps    + Compare + 📈 Graph
» With all tested laptops playable in detail settings ultra.
Additional Benchmarks
Low Preset SMAA 1280x720
95.7
Lies of P

Lies of P

2023
low 1920x1080
88.4  fps    + Compare + 📈 Graph
med. 1920x1080
67  fps    + Compare + 📈 Graph
high 1920x1080
48.3  fps    + Compare + 📈 Graph
ultra 1920x1080
32.8  fps    + Compare + 📈 Graph
QHD 2560x1440
17.5  fps    + Compare + 📈 Graph
4K 3840x2160
7.6  fps    + Compare + 📈 Graph
» With all tested laptops playable in detail settings high.
Additional Benchmarks
Low Preset 1280x720
155.1
Starfield

Starfield

2023
low 1920x1080
42.3  fps    + Compare + 📈 Graph
med. 1920x1080
13.9  fps    + Compare + 📈 Graph
high 1920x1080
10.6  fps    + Compare + 📈 Graph
ultra 1920x1080
9.7  fps    + Compare + 📈 Graph
» With all tested laptops playable in detail settings low.
Additional Benchmarks
Low Preset 1280x720
58.3
low 1920x1080
89.6  fps    + Compare + 📈 Graph
med. 1920x1080
69.3  fps    + Compare + 📈 Graph
high 1920x1080
58.7  fps    + Compare + 📈 Graph
ultra 1920x1080
35.3  fps    + Compare + 📈 Graph
QHD 2560x1440
20  fps    + Compare + 📈 Graph
4K 3840x2160
10.7  fps    + Compare + 📈 Graph
» With all tested laptops playable in detail settings ultra.
Additional Benchmarks
Low Preset 1280x720
116.2
low 1920x1080
27.3  fps    + Compare + 📈 Graph
high 1920x1080
23.7  fps    + Compare + 📈 Graph
ultra 1920x1080
15.2  fps    + Compare + 📈 Graph
» The benchmarks indicate that the game is not playable in the tested settings.
Additional Benchmarks
Low 1280x720
49.8
low 1920x1080
51.3  fps    + Compare + 📈 Graph
med. 1920x1080
35.5  fps    + Compare + 📈 Graph
high 1920x1080
28.6  fps    + Compare + 📈 Graph
ultra 1920x1080
6.2  fps    + Compare + 📈 Graph
» With all tested laptops playable in detail settings med..
Additional Benchmarks
Low Preset 1280x720
66.1
low 1920x1080
23.7  fps    + Compare + 📈 Graph
med. 1920x1080
20.5  fps    + Compare + 📈 Graph
high 1920x1080
15.3  fps    + Compare + 📈 Graph
ultra 1920x1080
10.6  fps    + Compare + 📈 Graph
» The benchmarks indicate that the game is not playable in the tested settings.
Additional Benchmarks
Very Low Preset 1280x720
39.2
F1 23

F1 23

2023
low 1920x1080
85.3  fps    + Compare
med. 1920x1080
77.3  fps    + Compare
high 1920x1080
52  fps    + Compare
ultra 1920x1080
11.5  fps    + Compare
QHD 2560x1440
7.4  fps    + Compare
4K 3840x2160
2.2  fps    + Compare
» With all tested laptops playable in detail settings high.
Additional Benchmarks
Ultra Low Preset TAA 1280x720
238
Diablo 4

Diablo 4

2023
low 1920x1080
116.9  fps    + Compare + 📈 Graph
med. 1920x1080
93.7  fps    + Compare + 📈 Graph
high 1920x1080
80.8  fps    + Compare + 📈 Graph
ultra 1920x1080
75.8  fps    + Compare + 📈 Graph
» With all tested laptops playable in detail settings ultra.
Additional Benchmarks
Low Preset 1280x720
244
low 1920x1080
39.1  fps    + Compare + 📈 Graph
med. 1920x1080
30.4  fps    + Compare + 📈 Graph
high 1920x1080
28.9  fps    + Compare + 📈 Graph
ultra 1920x1080
23.7  fps    + Compare + 📈 Graph
» With all tested laptops playable in detail settings low.
Additional Benchmarks
Low Preset 1280x720
74.8
low 1920x1080
159.1  fps    + Compare + 📈 Graph
med. 1920x1080
117.4  fps    + Compare + 📈 Graph
high 1920x1080
87.6  fps    + Compare + 📈 Graph
ultra 1920x1080
62.3  fps    + Compare + 📈 Graph
QHD 2560x1440
45.3  fps    + Compare + 📈 Graph
4K 3840x2160
20.4  fps    + Compare + 📈 Graph
» With all tested laptops playable in detail settings ultra.
Additional Benchmarks
Low Preset Low TAA 1280x720
289
low 1920x1080
54.1  fps    + Compare + 📈 Graph
med. 1920x1080
37.1  fps    + Compare + 📈 Graph
high 1920x1080
28.7  fps    + Compare + 📈 Graph
ultra 1920x1080
24.4  fps    + Compare + 📈 Graph
» With all tested laptops playable in detail settings med..
Additional Benchmarks
Low Preset 1280x720
87.8
low 1920x1080
77.3  fps    + Compare + 📈 Graph
med. 1920x1080
57.2  fps    + Compare + 📈 Graph
high 1920x1080
11.7  fps    + Compare + 📈 Graph
» With all tested laptops playable in detail settings med..
Additional Benchmarks
Prioritize Performance Preset 1280x720
118.4
low 1920x1080
87.8  fps    + Compare
med. 1920x1080
71.8  fps    + Compare
high 1920x1080
57.5  fps    + Compare
ultra 1920x1080
56.1  fps    + Compare
QHD 2560x1440
31.9  fps    + Compare
4K 3840x2160
13.7  fps    + Compare
» With all tested laptops playable in detail settings ultra.
Additional Benchmarks
Minimum Settings 1280x720
159.8
low 1920x1080
40.4  fps    + Compare + 📈 Graph
med. 1920x1080
29.4  fps    + Compare + 📈 Graph
high 1920x1080
26.7  fps    + Compare + 📈 Graph
ultra 1920x1080
24.5  fps    + Compare + 📈 Graph
QHD 2560x1440
18.1  fps    + Compare + 📈 Graph
4K 3840x2160
10.5  fps    + Compare + 📈 Graph
» With all tested laptops playable in detail settings low.
Additional Benchmarks
Ultra Low Preset 1280x720
73.1
low 1920x1080
110.9  fps    + Compare + 📈 Graph
med. 1920x1080
84.2  fps    + Compare + 📈 Graph
high 1920x1080
47.9  fps    + Compare + 📈 Graph
ultra 1920x1080
37.4  fps    + Compare + 📈 Graph
QHD 2560x1440
27.2  fps    + Compare + 📈 Graph
4K 3840x2160
13.8  fps    + Compare + 📈 Graph
» With all tested laptops playable in detail settings ultra.
Additional Benchmarks
Low Preset 1280x720
181.7
Returnal

Returnal

2023
low 1920x1080
54  fps    + Compare
med. 1920x1080
51  fps    + Compare
high 1920x1080
45  fps    + Compare
ultra 1920x1080
24  fps    + Compare
QHD 2560x1440
15  fps    + Compare
4K 3840x2160
12  fps    + Compare
» With all tested laptops playable in detail settings high.
Additional Benchmarks
Low Preset 1280x720
74
low 1920x1080
79.5  fps    + Compare + 📈 Graph
med. 1920x1080
59.5  fps    + Compare + 📈 Graph
high 1920x1080
47.9  fps    + Compare + 📈 Graph
ultra 1920x1080
33.3  fps    + Compare + 📈 Graph
QHD 2560x1440
23.3  fps    + Compare + 📈 Graph
4K 3840x2160
9.4  fps    + Compare + 📈 Graph
» With all tested laptops playable in detail settings high.
Additional Benchmarks
Low Preset Low TAA 1280x720
130.5
low 1920x1080
33.9  fps    + Compare + 📈 Graph
med. 1920x1080
27.7  fps    + Compare + 📈 Graph
high 1920x1080
21.9  fps    + Compare + 📈 Graph
ultra 1920x1080
17.5  fps    + Compare + 📈 Graph
QHD 2560x1440
8.9  fps    + Compare + 📈 Graph
4K 3840x2160
2.1  fps    + Compare + 📈 Graph
» The benchmarks indicate that the game is not playable in the tested settings.
Additional Benchmarks
Low Preset TAA 1280x720
72.8
low 1920x1080
99.9  fps    + Compare + 📈 Graph
med. 1920x1080
75.1  fps    + Compare + 📈 Graph
high 1920x1080
65.7  fps    + Compare + 📈 Graph
ultra 1920x1080
54.1  fps    + Compare + 📈 Graph
QHD 2560x1440
30.4  fps    + Compare + 📈 Graph
4K 3840x2160
9.9  fps    + Compare + 📈 Graph
» With all tested laptops playable in detail settings ultra.
Additional Benchmarks
Low Preset / Off 1280x720
184.6
low 1920x1080
150.6  fps    + Compare + 📈 Graph
med. 1920x1080
81.2  fps    + Compare + 📈 Graph
high 1920x1080
56.2  fps    + Compare + 📈 Graph
ultra 1920x1080
54.4  fps    + Compare + 📈 Graph
QHD 2560x1440
32.1  fps    + Compare + 📈 Graph
4K 3840x2160
11.8  fps    + Compare + 📈 Graph
» With all tested laptops playable in detail settings ultra.
Additional Benchmarks
Low Preset 1280x720
236
low 1920x1080
90.6  fps    + Compare
med. 1920x1080
59.1  fps    + Compare
high 1920x1080
29.3  fps    + Compare
ultra 1920x1080
28.2  fps    + Compare
QHD 2560x1440
18.5  fps    + Compare
4K 3840x2160
7.3  fps    + Compare
» With all tested laptops playable in detail settings med..
Additional Benchmarks
Low Preset (without FSR Upscaling) 1280x720
158.3
low 1920x1080
55.8  fps    + Compare + 📈 Graph
med. 1920x1080
33.6  fps    + Compare + 📈 Graph
high 1920x1080
30.7  fps    + Compare + 📈 Graph
ultra 1920x1080
23.5  fps    + Compare + 📈 Graph
QHD 2560x1440
17.2  fps    + Compare + 📈 Graph
» With all tested laptops playable in detail settings low.
Additional Benchmarks
Low Preset 1280x720
63.8
low 1920x1080
52.5  fps    + Compare + 📈 Graph
med. 1920x1080
48  fps    + Compare + 📈 Graph
high 1920x1080
36.6  fps    + Compare + 📈 Graph
ultra 1920x1080
30.2  fps    + Compare + 📈 Graph
QHD 2560x1440
19.7  fps    + Compare + 📈 Graph
4K 3840x2160
10.6  fps    + Compare + 📈 Graph
» With all tested laptops playable in detail settings high.
Additional Benchmarks
Very Low Preset 1280x720
99.1
low 1920x1080
87  fps    + Compare
med. 1920x1080
69  fps    + Compare
high 1920x1080
53  fps    + Compare
ultra 1920x1080
42  fps    + Compare
QHD 2560x1440
28  fps    + Compare
4K 3840x2160
11  fps    + Compare
» With all tested laptops playable in detail settings ultra.
Additional Benchmarks
Basic Quality Preset T2X SMAA 1280x720
131
low 1920x1080
51.8  fps    + Compare + 📈 Graph
med. 1920x1080
42.1  fps    + Compare + 📈 Graph
high 1920x1080
16.7  fps    + Compare + 📈 Graph
ultra 1920x1080
15.1  fps    + Compare + 📈 Graph
QHD 2560x1440
9.2  fps    + Compare + 📈 Graph
» With all tested laptops playable in detail settings med..
Additional Benchmarks
Low Preset 1280x720
82
low 1920x1080
66.6  fps    + Compare + 📈 Graph
med. 1920x1080
49.9  fps    + Compare + 📈 Graph
high 1920x1080
35.3  fps    + Compare + 📈 Graph
ultra 1920x1080
22.7  fps    + Compare + 📈 Graph
QHD 2560x1440
13.1  fps    + Compare + 📈 Graph
4K 3840x2160
4.6  fps    + Compare + 📈 Graph
» With all tested laptops playable in detail settings high.
Additional Benchmarks
Low Preset 1280x720
91.6
FIFA 23

FIFA 23

2022
low 1920x1080
170.8  fps    + Compare + 📈 Graph
med. 1920x1080
150.4  fps    + Compare + 📈 Graph
high 1920x1080
79.6  fps    + Compare + 📈 Graph
ultra 1920x1080
66  fps    + Compare + 📈 Graph
QHD 2560x1440
56.9  fps    + Compare + 📈 Graph
4K 3840x2160
29.5  fps    + Compare + 📈 Graph
» With all tested laptops playable in detail settings ultra.
Additional Benchmarks
Low Rendering Quality 1280x720
273
low 1920x1080
78.6 79.3 ~ 79 fps    + Compare + 📈 Graph
med. 1920x1080
57.2 58 ~ 58 fps    + Compare + 📈 Graph
high 1920x1080
44.1 46.6 ~ 45 fps    + Compare + 📈 Graph
ultra 1920x1080
23.3 28.1 ~ 26 fps    + Compare + 📈 Graph
QHD 2560x1440
8 9.5 ~ 9 fps    + Compare + 📈 Graph
4K 3840x2160
4.2  fps    + Compare + 📈 Graph
» With all tested laptops playable in detail settings high.
Additional Benchmarks
Low Preset 1280x720
112.5
F1 22

F1 22

2022
low 1920x1080
126.4 137.8 ~ 132 fps    + Compare
med. 1920x1080
101.1 120.5 ~ 111 fps    + Compare
high 1920x1080
68.4 75.3 ~ 72 fps    + Compare
ultra 1920x1080
14.9 16.1 ~ 16 fps    + Compare
QHD 2560x1440
9.8 10.3 ~ 10 fps    + Compare
4K 3840x2160
2.6 2.8 ~ 3 fps    + Compare
» With all tested laptops playable in detail settings high.
Additional Benchmarks
Ultra Low Preset 16xAF TAA 1280x720
259
284
low 1920x1080
222  fps    + Compare + 📈 Graph
med. 1920x1080
116.3  fps    + Compare + 📈 Graph
high 1920x1080
111.9  fps    + Compare + 📈 Graph
ultra 1920x1080
110.9  fps    + Compare + 📈 Graph
QHD 2560x1440
62.7  fps    + Compare + 📈 Graph
4K 3840x2160
23.1  fps    + Compare + 📈 Graph
» With all tested laptops playable in detail settings ultra.
Additional Benchmarks
Low Preset 1280x720
377
low 1920x1080
93.2 94.8 ~ 94 fps    + Compare + 📈 Graph
med. 1920x1080
88.3 89.4 ~ 89 fps    + Compare + 📈 Graph
high 1920x1080
84.6 89.3 ~ 87 fps    + Compare + 📈 Graph
ultra 1920x1080
87.7 87.8 ~ 88 fps    + Compare + 📈 Graph
QHD 2560x1440
47.9 49.4 ~ 49 fps    + Compare + 📈 Graph
4K 3840x2160
19.2 20.6 ~ 20 fps    + Compare + 📈 Graph
» With all tested laptops playable in detail settings ultra.
Additional Benchmarks
Lowest Settings 1280x720
168
197.7
Highest Settings + Maximum Ray Tracing 1920x1080
18.9
low 1920x1080
99.5 119.1 134.1 ~ 118 fps    + Compare
med. 1920x1080
64.4 86.7 93.4 ~ 82 fps    + Compare
high 1920x1080
44.9 52.9 55.5 ~ 51 fps    + Compare
ultra 1920x1080
25.1 30.3 37.4 ~ 31 fps    + Compare
QHD 2560x1440
16.2 17.3 19.3 ~ 18 fps    + Compare
4K 3840x2160
7.2 9.1 ~ 8 fps    + Compare
» With all tested laptops playable in detail settings high.
Additional Benchmarks
Lowest Preset (DX12) 1280x720
246
189
169.8
low 1920x1080
68.6 74.7 ~ 72 fps    + Compare
med. 1920x1080
50.5 57.8 ~ 54 fps    + Compare
high 1920x1080
32.6 35.6 ~ 34 fps    + Compare
ultra 1920x1080
28.7 31.4 ~ 30 fps    + Compare
QHD 2560x1440
16.5 17.7 ~ 17 fps    + Compare
4K 3840x2160
3 4.4 ~ 4 fps    + Compare
» With all tested laptops playable in detail settings med..
Additional Benchmarks
Low Preset 1280x720
85.1
111.8
Elex 2

Elex 2

2022
low 1920x1080
64.8  fps    + Compare + 📈 Graph
med. 1920x1080
59.7  fps    + Compare + 📈 Graph
high 1920x1080
40.5  fps    + Compare + 📈 Graph
ultra 1920x1080
33.8  fps    + Compare + 📈 Graph
QHD 2560x1440
21.7  fps    + Compare + 📈 Graph
4K 3840x2160
5.9  fps    + Compare + 📈 Graph
» With all tested laptops playable in detail settings high.
Additional Benchmarks
Low / Off 1280x720
71.2
low 1920x1080
202  fps    + Compare
med. 1920x1080
149.6  fps    + Compare
high 1920x1080
85.2  fps    + Compare
ultra 1920x1080
59.4  fps    + Compare
QHD 2560x1440
52.5  fps    + Compare
4K 3840x2160
26.5  fps    + Compare
» With all tested laptops playable in detail settings ultra.
Additional Benchmarks
Low Preset 1280x720
283
low 1920x1080
59.4  fps    + Compare + 📈 Graph
med. 1920x1080
59.5  fps    + Compare + 📈 Graph
high 1920x1080
59.4  fps    + Compare + 📈 Graph
ultra 1920x1080
58  fps    + Compare + 📈 Graph
QHD 2560x1440
44  fps    + Compare + 📈 Graph
4K 3840x2160
20.6  fps    + Compare + 📈 Graph
» With all tested laptops playable in detail settings ultra.
Additional Benchmarks
Low Preset 1280x720
59.2
low 1920x1080
58.3  fps    + Compare + 📈 Graph
med. 1920x1080
44.1  fps    + Compare + 📈 Graph
high 1920x1080
35.5  fps    + Compare + 📈 Graph
QHD 2560x1440
24.4  fps    + Compare + 📈 Graph
4K 3840x2160
11.2  fps    + Compare + 📈 Graph
» With all tested laptops playable in detail settings high.
Additional Benchmarks
Low Quality 1280x720
95.4
low 1920x1080
101  fps    + Compare
med. 1920x1080
91  fps    + Compare
high 1920x1080
66  fps    + Compare
ultra 1920x1080
33  fps    + Compare
QHD 2560x1440
19  fps    + Compare
4K 3840x2160
6  fps    + Compare
» With all tested laptops playable in detail settings high.
Additional Benchmarks
Ultra Low Preset (with Fixed Resolution Quality) 1280x720
108
low 1920x1080
74.7 79.2 79.3 ~ 78 fps    + Compare + 📈 Graph
med. 1920x1080
60 62.5 62.7 ~ 62 fps    + Compare + 📈 Graph
high 1920x1080
20.4 30.3 38.3 ~ 30 fps    + Compare + 📈 Graph
ultra 1920x1080
8.2 9.2 11.1 ~ 9 fps    + Compare + 📈 Graph
QHD 2560x1440
7.1 9.1 ~ 8 fps    + Compare + 📈 Graph
4K 3840x2160
6.7  fps    + Compare + 📈 Graph
» With all tested laptops playable in detail settings med..
Additional Benchmarks
Low Preset 1280x720
118
127.4
131.4
med. 1920x1080
74.8  fps    + Compare + 📈 Graph
high 1920x1080
73  fps    + Compare + 📈 Graph
ultra 1920x1080
64.5  fps    + Compare + 📈 Graph
QHD 2560x1440
56  fps    + Compare + 📈 Graph
4K 3840x2160
11.1  fps    + Compare + 📈 Graph
» With all tested laptops playable in detail settings ultra.
Additional Benchmarks
Low Preset 1920x1080
84.9
low 1280x720
291  fps    + Compare + 📈 Graph
med. 1920x1080
162  fps    + Compare + 📈 Graph
high 1920x1080
112  fps    + Compare + 📈 Graph
ultra 1920x1080
92.3  fps    + Compare + 📈 Graph
QHD 2560x1440
70.5  fps    + Compare + 📈 Graph
4K 3840x2160
37.9  fps    + Compare + 📈 Graph
» With all tested laptops playable in detail settings ultra.
Additional Benchmarks
Low Preset 1920x1080
256
low 1280x720
145  fps    + Compare + 📈 Graph
med. 1920x1080
80.4  fps    + Compare + 📈 Graph
high 1920x1080
39.8  fps    + Compare + 📈 Graph
ultra 1920x1080
25.3  fps    + Compare + 📈 Graph
QHD 2560x1440
18.5  fps    + Compare + 📈 Graph
4K 3840x2160
4  fps    + Compare + 📈 Graph
» With all tested laptops playable in detail settings high.
Additional Benchmarks
Low Preset 1920x1080
103
low 1280x720
180 211 221 ~ 204 fps    + Compare
med. 1920x1080
89 107 111 ~ 102 fps    + Compare
high 1920x1080
76 81 85 ~ 81 fps    + Compare
ultra 1920x1080
26 26 34 ~ 29 fps    + Compare
QHD 2560x1440
11 11 12 ~ 11 fps    + Compare
4K 3840x2160
4 5 6 ~ 5 fps    + Compare
» With all tested laptops playable in detail settings high.
Additional Benchmarks
Low Preset 1920x1080
115
132
low 1280x720
102  fps    + Compare + 📈 Graph
med. 1920x1080
87.1  fps    + Compare + 📈 Graph
high 1920x1080
34.9  fps    + Compare + 📈 Graph
ultra 1920x1080
31.4  fps    + Compare + 📈 Graph
QHD 2560x1440
22.8  fps    + Compare + 📈 Graph
4K 3840x2160
3.2  fps    + Compare + 📈 Graph
» With all tested laptops playable in detail settings med..
Additional Benchmarks
Low Preset 1920x1080
100
low 1280x720
127  fps    + Compare
med. 1920x1080
66  fps    + Compare
high 1920x1080
54  fps    + Compare
ultra 1920x1080
47  fps    + Compare
QHD 2560x1440
27  fps    + Compare
4K 3840x2160
9  fps    + Compare
» With all tested laptops playable in detail settings ultra.
Additional Benchmarks
Low Preset 1920x1080
83
low 1280x720
69 86 ~ 78 fps    + Compare
med. 1920x1080
37 39 ~ 38 fps    + Compare
high 1920x1080
29 36 ~ 33 fps    + Compare
ultra 1920x1080
26 35 ~ 31 fps    + Compare
QHD 2560x1440
20 31 ~ 26 fps    + Compare
4K 3840x2160
4 7 ~ 6 fps    + Compare
» With all tested laptops playable in detail settings med..
Additional Benchmarks
Low Preset 1920x1080
65
42
med. 1920x1080
140  fps    + Compare + 📈 Graph
high 1920x1080
117  fps    + Compare + 📈 Graph
ultra 1920x1080
109  fps    + Compare + 📈 Graph
QHD 2560x1440
68.1  fps    + Compare + 📈 Graph
4K 3840x2160
27.7  fps    + Compare + 📈 Graph
» With all tested laptops playable in detail settings ultra.
Additional Benchmarks
Low Preset (DX12) 1920x1080
198
Far Cry 6

Far Cry 6

2021
low 1280x720
137 162.9 164.8 ~ 155 fps    + Compare + 📈 Graph
med. 1920x1080
15.4 15.6 24.7 ~ 19 fps    + Compare + 📈 Graph
high 1920x1080
18.5 21.2 59.7 ~ 33 fps    + Compare + 📈 Graph
ultra 1920x1080
7.3 7.7 7.9 ~ 8 fps    + Compare + 📈 Graph
QHD 2560x1440
4.9 5.3 ~ 5 fps    + Compare + 📈 Graph
4K 3840x2160
1.9 1.9 ~ 2 fps    + Compare + 📈 Graph
» With all tested laptops playable in detail settings low.
Additional Benchmarks
Low Graphics Quality 1920x1080
86.8
38.1
med. 1920x1080
147  fps    + Compare + 📈 Graph
high 1920x1080
123  fps    + Compare + 📈 Graph
QHD 2560x1440
93.3  fps    + Compare + 📈 Graph
4K 3840x2160
55  fps    + Compare + 📈 Graph
» With all tested laptops playable in detail settings high.
Additional Benchmarks
Low Preset 1920x1080
168
New World

New World

2021
low 1280x720
145  fps    + Compare + 📈 Graph
med. 1920x1080
62.1  fps    + Compare + 📈 Graph
high 1920x1080
55.3  fps    + Compare + 📈 Graph
ultra 1920x1080
43.4  fps    + Compare + 📈 Graph
QHD 2560x1440
29.8  fps    + Compare + 📈 Graph
4K 3840x2160
16.8  fps    + Compare + 📈 Graph
» With all tested laptops playable in detail settings ultra.
Additional Benchmarks
Low Video Quality 1920x1080
80
F1 2021

F1 2021

2021
low 1280x720
370 382 385 ~ 379 fps    + Compare
med. 1920x1080
150.3 156 158 ~ 155 fps    + Compare
high 1920x1080
108.6 109 110 ~ 109 fps    + Compare
ultra 1920x1080
31.6 32.8 40.2 ~ 35 fps    + Compare
QHD 2560x1440
24.2 24.5 29.9 ~ 26 fps    + Compare
4K 3840x2160
10.3 10.4 10.8 ~ 11 fps    + Compare
» With all tested laptops playable in detail settings high.
low 1280x720
110  fps    + Compare + 📈 Graph
ultra 1920x1080
105  fps    + Compare + 📈 Graph
QHD 2560x1440
78.1  fps    + Compare + 📈 Graph
4K 3840x2160
37.5  fps    + Compare + 📈 Graph
» With all tested laptops playable in detail settings ultra.
low 1280x720
128  fps    + Compare
med. 1920x1080
68  fps    + Compare
high 1920x1080
58  fps    + Compare
ultra 1920x1080
46  fps    + Compare
QHD 2560x1440
35  fps    + Compare
4K 3840x2160
10  fps    + Compare
» With all tested laptops playable in detail settings ultra.
low 1280x720
100  fps    + Compare
med. 1920x1080
51  fps    + Compare
high 1920x1080
43  fps    + Compare
ultra 1920x1080
31  fps    + Compare
QHD 2560x1440
23  fps    + Compare
4K 3840x2160
6  fps    + Compare
» With all tested laptops playable in detail settings high.
Dirt 5

Dirt 5

2020
low 1280x720
168.5  fps    + Compare
med. 1920x1080
61.7  fps    + Compare
high 1920x1080
41.9  fps    + Compare
ultra 1920x1080
34.3  fps    + Compare
QHD 2560x1440
24.2  fps    + Compare
4K 3840x2160
14.5  fps    + Compare
» With all tested laptops playable in detail settings high.
low 1280x720
117  fps    + Compare + 📈 Graph
med. 1920x1080
73.7  fps    + Compare + 📈 Graph
high 1920x1080
57.6  fps    + Compare + 📈 Graph
ultra 1920x1080
24.8  fps    + Compare + 📈 Graph
QHD 2560x1440
18.5  fps    + Compare + 📈 Graph
4K 3840x2160
9.7  fps    + Compare + 📈 Graph
» With all tested laptops playable in detail settings high.
low 1280x720
146  fps    + Compare + 📈 Graph
med. 1920x1080
63  fps    + Compare + 📈 Graph
high 1920x1080
57.9  fps    + Compare + 📈 Graph
QHD 2560x1440
36.2  fps    + Compare + 📈 Graph
4K 3840x2160
17.2  fps    + Compare + 📈 Graph
» With all tested laptops playable in detail settings high.
low 1280x720
271  fps    + Compare + 📈 Graph
med. 1920x1080
121  fps    + Compare + 📈 Graph
high 1920x1080
59.9  fps    + Compare + 📈 Graph
ultra 1920x1080
51.3  fps    + Compare + 📈 Graph
QHD 2560x1440
36.9  fps    + Compare + 📈 Graph
4K 3840x2160
18.2  fps    + Compare + 📈 Graph
» With all tested laptops playable in detail settings ultra.
low 1280x720
121  fps    + Compare
med. 1920x1080
76  fps    + Compare
high 1920x1080
63  fps    + Compare
ultra 1920x1080
53  fps    + Compare
QHD 2560x1440
42  fps    + Compare
4K 3840x2160
23  fps    + Compare
» With all tested laptops playable in detail settings ultra.
F1 2020

F1 2020

2020
low 1280x720
355 359 376 ~ 363 fps    + Compare
med. 1920x1080
175.7 176 181.7 ~ 178 fps    + Compare
high 1920x1080
137 137.6 140.2 ~ 138 fps    + Compare
ultra 1920x1080
91.6 92.2 94.4 ~ 93 fps    + Compare
QHD 2560x1440
62.8 66 66.7 ~ 65 fps    + Compare
4K 3840x2160
30.5 31.7 31.9 ~ 31 fps    + Compare