Ready or Not review: Laptop and desktop benchmarks

Test systems
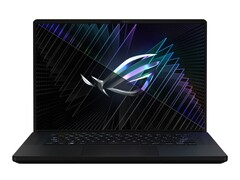

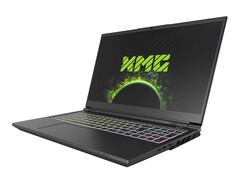
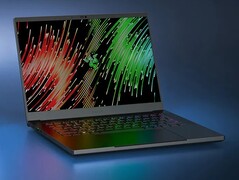
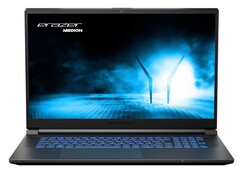
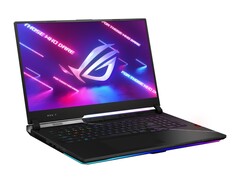
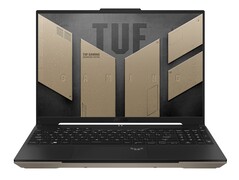
We currently carry out our gaming benchmarks with these devices. Clicking on the individual photos will take you to the respective manufacturer's website. Further details on the devices' specifications are listed at the end of the article.
Tech
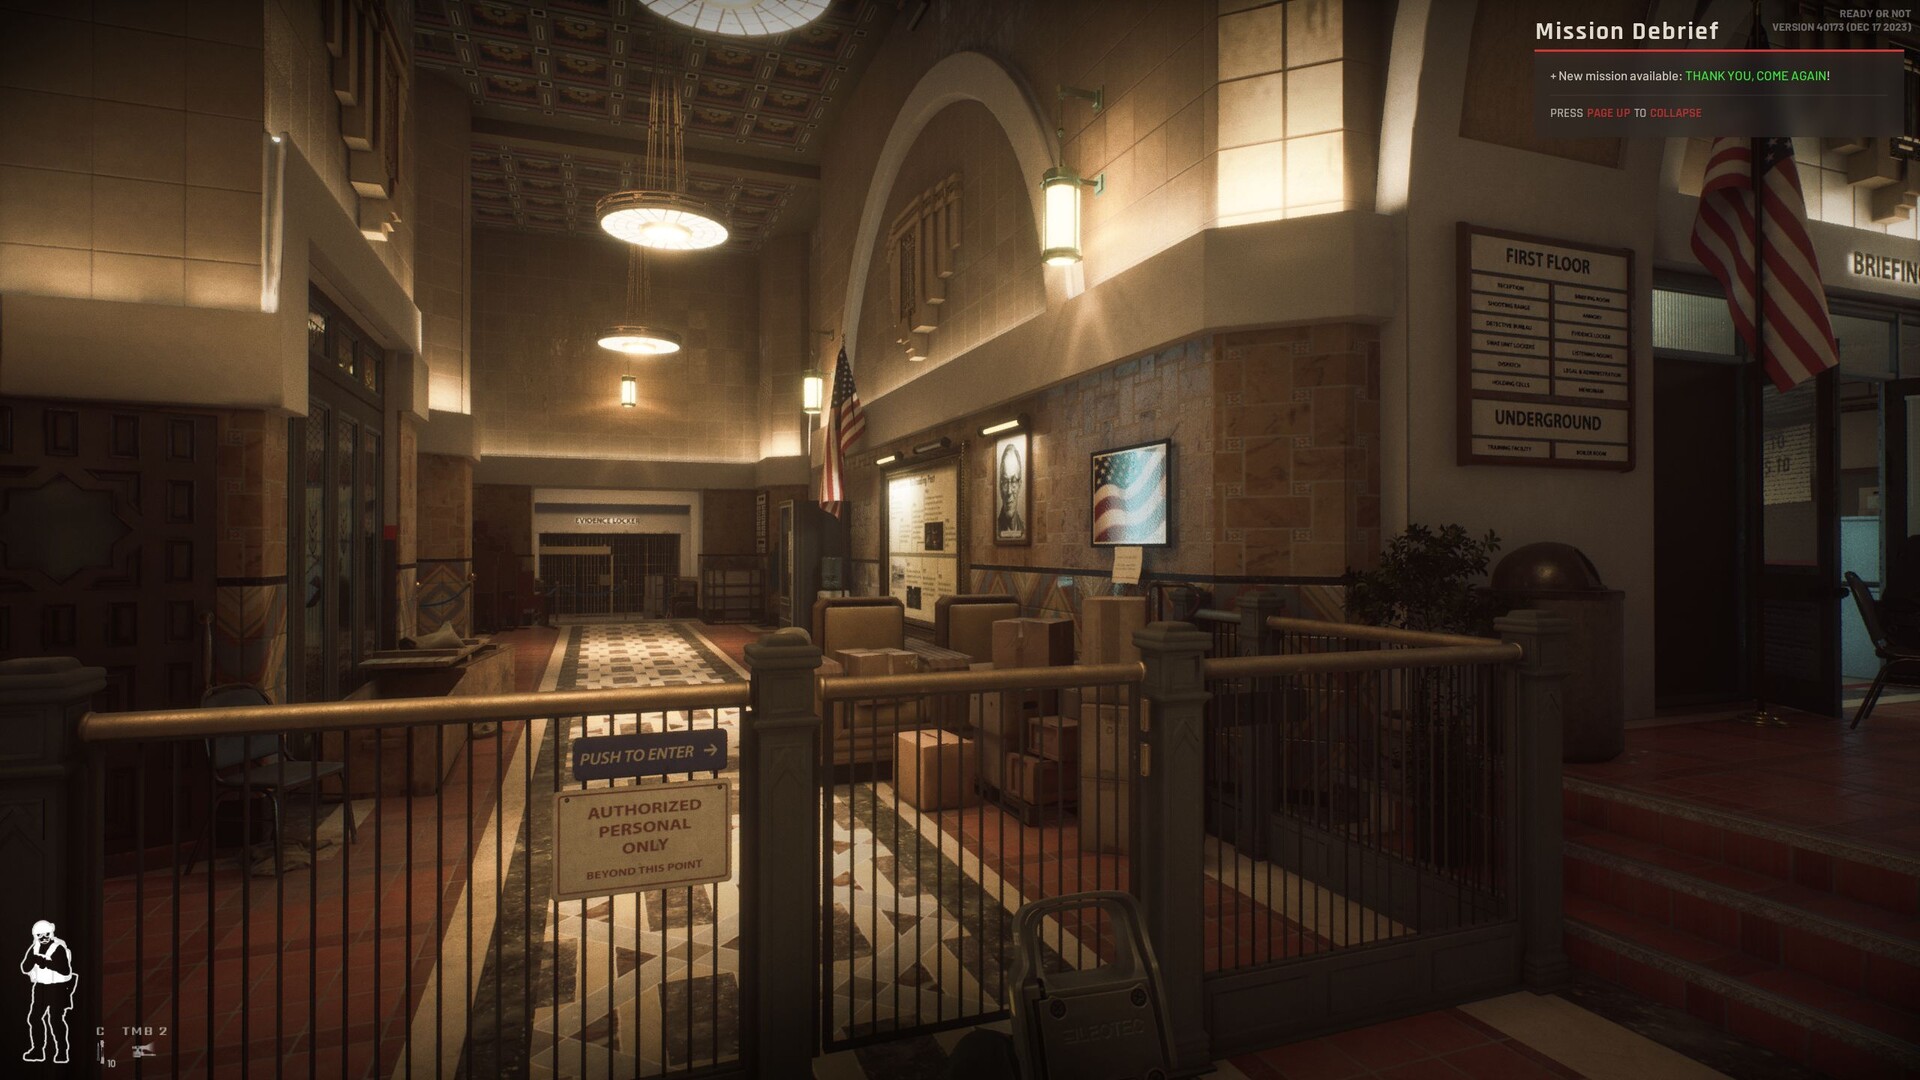
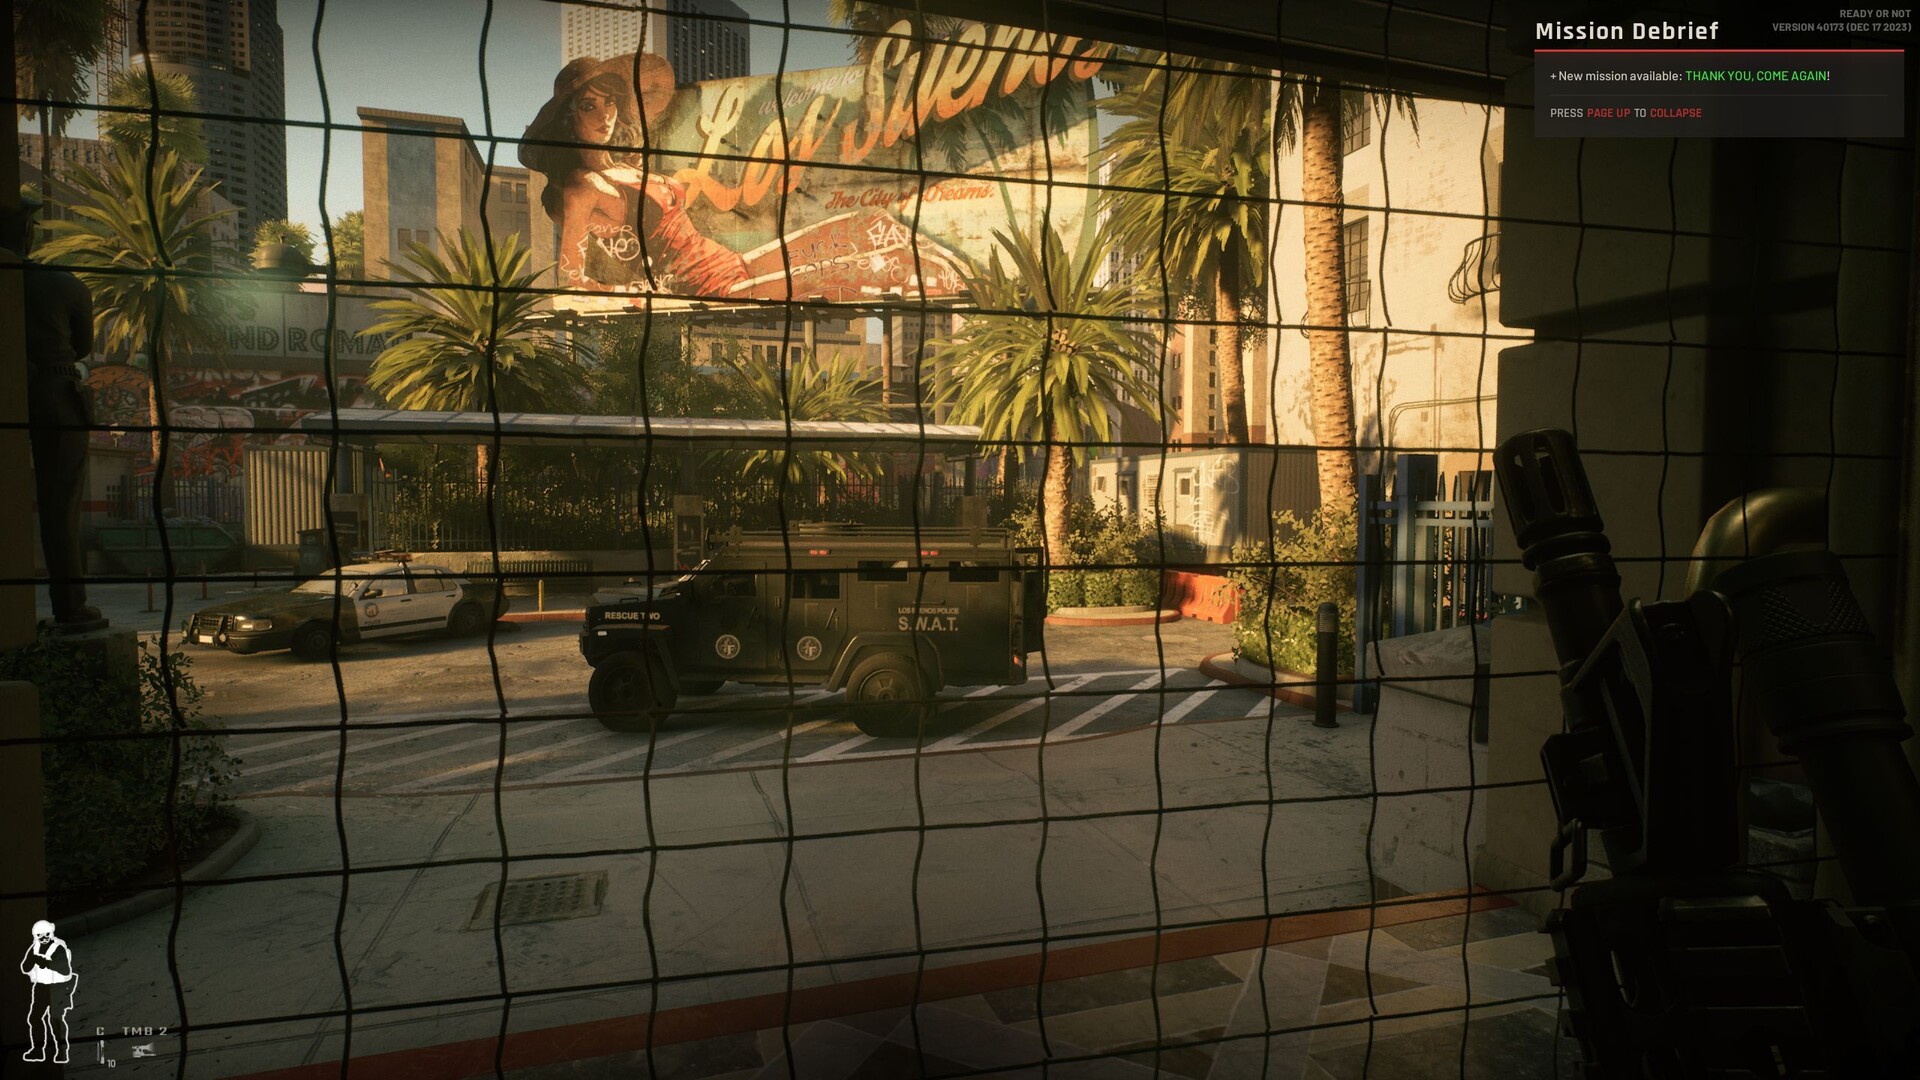
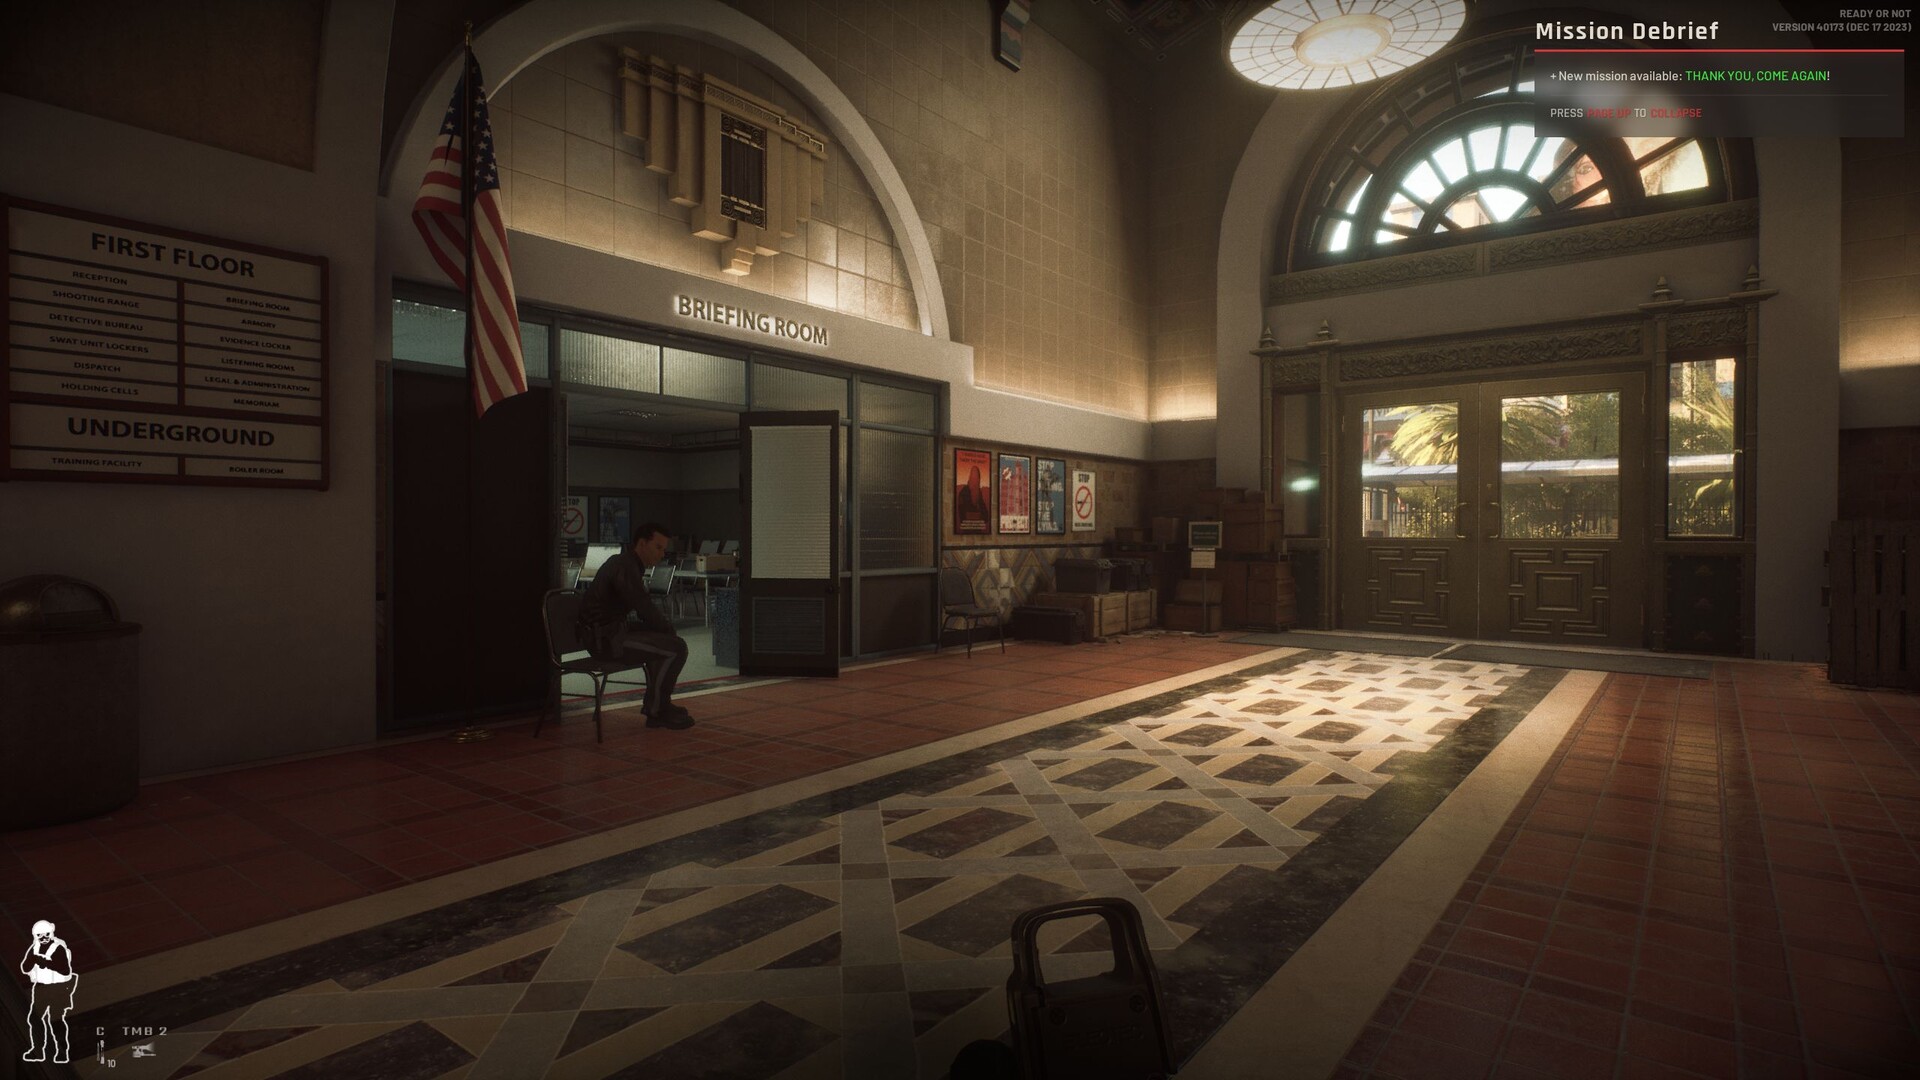
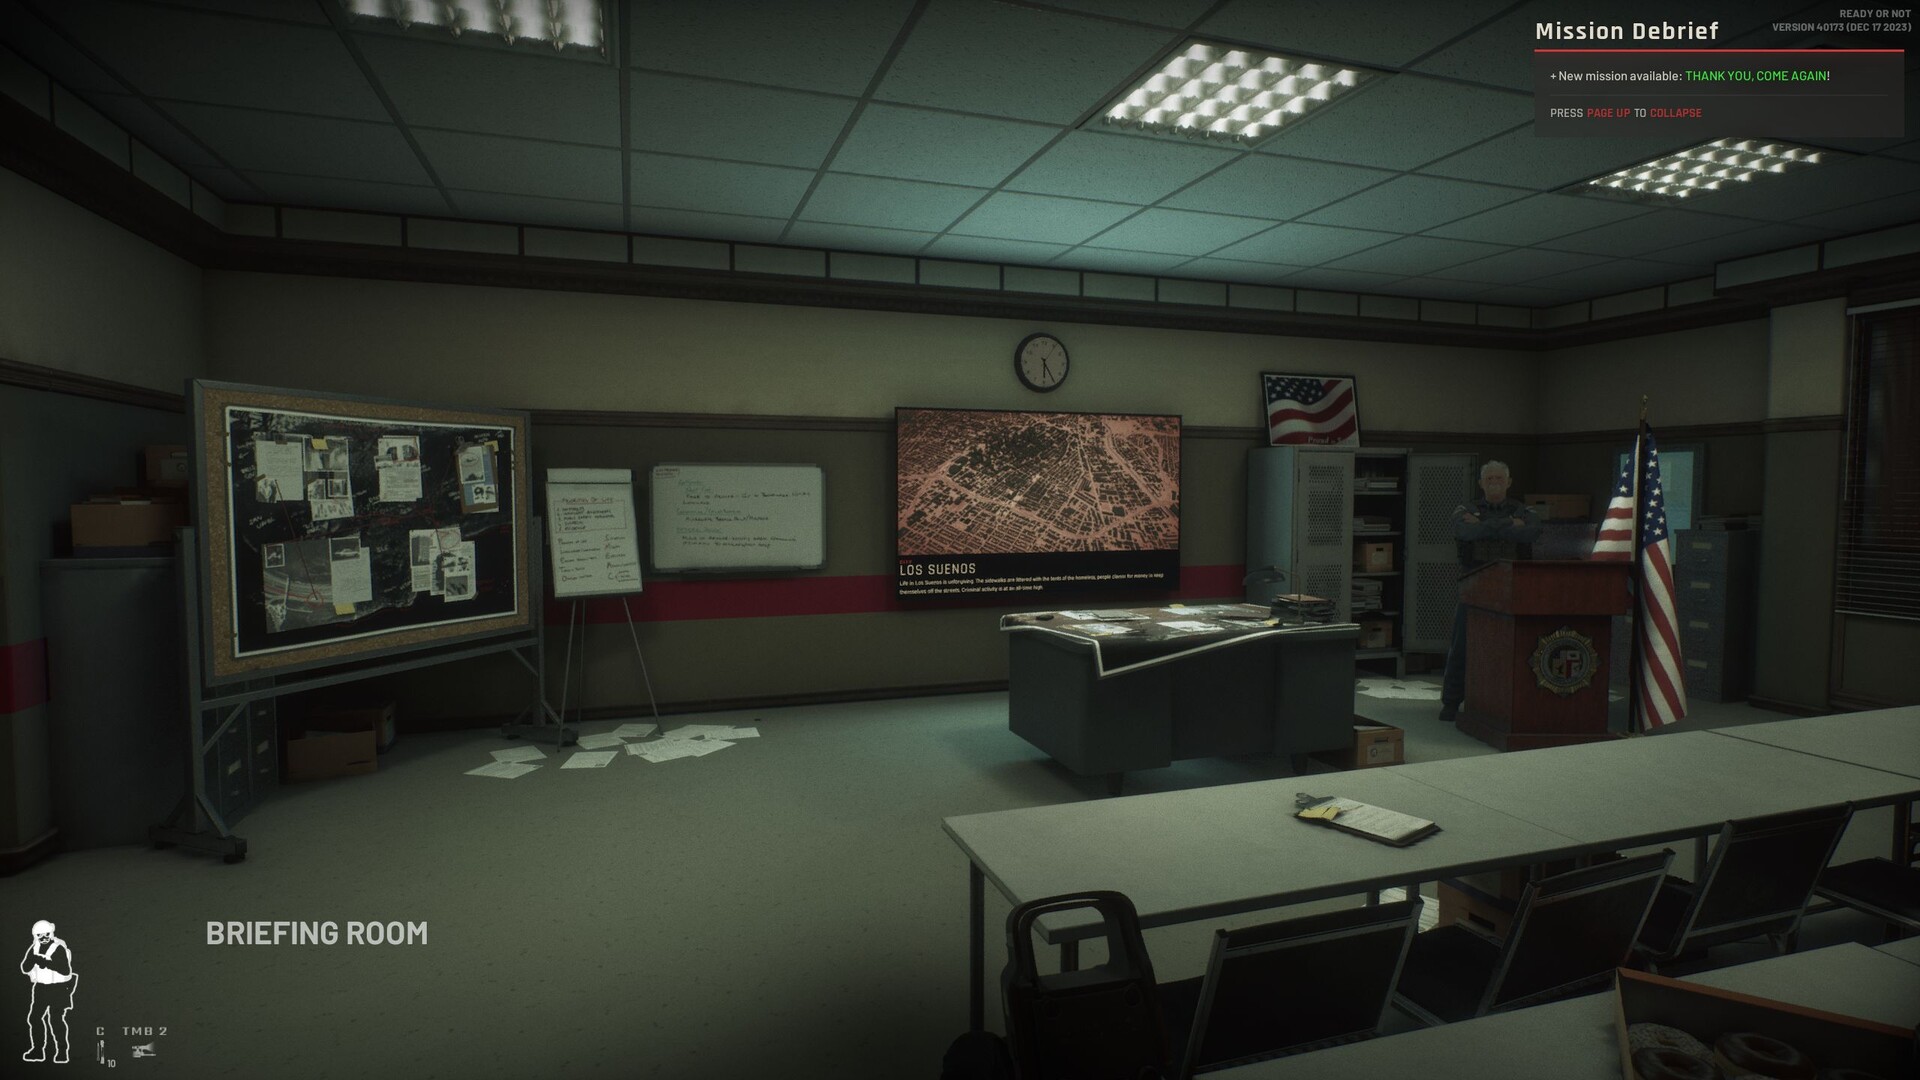
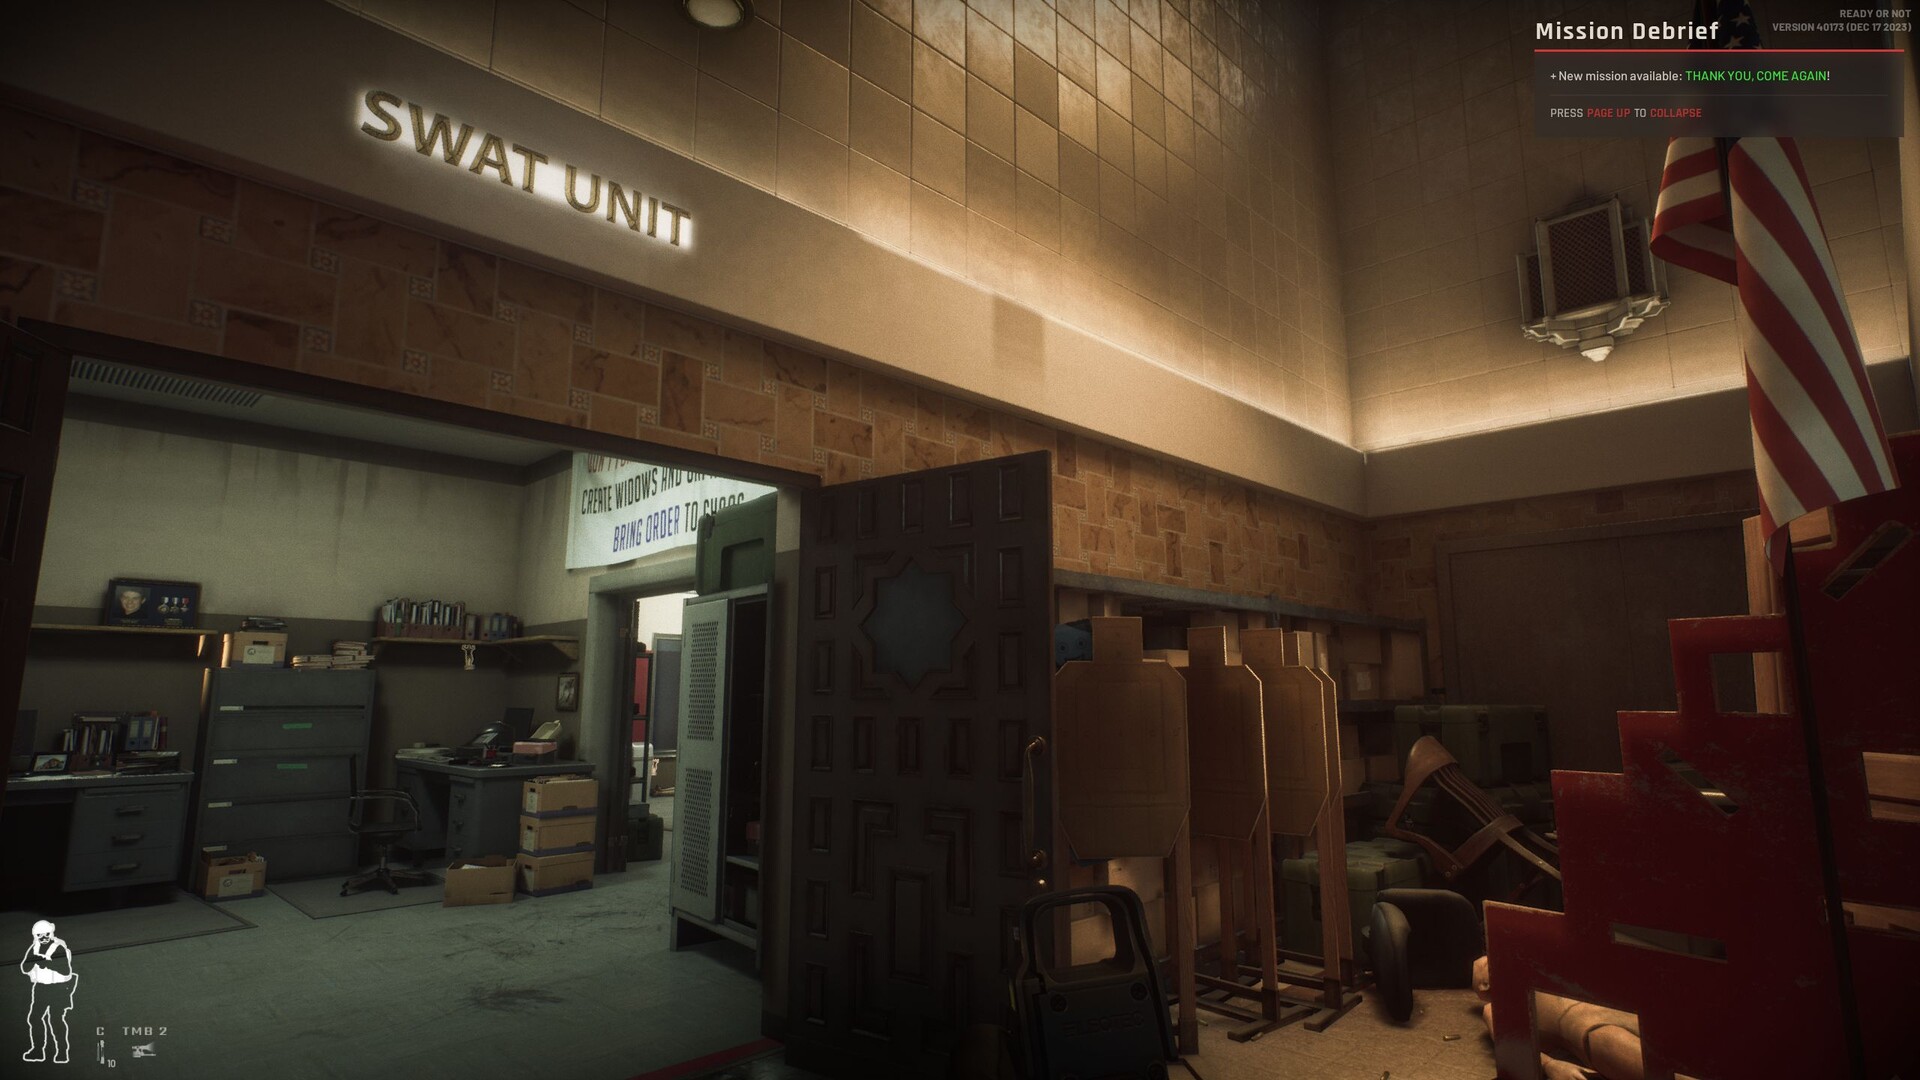
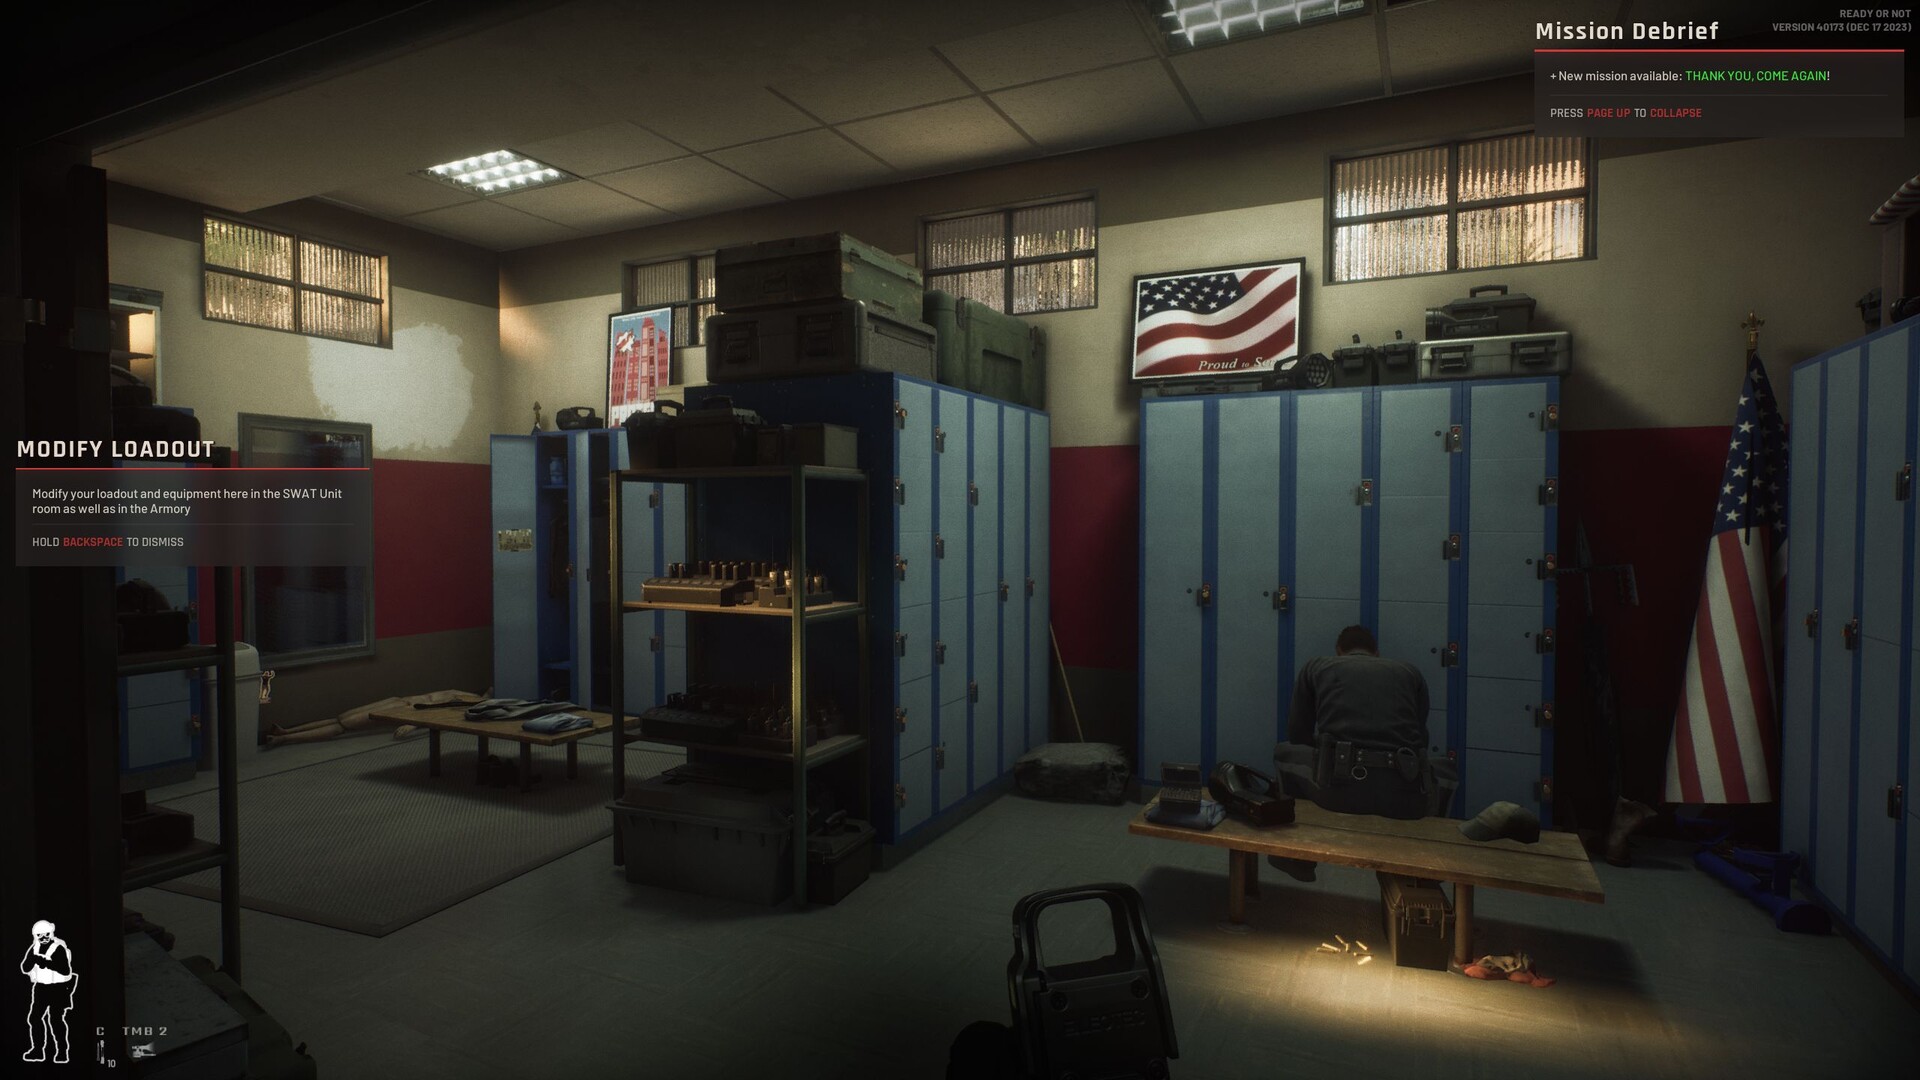
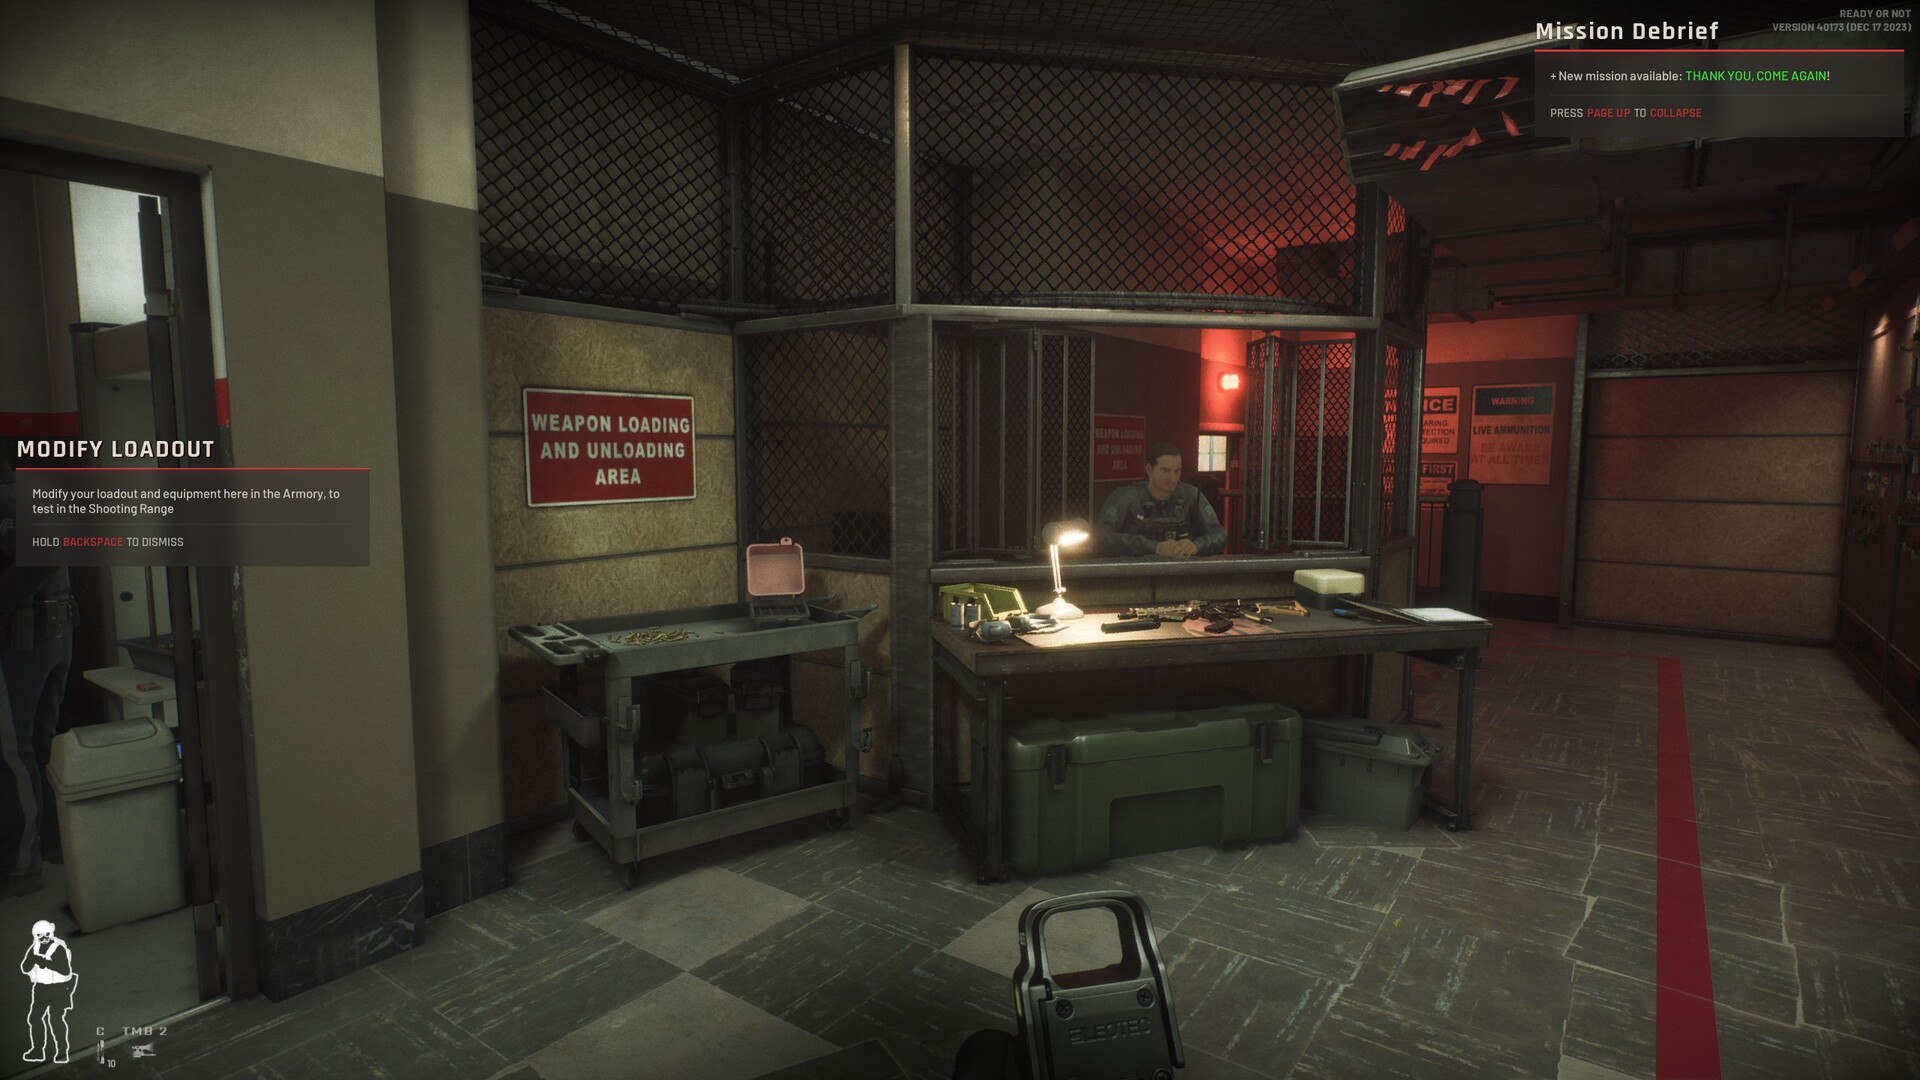
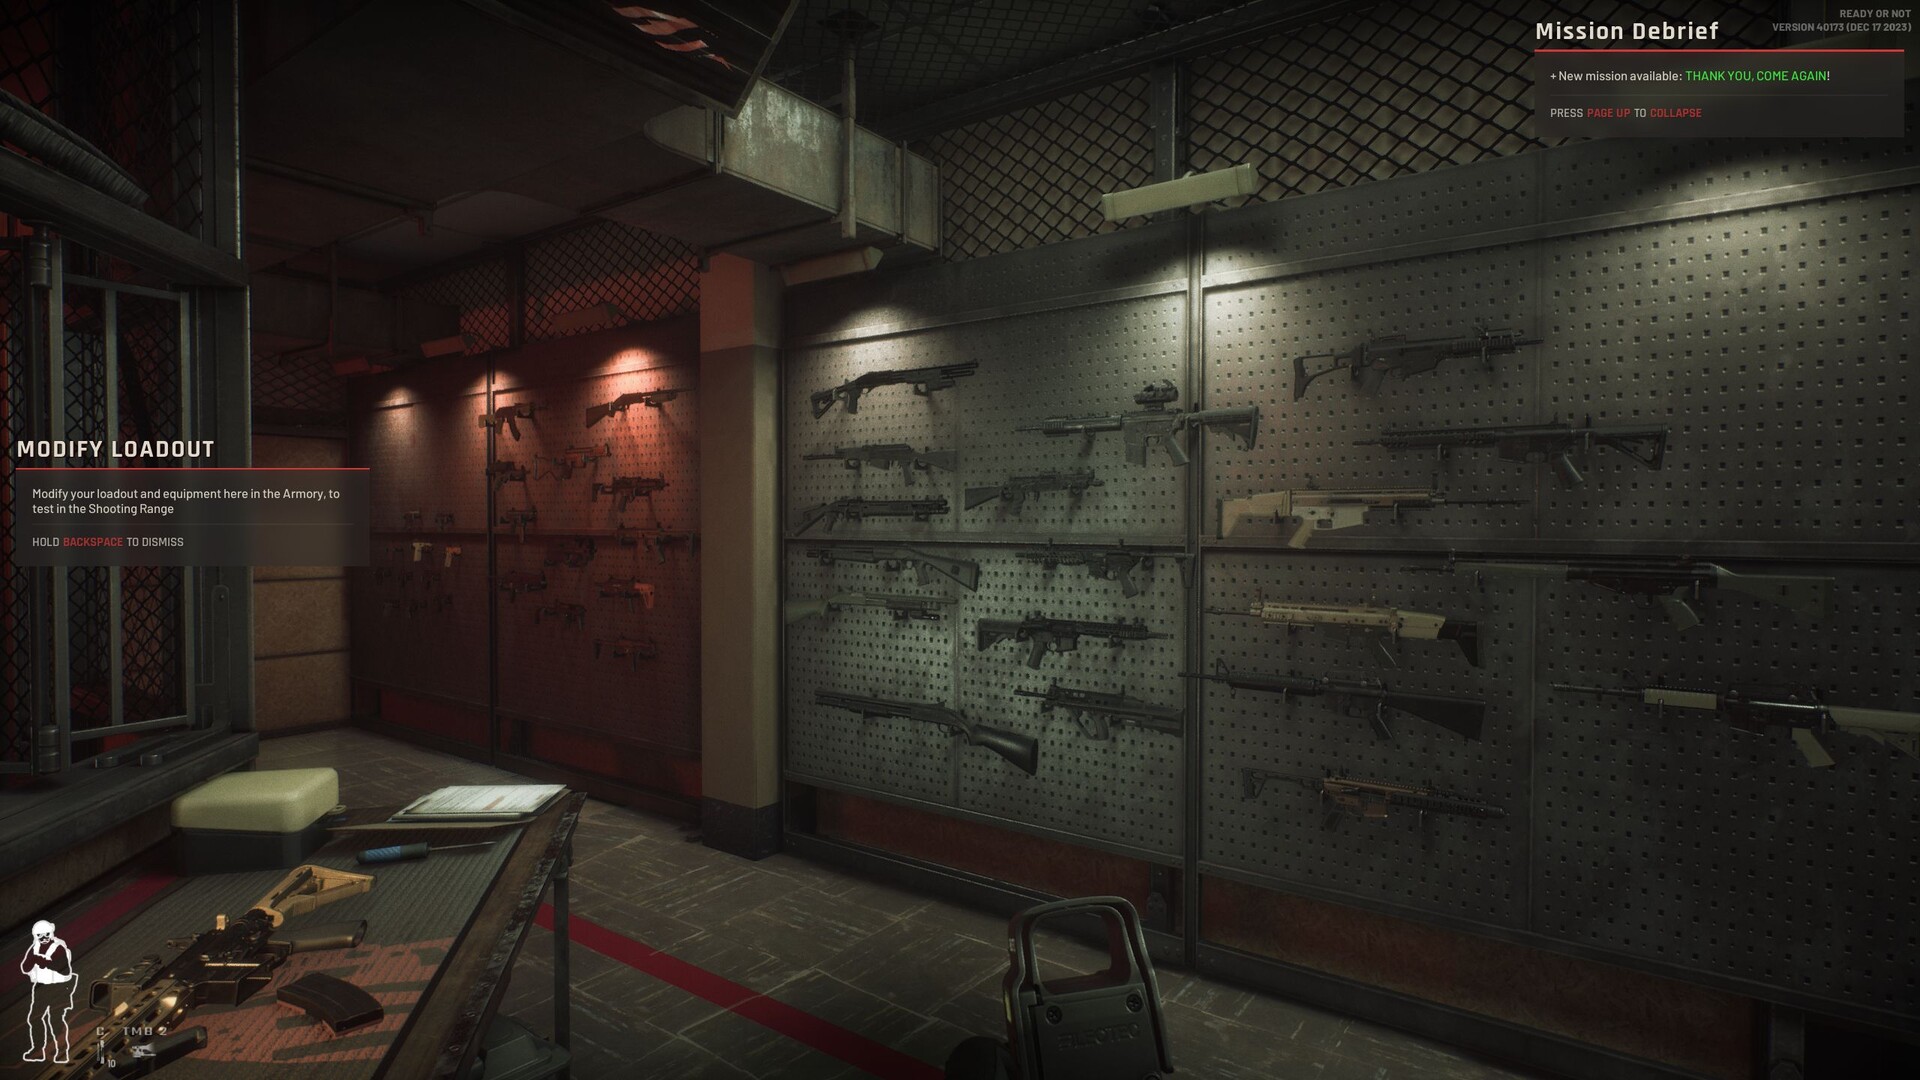
As mentioned, Ready or Not is based on the popular Unreal Engine. Although it "only" uses UE4 instead of the newer UE5, the game boasts good to very good visuals. As you can see in our screenshots, the game features sharp textures, attractive lighting and high object density. Despite its relatively small team size, each level has been constructed with love and attention.
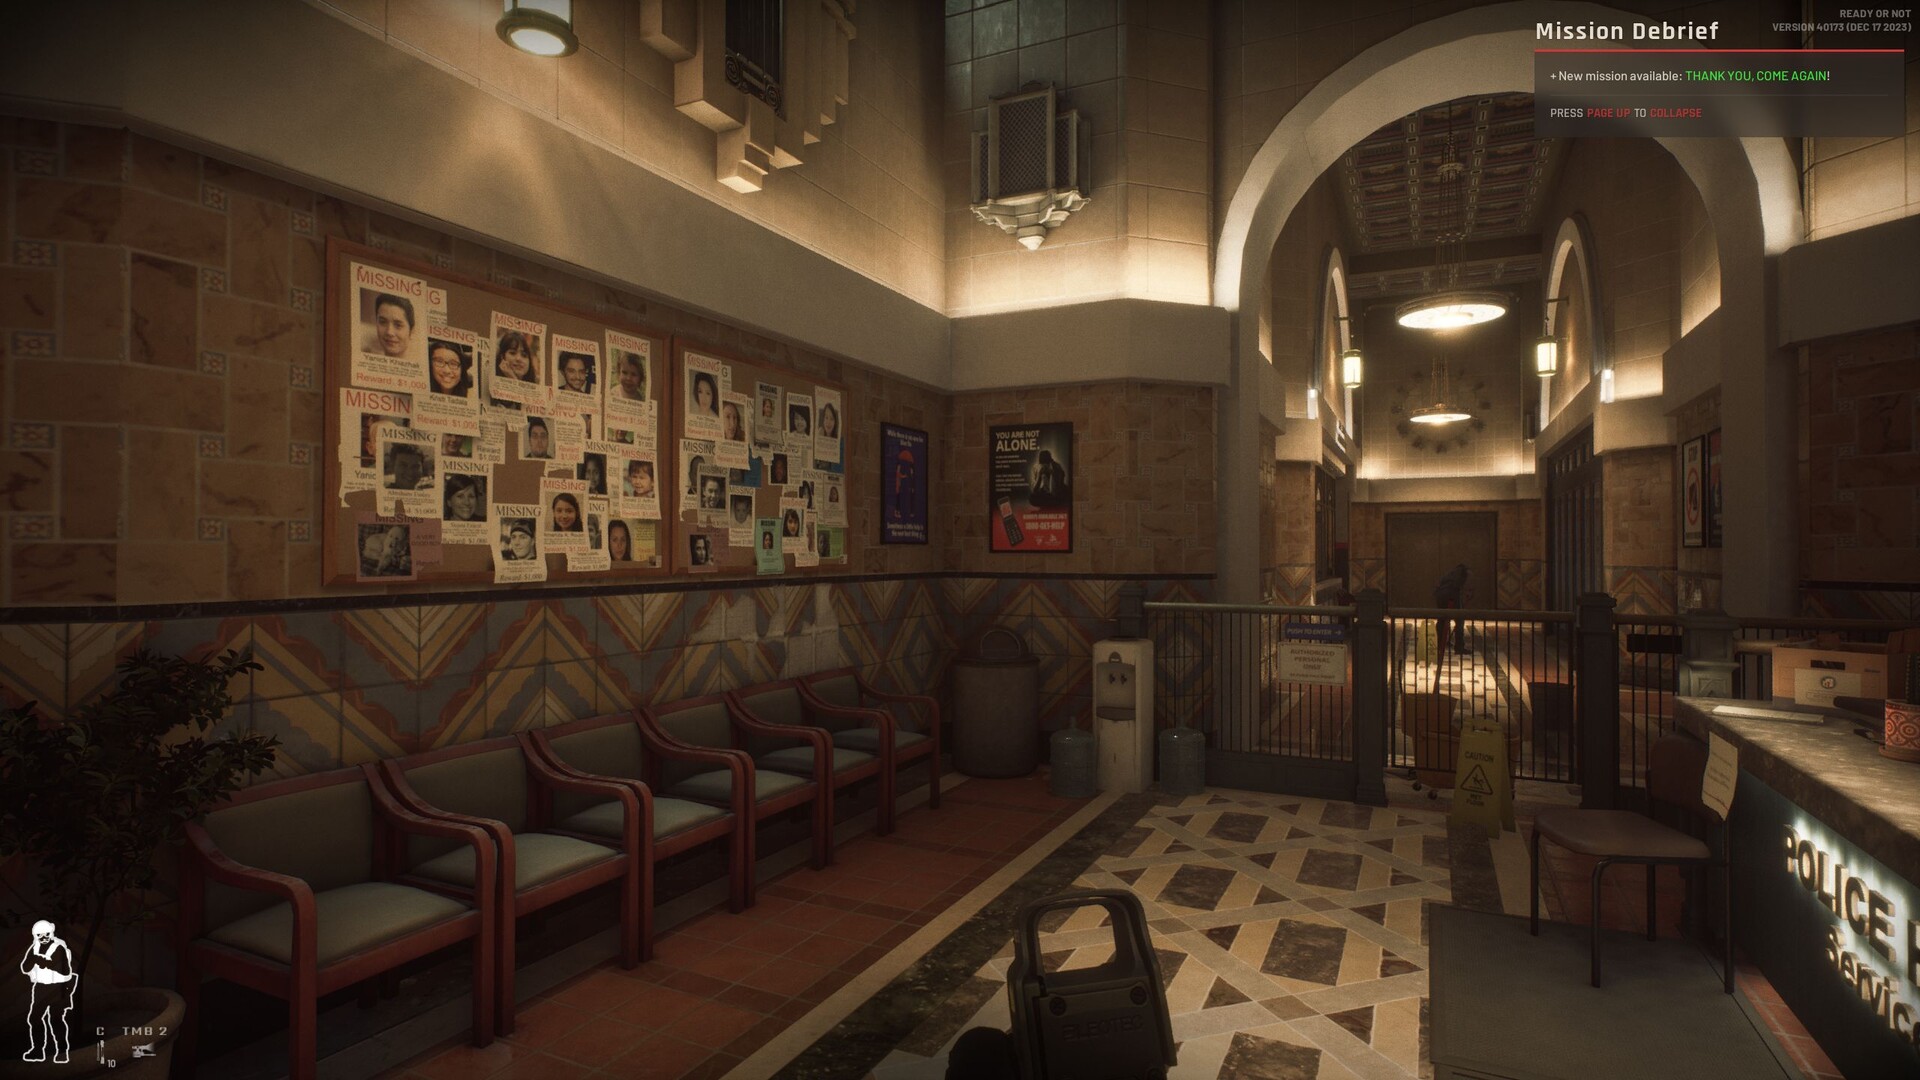
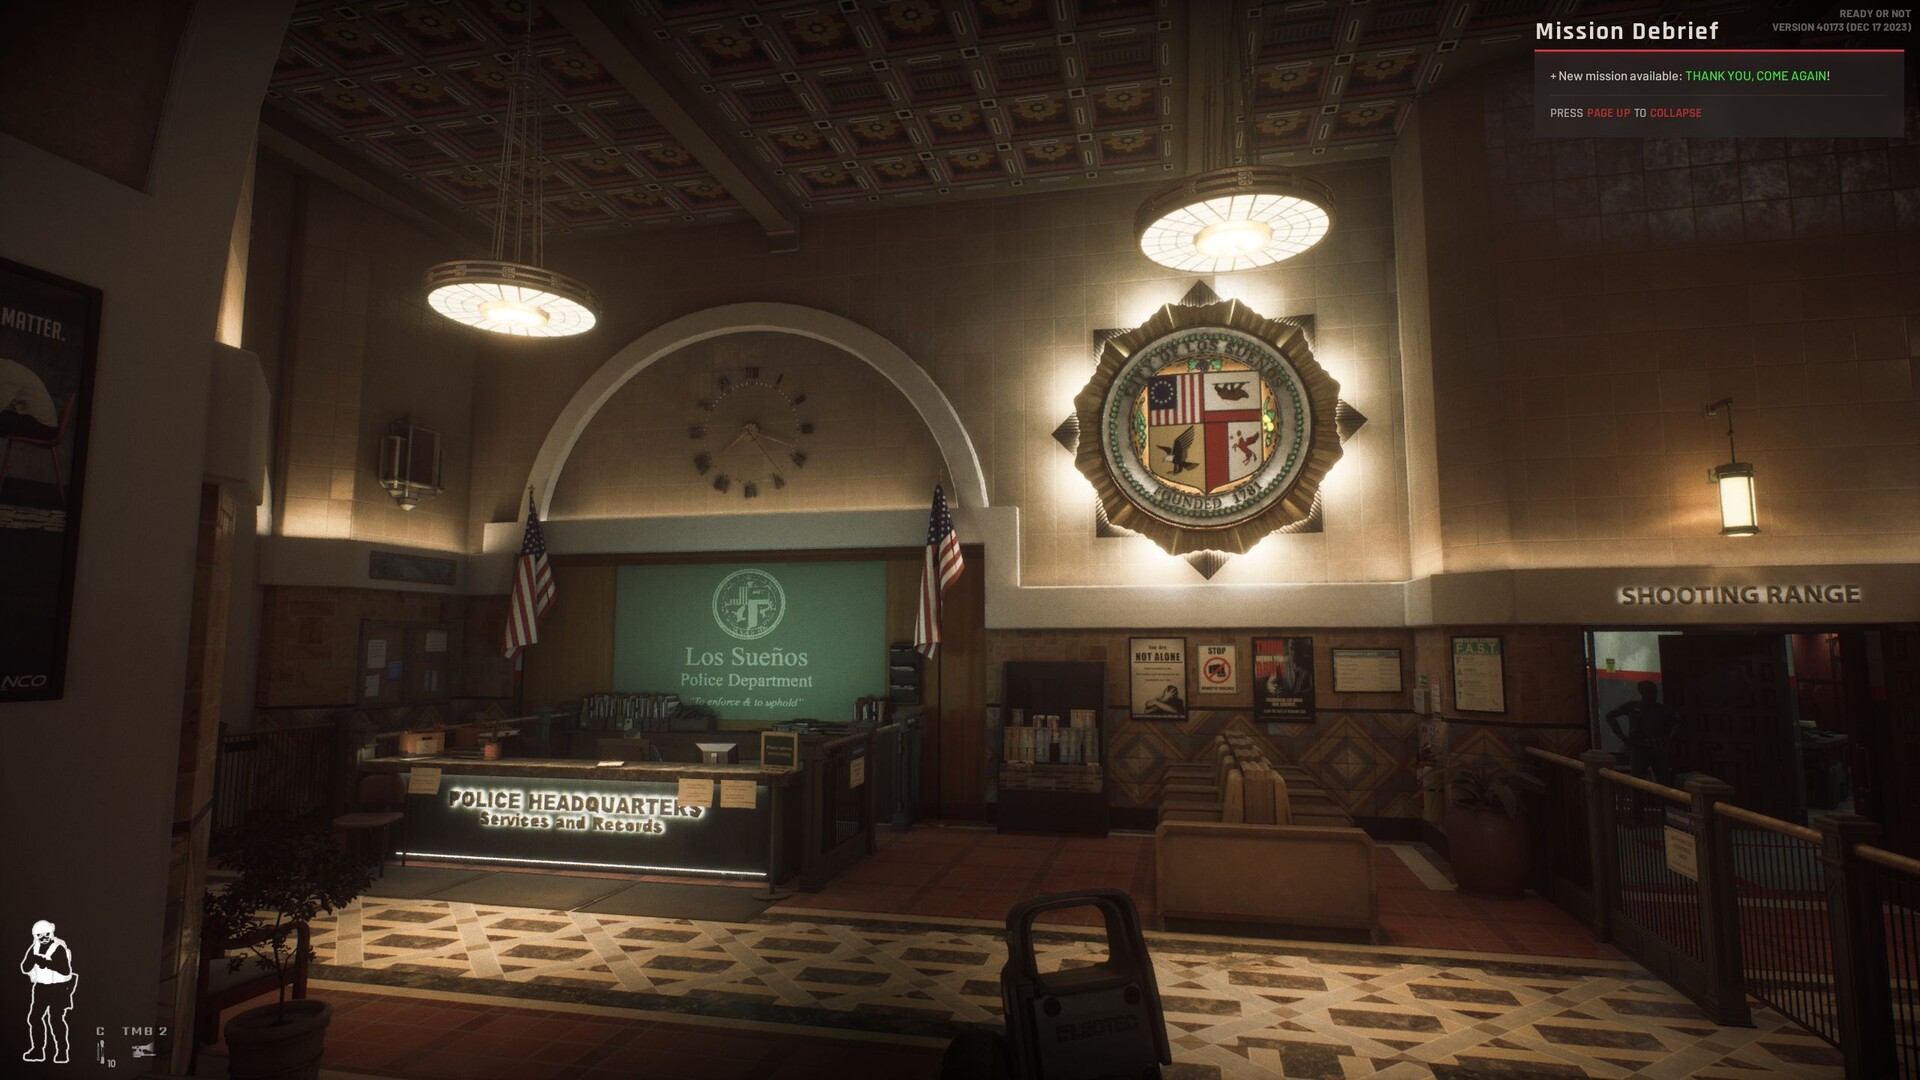
However, it sometimes takes a while for the textures to load properly (especially on weaker devices), which can get a little annoying. The developers could also do with improving on the dropped frames that sometimes occur (especially just after loading) and the game's poor minimum FPS rate in general. In addition, the controls often turn out to be quite clumsy (collision detection etc.). You also have to like the rather sluggish movement, even for a tactical shooter. On the other hand, it features first-class (weapon) sound that some larger studios could take as an example.
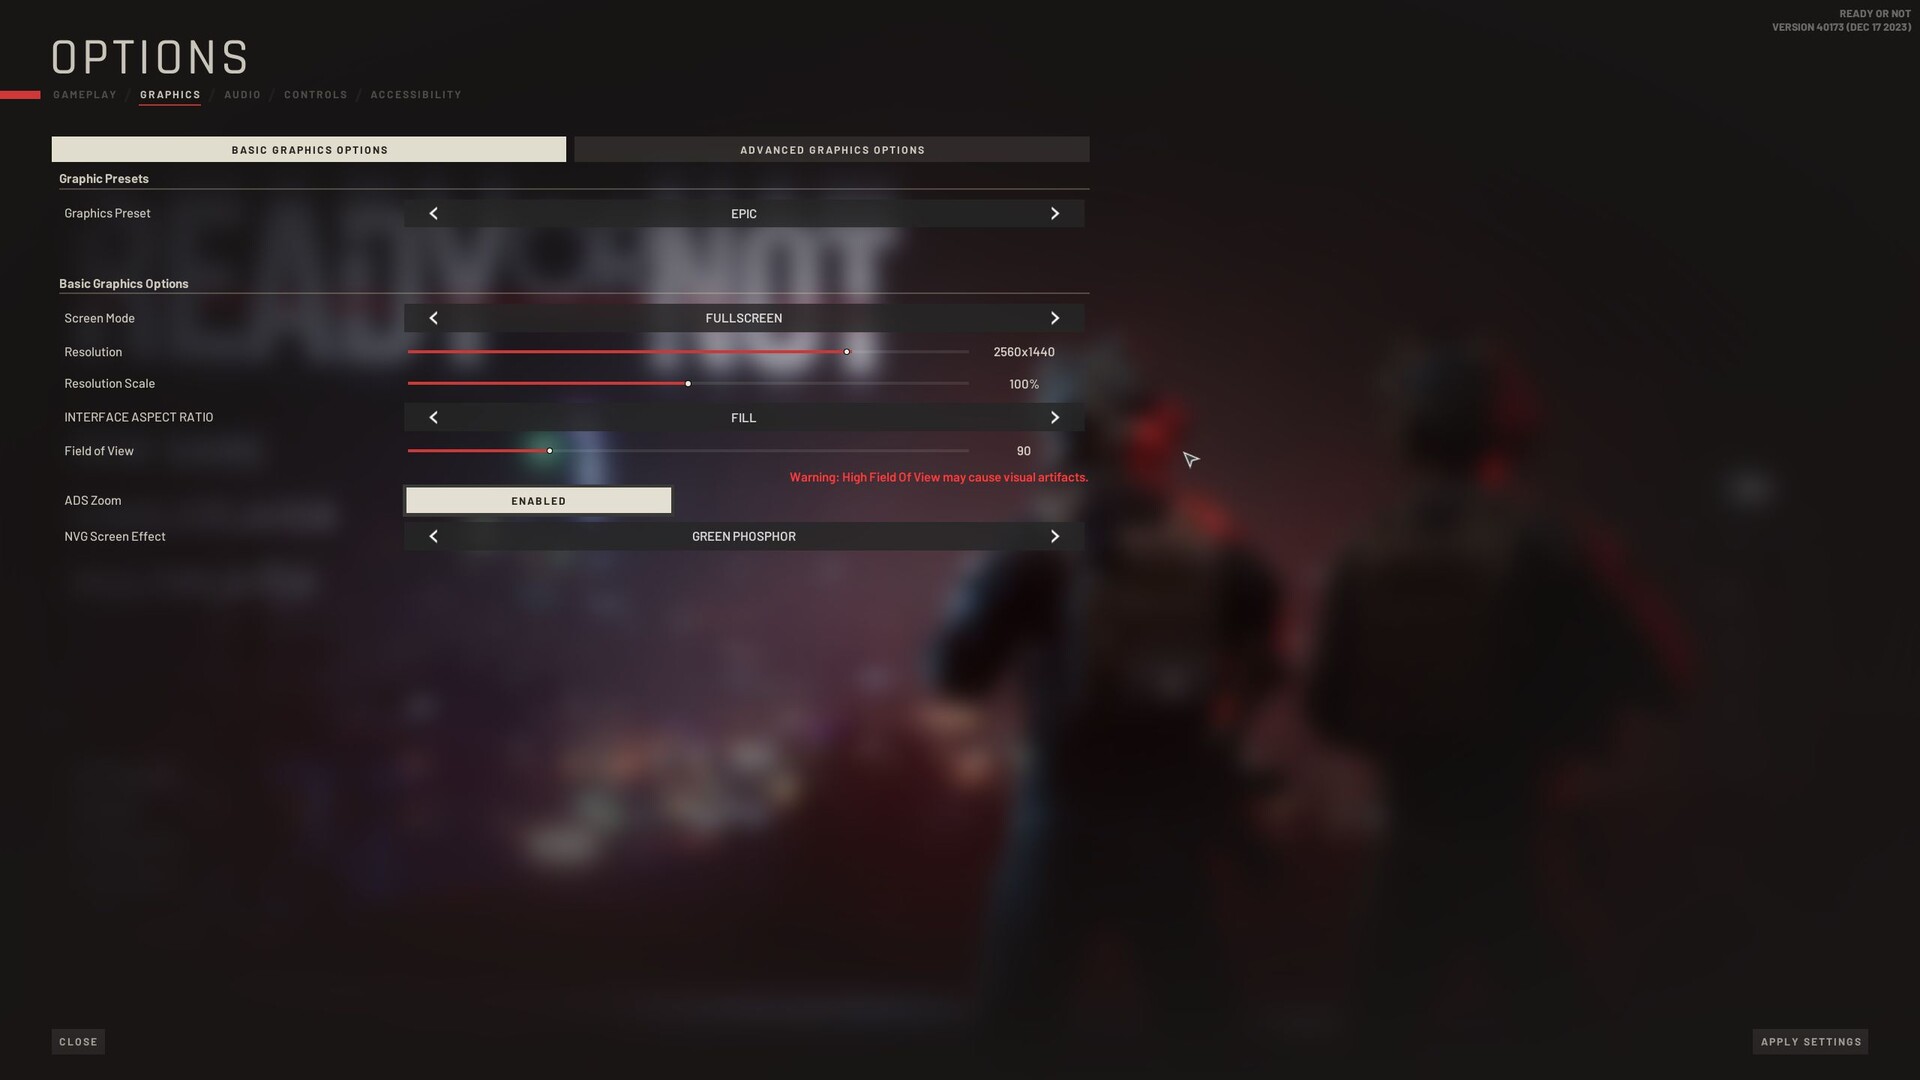
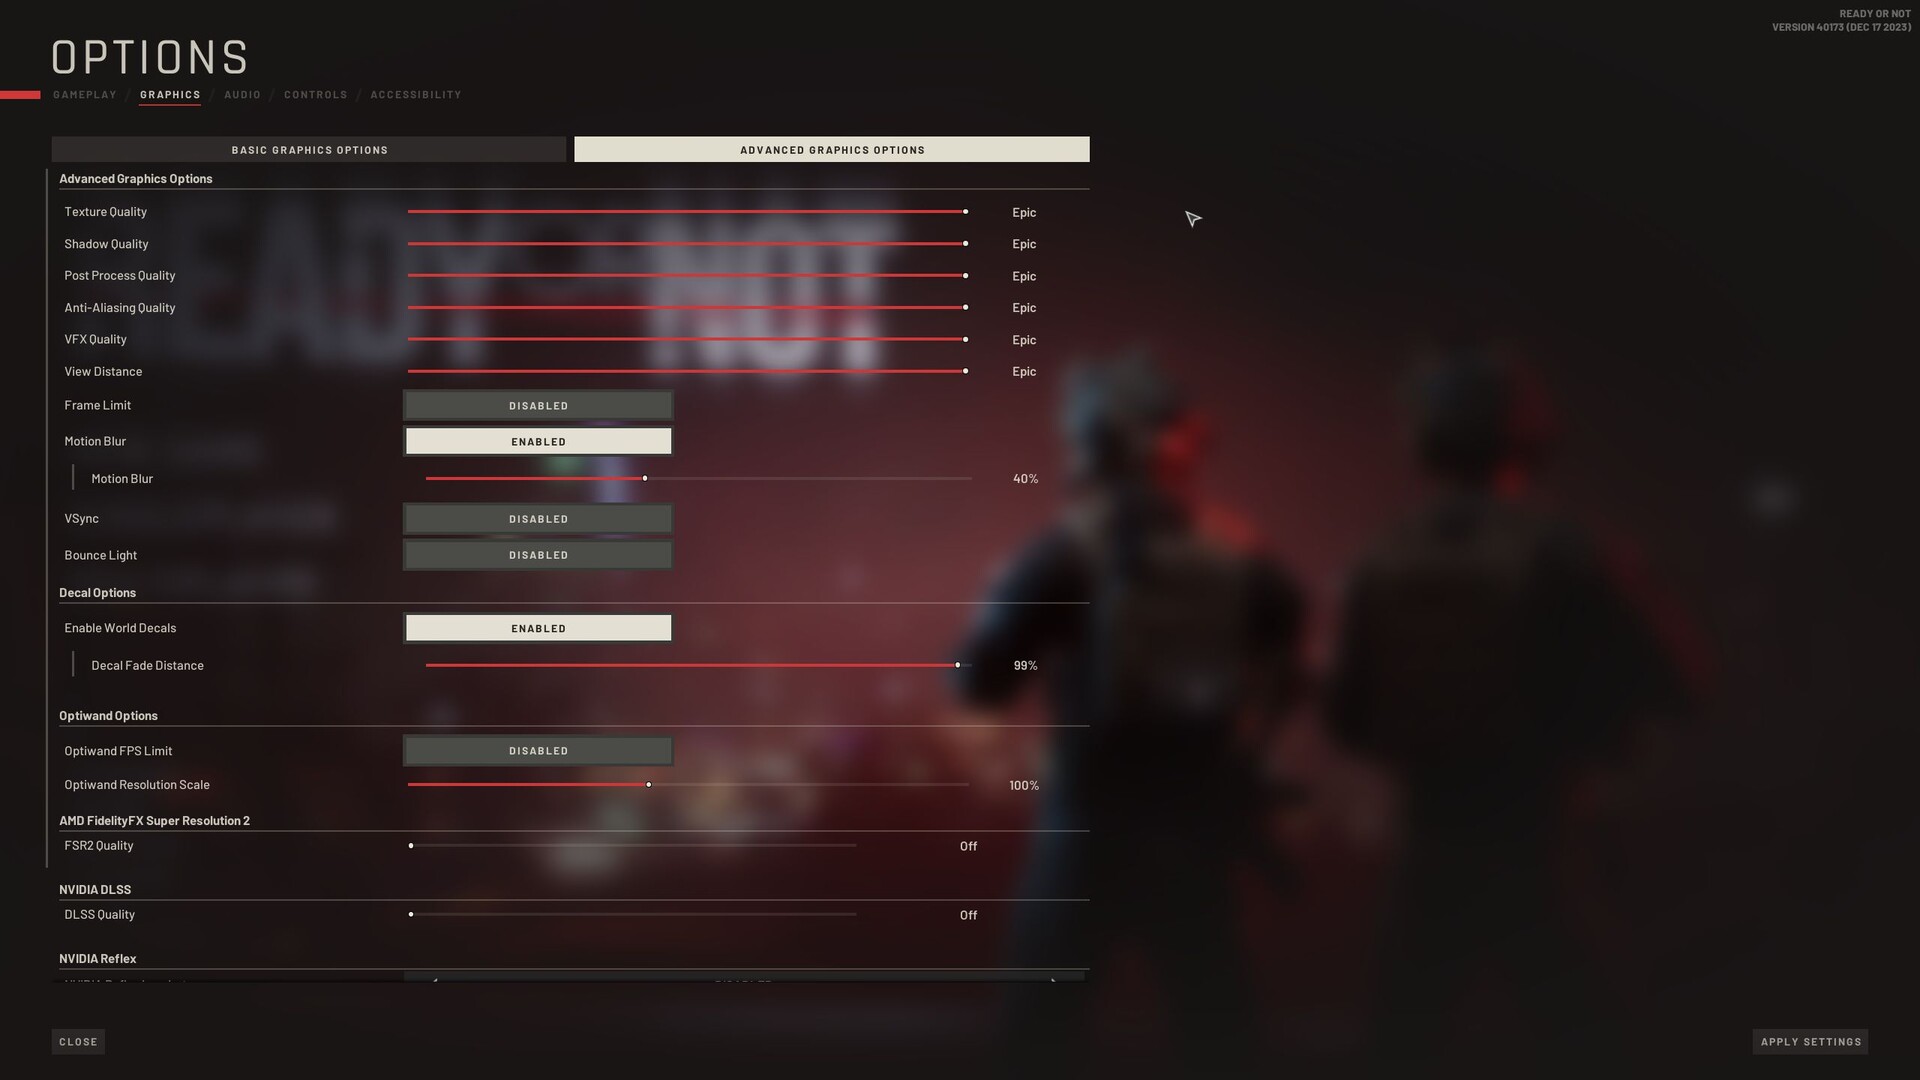
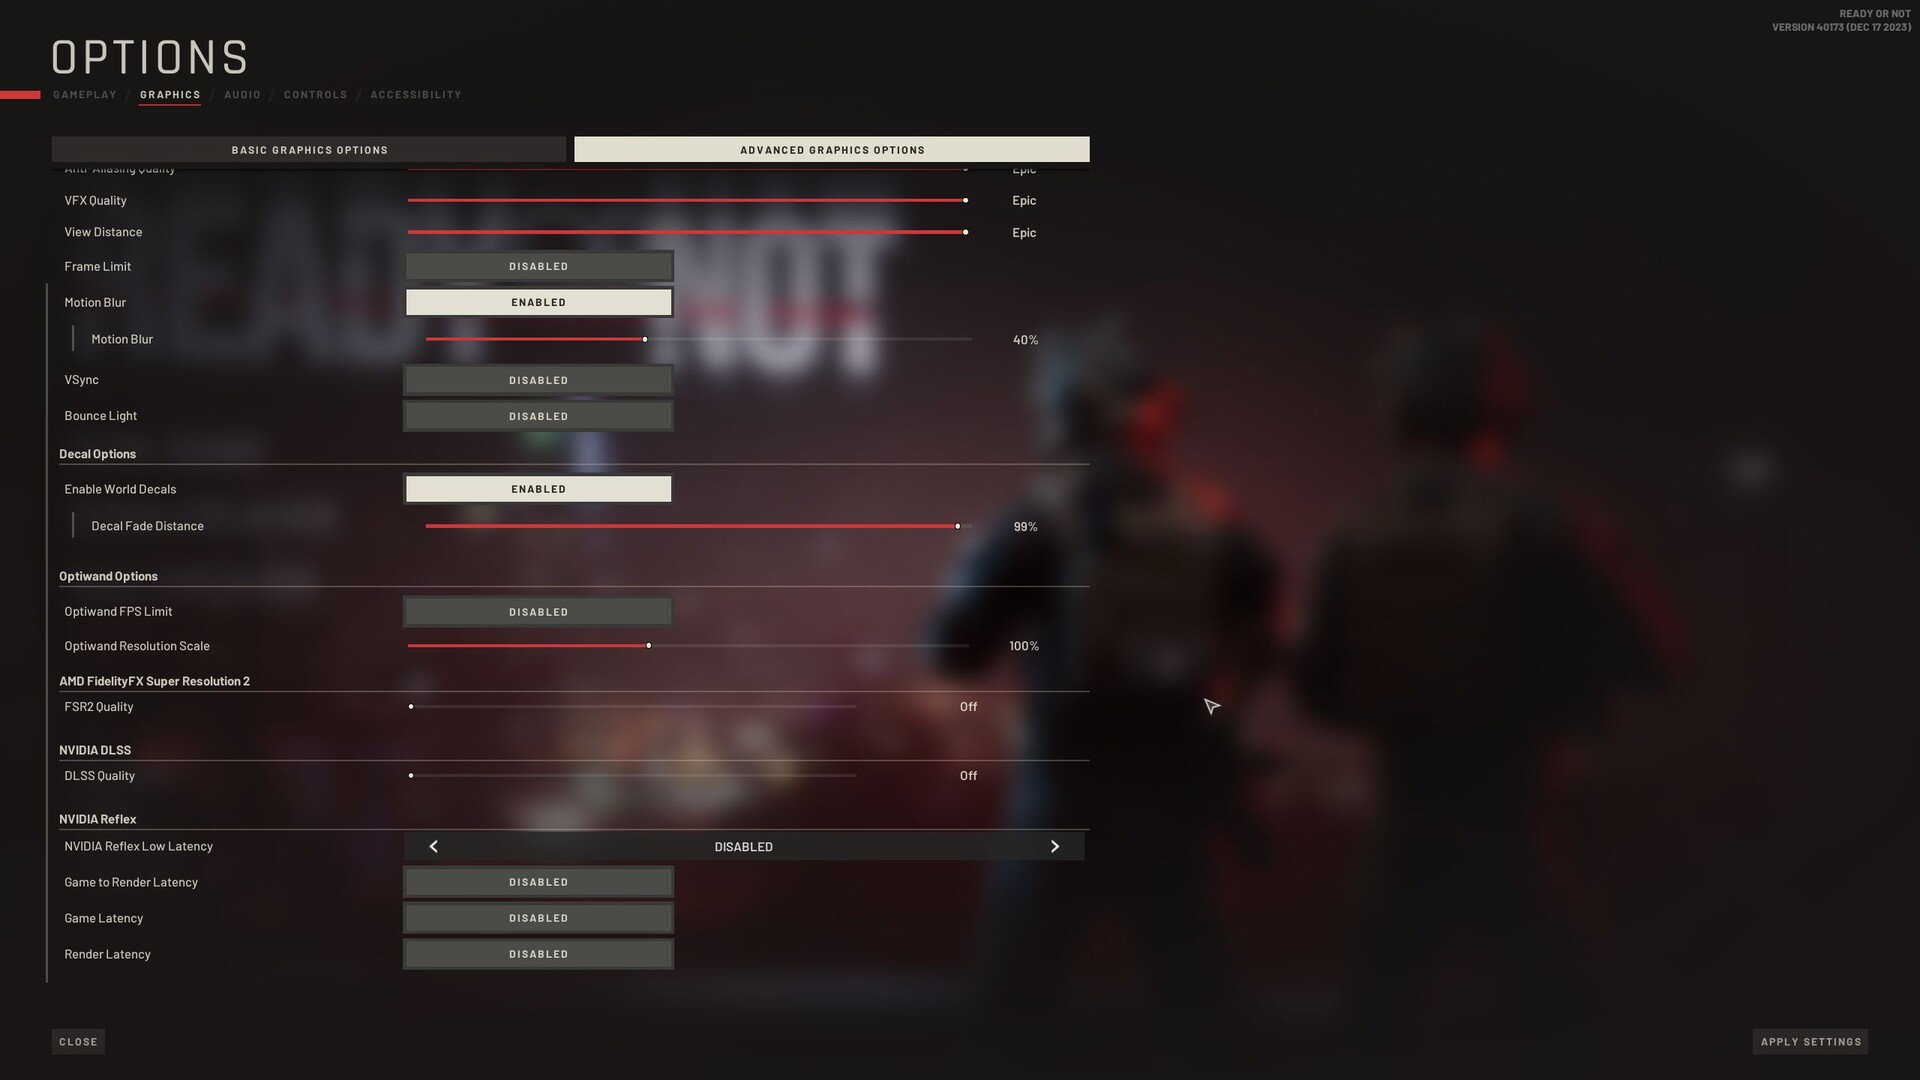
The graphics options are nice and extensive. While the basic tab is still manageable and relatively unspectacular (see screenshots), there are almost 20 settings options in the advanced tab. Upscaling fans can look forward to the presence of FSR and DLSS. Another nice feature is the fact that changes are applied without having to restart the game and there are some handy presets. When starting the game, you also have the choice between DirectX 11 and DirectX 12 (our benchmarks were carried out in DX12 mode).
Benchmark
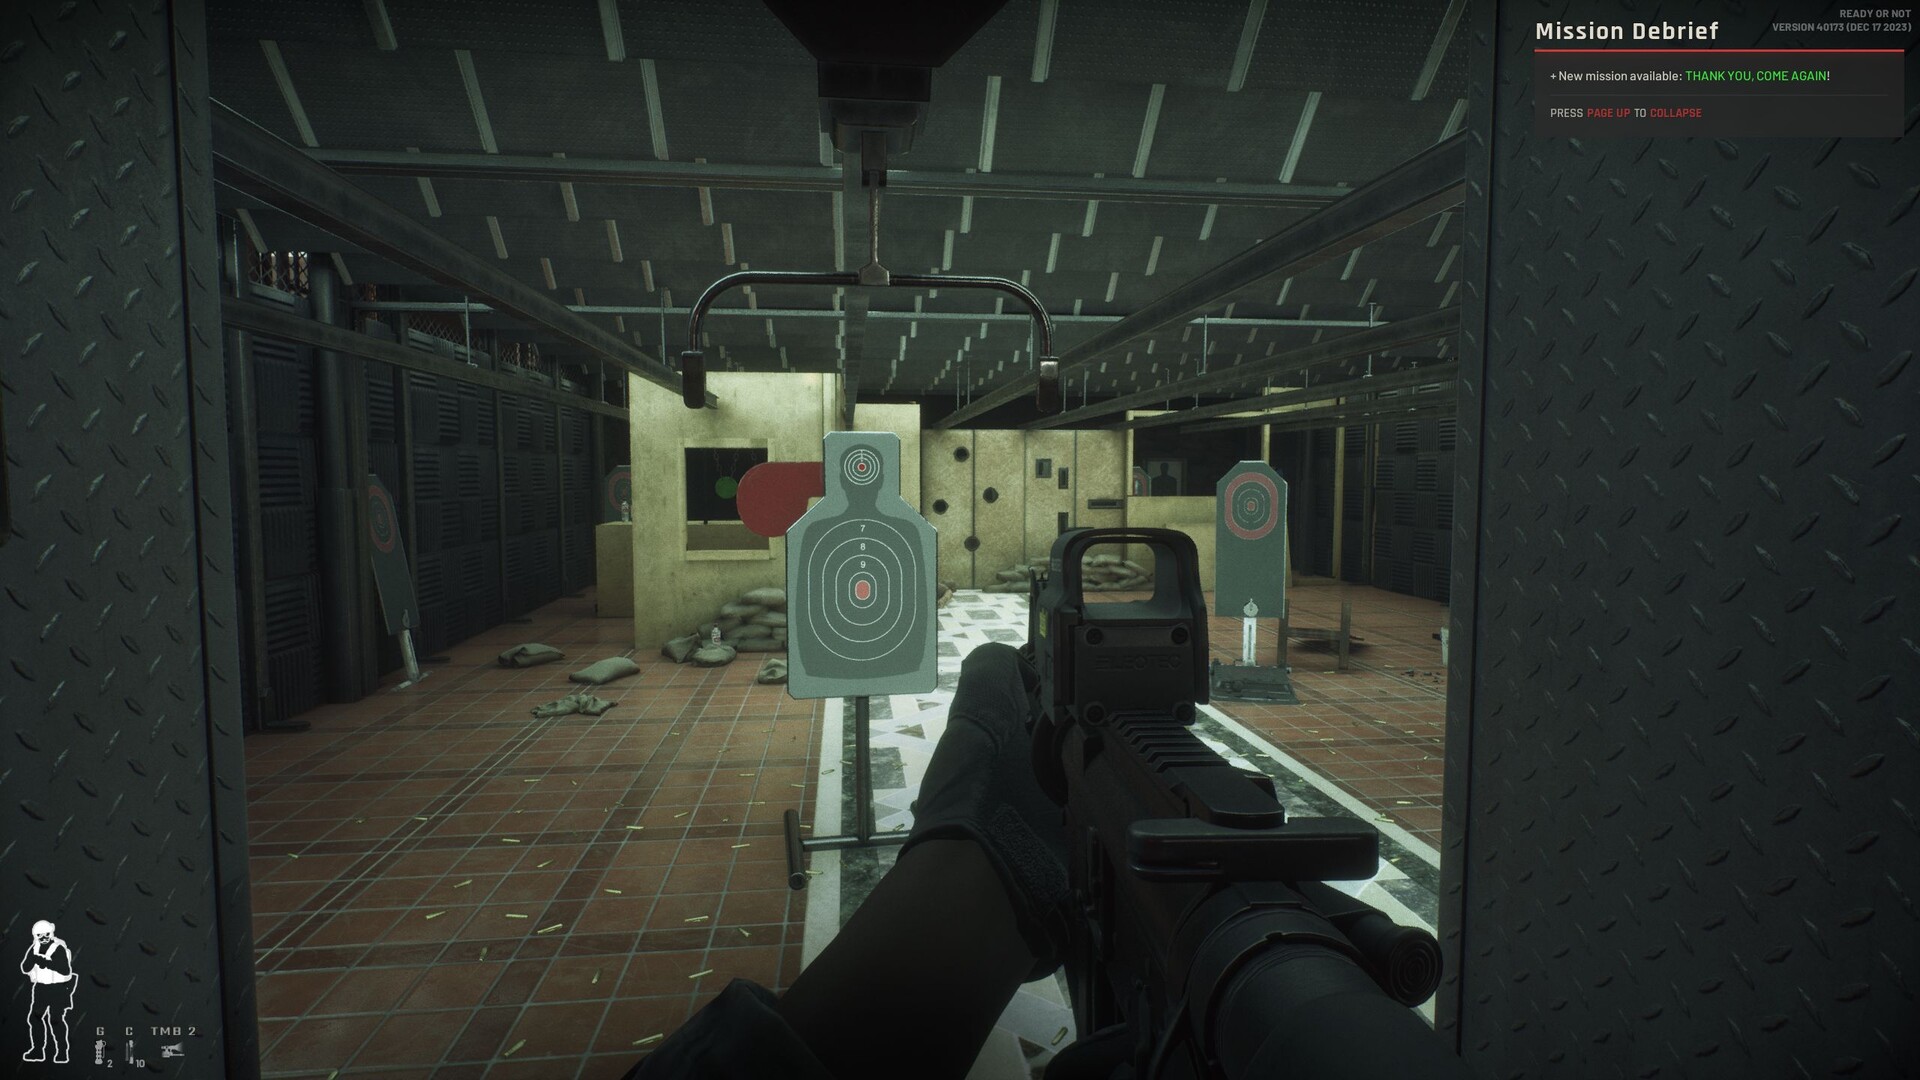
We used the single-player menu's practice mode as a benchmark sequence. As shown in the video below, we ran along a fixed route for just under 30 seconds and recorded the frame rate using the CapFrameX tool. As this is a first-person game, we would recommend at least 40 FPS despite the leisurely pace of the game.
Results
FHD (1,920 x 1,080)
Unreal Engine has proven not to be particularly demanding, as can be seen in our recent review of The Finals. With a combination of 1,920 x 1,080 pixels and high details, even a Radeon 780M manages to crack the 40 FPS mark, although the minimum FPS rate is quite modest. Current mid-range GPUs such as the GeForce RTX 4050, on the other hand, have no major problems with the epic preset — apart from the previously mentioned dropped frame issue.
| Ready or Not | |
| 1920x1080 Low Preset 1920x1080 Medium Preset 1920x1080 High Preset 1920x1080 Epic Preset | |
| NVIDIA GeForce RTX 4080, i9-13900K | |
| AMD Radeon RX 7900 XT, i9-13900K | |
| NVIDIA GeForce RTX 4090 Laptop GPU, i9-13900H | |
| NVIDIA GeForce RTX 4080 Laptop GPU, i9-13950HX | |
| NVIDIA GeForce RTX 3080 Ti Laptop GPU, i9-12900H | |
| NVIDIA GeForce RTX 4070 Laptop GPU, i9-13900HX | |
| NVIDIA GeForce RTX 4060 Laptop GPU, R9 7940HS | |
| NVIDIA GeForce RTX 4050 Laptop GPU, i7-13700H | |
| AMD Radeon RX 7600S, R9 7940HS | |
| AMD Radeon 780M, R9 7940HS | |
QHD (2,560 x 1,440)
A mid-range model is also enough for QHD. From a Radeon RX 7600S upwards, you can expect more than 60 FPS on average when running the game at 2,560 x 1,440 pixels and with maximum settings.
| Ready or Not | |
| 2560x1440 Epic Preset | |
| NVIDIA GeForce RTX 4080, i9-13900K | |
| AMD Radeon RX 7900 XT, i9-13900K | |
| NVIDIA GeForce RTX 4090 Laptop GPU, i9-13900H | |
| NVIDIA GeForce RTX 4080 Laptop GPU, i9-13950HX | |
| NVIDIA GeForce RTX 3080 Ti Laptop GPU, i9-12900H | |
| NVIDIA GeForce RTX 4070 Laptop GPU, i9-13900HX | |
| NVIDIA GeForce RTX 4060 Laptop GPU, R9 7940HS | |
| AMD Radeon RX 7600S, R9 7940HS | |
| NVIDIA GeForce RTX 4050 Laptop GPU, i7-13700H | |
UHD (3,840 x 2,160)
Only 4K begins to separate the wheat from the chaff. When using the epic preset, you will likely not be able to avoid needing a high-end component. Anything from a GeForce RTX 4070 upwards will lead to acceptable performance. With DLSS (Quality) activated, the situation looks more relaxed. Theoretically, an RTX 4050 should already offer sufficient performance.
| Ready or Not | |
| 3840x2160 Epic Preset 3840x2160 Epic Preset + Quality DLSS | |
| NVIDIA GeForce RTX 4080, i9-13900K | |
| AMD Radeon RX 7900 XT, i9-13900K | |
| NVIDIA GeForce RTX 4090 Laptop GPU, i9-13900H | |
| NVIDIA GeForce RTX 4080 Laptop GPU, i9-13950HX | |
| NVIDIA GeForce RTX 3080 Ti Laptop GPU, i9-12900H | |
| NVIDIA GeForce RTX 4070 Laptop GPU, i9-13900HX | |
| NVIDIA GeForce RTX 4060 Laptop GPU, R9 7940HS | |
| AMD Radeon RX 7600S, R9 7940HS | |
| NVIDIA GeForce RTX 4050 Laptop GPU, i7-13700H | |
Overview
Test system details
| Laptop | Graphics card | Processor | RAM |
|---|---|---|---|
| Asus ROG Zephyrus M16 | Nvidia GeForce RTX 4090 @150 W TGP (16 GB GDDR6X) | Intel Core i9-13900H | 2 x 16 GB DDR5 |
| Razer Blade 16 Mid 23 | Nvidia GeForce RTX 4080 @175 W TGP (12 GB GDDR6X) | Intel Core i9-13950HX | 2 x 16 GB DDR5 |
| XMG Pro 15 E23 | Nvidia GeForce RTX 4070 @140 W TGP (8 GB GDDR6) | Intel Core i9-13900HX | 2 x 16 GB DDR5 |
| Razer Blade 14 Mid 23 | Nvidia GeForce RTX 4060 @140 W TGP (8 GB GDDR6) | AMD Ryzen 9 7940HS | 2 x 8 GB DDR5 |
| Medion Erazer Scout E20 | Nvidia GeForce RTX 4050 @100 W TGP (6 GB GDDR6) | Intel Core i7-13700H | 2 x 8 GB DDR5 |
| Asus ROG Strix Scar 17 | Nvidia GeForce RTX 3080 Ti @150 W TGP (16 GB GDDR6) | Intel Core i9-12900H | 2 x 16 GB DDR5 |
| Asus TUF Gaming Advantage A16 | AMD Radeon RX 7600S (8 GB GDDR6) & AMD Radeon 780M | AMD Ryzen 9 7940HS | 2 x 8 GB DDR5 |
| Tower PC | Graphics card | Processor | RAM |
|---|---|---|---|
| Asus ROG Strix Z790-F | Nvidia GeForce RTX 4080 (16 GB GDDR6X) AMD Radeon RX 7900 XT (20 GB GDDR6) |
Intel Core i9-13900K | 2 x 24 GB DDR5 G.Skill |
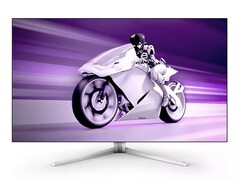
| 4K monitor | Operating system | Nvidia driver | AMD driver |
|---|---|---|---|
| Philips Evnia 42M2N8900 | Windows 11 | ForceWare 546.33 | Adrenalin 23.12.1 |

