Notebookcheck Logo

The Finals review: Laptop and desktop benchmarks

Creative gaming concept. The Finals brings a breath of fresh air to the multiplayer shooter genre. We have taken a look at the tech and graphics requirements of this exciting game.

Test systems

Asus ROG Zephyrus M16 (RTX 4090)
Razer Blade 16 Mid 23 (RTX 4080)
XMG Pro 15 E23 (RTX 4070)
Razer Blade 14 Mid 23 (RTX 4060)
Medion Erazer Scout E20 (RTX 4050)
Asus ROG Strix Scar 17 (RTX 3080 Ti)
Asus TUF Gaming Advantage A16 (RX 7600S & 780M)
be quiet! Silent Base 802 (RTX 4080 & RX 7900 XT)
Philips Evnia 8000 Series 41,5" UHD OLED gaming monitor

We currently carry out our gaming benchmarks using these devices. Clicking on the photos will take you to the respective manufacturer's website. More details on the specifications are listed at the end of the article.

Tech

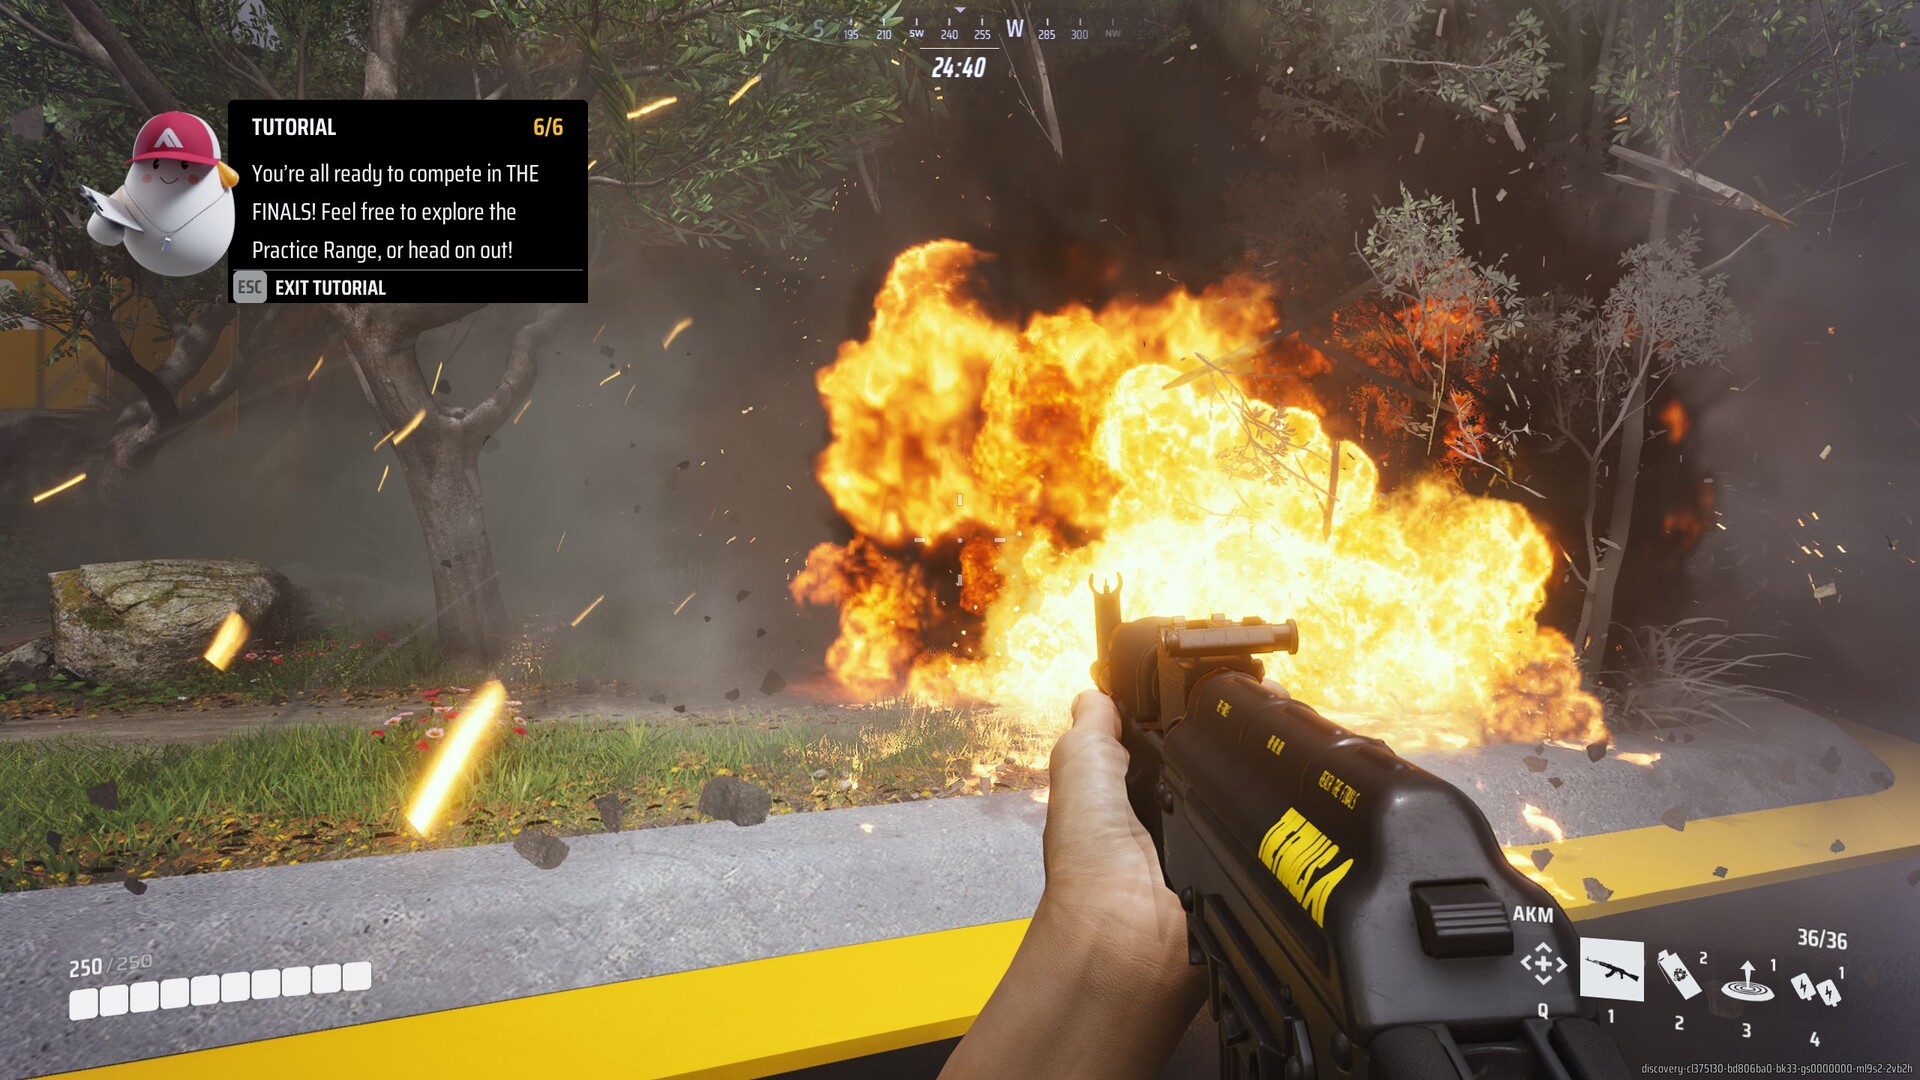
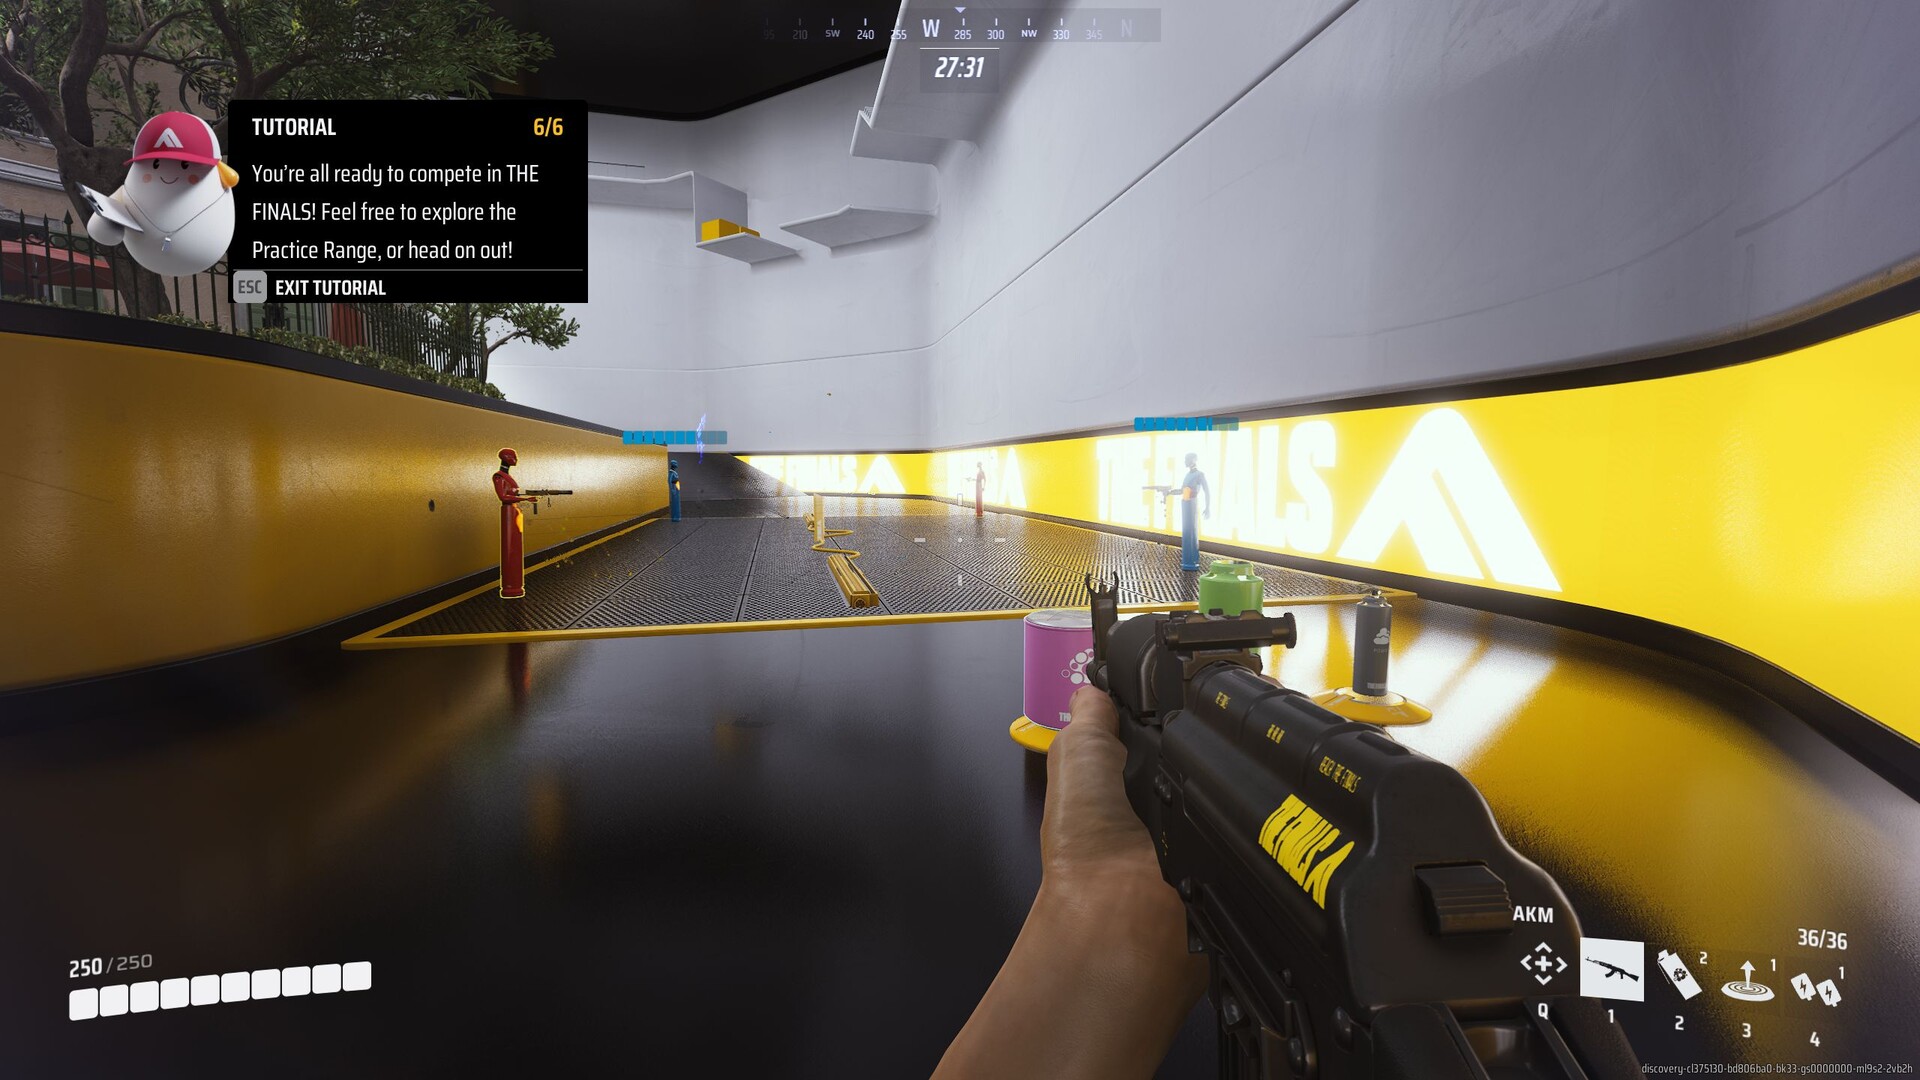
Despite its colourful and contrast-rich visuals (reminiscent of Mirror's Edge amongst other games), The Finals offers very good graphics. The underlying Unreal Engine 5 comes up trumps with sharp textures and great effects (fire, foam, ...). We were particularly impressed by the first-class reflections, which are already very impressive without the dynamic RTX global illumination. The destructible environment turns out to be another highlight and tactical feature.

The Finals
The Finals
The Finals
The Finals
The Finals
The Finals

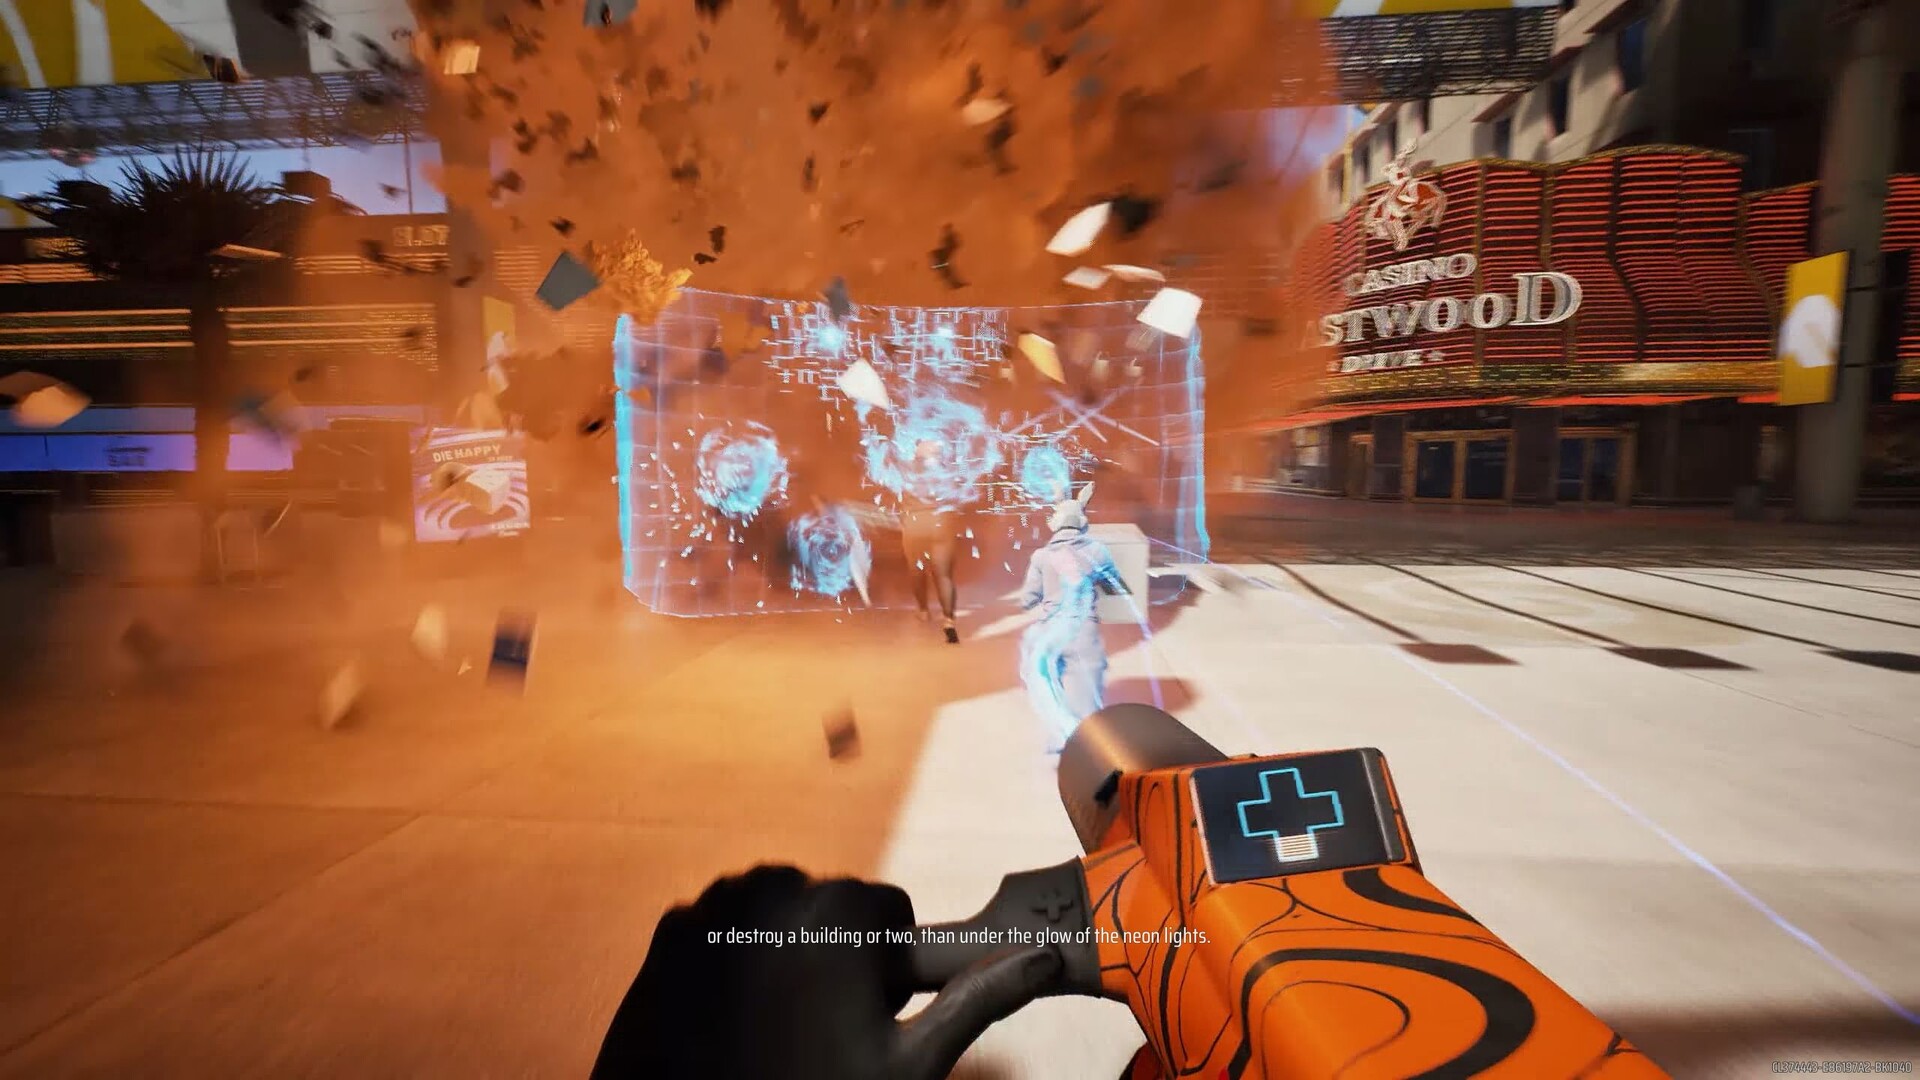
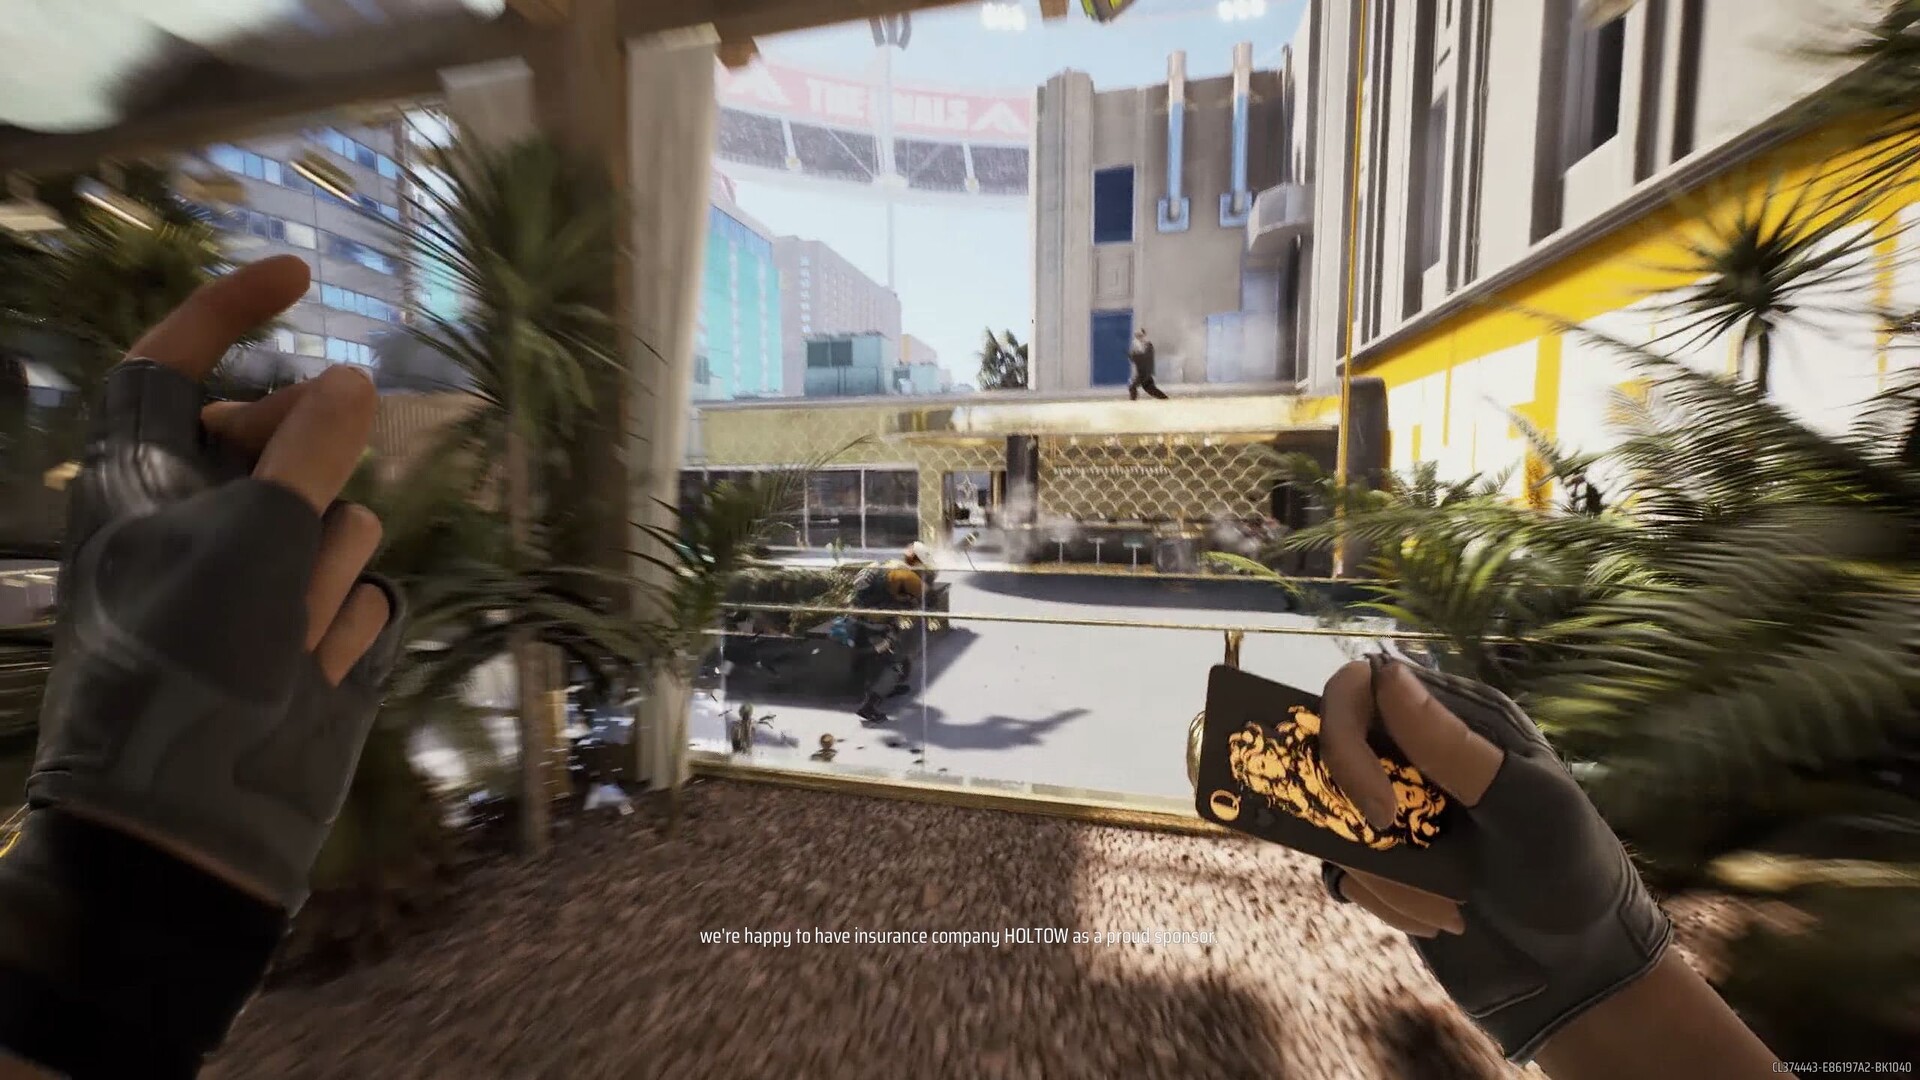
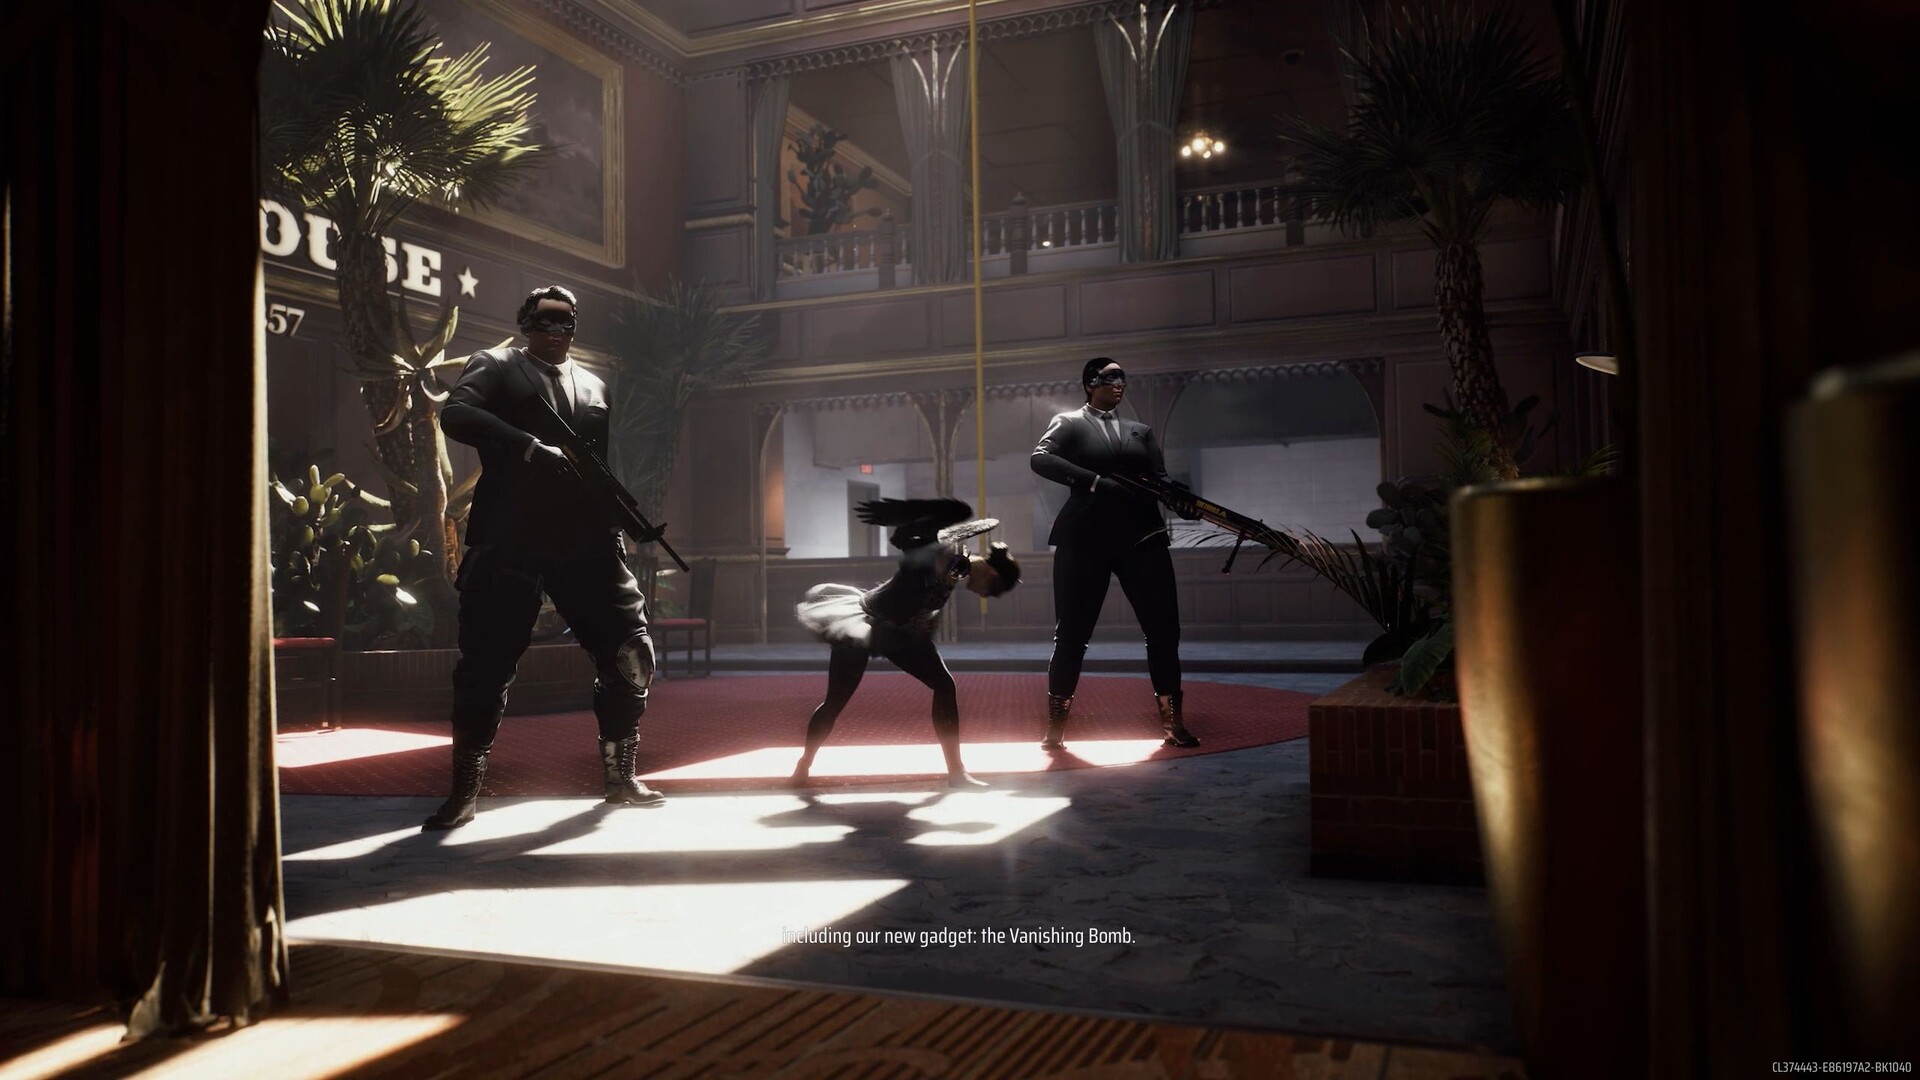
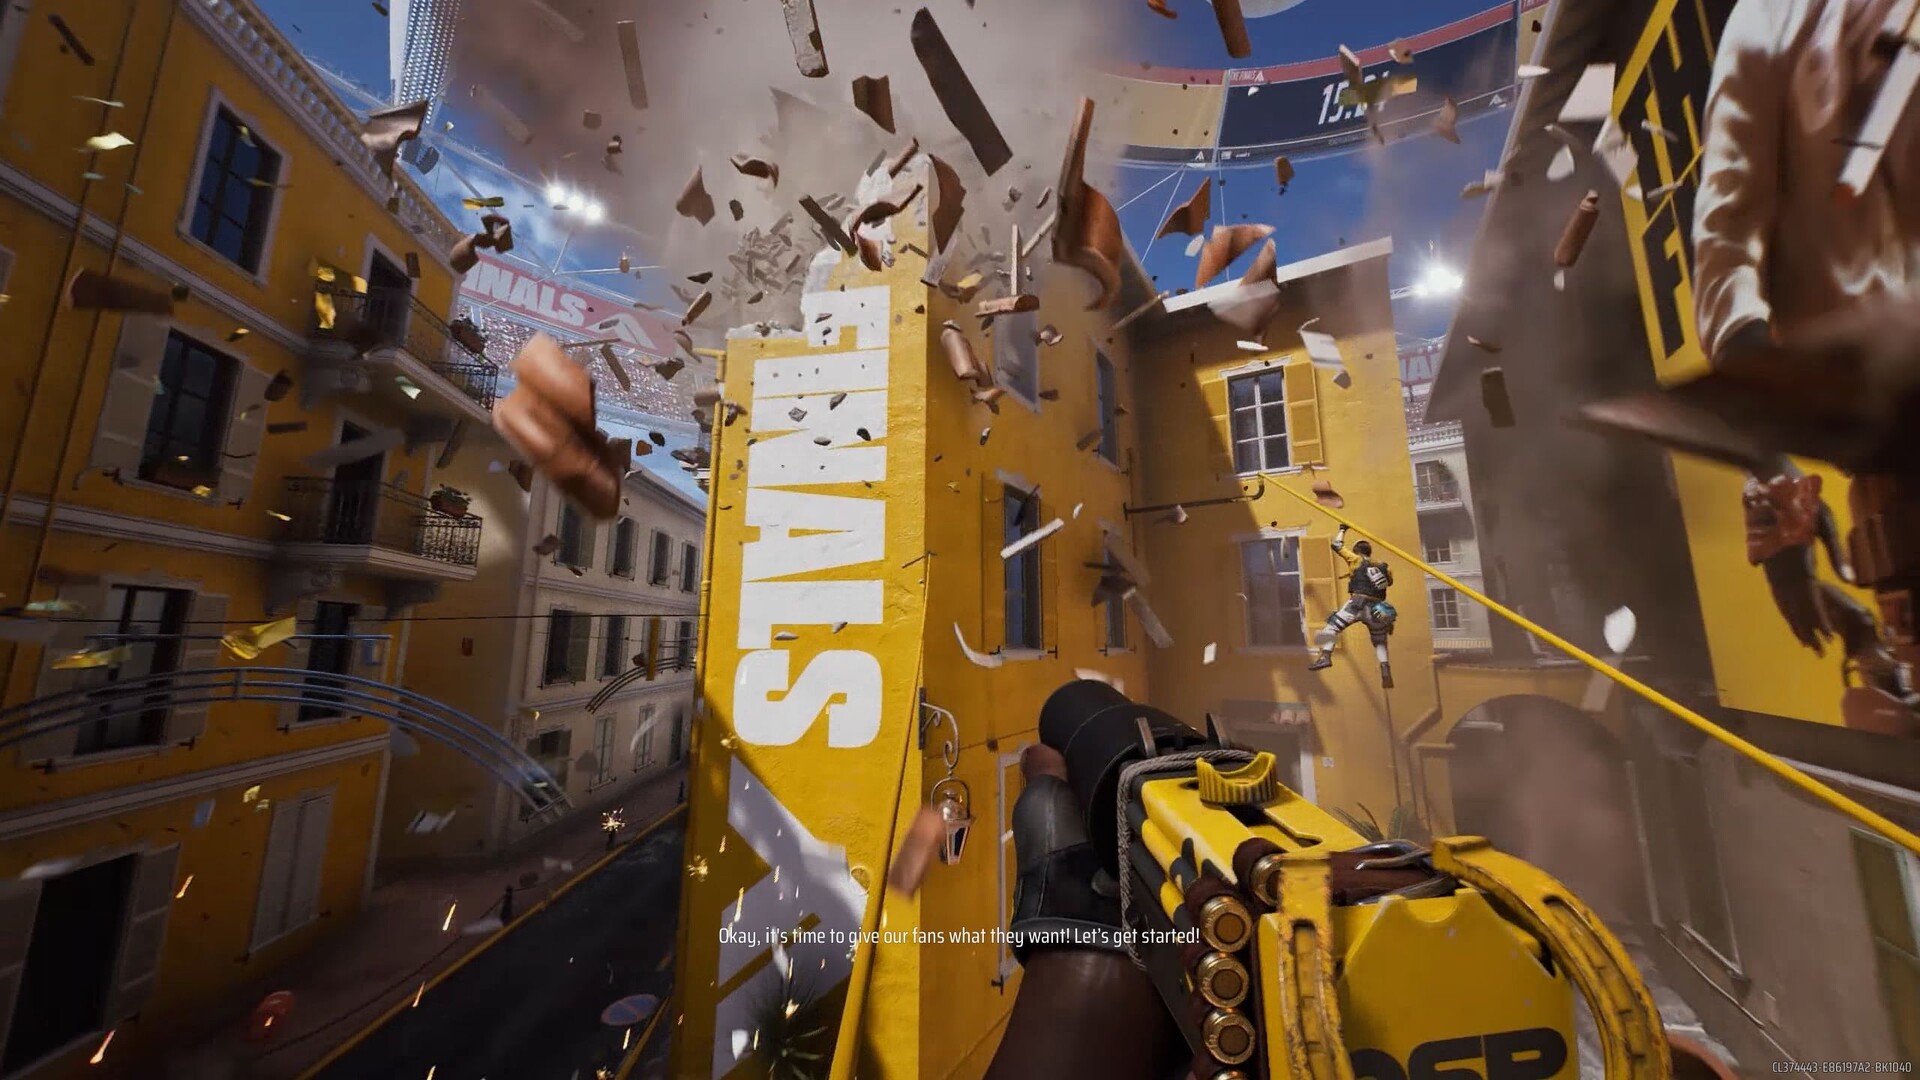
The Free2Play game also impresses in most other respects — be it the sound, movement or gunplay. In general, The Finals plays extremely smoothly and fluidly, unless you are plagued by lags or the like.

The Finals
The Finals
The Finals
The Finals
The Finals
The Finals

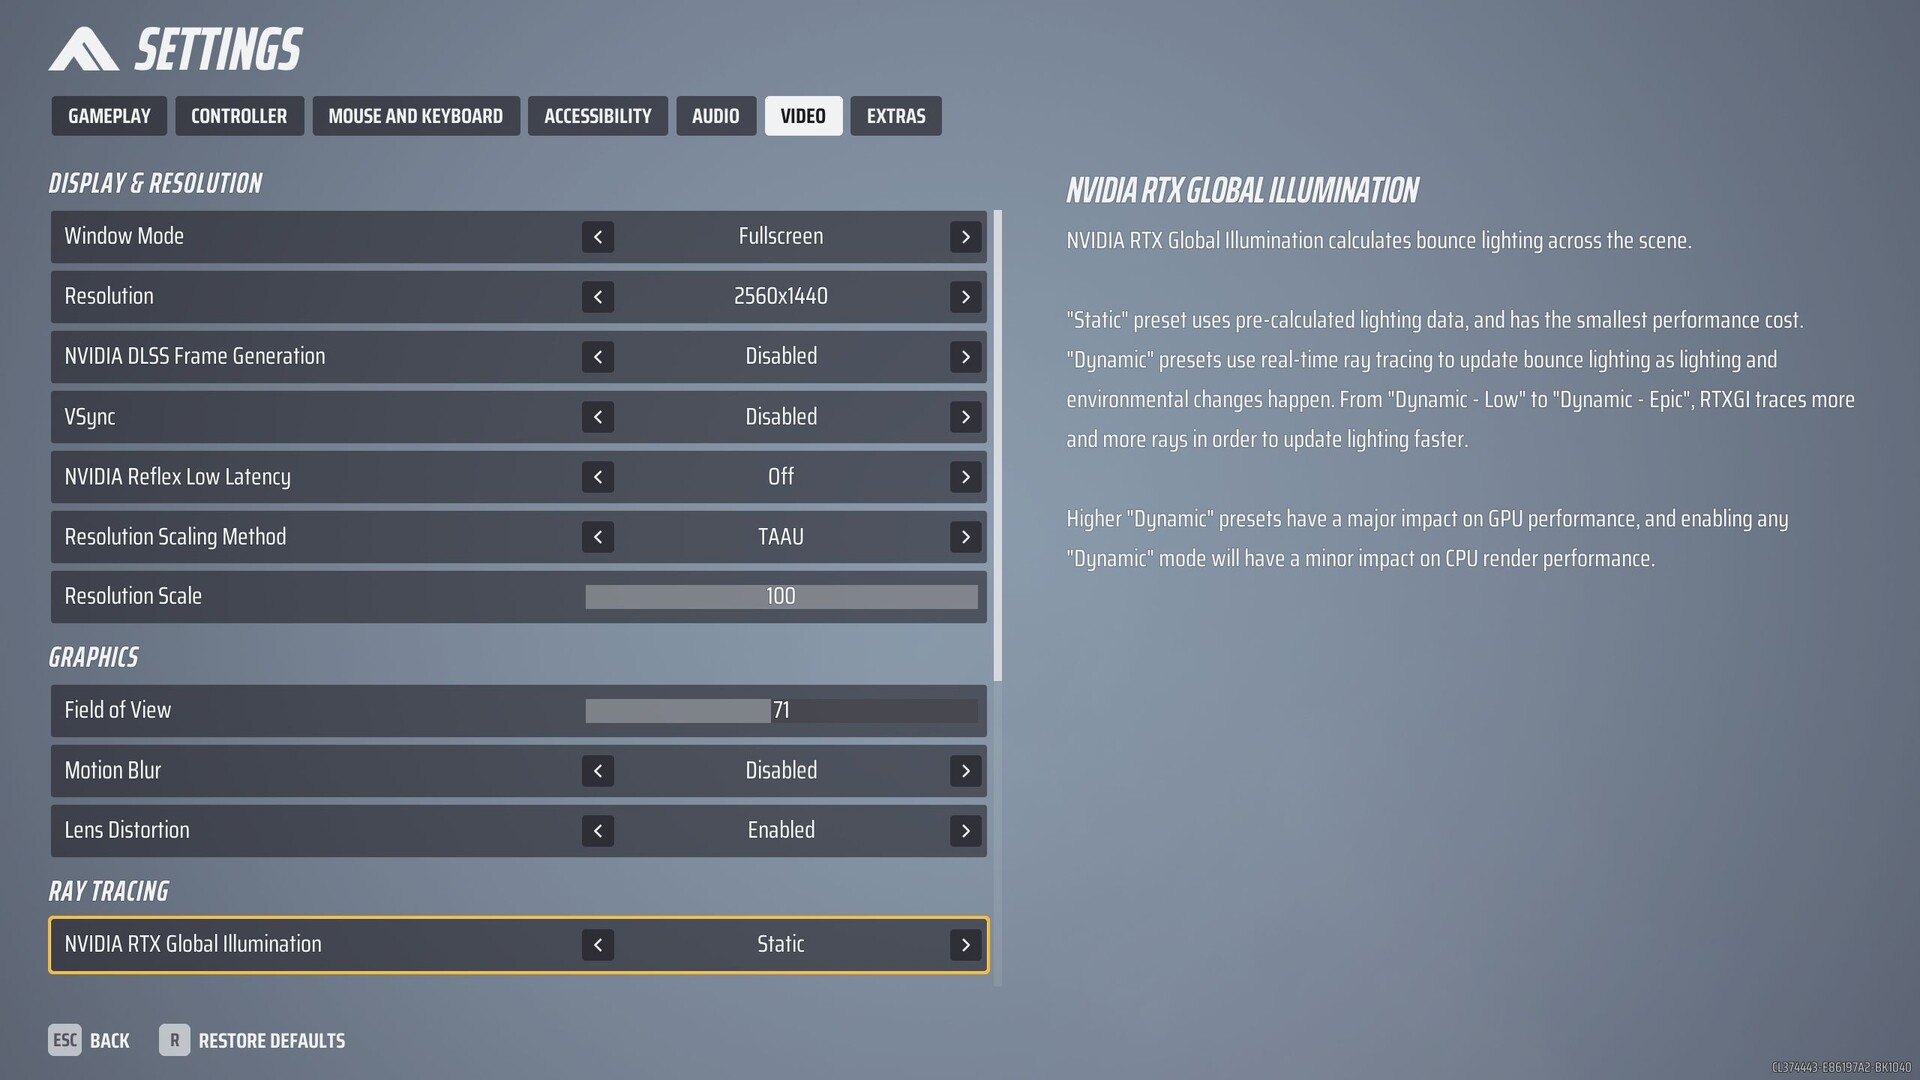
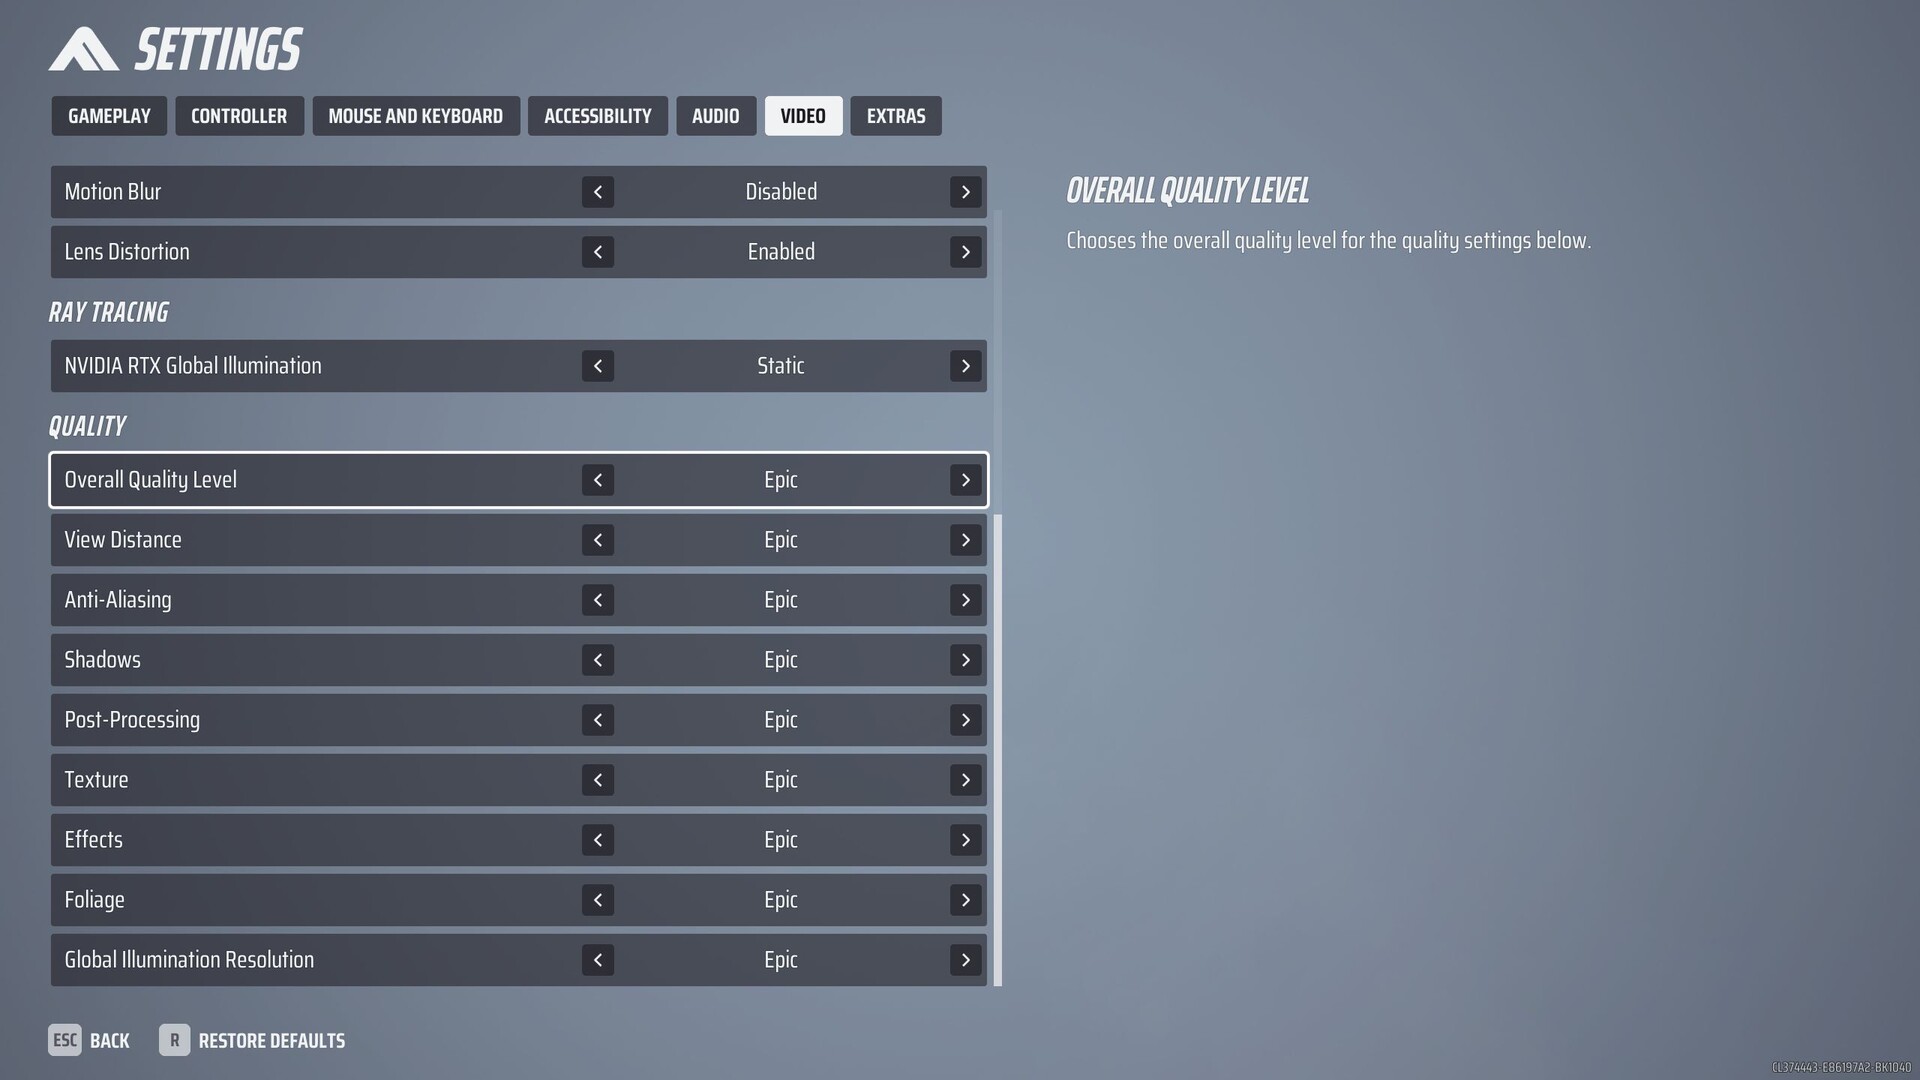
We also have hardly anything to complain about when it comes to its graphics menu. In addition to classics such as resolution, picture mode and VSync, there are also all kinds of modern features such as upscaling (DLSS, FSR, XeSS) and Frame Generation. At the bottom, there are almost 10 quality and detail controls, which can be changed via presets without having to restart the game. Unlike some other games, there are no sample images, but there are at least explanations of the individual settings.

The Finals
The Finals

From a tech standpoint, The Finals makes a mostly clean impression. Although the game takes a little too long to start for our taste, it only takes up around 17 GB on your hard drive.

Benchmark

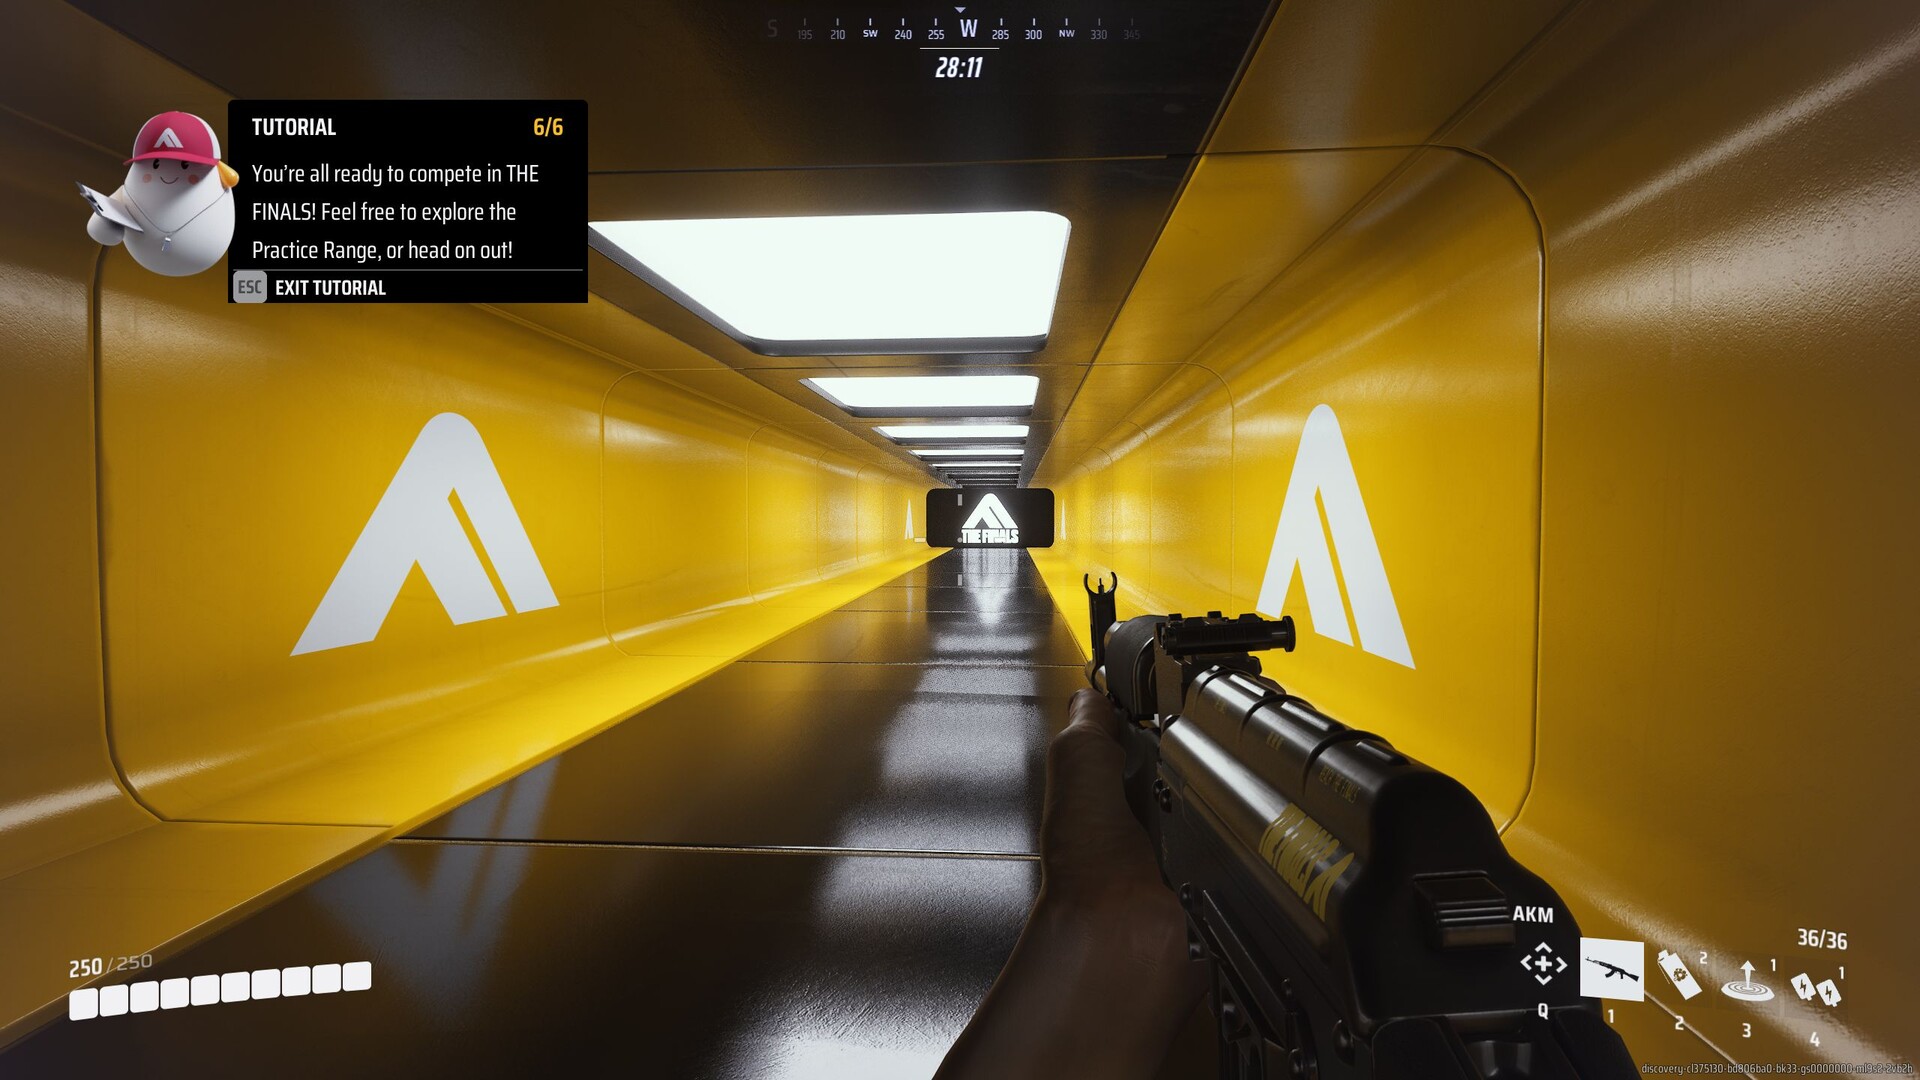
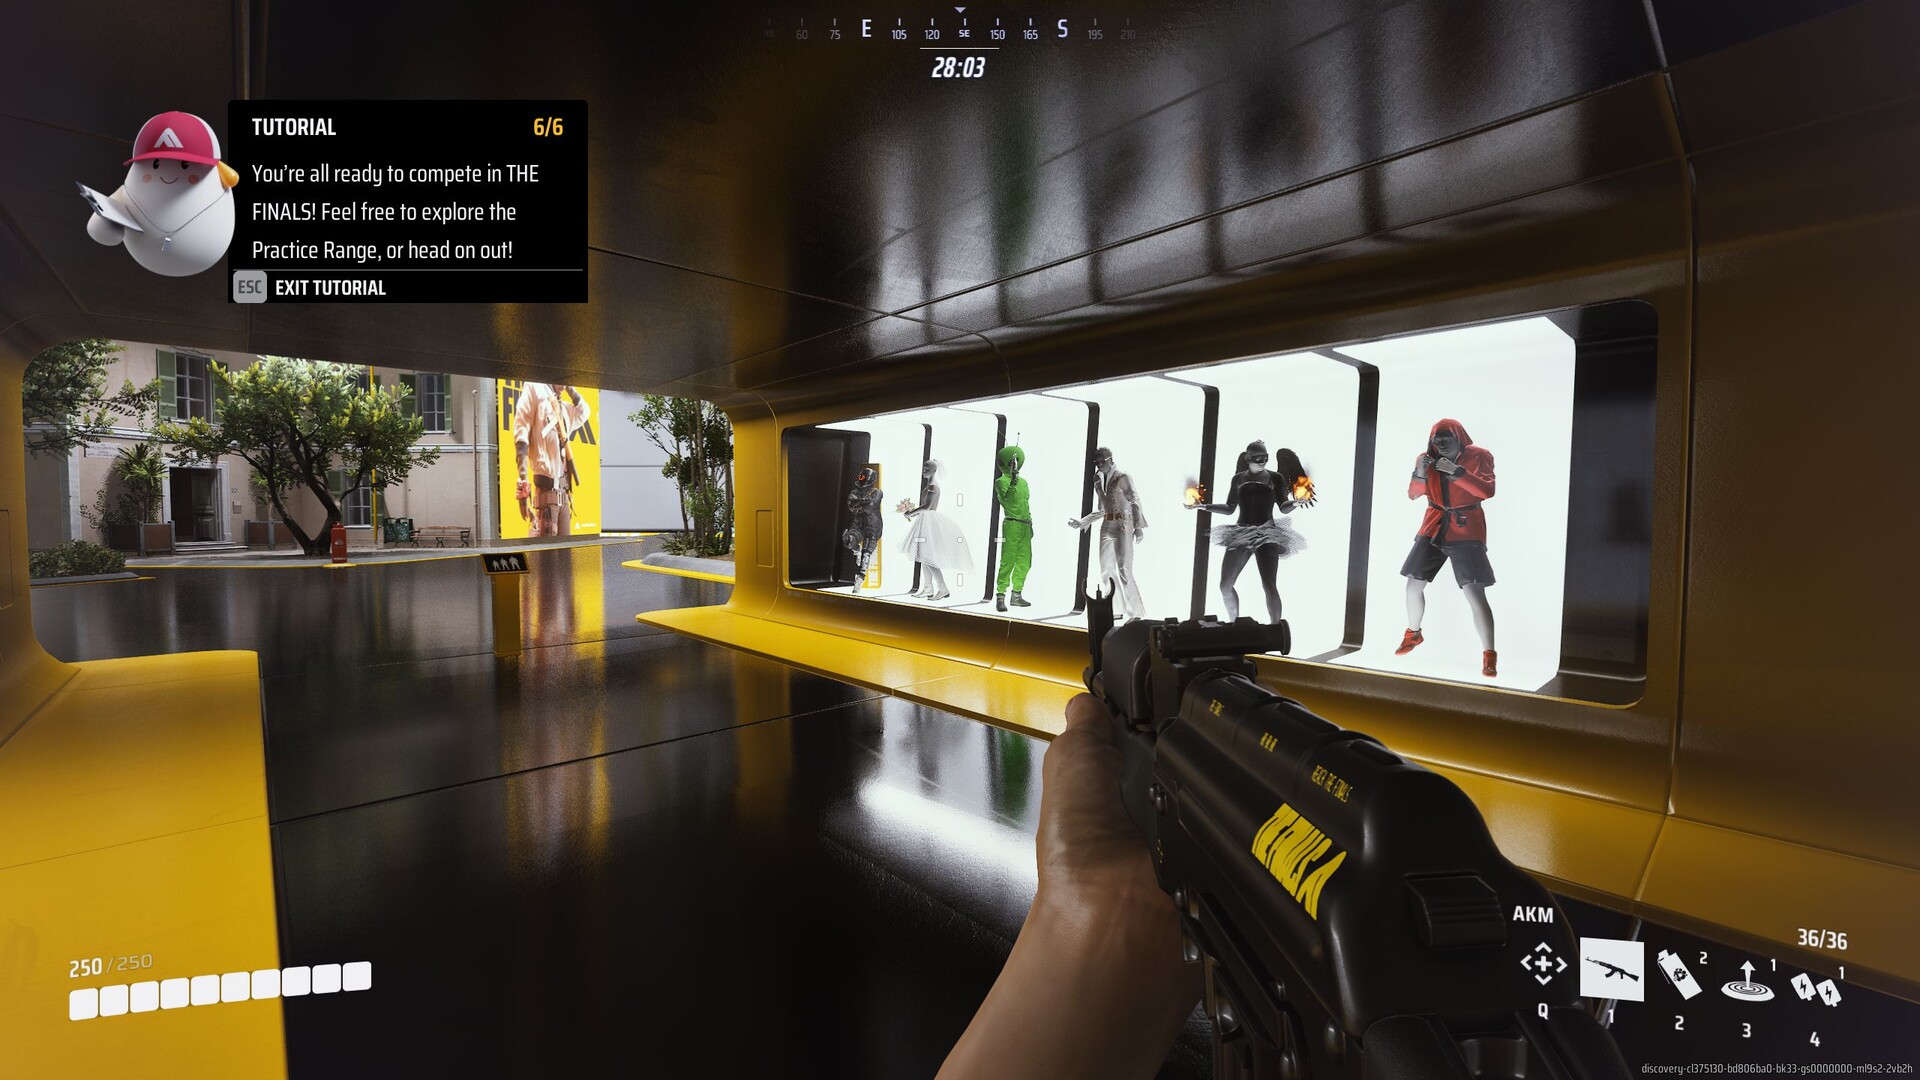
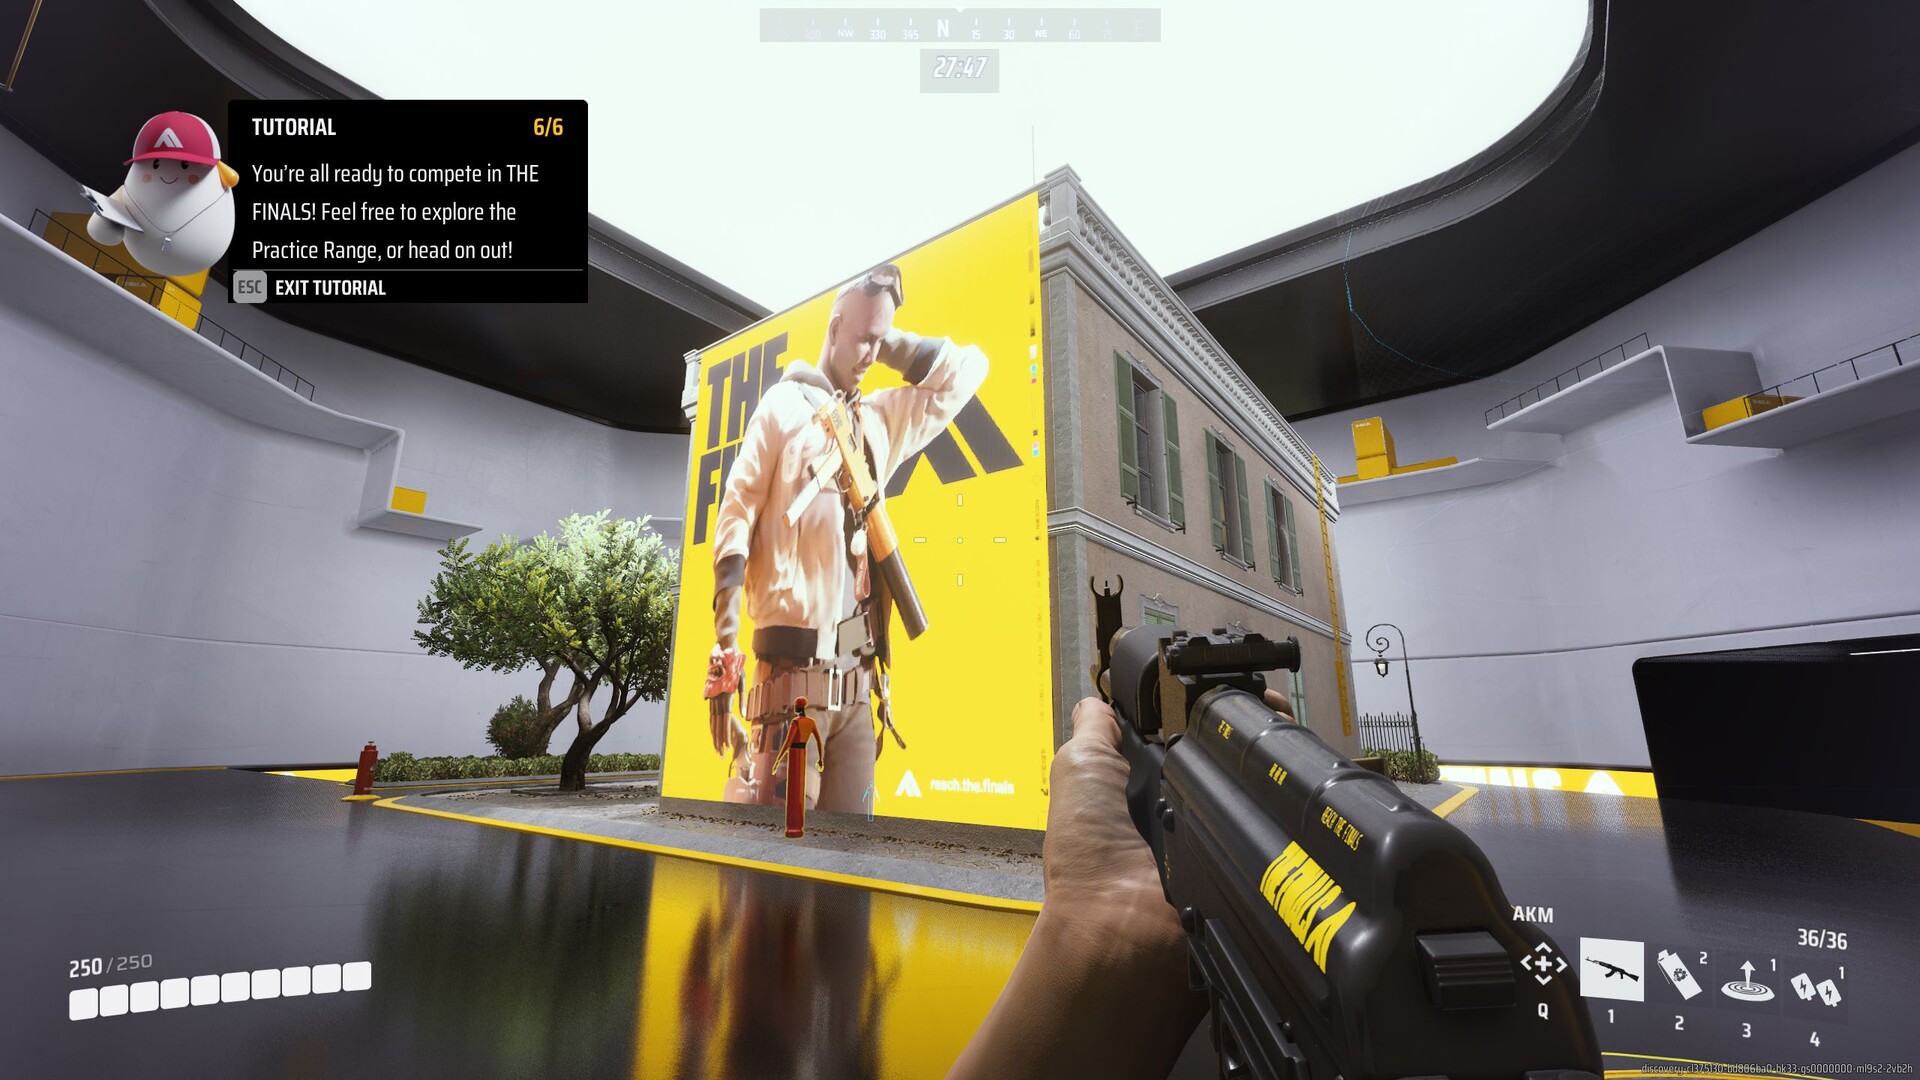
We used the so-called Practice Range for our speed measurements, as this enables constant, reproducible sequences (see video). All-in-all, The Finals' hardware requirements are fairly moderate. Due to possible performance drops during intense scenes (explosions etc.) which can occur during normal gameplay, our benchmark sequence — as a buffer, so to speak — should result in at least 60 FPS.

Results


FHD (1,920 x 1,080)

While iGPUs were hopelessly overwhelmed in the Avatar Frontiers of Pandora test, a Radeon 780M is at least sufficient for 1,920 x 1,080 pixels and a mixture of low to medium details when running The Finals. With a mid-range GPU on the level of the GeForce RTX 4050, you are on the safe side when playing the game Full HD and can also enjoy maximum settings adequately.

The Finals
    1920x1080 Low Preset     1920x1080 Medium Preset     1920x1080 High Preset     1920x1080 Epic Preset
NVIDIA GeForce RTX 4080, i9-13900K
Desktop-PC Asus ROG Strix Z790-F
317 (109.6min, 198.1P0.1, 235P1) fps ∼100%
309 (67.9min, 195.9P0.1, 236P1) fps ∼100%
302 (149.3min, 192.3P0.1, 225P1) fps ∼100%
AMD Radeon RX 7900 XT, i9-13900K
Desktop-PC Asus ROG Strix Z790-F
295 (120.6min, 186.6P0.1, 220P1) fps ∼93%
286 (59.7min, 166.8P0.1, 204P1) fps ∼93%
258 (161.5min, 168.1P0.1, 186.1P1) fps ∼85%
NVIDIA GeForce RTX 4090 Laptop GPU, i9-13900H
Asus ROG Zephyrus M16
193 (52.1min, 59.2P0.1, 103.6P1) fps ∼61%
175.1 (33.8min, 40.2P0.1, 63P1) fps ∼57%
174.1 (31.4min, 42.3P0.1, 67.1P1) fps ∼58%
NVIDIA GeForce RTX 4080 Laptop GPU, i9-13950HX
Razer Blade 16 Mid 23
175.5 (35.4min, 48.6P0.1, 94.8P1) fps ∼55%
174.8 (28.8min, 55.6P0.1, 110.4P1) fps ∼57%
171.4 (14.4min, 57.6P0.1, 104.1P1) fps ∼57%
NVIDIA GeForce RTX 4070 Laptop GPU, i9-13900HX
XMG Pro 15 E23
186.6 (25.4min, 97.2P0.1, 131.9P1) fps ∼59%
180.6 (53min, 97.1P0.1, 124.3P1) fps ∼58%
156.7 (76.4min, 100.5P0.1, 114.6P1) fps ∼52%
NVIDIA GeForce RTX 3080 Ti Laptop GPU, i9-12900H
Asus ROG Strix Scar 17 G733ZX
212 (57.1min, 89.8P0.1, 150.1P1) fps ∼67%
190.1 (42.9min, 83.8P0.1, 133.2P1) fps ∼62%
156.4 (45.7min, 67.4P0.1, 112.9P1) fps ∼52%
NVIDIA GeForce RTX 4060 Laptop GPU, R9 7940HS
Razer Blade 14 Mid 23
176 (72.3min, 95.3P0.1, 127.6P1) fps ∼56%
157.7 (19.9min, 60.1P0.1, 115.6P1) fps ∼51%
126 (38.9min, 73.3P0.1, 93.8P1) fps ∼42%
AMD Radeon RX 7600S, R9 7940HS
Asus TUF Gaming Advantage A16
155.9 (82.3min, 102.8P0.1, 114.9P1) fps ∼49%
133.7 (89.2min, 95P0.1, 100P1) fps ∼43%
100.8 (64.2min, 69.5P0.1, 75.1P1) fps ∼33%
NVIDIA GeForce RTX 4050 Laptop GPU, i7-13700H
Medion Erazer Scout E20
154.7 (72.1min, 84P0.1, 111.7P1) fps ∼49%
133.5 (67min, 74.3P0.1, 95.9P1) fps ∼43%
99.2 (55.1min, 63.8P0.1, 71.7P1) fps ∼33%
AMD Radeon 780M, R9 7940HS
Asus TUF Gaming Advantage A16
70.2 (12.9min, 26.8P0.1, 49.6P1) fps ∼100%
51.7 (10.4min, 12.4P0.1, 37.1P1) fps ∼16%
46.8 (10.7min, 13.5P0.1, 34P1) fps ∼15%
30.6 (19.8min, 19.9P0.1, 20.9P1) fps ∼10%

QHD (2,560 x 1,440)

QHD displays also do not (yet) require a high-end component. Starting with a Radeon RX 7600S, the 60 FPS mark is cracked at 2,560 x 1,440 pixels and the Epic preset.

The Finals
    2560x1440 Epic Preset
NVIDIA GeForce RTX 4080, i9-13900K
Desktop-PC Asus ROG Strix Z790-F
208 (120.6min, 133.8P0.1, 159.1P1) fps ∼100%
AMD Radeon RX 7900 XT, i9-13900K
Desktop-PC Asus ROG Strix Z790-F
172.4 (112.1min, 124P0.1, 133.3P1) fps ∼83%
NVIDIA GeForce RTX 4090 Laptop GPU, i9-13900H
Asus ROG Zephyrus M16
137.2 (37.2min, 49.8P0.1, 94.2P1) fps ∼66%
NVIDIA GeForce RTX 4080 Laptop GPU, i9-13950HX
Razer Blade 16 Mid 23
125.5 (42min, 48.9P0.1, 80.6P1) fps ∼60%
NVIDIA GeForce RTX 3080 Ti Laptop GPU, i9-12900H
Asus ROG Strix Scar 17 G733ZX
100.7 (73min, 73.8P0.1, 77.4P1) fps ∼48%
NVIDIA GeForce RTX 4070 Laptop GPU, i9-13900HX
XMG Pro 15 E23
94.6 (58.2min, 65.2P0.1, 71.9P1) fps ∼45%
NVIDIA GeForce RTX 4060 Laptop GPU, R9 7940HS
Razer Blade 14 Mid 23
77.7 (56min, 56.9P0.1, 61.2P1) fps ∼37%
AMD Radeon RX 7600S, R9 7940HS
Asus TUF Gaming Advantage A16
61.5 (43.5min, 44.4P0.1, 47.7P1) fps ∼30%
NVIDIA GeForce RTX 4050 Laptop GPU, i7-13700H
Medion Erazer Scout E20
54.6 (35.2min, 35.7P0.1, 40.1P1) fps ∼26%

UHD (3,840 x 2,160)

As is so often the case, it only gets really demanding when you hit 4K. A GeForce RTX 4080 or better should be installed in your computer to use the Epic preset.

The Finals
    3840x2160 Epic Preset
NVIDIA GeForce RTX 4080, i9-13900K
Desktop-PC Asus ROG Strix Z790-F
100.3 (44.6min, 73.7P0.1, 78P1) fps ∼100%
AMD Radeon RX 7900 XT, i9-13900K
Desktop-PC Asus ROG Strix Z790-F
83 (30.3min, 63.8P0.1, 66.9P1) fps ∼83%
NVIDIA GeForce RTX 4090 Laptop GPU, i9-13900H
Asus ROG Zephyrus M16
67 (17.3min, 37.3P0.1, 50.3P1) fps ∼67%
NVIDIA GeForce RTX 4080 Laptop GPU, i9-13950HX
Razer Blade 16 Mid 23
60.3 (34.2min, 43.8P0.1, 46.5P1) fps ∼60%
NVIDIA GeForce RTX 3080 Ti Laptop GPU, i9-12900H
Asus ROG Strix Scar 17 G733ZX
47.5 (34.7min, 36P0.1, 38.2P1) fps ∼47%
NVIDIA GeForce RTX 4070 Laptop GPU, i9-13900HX
XMG Pro 15 E23
42.9 (12.3min, 25P0.1, 33P1) fps ∼43%
NVIDIA GeForce RTX 4060 Laptop GPU, R9 7940HS
Razer Blade 14 Mid 23
35.6 (27.2min, 27.4P0.1, 28.1P1) fps ∼35%
AMD Radeon RX 7600S, R9 7940HS
Asus TUF Gaming Advantage A16
27.6 (21.2min, 21.4P0.1, 21.8P1) fps ∼28%
NVIDIA GeForce RTX 4050 Laptop GPU, i7-13700H
Medion Erazer Scout E20
27.3 (19.7min, 19.9P0.1, 21.5P1) fps ∼27%

Ray Tracing & DLSS

Active ray tracing in the form of dynamic global illumination costs surprisingly little performance, resulting in the same GPU recommendation applying in Full HD compared to without RTX. If you switch on Quality DLSS and Frame Generation on 4000-gen Nvidia chips, an RTX 4060 already hits 60 FPS in 4K.

The Finals
    1920x1080 Epic Preset + Epic RTX Global Illumination     3840x2160 Epic Preset + Epic RTX Global Illumination + Quality DLSS + FG
NVIDIA GeForce RTX 4080, i9-13900K
Desktop-PC Asus ROG Strix Z790-F
267 (119.2min, 169.8P0.1, 204P1) fps ∼100%
162.8 (76.6min, 93.8P0.1, 143P1) fps ∼100%
AMD Radeon RX 7900 XT, i9-13900K
Desktop-PC Asus ROG Strix Z790-F
236 (57.6min, 144.6P0.1, 172.2P1) fps ∼88%
NVIDIA GeForce RTX 4090 Laptop GPU, i9-13900H
Asus ROG Zephyrus M16
159.8 (40.5min, 63.6P0.1, 107.8P1) fps ∼60%
109.2 (29min, 40.7P0.1, 64P1) fps ∼67%
NVIDIA GeForce RTX 4080 Laptop GPU, i9-13950HX
Razer Blade 16 Mid 23
158.9 (36.3min, 53.2P0.1, 95P1) fps ∼60%
102.5 (25.7min, 40P0.1, 77.5P1) fps ∼63%
NVIDIA GeForce RTX 3080 Ti Laptop GPU, i9-12900H
Asus ROG Strix Scar 17 G733ZX
143.2 (32.6min, 62P0.1, 103.4P1) fps ∼54%
NVIDIA GeForce RTX 4070 Laptop GPU, i9-13900HX
XMG Pro 15 E23
142.2 (59.3min, 88.9P0.1, 106.5P1) fps ∼53%
70.5 (53min, 54.7P0.1, 57.8P1) fps ∼43%
NVIDIA GeForce RTX 4060 Laptop GPU, R9 7940HS
Razer Blade 14 Mid 23
121.1 (60.6min, 76.7P0.1, 91P1) fps ∼45%
60.1 (26min, 34.8P0.1, 47.9P1) fps ∼37%
NVIDIA GeForce RTX 4050 Laptop GPU, i7-13700H
Medion Erazer Scout E20
96.8 (48.4min, 60.1P0.1, 68.5P1) fps ∼36%
40.6 (29.1min, 30.8P0.1, 33.5P1) fps ∼25%
AMD Radeon RX 7600S, R9 7940HS
Asus TUF Gaming Advantage A16
95 (44.4min, 64.4P0.1, 70P1) fps ∼36%

Overview

Show Restrictions
PosModel< PrevNext >The Finals
 The Finals (2023)
low
1920x1080
Low Preset
med.
1920x1080
Medium Preset
high
1920x1080
High Preset
ultra
1920x1080
Epic Preset
QHD
2560x1440
Epic Preset
4K
3840x2160
Epic Preset

3840x2160
Epic Preset + Epic RTX Global Illumination + Quality DLSS + FG
NVIDIA GeForce RTX 4090
317n2
288.5n2
278n2
285n2
256.5n2
139.8n2
216n2
AMD Radeon RX 7900 XTX
398
390
384
319
215
109.1
NVIDIA GeForce RTX 4080 Super
425.5n2
387n2
384n2
320.5n2
213n2
102.65n2
167.25n2
NVIDIA GeForce RTX 4080
317
309
302
208
100.3
162.8
AMD Radeon RX 7900 XT
295
286
258
172.4
83
AMD Radeon RX 6950 XT
357
332
306
236
148.5
70.8
NVIDIA GeForce RTX 4090 Laptop GPU
228
204.5n2
194.55n2
192.55n2
142.3n2
67
109.2
NVIDIA GeForce RTX 3090
383.5n2
330.5n2
296.5n2
237n2
155.1n2
77.4n2
NVIDIA GeForce RTX 4080 Laptop GPU
188.9
177.4n2
172.75n2
171.4n3
125.5n3
60.3
102.5
NVIDIA GeForce RTX 3080 12 GB
323
279
218
144.7
72.1
AMD Radeon RX 6800
350
261
232
171.7
107.2
49.7
AMD Radeon RX 7700 XT
347
286
253
189.3
118.9
54.7
NVIDIA Titan RTX
324
250
225
171.5
111.6
55.1
NVIDIA GeForce RTX 3070 Ti
346
271
238
184.8
118.7
57.8
NVIDIA GeForce RTX 3080 Ti Laptop GPU
212
190.1
156.4
100.7
47.5
NVIDIA GeForce RTX 4070 Laptop GPU
186.6
174.3n2
143.45n2
88.7n2
42.9
70.5
NVIDIA GeForce RTX 3070
269
228
174.1
112
53.9
AMD Radeon RX 6750 XT
318
229
200
147
88.8
39.3
AMD Radeon RX 6700 XT
298
215
188.9
137.4
84
37.2
PosModel< PrevNext >The Finals
low med. high ultra QHD 4K
NVIDIA GeForce RTX 3080 Laptop GPU
141.3
88.1
42.3
NVIDIA GeForce RTX 3060 Ti
318
234
206
154.8
96.7
46.3
Intel Arc A770
204
161.7
146.2
121.5
83
40.5
AMD Radeon RX 7600
291
210
186.4
135.6
81.9
35.3
NVIDIA GeForce RTX 4060 Laptop GPU
176
157.7
126
77.7
35.6
60.1
AMD Radeon RX 6650 XT
269
195
169.6
122.9
73.7
33.4
AMD Radeon RX 6600 XT
113
69.1
31.3
NVIDIA GeForce RTX 3070 Laptop GPU
222
181.7
160.6
127.2
80.2
37.6
AMD Radeon RX 7600M XT
147.5
115.3
69.2
Intel Arc A750
189.5
148.8
134.6
109.3
72.1
35.1
NVIDIA Titan X Pascal
200
145.2
128.2
97.4
61.4
29.2
NVIDIA GeForce RTX 2070 Super (Desktop)
252
183.9
160.6
122.6
75.7
35.1
AMD Radeon RX 5700 XT (Desktop)
212
158.2
136.9
98.9
62.2
30.1
AMD Radeon RX 7600S
155.9
133.7
100.8
61.5
27.6
Intel Arc A580
183.8
142.4
128.4
101.3
64.4
30.3
NVIDIA GeForce RTX 2060 Super (Desktop)
220
158.3
139.7
106.9
65.4
30.1
AMD Radeon RX 6600
208
150
130.3
94.3
55.9
24.9
AMD Radeon RX 5700 (Desktop)
187.3
135.2
119.5
87.7
54
26.1
AMD Radeon RX 5600 XT (Desktop)
164.9
107.7
129
80.4
54.2
25.3
NVIDIA GeForce GTX 1660 Super (Desktop)
165.4
116.3
101.7
75.3
44.1
18.1
PosModel< PrevNext >The Finals
low med. high ultra QHD 4K
AMD Radeon RX 6500 XT
107.8
75.2
65.8
48.6
28.2
6
AMD Radeon RX 5500 XT (Desktop)
135.1
99.7
82.6
62.6
36.7
16.7
NVIDIA GeForce RTX 4050 Laptop GPU
142.45n2
123.6n2
95.5n2
54.6
27.3
40.6
Intel Arc A730M
144.7
109.2
97
77.4
48.9
22.7
NVIDIA GeForce GTX 1660 Ti Mobile
136.3
112.2
98.6
72.3
NVIDIA GeForce GTX 1660 (Desktop)
153.7
109.7
95.8
70.1
42
16.3
NVIDIA GeForce GTX 1650 Super (Desktop)
142.1
98.9
85.9
61.3
35.9
11.1
NVIDIA GeForce RTX 3050 4GB Laptop GPU
110.1
80.3
71.4
51.3
AMD Radeon RX 6500M
94
84.4
77.1
56.7
NVIDIA GeForce GTX 1650 Ti Mobile
101.7
77.9
68.4
49.5
NVIDIA GeForce RTX 2050 Mobile
107.7
76.4
67.8
50.9
NVIDIA GeForce GTX 1650 Mobile
100.2
70.4
60.4
43.3
Intel Arc A380
86
62.4
53.8
40.5
Intel Arc A310
75
53.1
46.6
34.6
Intel Arc 8-Cores iGPU
99.5
68.9
60.5
46.4
Intel Arc 7-Cores iGPU
70
47.7
39.7
34.6
AMD Radeon 780M
73.2n2
55.1n2
49.55n2
33.8n2
22.1
9.7
NVIDIA GeForce MX350
31.5
22.4
17
12.8
NVIDIA GeForce MX250
31
21.8
18.5
11
Intel UHD Graphics 32EUs (Alder Lake)
16.9
11.9
10.4
7.74
PosModel< PrevNext >The Finals
low med. high ultra QHD 4K
Intel UHD Graphics Xe 32EUs (Tiger Lake-H)
24.3
16.8
12.8
AMD Radeon RX Vega 6 (Ryzen 4000/5000)
21.4
16.2
14.2
10.2
Intel UHD Graphics Xe 16EUs (Tiger Lake-H)
9.88
(-) * Smaller values are better. / n123 Number of benchmarks for this median value / * Approximate position


Legend
5Stutters – This game is very likely to stutter and have poor frame rates. Based on all known benchmarks using the specified graphical settings, average frame rates are expected to fall below 25fps
May Stutter – This graphics card has not been explicitly tested on this game. Based on interpolated information from surrounding graphics cards of similar performance levels, stutters and poor frame rates are expected.
30Fluent – Based on all known benchmarks using the specified graphical settings, this game should run at or above 25fps
40Fluent – Based on all known benchmarks using the specified graphical settings, this game should run at or above 35fps
60Fluent – Based on all known benchmarks using the specified graphical settings, this game should run at or above 58fps
May Run Fluently – This graphics card has not been explicitly tested on this game. Based on interpolated information from surrounding graphics cards of similar performance levels, fluent frame rates are expected.
?Uncertain – This graphics card experienced unexpected performance issues during testing for this game. A slower card may be able to achieve better and more consistent frame rates than this particular GPU running the same benchmark scene.
Uncertain – This graphics card has not been explicitly tested on this game and no reliable interpolation can be made based on the performances of surrounding cards of the same class or family.
The value in the fields displays the average frame rate of all values in the database. Move your cursor over the value to see individual results.

Test system details

Laptop Graphics card Processor RAM
Asus ROG Zephyrus M16 Nvidia GeForce RTX 4090 @150 W TGP (16 GB GDDR6X) Intel Core i9-13900H 2 x 16 GB DDR5
Razer Blade 16 Mid 23 Nvidia GeForce RTX 4080 @175 W TGP (12 GB GDDR6X) Intel Core i9-13950HX 2 x 16 GB DDR5
XMG Pro 15 E23 Nvidia GeForce RTX 4070 @140 W TGP (8 GB GDDR6) Intel Core i9-13900HX 2 x 16 GB DDR5
Razer Blade 14 Mid 23 Nvidia GeForce RTX 4060 @140 W TGP (8 GB GDDR6) AMD Ryzen 9 7940HS 2 x 8 GB DDR5
Medion Erazer Scout E20 Nvidia GeForce RTX 4050 @100 W TGP (6 GB GDDR6) Intel Core i7-13700H 2 x 8 GB DDR5
Asus ROG Strix Scar 17 Nvidia GeForce RTX 3080 Ti @150 W TGP (16 GB GDDR6) Intel Core i9-12900H 2 x 16 GB DDR5
Asus TUF Gaming Advantage A16 AMD Radeon RX 7600S (8 GB GDDR6) & AMD Radeon 780M AMD Ryzen 9 7940HS 2 x 8 GB DDR5
Tower PC Graphics card Processor RAM
Asus ROG Strix Z790-F Nvidia GeForce RTX 4080 (16 GB GDDR6X)
AMD Radeon RX 7900 XT (20 GB GDDR6)
Intel Core i9-13900K 2 x 24 GB DDR5 G.Skill
4K monitor Operating system Nvidia driver AMD driver
Philips Evnia 42M2N8900 Windows 11 ForceWare 546.33 Adrenalin 23.12.1
static version load dynamic
Loading Comments
Comment on this article
Please share our article, every link counts!
> Expert Reviews and News on Laptops, Smartphones and Tech Innovations > Reviews > The Finals review: Laptop and desktop benchmarks
Florian Glaser, 2023-12-20 (Update: 2023-12-20)