Notebook reviews with AMD Radeon 890M graphics card
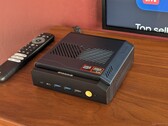
BOSGAME VTA-439 review: Ryzen AI 9 HX 470 is a great fit for mini PCs
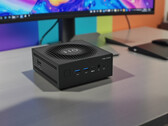
Bosgame is back with a striking new industrial design for its latest mini PC equipped with the latest AMD Zen 5c Gorgon Point processor. It may be a little big, but it supports more SSD slots than most competitors.
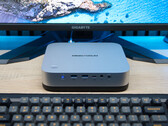
AMD Ryzen AI 9 HX 470, Radeon 890M, 764 gGeekom A9 Max mini PC review: The new Ryzen AI chip falls short of its potential
The Geekom A9 Max combines the AMD Ryzen AI 9 HX 470 with a compact, high-quality housing and extensive connectivity. In the test, the mini PC had to show how well cooling, power consumption, and performance harmonize in everyday use and whether the built-in hardware can actually exploit its potential.
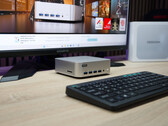
AMD Ryzen AI 9 HX 470, Radeon 890M, 686 gMinisforum AI X1 Pro with Ryzen AI 9 HX 470 review: Mini-PC upgrade for office, gaming & AI with RAM bottleneck?
Minisforum is updating the AI X1 Pro and is now giving the compact powerhouse the AMD Ryzen AI 9 HX 470, bringing an even more powerful APU to the fore that promises additional reserves, especially for demanding workloads and AI applications. But can the new processor actually meet the high expectations in practice?
AMD Ryzen AI 9 HX 470, Radeon 890M, 1.3 kgMini-PC with top price-performance reviewed: Peladn HO5 with Ryzen AI 9 HX 370 as an insider tip against Geekom and Minisforum
The Peladn HO5 with AMD Ryzen AI 9 HX 370 and Radeon 890M is a powerful mini PC for around $1,000. In our review, we examine performance, efficiency, volume, and features, including OCuLink. Can the compact Strix Point computer stand up to Minisforum and Geekom?
AMD Ryzen AI 9 HX 370, Radeon 890M, 575 gGaming handheld with great 144 Hz OLED and detachable controllers - Lenovo Legion Go 2 review
Lenovo is stepping things up by equipping its gaming handheld with a high-quality OLED panel and the AMD Ryzen Z2 Extreme. The detachable controllers are still included. However, the price comes in at a hefty €1,499 (approx. $1,777), making it one of the most expensive handhelds on the market.
AMD Ryzen Z2 Extreme, Radeon 890M, 8.8", 922 gLenovo ThinkPad P16s Gen 4 21RX000YGE: AMD Ryzen AI 9 HX PRO 370, 16.00", 2 kg
Review » This is the most powerful 16-inch AMD ThinkPad laptop: Lenovo ThinkPad P16s Gen 4 review with Ryzen AI 9 HX
MSI Claw A8 BZ2EM: AMD Ryzen Z2 Extreme, 8.00", 0.8 kg
Review » 8-inch gaming handheld now also with AMD - MSI Claw A8 review
Sapphire Edge AI, Ryzen AI 9 HX 370: AMD Ryzen AI 9 HX 370, 0.4 kg
Review » Sapphire Edge AI: Mini-PC comeback with AMD Ryzen AI 9 HX 370 and magnetic lid review
Minisforum N5 Pro: AMD Ryzen AI 9 HX PRO 370, 5 kg
Review » Minisforum N5 Pro: World's first AI NAS with AMD Ryzen AI 9 HX PRO 370 - IFA 2025 Award winner review
Asus ROG Xbox Ally X: AMD Ryzen Z2 Extreme, 7.00", 0.7 kg
Review » Full-screen Xbox experience for gaming handhelds - Asus ROG Xbox Ally X review
Geekom A9 Max, AI 9 HX 370: AMD Ryzen AI 9 HX 370, 0.7 kg
Review » Best Geekom mini PC ever? Geekom A9 Max review with AMD Ryzen AI 9 HX 370 for $999
Tuxedo Infinity Book Pro 14 Gen10 AMD: AMD Ryzen AI 9 HX 370, 14.00", 1.5 kg
Review » Tuxedo Infinity Book Pro 14 Gen10 Review - Linux ultrabook with AMD Zen 5 & 128 GB RAM
Lenovo ThinkPad P14s Gen 6 21RV0017GE: AMD Ryzen AI 9 HX PRO 370, 14.00", 1.4 kg
Review » Most powerful AMD 14-inch ThinkPad with Ryzen AI 9 HX: Lenovo ThinkPad P14s Gen 6 AMD laptop review
Acemagic F3A: AMD Ryzen AI 9 HX 370, 1 kg
Review » The affordable mini PC with an AMD Ryzen AI 9 HX 370 that costs less than $700 - Detailed review of the Acemagic F3A
Framework Laptop 13.5 Ryzen AI 9 HX 370: AMD Ryzen AI 9 HX 370, 13.50", 1.3 kg
Review » Framework Laptop 13.5 Ryzen AI 9 review: Skip the Intel version for better performance
ONEXPLAYER X1 Pro GA15H: AMD Ryzen AI 9 HX 370, 10.95", 0.9 kg
Review » XL gaming handheld, tablet and laptop: OneXplayer X1 Pro review
Minisforum AI X1 Pro, HX 370: AMD Ryzen AI 9 HX 370, 1.4 kg
Review » Minisforum AI X1 Pro review: An all-round mini PC for the office, multimedia, gaming and creative tasks
HP EliteBook X G1a 14 AI: AMD Ryzen AI 9 HX PRO 375, 14.00", 1.5 kg
Review » HP EliteBook X G1a 14 AI review: Supercharged business laptop with AMD Ryzen AI 9 HX
GMK EVO-X1: AMD Ryzen AI 9 HX 370, 0.6 kg
Review » GMKtec EVO-X1 mini PC review: New boxy design with Oculink and Ryzen AI 9
GPD Pocket 4: AMD Ryzen AI 9 HX 370, 8.80", 0.8 kg
Review » GPD Pocket 4 Ryzen AI 9 handheld PC review: Small, fast, and oh so adorable
Minisforum EliteMini AI370: AMD Ryzen AI 9 HX 370, 0.5 kg
Review » Minisforum EliteMini AI370 review: The mini PC sets new standards with an AMD Zen 5 Strix Point APU
Beelink SER9: AMD Ryzen AI 9 HX 370, 0.8 kg
Review » Beelink SER9 review: AMD Zen 5 makes this mini PC faster than ever
HP OmniBook Ultra 14: AMD Ryzen AI 9 HX 375, 14.00", 1.5 kg
Review » Ryzen AI 9 HX 375 performance debut: HP OmniBook Ultra 14 laptop review
Asus VivoBook S 14 OLED M5406WA: AMD Ryzen AI 9 HX 370, 14.00", 1.3 kg
Review » Asus VivoBook S 14 OLED laptop review: Successful performance of the Ryzen AI 9 HX 370
Asus ProArt P16 H7606WI: AMD Ryzen AI 9 HX 370
Review » AMD Zen 5 Strix Point CPU analysis - Ryzen AI 9 HX 370 versus Intel Core Ultra, Apple M3 and Qualcomm Snapdragon X Elite
Asus Zenbook S 16 UM5606-RK333W: AMD Ryzen AI 9 HX 370, 16.00", 1.5 kg
Review » AMD Zen 5 Strix Point CPU analysis - Ryzen AI 9 HX 370 versus Intel Core Ultra, Apple M3 and Qualcomm Snapdragon X Elite
Asus ProArt P16 H7606WI: AMD Ryzen AI 9 HX 370
Review » AMD Zen 5 Strix Point iGPU analysis - Radeon 890M versus Intel Arc Graphics, Apple M3 and Qualcomm Adreno X1-85
Asus ProArt PX13 HN7306: AMD Ryzen AI 9 HX 370
Review » AMD Zen 5 Strix Point iGPU analysis - Radeon 890M versus Intel Arc Graphics, Apple M3 and Qualcomm Adreno X1-85
Asus Zenbook S 16 UM5606-RK333W: AMD Ryzen AI 9 HX 370, 16.00", 1.5 kg
Review » AMD Zen 5 Strix Point iGPU analysis - Radeon 890M versus Intel Arc Graphics, Apple M3 and Qualcomm Adreno X1-85
Review » Asus Zenbook S 16 laptop review - The first Copilot+ laptop with AMD Zen 5 inside a 1.3-cm-thick case
Lenovo ThinkPad P14s Gen 6 21RV0017GE: AMD Ryzen AI 9 HX PRO 370, 14.00", 1.4 kg
External Review » Lenovo ThinkPad P14s Gen 6 21RV0017GE
Asus Zenbook S16 UM5606GA: AMD Ryzen AI 9 HX 470, 16.00", 1.5 kg
External Review » Asus Zenbook S16 UM5606GA
MSI Prestige A16 AI+ A3HMG: AMD Ryzen AI 9 HX 370, 16.00", 2 kg
External Review » MSI Prestige A16 AI+ A3HMG
Lenovo Legion Go 2: AMD Ryzen Z2 Extreme, 8.80", 0.9 kg
External Review » Lenovo Legion Go 2
Asus ROG Xbox Ally X: AMD Ryzen Z2 Extreme, 7.00", 0.7 kg
External Review » Asus ROG Xbox Ally X
MSI Claw A8 BZ2EM: AMD Ryzen Z2 Extreme, 8.00", 0.8 kg
External Review » MSI Claw A8 BZ2EM
Framework Laptop 13.5 Ryzen AI 9 HX 370: AMD Ryzen AI 9 HX 370, 13.50", 1.3 kg
External Review » Framework Laptop 13.5 Ryzen AI 9 HX 370
HP EliteBook X G1a 14 AI: AMD Ryzen AI 9 HX PRO 375, 14.00", 1.5 kg
External Review » HP EliteBook X G1a 14 AI
MSI Stealth A16 AI+ A3XVGG, HX 370: AMD Ryzen AI 9 HX 370, 16.00", 2.1 kg
External Review » MSI Stealth A16 AI+ A3XVGG, HX 370
HP OmniBook Ultra 14: AMD Ryzen AI 9 HX 375, 14.00", 1.5 kg
External Review » HP OmniBook Ultra 14
HP EliteBook X G1a: AMD Ryzen AI 9 HX 375, 14.00", 1.2 kg
External Review » HP EliteBook X G1a
Asus VivoBook S 14 OLED M5406WA: AMD Ryzen AI 9 HX 370, 14.00", 1.3 kg
External Review » Asus VivoBook S 14 OLED M5406WA
Asus Zenbook S 16 UM5606-RK333W: AMD Ryzen AI 9 HX 370, 16.00", 1.5 kg
External Review » Asus Zenbook S16 UM5606
BOSGAME VTA-439: AMD Ryzen AI 9 HX 470, 0.8 kg
» Ryzen AI 9 HX 470 vs. Ryzen AI 9 HX 370: More expensive but barely any faster
Acemagic F3A: AMD Ryzen AI 9 HX 370, 1 kg
» Acemagic anniversary 2026: Big discount campaign on mini PCs, laptops and NAS systems
Geekom A9 Max, AI 9 HX 470: AMD Ryzen AI 9 HX 470, 0.7 kg
» Geekom A9 Max now significantly cheaper: Ryzen AI mini PC with 32 GB RAM on offer
» Geekom A9 Max focuses on upgradeability - but is it really worth it?
Minisforum AI X1 Pro, HX 470: AMD Ryzen AI 9 HX 470, 1.3 kg
» Compact, high-quality, powerful connectivity - Minisforum AI X1 Pro with Ryzen AI 9 HX 470 reviewed
Lenovo ThinkPad P16s Gen 4 21RX000YGE: AMD Ryzen AI 9 HX PRO 370, 16.00", 2 kg
» 64 GB RAM, 4K display, 56% off: Lenovo ThinkPad P16 Gen 2 laptop with RTX 3500 Ada GPU gets big discount
Lenovo ThinkPad P14s Gen 6 21RV0017GE: AMD Ryzen AI 9 HX PRO 370, 14.00", 1.4 kg
» AMD Ryzen AI 9 HX-powered Lenovo ThinkPad P14s with 96GB RAM gets 45% price cut
Lenovo ThinkPad P16s Gen 4 21RX000YGE: AMD Ryzen AI 9 HX PRO 370, 16.00", 2 kg
» AMD-powered Lenovo ThinkPad P16s with 96 GB DDR5 RAM gets $1,484 discount
Peladn HO5, AI 9 HX 370: AMD Ryzen AI 9 HX 370, 0.6 kg
» High performance, fair price: Peladn HO5 Mini-PC scores with a strong price-performance ratio
Lenovo Legion Go 2: AMD Ryzen Z2 Extreme, 8.80", 0.9 kg
» Lenovo's Legion Go 2 is also available with the slower AMD Ryzen Z2, but SteamOS still will take longer
» €1,500 for Lenovo's Legion Go 2 gaming handheld with the Z2 Extreme is just too much
Lenovo ThinkPad P16s Gen 4 21RX000YGE: AMD Ryzen AI 9 HX PRO 370, 16.00", 2 kg
» No OLED on Strix Point ThinkPads: Lenovo artificially limits its AMD models to WUXGA IPS
MSI Claw A8 BZ2EM: AMD Ryzen Z2 Extreme, 8.00", 0.8 kg
» The new AMD version of the MSI Claw A8 is worse than the Intel version, despite the same price
Framework Laptop 13.5 Ryzen AI 9 HX 370: AMD Ryzen AI 9 HX 370, 13.50", 1.3 kg
» Framework Laptop receives another price increase after just one week
Sapphire Edge AI, Ryzen AI 9 HX 370: AMD Ryzen AI 9 HX 370, 0.4 kg
» Sapphire Edge AI review: Mini PC comeback with AI power and AMD Ryzen AI 9 HX 370
Lenovo ThinkPad P14s Gen 6 21RV0017GE: AMD Ryzen AI 9 HX PRO 370, 14.00", 1.4 kg
» Lenovo ThinkPad P14s Gen 6 with 64 GB RAM and 2.8K OLED has been discounted by 46%
Minisforum N5 Pro: AMD Ryzen AI 9 HX PRO 370, 5 kg
» Minisforum N5 Pro reviewed - First AI NAS in the world with Ryzen AI 9 HX PRO 370 and IFA 2025 Award
Asus ROG Xbox Ally X: AMD Ryzen Z2 Extreme, 7.00", 0.7 kg
» Microsoft's new Xbox full-screen experience does not improve the gaming performance
Lenovo ThinkPad P14s Gen 6 21RV0017GE: AMD Ryzen AI 9 HX PRO 370, 14.00", 1.4 kg
» ThinkPad P14s with 96GB RAM and AMD Ryzen AI 9 discounted by 43% at Lenovo
Asus ROG Xbox Ally X: AMD Ryzen Z2 Extreme
» Weak Asus ROG Xbox Ally X supply leaks suggesting Microsoft doesn't have lot of confidence in handheld console
» Asus ROG Xbox Ally X: Currently the most comfortable gaming handheld on the market
Lenovo ThinkPad P16s Gen 4 21RX000YGE: AMD Ryzen AI 9 HX PRO 370, 16.00", 2 kg
» 4K OLED, up to 64GB RAM and RTX 4080: Lenovo ThinkPad P1 and P16s get steep discounts
Lenovo ThinkPad P14s Gen 6 21RV0017GE: AMD Ryzen AI 9 HX PRO 370, 14.00", 1.4 kg
» AMD-equipped Lenovo ThinkPad P14s OLED with 64GB DDR5 gets 46% price cut
Tuxedo Infinity Book Pro 14 Gen10 AMD: AMD Ryzen AI 9 HX 370, 14.00", 1.5 kg
» Fast AMD processor, up to 128 GB RAM and Linux - The InfinityBook Pro 14 leaves a good impression in our review
Lenovo ThinkPad P14s Gen 6 21RV0017GE: AMD Ryzen AI 9 HX PRO 370, 14.00", 1.4 kg
» Lenovo ThinkPad P14s with 64GB RAM and AMD Ryzen AI 9 HX Pro 370 gets 41% price cut
Asus VivoBook S 14 OLED M5406WA: AMD Ryzen AI 9 HX 370, 14.00", 1.3 kg
» Big $350 price cut: Asus Vivobook S 14 OLED laptop with long battery life is now less than $1,000
Lenovo ThinkPad P14s Gen 6 21RV0017GE: AMD Ryzen AI 9 HX PRO 370, 14.00", 1.4 kg
» This AMD-powered Lenovo ThinkPad with 64GB RAM and 120Hz OLED is now cheaper than ever
» Weird segmentation: Lenovo keeps 2.8K OLED screen from Ryzen AI 9 ThinkPad laptop for no apparent reason
» Ryzen 9 CPU makes this Lenovo ThinkPad stand out: Compact mobile workstation offers the most CPU performance of any 14-inch ThinkPad laptop
ONEXPLAYER X1 Pro GA15H: AMD Ryzen AI 9 HX 370, 10.95", 0.9 kg
» OneXplayer X1 Pro: Nintendo Switch on steroids
Asus VivoBook S 14 OLED M5406WA: AMD Ryzen AI 9 HX 370, 14.00", 1.3 kg
» Asus Vivobook S 14 (S5406) OLED laptop with 17-hour battery life drops back to record low price after 33% cut
Asus Zenbook S 16 UM5606-RK333W: AMD Ryzen AI 9 HX 370, 16.00", 1.5 kg
» "Open-Box Excellent" Asus Zenbook S 16 with Ryzen AI 9 365 APU and 120 Hz OLED panel is now enjoying 41% price cut
Asus VivoBook S 14 OLED M5406WA: AMD Ryzen AI 9 HX 370, 14.00", 1.3 kg
» Asus Vivobook S 14 OLED laptop with 32 GB of RAM and super long battery life enjoys 33.3% price cut
» Long-lasting Asus Vivobook S 14 OLED laptop with efficient Lunar Lake APU is back on sale
» Asus Vivobook S 16 (M506KA) and Vivobook S 14 (M5406WA) debut with new AMD Krackan Point APUs and OLED displays
» Asus Vivobook S 16 (S5606CA) launched with latest Intel Core Ultra 200H Arrow Lake mobile CPUs and Lumina OLED display
HP OmniBook Ultra 14: AMD Ryzen AI 9 HX 375, 14.00", 1.5 kg
» HP OmniBook Ultra 14 with Ryzen AI 9 HX 375 and 32 GB RAM drops below $1,150 for a limited time
Asus VivoBook S 14 OLED M5406WA: AMD Ryzen AI 9 HX 370, 14.00", 1.3 kg
» Asus Vivobook S 14 OLED laptop with newest Lunar Lake CPU and long battery life is back on sale at lowest price to date
» Portable Asus Vivobook S 14 OLED laptop with latest Intel Lunar Lake SoC and 16 GB RAM is on sale at 32% discount
Asus ProArt P16 H7606WI: AMD Ryzen AI 9 HX 370
» Latest Asus ProArt PX13 OLED creator laptop with Ryzen AI 9 HX 370 drops to lowest price ever
» Strix Point APU handheld performance simulation: Ryzen AI 9 HX 370 shines in gaming even when tested at just 17 W
Asus ProArt PX13 HN7306: AMD Ryzen AI 9 HX 370
» Strix Point APU handheld performance simulation: Ryzen AI 9 HX 370 shines in gaming even when tested at just 17 W
Asus Zenbook S 16 UM5606-RK333W: AMD Ryzen AI 9 HX 370, 16.00", 1.5 kg
» Strix Point APU handheld performance simulation: Ryzen AI 9 HX 370 shines in gaming even when tested at just 17 W