Framework Laptop 13.5 Ryzen AI 9 review: Skip the Intel version for better performance
Verdict — Familiar But Faster
The new Ryzen AI 9 HX 370 is a sizable upgrade over the 2024 Core Ultra 7 or Zen 4 Ryzen U configurations. Performance has improved without needing to up the power envelope or enlarge the cooling solution to maintain part compatibility with older Laptop 13.5 configurations.
If you don't need all that performance, then older configurations of the Laptop 13.5 can still provide essentially the same user experience for less. Top-end Framework configurations are becoming noticeably more expensive with our test unit in particular cracking the $2000 ceiling. The slower and cheaper Core Ultra configurations offer longer battery life alongside four identical USB-C 4.0 ports to be a good trade-off if raw performance isn't priority.
A few aspects of the five-year old Framework design are starting to show their age. The 2 MP webcam, lack of OLED or P3 color options, and relatively weak speakers are falling behind latest competing models from Lenovo, HP, or Dell. Framework has yet to offer such upgrades despite the flexible design philosophy of the Laptop 13.5 series.
Pros
Cons
Price and Availability
Framework is now shipping the Laptop 13.5 with Ryzen AI 300 series options starting at $1330 USD. Our unit as reviewed retails for $2100.
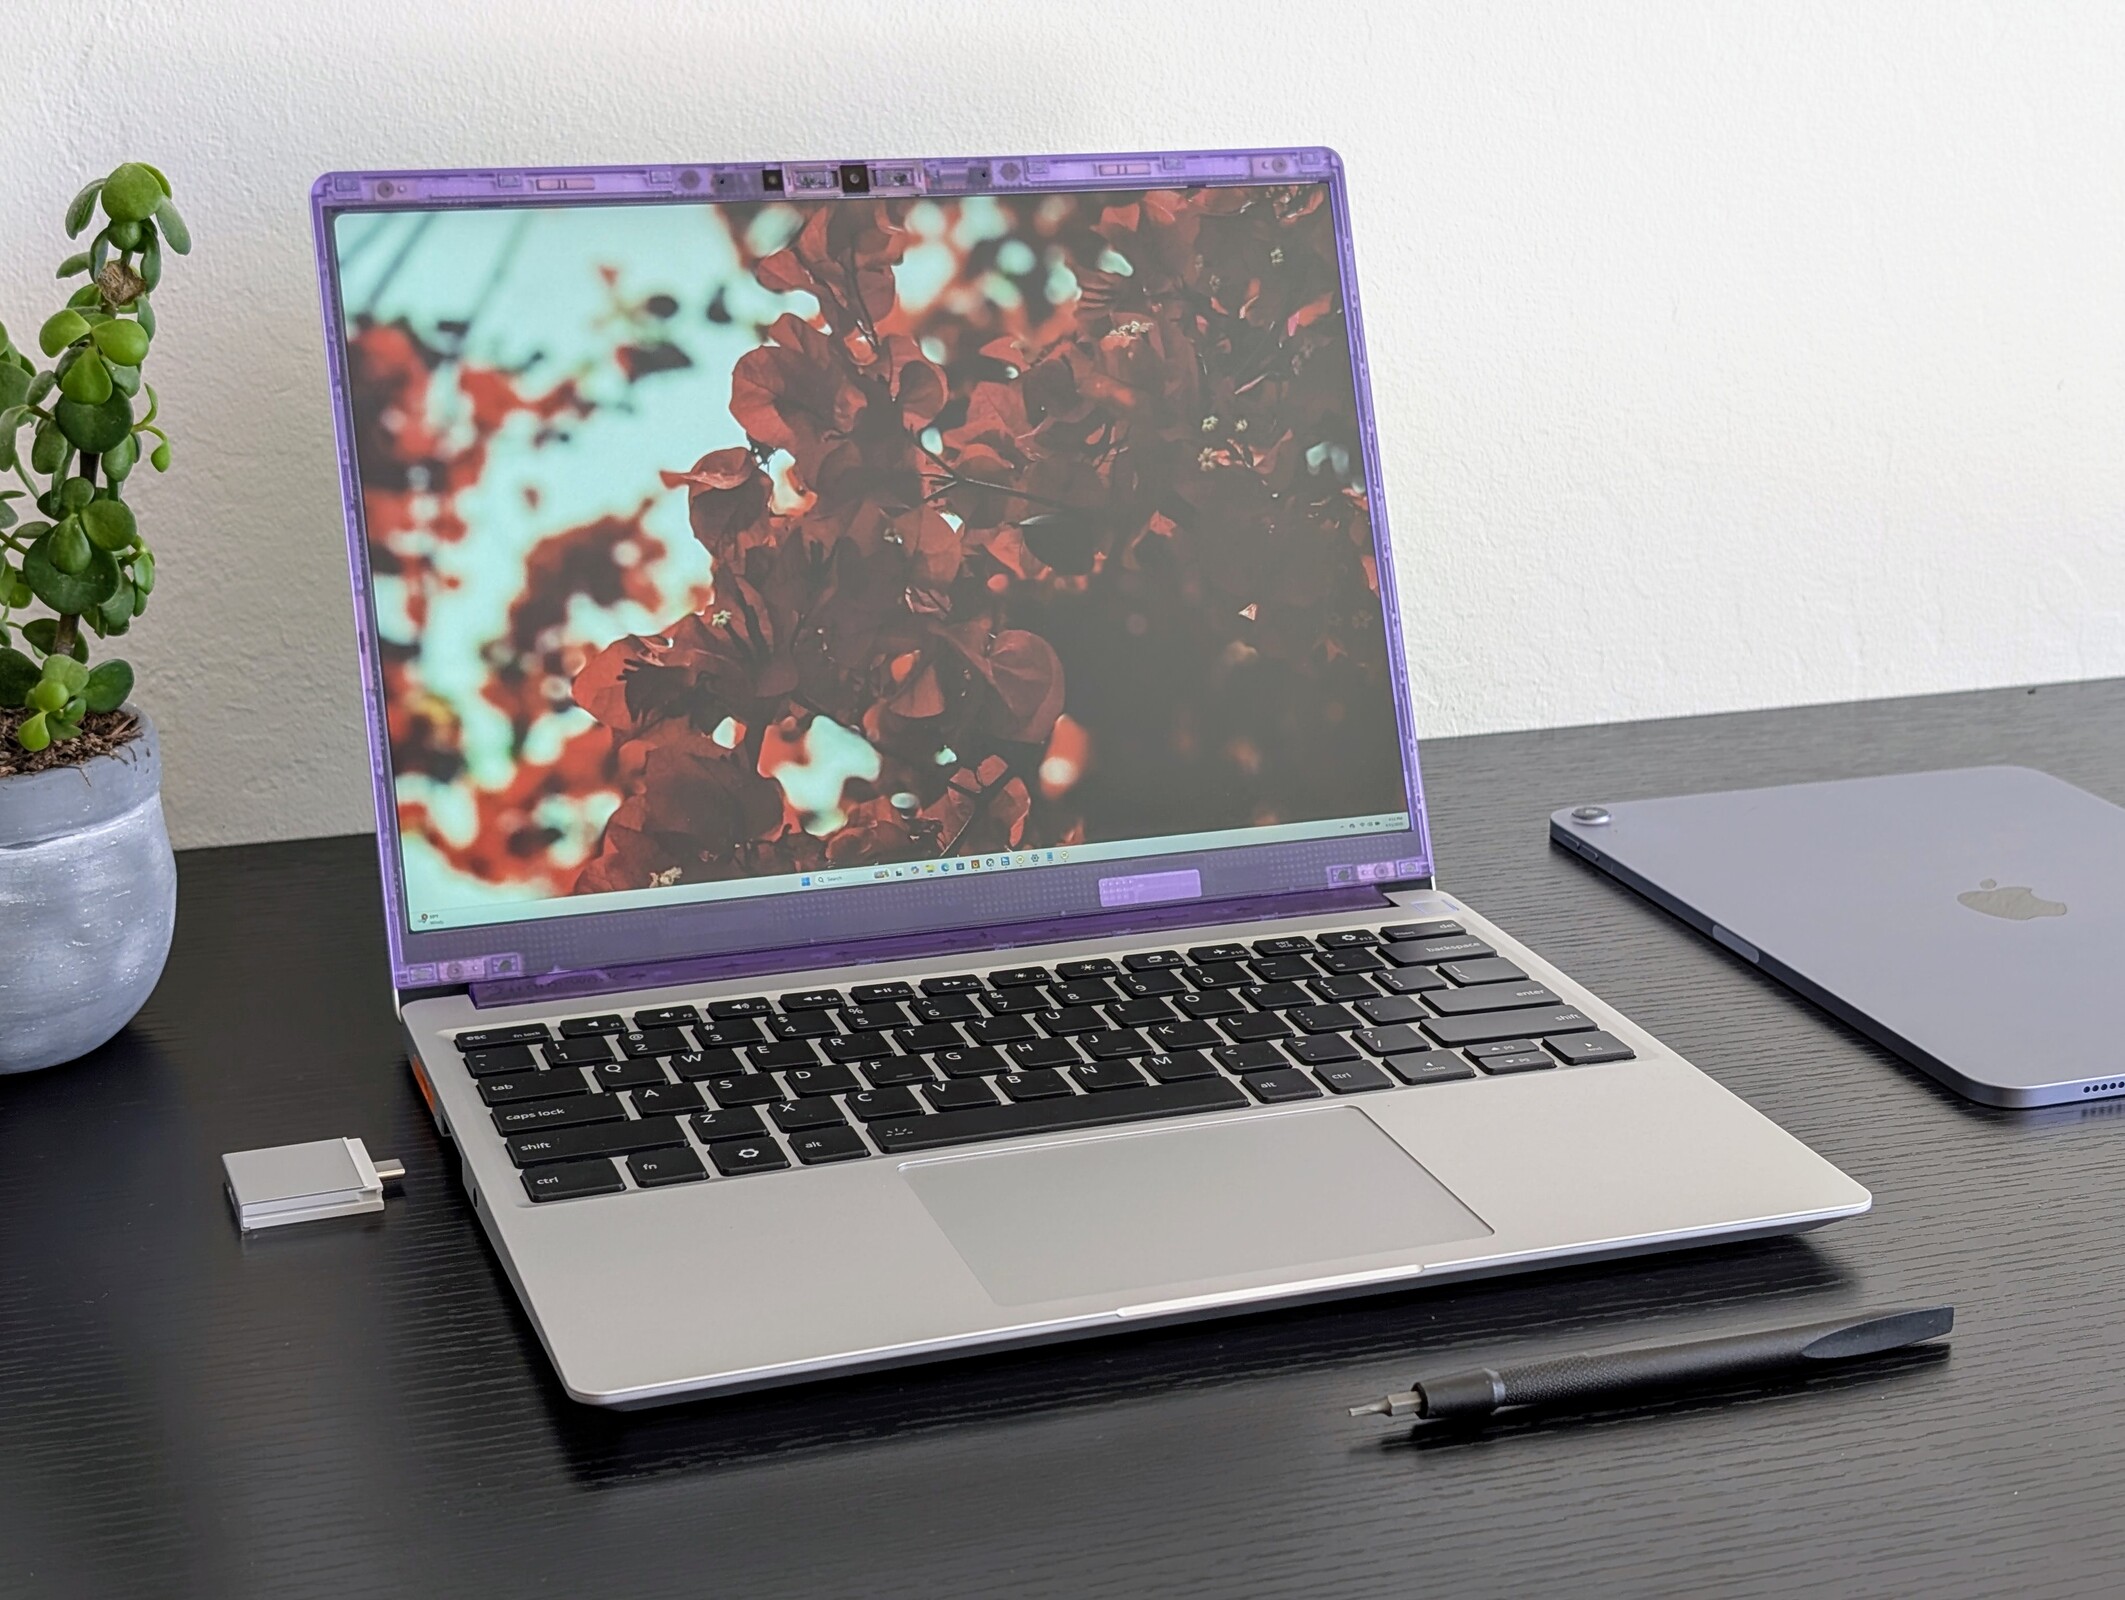
Framework has updated its Laptop 13.5 this year with AMD Zen 5 HX-series processors to supplant last year's Zen 4 U-series Core Ultra 7 options. The chassis is otherwise identical and so we recommend checking out our review on the original model to learn more about the physical features of the system.
Our test unit is the highest-end configuration with the Ryzen AI 9 HX 370 CPU and 2880 x 1920 120 Hz IPS display for over $2100 USD. Lower configurations start with the Ryzen AI 5 340 or 2256 x 1504 60 Hz display instead.
Competitors to the Laptop 13.5 include popular flagship prosumer or business subnotebooks like the Lenovo ThinkPad T14s, Dell Pro 13, or HP EliteBook series.
More Framework reviews:
Specifications
Case
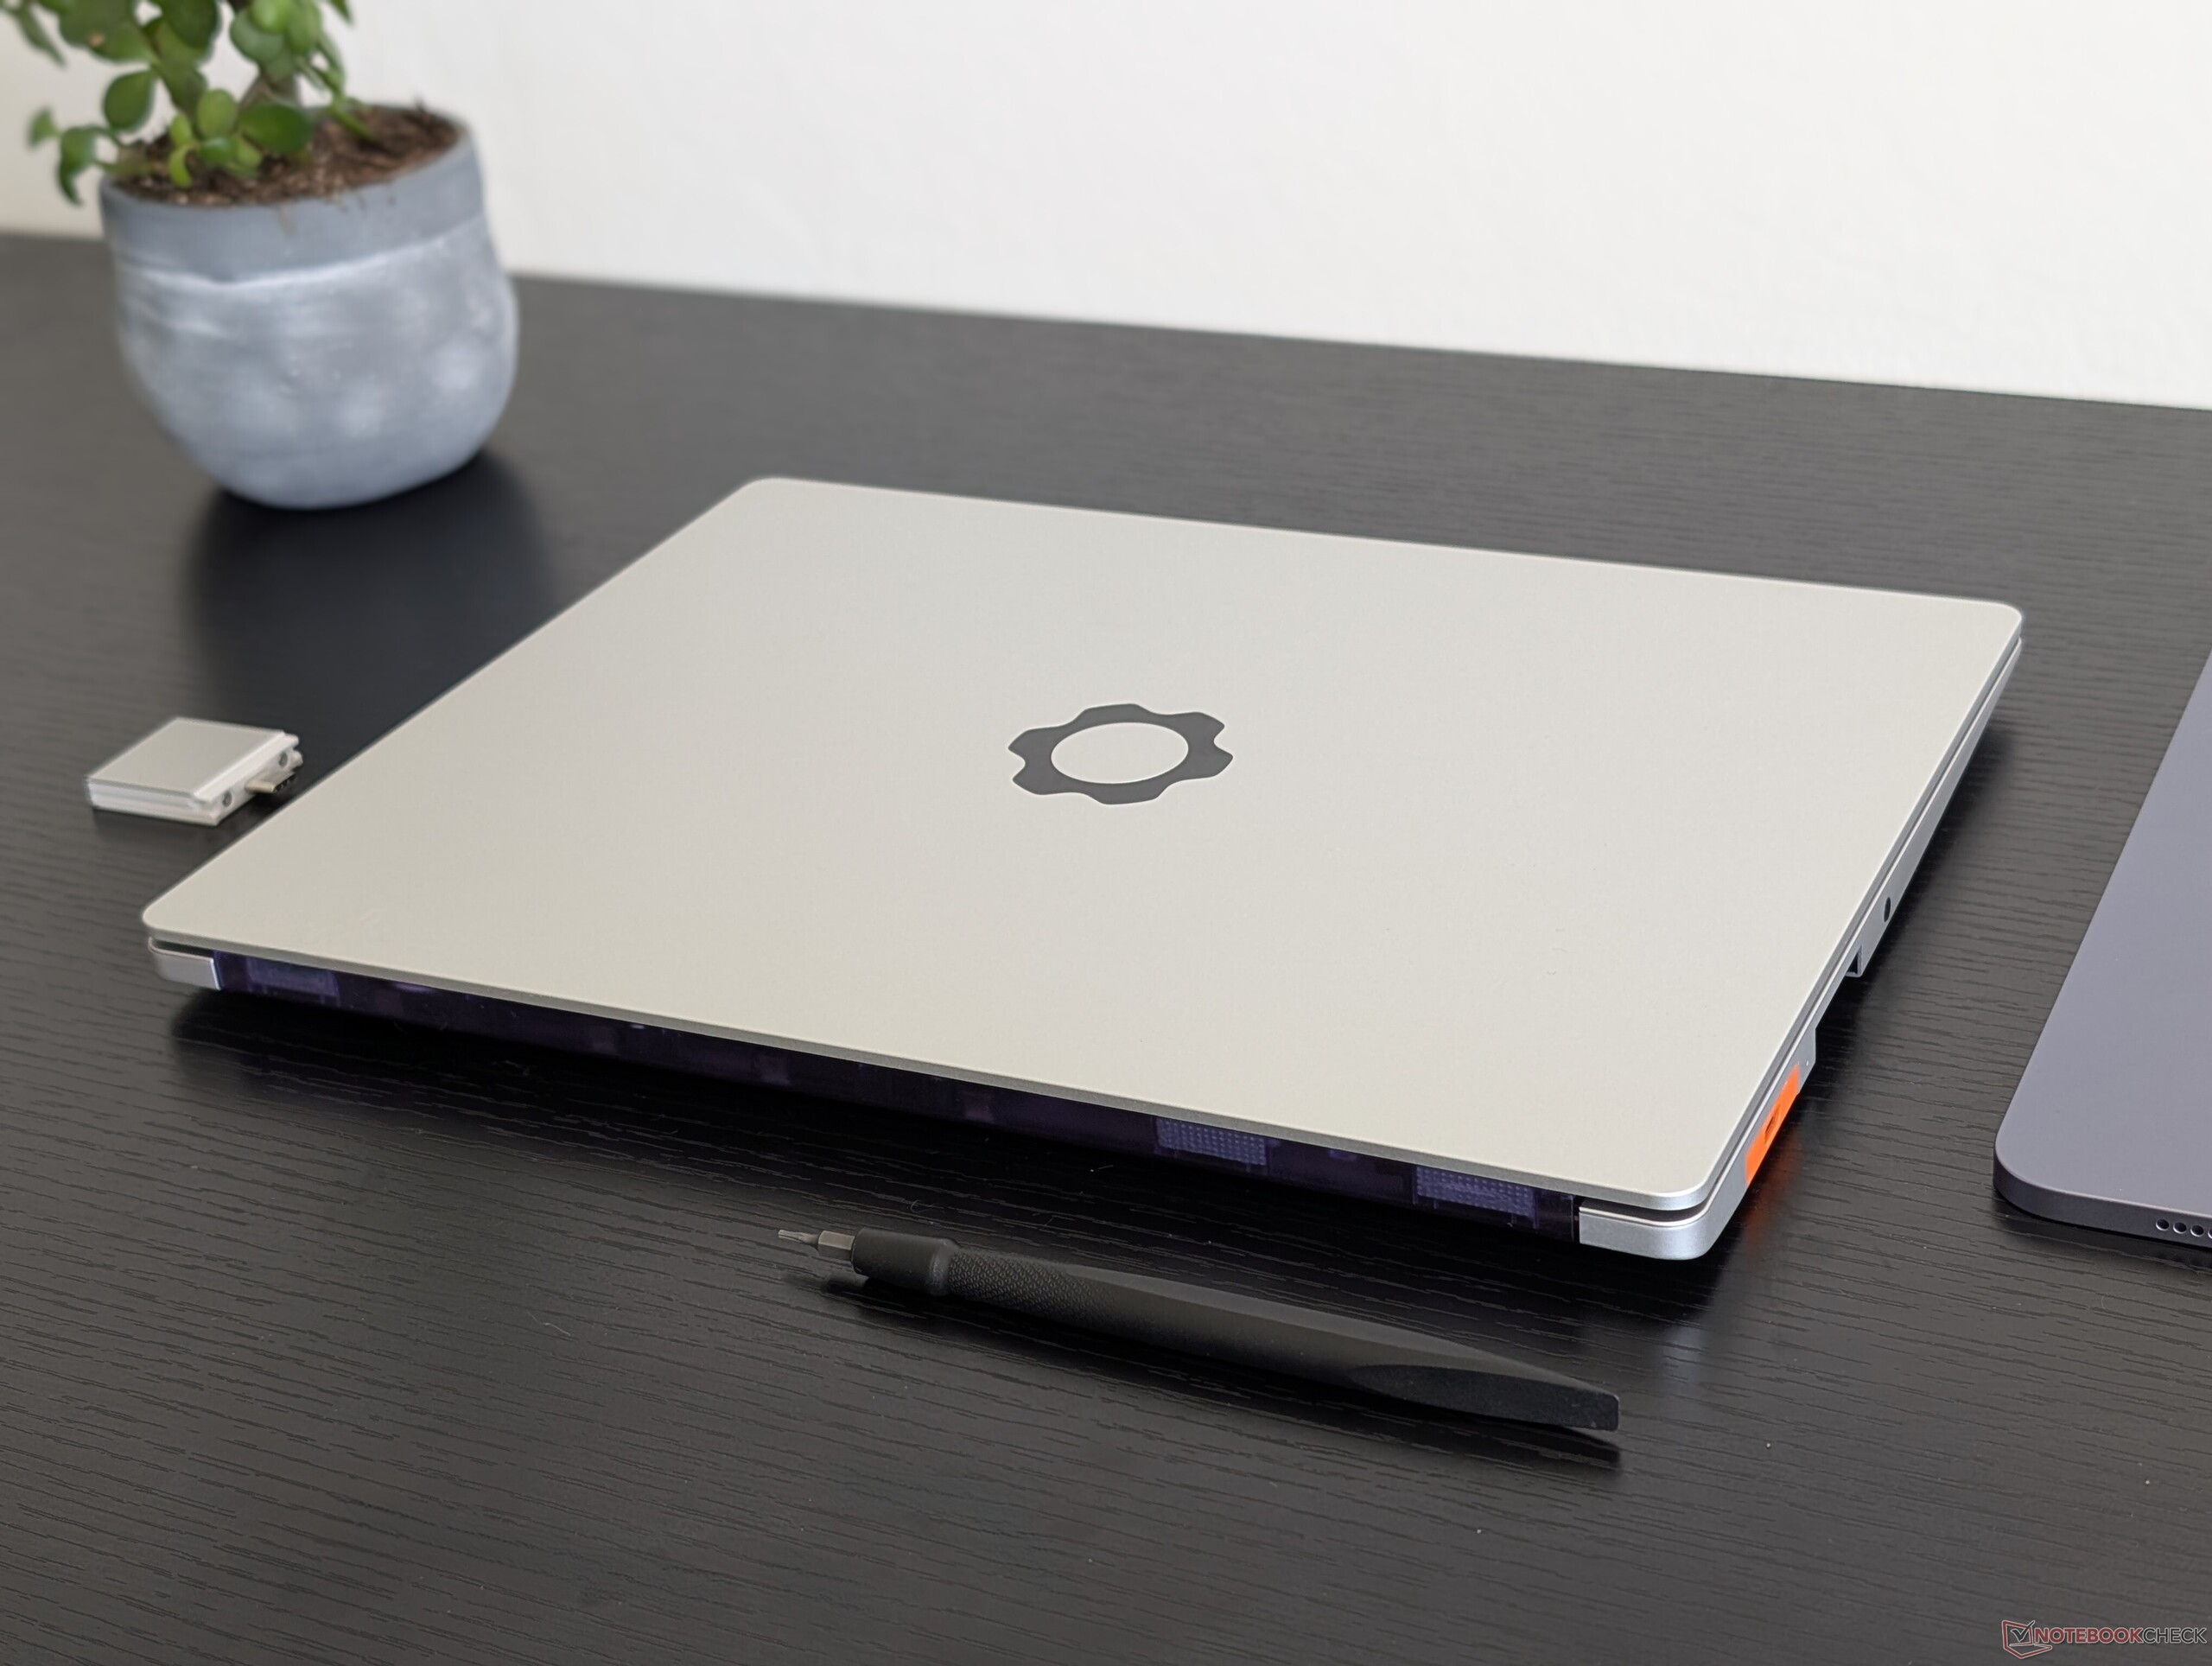
There are no changes to the chassis design in order to remain compatible with existing replacement parts and accessories.
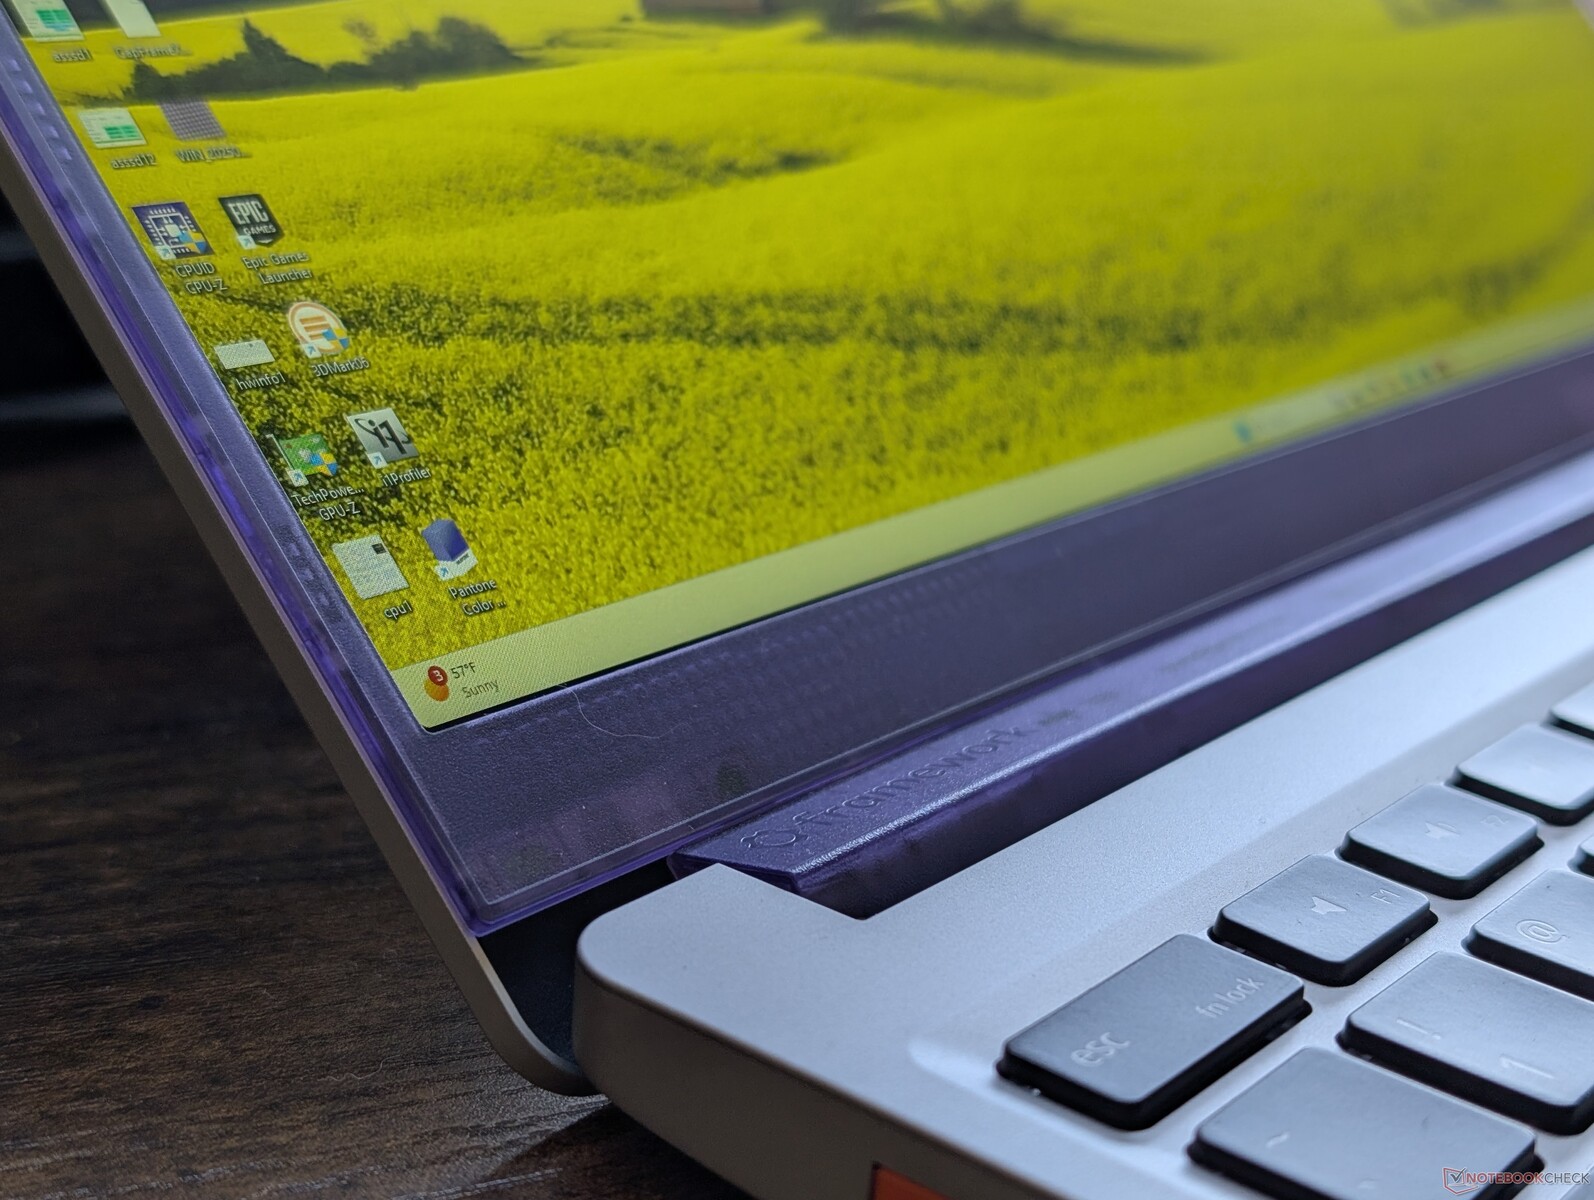
New options this year include the translucent colored plastic bezels for DIYers who want to add a bit of color to their systems and a second generation keyboard that reduces key clatter and vibration from the integrated speakers. Even so, the differences are arguably minor and largely aesthetic.
Connectivity
While the four USB-C ports have returned, keep in mind that they are not all identical unlike on the Intel version of this laptop due to underlying architectural differences of the AMD processor. In particular, only the two rear USB-C ports here are compatible with USB4 speeds while the front two USB-C ports are USB 3.2.
SD Card Reader
| SD Card Reader | |
| average JPG Copy Test (av. of 3 runs) | |
| Framework Laptop 13.5 Core Ultra 7 155H (Toshiba Exceria Pro SDXC 64 GB UHS-II) | |
| Framework Laptop 13.5 Ryzen AI 9 HX 370 (AV PRO microSD 128 GB V60) | |
| maximum AS SSD Seq Read Test (1GB) | |
| Framework Laptop 13.5 Core Ultra 7 155H (Toshiba Exceria Pro SDXC 64 GB UHS-II) | |
| Framework Laptop 13.5 Ryzen AI 9 HX 370 (AV PRO microSD 128 GB V60) | |
Communication
Webcam
The 2 MP webcam returns with no higher resolution options.


Maintenance
Serviceability remains unchanged and unchallenged when compared to other subnotebooks from major manufacturers. See our video below for a more in-depth guide on the maintenance features.
Sustainability
Framework utilizes 75 percent recycled aluminum for the top cover and speakers, 50 percent recycled aluminum for the bottom cover and keyboard deck, 50 percent recycled plastic for the keycaps, and up to 30 percent recycled plastic for the expansion cards. The packaging is all paper and cardboard to be fully recyclable.
The manufacturer also offers replacement parts, upgrade modules, and detailed servicing guides that even the larger makers have yet to match.
Accessories And Warranty
New to the expansion cards this year are translucent plastic colors and updated HDMI 2.0b options. The translucent colors do not cost extra when compared to the existing gray aluminum or solid plastic colors.
The standard one-year limited manufacturer warranty applies.
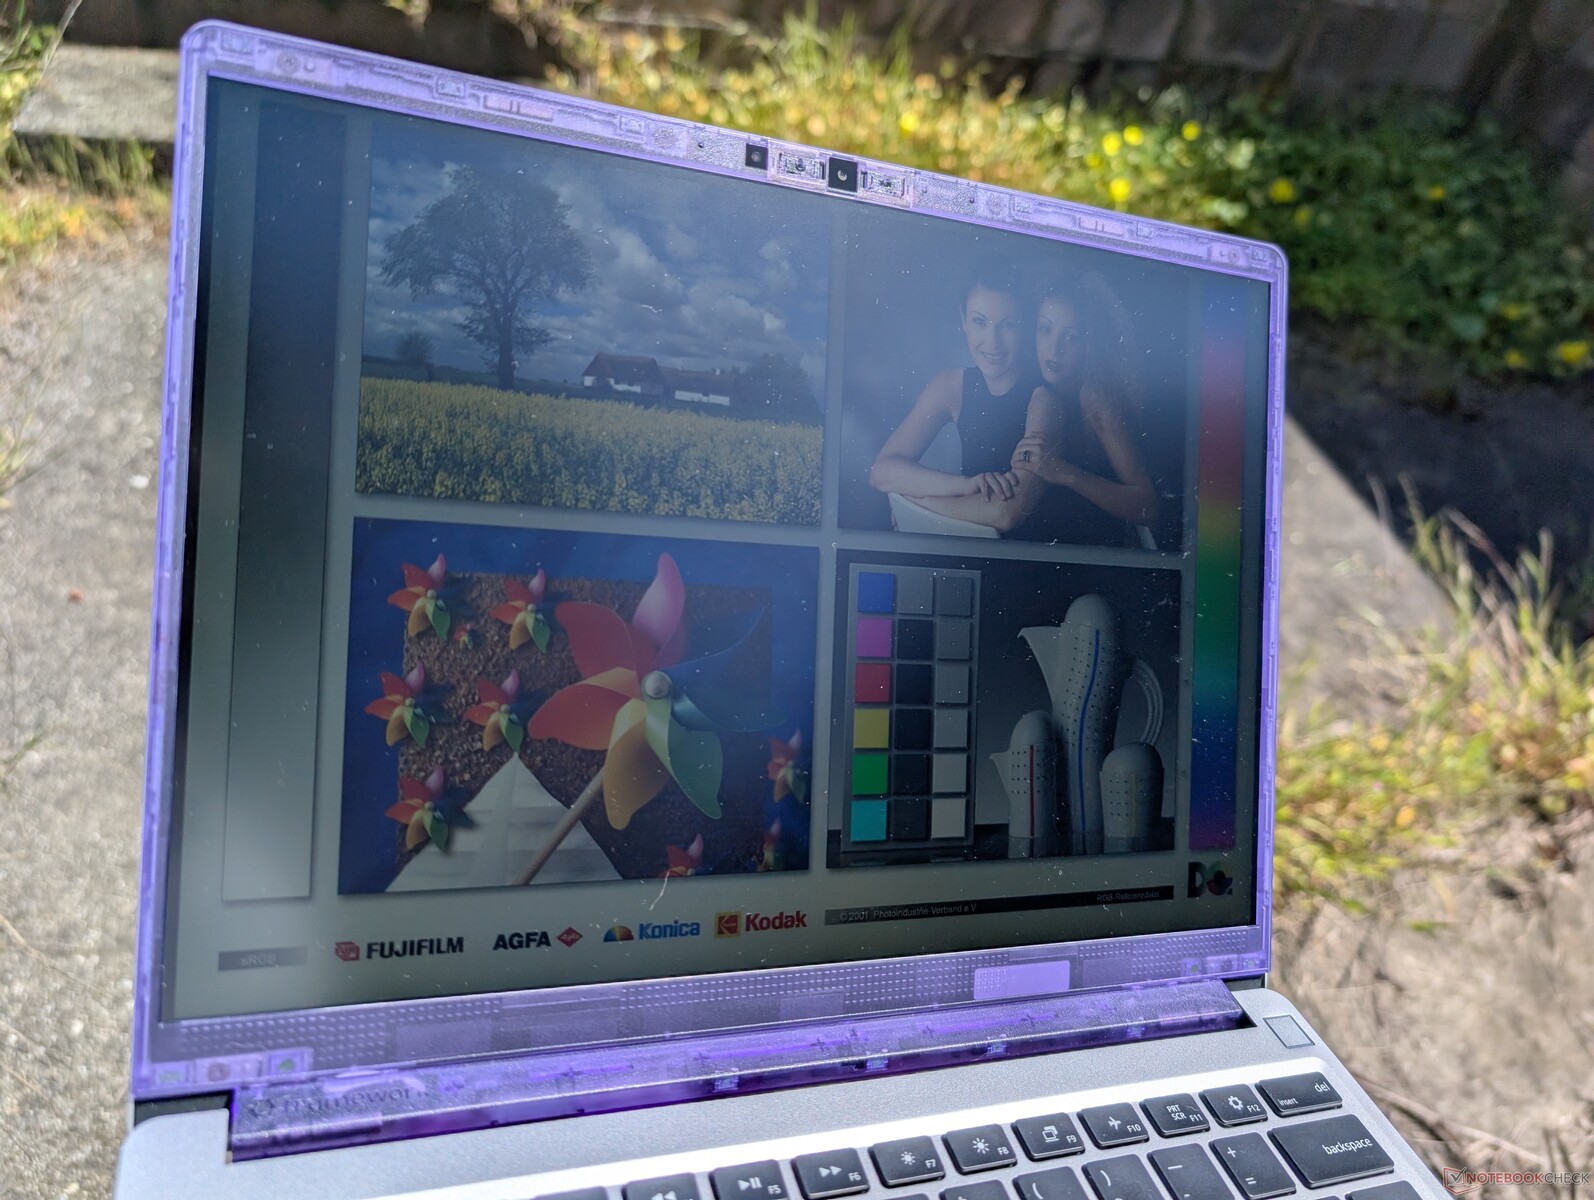
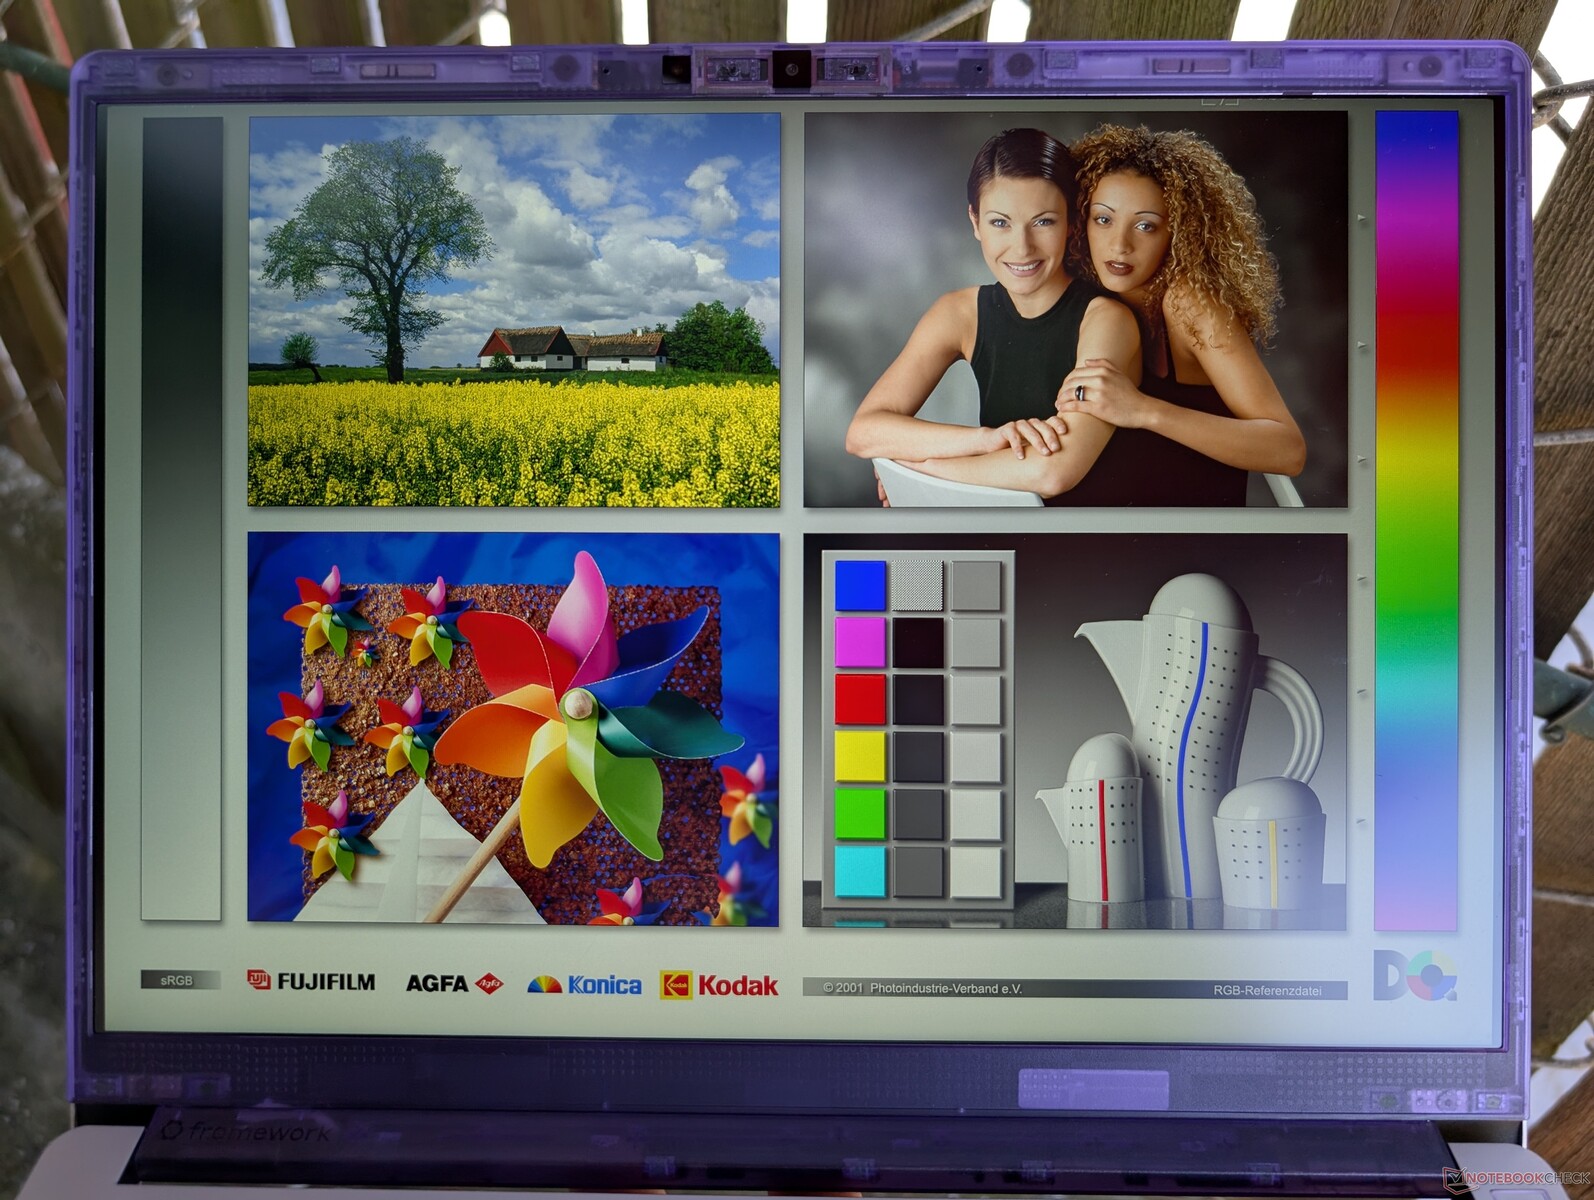
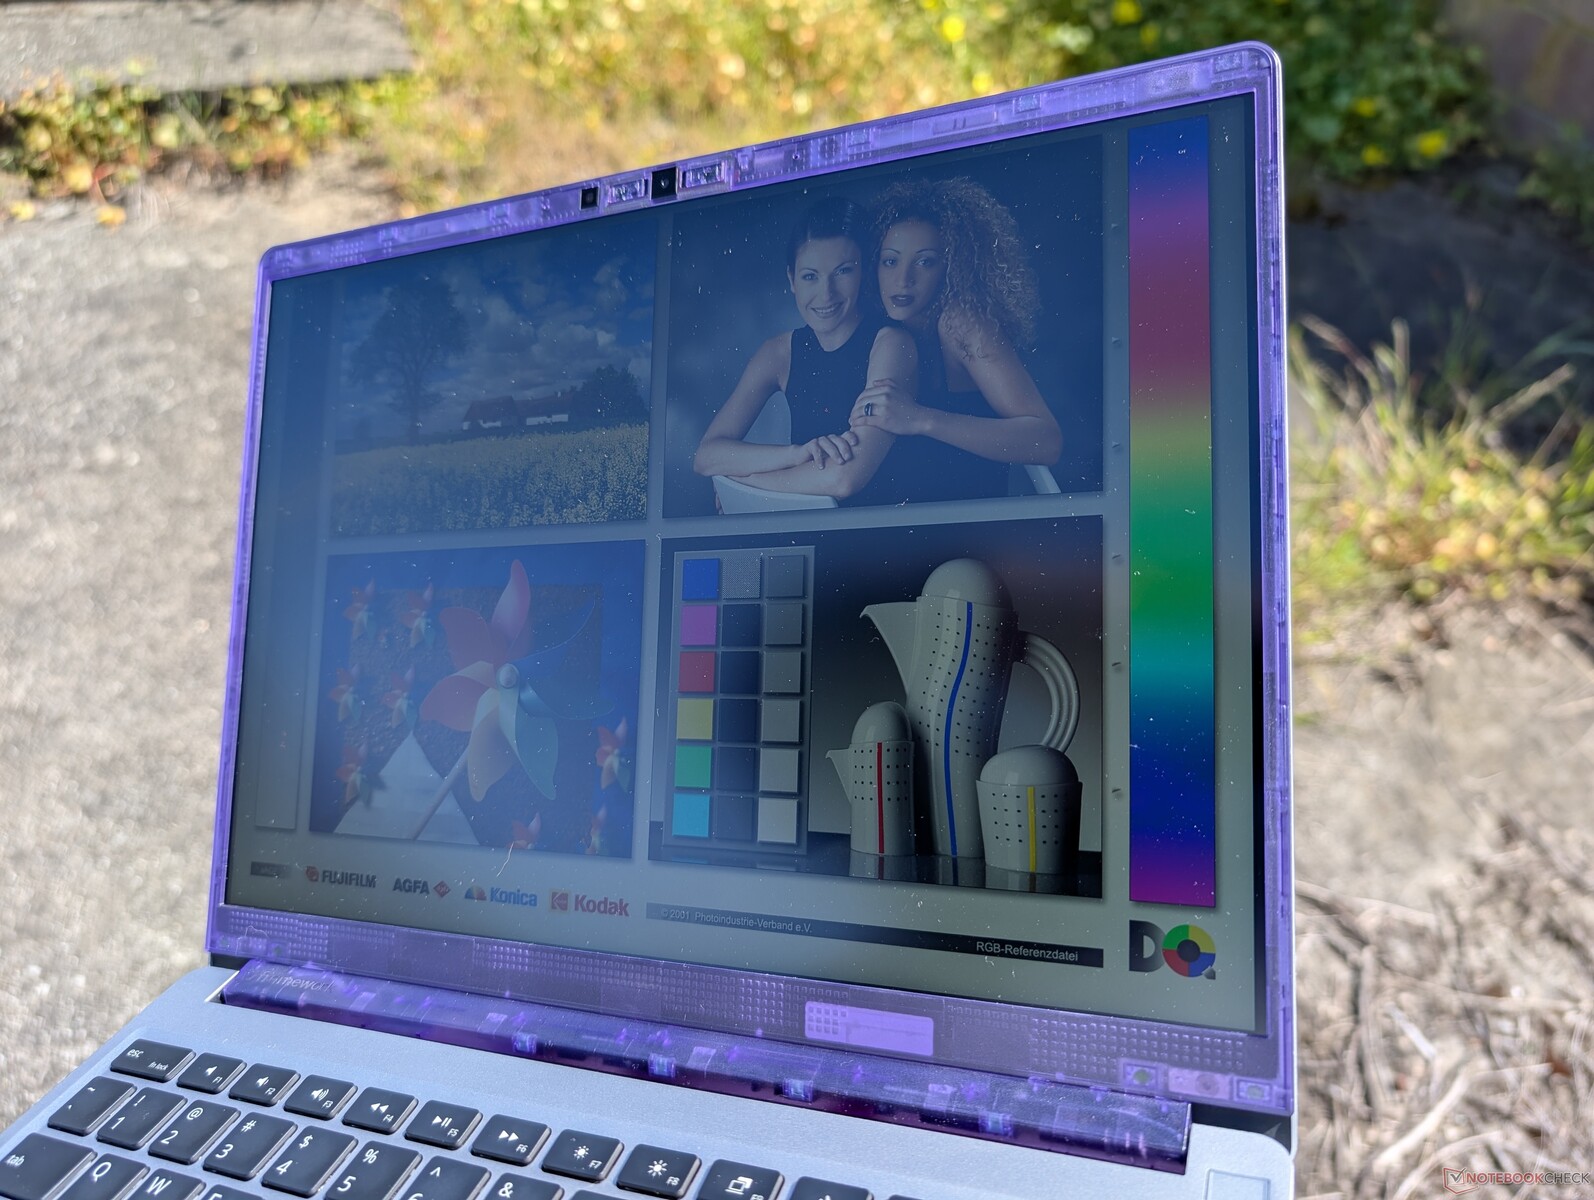
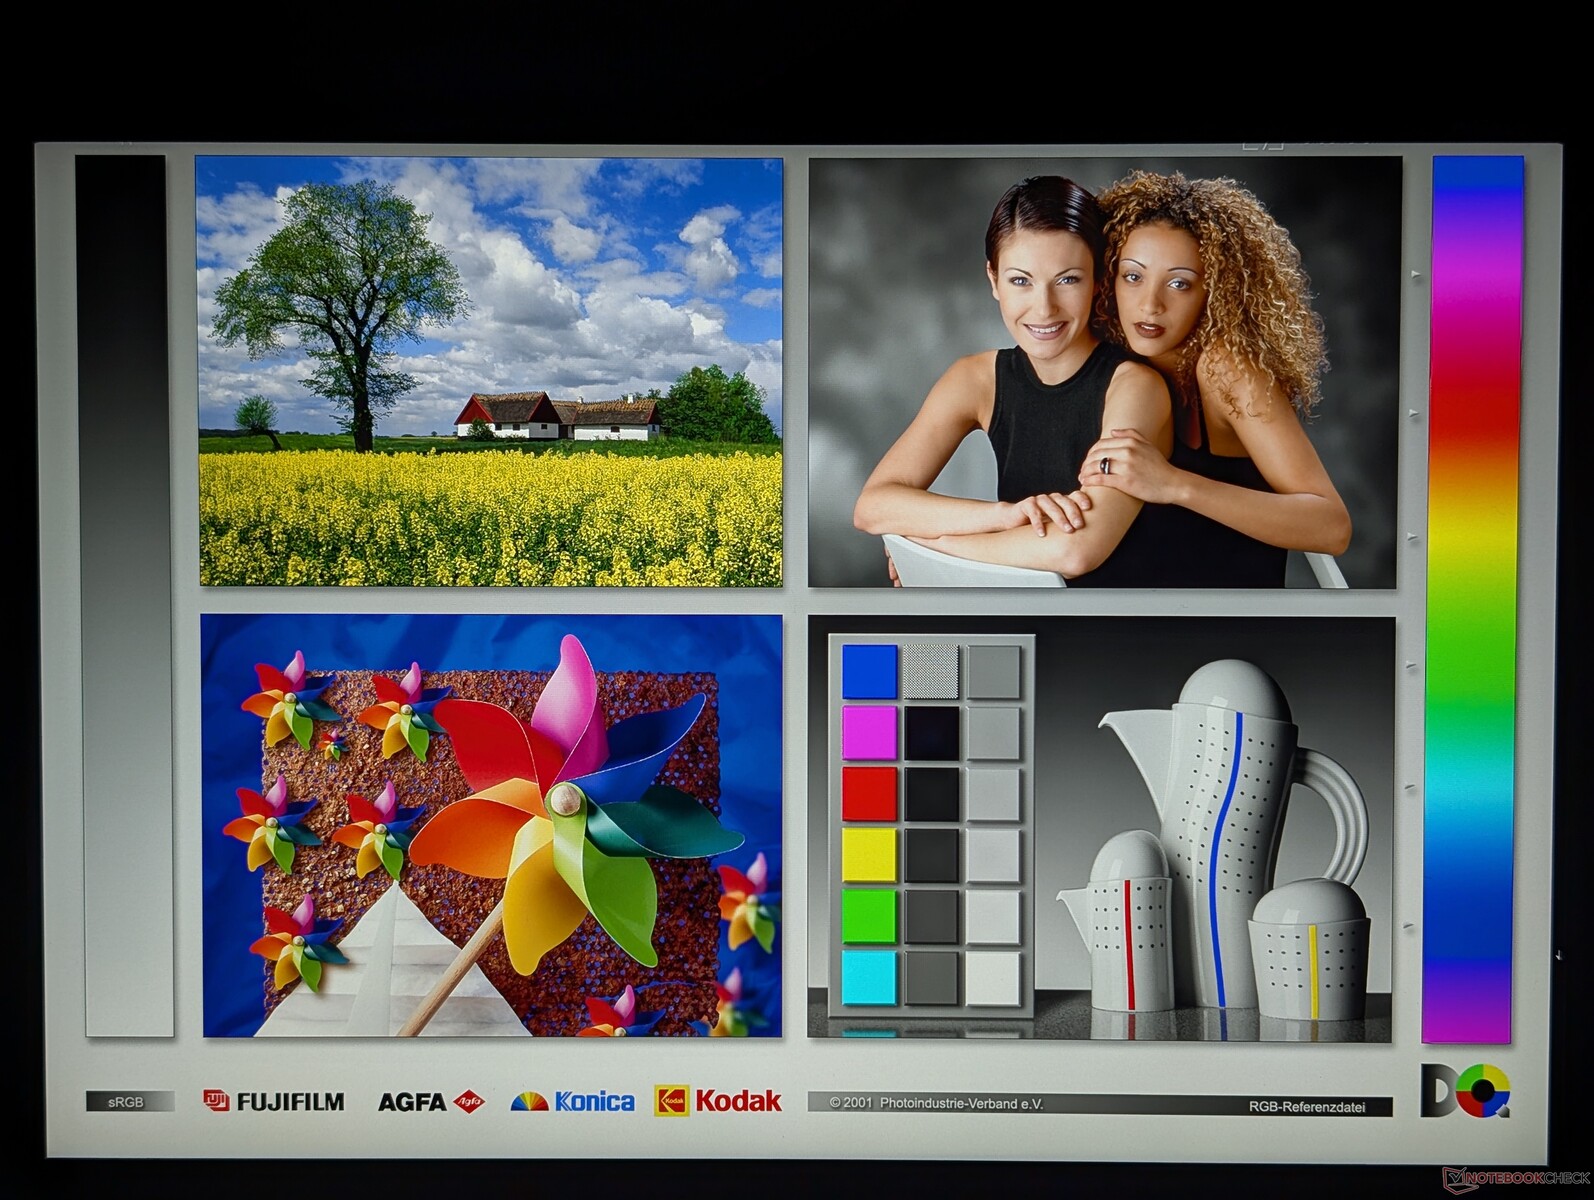
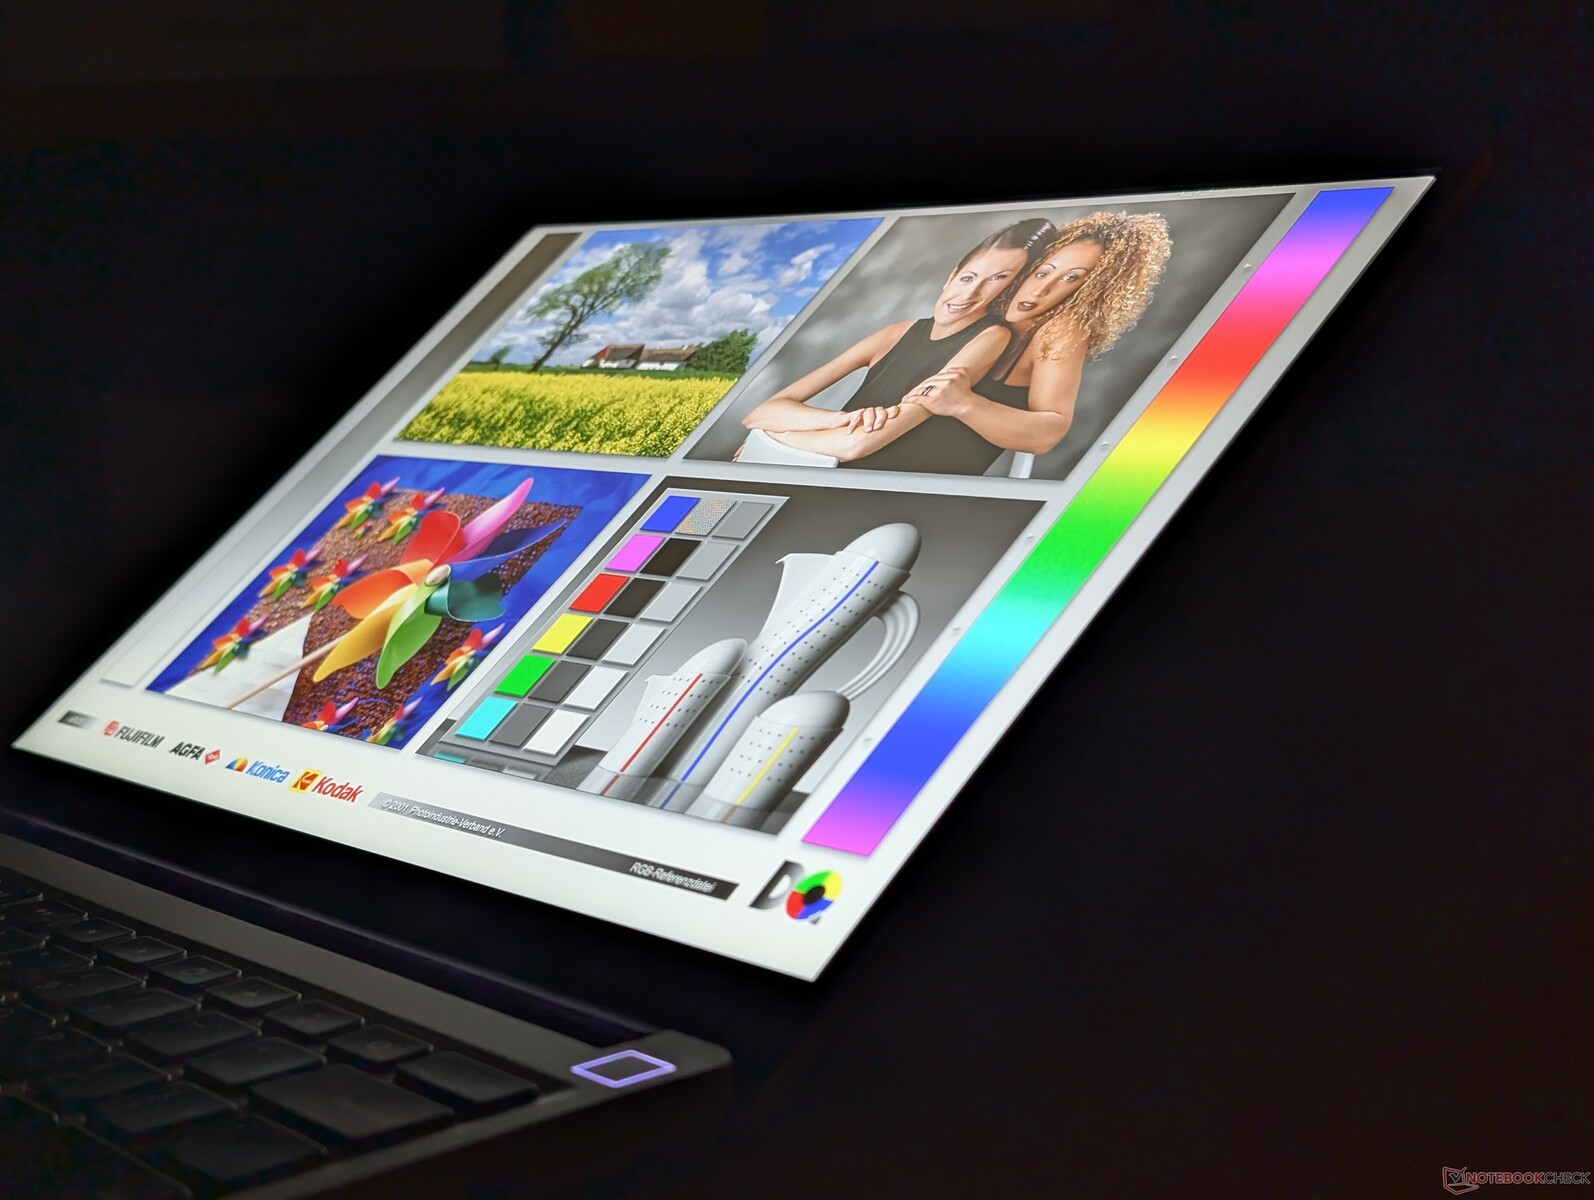
Display
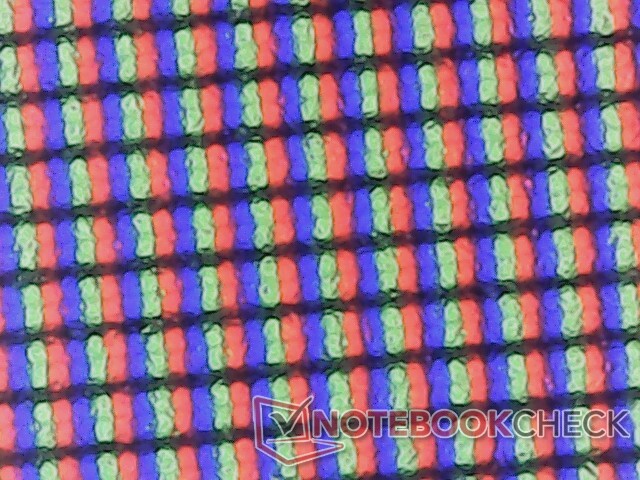
Framework is using the same BOE NE135A1M-NY1 IPS panel as found on last year's Intel model for this year's AMD refresh. While still an excellent panel, it would have been nice to see OLED options or P3 colors for those who demand them.

| |||||||||||||||||||||||||
Brightness Distribution: 94 %
Center on Battery: 529.9 cd/m²
Contrast: 1766:1 (Black: 0.3 cd/m²)
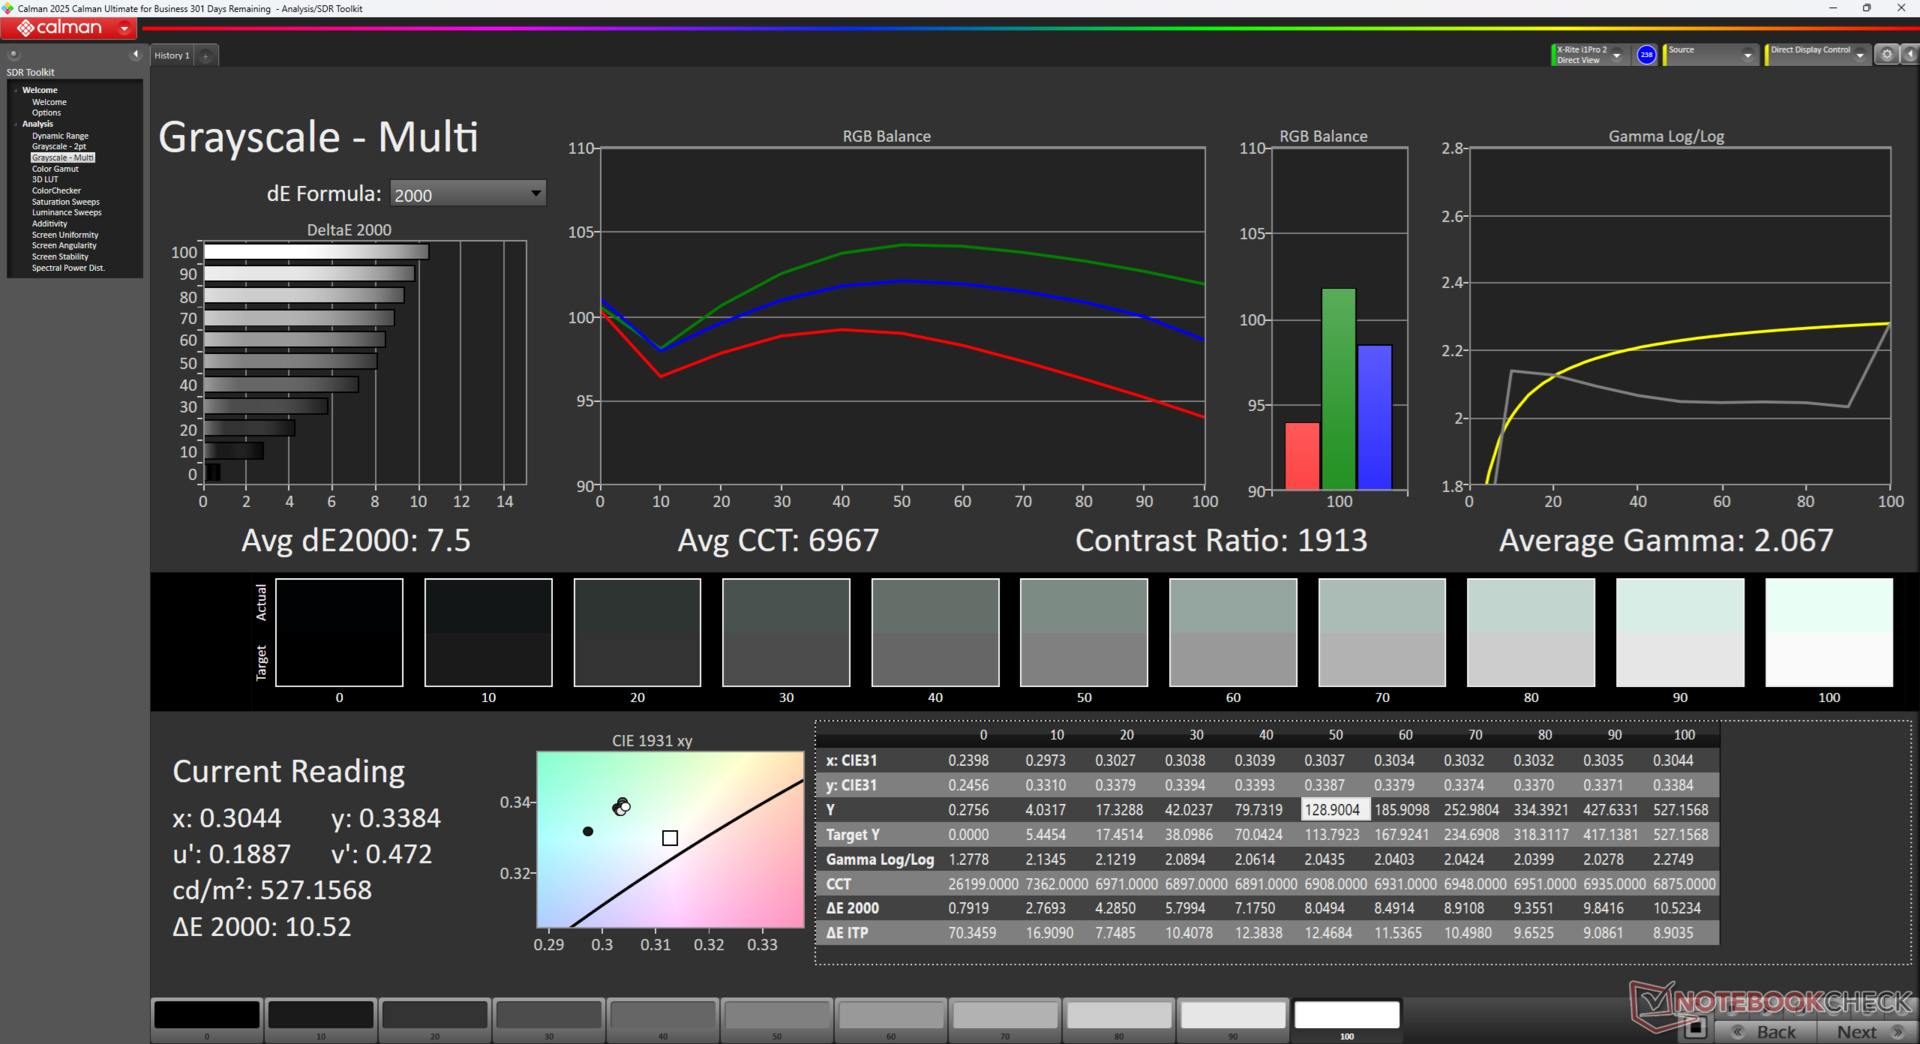
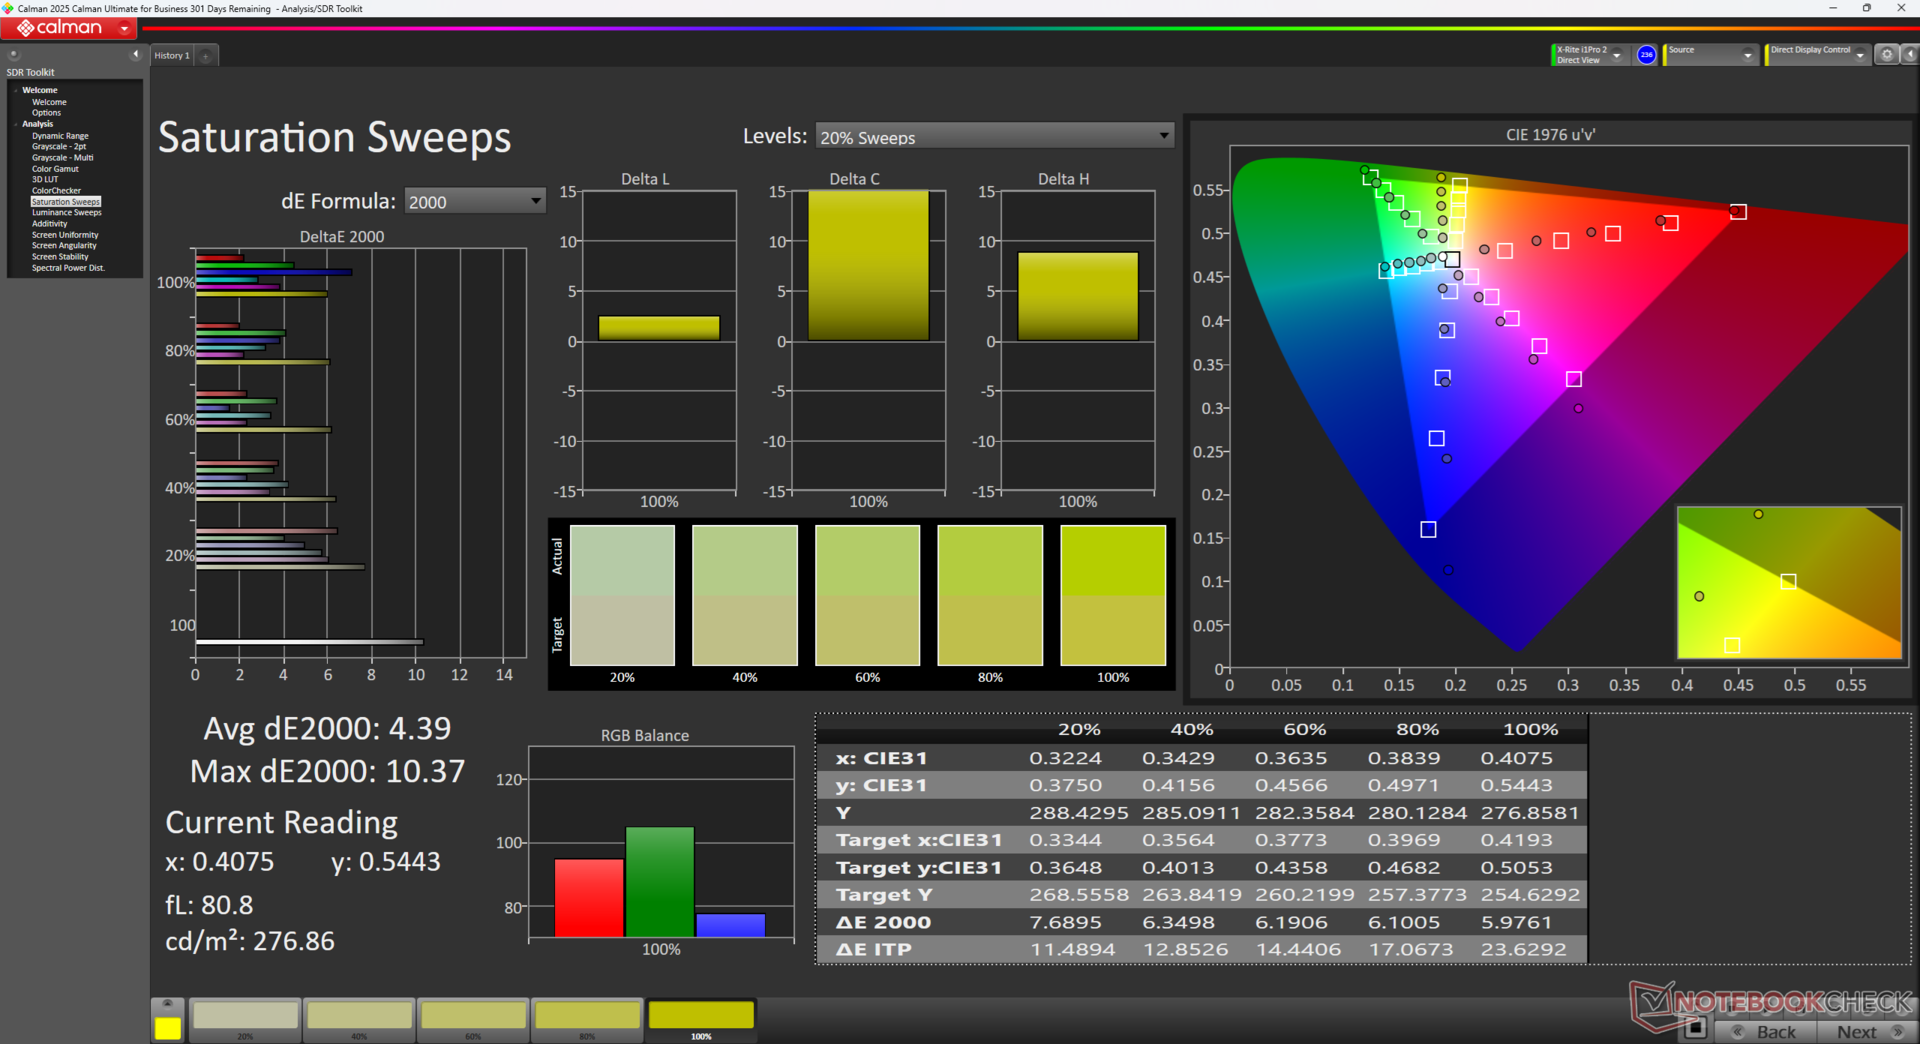
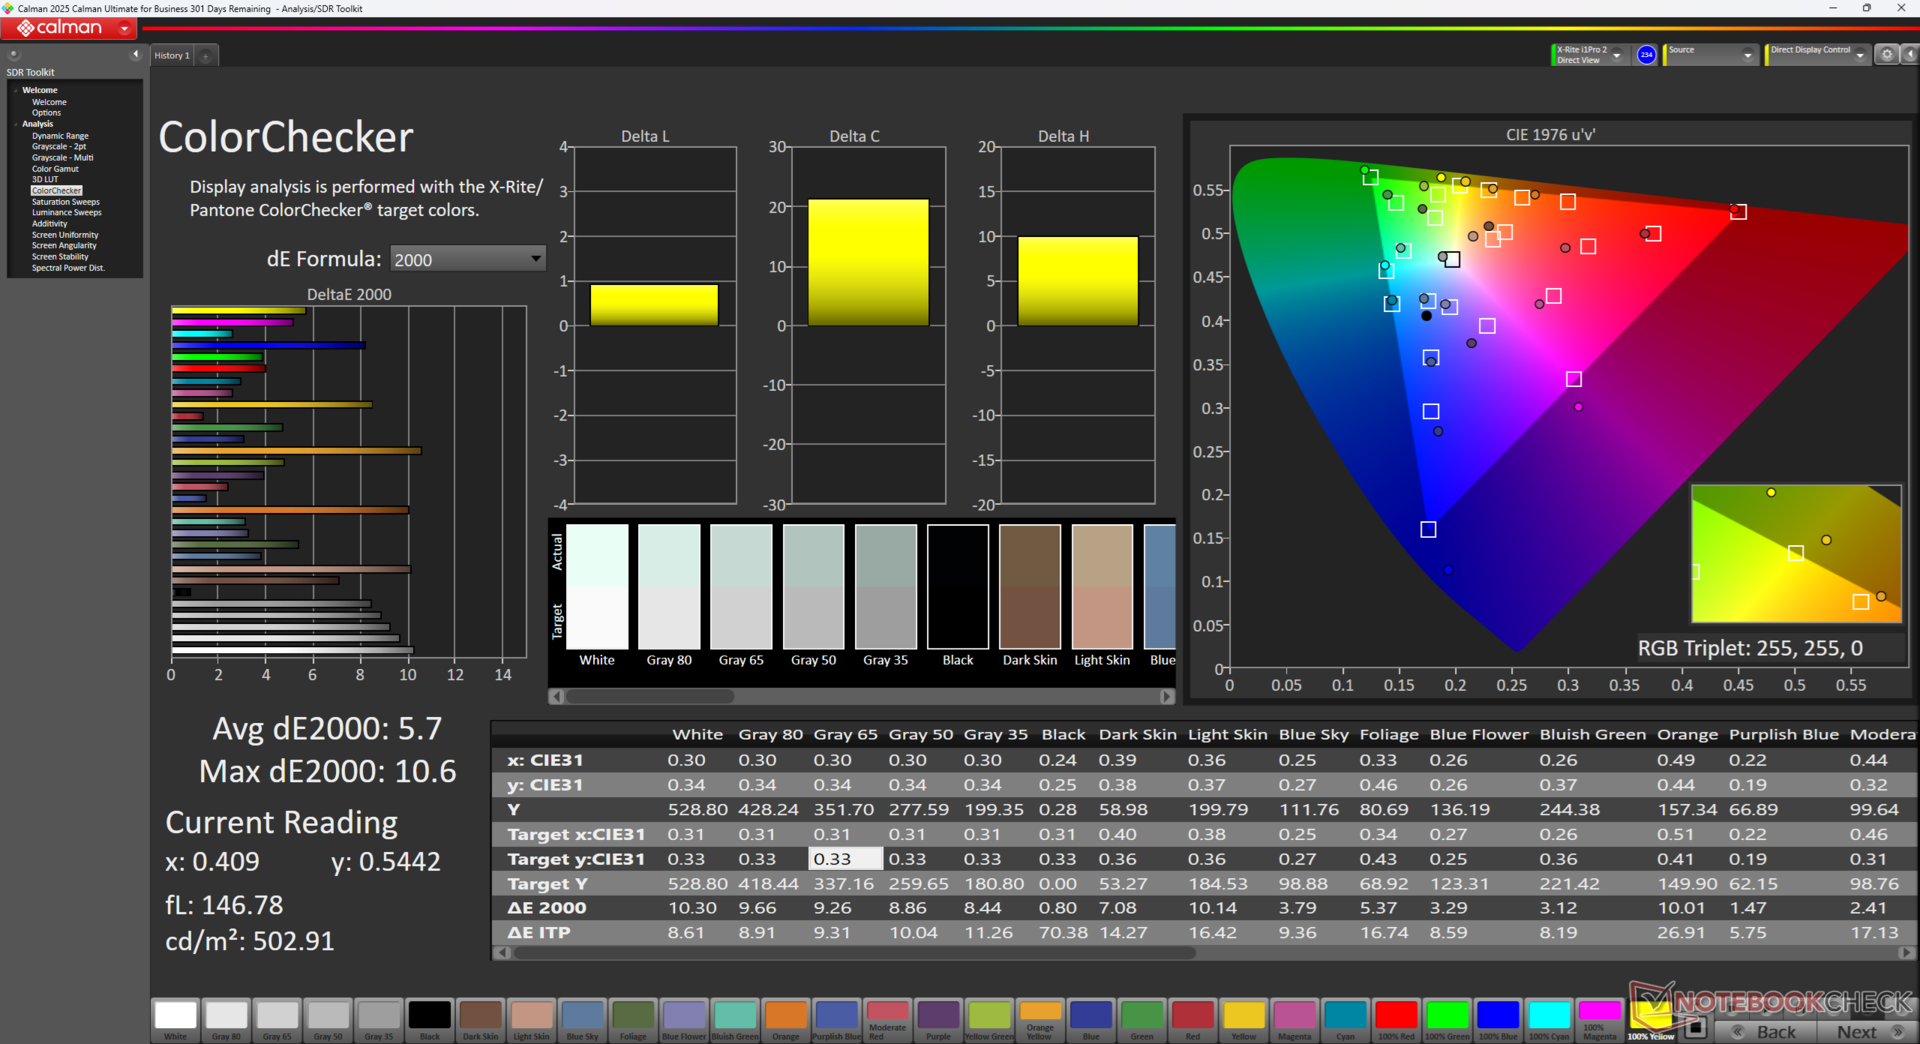
ΔE ColorChecker Calman: 5.7 | ∀{0.5-29.43 Ø4.72}
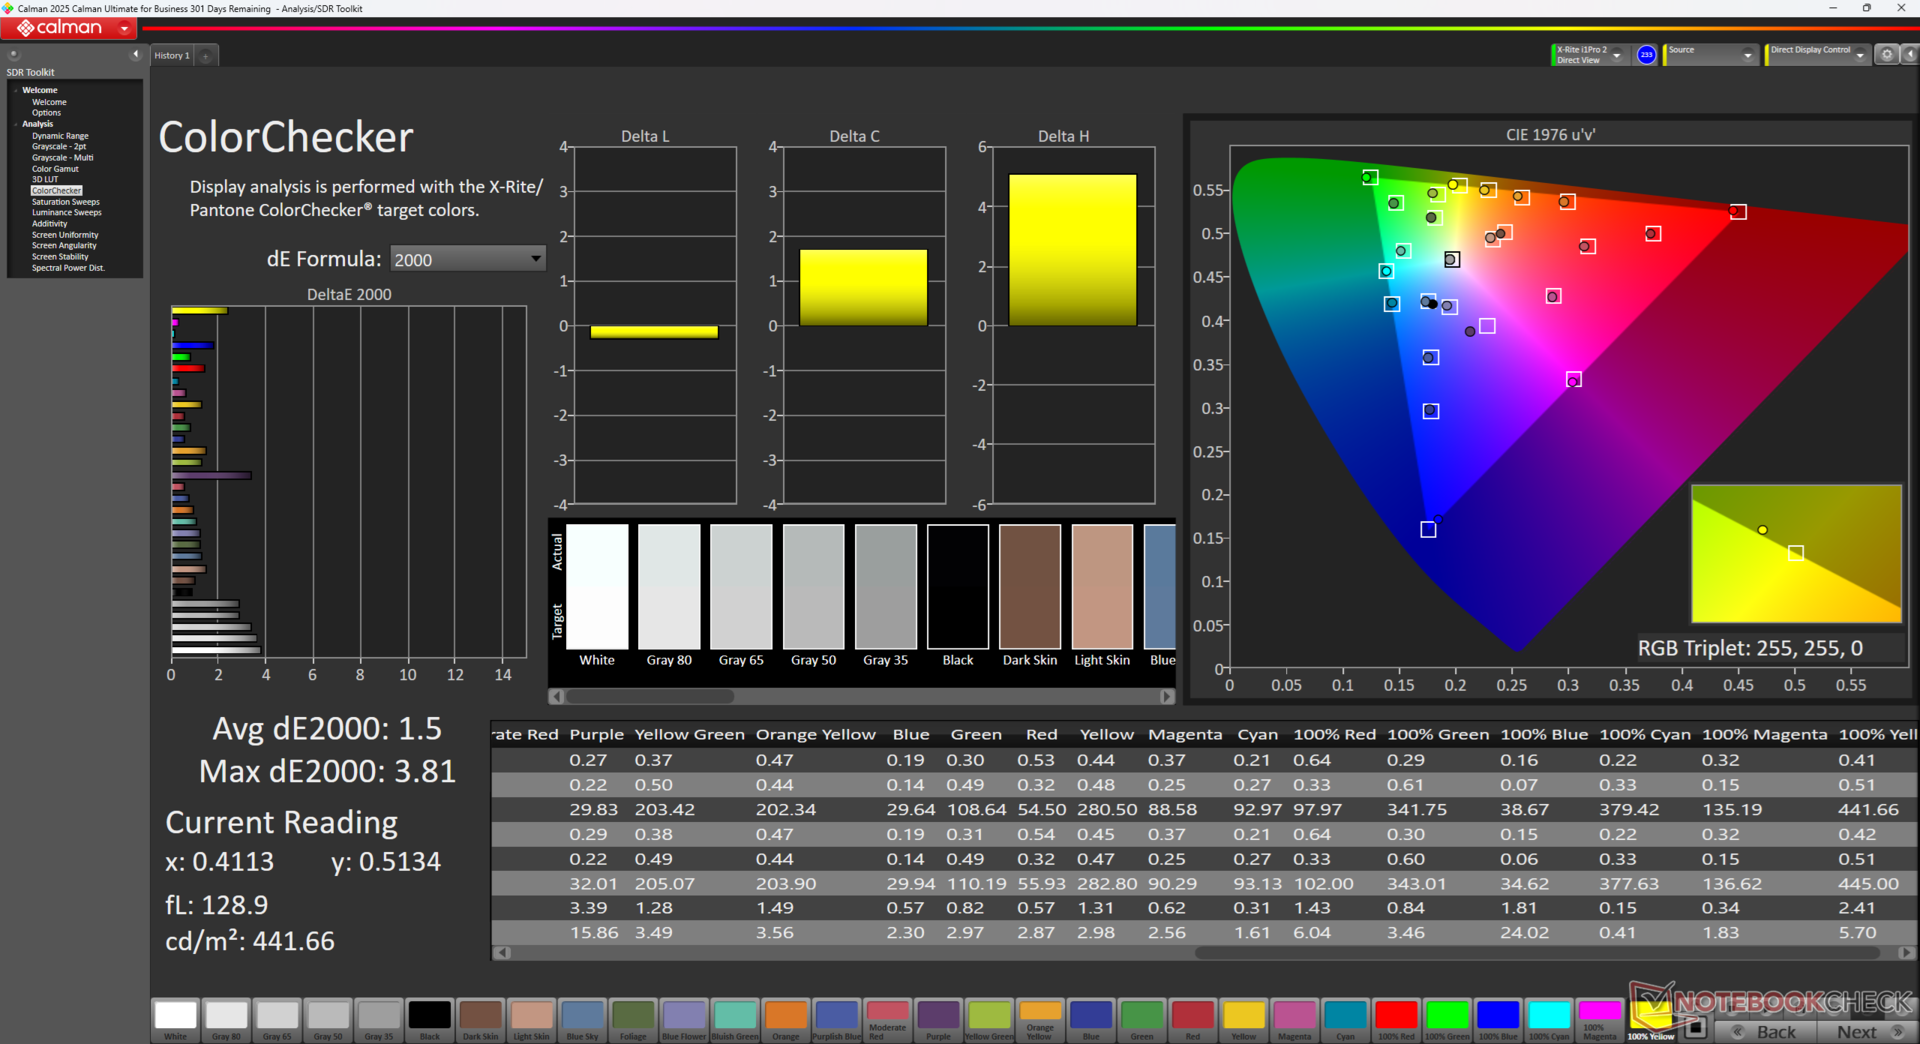
calibrated: 1.5
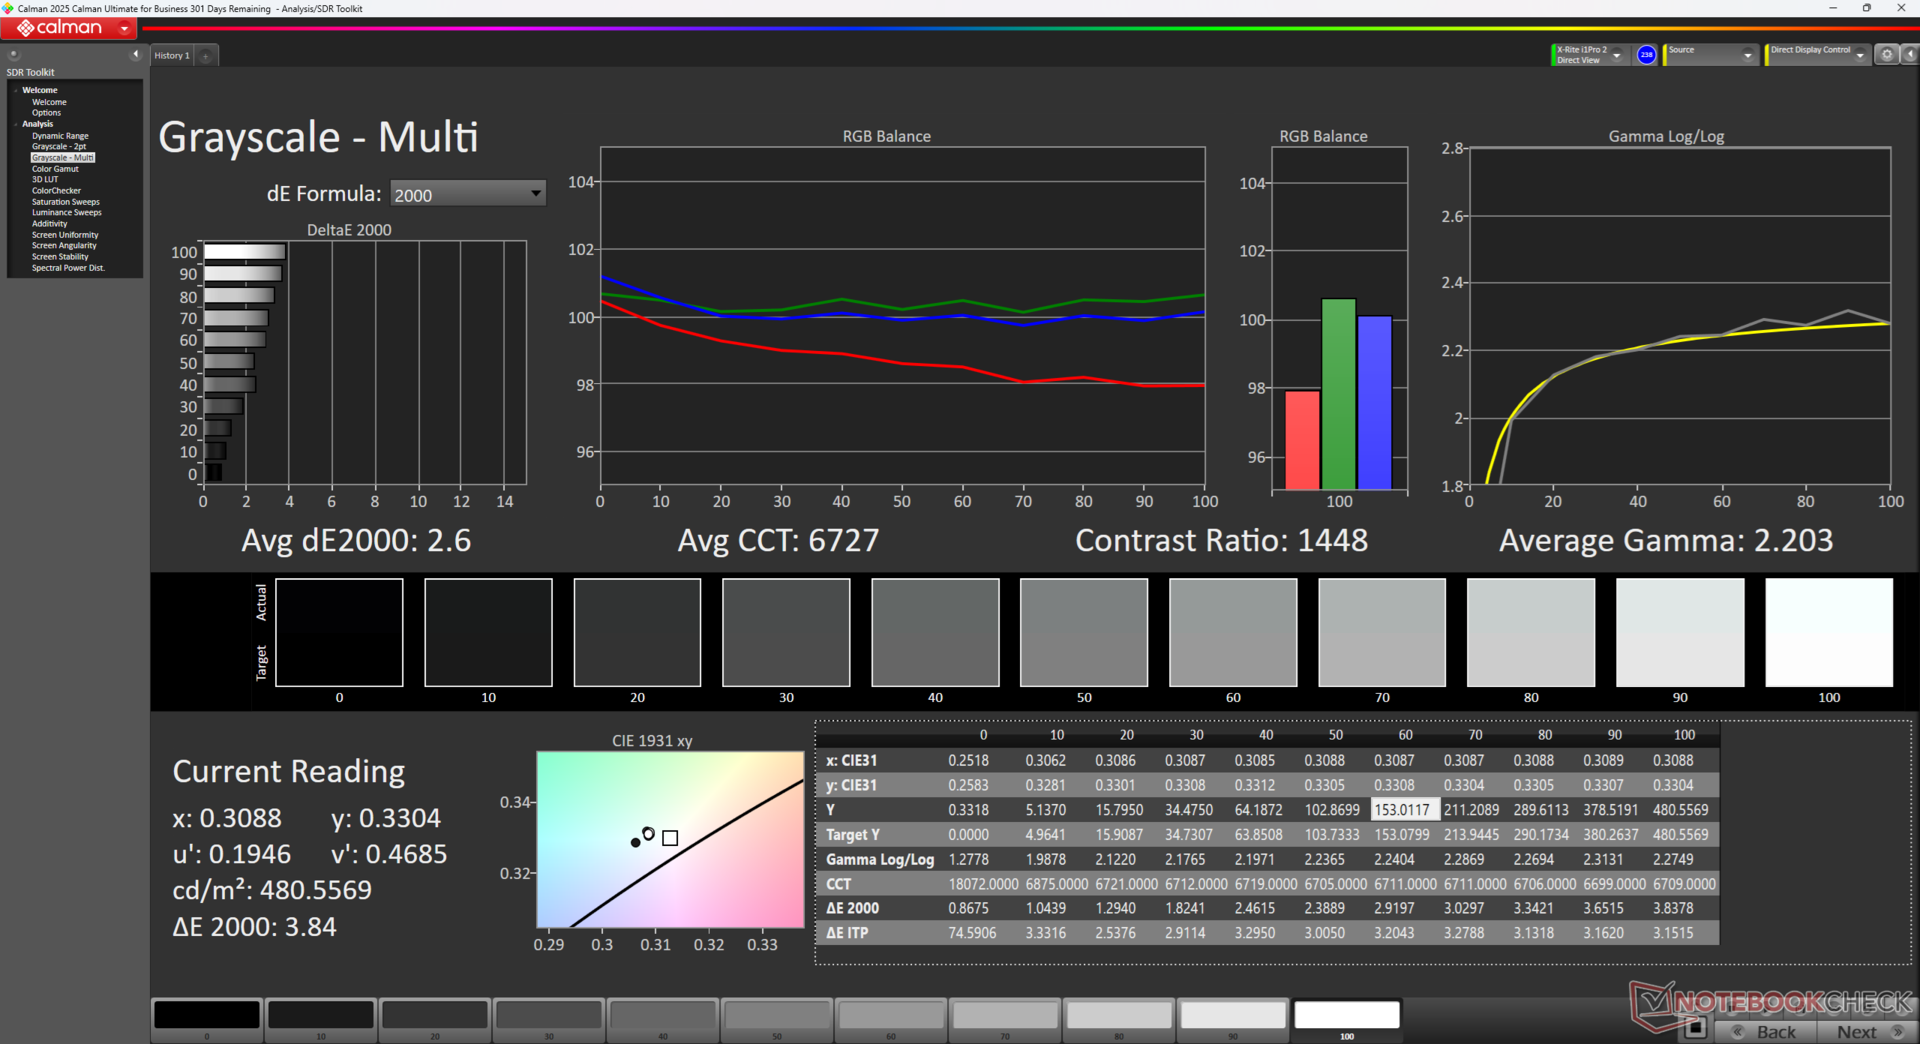
ΔE Greyscale Calman: 7.5 | ∀{0.09-98 Ø4.97}
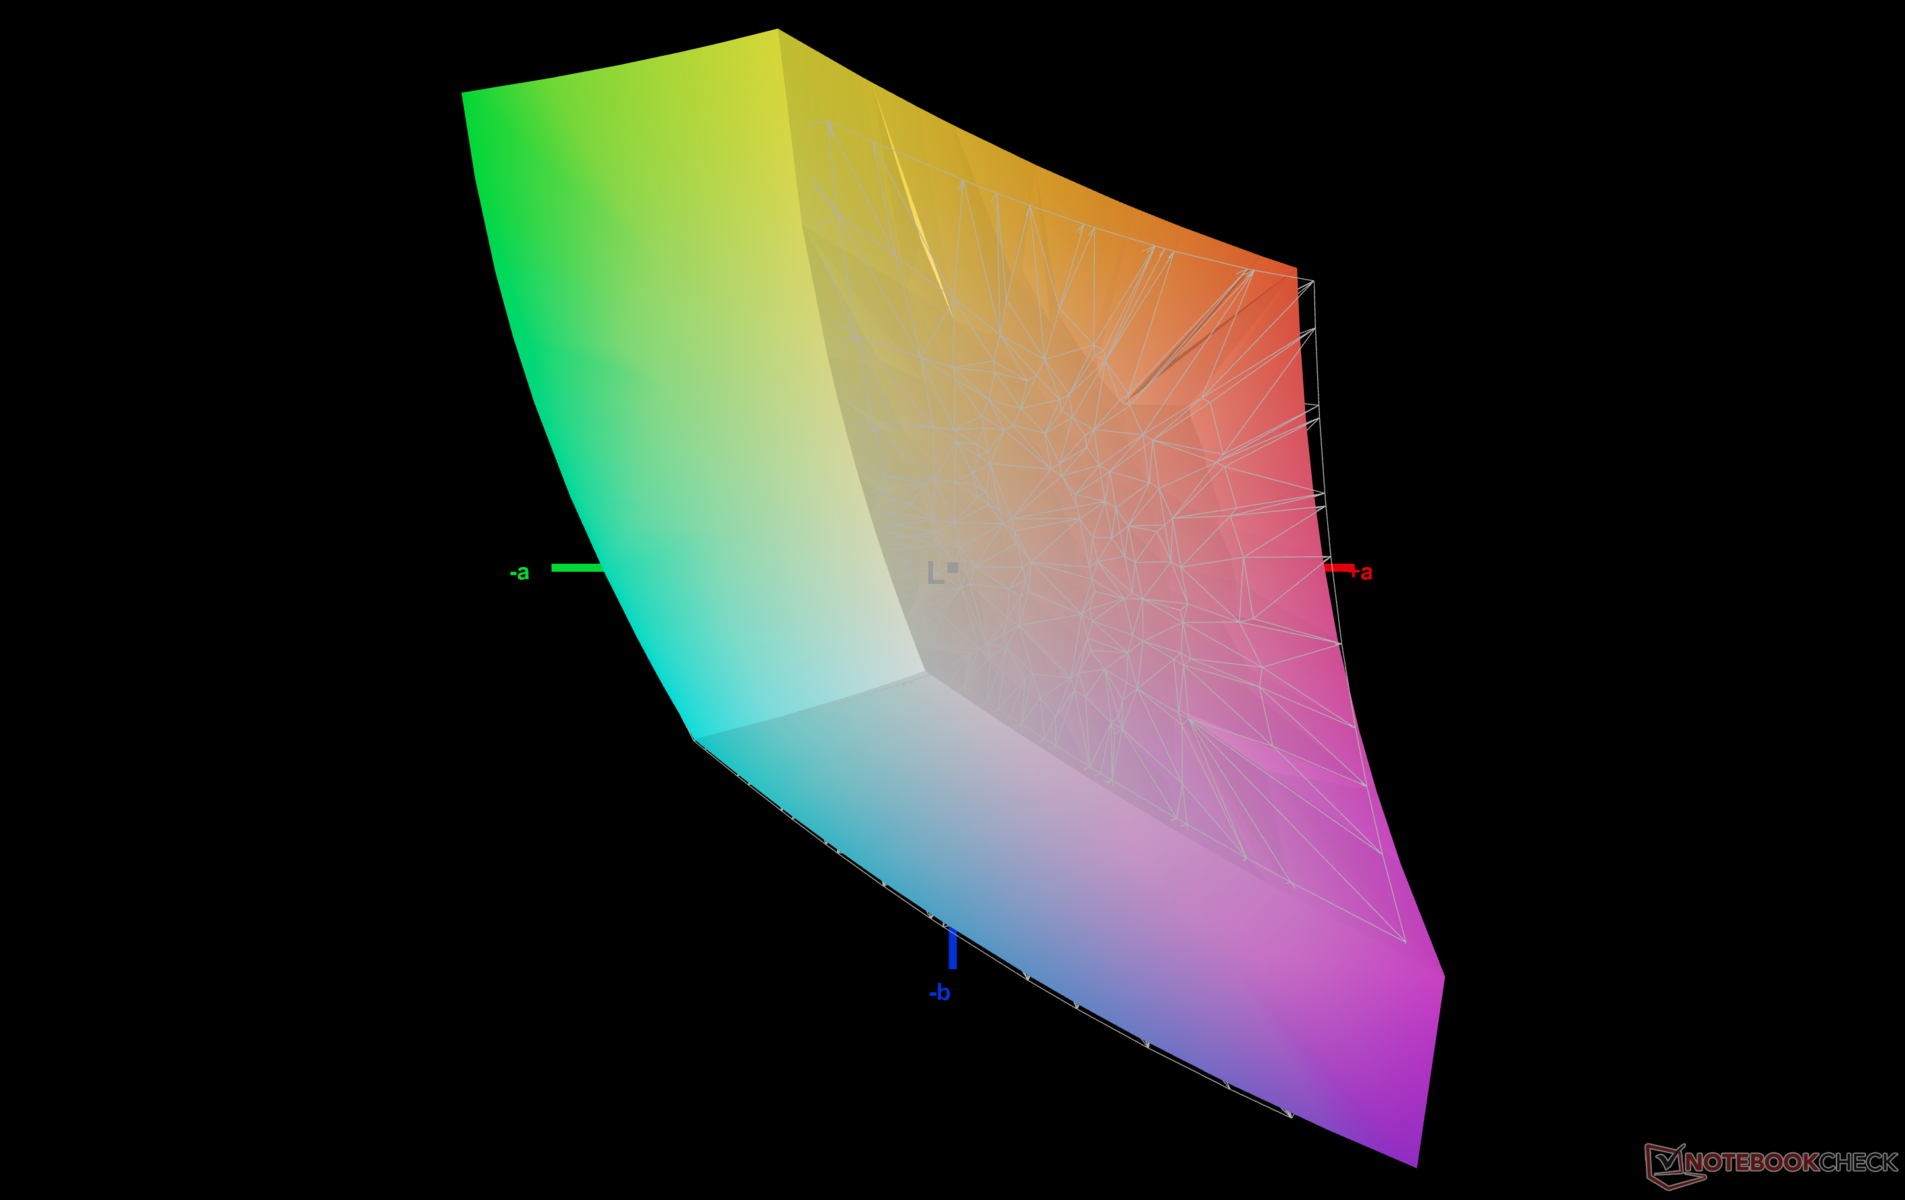
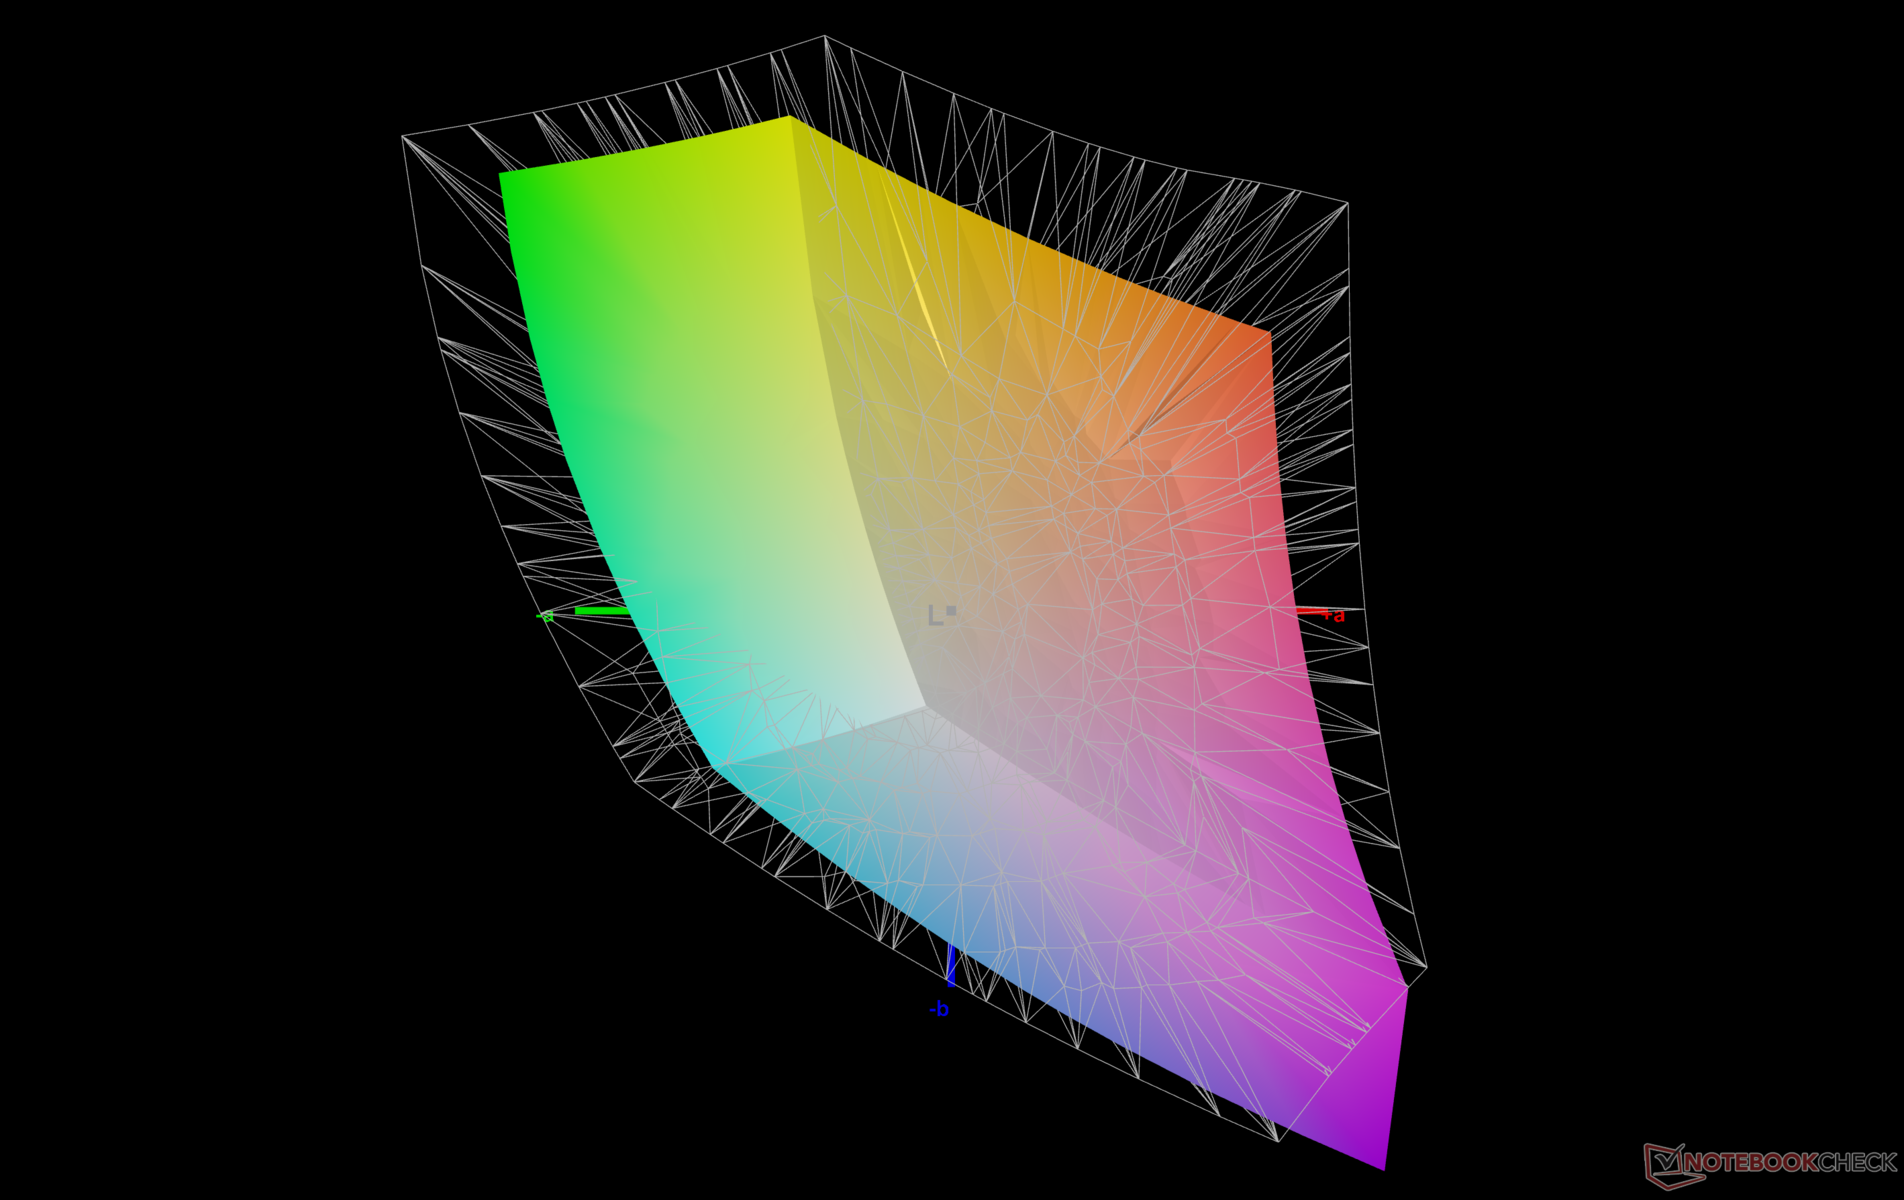
70.8% AdobeRGB 1998 (Argyll 3D)
95.9% sRGB (Argyll 3D)
71.9% Display P3 (Argyll 3D)
Gamma: 2.07
CCT: 6967 K
| Framework Laptop 13.5 Ryzen AI 9 HX 370 BOE NE135A1M-NY1, IPS, 2880x1920, 13.5", 120 Hz | Framework Laptop 13.5 Core Ultra 7 155H BOE NE135A1M-NY1, IPS, 2880x1920, 13.5", 120 Hz | Dell Pro 13 Premium PA13250 B133UAN (AUOBEB0), IPS, 1920x1200, 13.3", 60 Hz | MSI Summit E13 AI Evo A1MTG CMN13C6, IPS, 1920x1200, 13.3", 60 Hz | HP EliteBook x360 830 G10 7L7U1ET LGD06E5, IPS LED, 1920x1200, 13.3", Hz | Lenovo ThinkPad Z13 Gen 2 ATNA33AA02-0, OLED, 2880x1800, 13.3", 60 Hz | |
|---|---|---|---|---|---|---|
| Display | 2% | 4% | 2% | -8% | 27% | |
| Display P3 Coverage (%) | 71.9 | 72.8 1% | 74.3 3% | 71.6 0% | 63.2 -12% | 99.7 39% |
| sRGB Coverage (%) | 95.9 | 98.6 3% | 99.1 3% | 98.6 3% | 92.7 -3% | 100 4% |
| AdobeRGB 1998 Coverage (%) | 70.8 | 72.9 3% | 75.9 7% | 73.1 3% | 65.1 -8% | 97.3 37% |
| Response Times | -6% | -25% | -54% | -10% | 93% | |
| Response Time Grey 50% / Grey 80% * (ms) | 40 ? | 41.9 ? -5% | 52.8 ? -32% | 60 ? -50% | 39.8 ? 1% | 2.1 ? 95% |
| Response Time Black / White * (ms) | 22.3 ? | 23.7 ? -6% | 26.4 ? -18% | 35.1 ? -57% | 26.8 ? -20% | 2.2 ? 90% |
| PWM Frequency (Hz) | 60.1 ? | |||||
| Screen | 5% | 13% | 18% | 9% | 31% | |
| Brightness middle (cd/m²) | 529.9 | 498.5 -6% | 456 -14% | 405.2 -24% | 394 -26% | 372 -30% |
| Brightness (cd/m²) | 506 | 464 -8% | 460 -9% | 372 -26% | 372 -26% | 375 -26% |
| Brightness Distribution (%) | 94 | 86 -9% | 89 -5% | 88 -6% | 84 -11% | 99 5% |
| Black Level * (cd/m²) | 0.3 | 0.36 -20% | 0.23 23% | 0.34 -13% | 0.17 43% | |
| Contrast (:1) | 1766 | 1385 -22% | 1983 12% | 1192 -33% | 2318 31% | |
| Colorchecker dE 2000 * | 5.7 | 4.27 25% | 3.3 42% | 2.4 58% | 4.1 28% | 0.88 85% |
| Colorchecker dE 2000 max. * | 10.6 | 7.08 33% | 6.47 39% | 3.56 66% | 8.3 22% | 3.22 70% |
| Colorchecker dE 2000 calibrated * | 1.5 | 1.26 16% | 1.7 -13% | 0.54 64% | ||
| Greyscale dE 2000 * | 7.5 | 4.7 37% | 4.35 42% | 1.9 75% | 6.6 12% | 1.2 84% |
| Gamma | 2.07 106% | 2.09 105% | 2.51 88% | 2 110% | 2.17 101% | 2.18 101% |
| CCT | 6967 93% | 7417 88% | 6215 105% | 6503 100% | 6019 108% | 6326 103% |
| Total Average (Program / Settings) | 0% /
3% | -3% /
6% | -11% /
4% | -3% /
2% | 50% /
41% |
* ... smaller is better
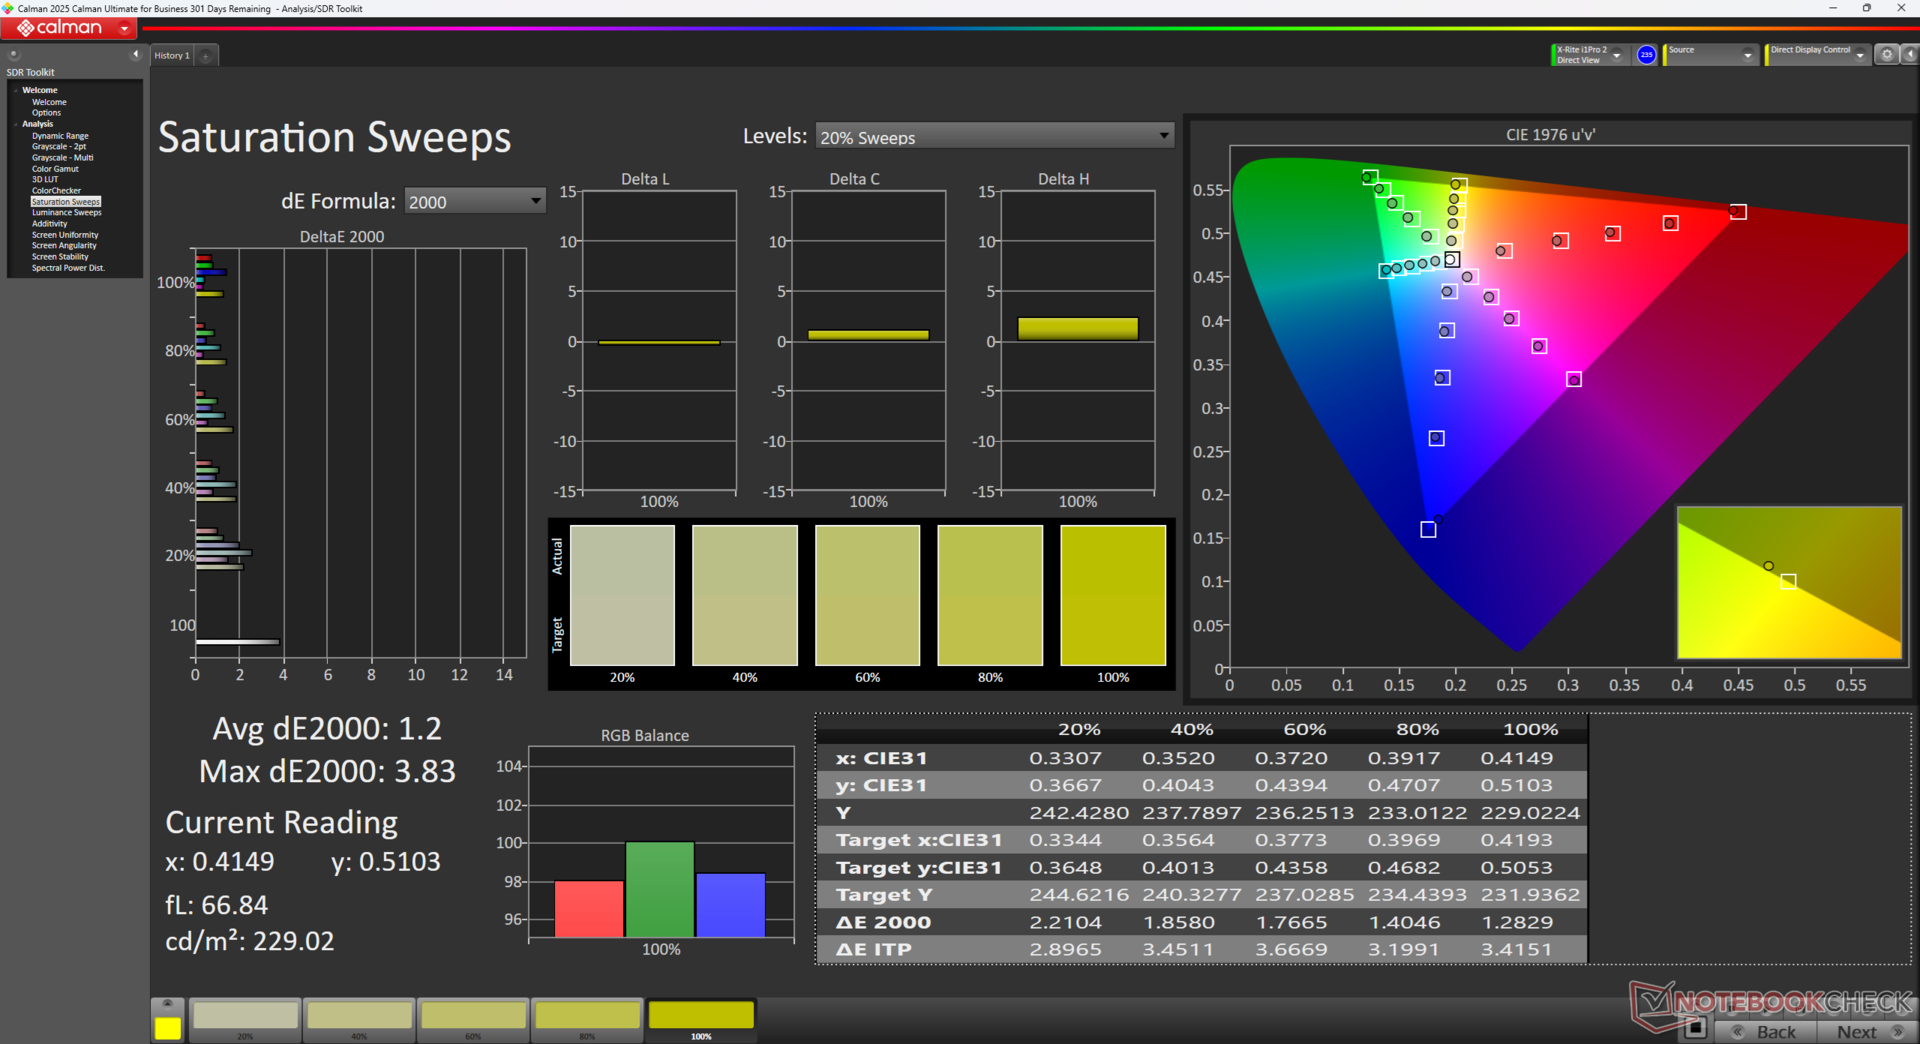
The display does not come pre-calibrated. We recommend applying our calibrated ICM profile above to get more accurate sRGB colors.
Display Response Times
| ↔ Response Time Black to White | ||
|---|---|---|
| 22.3 ms ... rise ↗ and fall ↘ combined | ↗ 11.1 ms rise | 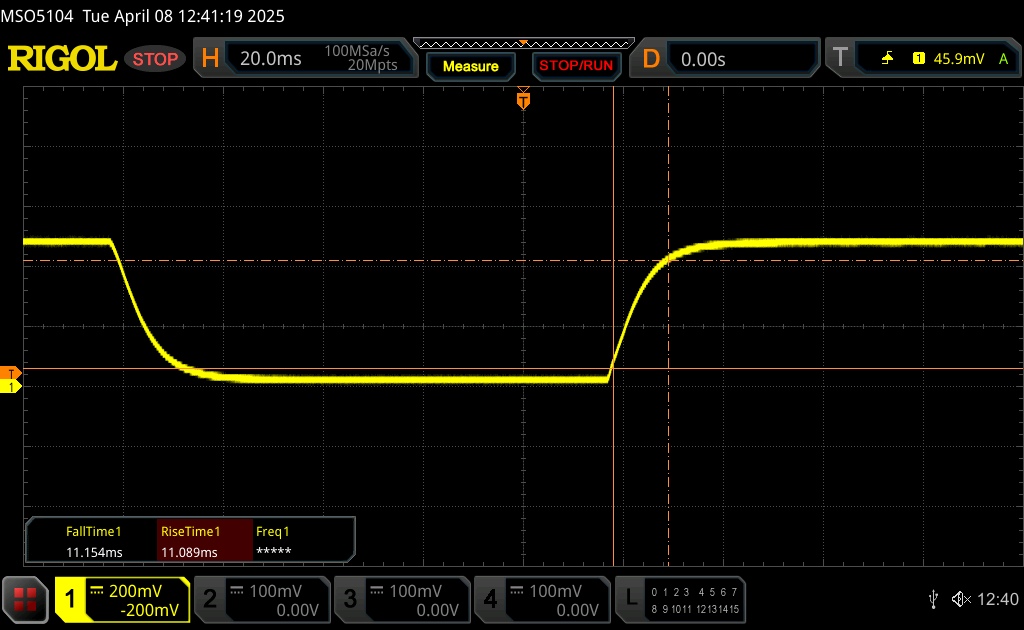 |
| ↘ 11.2 ms fall | ||
| The screen shows good response rates in our tests, but may be too slow for competitive gamers. In comparison, all tested devices range from 0.1 (minimum) to 240 (maximum) ms. » 51 % of all devices are better. This means that the measured response time is worse than the average of all tested devices (19.8 ms). | ||
| ↔ Response Time 50% Grey to 80% Grey | ||
| 40 ms ... rise ↗ and fall ↘ combined | ↗ 18.2 ms rise | 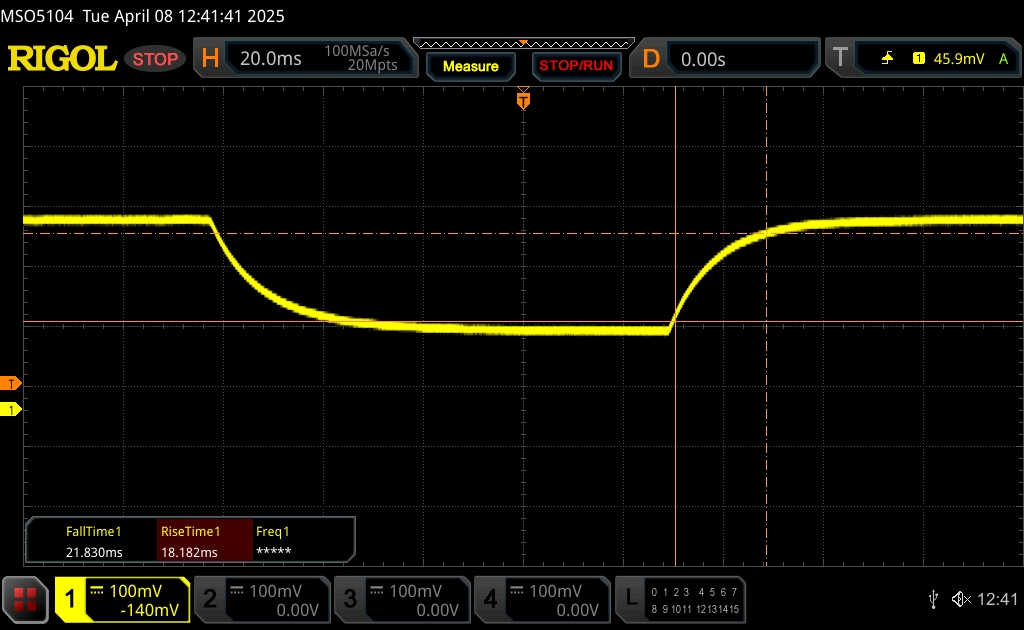 |
| ↘ 21.8 ms fall | ||
| The screen shows slow response rates in our tests and will be unsatisfactory for gamers. In comparison, all tested devices range from 0.165 (minimum) to 636 (maximum) ms. » 61 % of all devices are better. This means that the measured response time is worse than the average of all tested devices (31 ms). | ||
Screen Flickering / PWM (Pulse-Width Modulation)
| Screen flickering / PWM not detected | 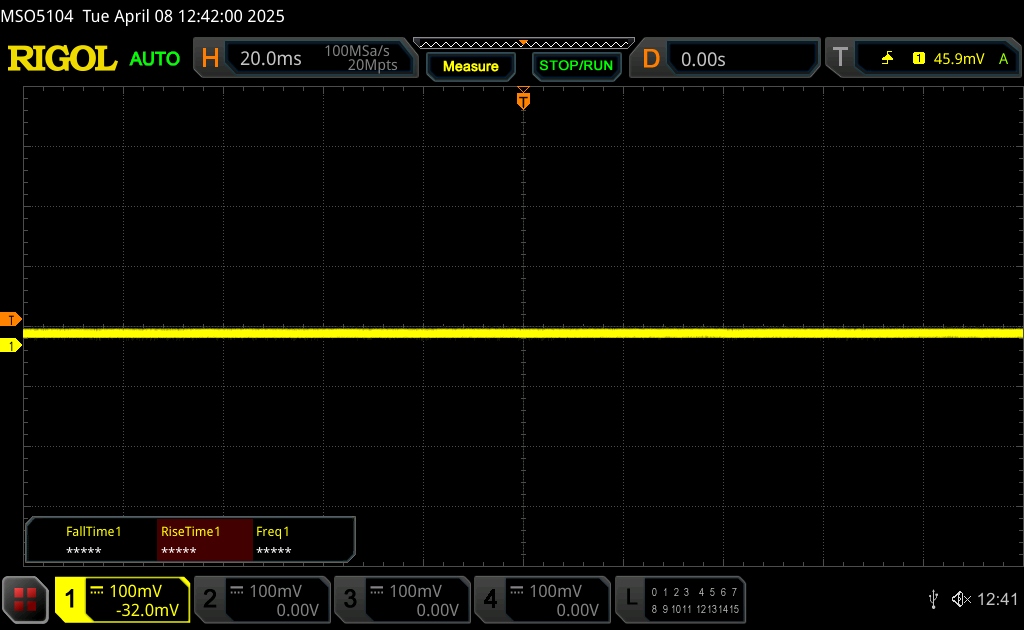 | ||
In comparison: 52 % of all tested devices do not use PWM to dim the display. If PWM was detected, an average of 7750 (minimum: 5 - maximum: 343500) Hz was measured. | |||

Performance
Testing Conditions
We set Windows to Performance mode prior to running the benchmarks below.
Processor
The Ryzen AI 9 HX 370 is easily 30 to 35 percent faster than last year's Intel Core Ultra 7 155H configuration when it comes to multi-threaded workloads. Performance sustainability could be better, however, as scores would slowly fall by up to 15 percent over time when running our CineBench R15 xT loop test as shown by the graph below. It is nonetheless still faster than previous Laptop 13.5 configurations even after accounting for the slight throttling.
Cinebench R15 Multi Loop
Cinebench R23: Multi Core | Single Core
Cinebench R20: CPU (Multi Core) | CPU (Single Core)
Cinebench R15: CPU Multi 64Bit | CPU Single 64Bit
Blender: v2.79 BMW27 CPU
7-Zip 18.03: 7z b 4 | 7z b 4 -mmt1
Geekbench 6.7: Multi-Core | Single-Core
Geekbench 5.5: Multi-Core | Single-Core
HWBOT x265 Benchmark v2.2: 4k Preset
LibreOffice : 20 Documents To PDF
R Benchmark 2.5: Overall mean
| Geekbench 6.7 / Multi-Core | |
| Average AMD Ryzen AI 9 HX 370 (11973 - 16311, n=26) | |
| Framework Laptop 13.5 Ryzen AI 9 HX 370 | |
| Framework Laptop 13.5 Core Ultra 7 155H | |
| Framework Laptop 13.5 Ryzen 7 7840U | |
| MSI Summit E13 AI Evo A1MTG | |
| Dell Pro 13 Premium PA13250 | |
| Dell Latitude 13 7350 | |
| Geekbench 6.7 / Single-Core | |
| Average AMD Ryzen AI 9 HX 370 (2780 - 2965, n=26) | |
| Framework Laptop 13.5 Ryzen AI 9 HX 370 | |
| Dell Pro 13 Premium PA13250 | |
| Framework Laptop 13.5 Ryzen 7 7840U | |
| Framework Laptop 13.5 Core Ultra 7 155H | |
| MSI Summit E13 AI Evo A1MTG | |
| Dell Latitude 13 7350 | |
* ... smaller is better
AIDA64: FP32 Ray-Trace | FPU Julia | CPU SHA3 | CPU Queen | FPU SinJulia | FPU Mandel | CPU AES | CPU ZLib | FP64 Ray-Trace | CPU PhotoWorxx
| Performance rating | |
| Average AMD Ryzen AI 9 HX 370 | |
| Framework Laptop 13.5 Ryzen AI 9 HX 370 | |
| Lenovo ThinkPad Z13 Gen 2 | |
| Framework Laptop 13.5 Core Ultra 7 155H | |
| MSI Summit E13 AI Evo A1MTG | |
| Dell Pro 13 Premium PA13250 | |
| HP EliteBook x360 830 G10 7L7U1ET | |
| AIDA64 / FP32 Ray-Trace | |
| Average AMD Ryzen AI 9 HX 370 (24673 - 37804, n=25) | |
| Framework Laptop 13.5 Ryzen AI 9 HX 370 | |
| Lenovo ThinkPad Z13 Gen 2 | |
| Framework Laptop 13.5 Core Ultra 7 155H | |
| Dell Pro 13 Premium PA13250 | |
| MSI Summit E13 AI Evo A1MTG | |
| HP EliteBook x360 830 G10 7L7U1ET | |
| AIDA64 / FPU SinJulia | |
| Average AMD Ryzen AI 9 HX 370 (16445 - 19120, n=26) | |
| Framework Laptop 13.5 Ryzen AI 9 HX 370 | |
| Lenovo ThinkPad Z13 Gen 2 | |
| Framework Laptop 13.5 Core Ultra 7 155H | |
| MSI Summit E13 AI Evo A1MTG | |
| Dell Pro 13 Premium PA13250 | |
| HP EliteBook x360 830 G10 7L7U1ET | |
| AIDA64 / FP64 Ray-Trace | |
| Average AMD Ryzen AI 9 HX 370 (13665 - 20648, n=26) | |
| Framework Laptop 13.5 Ryzen AI 9 HX 370 | |
| Lenovo ThinkPad Z13 Gen 2 | |
| Framework Laptop 13.5 Core Ultra 7 155H | |
| Dell Pro 13 Premium PA13250 | |
| MSI Summit E13 AI Evo A1MTG | |
| HP EliteBook x360 830 G10 7L7U1ET | |
| AIDA64 / CPU PhotoWorxx | |
| Average AMD Ryzen AI 9 HX 370 (36752 - 52671, n=26) | |
| Framework Laptop 13.5 Ryzen AI 9 HX 370 | |
| Dell Pro 13 Premium PA13250 | |
| Framework Laptop 13.5 Core Ultra 7 155H | |
| MSI Summit E13 AI Evo A1MTG | |
| Lenovo ThinkPad Z13 Gen 2 | |
| HP EliteBook x360 830 G10 7L7U1ET | |
Stress Test
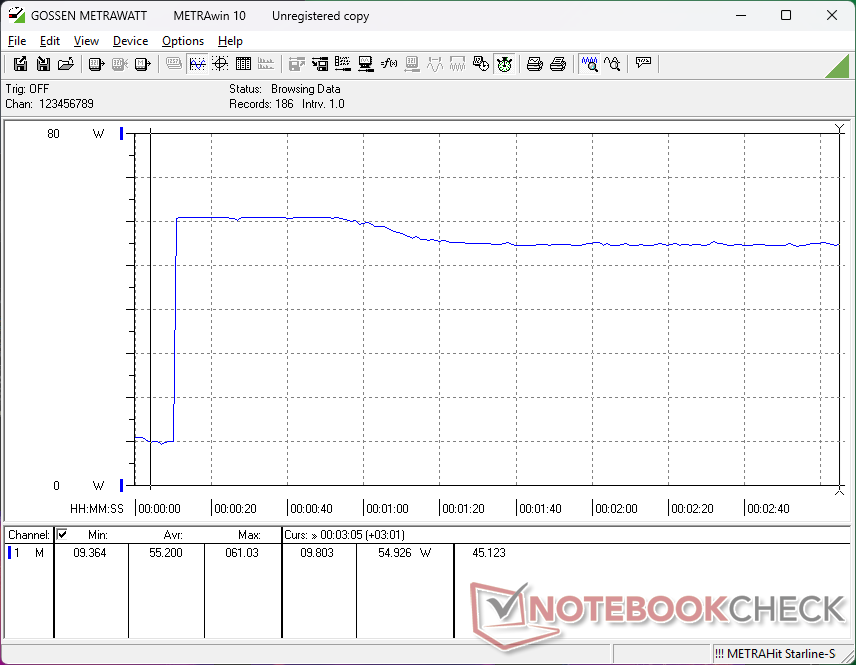
The CPU would boost to 3.2 GHz and 46 W when initiating Prime95 stress before falling to 2.6 GHz and 33 W after a minute into the test to represent limited maximum Turbo Boost. Core temperatures are otherwise similar to the Intel configuration if not slightly cooler when gaming.
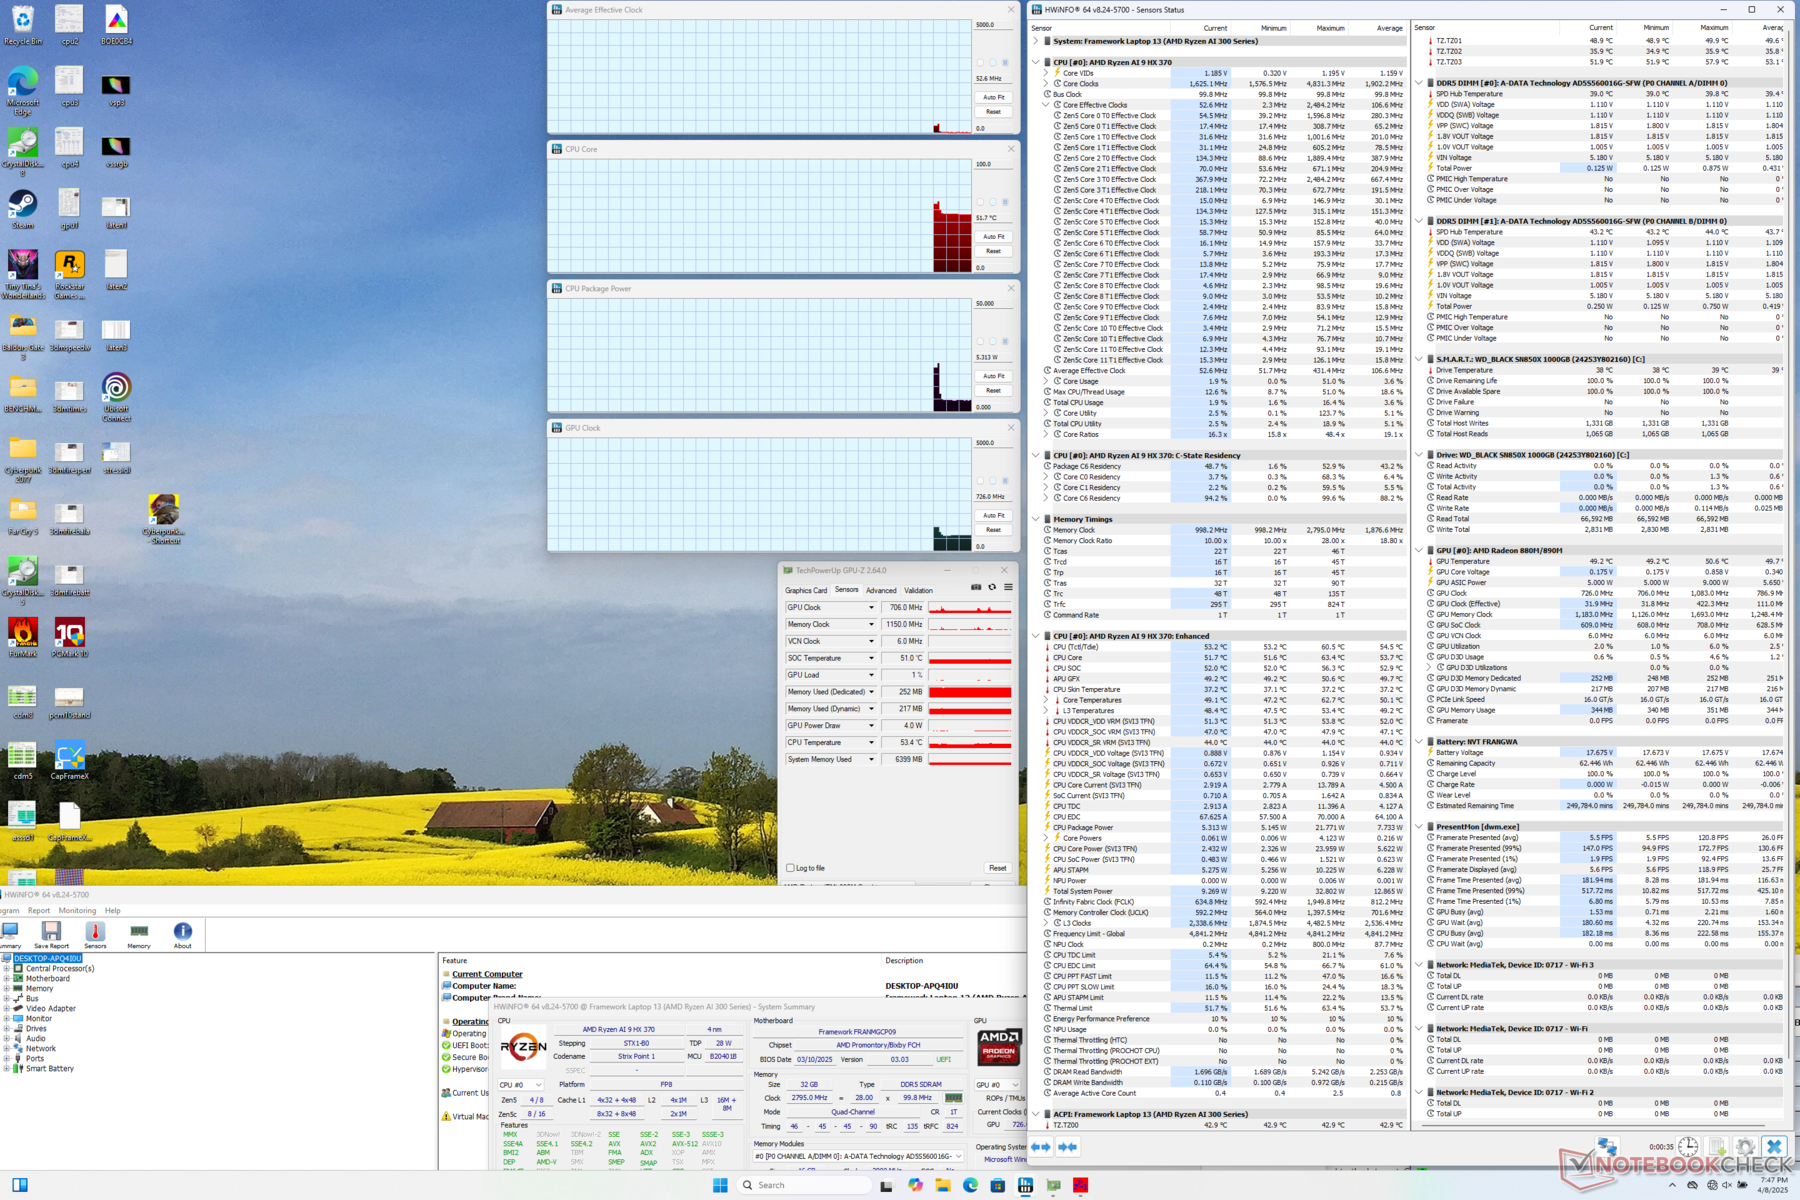
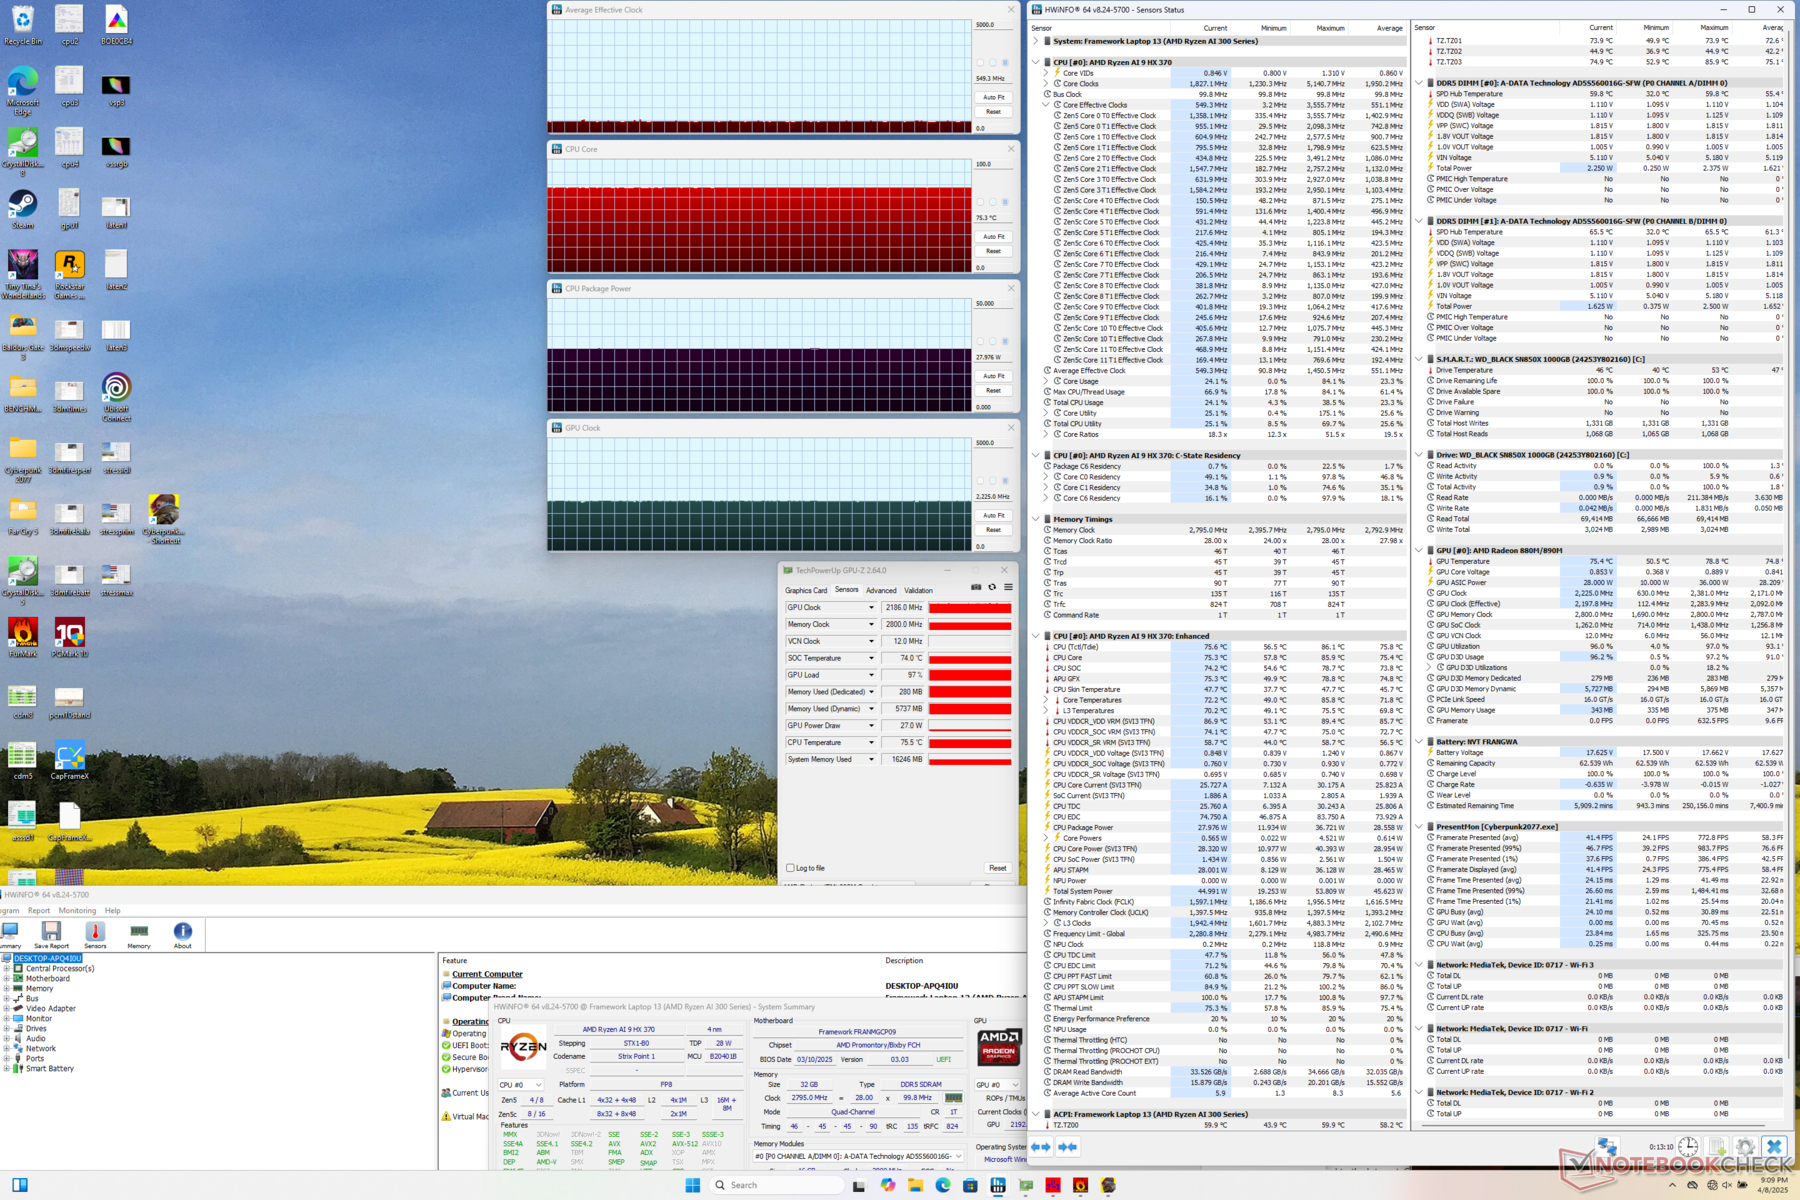
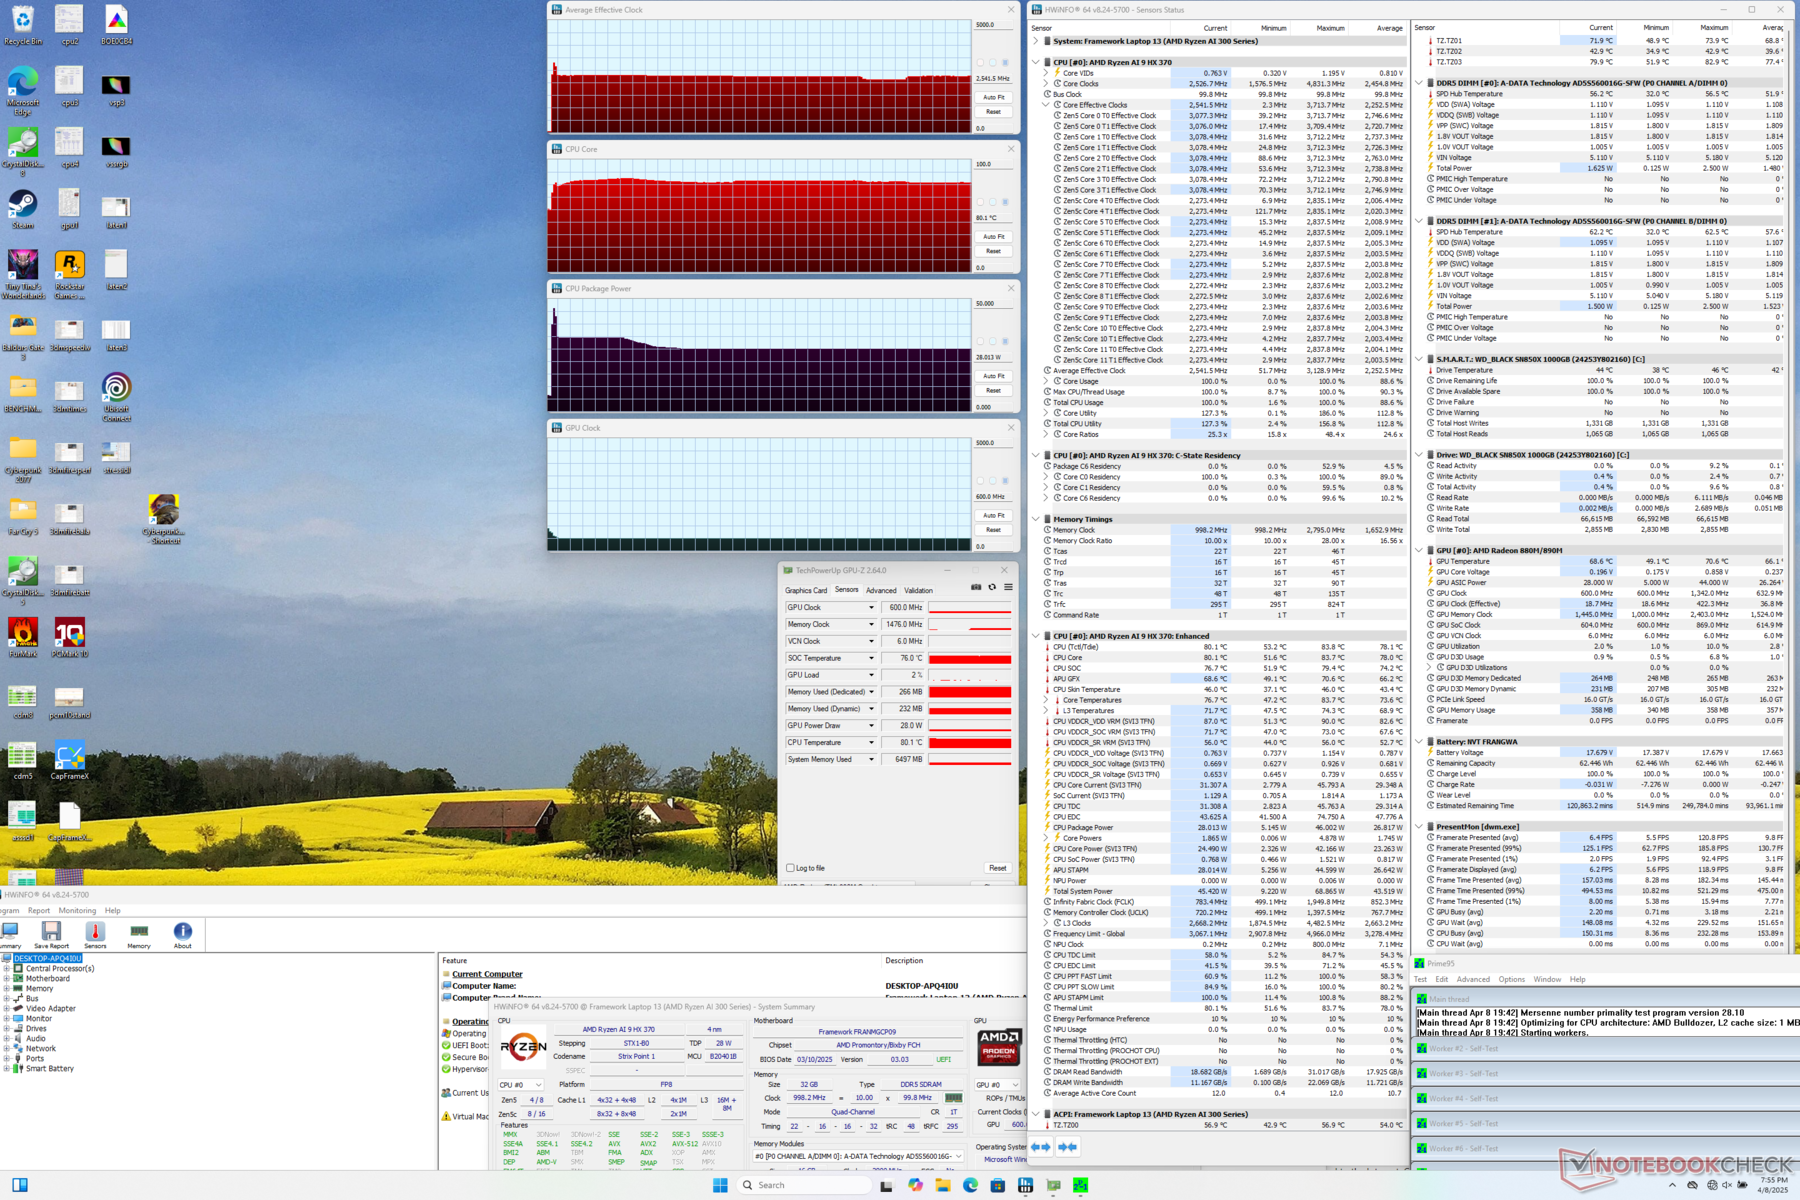
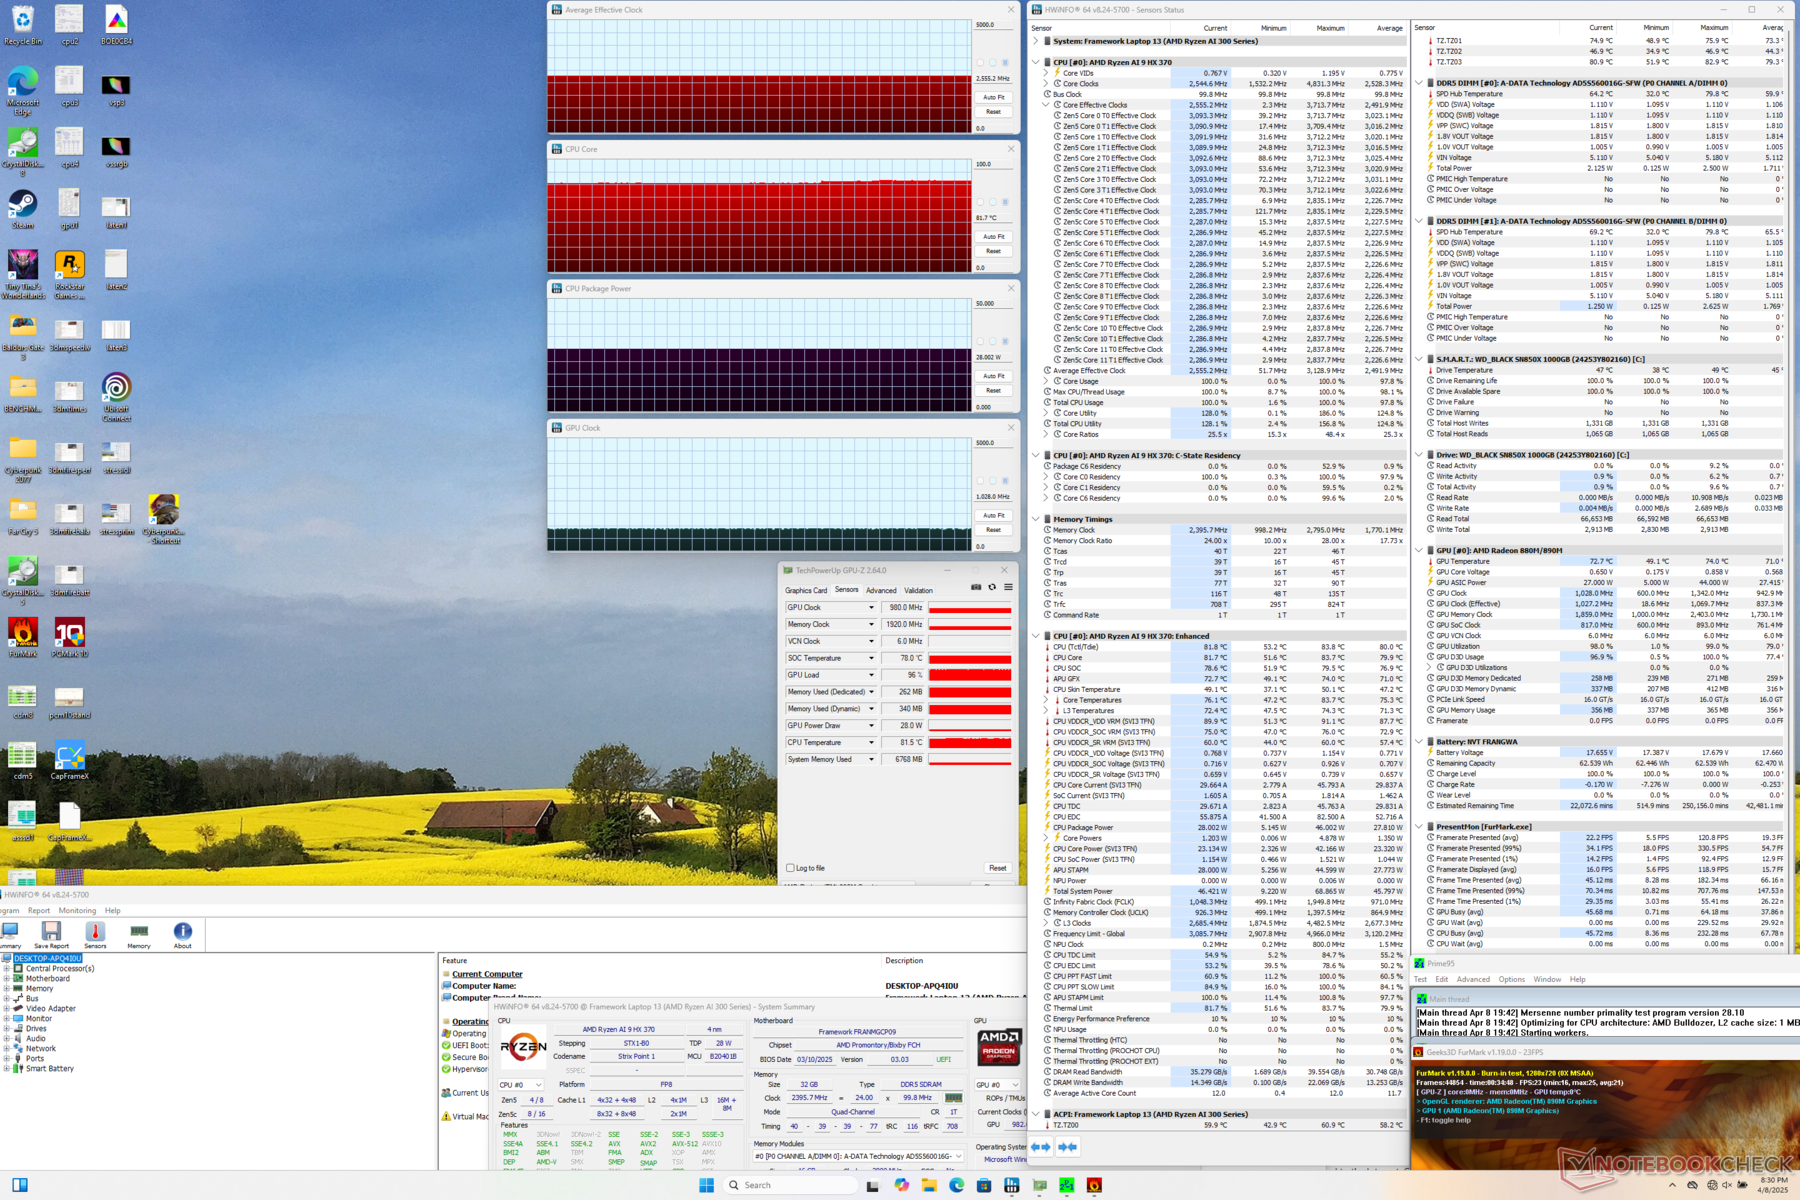
| Average CPU Clock (GHz) | GPU Clock (MHz) | Average CPU Temperature (°C) | |
| System Idle | -- | -- | 52 |
| Prime95 Stress | 2.5 | -- | 80 |
| Prime95 + FurMark Stress | 2.6 | 980 | 82 |
| Cyberpunk 2077 Stress | 0.6 | 2186 | 75 |
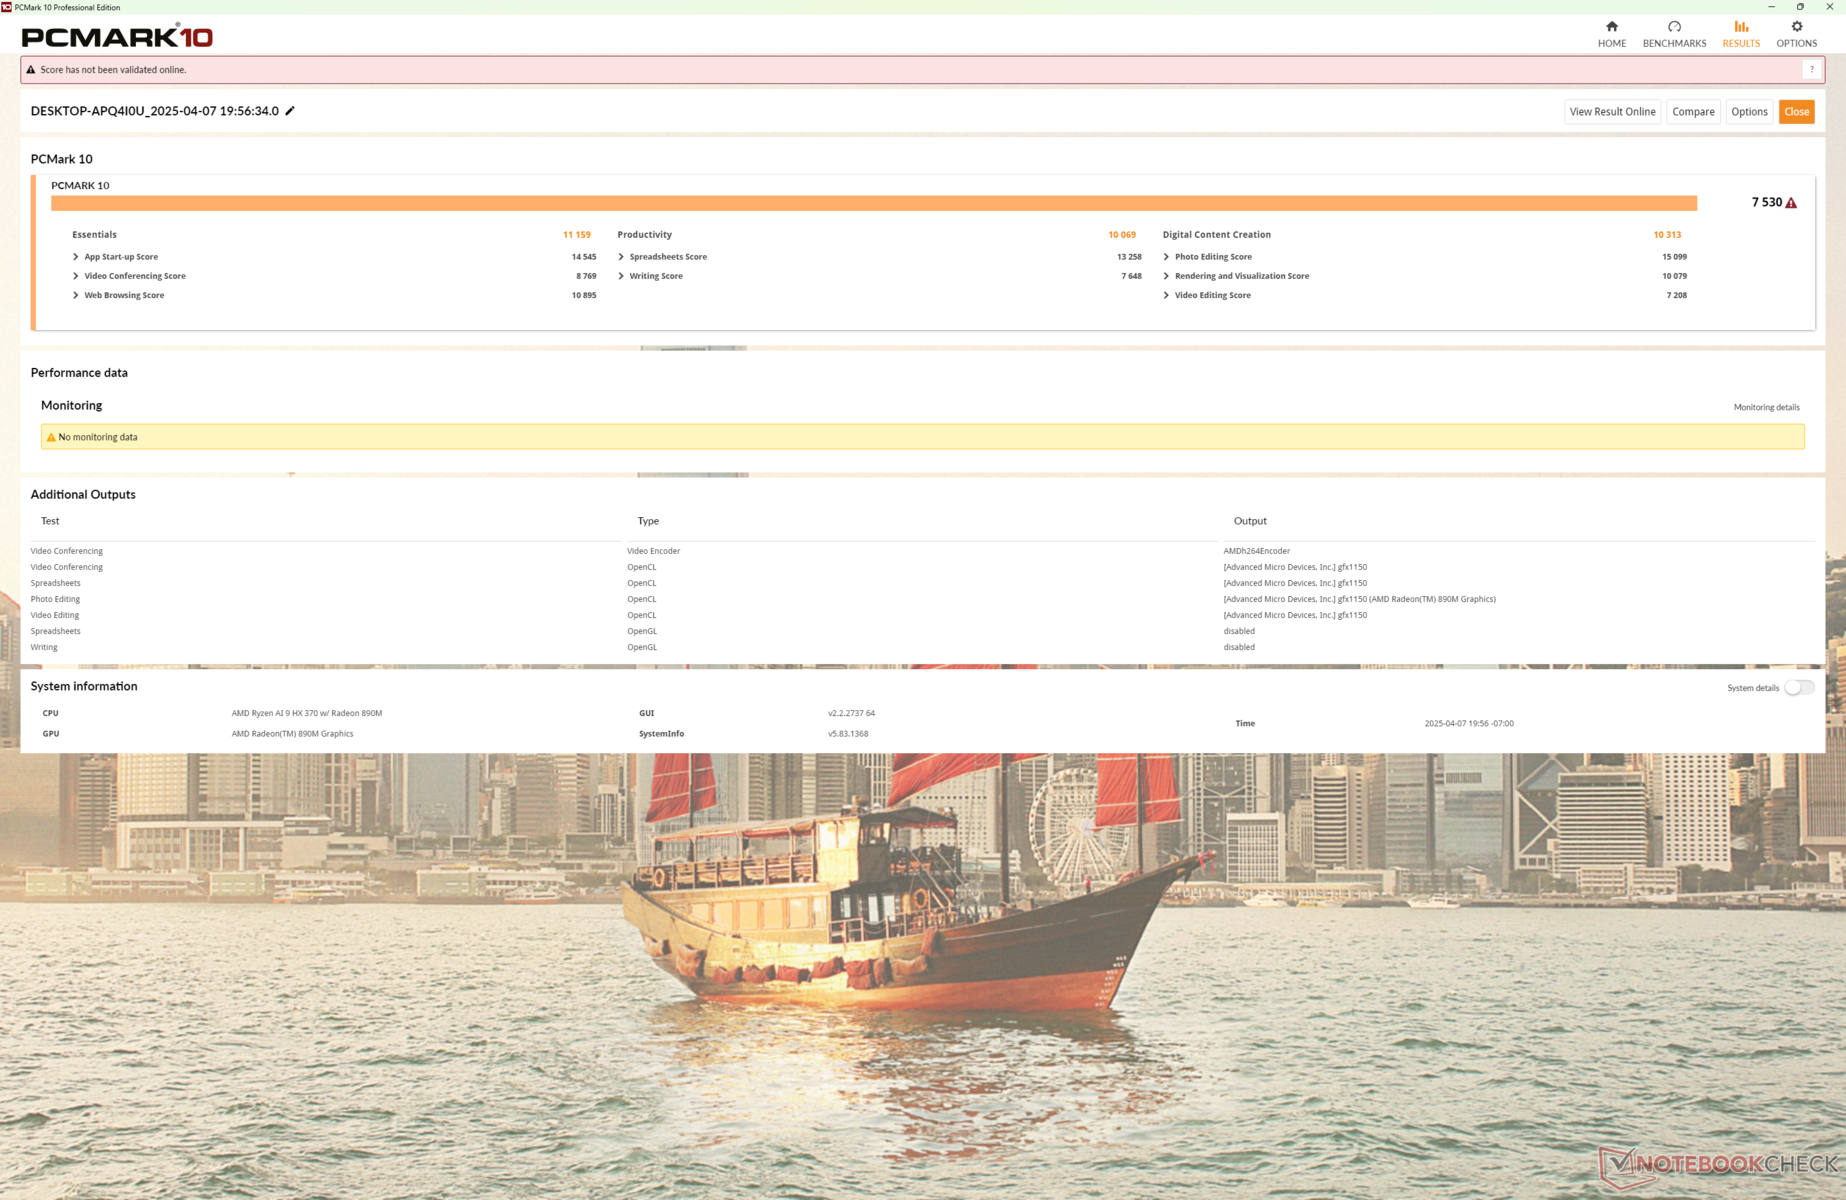
System Performance
CrossMark: Overall | Productivity | Creativity | Responsiveness
WebXPRT 3: Overall
WebXPRT 4: Overall
Mozilla Kraken 1.1: Total
| PCMark 10 / Score | |
| Framework Laptop 13.5 Ryzen AI 9 HX 370 | |
| Average AMD Ryzen AI 9 HX 370, AMD Radeon 890M (6577 - 7755, n=14) | |
| Lenovo ThinkPad Z13 Gen 2 | |
| Framework Laptop 13.5 Core Ultra 7 155H | |
| Dell Pro 13 Premium PA13250 | |
| HP EliteBook x360 830 G10 7L7U1ET | |
| MSI Summit E13 AI Evo A1MTG | |
| PCMark 10 / Essentials | |
| Framework Laptop 13.5 Ryzen AI 9 HX 370 | |
| Lenovo ThinkPad Z13 Gen 2 | |
| Framework Laptop 13.5 Core Ultra 7 155H | |
| Average AMD Ryzen AI 9 HX 370, AMD Radeon 890M (9277 - 11262, n=14) | |
| HP EliteBook x360 830 G10 7L7U1ET | |
| Dell Pro 13 Premium PA13250 | |
| MSI Summit E13 AI Evo A1MTG | |
| PCMark 10 / Productivity | |
| Framework Laptop 13.5 Ryzen AI 9 HX 370 | |
| Average AMD Ryzen AI 9 HX 370, AMD Radeon 890M (8497 - 10615, n=14) | |
| Lenovo ThinkPad Z13 Gen 2 | |
| Dell Pro 13 Premium PA13250 | |
| Framework Laptop 13.5 Core Ultra 7 155H | |
| HP EliteBook x360 830 G10 7L7U1ET | |
| MSI Summit E13 AI Evo A1MTG | |
| PCMark 10 / Digital Content Creation | |
| Average AMD Ryzen AI 9 HX 370, AMD Radeon 890M (9334 - 11422, n=14) | |
| Framework Laptop 13.5 Ryzen AI 9 HX 370 | |
| Framework Laptop 13.5 Core Ultra 7 155H | |
| Dell Pro 13 Premium PA13250 | |
| Lenovo ThinkPad Z13 Gen 2 | |
| MSI Summit E13 AI Evo A1MTG | |
| HP EliteBook x360 830 G10 7L7U1ET | |
| CrossMark / Overall | |
| Framework Laptop 13.5 Ryzen AI 9 HX 370 | |
| Average AMD Ryzen AI 9 HX 370, AMD Radeon 890M (1344 - 2040, n=13) | |
| Framework Laptop 13.5 Core Ultra 7 155H | |
| Dell Pro 13 Premium PA13250 | |
| MSI Summit E13 AI Evo A1MTG | |
| Lenovo ThinkPad Z13 Gen 2 | |
| HP EliteBook x360 830 G10 7L7U1ET | |
| CrossMark / Productivity | |
| Framework Laptop 13.5 Ryzen AI 9 HX 370 | |
| Framework Laptop 13.5 Core Ultra 7 155H | |
| Average AMD Ryzen AI 9 HX 370, AMD Radeon 890M (1166 - 1833, n=13) | |
| Dell Pro 13 Premium PA13250 | |
| MSI Summit E13 AI Evo A1MTG | |
| Lenovo ThinkPad Z13 Gen 2 | |
| HP EliteBook x360 830 G10 7L7U1ET | |
| CrossMark / Creativity | |
| Framework Laptop 13.5 Ryzen AI 9 HX 370 | |
| Average AMD Ryzen AI 9 HX 370, AMD Radeon 890M (1672 - 2439, n=13) | |
| Framework Laptop 13.5 Core Ultra 7 155H | |
| Dell Pro 13 Premium PA13250 | |
| Lenovo ThinkPad Z13 Gen 2 | |
| MSI Summit E13 AI Evo A1MTG | |
| HP EliteBook x360 830 G10 7L7U1ET | |
| CrossMark / Responsiveness | |
| Framework Laptop 13.5 Ryzen AI 9 HX 370 | |
| MSI Summit E13 AI Evo A1MTG | |
| Average AMD Ryzen AI 9 HX 370, AMD Radeon 890M (1067 - 1667, n=13) | |
| Framework Laptop 13.5 Core Ultra 7 155H | |
| Dell Pro 13 Premium PA13250 | |
| Lenovo ThinkPad Z13 Gen 2 | |
| HP EliteBook x360 830 G10 7L7U1ET | |
| WebXPRT 3 / Overall | |
| Framework Laptop 13.5 Ryzen AI 9 HX 370 | |
| Average AMD Ryzen AI 9 HX 370, AMD Radeon 890M (252 - 363, n=13) | |
| Lenovo ThinkPad Z13 Gen 2 | |
| Framework Laptop 13.5 Core Ultra 7 155H | |
| MSI Summit E13 AI Evo A1MTG | |
| HP EliteBook x360 830 G10 7L7U1ET | |
| Dell Pro 13 Premium PA13250 | |
| WebXPRT 4 / Overall | |
| Framework Laptop 13.5 Ryzen AI 9 HX 370 | |
| Framework Laptop 13.5 Core Ultra 7 155H | |
| Average AMD Ryzen AI 9 HX 370, AMD Radeon 890M (210 - 277, n=14) | |
| Dell Pro 13 Premium PA13250 | |
| Lenovo ThinkPad Z13 Gen 2 | |
| MSI Summit E13 AI Evo A1MTG | |
| Mozilla Kraken 1.1 / Total | |
| Lenovo ThinkPad Z13 Gen 2 | |
| HP EliteBook x360 830 G10 7L7U1ET | |
| MSI Summit E13 AI Evo A1MTG | |
| Framework Laptop 13.5 Core Ultra 7 155H | |
| Dell Pro 13 Premium PA13250 | |
| Framework Laptop 13.5 Ryzen AI 9 HX 370 | |
| Average AMD Ryzen AI 9 HX 370, AMD Radeon 890M (308 - 503, n=15) | |
* ... smaller is better
| PCMark 10 Score | 7530 points | |
Help | ||
| AIDA64 / Memory Latency | |
| Framework Laptop 13.5 Core Ultra 7 155H | |
| Average AMD Ryzen AI 9 HX 370 (86.7 - 119.4, n=26) | |
| Framework Laptop 13.5 Ryzen AI 9 HX 370 | |
| Framework Laptop 13.5 Ryzen 7 7840U | |
| Framework Laptop 13.5 12th Gen Intel | |
| Framework Laptop 13.5 | |
| Framework Laptop 13.5 13th Gen Intel | |
* ... smaller is better
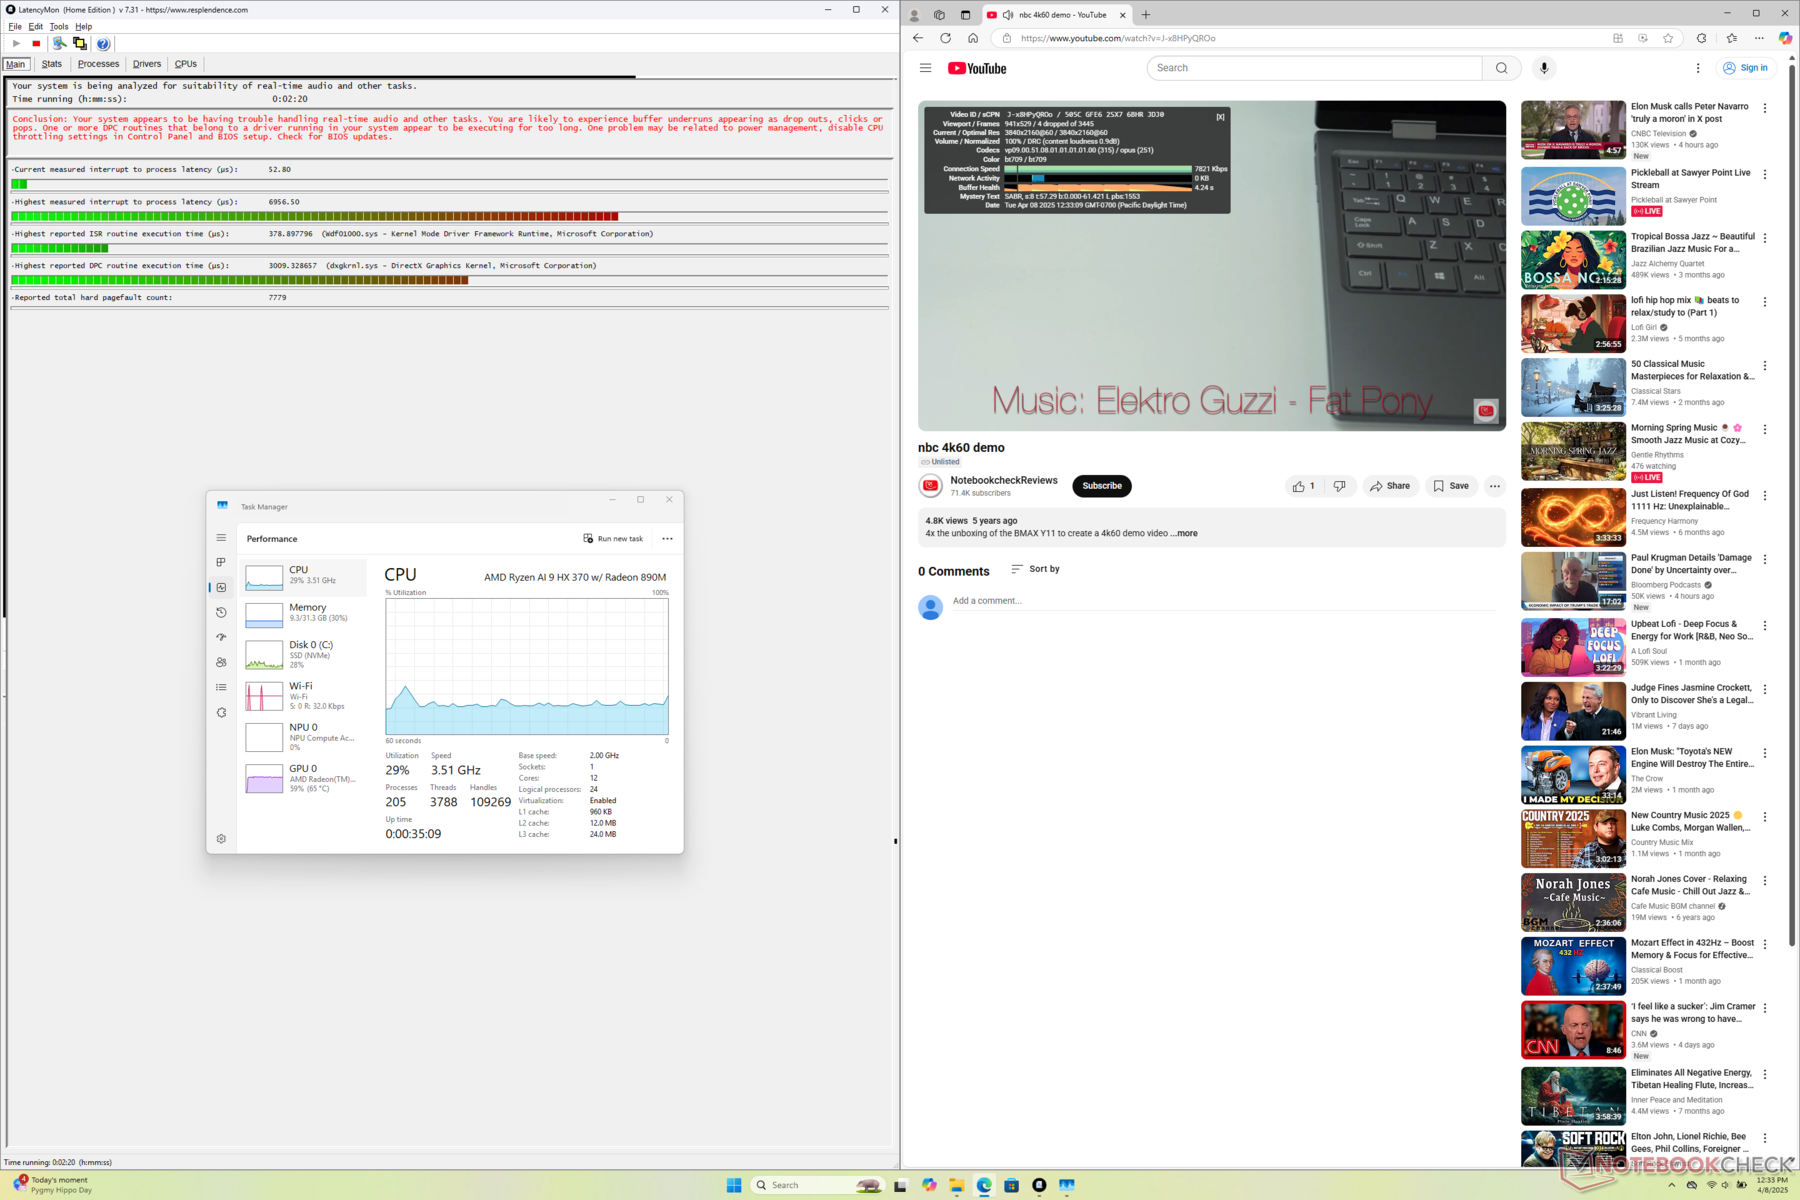
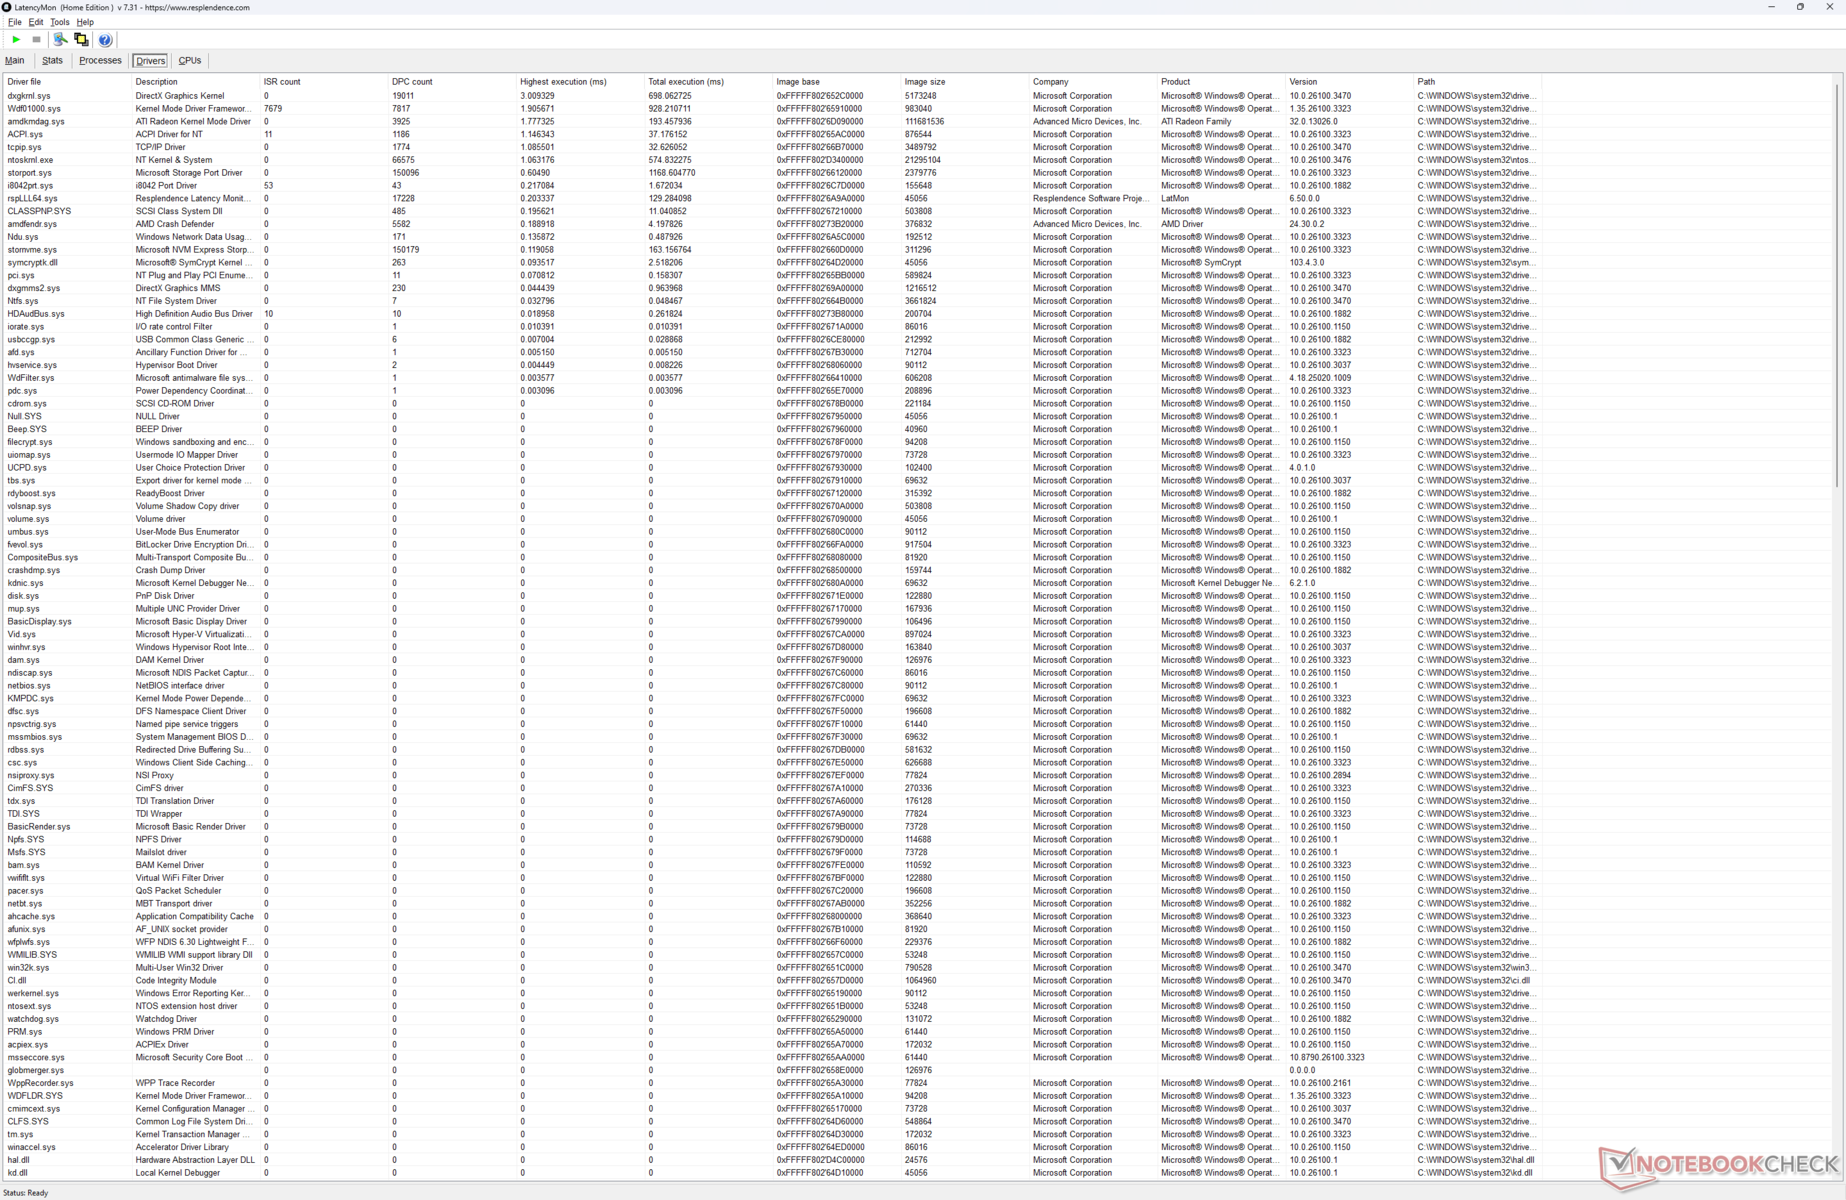
DPC Latency
The AMD configuration experiences slightly higher latency and frame drops than the Intel configuration when playing 4K60 video.
| DPC Latencies / LatencyMon - interrupt to process latency (max), Web, Youtube, Prime95 | |
| Framework Laptop 13.5 Ryzen AI 9 HX 370 | |
| MSI Summit E13 AI Evo A1MTG | |
| HP EliteBook x360 830 G10 7L7U1ET | |
| Lenovo ThinkPad Z13 Gen 2 | |
| Dell Pro 13 Premium PA13250 | |
| Framework Laptop 13.5 Core Ultra 7 155H | |
* ... smaller is better
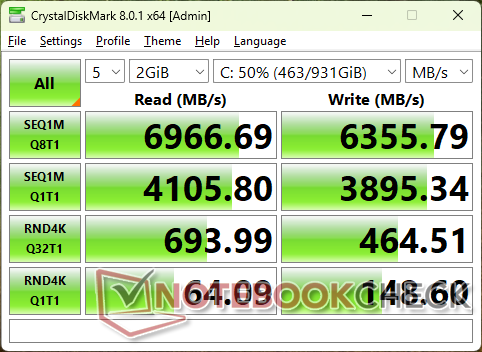
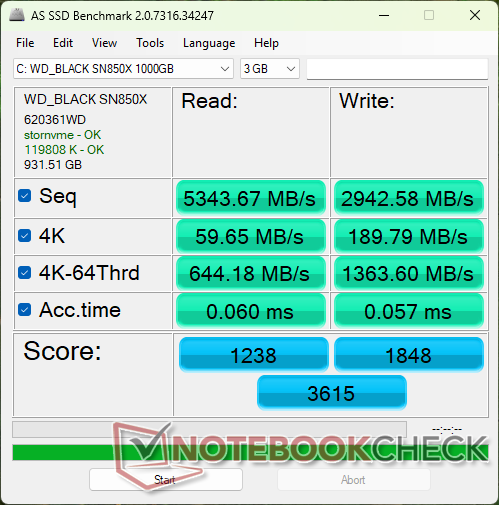
Storage Devices
Framework offers the same WD Black SN850X PCIe4 NVMe SSD as on last year's model.

* ... smaller is better
Disk Throttling: DiskSpd Read Loop, Queue Depth 8
GPU Performance
3DMark results are lower than expected by up to 15 percent when compared to the average laptop in our database with the same Radeon RX 890M GPU. When running actual games, however, our unit would still consistently outperform the older Core Ultra 7 155H and Arc 8 configuration by comfortable margins.
| 3DMark 11 Performance | 12491 points | |
| 3DMark Fire Strike Score | 7387 points | |
| 3DMark Time Spy Score | 3287 points | |
Help | ||
* ... smaller is better
Cyberpunk 2077 ultra FPS Chart
| low | med. | high | ultra | |
|---|---|---|---|---|
| GTA V (2015) | 172.7 | 159.9 | 71.2 | 29.7 |
| Dota 2 Reborn (2015) | 171.3 | 138.8 | 47.7 | 45.1 |
| Final Fantasy XV Benchmark (2018) | 73 | 39.1 | 27.8 | |
| X-Plane 11.11 (2018) | 71.6 | 55 | 45.4 | |
| Far Cry 5 (2018) | 80 | 45 | 42 | 40 |
| Strange Brigade (2018) | 174.4 | 70.8 | 58.7 | 48.5 |
| Tiny Tina's Wonderlands (2022) | 68.1 | 52.2 | 36.1 | 29.4 |
| F1 22 (2022) | 99.2 | 90.6 | 67.8 | 20.1 |
| Baldur's Gate 3 (2023) | 44.6 | 36.9 | 30.8 | 30 |
| Cyberpunk 2077 (2023) | 44.5 | 34.7 | 27.4 | 24.4 |
| Monster Hunter Wilds (2025) | 25 | 19.5 | 14 |
Emissions
System Noise
Fan noise profile remains largely the same with a similar floor and ceiling as the Intel configuration. Fan RPM, however, tends to increase slightly sooner with the AMD configuration.
Noise level
| Idle |
| 24.4 / 24.4 / 28 dB(A) |
| Load |
| 46.2 / 45.9 dB(A) |
 | ||
30 dB silent 40 dB(A) audible 50 dB(A) loud |
||
min: | ||
| Framework Laptop 13.5 Ryzen AI 9 HX 370 Radeon 890M, Ryzen AI 9 HX 370 | Framework Laptop 13.5 Core Ultra 7 155H Arc 8-Core, Ultra 7 155H | Dell Pro 13 Premium PA13250 Arc 140V, Core Ultra 7 268V, Micron 2550 1TB | MSI Summit E13 AI Evo A1MTG Arc 8-Core, Ultra 7 155H, Micron 2400 MTFDKBA1T0QFM | HP EliteBook x360 830 G10 7L7U1ET Iris Xe G7 80EUs, i5-1335U, Samsung PM991 MZVLQ512HBLU | Lenovo ThinkPad Z13 Gen 2 Radeon 780M, R7 PRO 7840U, SK hynix BC901 HFS001TEJ4X164N | |
|---|---|---|---|---|---|---|
| Noise | 4% | 10% | 2% | 12% | 4% | |
| off / environment * (dB) | 24.2 | 24 1% | 23 5% | 24 1% | 23.2 4% | 25.1 -4% |
| Idle Minimum * (dB) | 24.4 | 24.1 1% | 23 6% | 24.1 1% | 23.2 5% | 25.8 -6% |
| Idle Average * (dB) | 24.4 | 25.1 -3% | 23 6% | 24.8 -2% | 23.2 5% | 25.8 -6% |
| Idle Maximum * (dB) | 28 | 27 4% | 23 18% | 26.5 5% | 23.2 17% | 28.3 -1% |
| Load Average * (dB) | 46.2 | 38.4 17% | 37 20% | 39.3 15% | 29.4 36% | 28.3 39% |
| Cyberpunk 2077 ultra * (dB) | 45.8 | 43.7 5% | 42.74 7% | 45 2% | ||
| Load Maximum * (dB) | 45.9 | 45.8 -0% | 42.74 7% | 49.1 -7% | 42.5 7% | 44.8 2% |
| Witcher 3 ultra * (dB) | 42.3 | 44.8 |
* ... smaller is better
Temperature
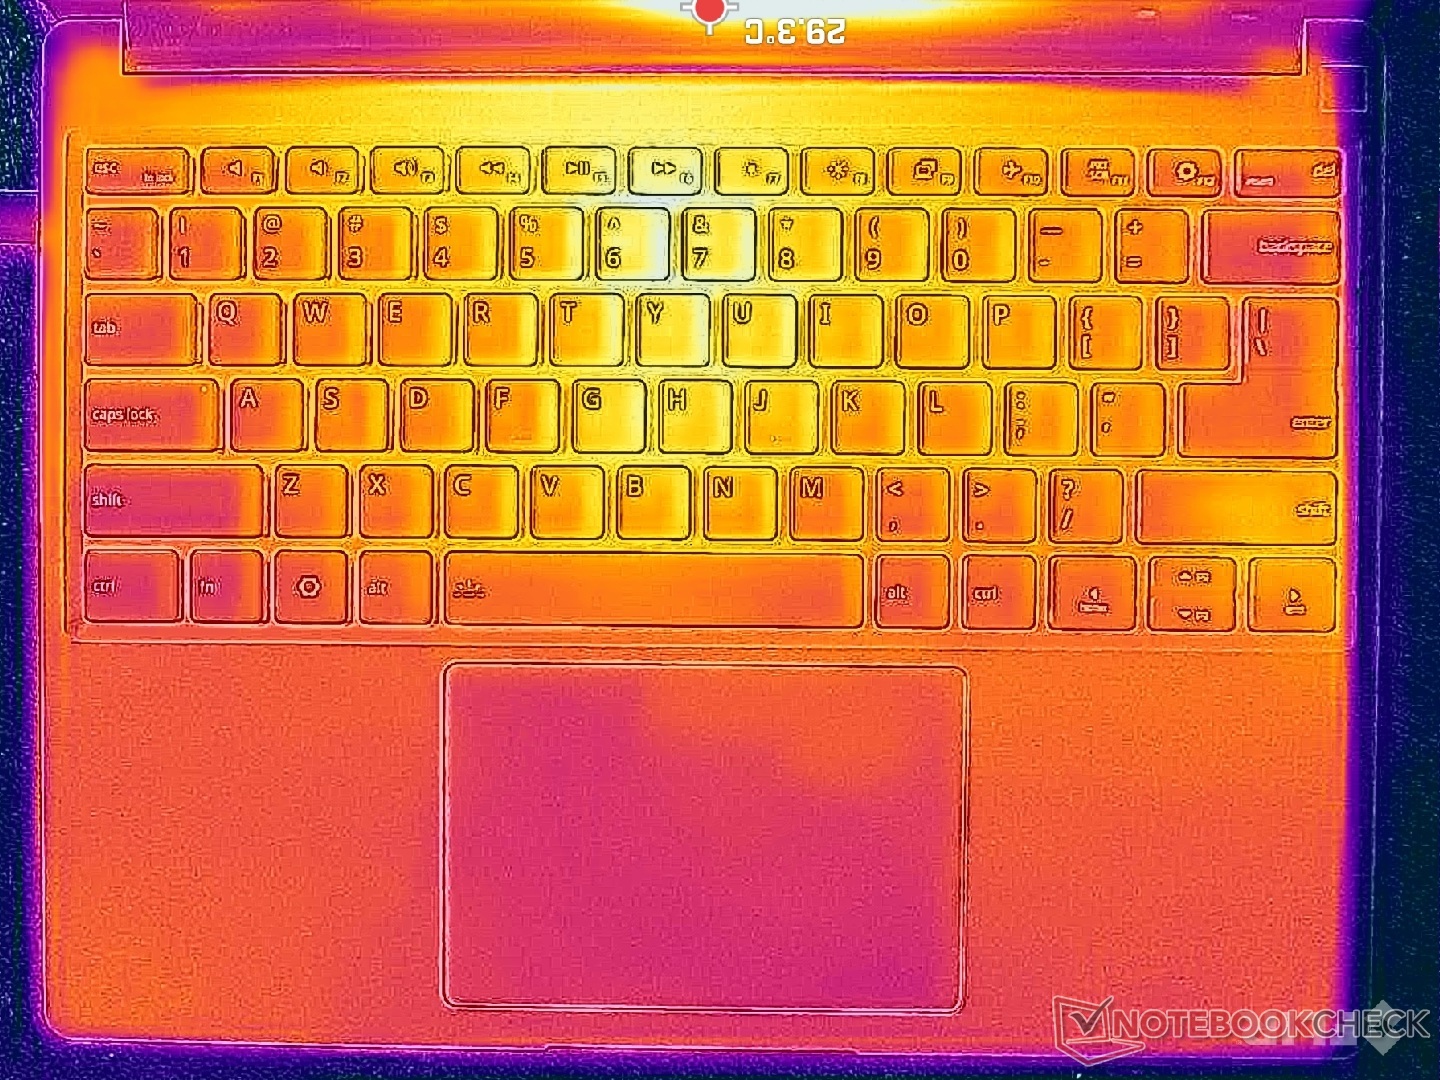
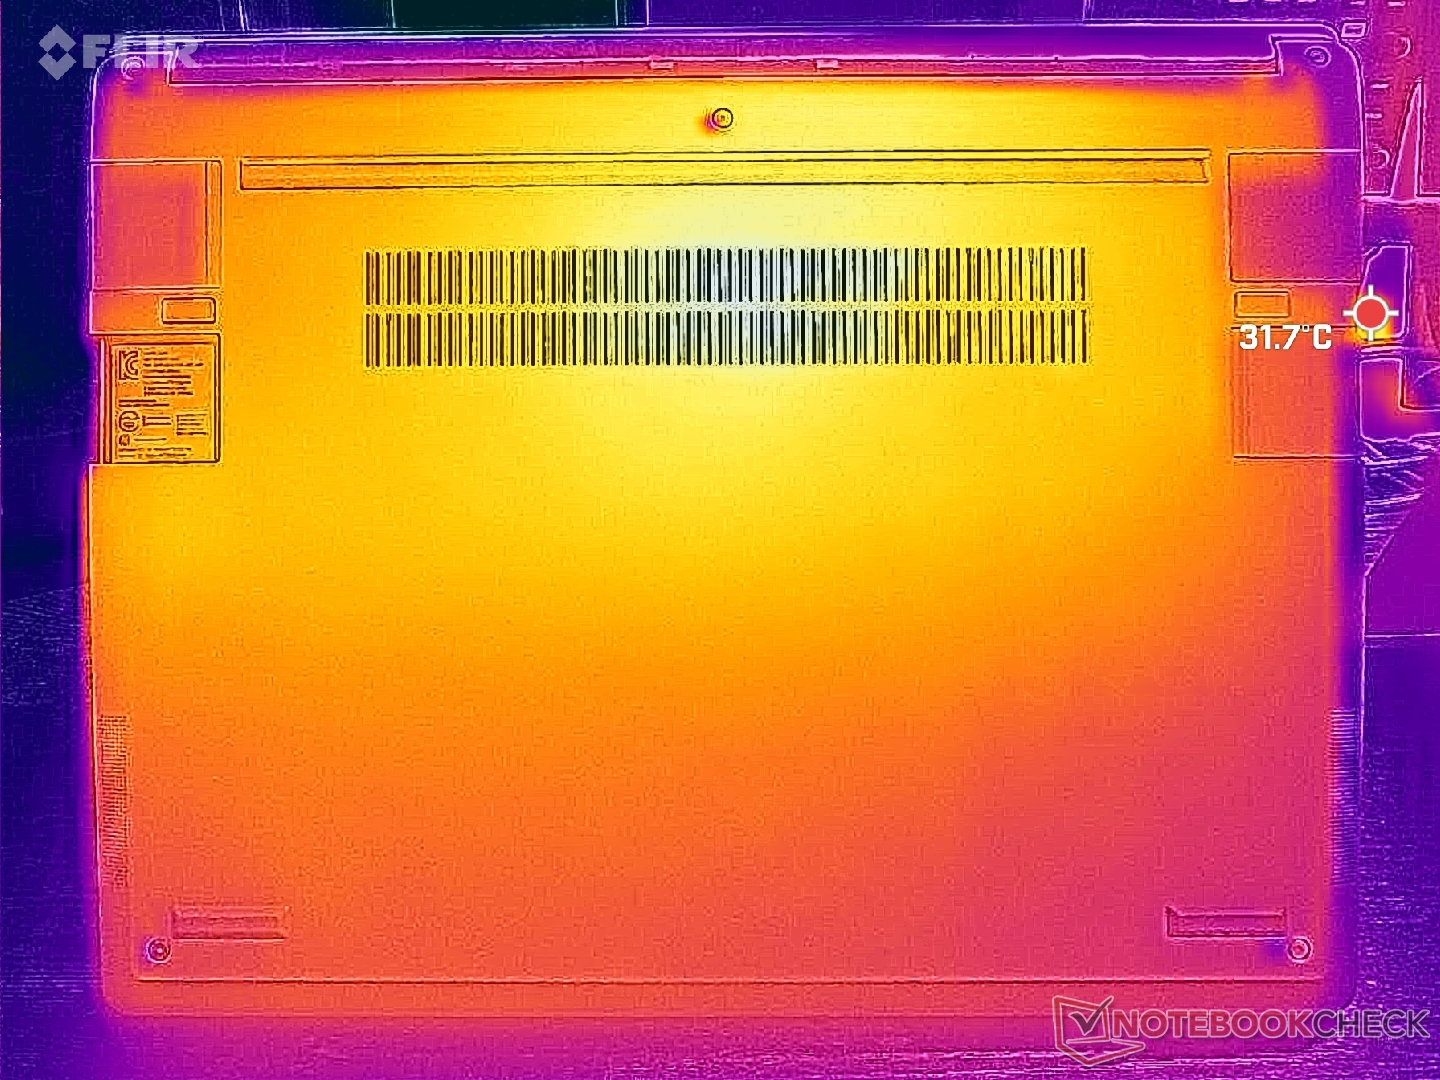
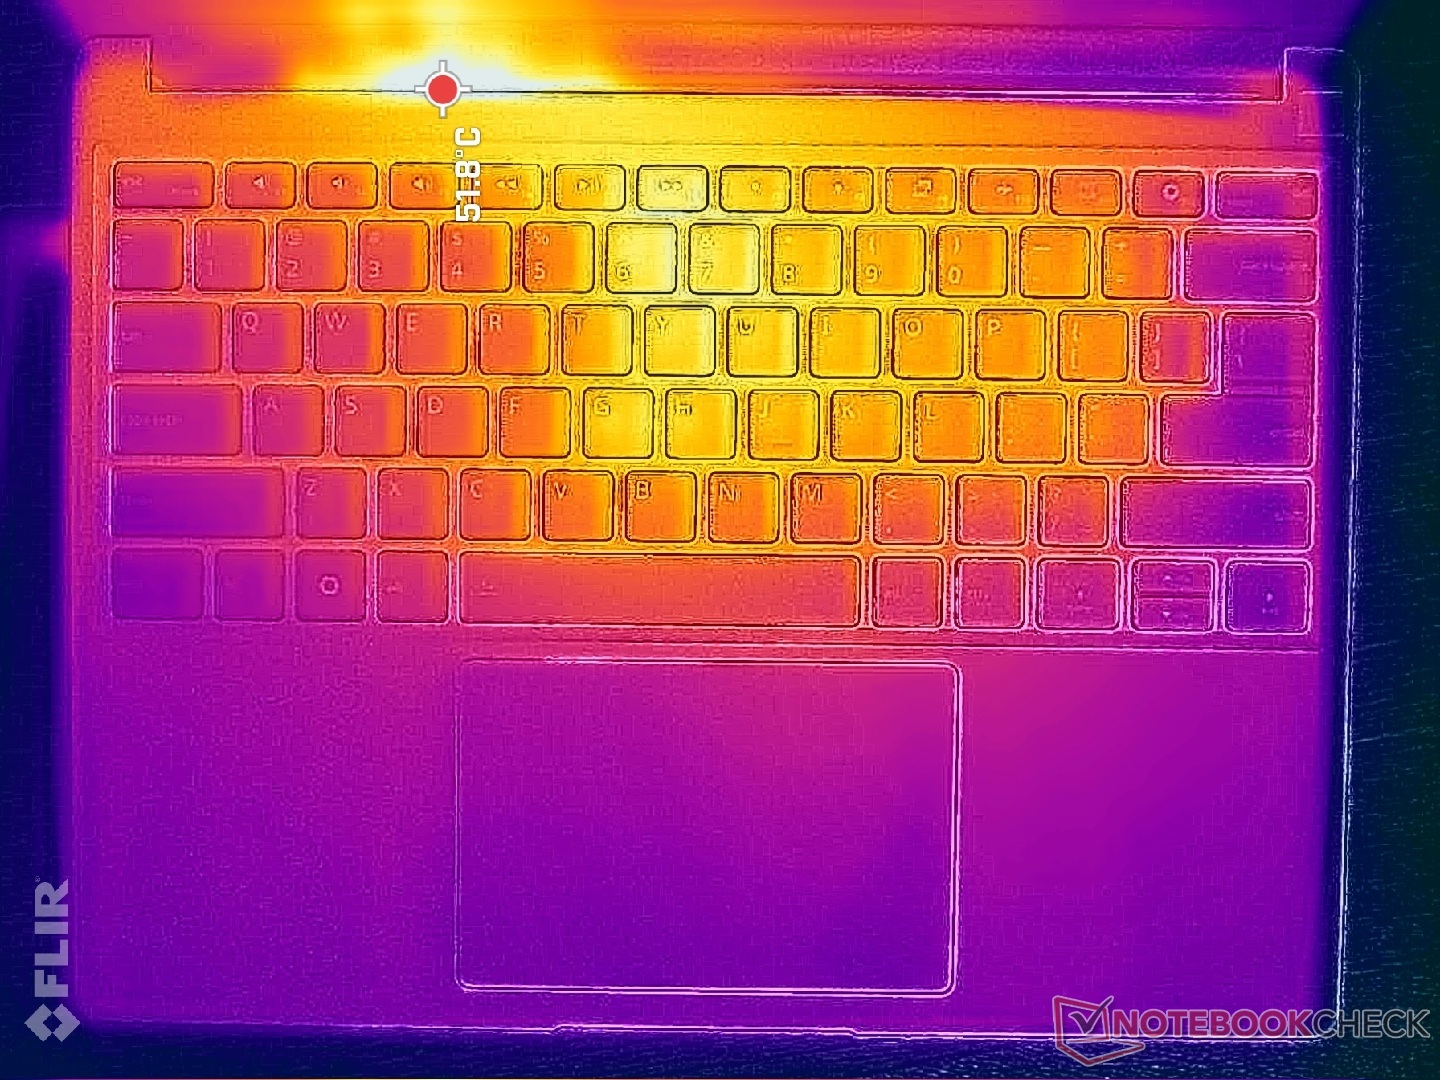
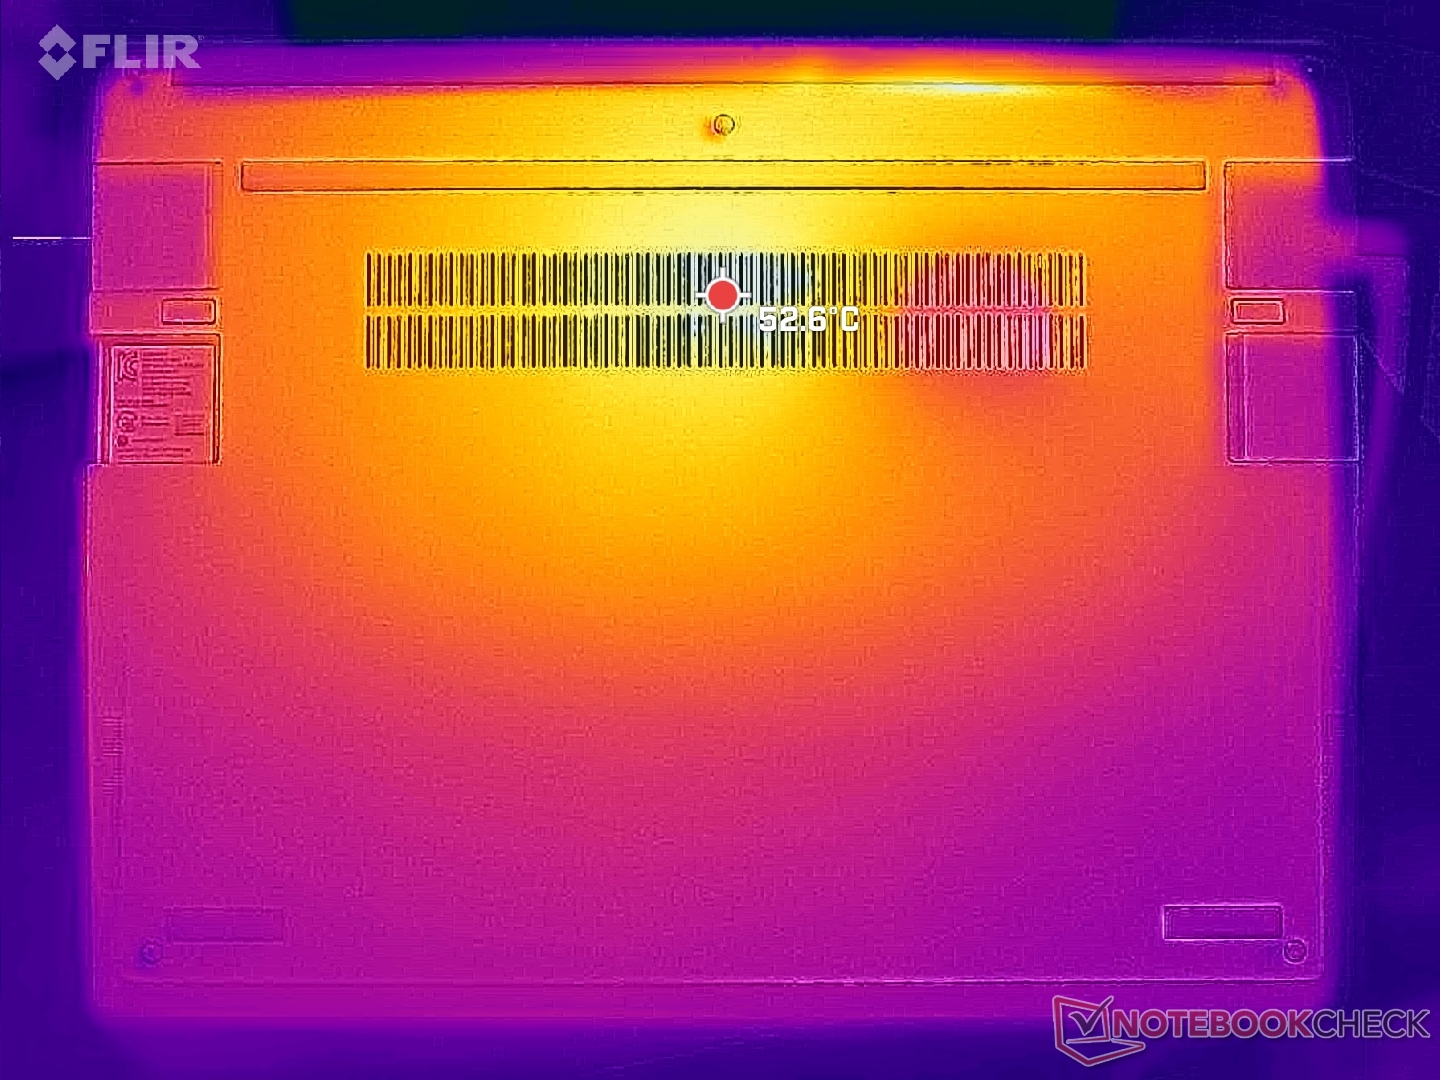
Surface temperature development remains largely the same as before since the thermal envelope and cooling solution have not changed.
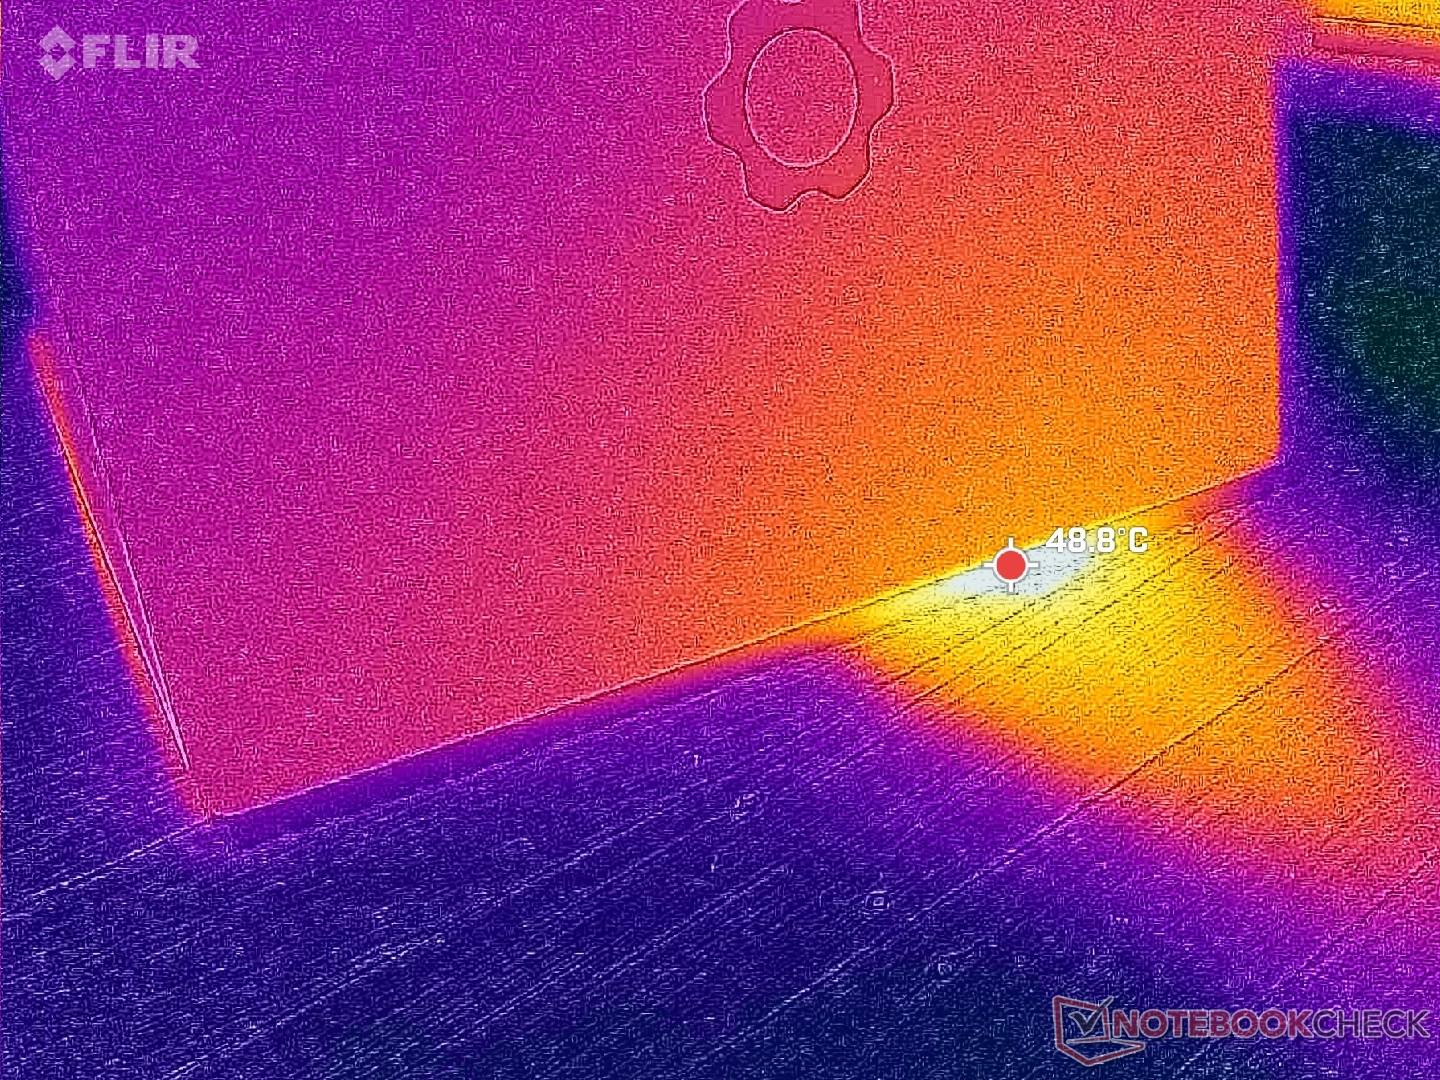
(±) The maximum temperature on the upper side is 42.2 °C / 108 F, compared to the average of 34.3 °C / 94 F, ranging from 21.2 to 62.5 °C for the class Office.
(-) The bottom heats up to a maximum of 46.8 °C / 116 F, compared to the average of 36.8 °C / 98 F
(+) In idle usage, the average temperature for the upper side is 29.2 °C / 85 F, compared to the device average of 29.5 °C / 85 F.
(+) The palmrests and touchpad are cooler than skin temperature with a maximum of 29 °C / 84.2 F and are therefore cool to the touch.
(±) The average temperature of the palmrest area of similar devices was 27.5 °C / 81.5 F (-1.5 °C / -2.7 F).
| Framework Laptop 13.5 Ryzen AI 9 HX 370 AMD Ryzen AI 9 HX 370, AMD Radeon 890M | Framework Laptop 13.5 Core Ultra 7 155H Intel Core Ultra 7 155H, Intel Arc 8-Core iGPU | Dell Pro 13 Premium PA13250 Intel Core Ultra 7 268V, Intel Arc Graphics 140V | MSI Summit E13 AI Evo A1MTG Intel Core Ultra 7 155H, Intel Arc 8-Core iGPU | HP EliteBook x360 830 G10 7L7U1ET Intel Core i5-1335U, Intel Iris Xe Graphics G7 80EUs | Lenovo ThinkPad Z13 Gen 2 AMD Ryzen 7 PRO 7840U, AMD Radeon 780M | |
|---|---|---|---|---|---|---|
| Heat | 6% | 27% | -7% | 5% | 11% | |
| Maximum Upper Side * (°C) | 42.2 | 42.8 -1% | 31 27% | 45.2 -7% | 40.2 5% | 46.2 -9% |
| Maximum Bottom * (°C) | 46.8 | 45.2 3% | 31 34% | 44.8 4% | 42.4 9% | 48.4 -3% |
| Idle Upper Side * (°C) | 31 | 27.2 12% | 24 23% | 34.8 -12% | 30 3% | 23.2 25% |
| Idle Bottom * (°C) | 32.2 | 28.6 11% | 24 25% | 35.8 -11% | 31.8 1% | 23 29% |
* ... smaller is better
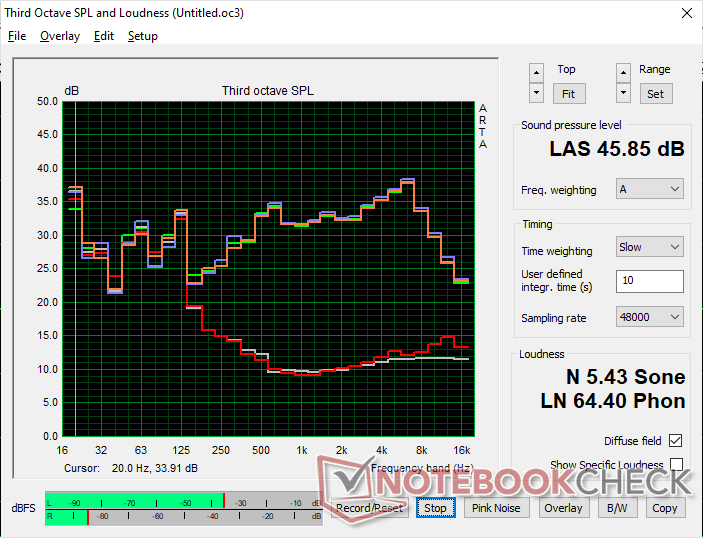
Speakers
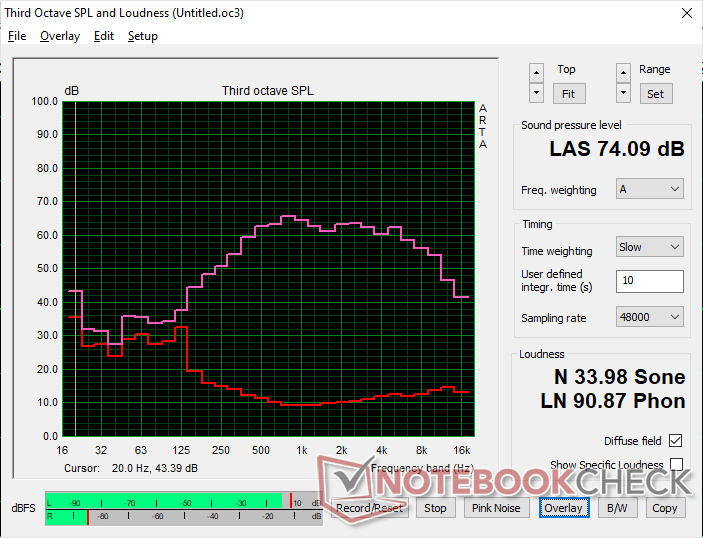
Framework Laptop 13.5 Ryzen AI 9 HX 370 audio analysis
(±) | speaker loudness is average but good (74.1 dB)
Bass 100 - 315 Hz
(±) | reduced bass - on average 14.3% lower than median
(±) | linearity of bass is average (7.3% delta to prev. frequency)
Mids 400 - 2000 Hz
(+) | balanced mids - only 3.5% away from median
(+) | mids are linear (4.7% delta to prev. frequency)
Highs 2 - 16 kHz
(+) | balanced highs - only 2.9% away from median
(+) | highs are linear (4.3% delta to prev. frequency)
Overall 100 - 16.000 Hz
(±) | linearity of overall sound is average (17.4% difference to median)
Compared to same class
» 26% of all tested devices in this class were better, 7% similar, 67% worse
» The best had a delta of 7%, average was 21%, worst was 53%
Compared to all devices tested
» 33% of all tested devices were better, 8% similar, 58% worse
» The best had a delta of 4%, average was 23%, worst was 134%
Apple MacBook Pro 16 2021 M1 Pro audio analysis
(+) | speakers can play relatively loud (84.7 dB)
Bass 100 - 315 Hz
(+) | good bass - only 3.8% away from median
(+) | bass is linear (5.2% delta to prev. frequency)
Mids 400 - 2000 Hz
(+) | balanced mids - only 1.3% away from median
(+) | mids are linear (2.1% delta to prev. frequency)
Highs 2 - 16 kHz
(+) | balanced highs - only 1.9% away from median
(+) | highs are linear (2.7% delta to prev. frequency)
Overall 100 - 16.000 Hz
(+) | overall sound is linear (4.6% difference to median)
Compared to same class
» 0% of all tested devices in this class were better, 0% similar, 100% worse
» The best had a delta of 5%, average was 17%, worst was 45%
Compared to all devices tested
» 0% of all tested devices were better, 0% similar, 100% worse
» The best had a delta of 4%, average was 23%, worst was 134%
Energy Management
Power Consumption
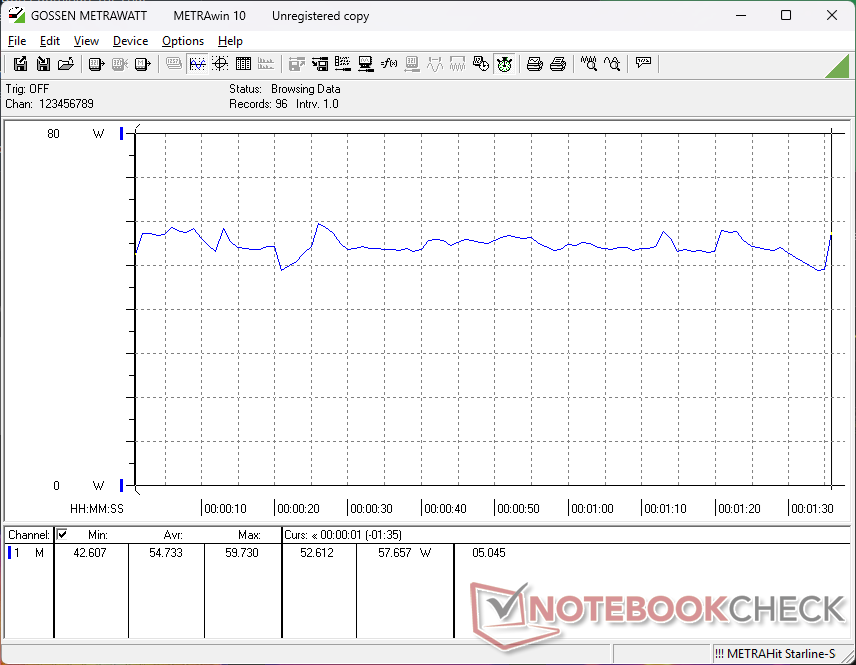
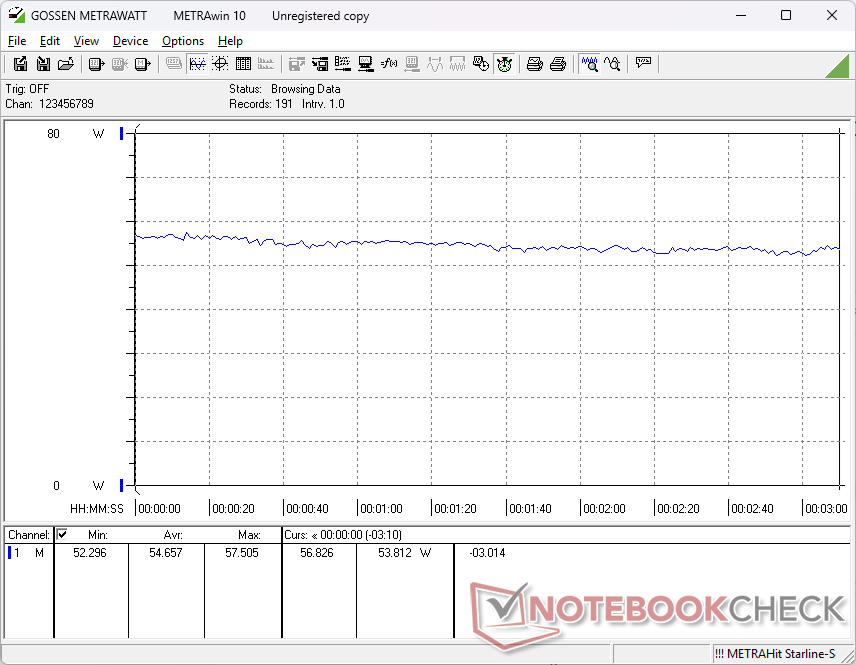
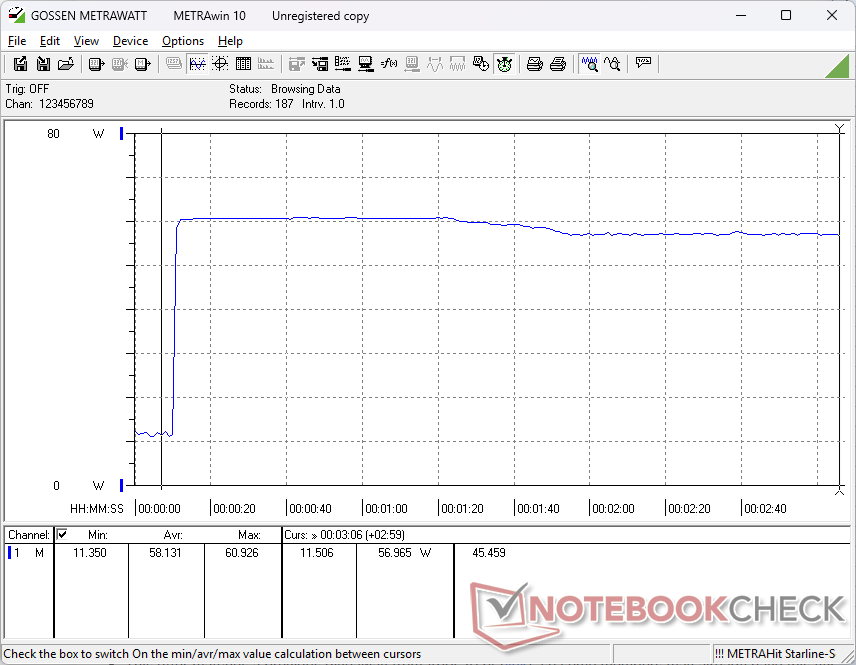
Consumption levels are close to what we recorded on last year's Core Ultra 7 155H option while providing faster CPU and GPU performance for superior performance-per-watt with our AMD configuration. Even so, the AMD system is slightly more demanding when idling on desktop which has an impact on battery life.
| Off / Standby | |
| Idle | |
| Load |
|
Key:
min: | |
| Framework Laptop 13.5 Ryzen AI 9 HX 370 Ryzen AI 9 HX 370, Radeon 890M, , IPS, 2880x1920, 13.5" | Framework Laptop 13.5 Core Ultra 7 155H Ultra 7 155H, Arc 8-Core, , IPS, 2880x1920, 13.5" | Framework Laptop 13.5 Ryzen 7 7840U R7 7840U, Radeon 780M, WD PC SN740 512GB SDDPNQD-512G, IPS, 2256x1504, 13.5" | Framework Laptop 13.5 13th Gen Intel i7-1370P, Iris Xe G7 96EUs, WD PC SN740 SDDPNQD-1T00, IPS, 2256x1504, 13.5" | Framework Laptop 13.5 12th Gen Intel i7-1260P, Iris Xe G7 96EUs, WDC PC SN730 SDBPNTY-512G, IPS, 2256x1504, 13.5" | Framework Laptop 13.5 i7-1165G7, Iris Xe G7 96EUs, Western Digital WD_BLACK SN850 WDS100T1X0E, IPS, 2256x1504, 13.5" | |
|---|---|---|---|---|---|---|
| Power Consumption | 26% | 30% | 23% | 11% | 23% | |
| Idle Minimum * (Watt) | 7.6 | 2.5 67% | 4 47% | 2.9 62% | 5.3 30% | 4.3 43% |
| Idle Average * (Watt) | 11.3 | 5.2 54% | 6.5 42% | 6.3 44% | 8.4 26% | 8.2 27% |
| Idle Maximum * (Watt) | 11.5 | 5.8 50% | 6.8 41% | 9.9 14% | 11.2 3% | 8.7 24% |
| Load Average * (Watt) | 54.7 | 47.5 13% | 48 12% | 56.2 -3% | 57.4 -5% | 43.5 20% |
| Cyberpunk 2077 ultra external monitor * (Watt) | 51.3 | 52.4 -2% | ||||
| Cyberpunk 2077 ultra * (Watt) | 54.6 | 54.5 -0% | ||||
| Load Maximum * (Watt) | 60.9 | 61.5 -1% | 55.2 9% | 60.8 -0% | 61.2 -0% | 61.8 -1% |
| Witcher 3 ultra * (Watt) | 52.3 | 56.6 | 46.7 | 43.5 |
* ... smaller is better
Power Consumption Cyberpunk / Stress Test
Power Consumption external Monitor
Battery Life
Runtimes are good but noticeably shorter than with older processor options.
| Framework Laptop 13.5 Ryzen AI 9 HX 370 Ryzen AI 9 HX 370, Radeon 890M, 61 Wh | Framework Laptop 13.5 Core Ultra 7 155H Ultra 7 155H, Arc 8-Core, 61 Wh | Framework Laptop 13.5 Ryzen 7 7840U R7 7840U, Radeon 780M, 61 Wh | Framework Laptop 13.5 13th Gen Intel i7-1370P, Iris Xe G7 96EUs, 61 Wh | Framework Laptop 13.5 12th Gen Intel i7-1260P, Iris Xe G7 96EUs, 55 Wh | Framework Laptop 13.5 i7-1165G7, Iris Xe G7 96EUs, 55 Wh | |
|---|---|---|---|---|---|---|
| Battery runtime | 31% | 51% | 10% | -6% | 0% | |
| WiFi v1.3 (h) | 8 | 10.5 31% | 12.1 51% | 8.8 10% | 7.5 -6% | 8 0% |
| Reader / Idle (h) | 38.3 | |||||
| Load (h) | 1.5 |
Notebookcheck Rating
Framework Laptop 13.5 Ryzen AI 9 HX 370
- 04/14/2025 v8
Allen Ngo
 Total Sustainability Score:
 Potential Competitors in Comparison
Image | Model / Review | Price | Weight | Height | Display |
|---|---|---|---|---|---|
1. 83.8%  | Framework Laptop 13.5 Ryzen AI 9 HX 370 AMD Ryzen AI 9 HX 370 ⎘ AMD Radeon 890M ⎘ 32 GB Memory | Amazon: List Price: 2100 USD | 1.3 kg | 15.85 mm | 13.50" 2880x1920 256 PPI IPS |
2. 84%  | Framework Laptop 13.5 Core Ultra 7 155H Intel Core Ultra 7 155H ⎘ Intel Arc 8-Core iGPU ⎘ 32 GB Memory | Amazon: List Price: 1500 USD | 1.4 kg | 15.85 mm | 13.50" 2880x1920 256 PPI IPS |
3. 90%  | Dell Pro 13 Premium PA13250 Intel Core Ultra 7 268V ⎘ Intel Arc Graphics 140V ⎘ 32 GB Memory, 1024 GB SSD | Amazon: List Price: 2700 Euro | 1.1 kg | 17.2 mm | 13.30" 1920x1200 170 PPI IPS |
4. 78.6%  | MSI Summit E13 AI Evo A1MTG Intel Core Ultra 7 155H ⎘ Intel Arc 8-Core iGPU ⎘ 16 GB Memory, 1024 GB SSD | Amazon: List Price: 1100 USD | 1.3 kg | 16.2 mm | 13.30" 1920x1200 170 PPI IPS |
5. 89.4% v7 (old)  | HP EliteBook x360 830 G10 7L7U1ET Intel Core i5-1335U ⎘ Intel Iris Xe Graphics G7 80EUs ⎘ 16 GB Memory, 512 GB SSD | Amazon: List Price: 1300 Euro | 1.3 kg | 19.2 mm | 13.30" 1920x1200 170 PPI IPS LED |
6. 89.5% v7 (old)  | Lenovo ThinkPad Z13 Gen 2 AMD Ryzen 7 PRO 7840U ⎘ AMD Radeon 780M ⎘ 32 GB Memory, 1024 GB SSD | Amazon: 1. $1,059.99 Lenovo ThinkPad X13 Gen 6 21... 2. $1,899.00 Lenovo ThinkPad X1 Carbon Ge... 3. $408.00 Lenovo Thinkpad T14 Gen 2 14... List Price: 1800 USD | 1.2 kg | 13.99 mm | 13.30" 2880x1800 255 PPI OLED |
Transparency
The selection of devices to be reviewed is made by our editorial team. The test sample was provided to the author as a loan by the manufacturer or retailer for the purpose of this review. The lender had no influence on this review, nor did the manufacturer receive a copy of this review before publication. There was no obligation to publish this review. As an independent media company, Notebookcheck is not subjected to the authority of manufacturers, retailers or publishers.
This is how Notebookcheck is testing
Every year, Notebookcheck independently reviews hundreds of laptops and smartphones using standardized procedures to ensure that all results are comparable. We have continuously developed our test methods for around 20 years and set industry standards in the process. In our test labs, high-quality measuring equipment is utilized by experienced technicians and editors. These tests involve a multi-stage validation process. Our complex rating system is based on hundreds of well-founded measurements and benchmarks, which maintains objectivity. Further information on our test methods can be found here.
