

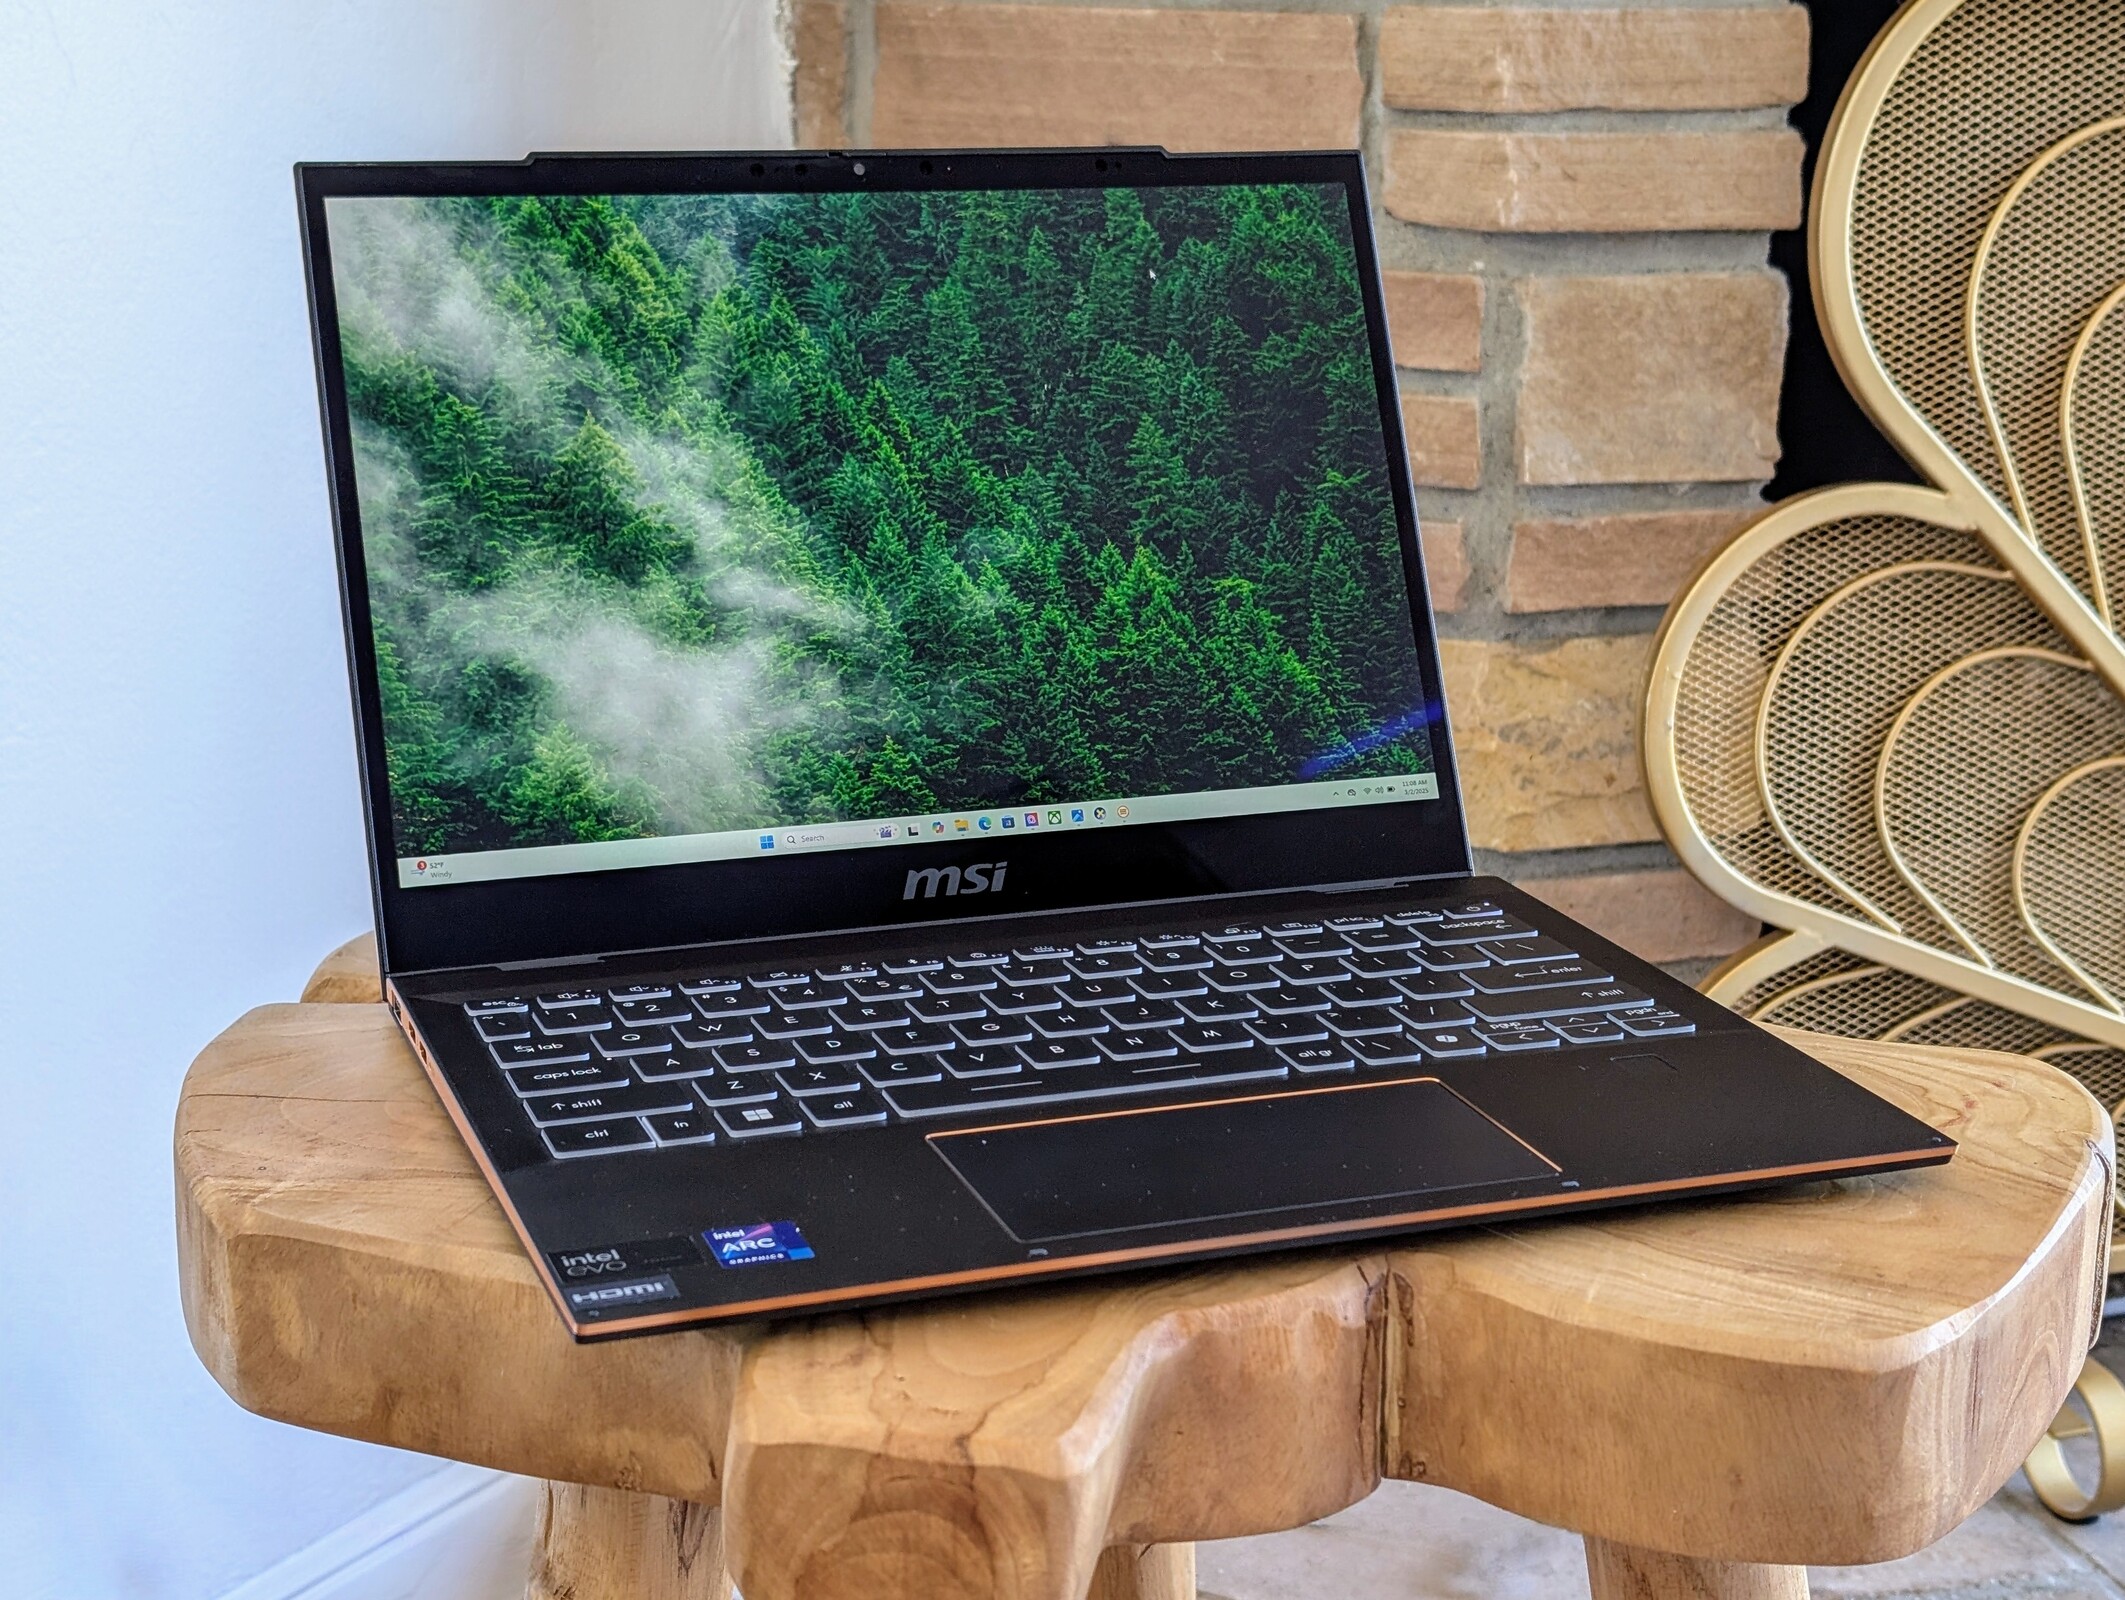
MSI Summit E13 AI Evo convertible review: Serious throttling issues with Core Ultra 7
Verdict — One Step Forward And Two Steps Back
The Summit E13 AI Evo A1MTG can feel like a downgrade when compared to its predecessor. It sounds good on paper with its Core Ultra H CPU, but in practice the processor throttles much more quickly and sharply than most other laptops with the same CPU option as the Summit E13 was originally designed for ULV Core U-series processors. The newer model is certainly faster than the original 2021 version, but the difference is not as wide as it could have been given our experience with other Core Ultra H laptops like the Framework Laptop 13.5. Aspects like battery life and core temperature suffer from the processor change as well.
Other disappointing changes include fewer USB-C ports and the removal of the MicroSD reader. Even the base IPS display has been downgraded from 120 Hz to just 60 Hz with no improvements to the slow black-white response times.
It may be time for a chassis redesign now that the Summit E13 is approaching four years old. The Core Ultra-H processor helps to separate the MSI model from other 13-inch convertibles, but its implementation could have been better handled by improving the cooling solution first to support the higher CPU demands. The higher than average temperatures and fan noise are both indicative of a cooling solution struggling to keep the new processor afloat.
Pros
Cons
Price and Availability
Amazon is currently offering the Summit E13 AI Evo with the Core Ultra 7, 16 GB LPDDR5 RAM, and 1 TB SSD as reviewed for $1100.
Potential Competitors in Comparison
Image | Model / Review | Price | Weight | Height | Display |
|---|---|---|---|---|---|
1. 78.6% 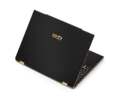 | MSI Summit E13 AI Evo A1MTG Intel Core Ultra 7 155H ⎘ Intel Arc 8-Core iGPU ⎘ 16 GB Memory, 1024 GB SSD | Amazon: $859.99 List Price: 1100 USD | 1.3 kg | 16.2 mm | 13.30" 1920x1200 170 PPI IPS |
2. 86.9% v7 (old) 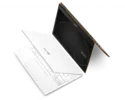 | MSI Summit E13 Flip Evo A11MT Intel Core i7-1185G7 ⎘ Intel Iris Xe Graphics G7 96EUs ⎘ 32 GB Memory, 1024 GB SSD | Amazon: 1. $839.99 msi Summit E13 Flip EVO 13.4... 2. $72.00 Laptop Hinge for MSI Summit ... 3. $889.00 MSI Summit E13 Flip Evo Prof... List Price: 1900 USD | 1.4 kg | 14.9 mm | 13.40" 1920x1200 169 PPI IPS |
3. 87% v7 (old)  | Lenovo Yoga Book 9 13IMU9 Intel Core Ultra 7 155U ⎘ Intel Graphics 4-Core iGPU (Arrow Lake) ⎘ 16 GB Memory | List Price: 2000 USD | 1.4 kg | 15.95 mm | 13.30" 2880x1800 255 PPI OLED |
4. 88.1% v7 (old) 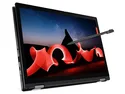 | Lenovo ThinkPad L13 Yoga G4 i7-1355U Intel Core i7-1355U ⎘ Intel Iris Xe Graphics G7 96EUs ⎘ 16 GB Memory, 512 GB SSD | Amazon: 1. $1,377.38 Lenovo ThinkPad L13 Yoga Gen... 2. $949.99 Lenovo ThinkPad L13 Yoga Gen... 3. $43.99 Gumdrop DropTech Laptop Case... List Price: 1589 USD | 1.4 kg | 17.1 mm | 13.30" 1920x1200 170 PPI IPS |
5. 90.3% v7 (old)  | HP Elite Dragonfly Folio 13.5 G3 Intel Core i7-1265U ⎘ Intel Iris Xe Graphics G7 96EUs ⎘ 16 GB Memory, 512 GB SSD | Amazon: 1. $49.99 Smatree 13.5 inch Laptop Sle... 2. $39.99 Smatree Hard EVA Protective ... 3. $39.99 Smatree Hard EVA Protective ... List Price: 3900 USD | 1.4 kg | 17.8 mm | 13.50" 1920x1280 171 PPI IPS |
6. 89% v7 (old)  | Dell Latitude 9330 Intel Core i7-1260U ⎘ Intel Iris Xe Graphics G7 96EUs ⎘ 16 GB Memory | Amazon: 1. $29.99 Ruilezyo 90W USB C Laptop Ch... 2. $57.99 ZTHY 47XV3 Laptop Battery Re... 3. $33.00 Dell Laptop Charger 90W Watt... | 1.2 kg | 14.1 mm | 13.30" 2560x1600 227 PPI IPS |
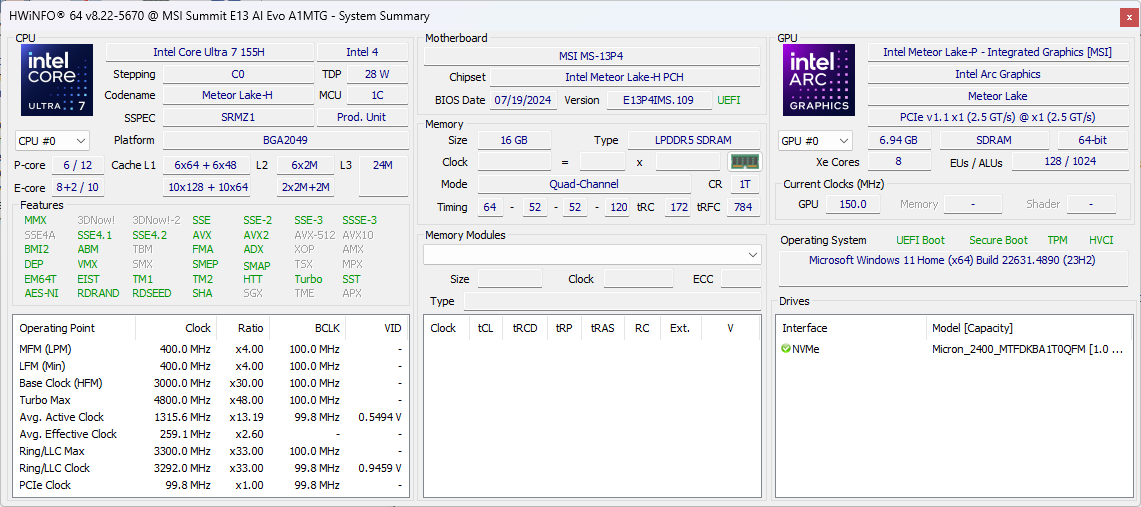
The 2024 Summit E13 AI Evo A1MTG is the updated version of the 2021 Summit E13 Flip Evo. While the "Flip" moniker has been dropped, the model is still a 2-in-1 form factor just like its predecessor. It comes with a newer Intel Core Meteor Lake-H processor which replaces the older Tiger Lake-U option on the 2021 model.
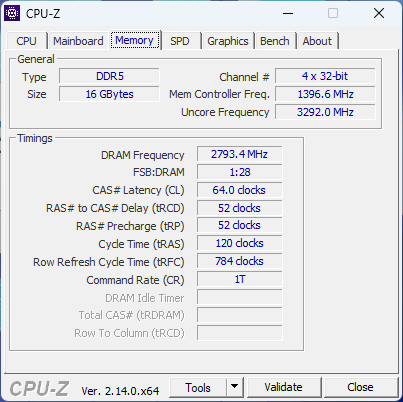
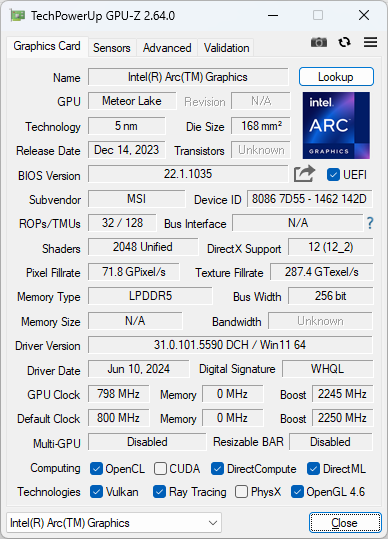
Our test unit is equipped with the Core Ultra 7 155H CPU, 16 GB LPDDR5-5600 RAM, and 1 TB SSD for approximately $1100. Other SKUs may offer 32 GB LPDDR5-6400 RAM or the slower Core Ultra 5 125H, but the 1200p IPS touchscreen appears to be fixed across the lineup.
Competitors include other 13-inch office subnotebooks like the Dell Latitude 9330, HP Elite Dragonfly Folio, or Lenovo ThinkPad L13 Yoga G4.
More MSI reviews:
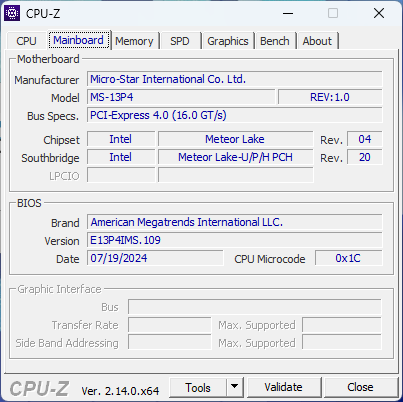
Specifications
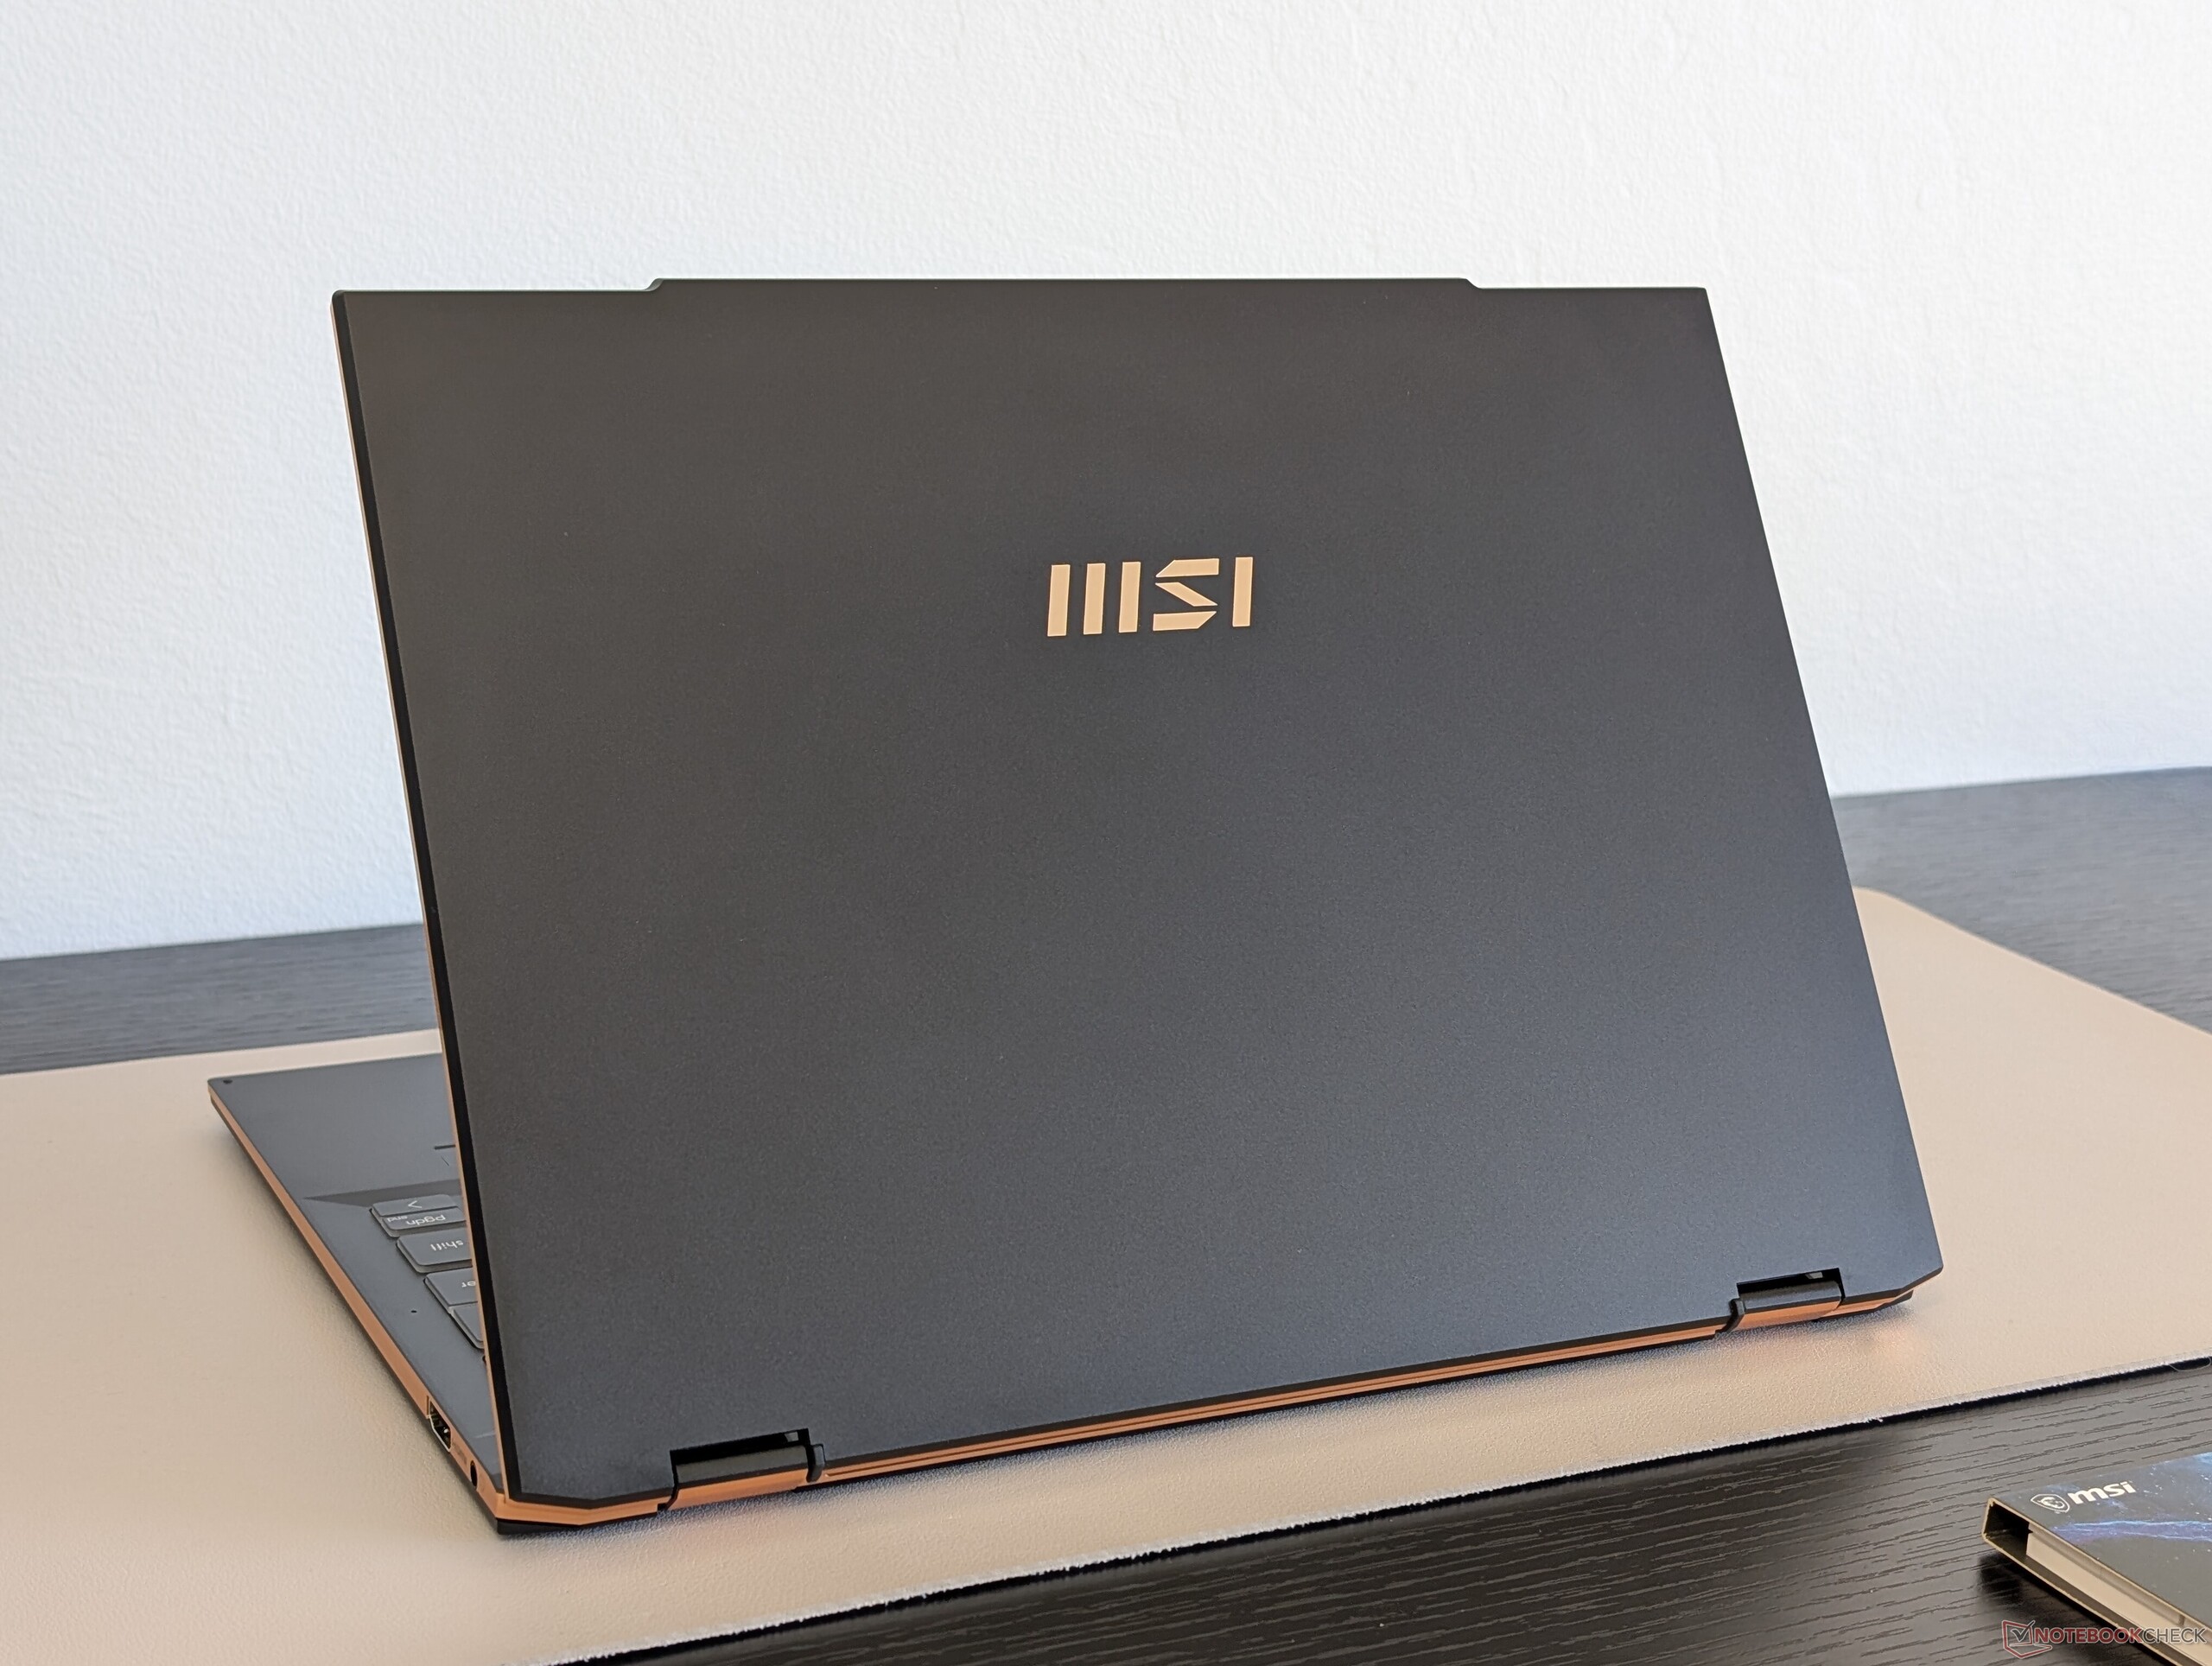
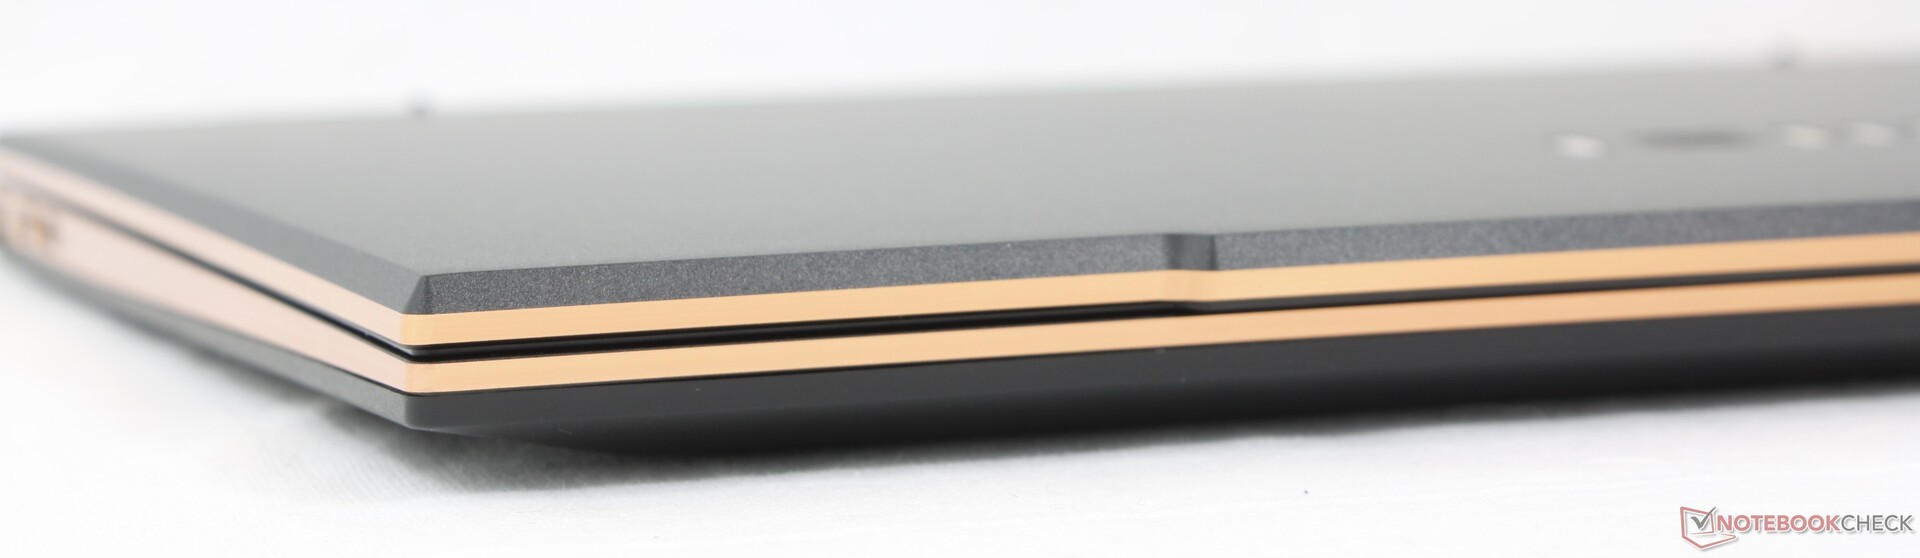
Case — Golden Trims
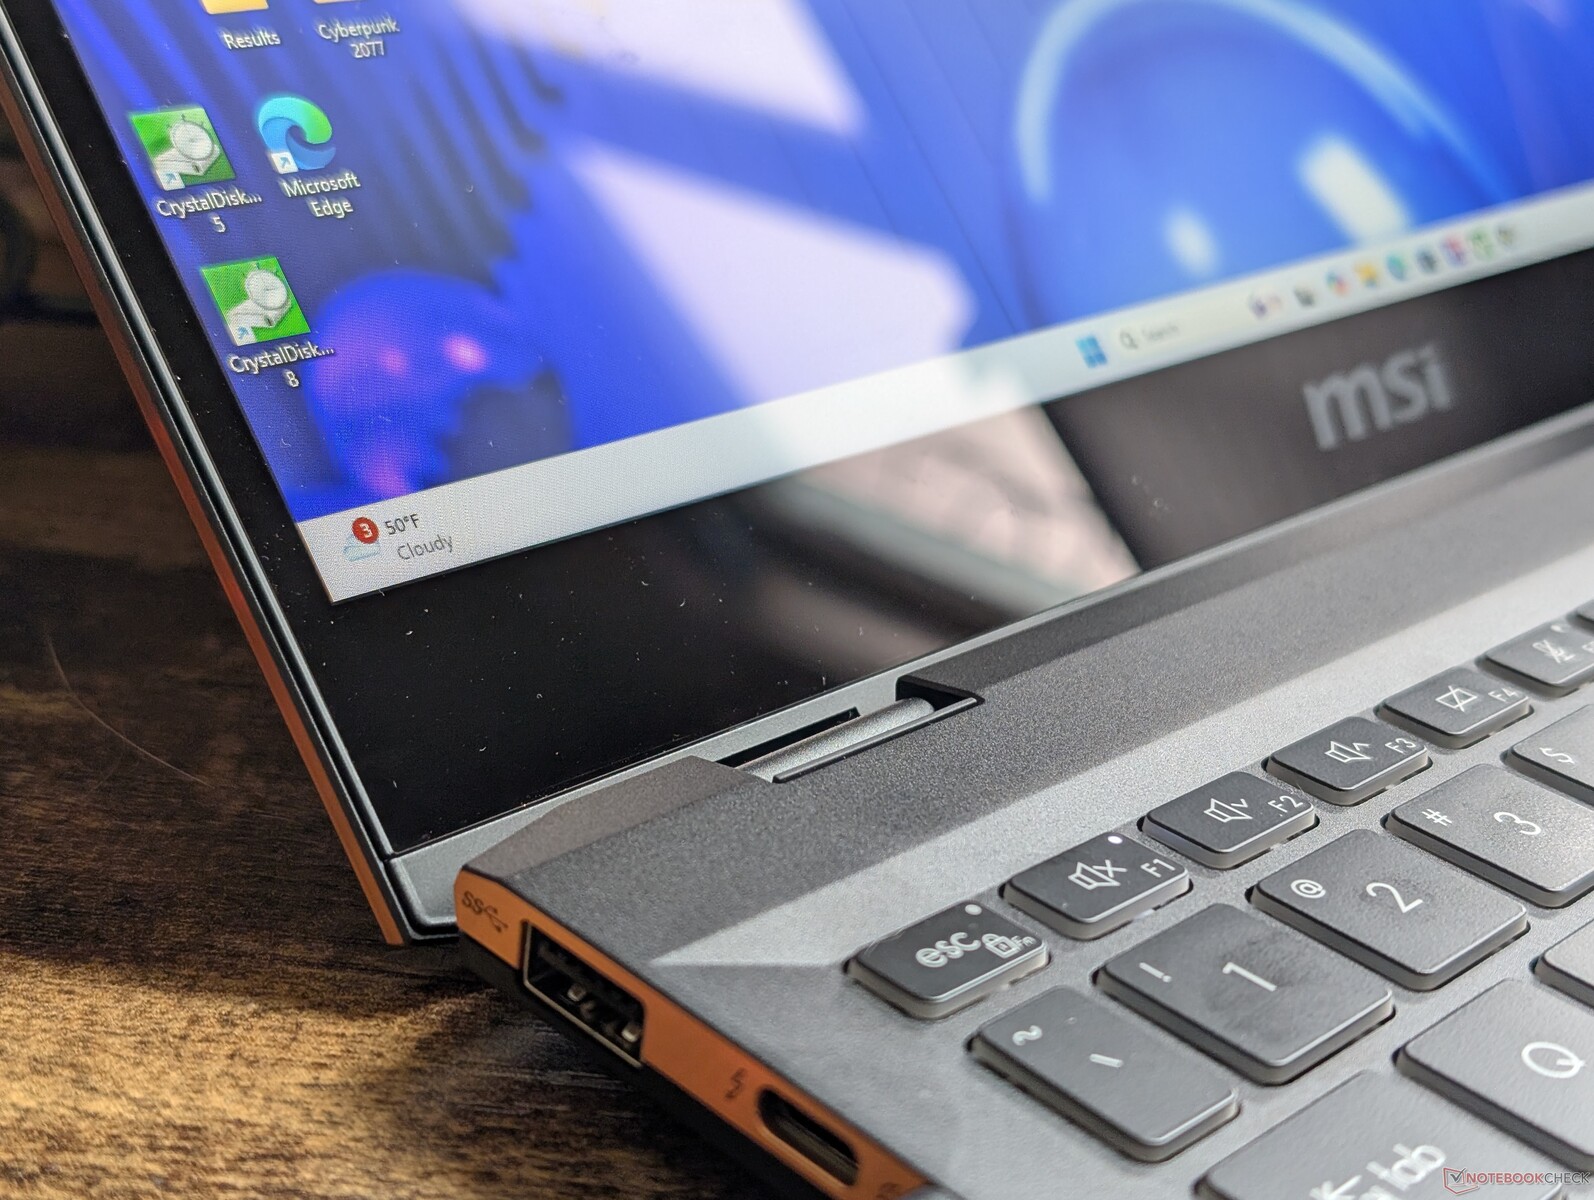
The 2024 Summit E13 carries different ports and a new webcam shutter when compared to the 2021 version. Otherwise, the chassis are identical for no major changes between them both externally and internally.
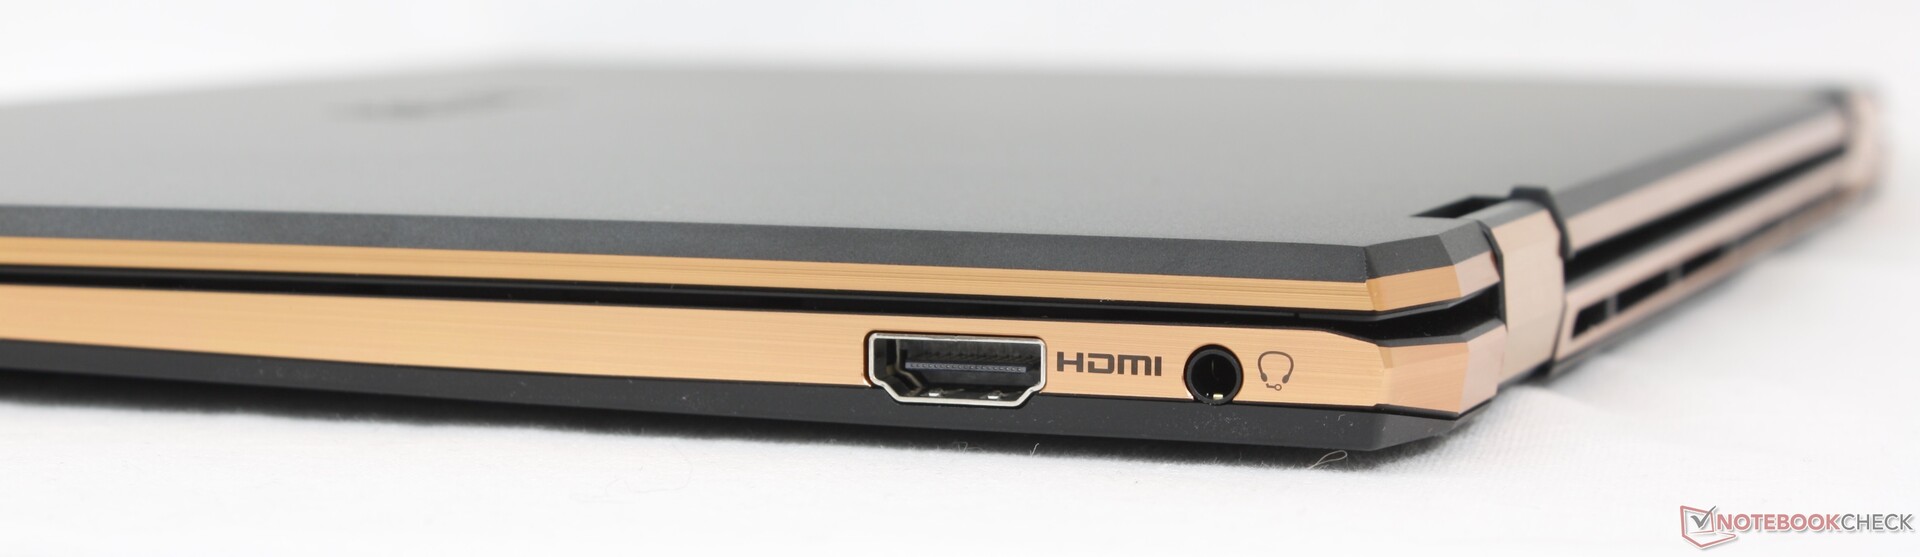
Connectivity — New Ports This Year
Port options have changed from the 2021 model and not necessarily for the better. One of the USB-C ports has been removed in favor of HDMI while the MicroSD reader has been dropped completely.


Communication
| Networking | |
| iperf3 transmit AX12 | |
| MSI Summit E13 Flip Evo A11MT | |
| iperf3 receive AX12 | |
| MSI Summit E13 Flip Evo A11MT | |
| iperf3 transmit AXE11000 | |
| Lenovo ThinkPad L13 Yoga G4 i7-1355U | |
| HP Elite Dragonfly Folio 13.5 G3 | |
| Dell Latitude 9330 | |
| Lenovo Yoga Book 9 13IMU9 | |
| MSI Summit E13 AI Evo A1MTG | |
| iperf3 receive AXE11000 | |
| Lenovo ThinkPad L13 Yoga G4 i7-1355U | |
| Lenovo Yoga Book 9 13IMU9 | |
| HP Elite Dragonfly Folio 13.5 G3 | |
| Dell Latitude 9330 | |
| MSI Summit E13 AI Evo A1MTG | |
| iperf3 transmit AXE11000 6GHz | |
| HP Elite Dragonfly Folio 13.5 G3 | |
| Dell Latitude 9330 | |
| MSI Summit E13 AI Evo A1MTG | |
| Lenovo Yoga Book 9 13IMU9 | |
| iperf3 receive AXE11000 6GHz | |
| HP Elite Dragonfly Folio 13.5 G3 | |
| MSI Summit E13 AI Evo A1MTG | |
| Dell Latitude 9330 | |
| Lenovo Yoga Book 9 13IMU9 | |
Webcam
The webcam remains the same at 1080p or 2 MP only with IR support.


Maintenance
Servicing is similar to the 2021 model down to even the motherboard layout according to the LaptopMedia servicing video. RAM is not upgradeable and only up to one M.2 2280 SSD is supported.
Sustainability
MSI advertises no sustainability measures taken during manufacturing. The retail box is otherwise mostly paper and cardboard with plastic wrapping for the AC adapter.
Accessories And Warranty
The retail box includes the MSI Pen 2 active stylus in addition to the AC adapter and paperwork. The usual one-year limited manufacturer warranty applies if purchased in the US.
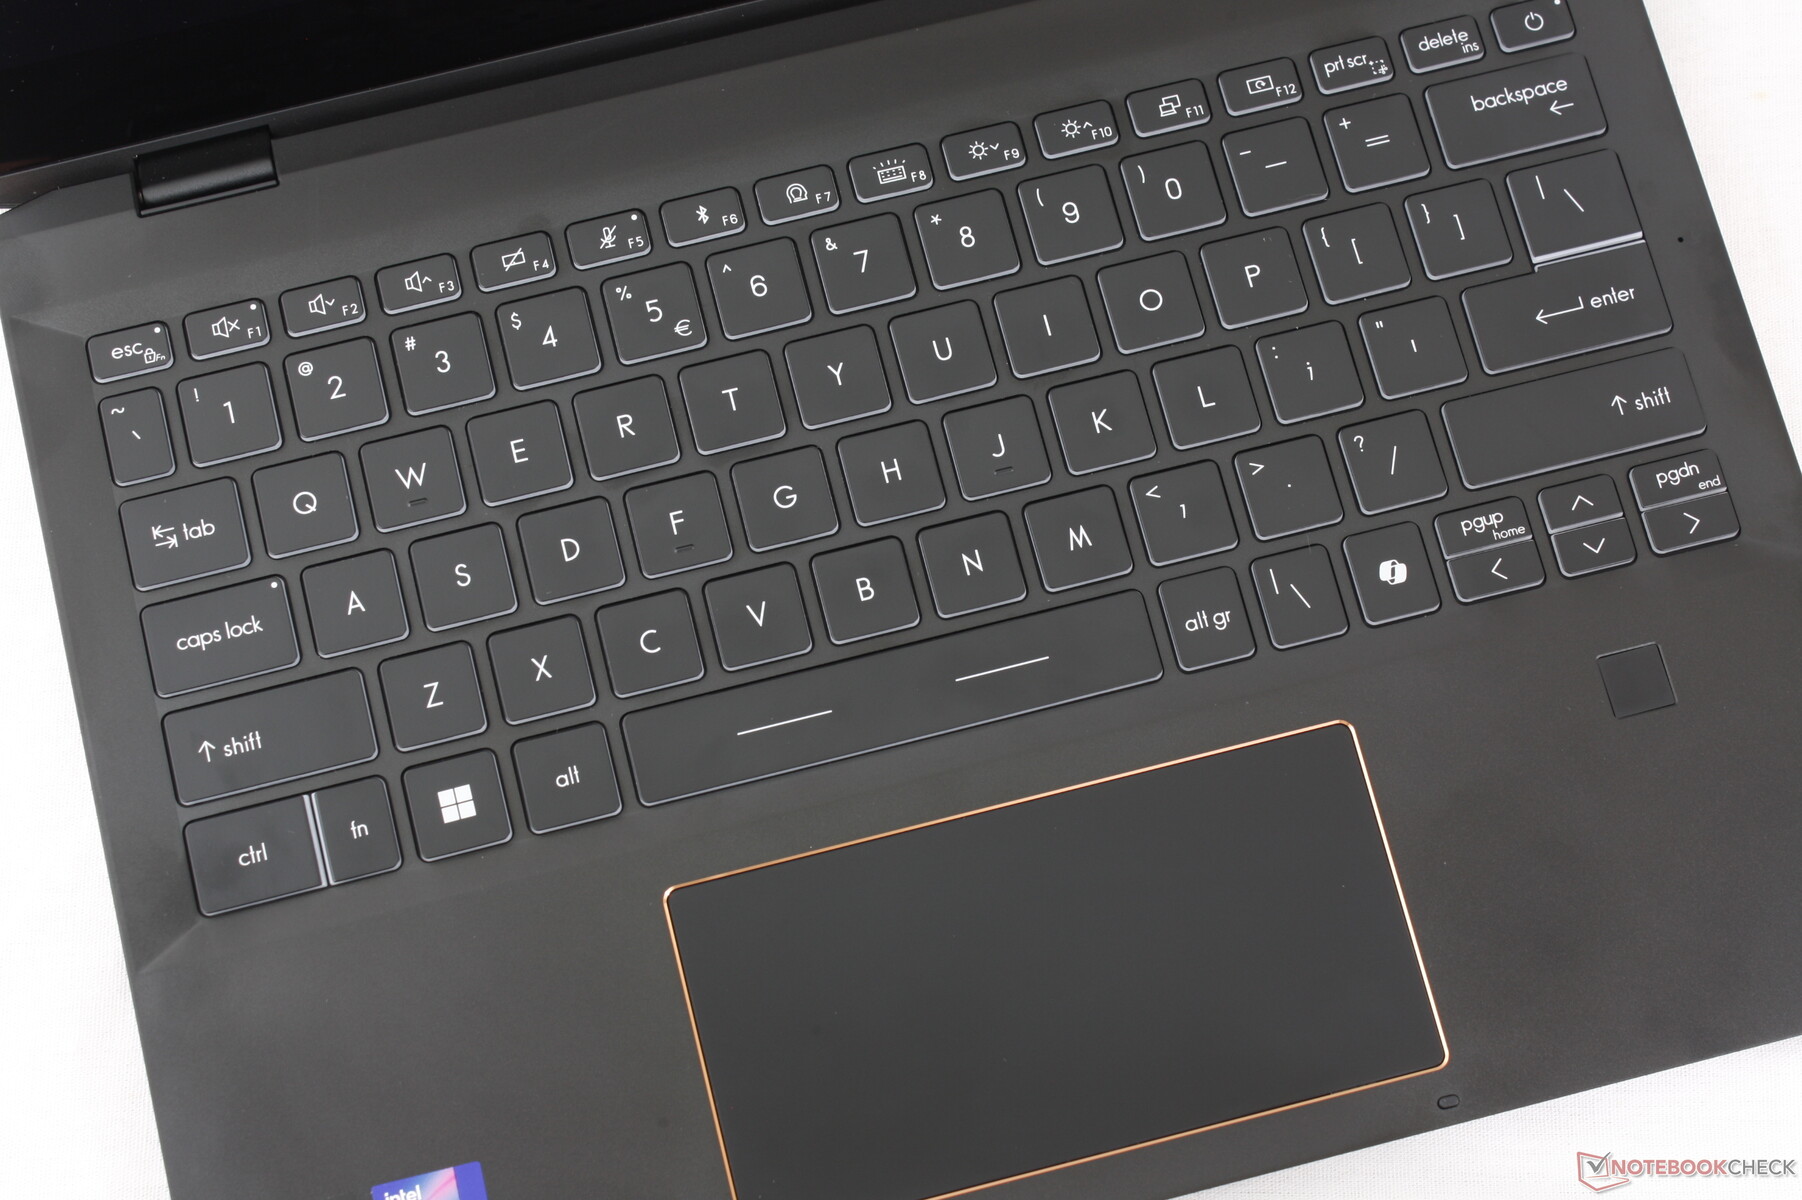
Input Devices
The keyboard and clickpad have not changed in overall size or feedback for the same typing experience as the 2021 model. New this year is the dedicated Co-Pilot key and slightly revised Fn and Ctrl keys. Unfortunately, the small PgUp, PgDn, and arrow keys continue to be very cramped, spongy, and generally unreliable.
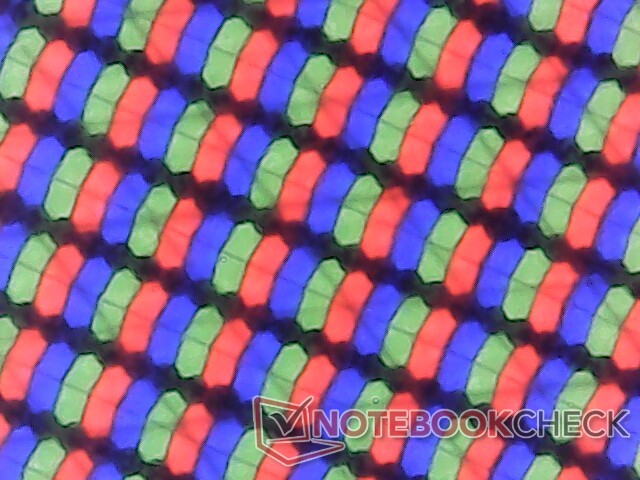
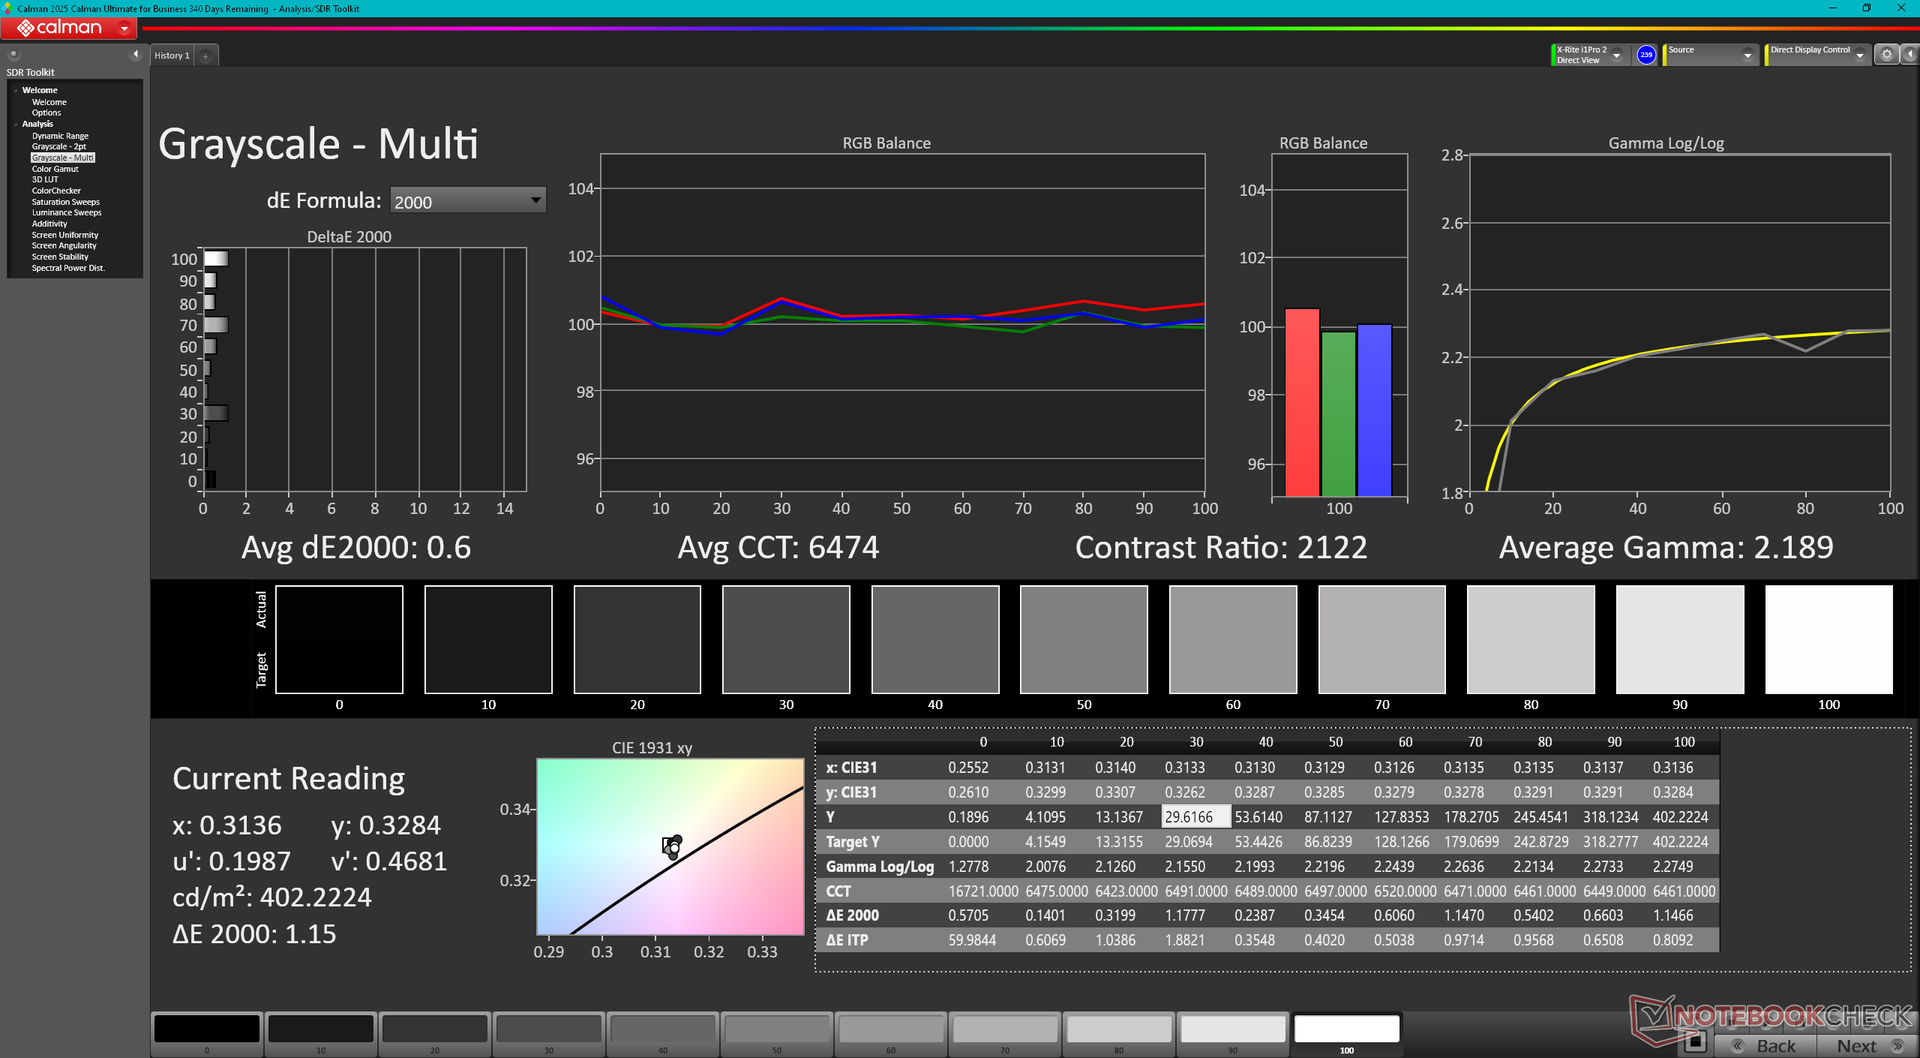
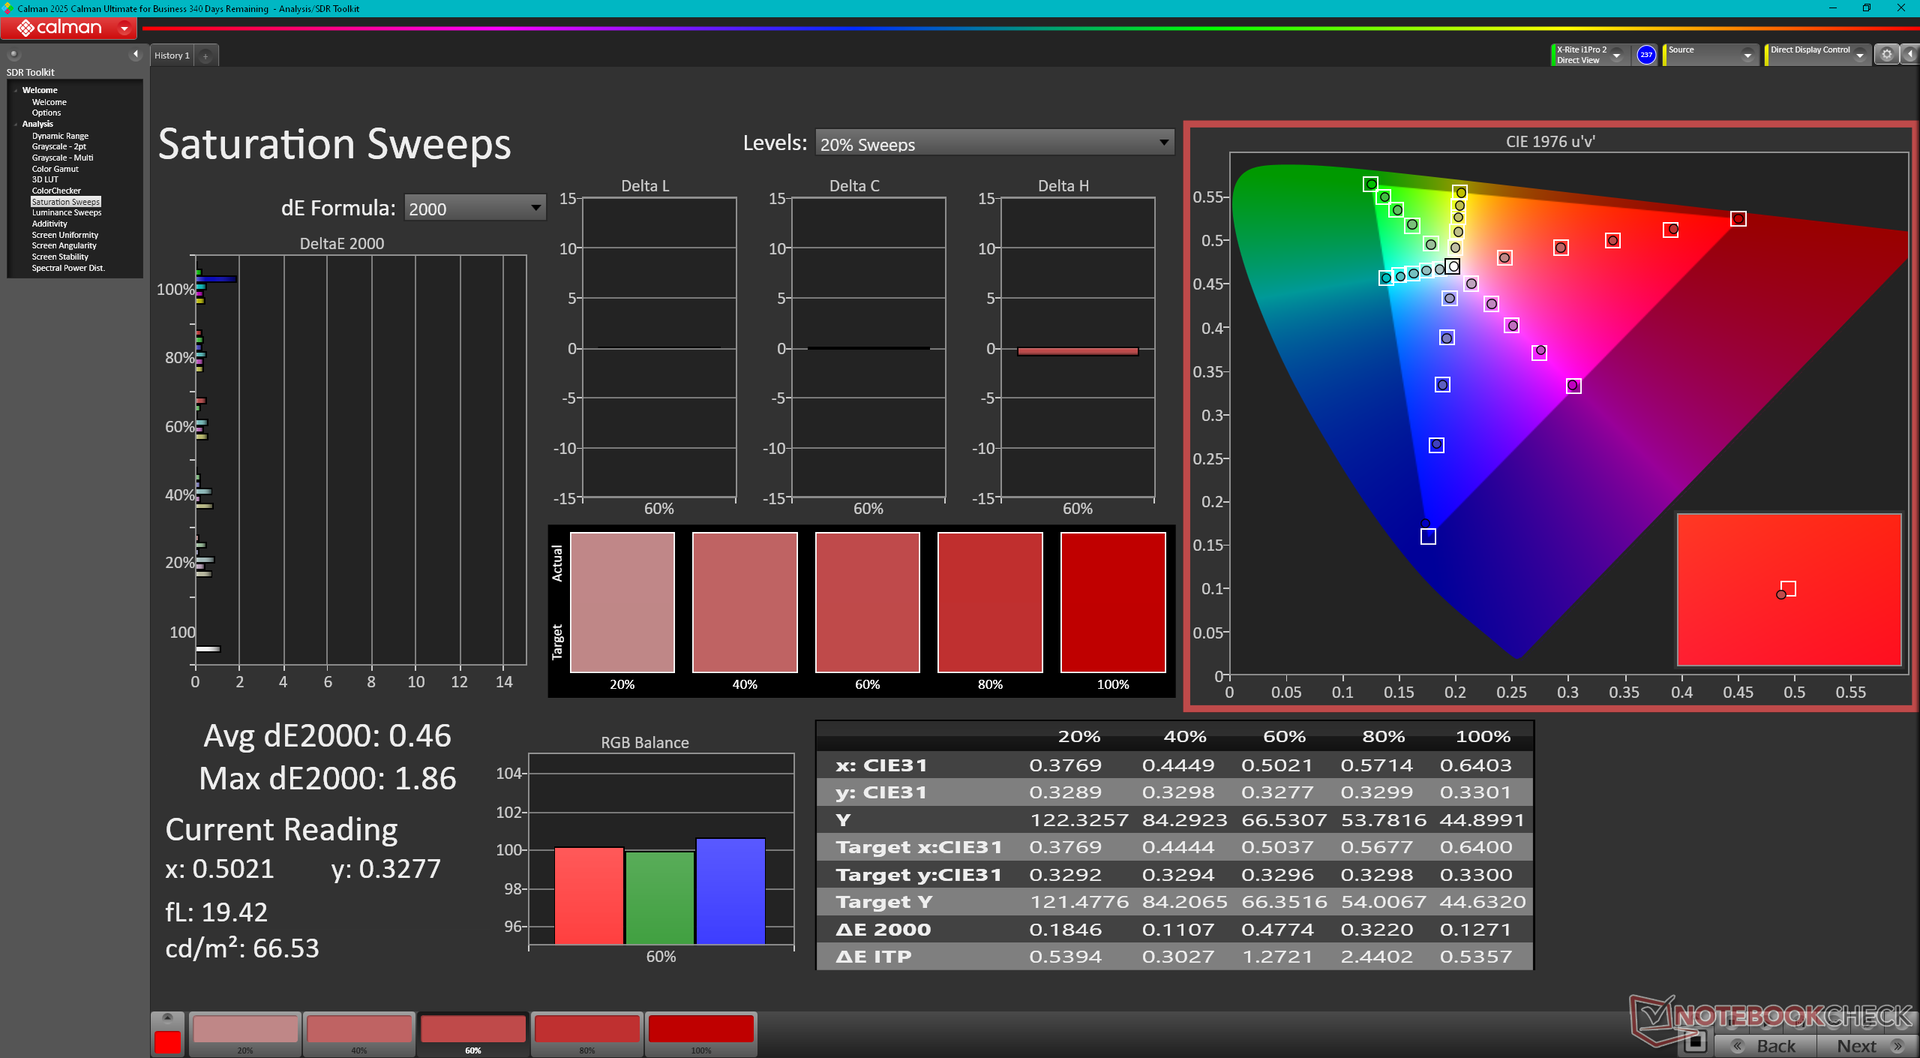
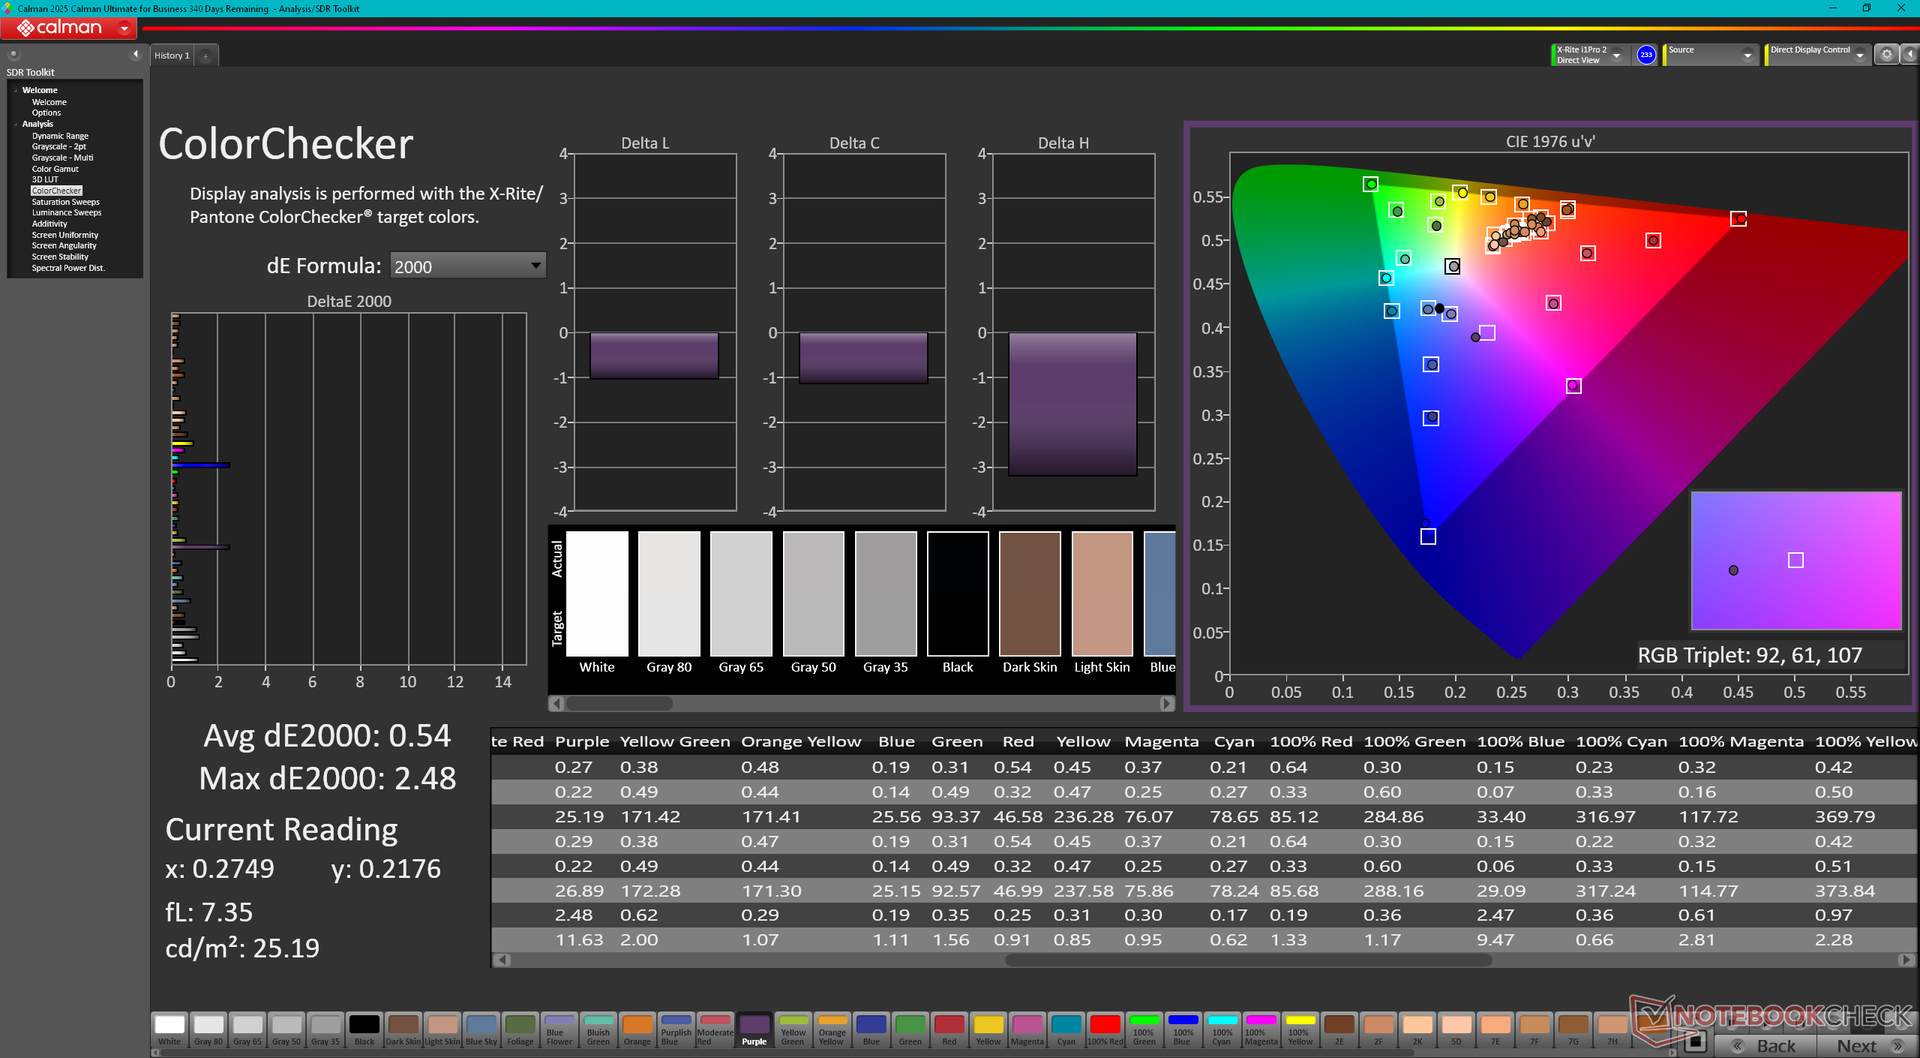
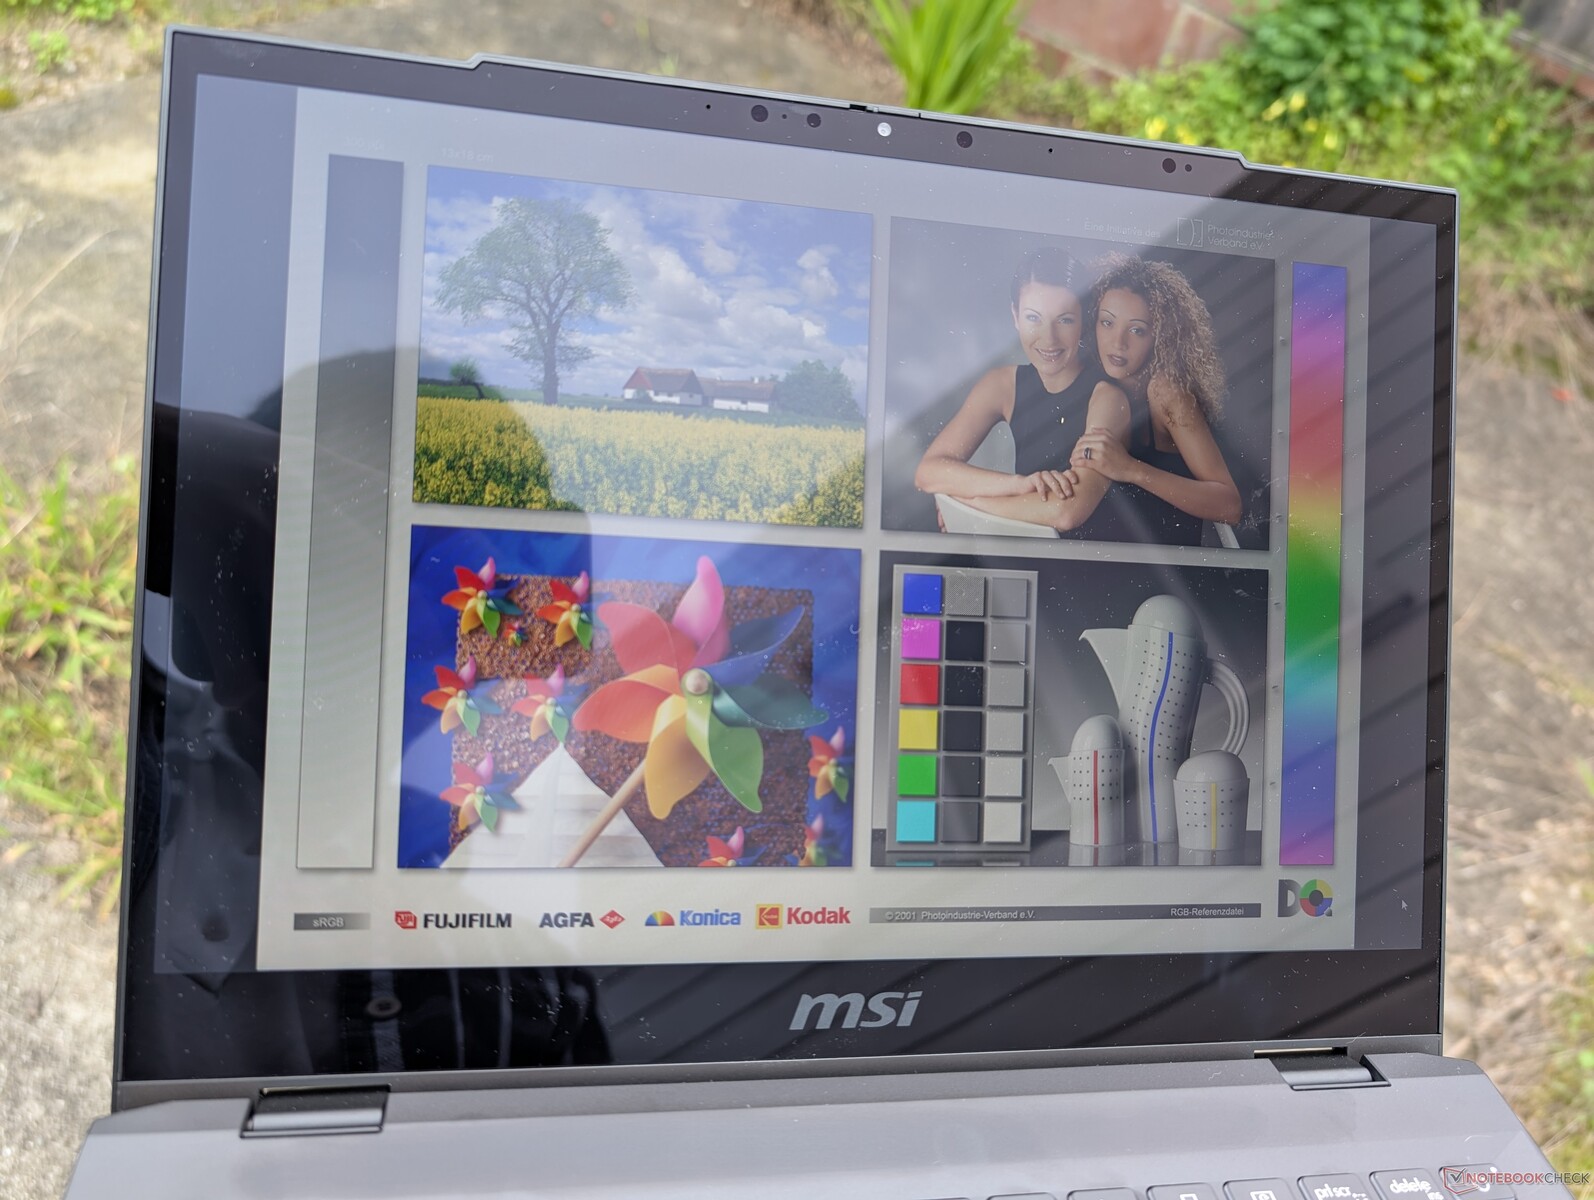
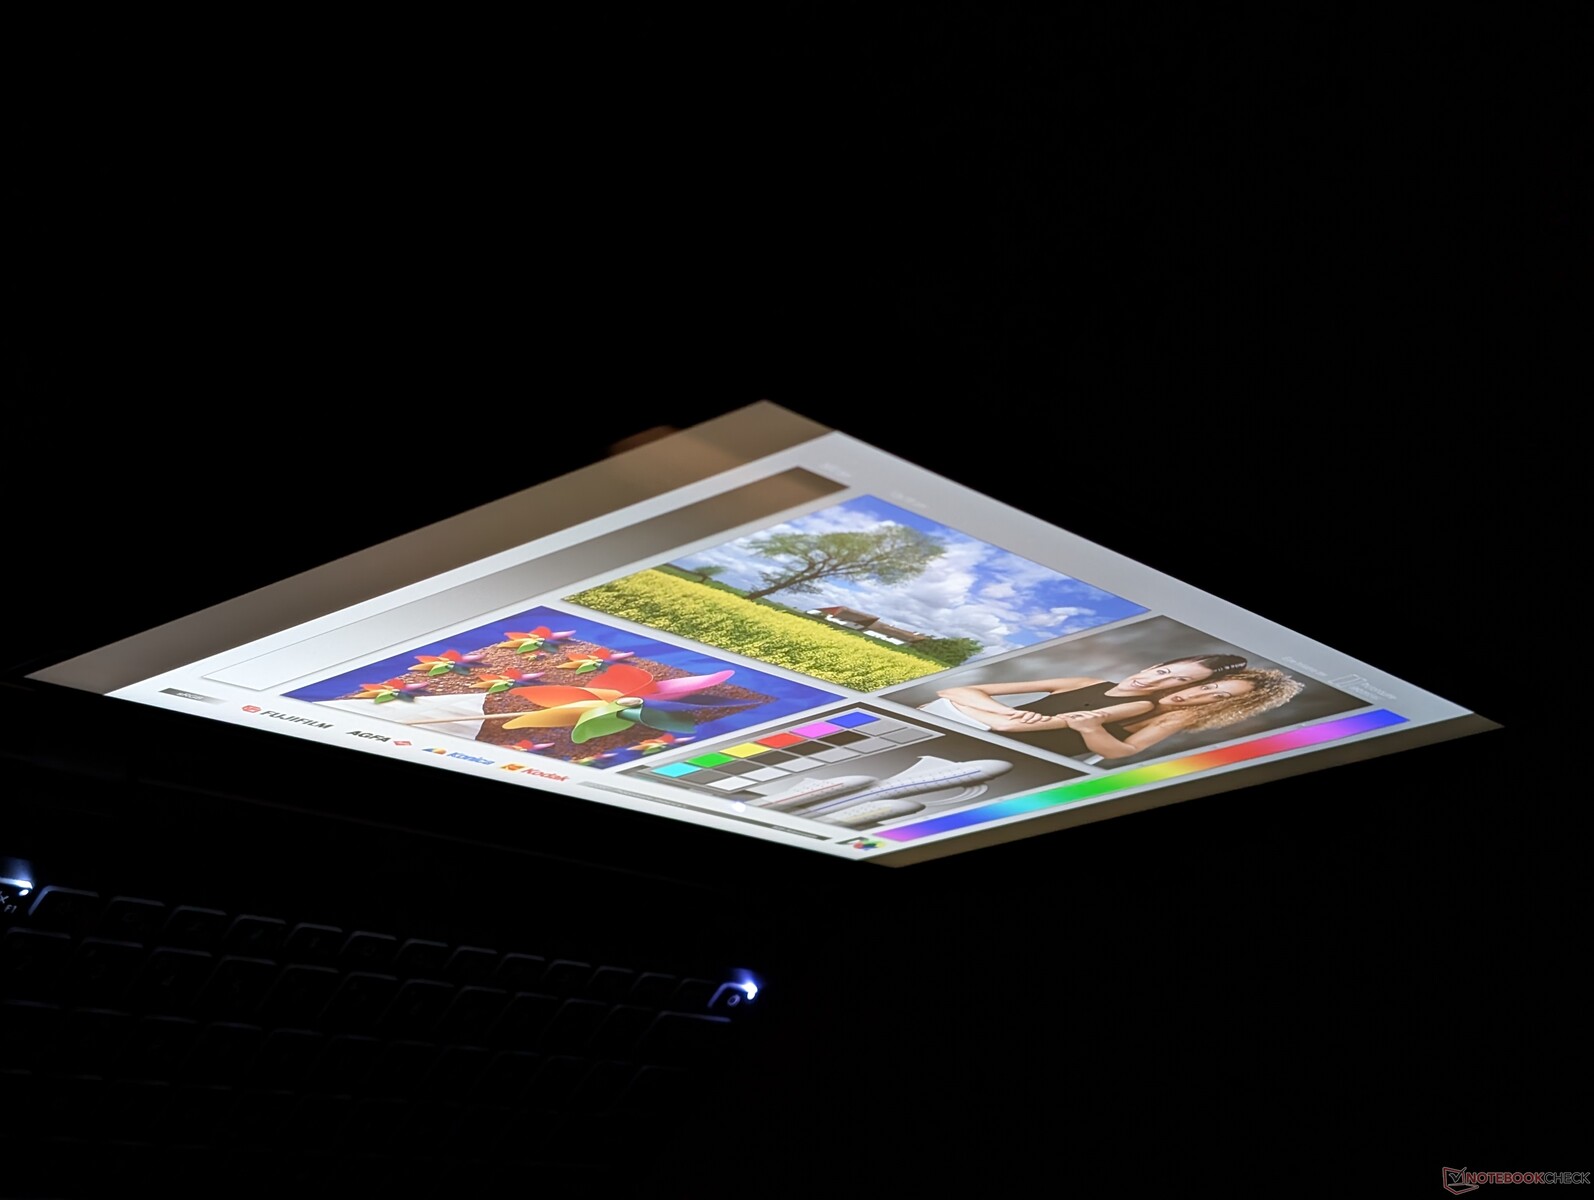
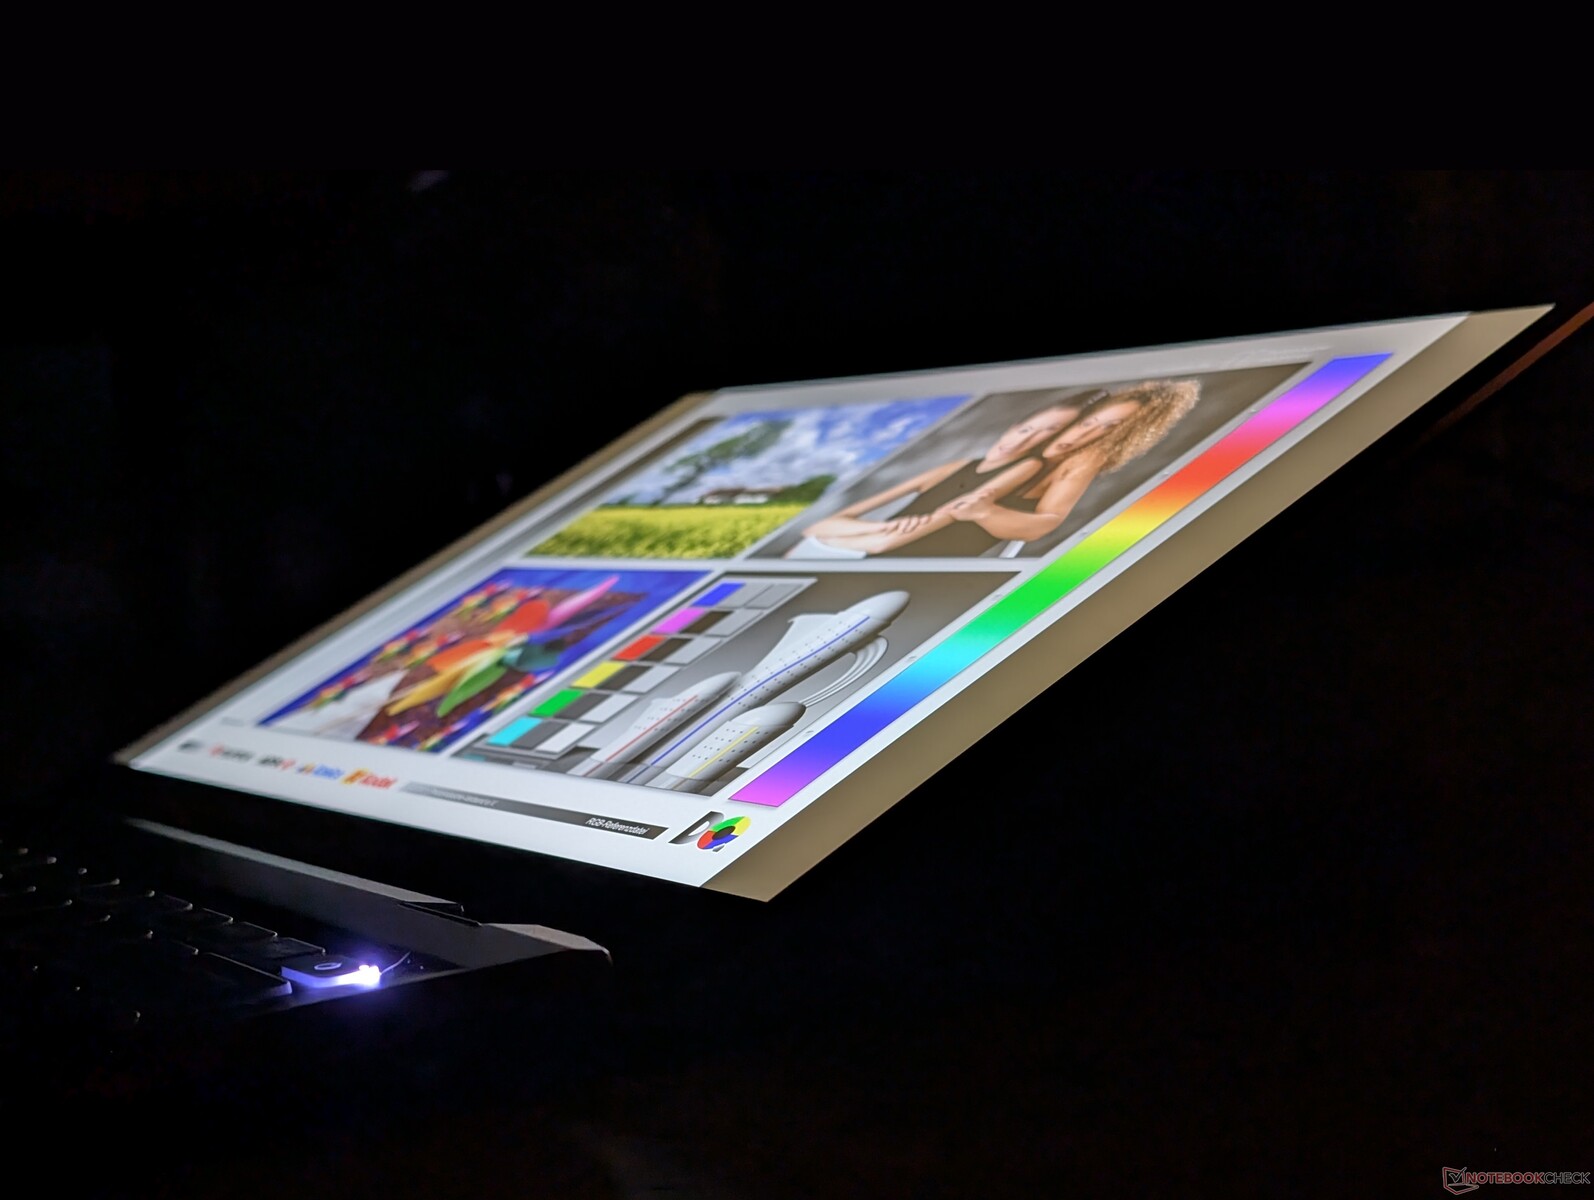
Display — Only Average For The Price
Our unit utilizes a 60 Hz Chi Mei panel instead of the 120 Hz Sharp panel on the 2021 model. The Chi Mei panel offers similar sRGB colors but with slightly lower contrast levels. Black-white and gray-gray response times are still very slow even by non-gaming standards.
| |||||||||||||||||||||||||
Brightness Distribution: 88 %
Center on Battery: 405.2 cd/m²
Contrast: 1192:1 (Black: 0.34 cd/m²)
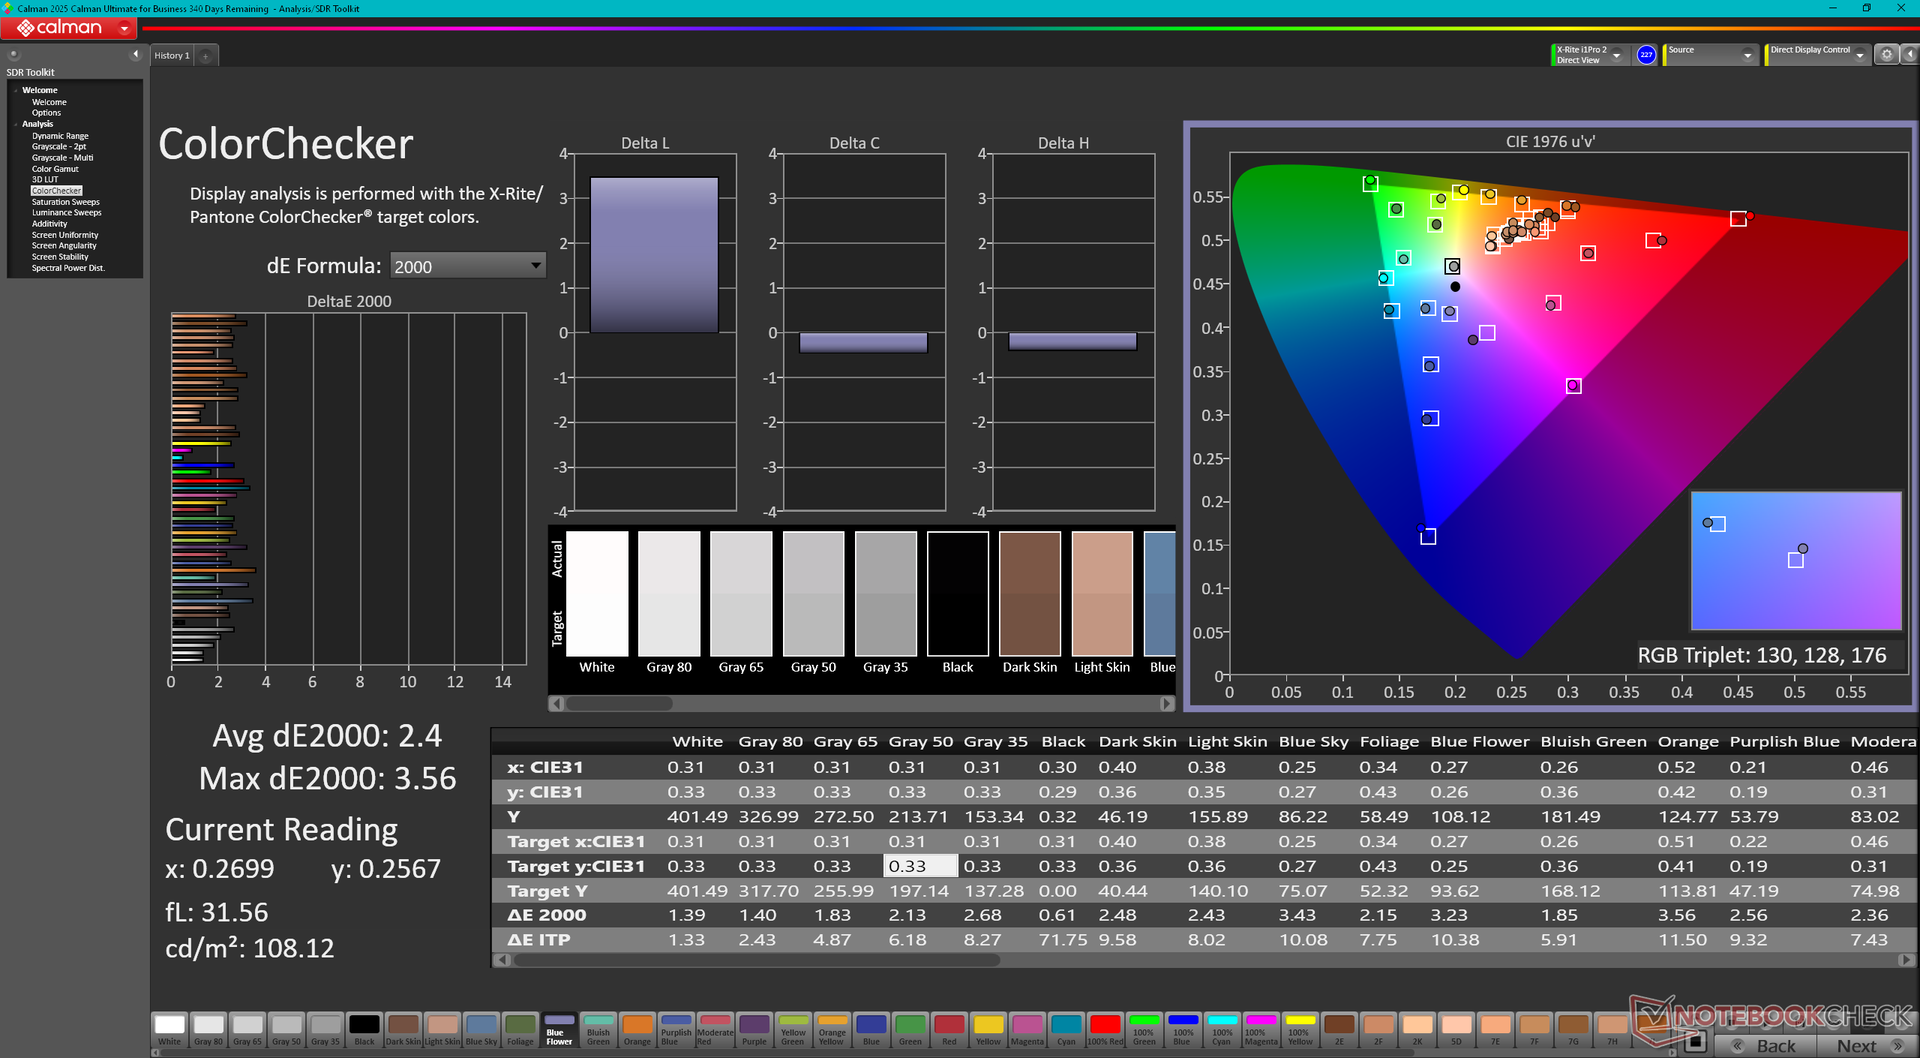
ΔE ColorChecker Calman: 2.4 | ∀{0.5-29.43 Ø4.78}
calibrated: 0.54
ΔE Greyscale Calman: 1.9 | ∀{0.09-98 Ø5}
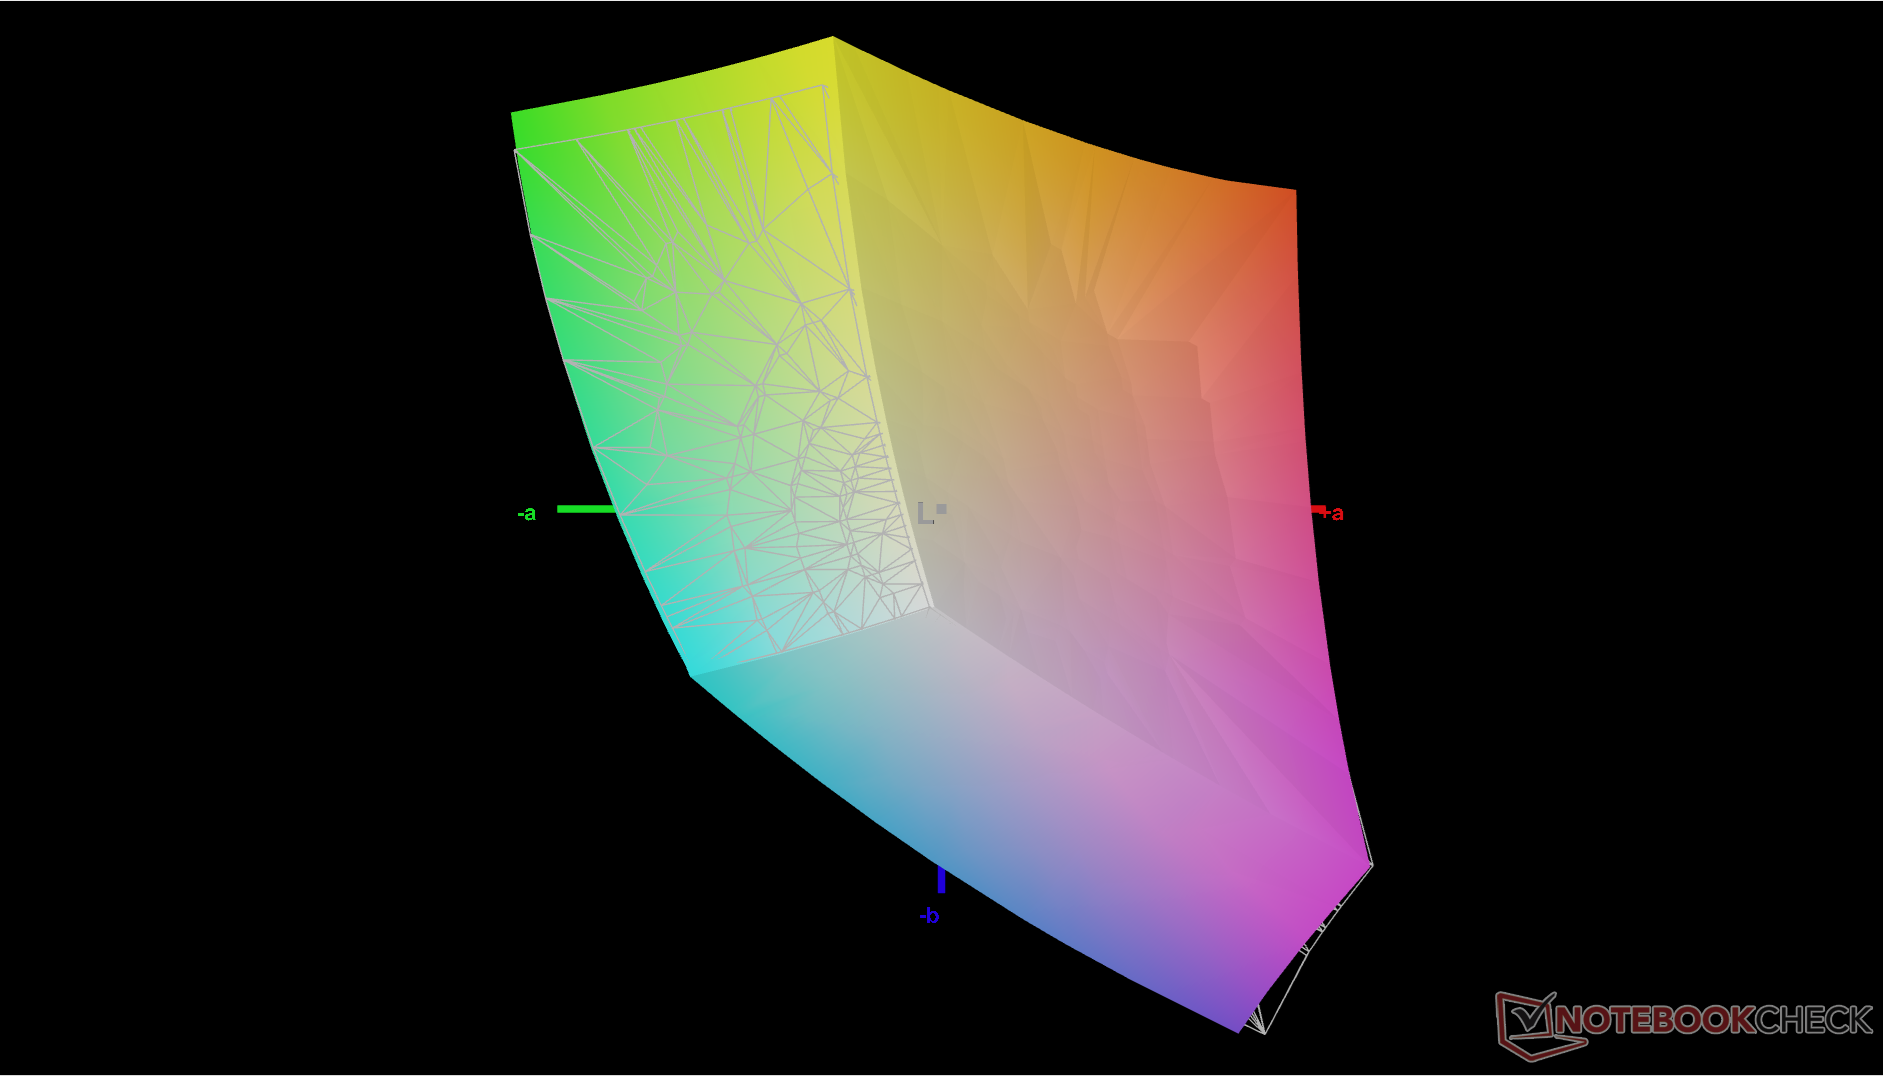
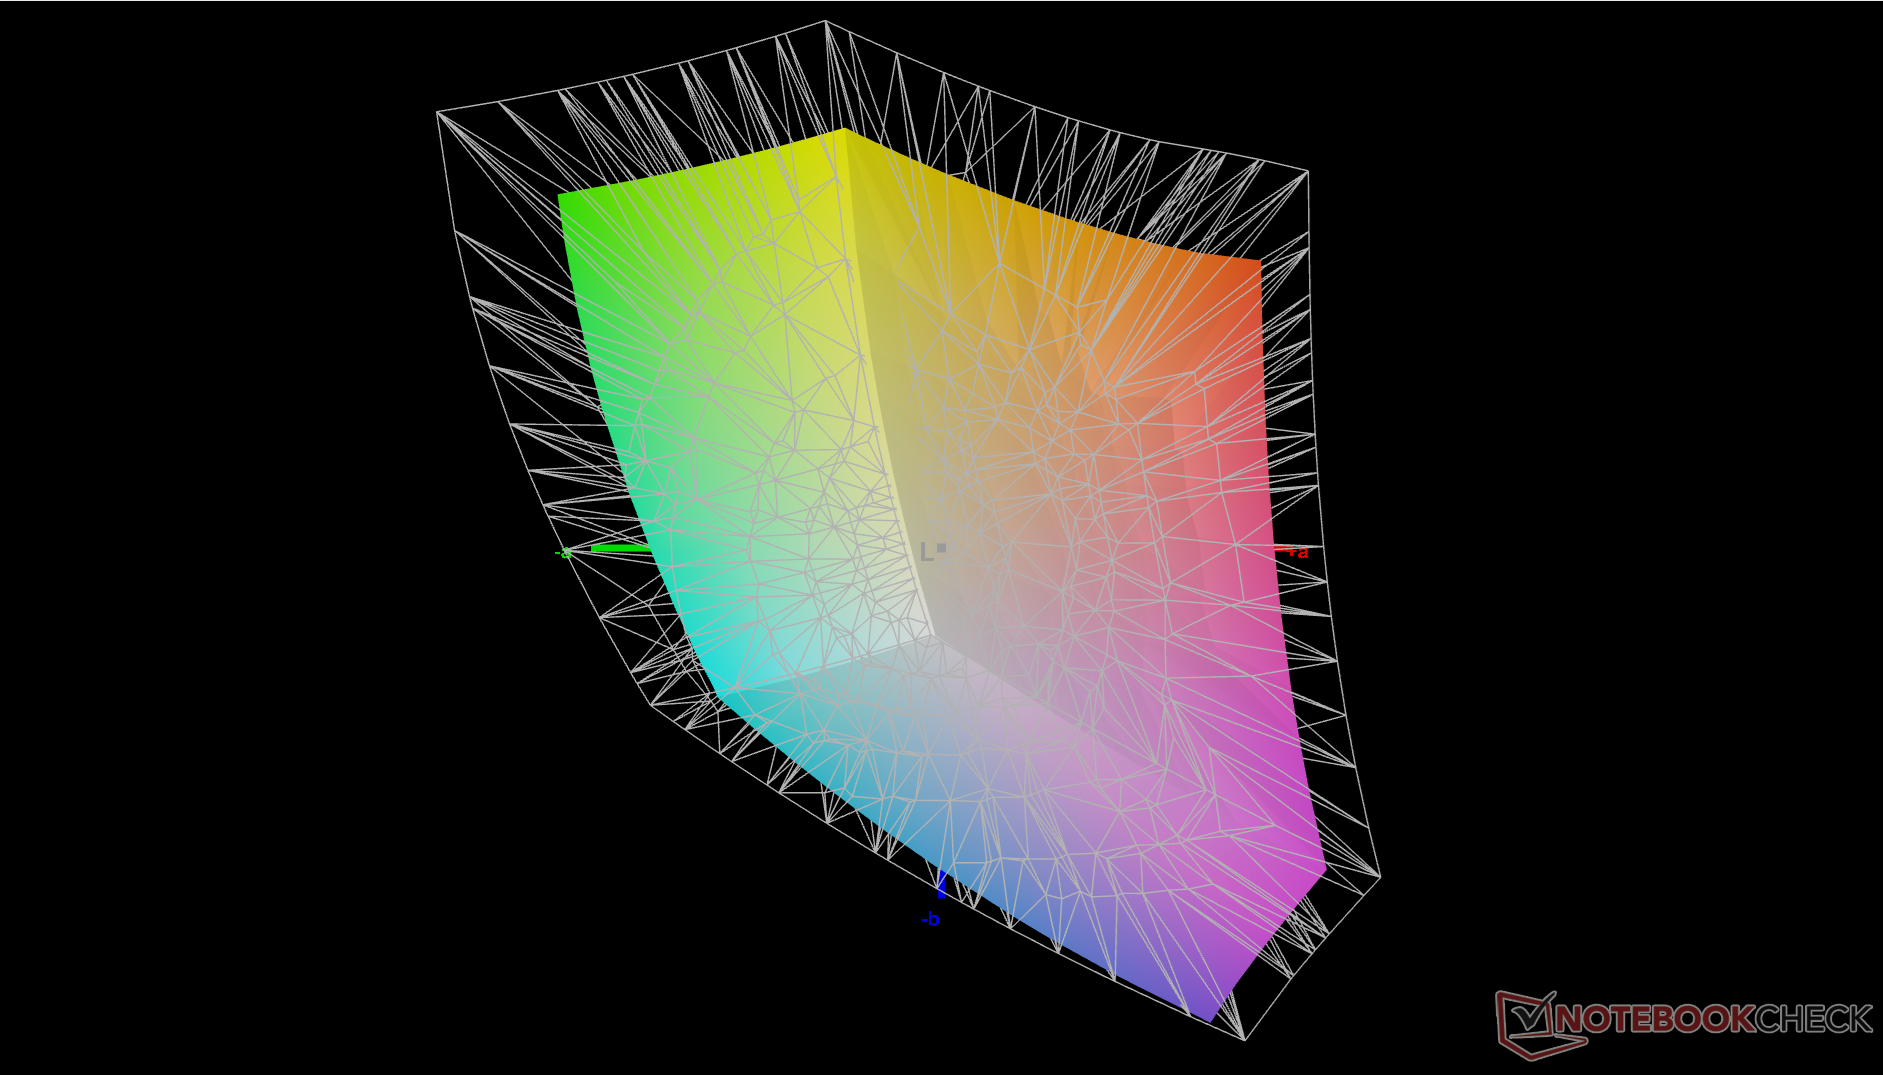
73.1% AdobeRGB 1998 (Argyll 3D)
98.6% sRGB (Argyll 3D)
71.6% Display P3 (Argyll 3D)
Gamma: 2
CCT: 6503 K
| MSI Summit E13 AI Evo A1MTG CMN13C6, IPS, 1920x1200, 13.3", 60 Hz | MSI Summit E13 Flip Evo A11MT Sharp LQ134N1JW53, IPS, 1920x1200, 13.4", 120 Hz | Lenovo Yoga Book 9 13IMU9 SDC ATNA33AA02-0, OLED, 2880x1800, 13.3", 60 Hz | Lenovo ThinkPad L13 Yoga G4 i7-1355U NV133WUM-N61, IPS, 1920x1200, 13.3", 60 Hz | HP Elite Dragonfly Folio 13.5 G3 Chi Mei CMN13C0, IPS, 1920x1280, 13.5", 60 Hz | Dell Latitude 9330 AU Optronics B133QAA, IPS, 2560x1600, 13.3", 60 Hz | |
|---|---|---|---|---|---|---|
| Display | -2% | 24% | -0% | -3% | 5% | |
| Display P3 Coverage (%) | 71.6 | 69.8 -3% | 99.7 39% | 71.6 0% | 68.3 -5% | 77.8 9% |
| sRGB Coverage (%) | 98.6 | 98.8 0% | 100 1% | 99.8 1% | 98.6 0% | 99.9 1% |
| AdobeRGB 1998 Coverage (%) | 73.1 | 70.6 -3% | 97 33% | 71.9 -2% | 70.2 -4% | 77.5 6% |
| Response Times | -16% | 96% | 52% | -19% | -29% | |
| Response Time Grey 50% / Grey 80% * (ms) | 60 ? | 64 ? -7% | 1.88 ? 97% | 27.3 ? 54% | 66.8 ? -11% | 67.6 ? -13% |
| Response Time Black / White * (ms) | 35.1 ? | 44 ? -25% | 2.1 ? 94% | 17.9 ? 49% | 44.4 ? -26% | 50.4 ? -44% |
| PWM Frequency (Hz) | 60 ? | |||||
| Screen | -3% | -34% | -25% | -6% | -12% | |
| Brightness middle (cd/m²) | 405.2 | 551.3 36% | 362.6 -11% | 278.1 -31% | 369.5 -9% | 542.3 34% |
| Brightness (cd/m²) | 372 | 517 39% | 368 -1% | 280 -25% | 350 -6% | 516 39% |
| Brightness Distribution (%) | 88 | 91 3% | 97 10% | 92 5% | 87 -1% | 85 -3% |
| Black Level * (cd/m²) | 0.34 | 0.37 -9% | 0.34 -0% | 0.24 29% | 0.38 -12% | |
| Contrast (:1) | 1192 | 1490 25% | 818 -31% | 1540 29% | 1427 20% | |
| Colorchecker dE 2000 * | 2.4 | 1.45 40% | 4.66 -94% | 2.6 -8% | 2.3 4% | 3.18 -33% |
| Colorchecker dE 2000 max. * | 3.56 | 2.86 20% | 7.25 -104% | 4.81 -35% | 4.34 -22% | 6.05 -70% |
| Colorchecker dE 2000 calibrated * | 0.54 | 1.7 -215% | 0.56 -4% | 0.51 6% | 0.6 -11% | 0.67 -24% |
| Greyscale dE 2000 * | 1.9 | 1.3 32% | 2.6 -37% | 3.9 -105% | 3.1 -63% | 3.1 -63% |
| Gamma | 2 110% | 2.14 103% | 2.2 100% | 2.29 96% | 2.1 105% | 2.08 106% |
| CCT | 6503 100% | 6580 99% | 6055 107% | 5877 111% | 6248 104% | 6140 106% |
| Color Space (Percent of AdobeRGB 1998) (%) | 65 | |||||
| Color Space (Percent of sRGB) (%) | 99 | |||||
| Total Average (Program / Settings) | -7% /
-5% | 29% /
2% | 9% /
-9% | -9% /
-7% | -12% /
-11% |
* ... smaller is better
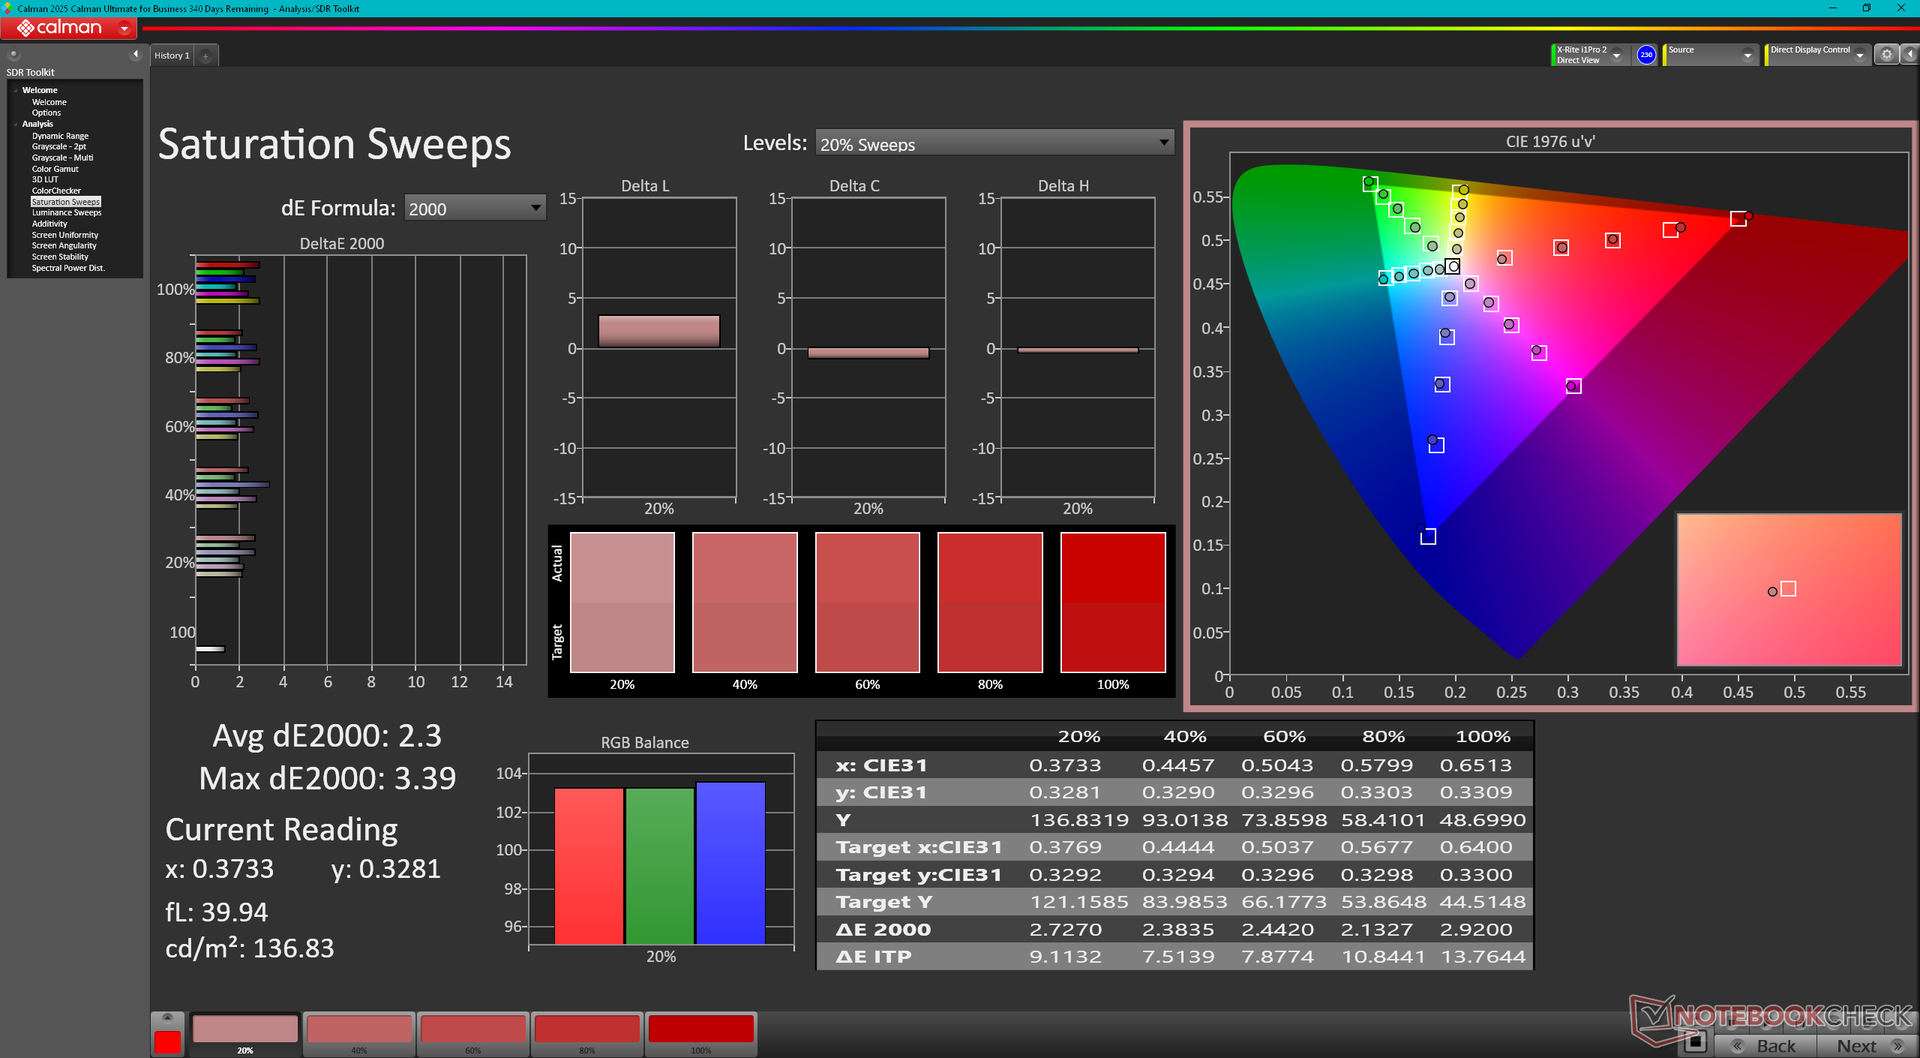
The display may be decently calibrated out of the box, but our own X-Rite calibration would improve colors even further. Average grayscale and color DeltaE values can be as low as 0.6 and 0.54, respectively.

Display Response Times
| ↔ Response Time Black to White | ||
|---|---|---|
| 35.1 ms ... rise ↗ and fall ↘ combined | ↗ 17 ms rise | 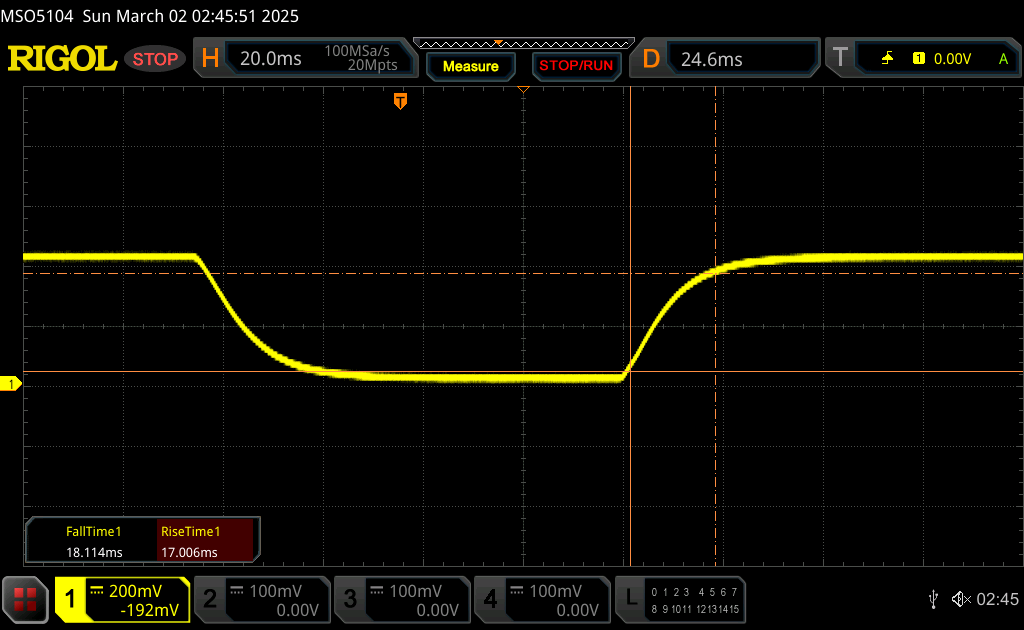 |
| ↘ 18.1 ms fall | ||
| The screen shows slow response rates in our tests and will be unsatisfactory for gamers. In comparison, all tested devices range from 0.1 (minimum) to 240 (maximum) ms. » 93 % of all devices are better. This means that the measured response time is worse than the average of all tested devices (20.2 ms). | ||
| ↔ Response Time 50% Grey to 80% Grey | ||
| 60 ms ... rise ↗ and fall ↘ combined | ↗ 27.2 ms rise | 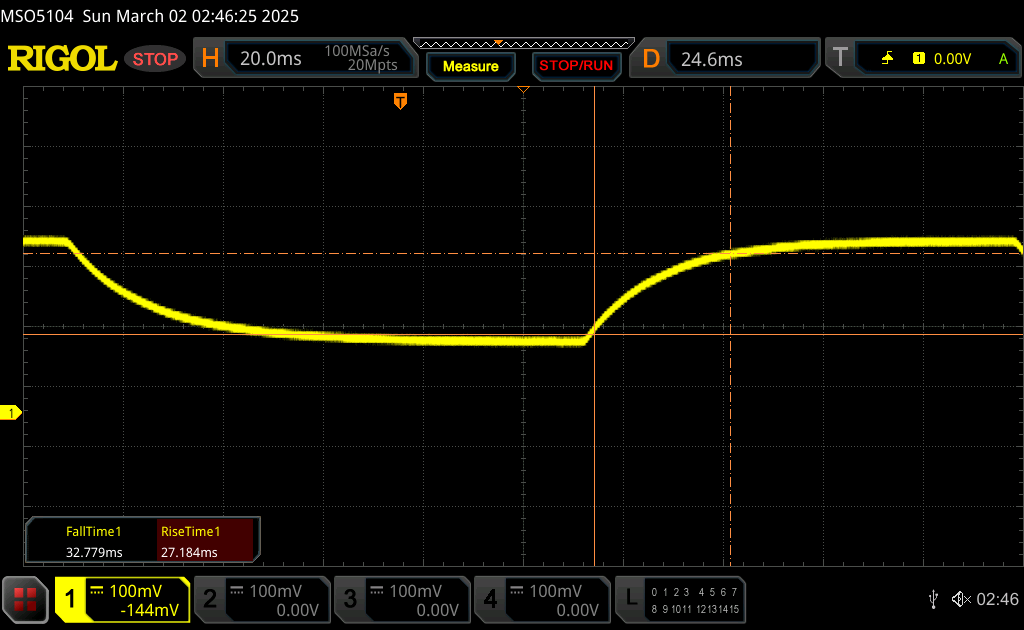 |
| ↘ 32.8 ms fall | ||
| The screen shows slow response rates in our tests and will be unsatisfactory for gamers. In comparison, all tested devices range from 0.165 (minimum) to 636 (maximum) ms. » 96 % of all devices are better. This means that the measured response time is worse than the average of all tested devices (31.6 ms). | ||
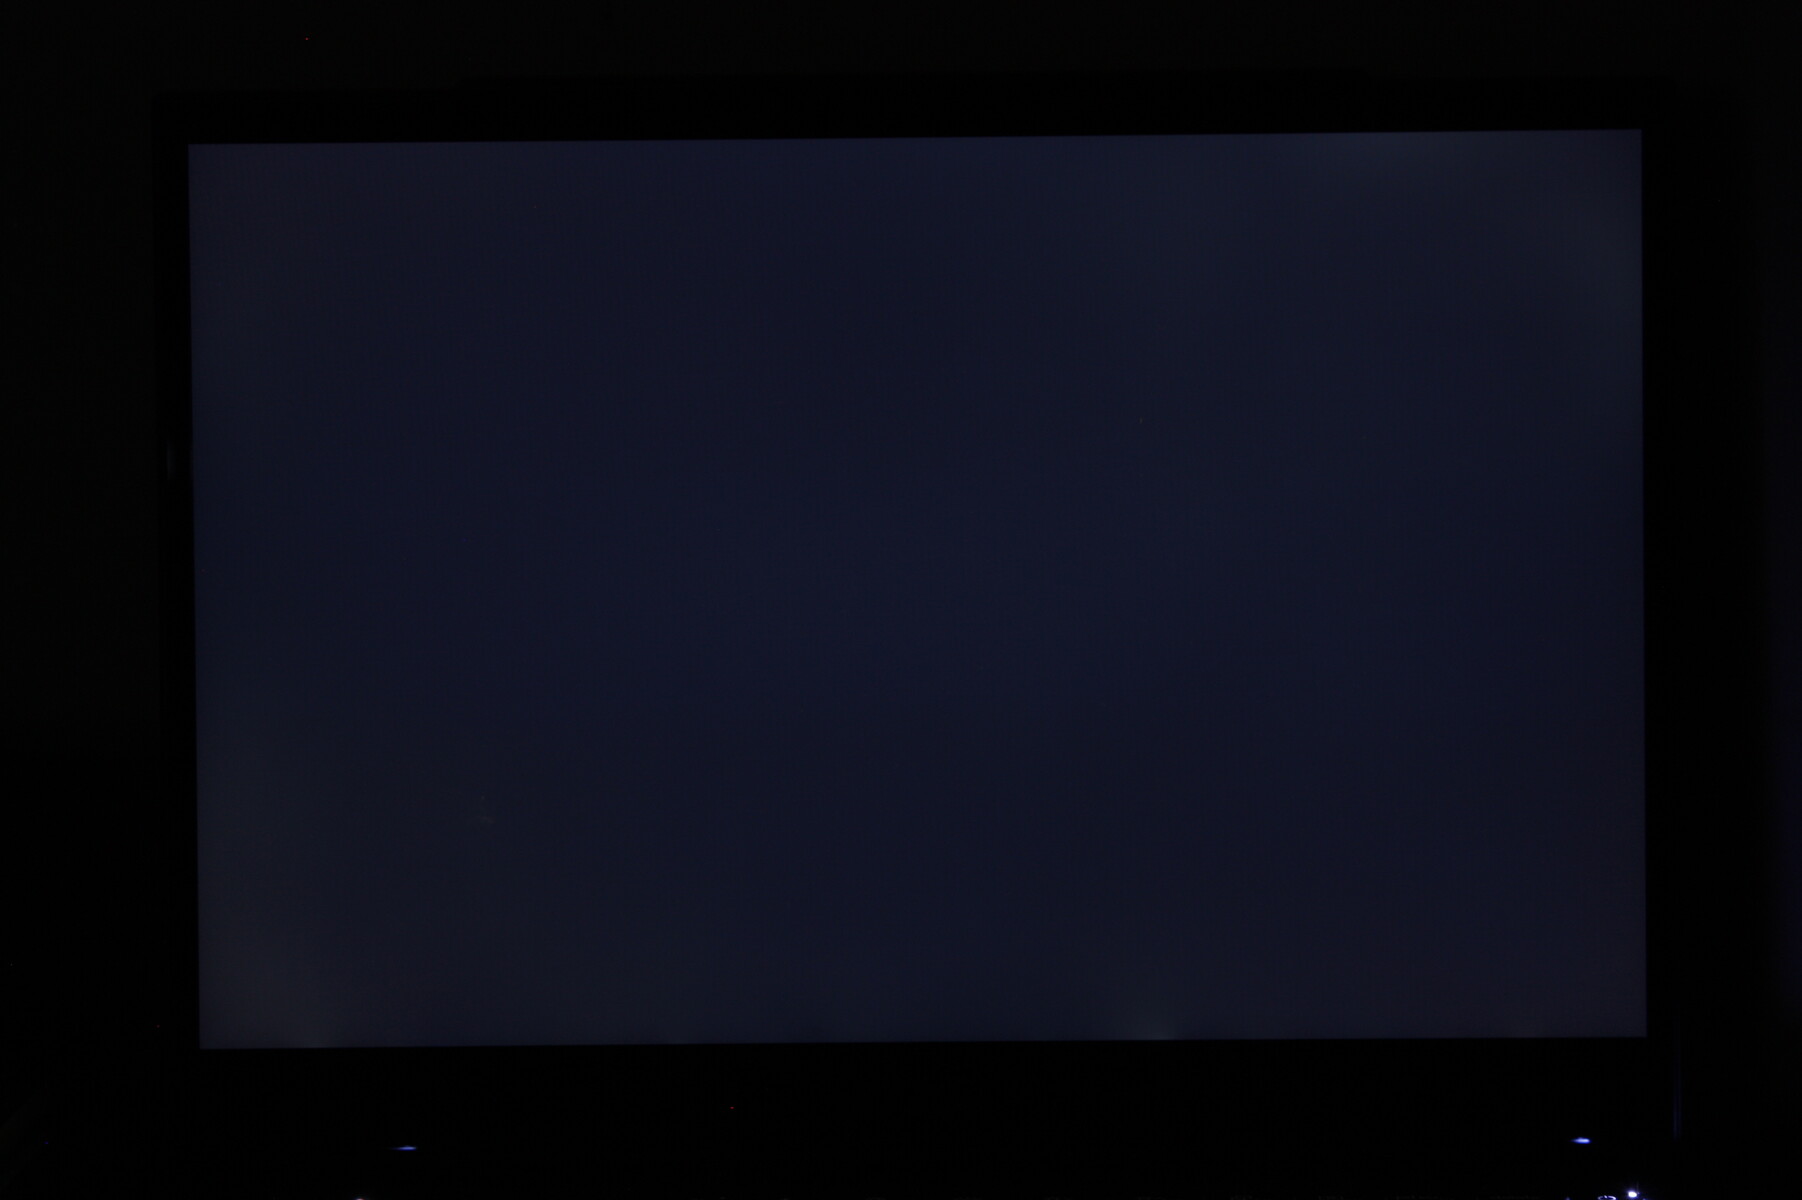
Screen Flickering / PWM (Pulse-Width Modulation)
| Screen flickering / PWM not detected |  | ||
In comparison: 53 % of all tested devices do not use PWM to dim the display. If PWM was detected, an average of 8121 (minimum: 5 - maximum: 343500) Hz was measured. | |||

Performance — Core Ultra-H Is Too Much To Handle


Testing Conditions
We set Windows to Performance mode and MSI Center to Extreme Performance mode prior to running the benchmarks below.
Processor
Raw multi-thread CPU performance would drop by over 20 percent after just the first loop into our CineBench R15 xT stress test. Consequently, our system would perform roughly 20 percent slower than the average laptop in our database equipped with the same Core Ultra 7 155H processor.
Cinebench R15 Multi Loop
Cinebench R23: Multi Core | Single Core
Cinebench R20: CPU (Multi Core) | CPU (Single Core)
Cinebench R15: CPU Multi 64Bit | CPU Single 64Bit
Blender: v2.79 BMW27 CPU
7-Zip 18.03: 7z b 4 | 7z b 4 -mmt1
Geekbench 6.5: Multi-Core | Single-Core
Geekbench 5.5: Multi-Core | Single-Core
HWBOT x265 Benchmark v2.2: 4k Preset
LibreOffice : 20 Documents To PDF
R Benchmark 2.5: Overall mean
| Geekbench 6.5 / Multi-Core | |
| Asus ROG Flow Z13 GZ302EA-RU073W | |
| Average Intel Core Ultra 7 155H (7732 - 13656, n=55) | |
| Framework Laptop 13.5 Ryzen 7 7840U | |
| MSI Prestige 13 AI Plus Evo A2VMG | |
| MSI Summit E13 AI Evo A1MTG | |
| Lenovo Yoga Book 9 13IMU9 | |
| Lenovo ThinkPad L13 Yoga G4 i7-1355U | |
| Geekbench 6.5 / Single-Core | |
| Asus ROG Flow Z13 GZ302EA-RU073W | |
| MSI Prestige 13 AI Plus Evo A2VMG | |
| Framework Laptop 13.5 Ryzen 7 7840U | |
| Lenovo ThinkPad L13 Yoga G4 i7-1355U | |
| Average Intel Core Ultra 7 155H (1901 - 2473, n=52) | |
| Lenovo Yoga Book 9 13IMU9 | |
| MSI Summit E13 AI Evo A1MTG | |
* ... smaller is better
AIDA64: FP32 Ray-Trace | FPU Julia | CPU SHA3 | CPU Queen | FPU SinJulia | FPU Mandel | CPU AES | CPU ZLib | FP64 Ray-Trace | CPU PhotoWorxx
| Performance rating | |
| Average Intel Core Ultra 7 155H | |
| MSI Summit E13 AI Evo A1MTG | |
| Lenovo Yoga Book 9 13IMU9 | |
| MSI Summit E13 Flip Evo A11MT | |
| HP Elite Dragonfly Folio 13.5 G3 | |
| Lenovo ThinkPad L13 Yoga G4 i7-1355U | |
| Dell Latitude 9330 | |
| AIDA64 / FP32 Ray-Trace | |
| Average Intel Core Ultra 7 155H (6670 - 18470, n=50) | |
| MSI Summit E13 AI Evo A1MTG | |
| Lenovo Yoga Book 9 13IMU9 | |
| MSI Summit E13 Flip Evo A11MT | |
| Dell Latitude 9330 | |
| HP Elite Dragonfly Folio 13.5 G3 | |
| Lenovo ThinkPad L13 Yoga G4 i7-1355U | |
| AIDA64 / FPU Julia | |
| Average Intel Core Ultra 7 155H (40905 - 93181, n=50) | |
| MSI Summit E13 AI Evo A1MTG | |
| Lenovo Yoga Book 9 13IMU9 | |
| HP Elite Dragonfly Folio 13.5 G3 | |
| Dell Latitude 9330 | |
| Lenovo ThinkPad L13 Yoga G4 i7-1355U | |
| MSI Summit E13 Flip Evo A11MT | |
| AIDA64 / CPU SHA3 | |
| Average Intel Core Ultra 7 155H (1940 - 4436, n=50) | |
| MSI Summit E13 AI Evo A1MTG | |
| Lenovo Yoga Book 9 13IMU9 | |
| MSI Summit E13 Flip Evo A11MT | |
| Dell Latitude 9330 | |
| Lenovo ThinkPad L13 Yoga G4 i7-1355U | |
| HP Elite Dragonfly Folio 13.5 G3 | |
| AIDA64 / CPU Queen | |
| Average Intel Core Ultra 7 155H (64698 - 94181, n=50) | |
| MSI Summit E13 AI Evo A1MTG | |
| HP Elite Dragonfly Folio 13.5 G3 | |
| Lenovo ThinkPad L13 Yoga G4 i7-1355U | |
| MSI Summit E13 Flip Evo A11MT | |
| Dell Latitude 9330 | |
| Lenovo Yoga Book 9 13IMU9 | |
| AIDA64 / FPU SinJulia | |
| Average Intel Core Ultra 7 155H (5639 - 10647, n=50) | |
| MSI Summit E13 AI Evo A1MTG | |
| Lenovo Yoga Book 9 13IMU9 | |
| MSI Summit E13 Flip Evo A11MT | |
| HP Elite Dragonfly Folio 13.5 G3 | |
| Lenovo ThinkPad L13 Yoga G4 i7-1355U | |
| Dell Latitude 9330 | |
| AIDA64 / FPU Mandel | |
| Average Intel Core Ultra 7 155H (18236 - 47685, n=50) | |
| MSI Summit E13 AI Evo A1MTG | |
| Lenovo Yoga Book 9 13IMU9 | |
| MSI Summit E13 Flip Evo A11MT | |
| HP Elite Dragonfly Folio 13.5 G3 | |
| Dell Latitude 9330 | |
| Lenovo ThinkPad L13 Yoga G4 i7-1355U | |
| AIDA64 / CPU AES | |
| Average Intel Core Ultra 7 155H (45713 - 152179, n=50) | |
| MSI Summit E13 Flip Evo A11MT | |
| MSI Summit E13 AI Evo A1MTG | |
| Lenovo Yoga Book 9 13IMU9 | |
| HP Elite Dragonfly Folio 13.5 G3 | |
| Lenovo ThinkPad L13 Yoga G4 i7-1355U | |
| Dell Latitude 9330 | |
| AIDA64 / CPU ZLib | |
| Average Intel Core Ultra 7 155H (557 - 1250, n=50) | |
| MSI Summit E13 AI Evo A1MTG | |
| Lenovo Yoga Book 9 13IMU9 | |
| HP Elite Dragonfly Folio 13.5 G3 | |
| Lenovo ThinkPad L13 Yoga G4 i7-1355U | |
| Dell Latitude 9330 | |
| MSI Summit E13 Flip Evo A11MT | |
| AIDA64 / FP64 Ray-Trace | |
| Average Intel Core Ultra 7 155H (3569 - 9802, n=50) | |
| MSI Summit E13 AI Evo A1MTG | |
| Lenovo Yoga Book 9 13IMU9 | |
| MSI Summit E13 Flip Evo A11MT | |
| Dell Latitude 9330 | |
| HP Elite Dragonfly Folio 13.5 G3 | |
| Lenovo ThinkPad L13 Yoga G4 i7-1355U | |
| AIDA64 / CPU PhotoWorxx | |
| Average Intel Core Ultra 7 155H (32719 - 54223, n=50) | |
| Lenovo Yoga Book 9 13IMU9 | |
| HP Elite Dragonfly Folio 13.5 G3 | |
| MSI Summit E13 AI Evo A1MTG | |
| MSI Summit E13 Flip Evo A11MT | |
| Dell Latitude 9330 | |
| Lenovo ThinkPad L13 Yoga G4 i7-1355U | |
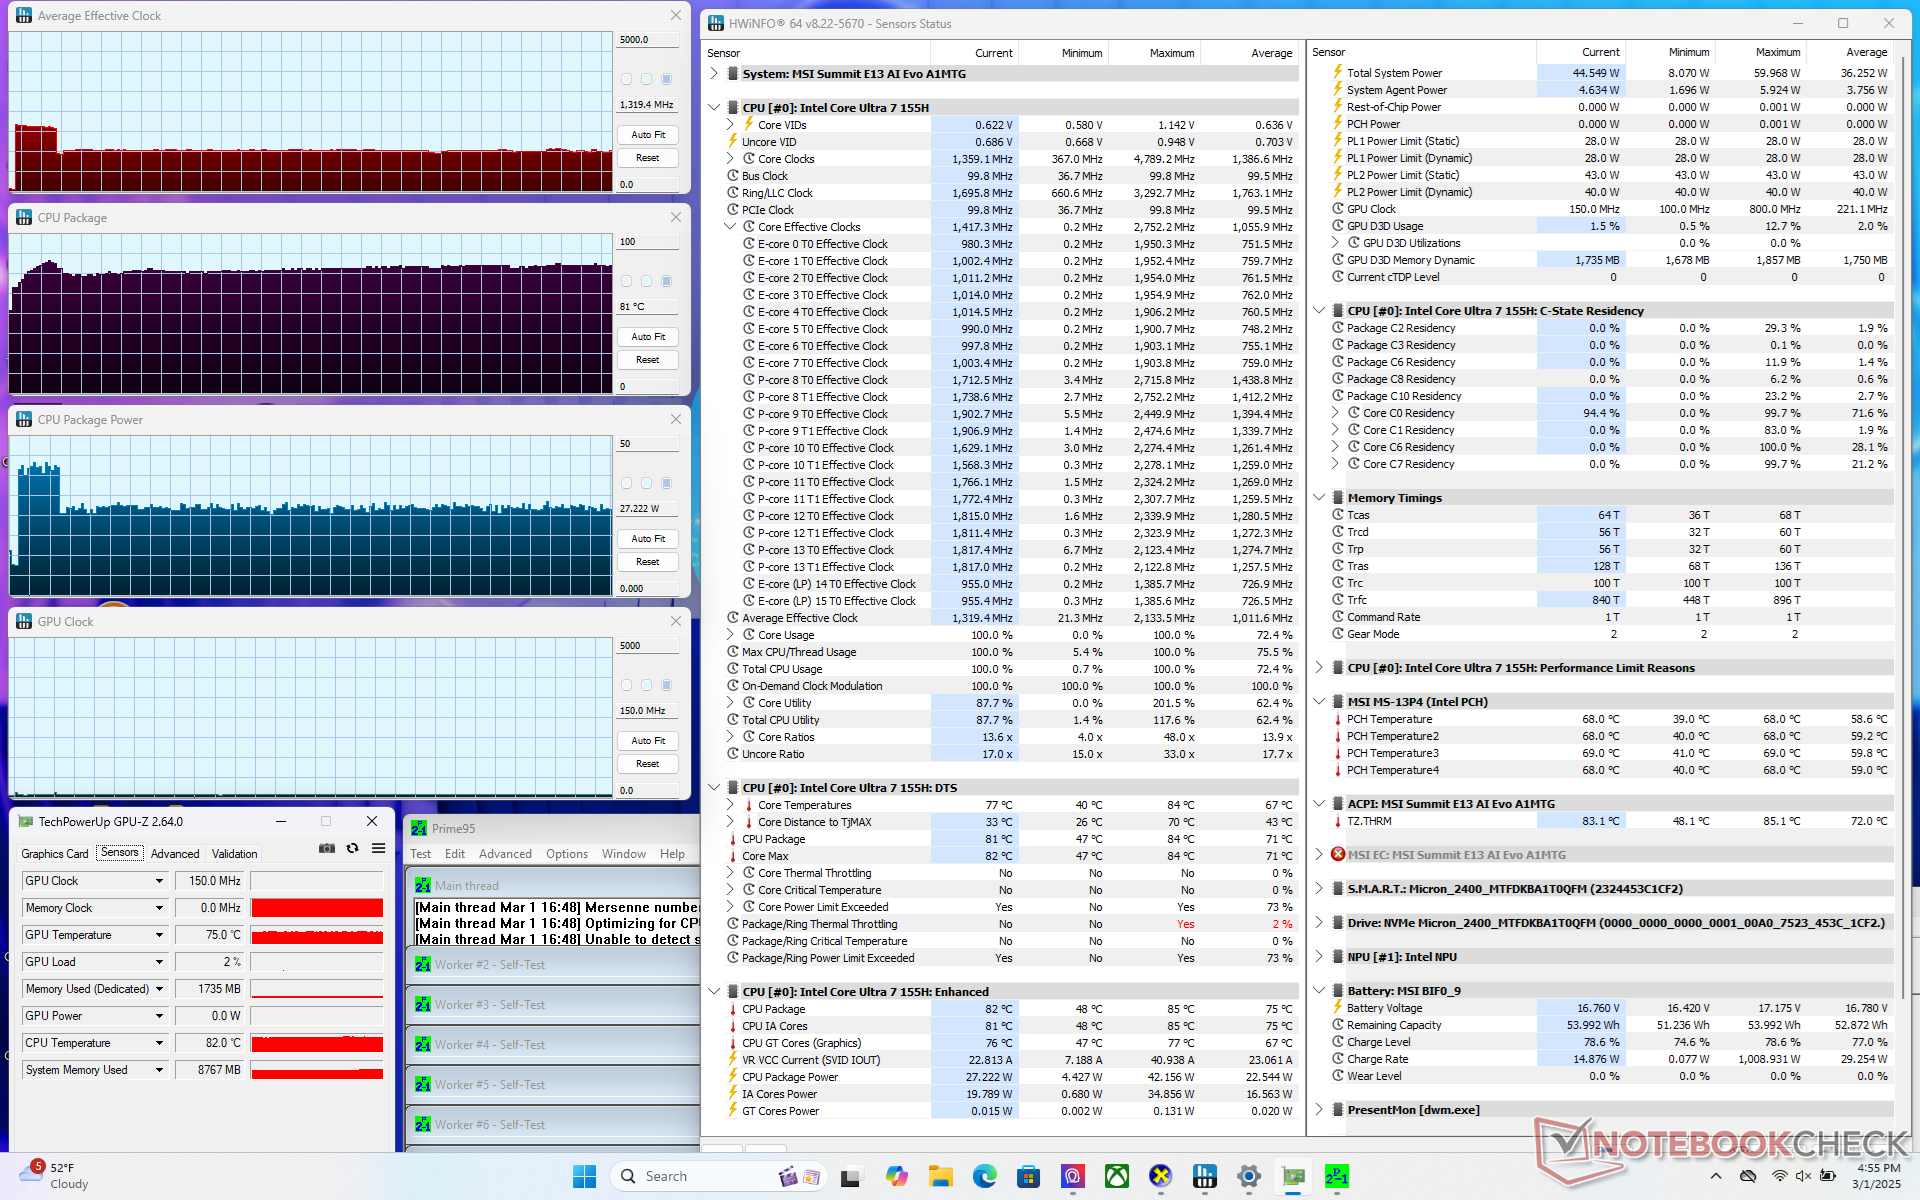
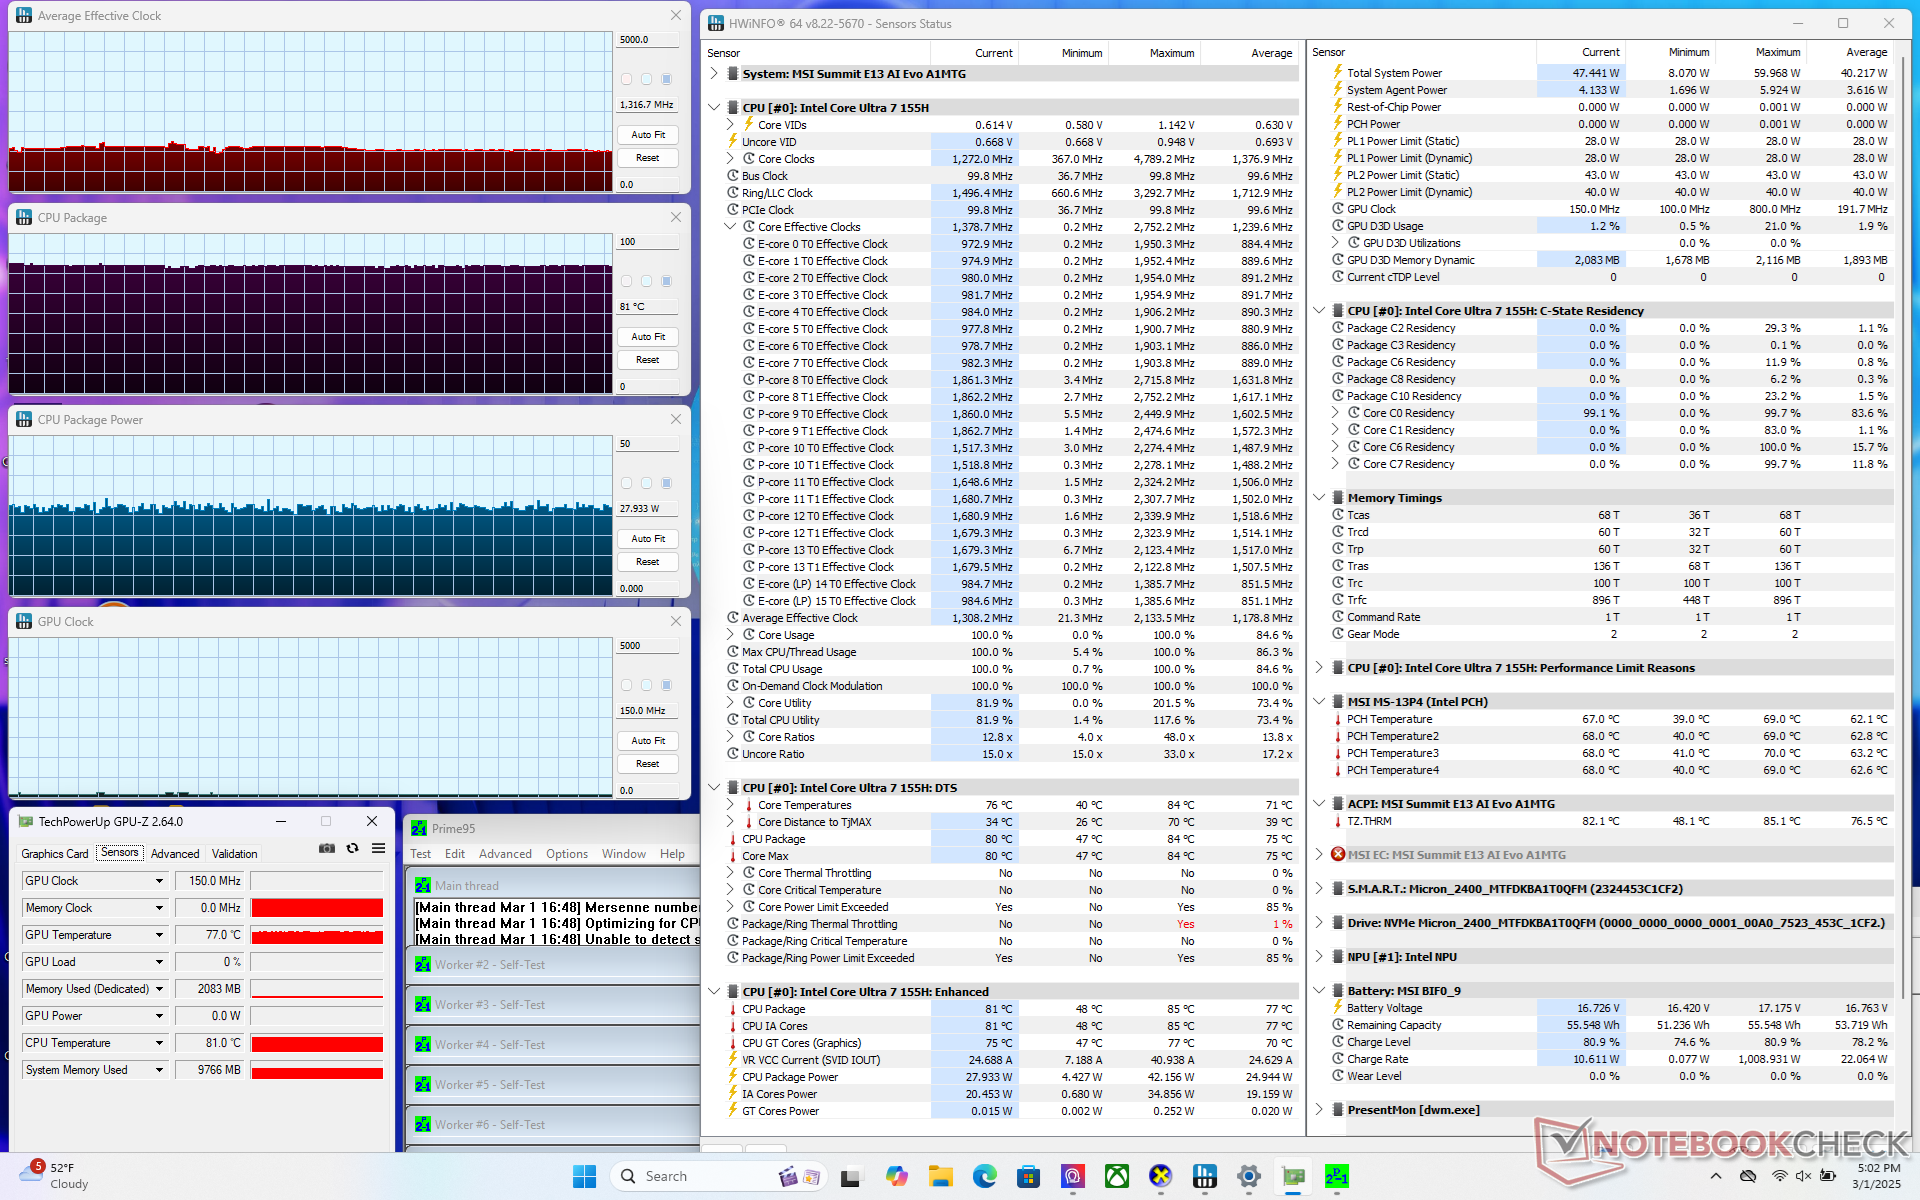
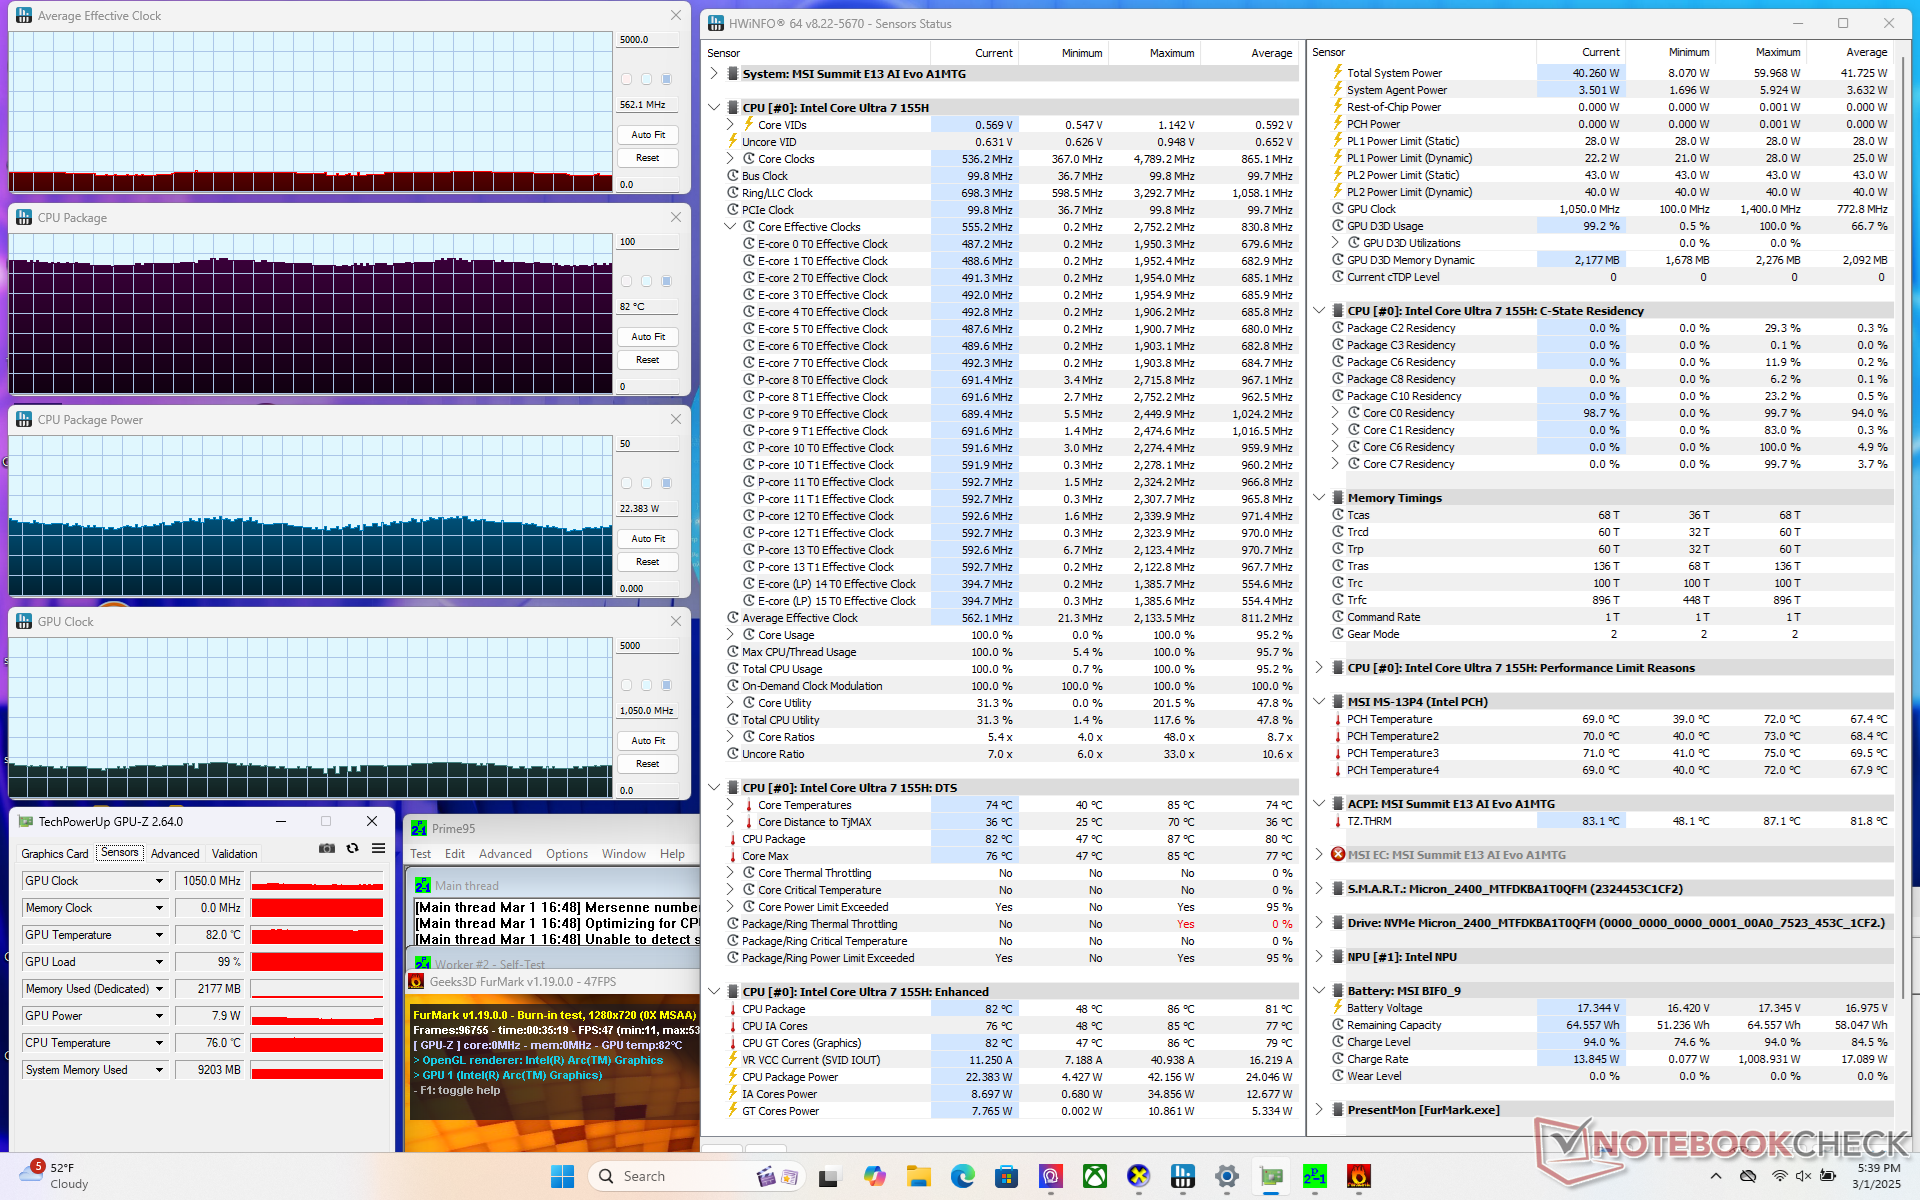
Stress Test
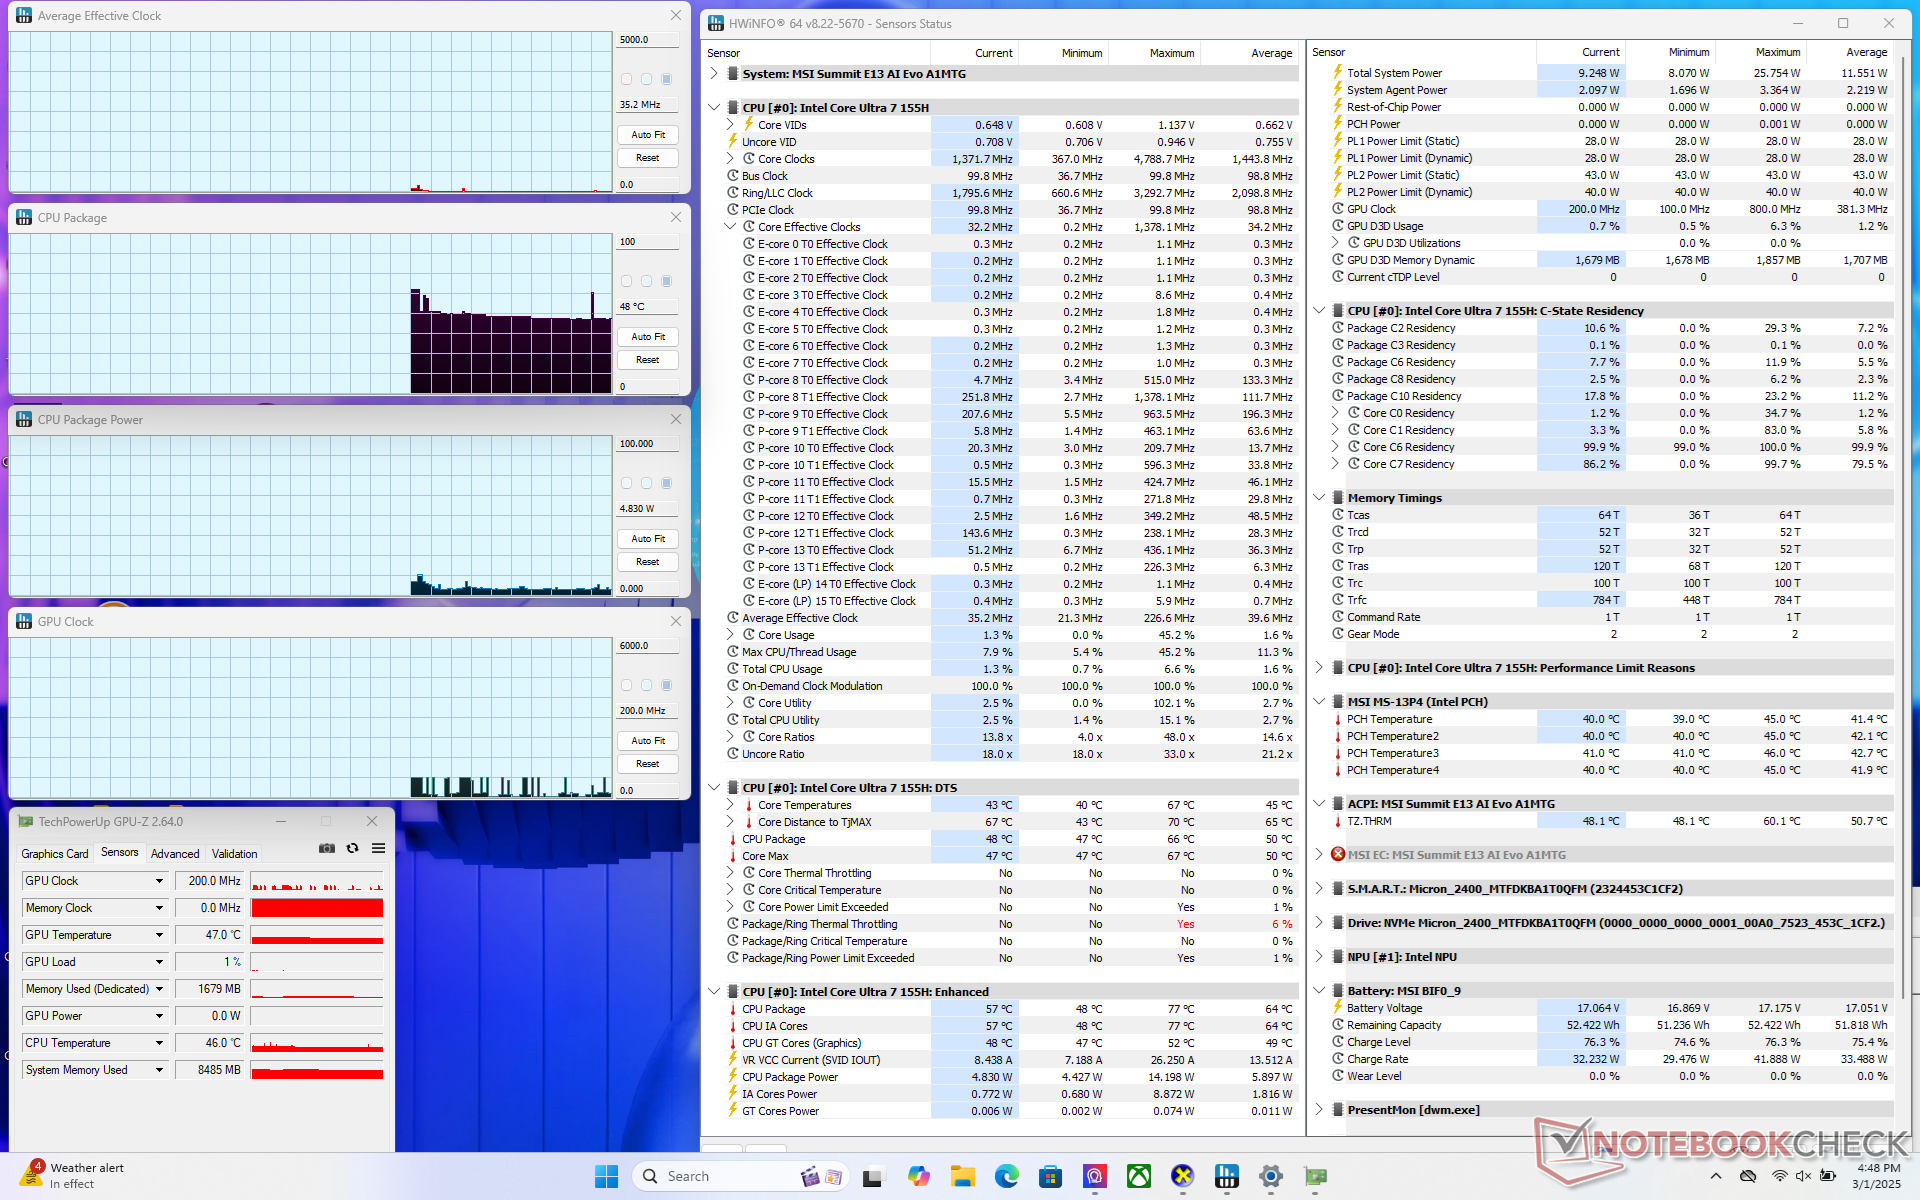
When running Prime95, the CPU would boost to 2.1 GHz and 41 W until reaching a core temperature of 84 C a few moments later. It would then stabilize at 1.3 GHz and 28 W in order to maintain a core temperature of 81 C with Cooler Boost enabled. Core temperature would rise by only a few degrees if Cooler Boost is disabled.
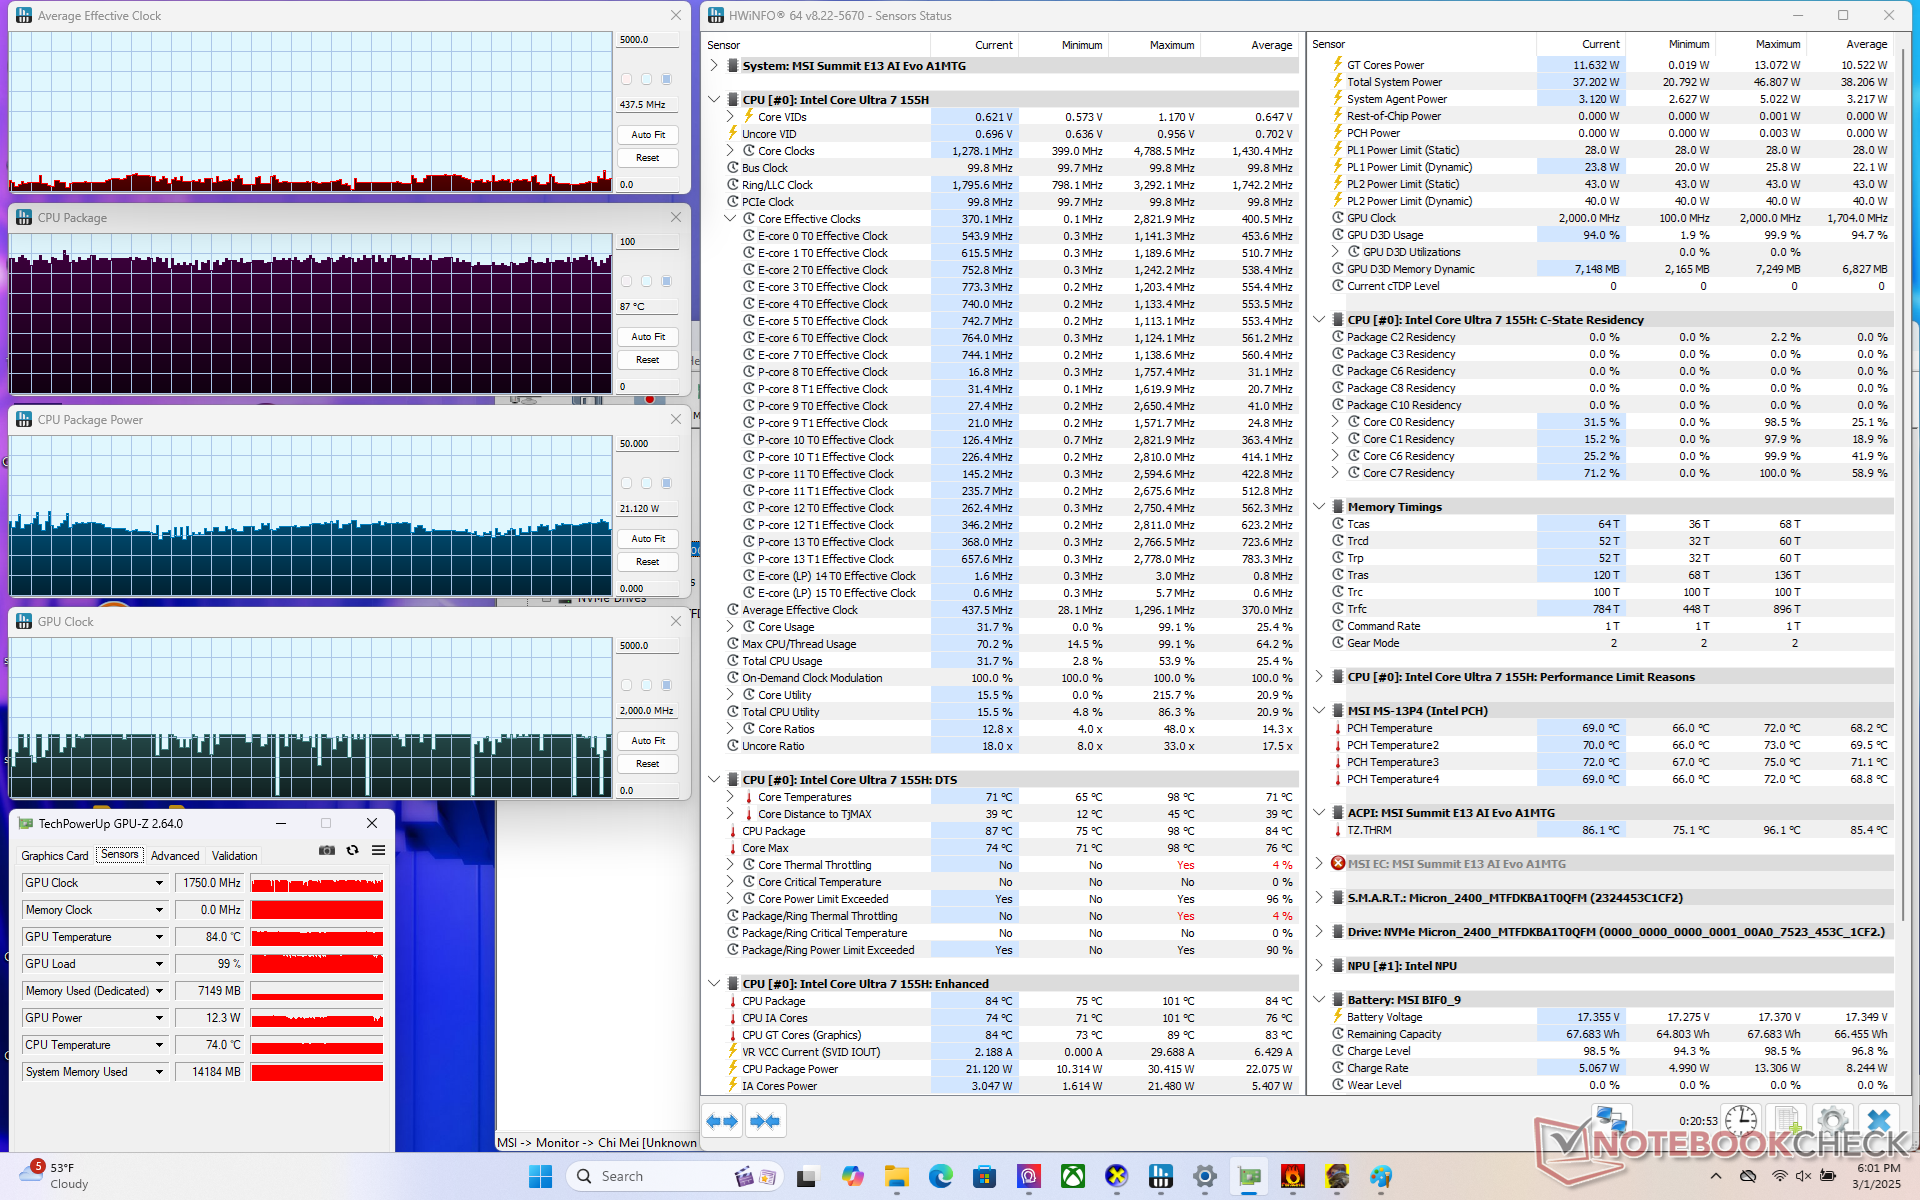
When running Cyberpunk 2077, GPU clock rate would be relatively unsteady as shown by the screenshot below even when idling in-game. This reflects the unsteady frame rates as noted in the GPU Performance section below. Core temperature would be very high as well at 87 C or over 10 C warmer than on the 2021 model.
| Average CPU Clock (GHz) | GPU Clock (MHz) | Average CPU Temperature (°C) | |
| System Idle | -- | -- | 48 |
| Prime95 Stress (Cooler Boost On) | 1.3 | -- | 81 |
| Prime95 Stress (Cooler Boost Off) | 1.3 | -- | 81 |
| Prime95 + FurMark Stress | 0.6 | 1050 | 82 |
| Cyberpunk 2077 Stress | 0.4 | ~2000 | 87 |
System Performance
CrossMark: Overall | Productivity | Creativity | Responsiveness
WebXPRT 3: Overall
WebXPRT 4: Overall
Mozilla Kraken 1.1: Total
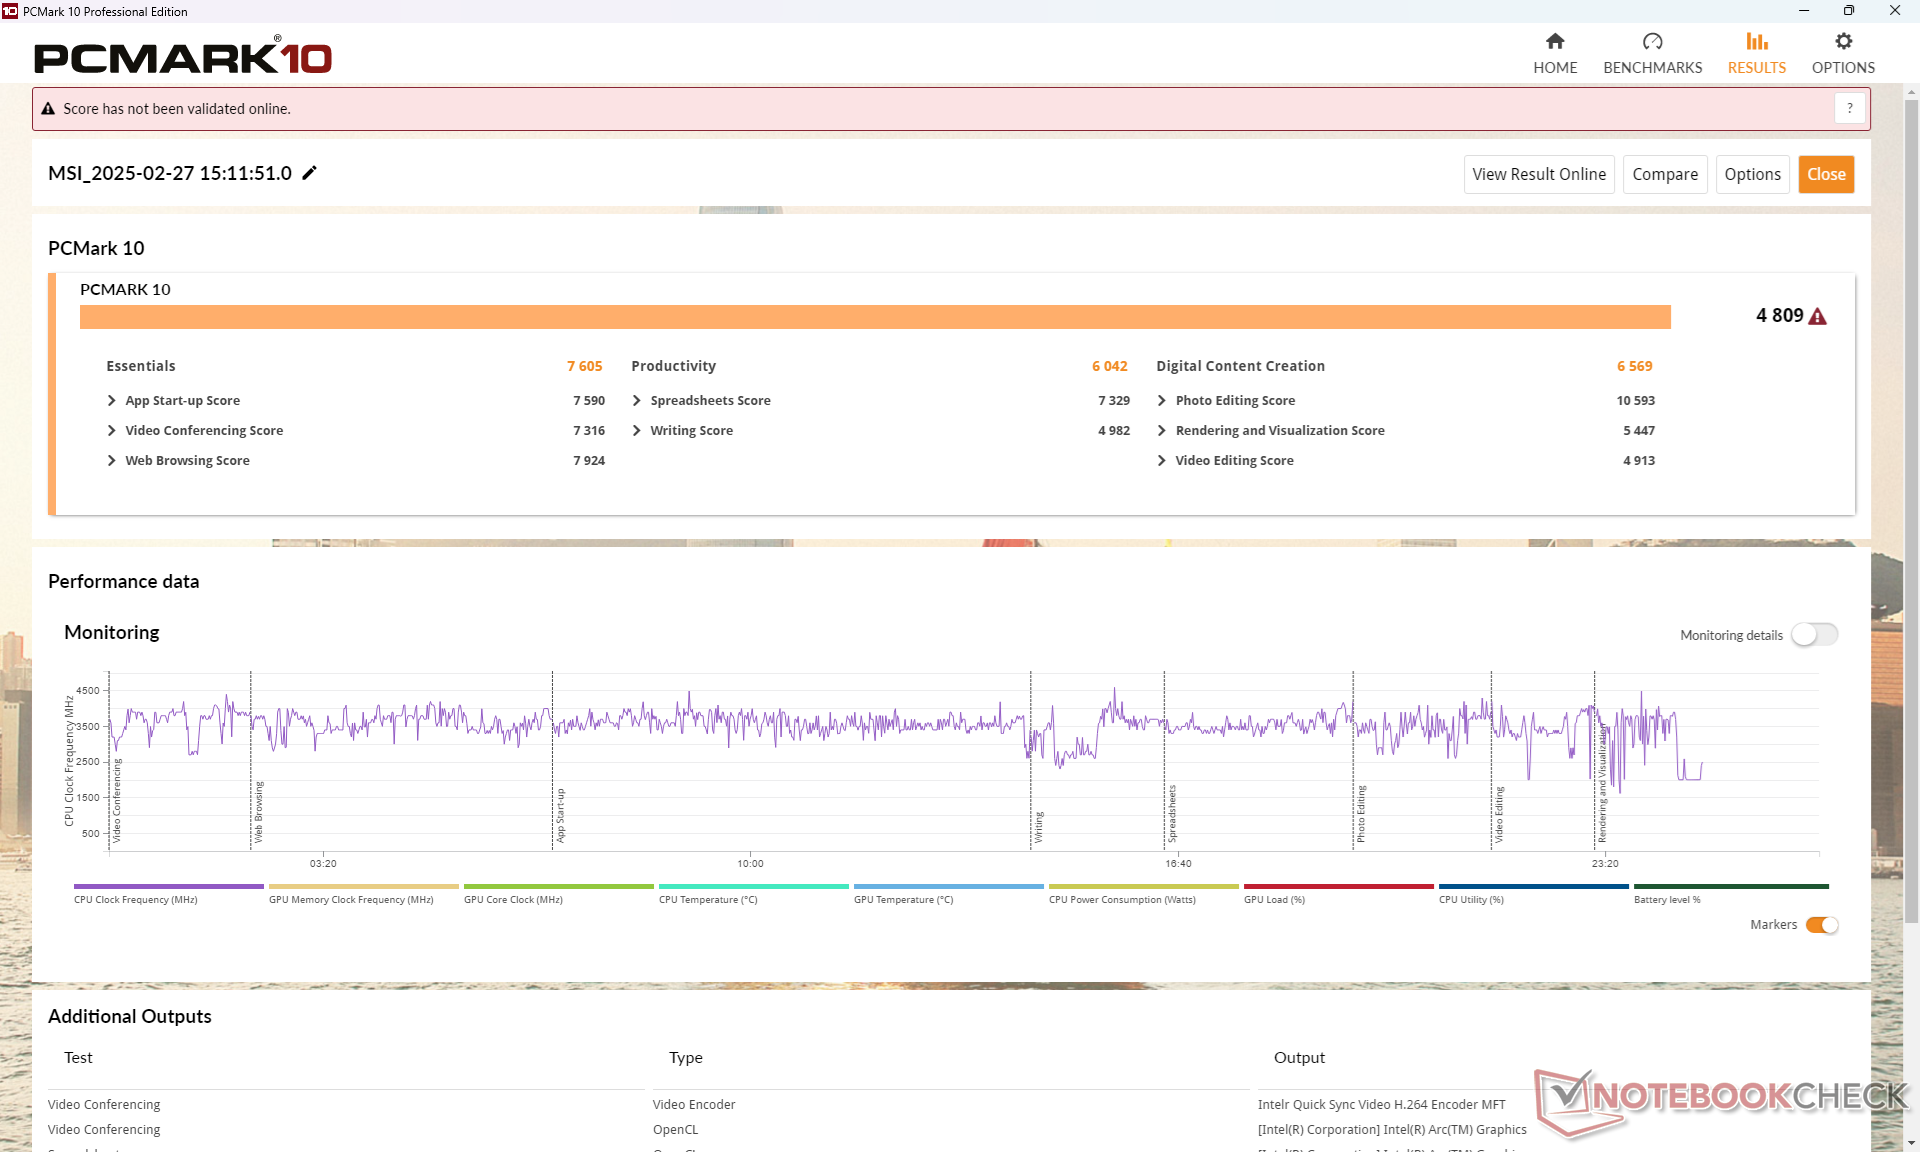
| PCMark 10 / Score | |
| Average Intel Core Ultra 7 155H, Intel Arc 8-Core iGPU (4809 - 7529, n=34) | |
| Lenovo Yoga Book 9 13IMU9 | |
| Lenovo ThinkPad L13 Yoga G4 i7-1355U | |
| HP Elite Dragonfly Folio 13.5 G3 | |
| Dell Latitude 9330 | |
| MSI Summit E13 AI Evo A1MTG | |
| MSI Summit E13 Flip Evo A11MT | |
| PCMark 10 / Essentials | |
| HP Elite Dragonfly Folio 13.5 G3 | |
| Lenovo ThinkPad L13 Yoga G4 i7-1355U | |
| Lenovo Yoga Book 9 13IMU9 | |
| Average Intel Core Ultra 7 155H, Intel Arc 8-Core iGPU (7605 - 11289, n=34) | |
| Dell Latitude 9330 | |
| MSI Summit E13 Flip Evo A11MT | |
| MSI Summit E13 AI Evo A1MTG | |
| PCMark 10 / Productivity | |
| Average Intel Core Ultra 7 155H, Intel Arc 8-Core iGPU (6042 - 10591, n=34) | |
| Lenovo Yoga Book 9 13IMU9 | |
| Lenovo ThinkPad L13 Yoga G4 i7-1355U | |
| HP Elite Dragonfly Folio 13.5 G3 | |
| Dell Latitude 9330 | |
| MSI Summit E13 Flip Evo A11MT | |
| MSI Summit E13 AI Evo A1MTG | |
| PCMark 10 / Digital Content Creation | |
| Average Intel Core Ultra 7 155H, Intel Arc 8-Core iGPU (4985 - 10709, n=34) | |
| Lenovo Yoga Book 9 13IMU9 | |
| MSI Summit E13 AI Evo A1MTG | |
| Lenovo ThinkPad L13 Yoga G4 i7-1355U | |
| HP Elite Dragonfly Folio 13.5 G3 | |
| Dell Latitude 9330 | |
| MSI Summit E13 Flip Evo A11MT | |
| CrossMark / Overall | |
| Average Intel Core Ultra 7 155H, Intel Arc 8-Core iGPU (1366 - 1903, n=34) | |
| MSI Summit E13 AI Evo A1MTG | |
| HP Elite Dragonfly Folio 13.5 G3 | |
| Lenovo ThinkPad L13 Yoga G4 i7-1355U | |
| Lenovo Yoga Book 9 13IMU9 | |
| CrossMark / Productivity | |
| Average Intel Core Ultra 7 155H, Intel Arc 8-Core iGPU (1291 - 1798, n=33) | |
| HP Elite Dragonfly Folio 13.5 G3 | |
| MSI Summit E13 AI Evo A1MTG | |
| Lenovo ThinkPad L13 Yoga G4 i7-1355U | |
| Lenovo Yoga Book 9 13IMU9 | |
| CrossMark / Creativity | |
| Average Intel Core Ultra 7 155H, Intel Arc 8-Core iGPU (1519 - 1929, n=33) | |
| MSI Summit E13 AI Evo A1MTG | |
| HP Elite Dragonfly Folio 13.5 G3 | |
| Lenovo ThinkPad L13 Yoga G4 i7-1355U | |
| Lenovo Yoga Book 9 13IMU9 | |
| CrossMark / Responsiveness | |
| HP Elite Dragonfly Folio 13.5 G3 | |
| MSI Summit E13 AI Evo A1MTG | |
| Average Intel Core Ultra 7 155H, Intel Arc 8-Core iGPU (939 - 1802, n=33) | |
| Lenovo Yoga Book 9 13IMU9 | |
| Lenovo ThinkPad L13 Yoga G4 i7-1355U | |
| WebXPRT 3 / Overall | |
| Lenovo ThinkPad L13 Yoga G4 i7-1355U | |
| HP Elite Dragonfly Folio 13.5 G3 | |
| MSI Summit E13 AI Evo A1MTG | |
| Average Intel Core Ultra 7 155H, Intel Arc 8-Core iGPU (252 - 299, n=34) | |
| Lenovo Yoga Book 9 13IMU9 | |
| MSI Summit E13 Flip Evo A11MT | |
| Dell Latitude 9330 | |
| WebXPRT 4 / Overall | |
| Lenovo ThinkPad L13 Yoga G4 i7-1355U | |
| Average Intel Core Ultra 7 155H, Intel Arc 8-Core iGPU (166.4 - 309, n=29) | |
| Lenovo Yoga Book 9 13IMU9 | |
| HP Elite Dragonfly Folio 13.5 G3 | |
| Dell Latitude 9330 | |
| MSI Summit E13 AI Evo A1MTG | |
| Mozilla Kraken 1.1 / Total | |
| MSI Summit E13 Flip Evo A11MT | |
| Dell Latitude 9330 | |
| HP Elite Dragonfly Folio 13.5 G3 | |
| Lenovo Yoga Book 9 13IMU9 | |
| MSI Summit E13 AI Evo A1MTG | |
| Average Intel Core Ultra 7 155H, Intel Arc 8-Core iGPU (517 - 614, n=35) | |
| Lenovo ThinkPad L13 Yoga G4 i7-1355U | |
* ... smaller is better
| PCMark 10 Score | 4809 points | |
Help | ||
| AIDA64 / Memory Copy | |
| Average Intel Core Ultra 7 155H (62397 - 96791, n=50) | |
| Lenovo Yoga Book 9 13IMU9 | |
| MSI Summit E13 AI Evo A1MTG | |
| Dell Latitude 9330 | |
| HP Elite Dragonfly Folio 13.5 G3 | |
| Lenovo ThinkPad L13 Yoga G4 i7-1355U | |
| MSI Summit E13 Flip Evo A11MT | |
| AIDA64 / Memory Read | |
| Average Intel Core Ultra 7 155H (60544 - 90647, n=50) | |
| MSI Summit E13 AI Evo A1MTG | |
| HP Elite Dragonfly Folio 13.5 G3 | |
| Lenovo Yoga Book 9 13IMU9 | |
| Dell Latitude 9330 | |
| MSI Summit E13 Flip Evo A11MT | |
| Lenovo ThinkPad L13 Yoga G4 i7-1355U | |
| AIDA64 / Memory Write | |
| HP Elite Dragonfly Folio 13.5 G3 | |
| MSI Summit E13 AI Evo A1MTG | |
| Average Intel Core Ultra 7 155H (58692 - 93451, n=50) | |
| Lenovo ThinkPad L13 Yoga G4 i7-1355U | |
| Dell Latitude 9330 | |
| Lenovo Yoga Book 9 13IMU9 | |
| MSI Summit E13 Flip Evo A11MT | |
| AIDA64 / Memory Latency | |
| Lenovo Yoga Book 9 13IMU9 | |
| Average Intel Core Ultra 7 155H (116.2 - 233, n=50) | |
| MSI Summit E13 AI Evo A1MTG | |
| HP Elite Dragonfly Folio 13.5 G3 | |
| Dell Latitude 9330 | |
| Lenovo ThinkPad L13 Yoga G4 i7-1355U | |
| MSI Summit E13 Flip Evo A11MT | |
* ... smaller is better
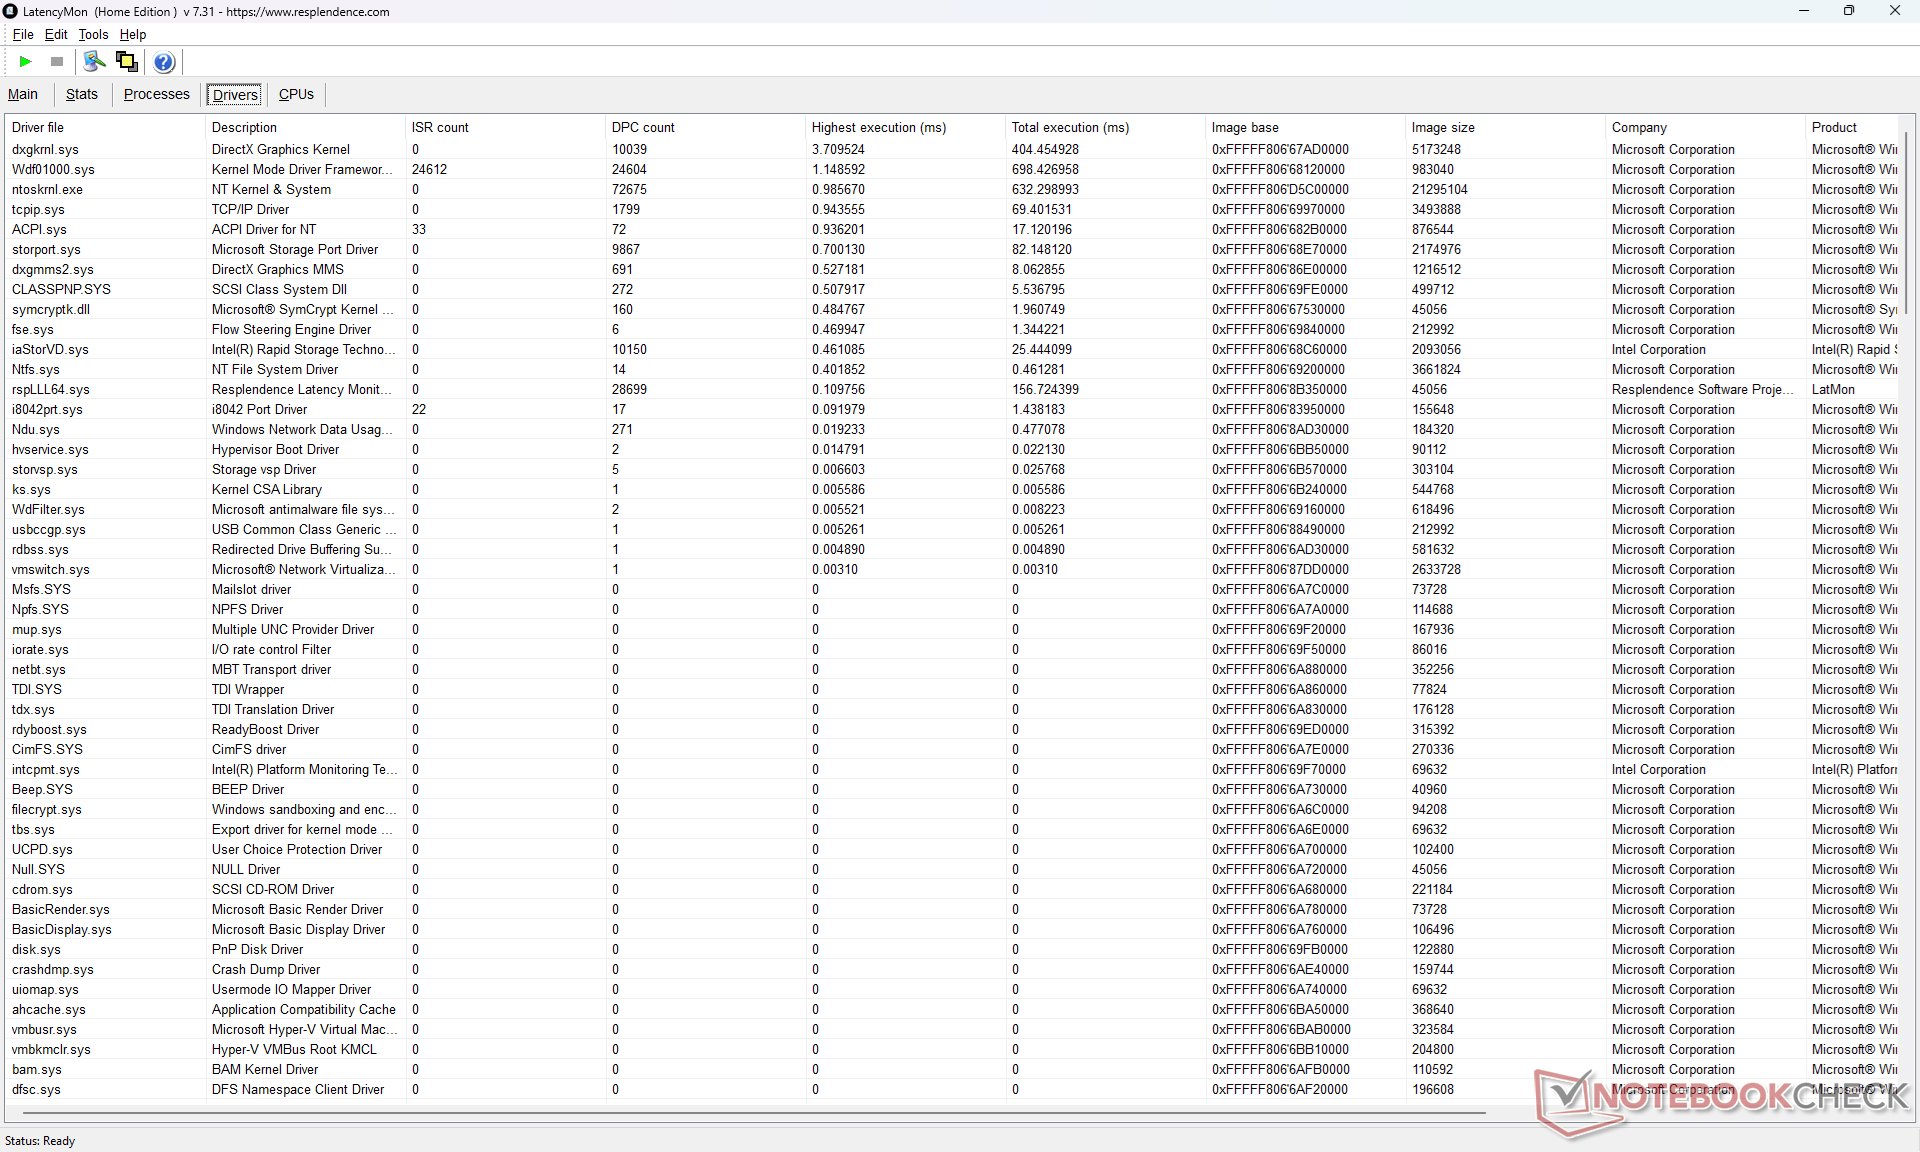
DPC Latency
LatencyMon reveals DPC issues when opening multiple browser tabs of our homepage. 4K60 video playback is imperfect but still smooth with just 3 dropped frames during the start of the test.

| DPC Latencies / LatencyMon - interrupt to process latency (max), Web, Youtube, Prime95 | |
| Dell Latitude 9330 | |
| HP Elite Dragonfly Folio 13.5 G3 | |
| MSI Summit E13 AI Evo A1MTG | |
| MSI Summit E13 Flip Evo A11MT | |
| Lenovo ThinkPad L13 Yoga G4 i7-1355U | |
| Lenovo Yoga Book 9 13IMU9 | |
* ... smaller is better
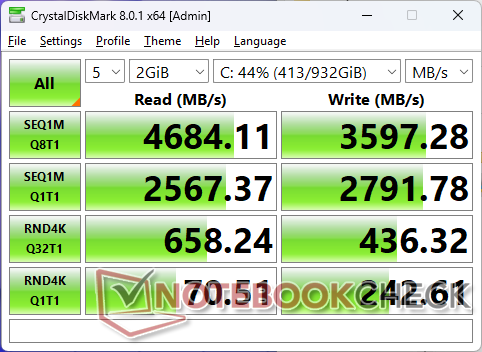
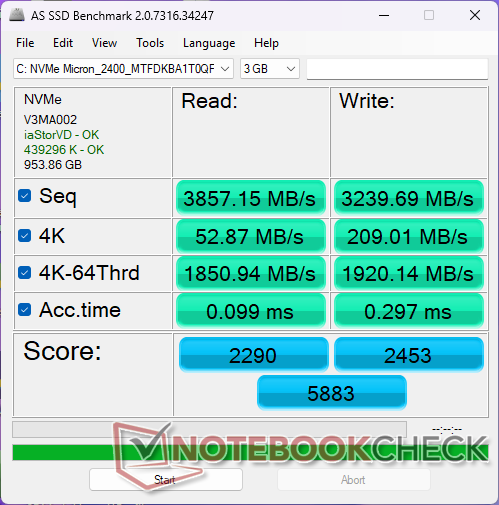
Storage Devices
The Micron 2400 PCIe4 x4 NVMe SSD throttles under stress. When running DiskSpd in a loop, for example, transfer rates would reach ~4300 MB/s before falling to just ~2600 MB/s after about 5 minutes into the test.

* ... smaller is better
Disk Throttling: DiskSpd Read Loop, Queue Depth 8
GPU Performance
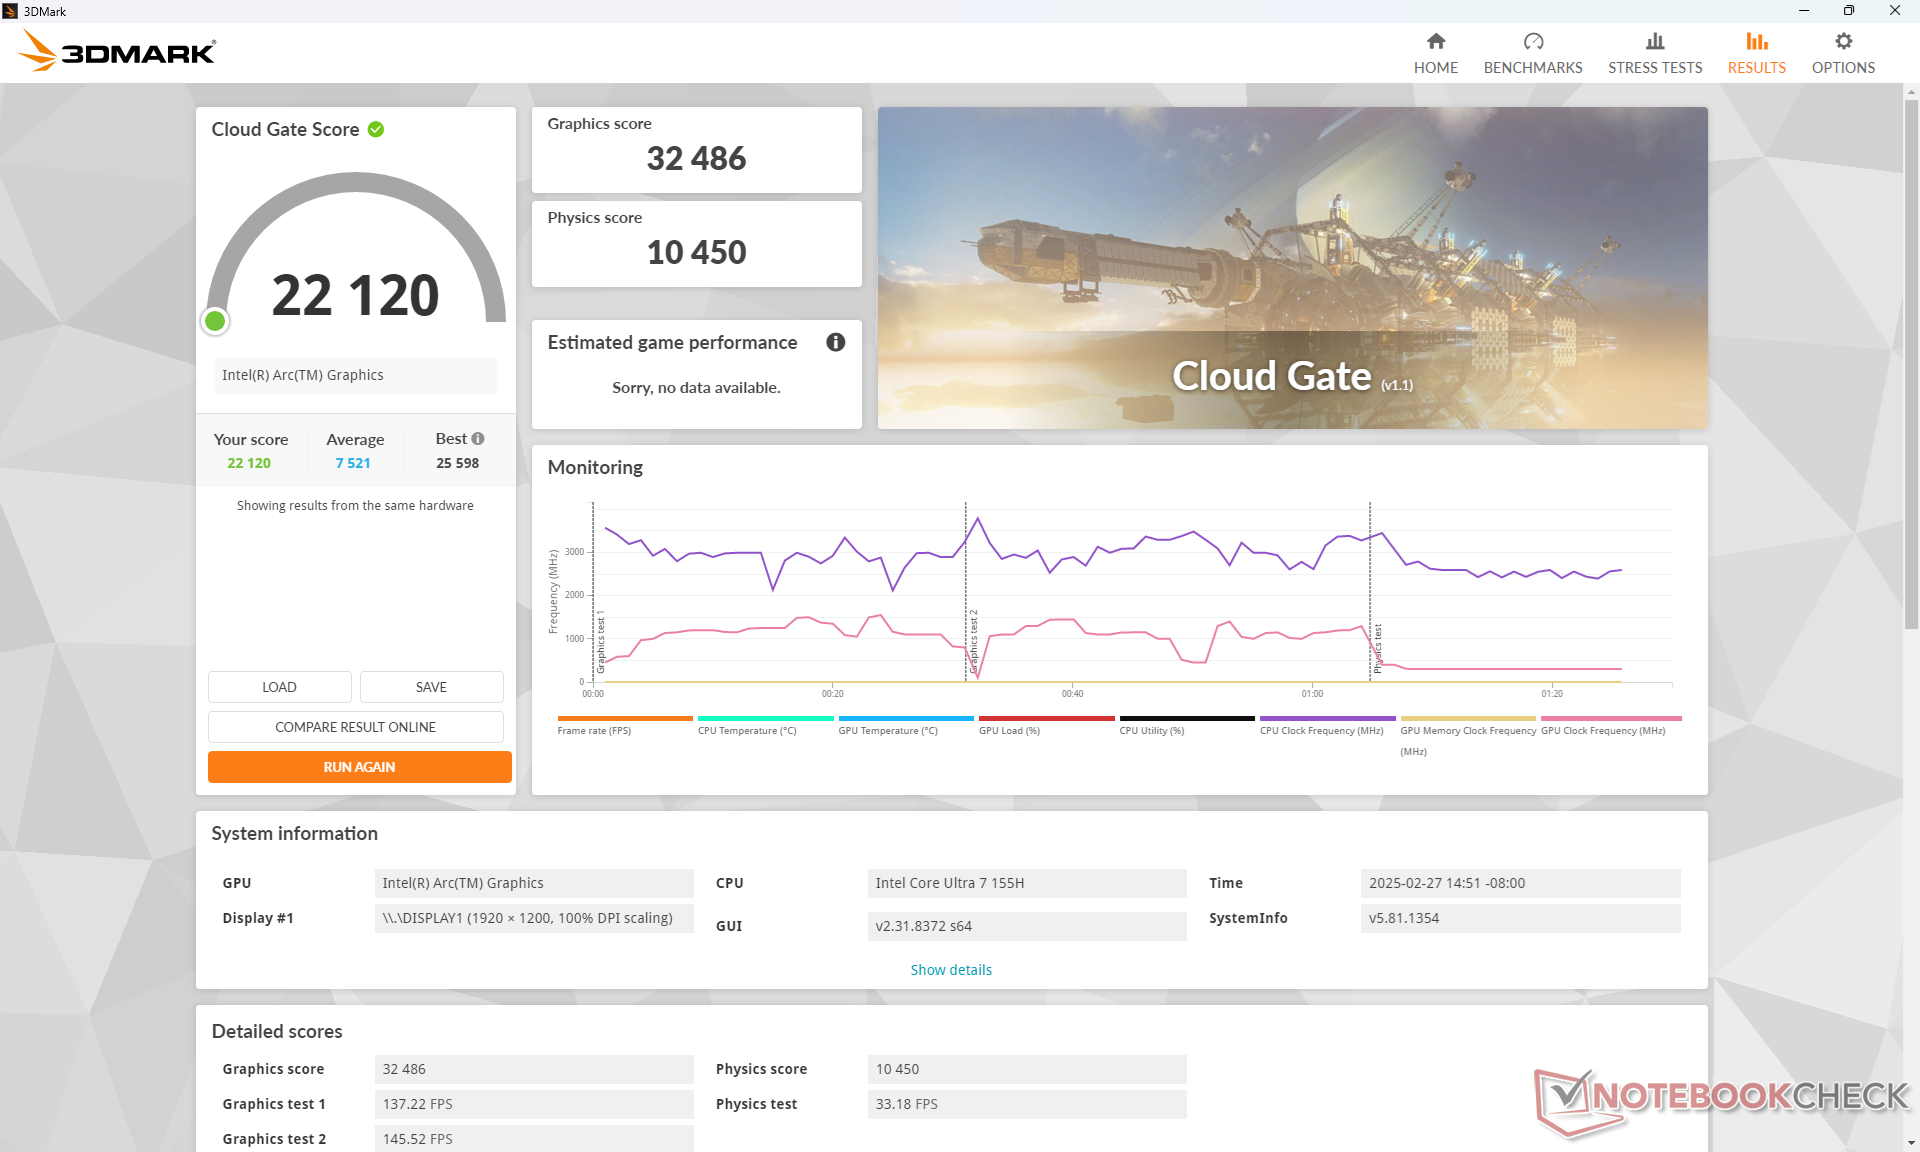
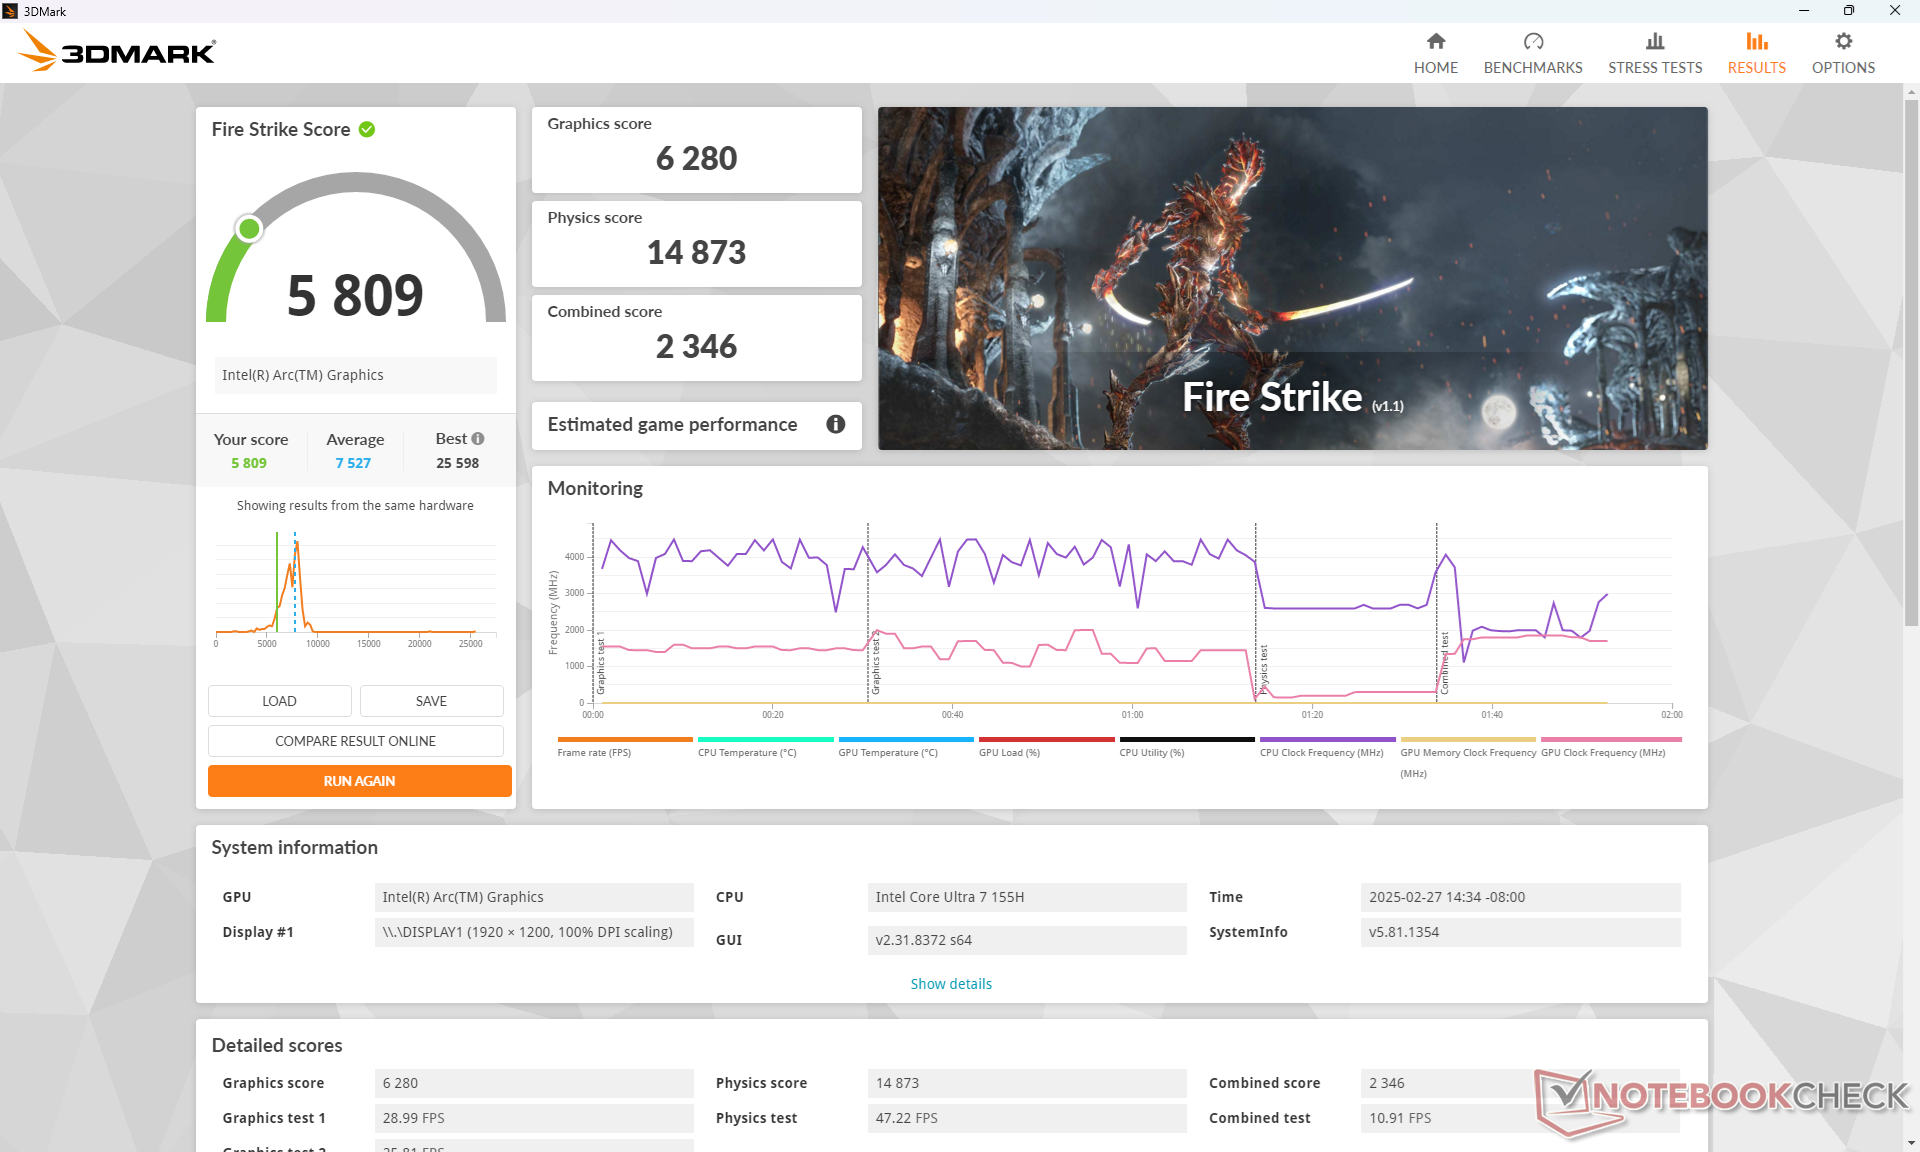
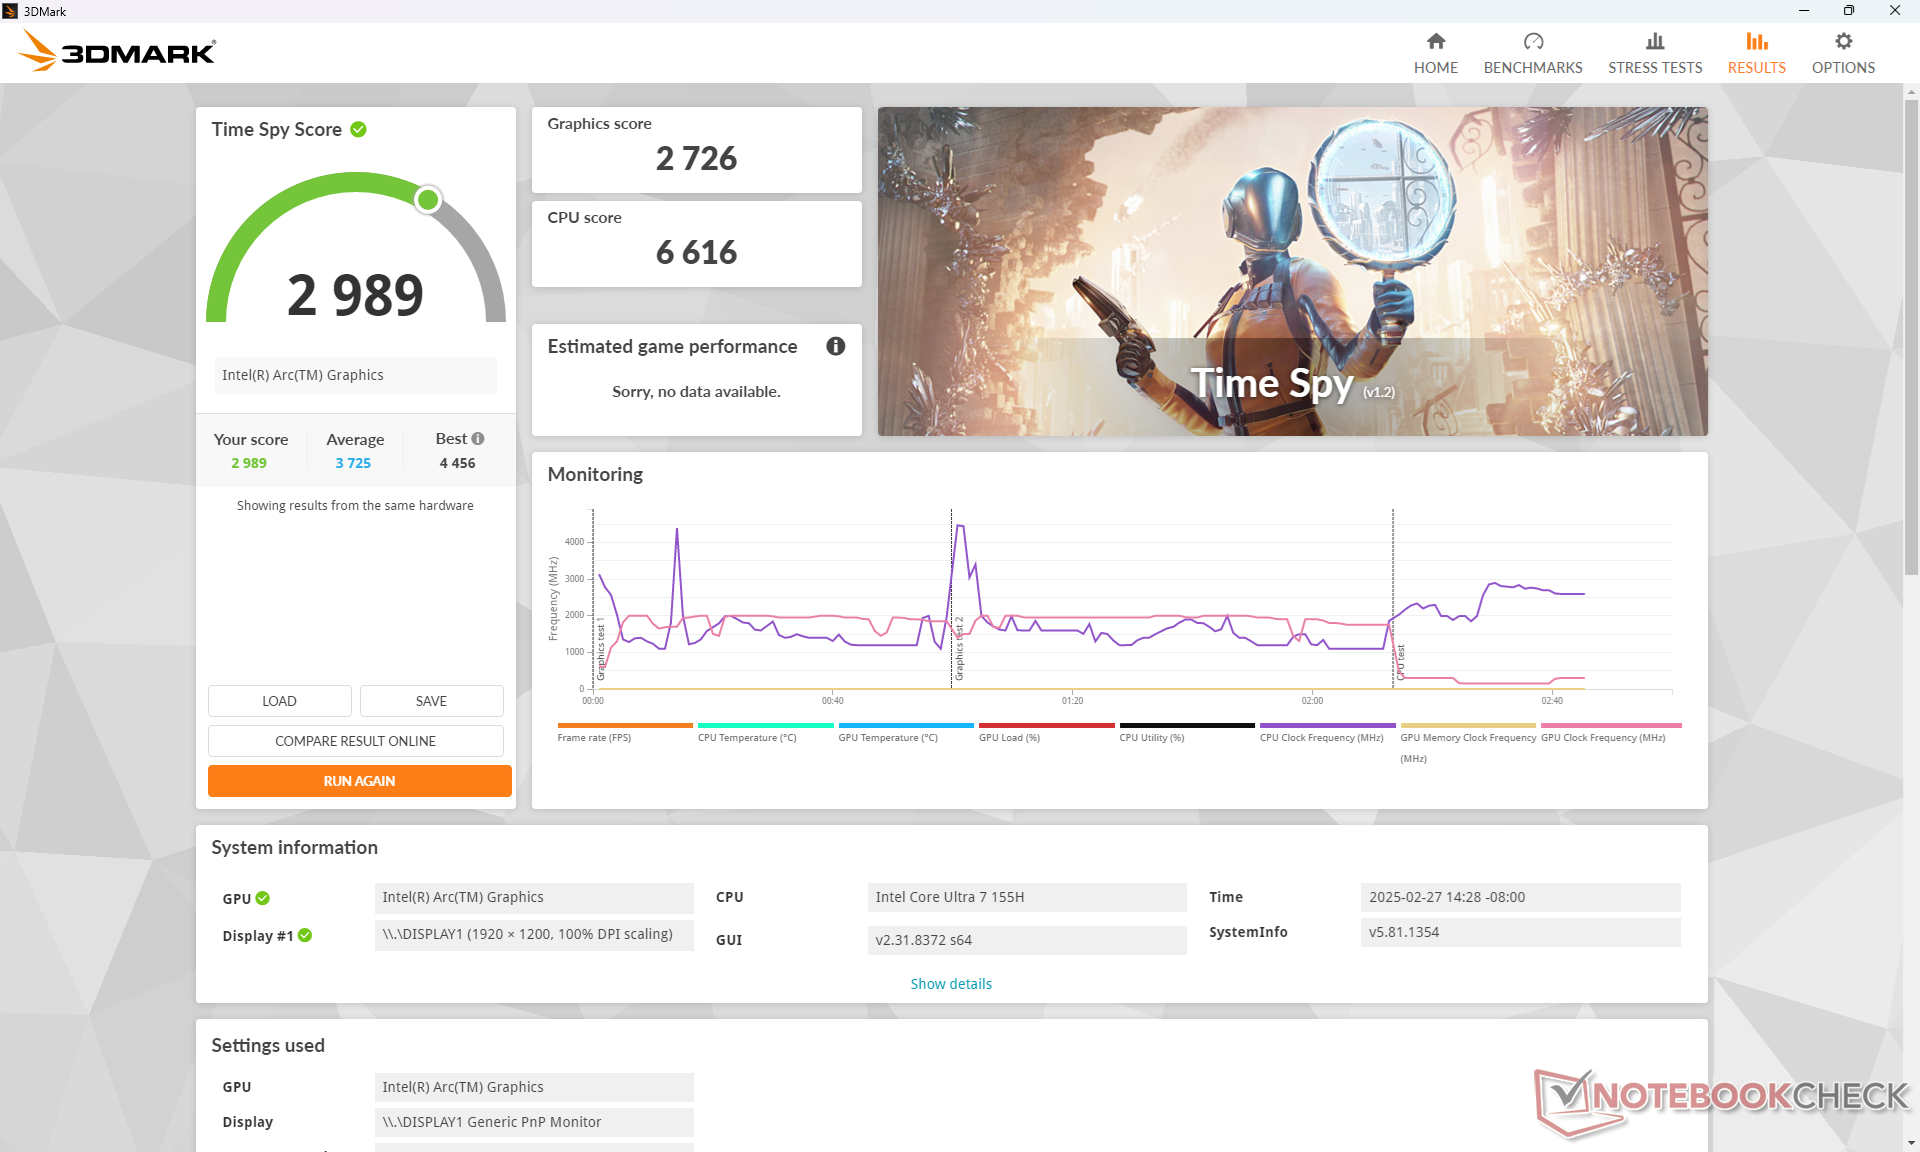
The slower-than-expected CPU performance mentioned above has led to slower-than-expected graphics performance. The Arc 8 in our MSI perform roughly 15 to 25 percent slower than the average laptop in our database with the same integrated graphics according to 3DMark benchmarks.
F1 22 and Cyberpunk 2077 would crash when settings are turned to High or Ultra.
| Power Profile | Graphics Score | Physics Score | Combined Score |
| Performance Mode | 6280 | 14873 | 2346 |
| Balanced Mode | 5786 (-8%) | 9842 (-34%) | 1685 (-28%) |
| Battery Power | 5196 (-17%) | 15031 (-0%) | 2267 (-3%) |
Running on Balanced mode can impact CPU performance quite significantly based on our Fire Strike results table above.
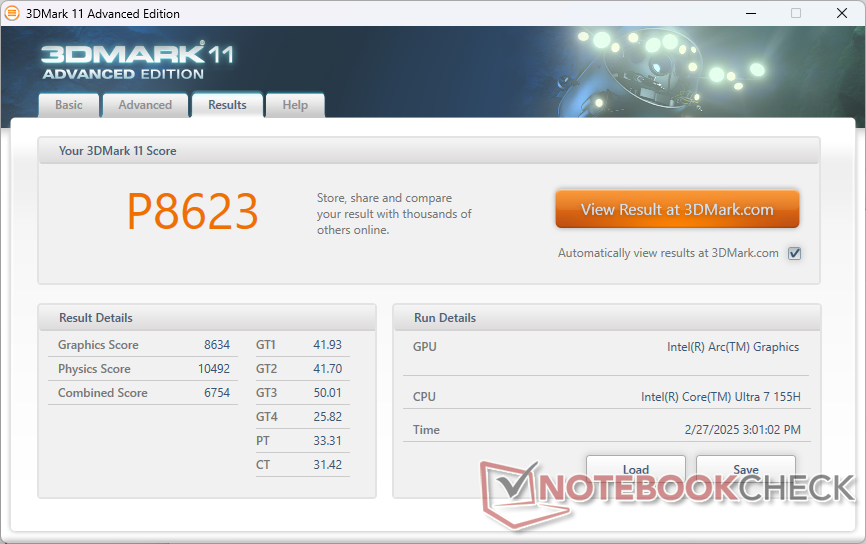
| 3DMark 11 Performance | 8623 points | |
| 3DMark Cloud Gate Standard Score | 22120 points | |
| 3DMark Fire Strike Score | 5809 points | |
| 3DMark Time Spy Score | 2989 points | |
Help | ||
* ... smaller is better
Gaming Performance
Gaming performance is poor. On top of the CPU and GPU deficits mentioned above, the noticeable ghosting and stuttering issues can be distracting even when running undemanding titles like DOTA 2 Reborn.
| Cyberpunk 2077 | |
| 1280x720 Low Preset (FSR off) | |
| MSI Prestige 13 AI Plus Evo A2VMG | |
| Average Intel Arc 8-Core iGPU (34.5 - 58, n=18) | |
| MSI Summit E13 AI Evo A1MTG | |
| Lenovo Yoga Book 9 13IMU9 | |
| 1920x1080 Low Preset (FSR off) | |
| Asus ROG Flow Z13 GZ302EA-RU073W | |
| MSI Prestige 13 AI Plus Evo A2VMG | |
| Average Intel Arc 8-Core iGPU (11.3 - 38, n=36) | |
| MSI Summit E13 AI Evo A1MTG | |
| Lenovo Yoga Book 9 13IMU9 | |
| 1920x1080 Medium Preset (FSR off) | |
| Asus ROG Flow Z13 GZ302EA-RU073W | |
| MSI Prestige 13 AI Plus Evo A2VMG | |
| Average Intel Arc 8-Core iGPU (9.42 - 31.4, n=34) | |
| MSI Summit E13 AI Evo A1MTG | |
| Lenovo Yoga Book 9 13IMU9 | |
| 1920x1080 High Preset (FSR off) | |
| Asus ROG Flow Z13 GZ302EA-RU073W | |
| MSI Prestige 13 AI Plus Evo A2VMG | |
| Average Intel Arc 8-Core iGPU (7.3 - 27.6, n=34) | |
| Lenovo Yoga Book 9 13IMU9 | |
| 1920x1080 Ultra Preset (FSR off) | |
| Asus ROG Flow Z13 GZ302EA-RU073W | |
| MSI Prestige 13 AI Plus Evo A2VMG | |
| Average Intel Arc 8-Core iGPU (13 - 24.7, n=26) | |
| Lenovo Yoga Book 9 13IMU9 | |
Cyberpunk 2077 ultra FPS Chart
| low | med. | high | ultra | |
|---|---|---|---|---|
| GTA V (2015) | 50.6 | 51.1 | 23.9 | 12 |
| Dota 2 Reborn (2015) | 93.2 | 83.5 | 65.2 | 63 |
| Final Fantasy XV Benchmark (2018) | 49.2 | 29.4 | 20.7 | |
| X-Plane 11.11 (2018) | 46.2 | 37.5 | 31.4 | |
| Strange Brigade (2018) | 131.2 | 61.3 | 45.7 | 33.9 |
| Tiny Tina's Wonderlands (2022) | 41.5 | 31.7 | 22 | 17.7 |
| F1 22 (2022) | 57.8 | 53.5 | ||
| Baldur's Gate 3 (2023) | 22.8 | 19.5 | 16.8 | 16.3 |
| Cyberpunk 2077 (2023) | 28.3 | 23.4 |
Emissions
System Noise
Fan noise is quiet when only browsing or streaming, but it pick up rather quickly when higher loads are introduced. Furthermore, the noise is relatively high-pitched and so any RPM changes tend to be noticeable. The fans are louder than on most other 13-inch business laptops when running demanding loads like games due to the more demanding Core Ultra-H CPU.
Noise level
| Idle |
| 24.1 / 24.8 / 26.5 dB(A) |
| Load |
| 39.3 / 49.1 dB(A) |
 | ||
30 dB silent 40 dB(A) audible 50 dB(A) loud |
||
min: | ||
| MSI Summit E13 AI Evo A1MTG Arc 8-Core, Ultra 7 155H, Micron 2400 MTFDKBA1T0QFM | MSI Summit E13 Flip Evo A11MT Iris Xe G7 96EUs, i7-1185G7, Phison 1TB SM2801T24GKBB4S-E162 | Lenovo Yoga Book 9 13IMU9 Graphics 4-Core iGPU (Arrow Lake), Ultra 7 155U | Lenovo ThinkPad L13 Yoga G4 i7-1355U Iris Xe G7 96EUs, i7-1355U, Samsung PM9B1 512GB MZAL4512HBLU | HP Elite Dragonfly Folio 13.5 G3 Iris Xe G7 96EUs, i7-1265U, Samsung PM9A1 MZVL2512HCJQ | Dell Latitude 9330 Iris Xe G7 96EUs, i7-1260U | |
|---|---|---|---|---|---|---|
| Noise | 0% | 16% | 11% | 11% | 9% | |
| off / environment * (dB) | 24 | 24.5 -2% | 23.3 3% | 23.1 4% | 24.6 -3% | 23 4% |
| Idle Minimum * (dB) | 24.1 | 24.7 -2% | 23.3 3% | 23.4 3% | 24.6 -2% | 23 5% |
| Idle Average * (dB) | 24.8 | 24.7 -0% | 23.3 6% | 23.4 6% | 24.6 1% | 23.1 7% |
| Idle Maximum * (dB) | 26.5 | 26.4 -0% | 24.6 7% | 23.4 12% | 24.6 7% | 23.1 13% |
| Load Average * (dB) | 39.3 | 37.8 4% | 26.2 33% | 33.9 14% | 27.8 29% | 37.1 6% |
| Cyberpunk 2077 ultra * (dB) | 45 | |||||
| Load Maximum * (dB) | 49.1 | 48.8 1% | 27.3 44% | 36.9 25% | 33.4 32% | 40.5 18% |
| Witcher 3 ultra * (dB) | 41.4 | 27.3 | 36.9 | 33.4 | 40.6 |
* ... smaller is better
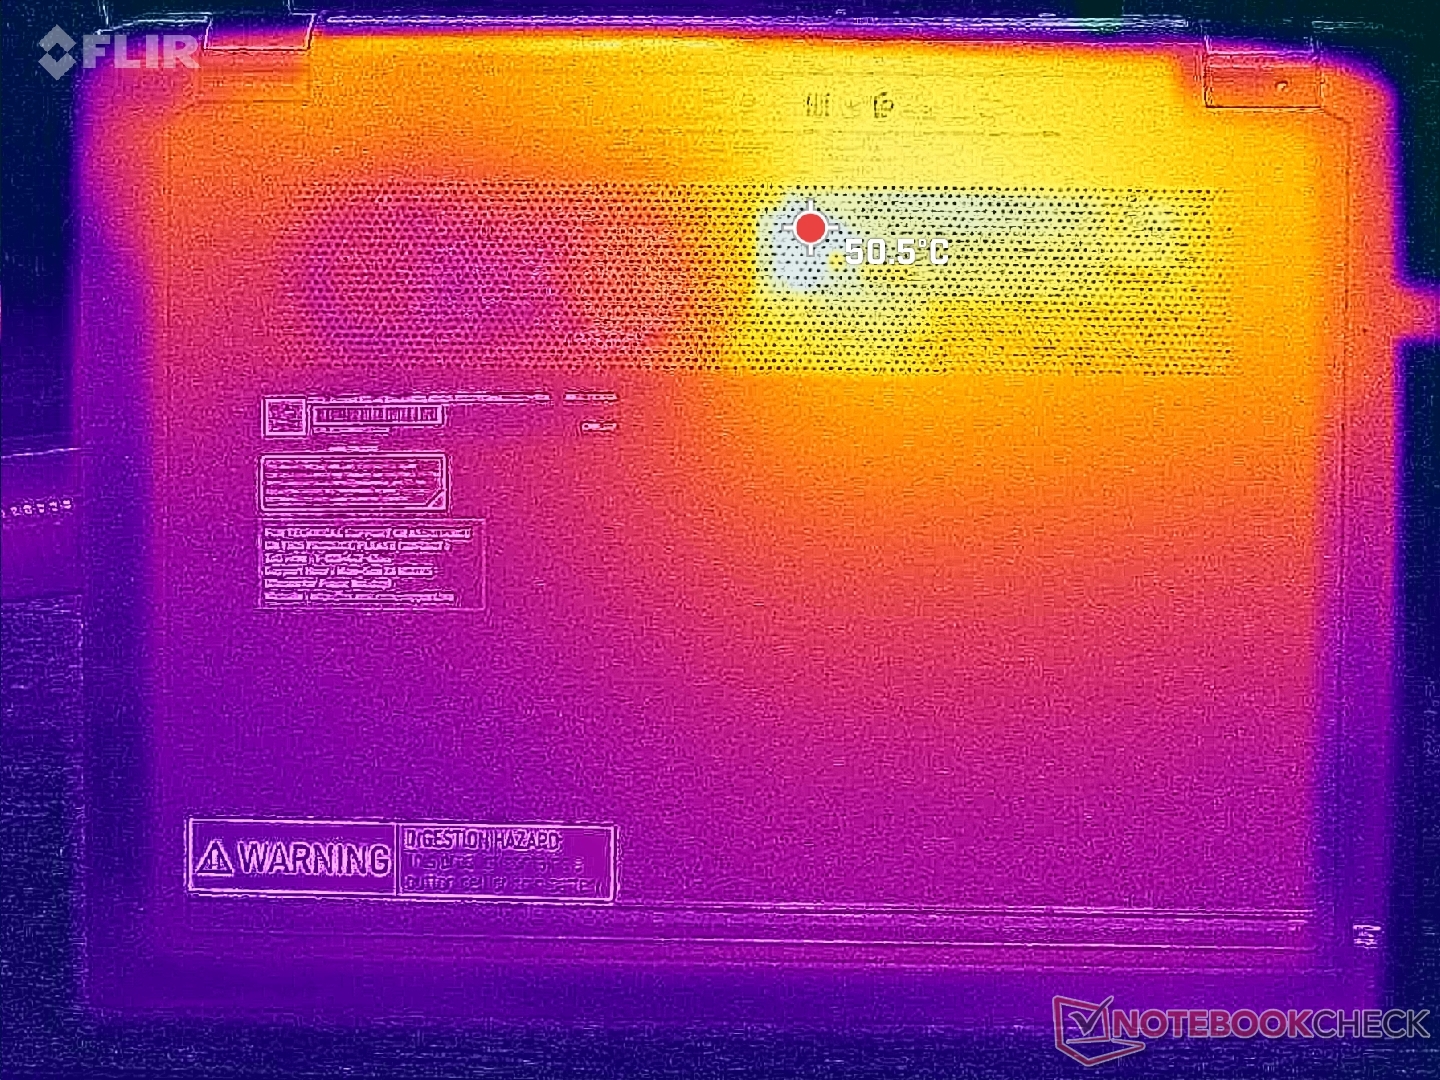
Temperature
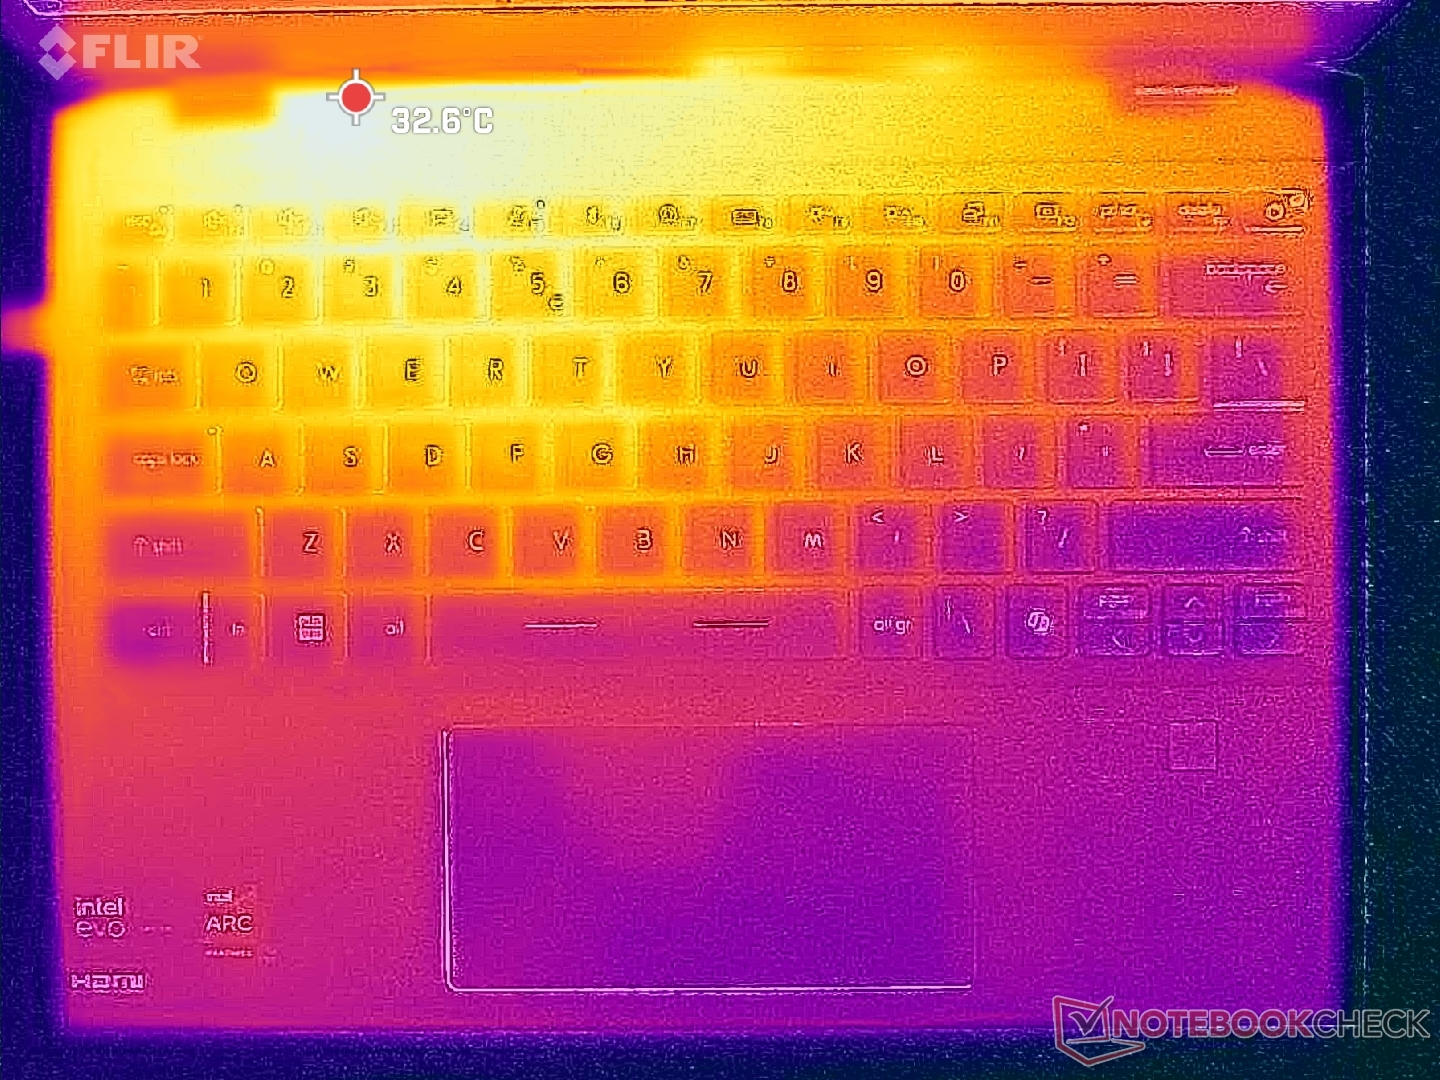
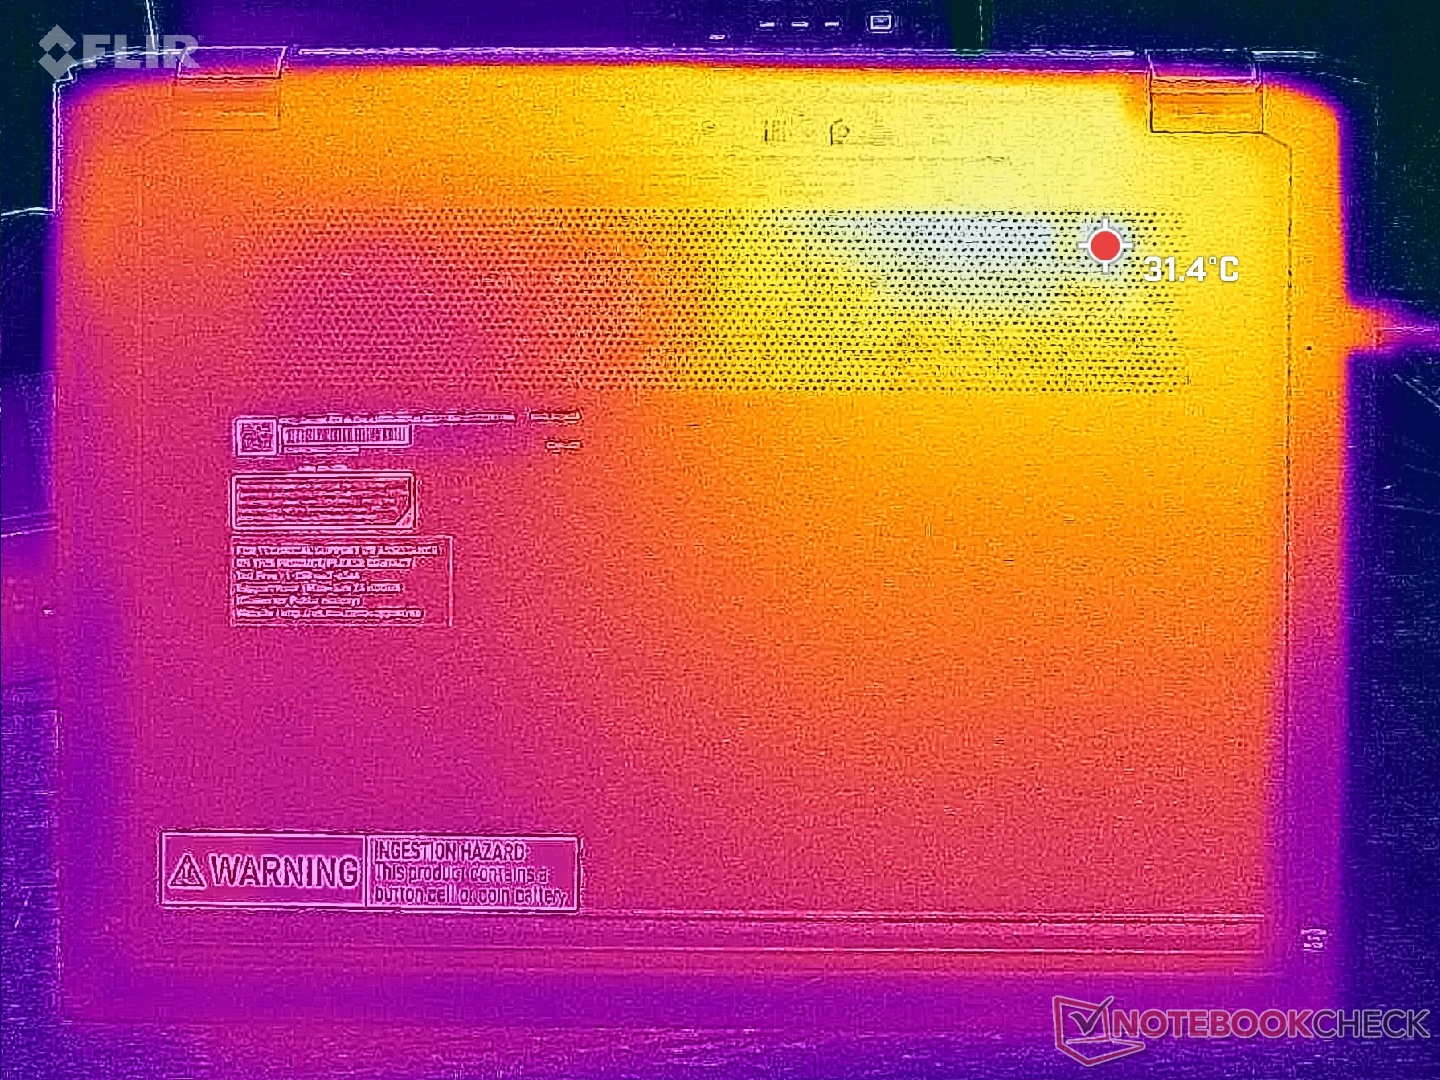
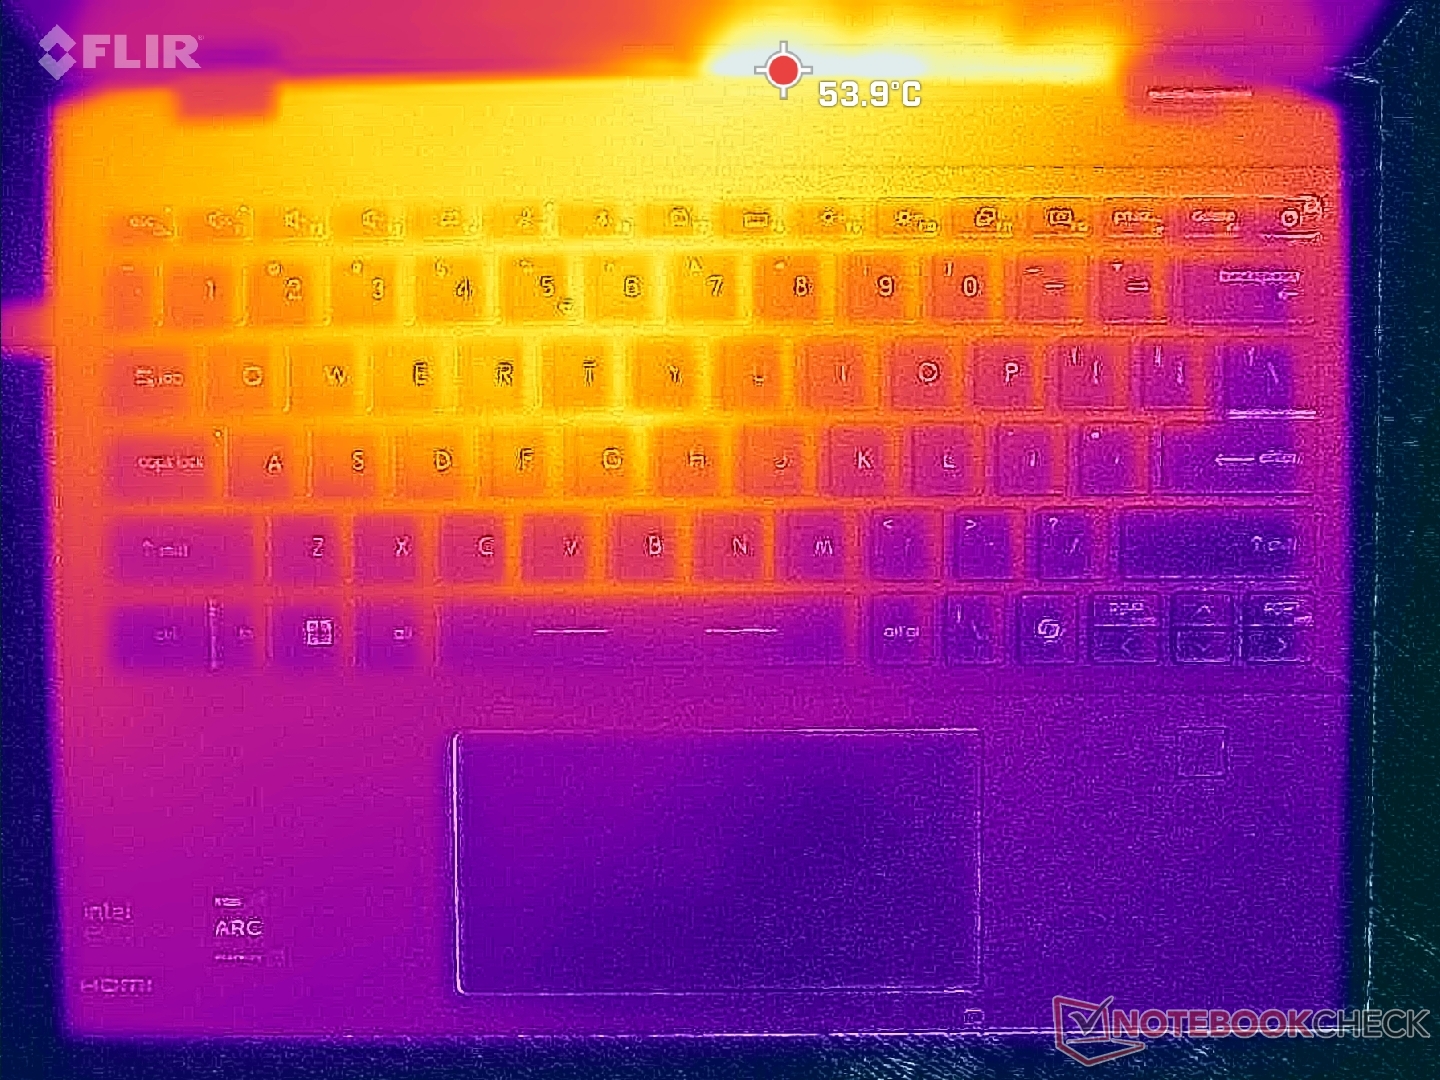
Surface temperatures are very warm even when simply idling on desktop. Hot spots would range from 36 C when idling up to over 45 C when running demanding loads which is warmer than most other 13-inch convertibles.
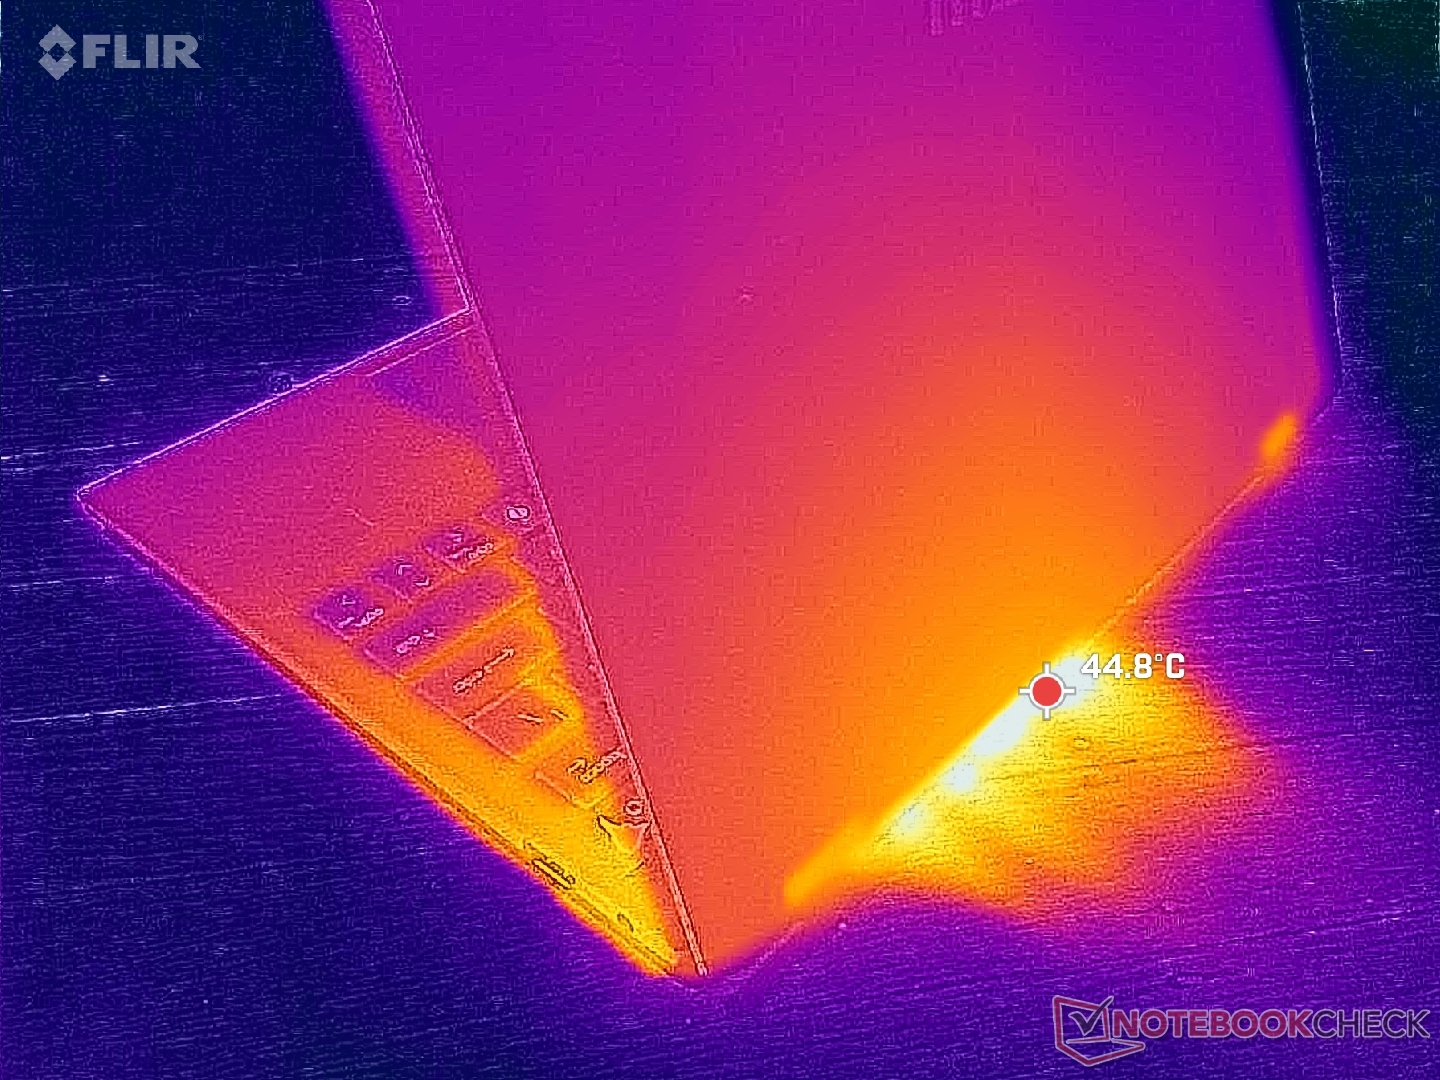

(-) The maximum temperature on the upper side is 45.2 °C / 113 F, compared to the average of 35.4 °C / 96 F, ranging from 19.6 to 60 °C for the class Convertible.
(±) The bottom heats up to a maximum of 44.8 °C / 113 F, compared to the average of 36.8 °C / 98 F
(+) In idle usage, the average temperature for the upper side is 30.1 °C / 86 F, compared to the device average of 30.3 °C / 87 F.
(+) The palmrests and touchpad are cooler than skin temperature with a maximum of 28.8 °C / 83.8 F and are therefore cool to the touch.
(±) The average temperature of the palmrest area of similar devices was 27.9 °C / 82.2 F (-0.9 °C / -1.6 F).
| MSI Summit E13 AI Evo A1MTG Intel Core Ultra 7 155H, Intel Arc 8-Core iGPU | MSI Summit E13 Flip Evo A11MT Intel Core i7-1185G7, Intel Iris Xe Graphics G7 96EUs | Lenovo Yoga Book 9 13IMU9 Intel Core Ultra 7 155U, Intel Graphics 4-Core iGPU (Arrow Lake) | Lenovo ThinkPad L13 Yoga G4 i7-1355U Intel Core i7-1355U, Intel Iris Xe Graphics G7 96EUs | HP Elite Dragonfly Folio 13.5 G3 Intel Core i7-1265U, Intel Iris Xe Graphics G7 96EUs | Dell Latitude 9330 Intel Core i7-1260U, Intel Iris Xe Graphics G7 96EUs | |
|---|---|---|---|---|---|---|
| Heat | -7% | 10% | 6% | 28% | 12% | |
| Maximum Upper Side * (°C) | 45.2 | 52 -15% | 39.2 13% | 38.4 15% | 32.8 27% | 40.6 10% |
| Maximum Bottom * (°C) | 44.8 | 57.4 -28% | 41 8% | 46 -3% | 33.4 25% | 50.2 -12% |
| Idle Upper Side * (°C) | 34.8 | 30.4 13% | 32.2 7% | 31.2 10% | 24.6 29% | 25 28% |
| Idle Bottom * (°C) | 35.8 | 34.2 4% | 31.6 12% | 34.8 3% | 24.6 31% | 27.6 23% |
* ... smaller is better
Speakers
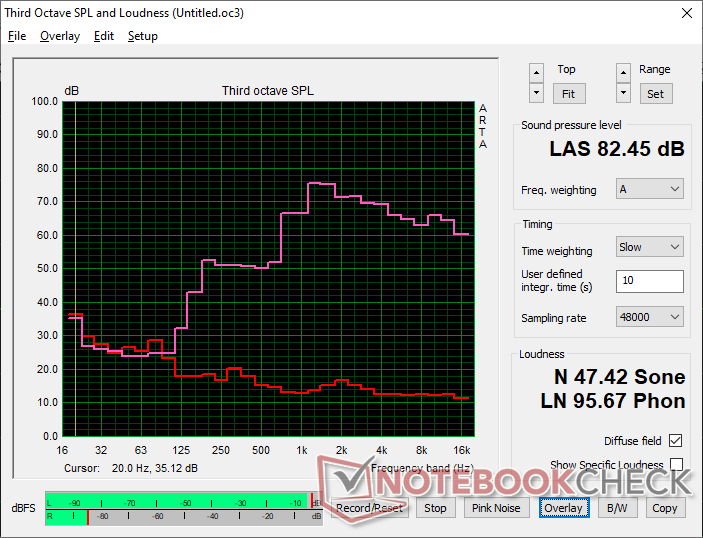
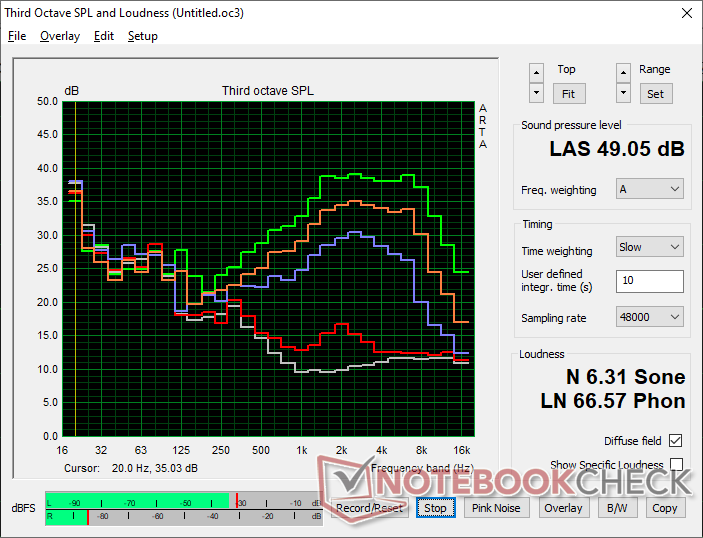
MSI Summit E13 AI Evo A1MTG audio analysis
(+) | speakers can play relatively loud (82.5 dB)
Bass 100 - 315 Hz
(-) | nearly no bass - on average 21.9% lower than median
(±) | linearity of bass is average (9.9% delta to prev. frequency)
Mids 400 - 2000 Hz
(±) | reduced mids - on average 9.2% lower than median
(±) | linearity of mids is average (7.6% delta to prev. frequency)
Highs 2 - 16 kHz
(+) | balanced highs - only 3.2% away from median
(+) | highs are linear (3.3% delta to prev. frequency)
Overall 100 - 16.000 Hz
(±) | linearity of overall sound is average (21.4% difference to median)
Compared to same class
» 56% of all tested devices in this class were better, 12% similar, 32% worse
» The best had a delta of 6%, average was 20%, worst was 57%
Compared to all devices tested
» 59% of all tested devices were better, 7% similar, 34% worse
» The best had a delta of 4%, average was 24%, worst was 134%
Apple MacBook Pro 16 2021 M1 Pro audio analysis
(+) | speakers can play relatively loud (84.7 dB)
Bass 100 - 315 Hz
(+) | good bass - only 3.8% away from median
(+) | bass is linear (5.2% delta to prev. frequency)
Mids 400 - 2000 Hz
(+) | balanced mids - only 1.3% away from median
(+) | mids are linear (2.1% delta to prev. frequency)
Highs 2 - 16 kHz
(+) | balanced highs - only 1.9% away from median
(+) | highs are linear (2.7% delta to prev. frequency)
Overall 100 - 16.000 Hz
(+) | overall sound is linear (4.6% difference to median)
Compared to same class
» 0% of all tested devices in this class were better, 0% similar, 100% worse
» The best had a delta of 5%, average was 17%, worst was 45%
Compared to all devices tested
» 0% of all tested devices were better, 0% similar, 100% worse
» The best had a delta of 4%, average was 24%, worst was 134%
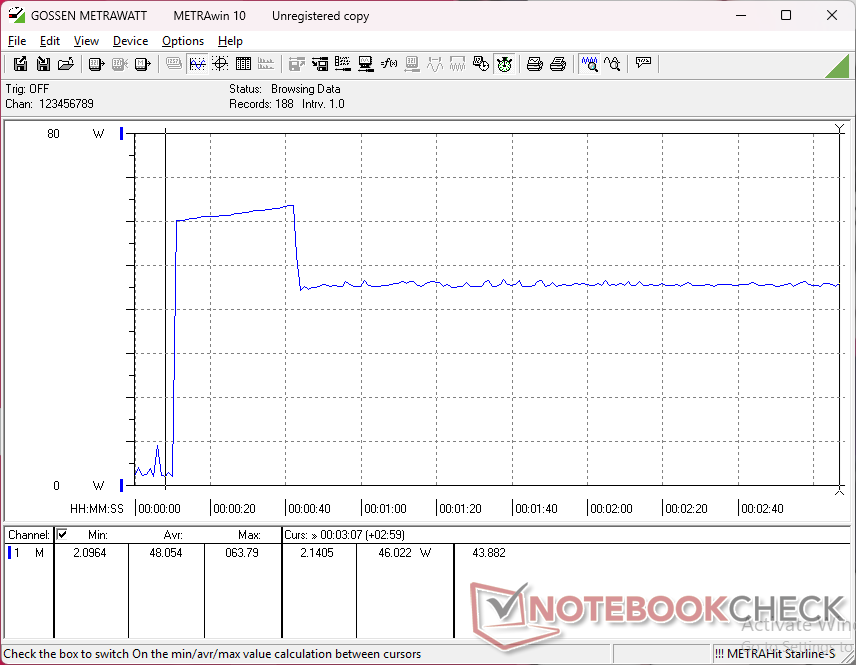
Energy Management
Power Consumption
Power consumption can be unsteady when running demanding GPU loads like Cyberpunk 2077 which aligns with the frame rate stutters noted above. This is in contrast to the Framework 13.5 which ships with the exact same Core Ultra 7 155H CPU but with much steadier consumption under load.


| Off / Standby | |
| Idle | |
| Load |
|
Key:
min: | |
| MSI Summit E13 AI Evo A1MTG Ultra 7 155H, Arc 8-Core, Micron 2400 MTFDKBA1T0QFM, IPS, 1920x1200, 13.3" | MSI Summit E13 Flip Evo A11MT i7-1185G7, Iris Xe G7 96EUs, Phison 1TB SM2801T24GKBB4S-E162, IPS, 1920x1200, 13.4" | Lenovo Yoga Book 9 13IMU9 Ultra 7 155U, Graphics 4-Core iGPU (Arrow Lake), , OLED, 2880x1800, 13.3" | Lenovo ThinkPad L13 Yoga G4 i7-1355U i7-1355U, Iris Xe G7 96EUs, Samsung PM9B1 512GB MZAL4512HBLU, IPS, 1920x1200, 13.3" | HP Elite Dragonfly Folio 13.5 G3 i7-1265U, Iris Xe G7 96EUs, Samsung PM9A1 MZVL2512HCJQ, IPS, 1920x1280, 13.5" | Dell Latitude 9330 i7-1260U, Iris Xe G7 96EUs, , IPS, 2560x1600, 13.3" | |
|---|---|---|---|---|---|---|
| Power Consumption | -52% | -116% | -59% | -26% | -40% | |
| Idle Minimum * (Watt) | 2.3 | 4.8 -109% | 7.1 -209% | 5.5 -139% | 3.4 -48% | 4.7 -104% |
| Idle Average * (Watt) | 4.8 | 8.4 -75% | 9.1 -90% | 8.3 -73% | 4.9 -2% | 8.2 -71% |
| Idle Maximum * (Watt) | 5 | 8.6 -72% | 18.4 -268% | 9.1 -82% | 9.3 -86% | 8.4 -68% |
| Load Average * (Watt) | 46.2 | 47.1 -2% | 51.3 -11% | 49.9 -8% | 41.9 9% | 36.8 20% |
| Cyberpunk 2077 ultra external monitor * (Watt) | 41.9 | |||||
| Cyberpunk 2077 ultra * (Watt) | 44.8 | |||||
| Load Maximum * (Watt) | 65 | 65.9 -1% | 65.5 -1% | 60 8% | 67.5 -4% | 49.9 23% |
| Witcher 3 ultra * (Watt) | 51.6 | 41.5 | 42.4 | 36.4 | 30.4 |
* ... smaller is better
Power Consumption Cyberpunk / Stress Test
Power Consumption external Monitor
Battery Life
WLAN runtime is shorter than on the older Summit E13 by a couple of hours but still good overall at almost 9.5 hours of real-world use.
| MSI Summit E13 AI Evo A1MTG Ultra 7 155H, Arc 8-Core, 70 Wh | MSI Summit E13 Flip Evo A11MT i7-1185G7, Iris Xe G7 96EUs, 70 Wh | Lenovo Yoga Book 9 13IMU9 Ultra 7 155U, Graphics 4-Core iGPU (Arrow Lake), 80 Wh | Lenovo ThinkPad L13 Yoga G4 i7-1355U i7-1355U, Iris Xe G7 96EUs, 46 Wh | HP Elite Dragonfly Folio 13.5 G3 i7-1265U, Iris Xe G7 96EUs, 53 Wh | Dell Latitude 9330 i7-1260U, Iris Xe G7 96EUs, 50 Wh | |
|---|---|---|---|---|---|---|
| Battery runtime | 18% | 6% | -35% | -1% | -1% | |
| WiFi v1.3 (h) | 9.5 | 11.2 18% | 10.1 6% | 6.2 -35% | 9.4 -1% | 9.4 -1% |
| Reader / Idle (h) | 21.1 | 27.3 | 15.4 | |||
| Load (h) | 1.8 | 2.6 | 2.3 |
Notebookcheck Rating
MSI Summit E13 AI Evo A1MTG
- 03/04/2025 v8
Allen Ngo
 Total Sustainability Score:
 Transparency
The selection of devices to be reviewed is made by our editorial team. The test sample was freely purchased by the author at his/her own expense. The lender had no influence on this review, nor did the manufacturer receive a copy of this review before publication. There was no obligation to publish this review. As an independent media company, Notebookcheck is not subjected to the authority of manufacturers, retailers or publishers.
This is how Notebookcheck is testing
Every year, Notebookcheck independently reviews hundreds of laptops and smartphones using standardized procedures to ensure that all results are comparable. We have continuously developed our test methods for around 20 years and set industry standards in the process. In our test labs, high-quality measuring equipment is utilized by experienced technicians and editors. These tests involve a multi-stage validation process. Our complex rating system is based on hundreds of well-founded measurements and benchmarks, which maintains objectivity. Further information on our test methods can be found here.
