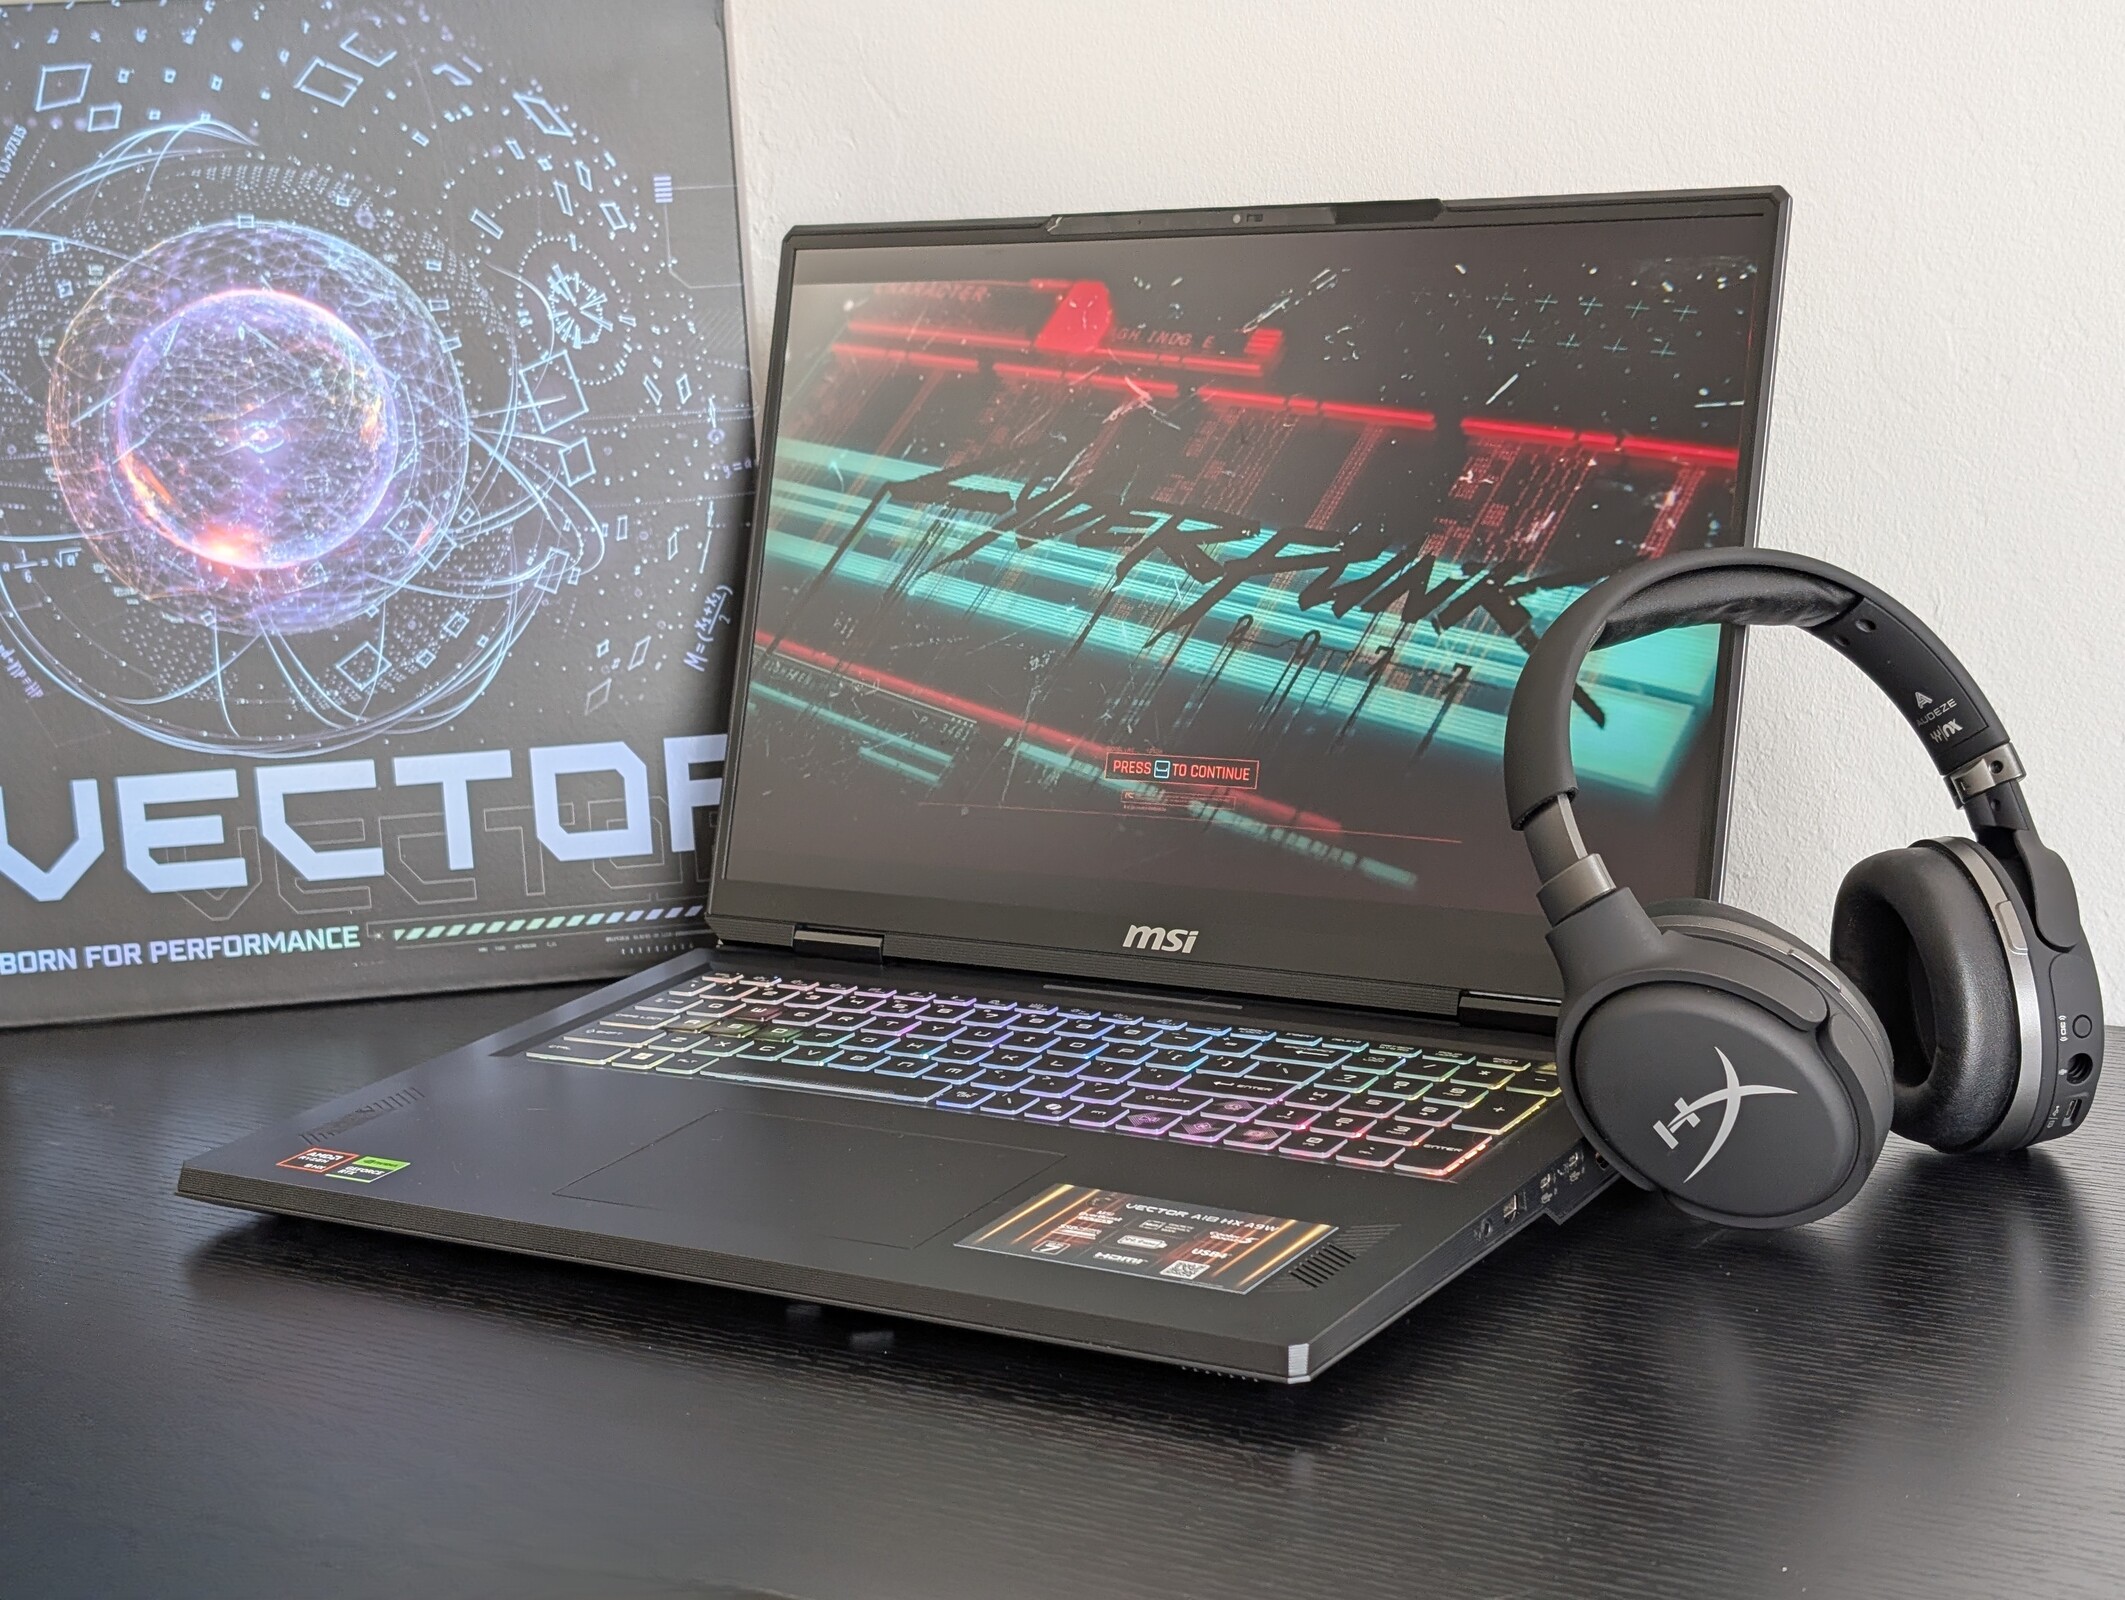
MSI Vector A18 HX A9W laptop review: GeForce RTX 5070 Ti is the way to go
Verdict — One Of MSI's Most Balanced Gaming Laptops
The Raider 18 HX is an enthusiast-level gaming machine with few compromises when it comes to performance, construction, and features. Predictably, it's also one of MSI's most expensive models. For users who want to save a little dough, the Vector A18 HX is essentially a tuned down Raider 18 HX with some auxiliary features and ultra high-end options removed like G-Sync and the RGB LED bar. The chassis is otherwise nearly identical even in terms of dimensions and materials meaning that the core user experience is still there but for hundreds (or even thousands) of dollars less.
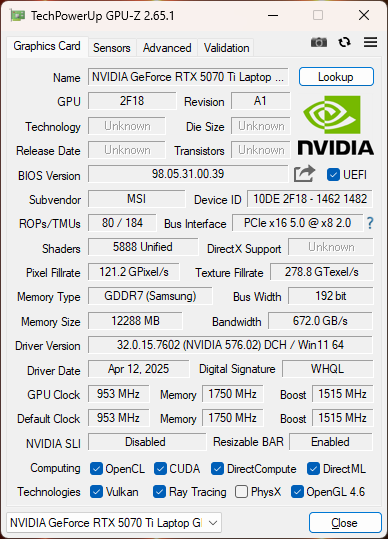
Meanwhile, the 140 W mobile RTX 5070 Ti performs closely to the 175 W mobile RTX 4080 for improved efficiency without sacrificing much performance.
We experienced issues with the Nvidia drivers and a sticky clickpad on our particular test unit and so we recommend checking for any quality abnormalities immediately upon purchasing. We're also wary of recommending any configurations with lesser 1200p panels as they may lack full sRGB coverage or be of poorer quality than the 1600p or higher options. Gamers who want something more portable may find the Vector A18 to be thicker or larger than most alternatives as well including the Acer Predator Helios 18 or Asus Strix Scar 18. Otherwise, this is one of MSI's better gaming laptops when it comes to balancing construction, performance, and price.
Pros
Cons
Price and Availability
Amazon is currently shipping the MSI Vector A18 HX configuration as reviewed. However, it is sold out as of this writing.
The MSI Vector series sits in between the budget Sword/Katana series and the higher-end Raider series of gaming laptops to be a good middle-ground option for gamers. It is nevertheless a potent gaming machine with some of the fastest processors and graphics cards available that can rival the best from competitors.
Our test unit is a middle configuration with the 1600p240 Hz IPS display, Ryzen Ryzen 9 9955HX CPU, and 140 W GeForce RTX 5070 Ti GPU for approximately $3200 retail. The top configuration comes with a 2400p120 mini-LED display and 175 W GeForce RTX 5080 GPU for over $4000. Users who want the even faster RTX 5090 will have to look one step up at the Raider 18 HX series.
Alternatives to the Vector A18 HX include other 18-inch gaming laptops like the Acer Predator Helios 18, Asus Strix Scar 18 G835LX, or Alienware m18.
More MSI reviews:
Specifications
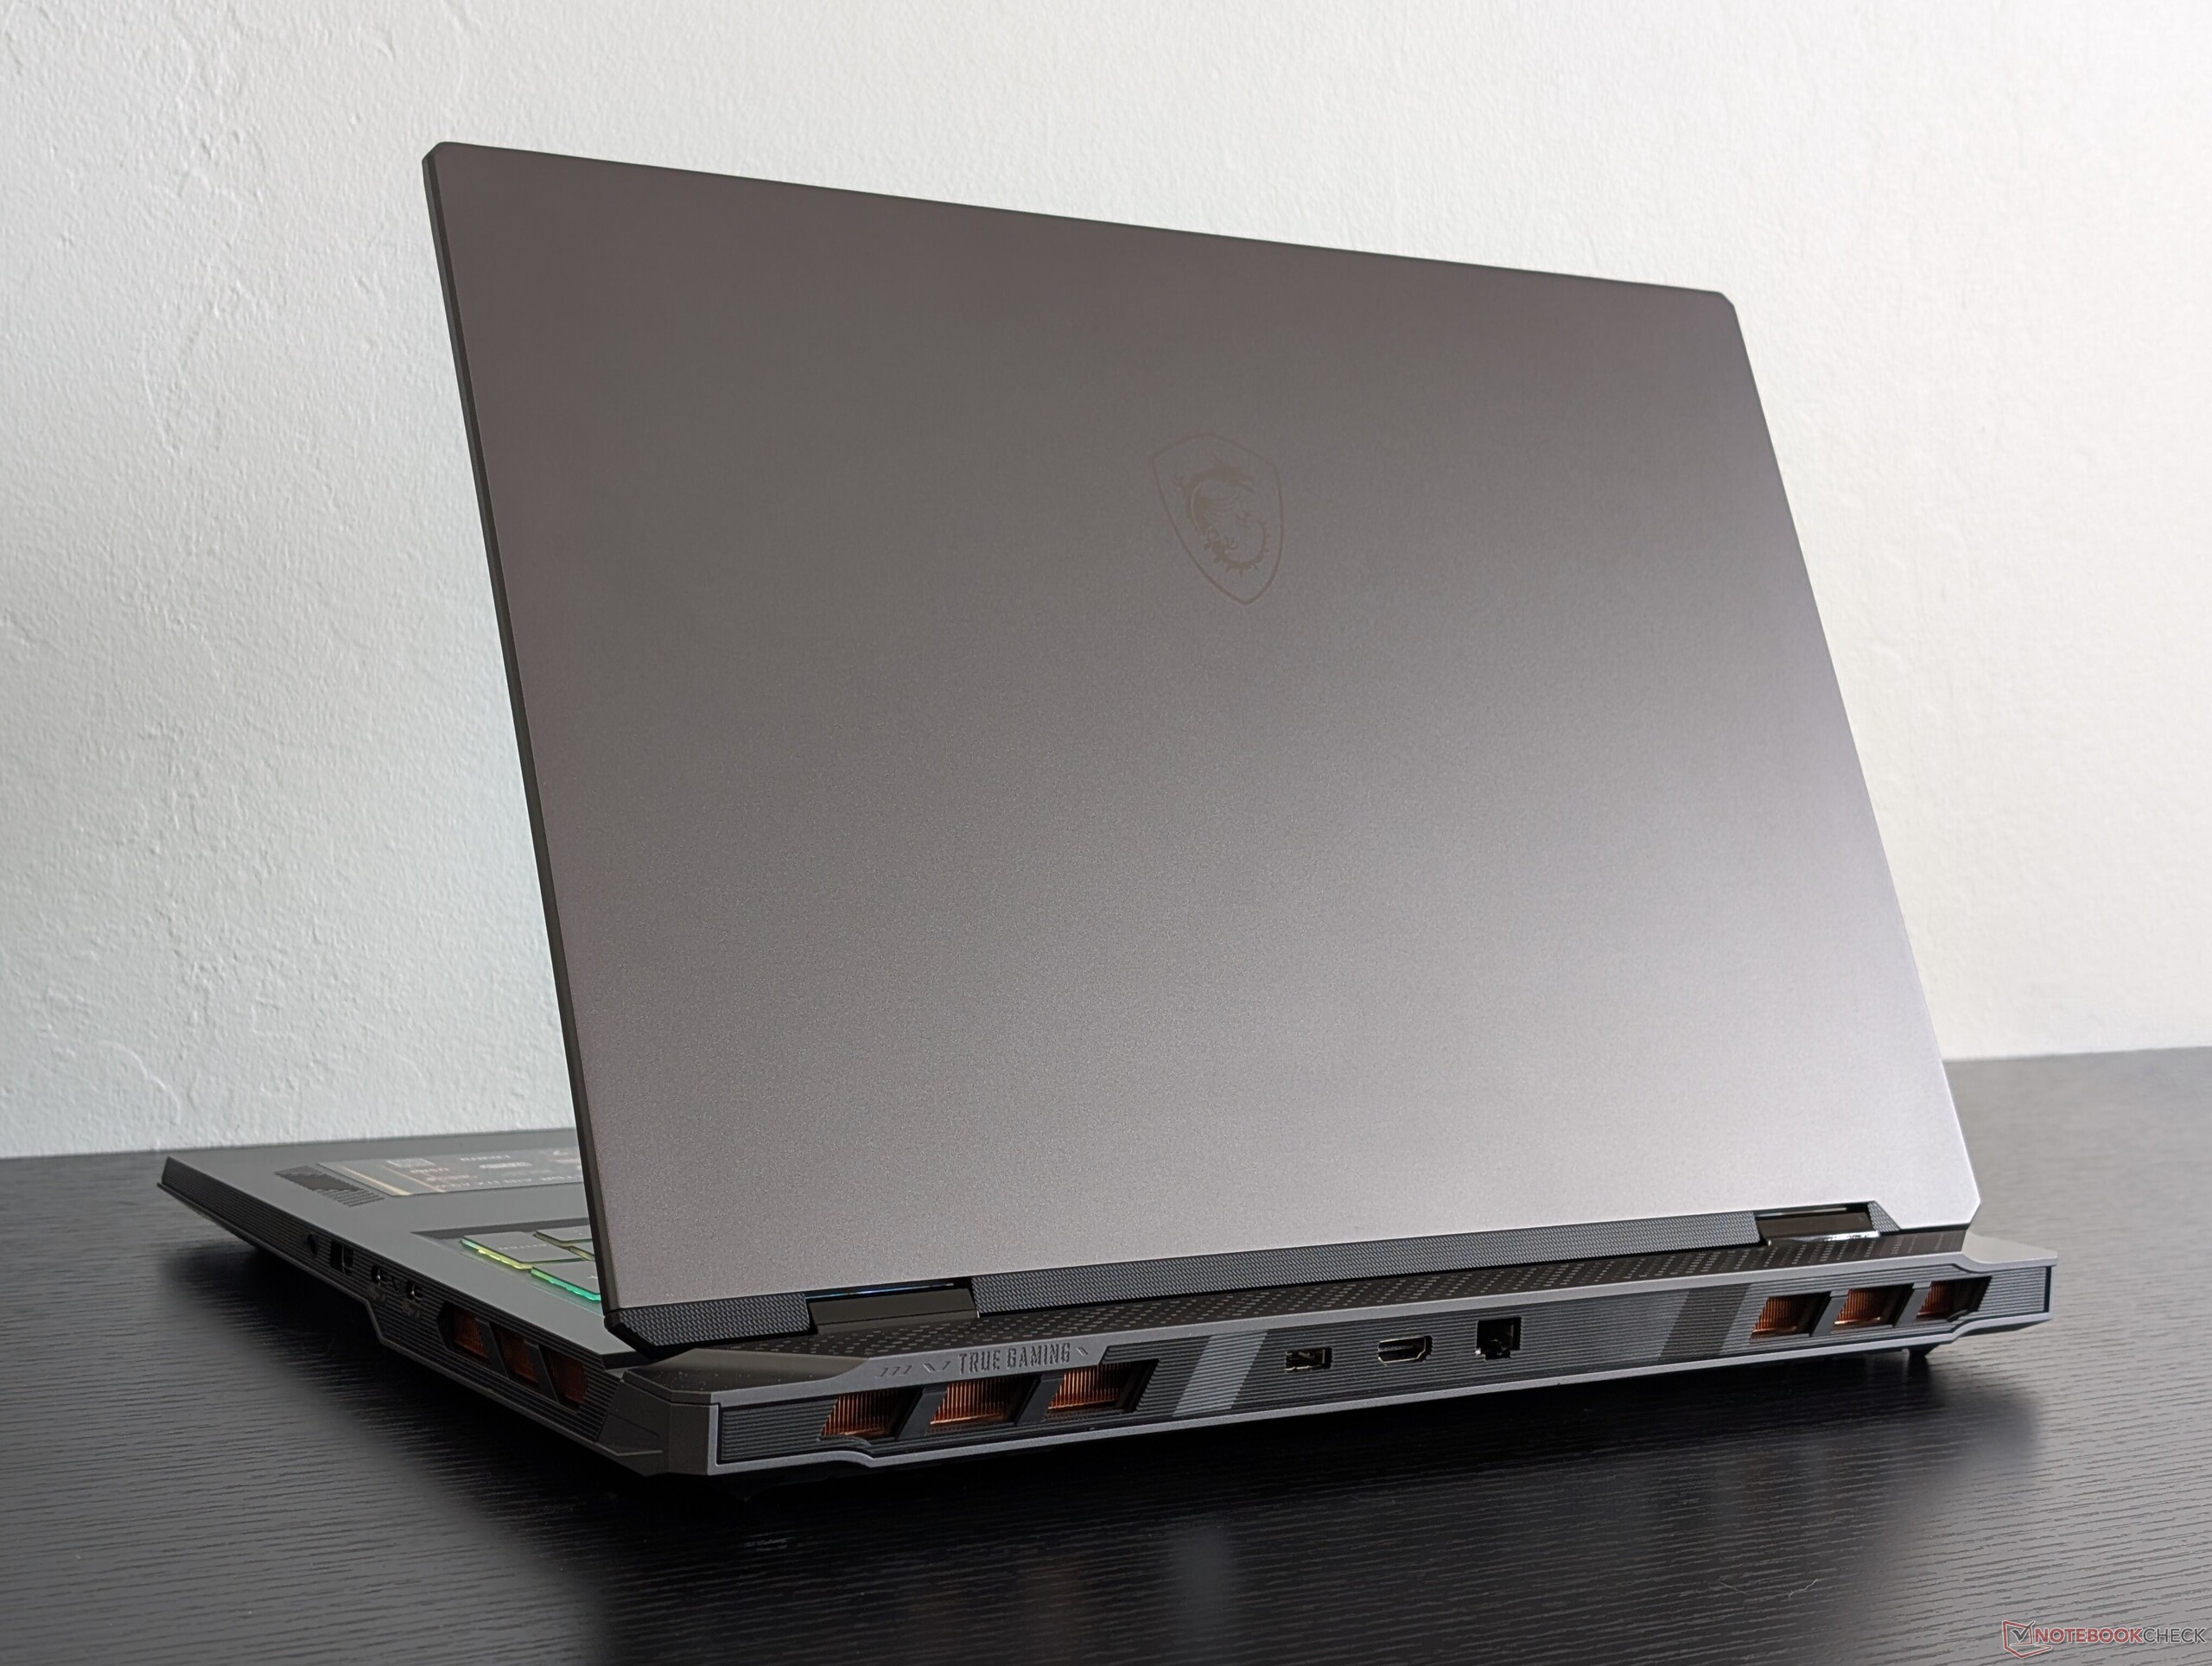
Case
Chassis materials and impressions are essentially the same as the pricier Raider 18 HX since the Vector A18 inherits the skeleton design of the Raider series. Surfaces are rigid and luxurious versus the cheap or plasticky feel of lower-end MSI models like the Katana, Sowrd, or Thin series.
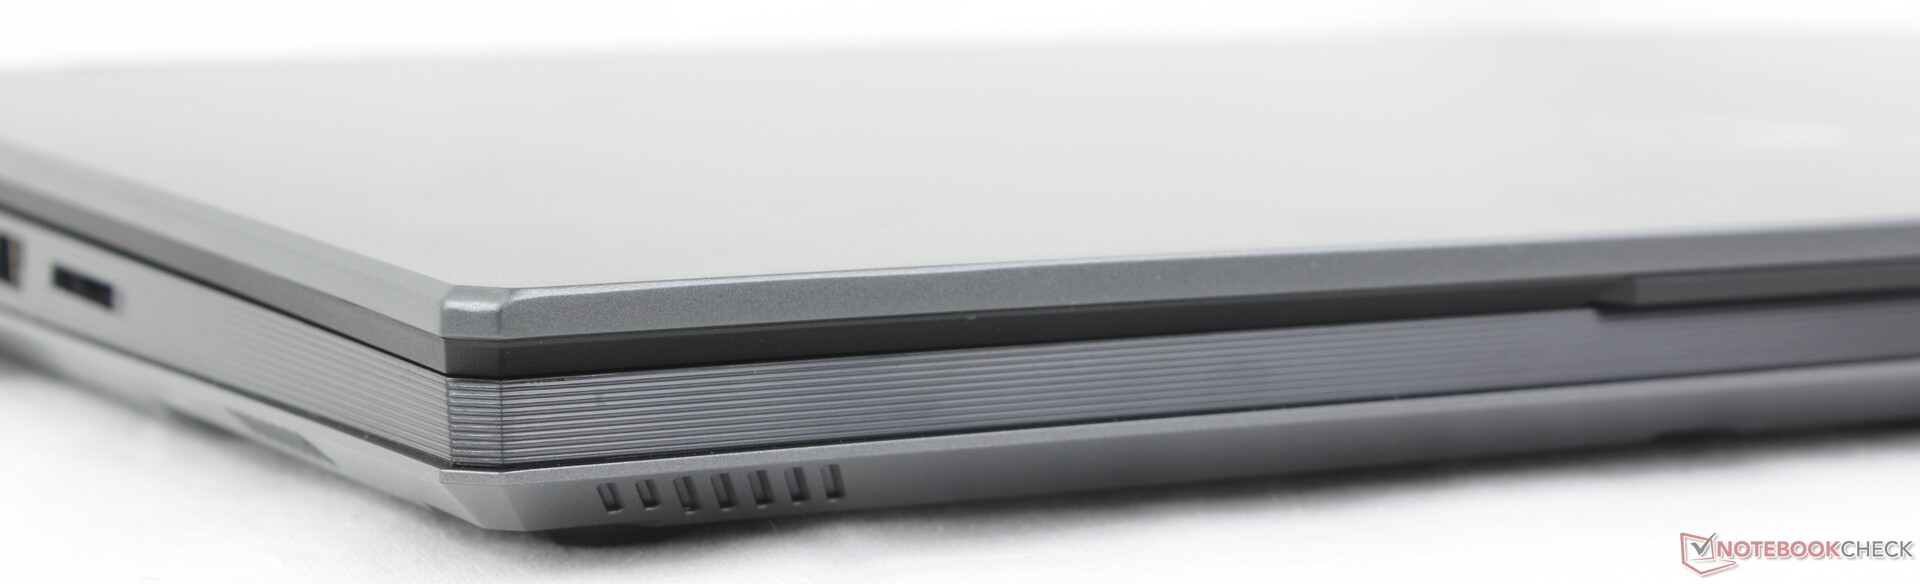
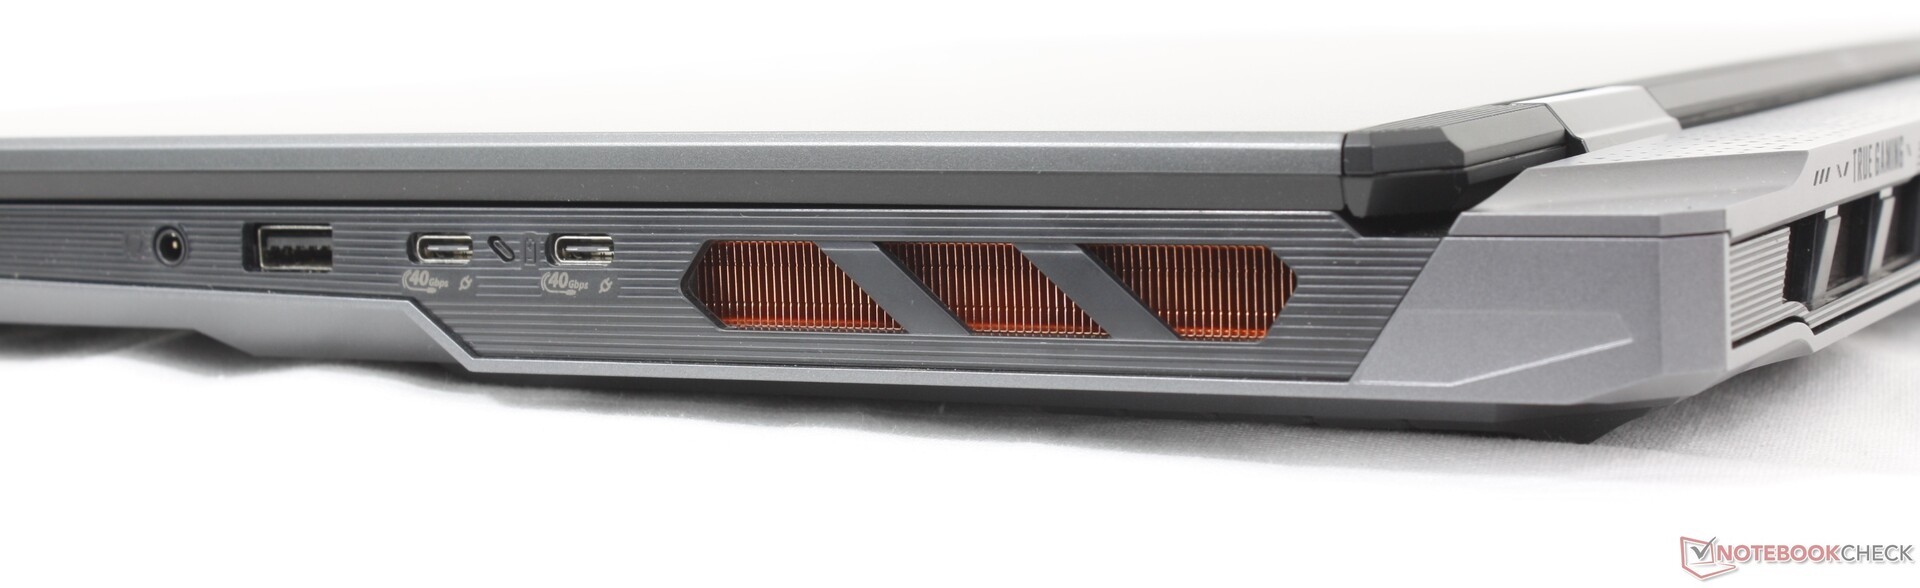
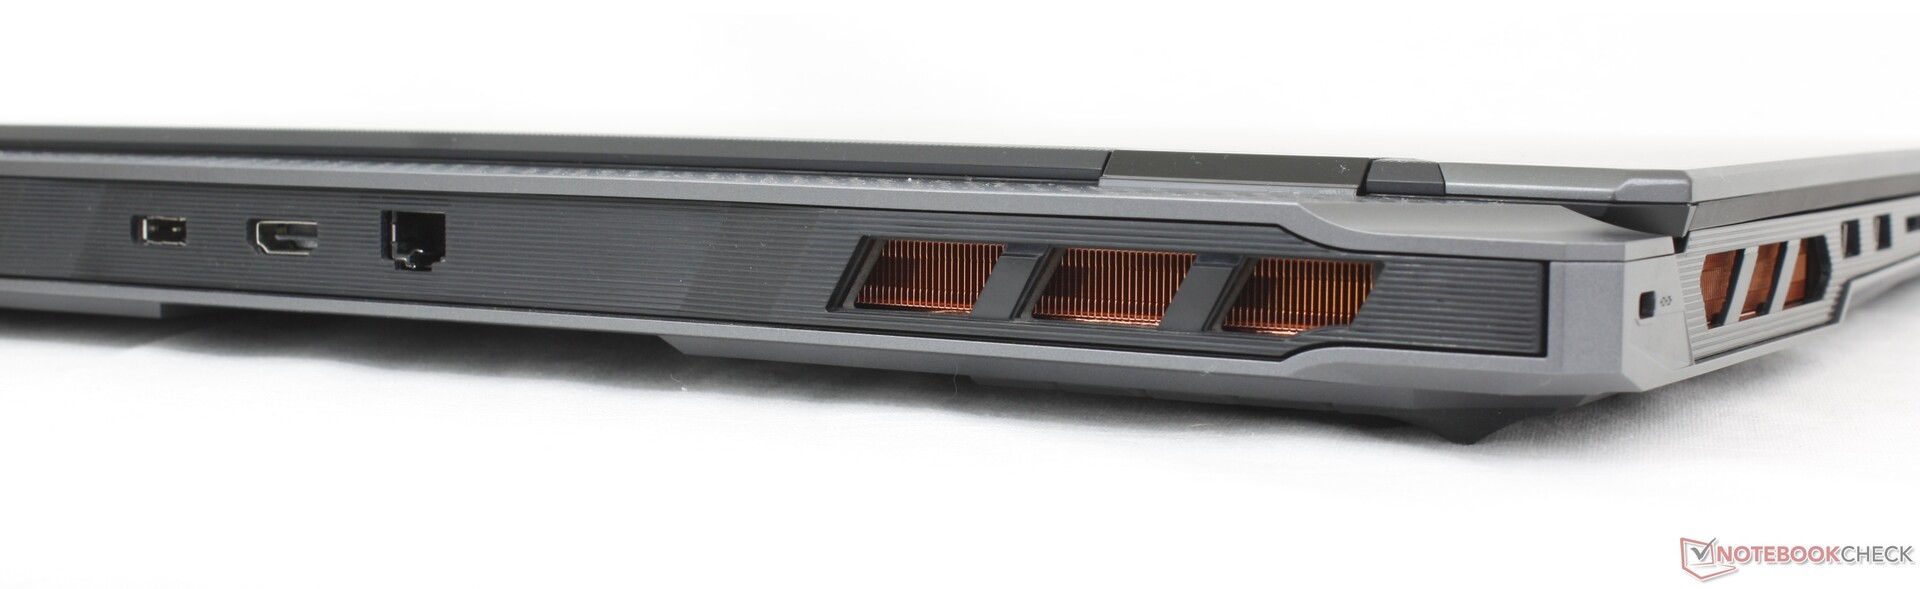
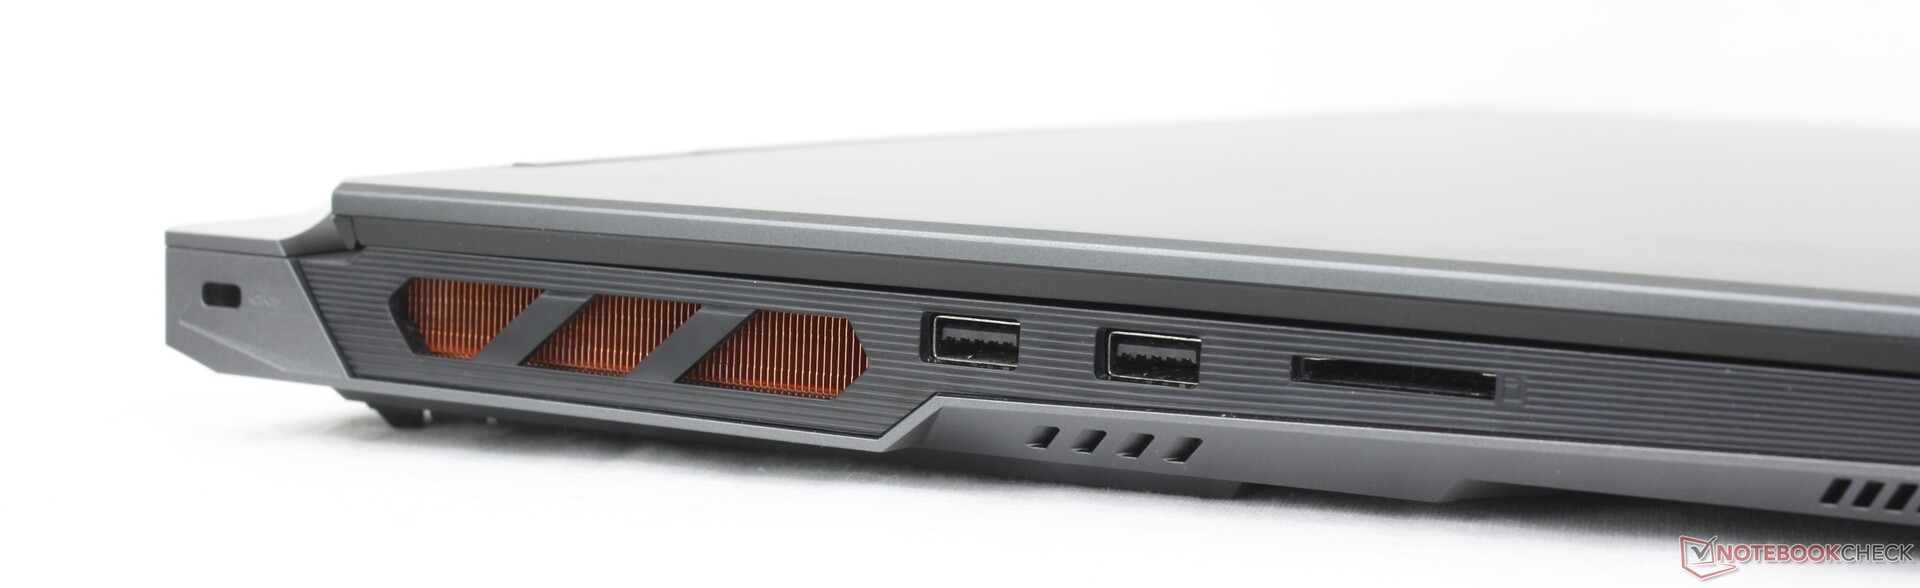
Connectivity
Port options and positioning are slightly different than on the Vector 16 despite their size differences. Vector A18 owners have two USB-C ports instead of three and three USB-A ports instead of two.
SD Card Reader
| SD Card Reader | |
| average JPG Copy Test (av. of 3 runs) | |
| MSI Vector A18 HX A9W (Toshiba Exceria Pro SDXC 64 GB UHS-II) | |
| Alienware m18 R2 (Toshiba Exceria Pro SDXC 64 GB UHS-II) | |
| Razer Blade 18 2024 RZ09-0509 (Toshiba Exceria Pro SDXC 64 GB UHS-II) | |
| Acer Predator Helios 18 PH18-72-98MW (AV PRO microSD 128 GB V60) | |
| MSI Raider 18 HX A14V (Toshiba Exceria Pro SDXC 64 GB UHS-II) | |
| maximum AS SSD Seq Read Test (1GB) | |
| MSI Vector A18 HX A9W (Toshiba Exceria Pro SDXC 64 GB UHS-II) | |
| Razer Blade 18 2024 RZ09-0509 (Toshiba Exceria Pro SDXC 64 GB UHS-II) | |
| Alienware m18 R2 (Toshiba Exceria Pro SDXC 64 GB UHS-II) | |
| MSI Raider 18 HX A14V (Toshiba Exceria Pro SDXC 64 GB UHS-II) | |
| Acer Predator Helios 18 PH18-72-98MW (AV PRO microSD 128 GB V60) | |
Communication
| Networking | |
| iperf3 transmit AXE11000 | |
| Asus Strix Scar 18 G835LX | |
| MSI Vector A18 HX A9W | |
| Razer Blade 18 2024 RZ09-0509 | |
| Acer Predator Helios 18 PH18-72-98MW | |
| Alienware m18 R2 | |
| MSI Raider 18 HX A14V | |
| iperf3 receive AXE11000 | |
| Acer Predator Helios 18 PH18-72-98MW | |
| Asus Strix Scar 18 G835LX | |
| MSI Vector A18 HX A9W | |
| Razer Blade 18 2024 RZ09-0509 | |
| Alienware m18 R2 | |
| MSI Raider 18 HX A14V | |
| iperf3 transmit AXE11000 6GHz | |
| MSI Vector A18 HX A9W | |
| Razer Blade 18 2024 RZ09-0509 | |
| MSI Raider 18 HX A14V | |
| Alienware m18 R2 | |
| iperf3 receive AXE11000 6GHz | |
| MSI Vector A18 HX A9W | |
| Razer Blade 18 2024 RZ09-0509 | |
| Alienware m18 R2 | |
| MSI Raider 18 HX A14V | |
Webcam
The 2 MP webcam comes standard with IR and a physical privacy slider.


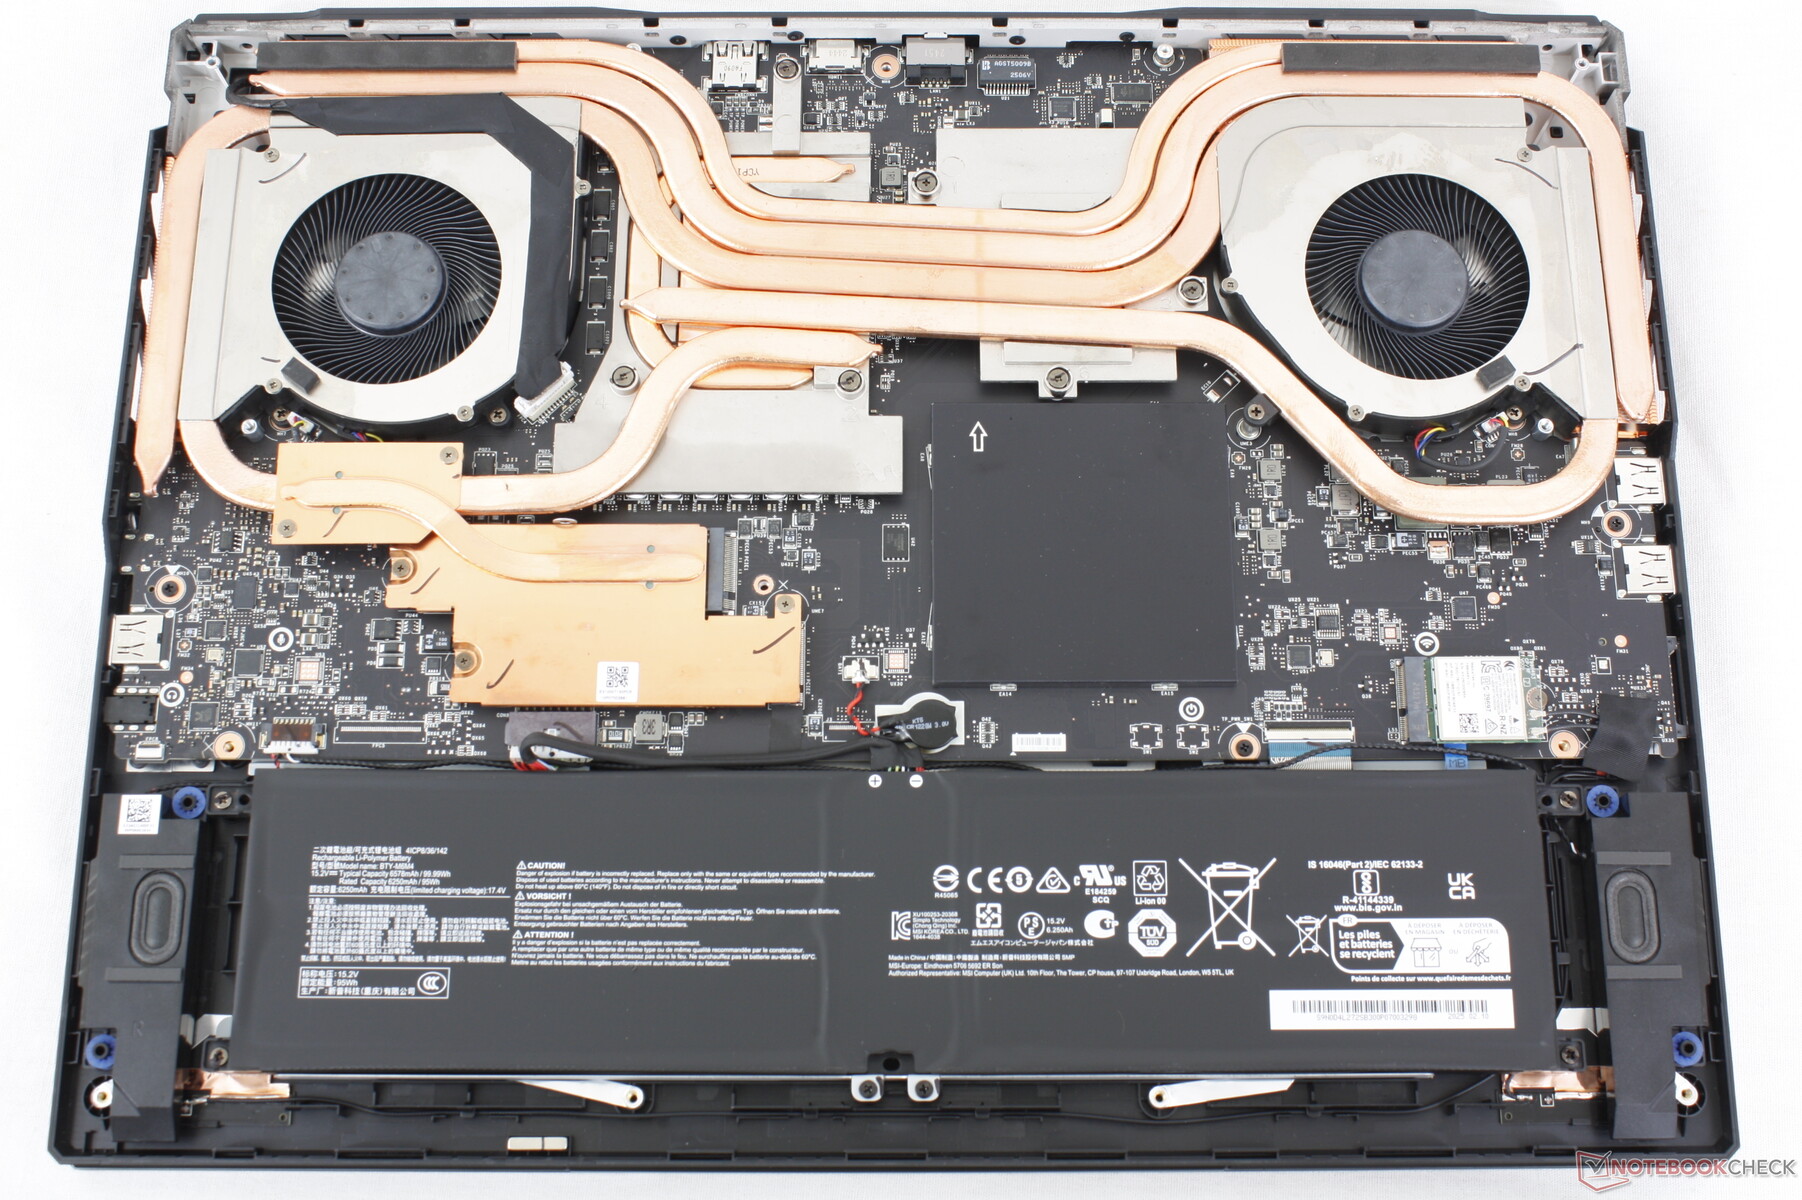
Maintenance
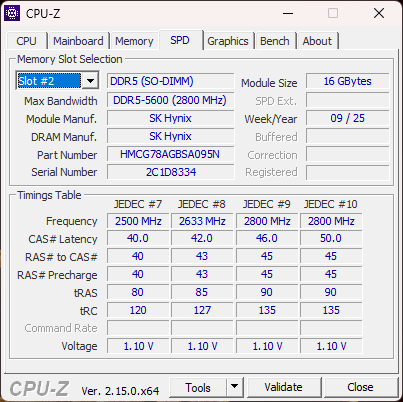
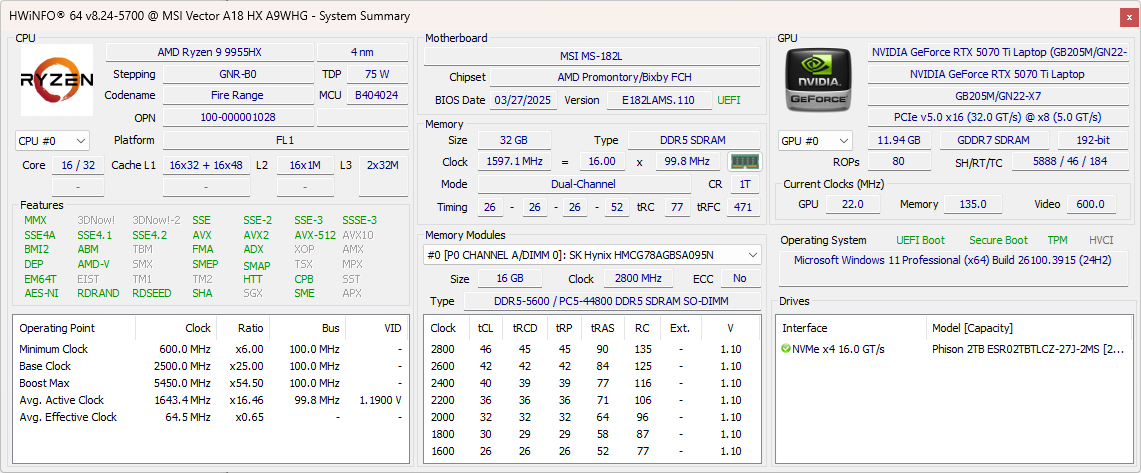
Owners have easy access to two DDR5 SODIMM slots, two M.2 2280 SSD slots, and the removable WLAN module. Note that one of the two SSD slots supports PCIe5 drives.
Sustainability
MSI does not explicitly mention any recycled materials used during the manufacturing process. The packaging is mostly paper and cardboard but with plastic wrapping around the laptop and AC adapter.
Accessories And Warranty
There are no extras in the box other than the AC adapter and paperwork. The usual one-year limited manufacturer warranty applies if purchased in the US.
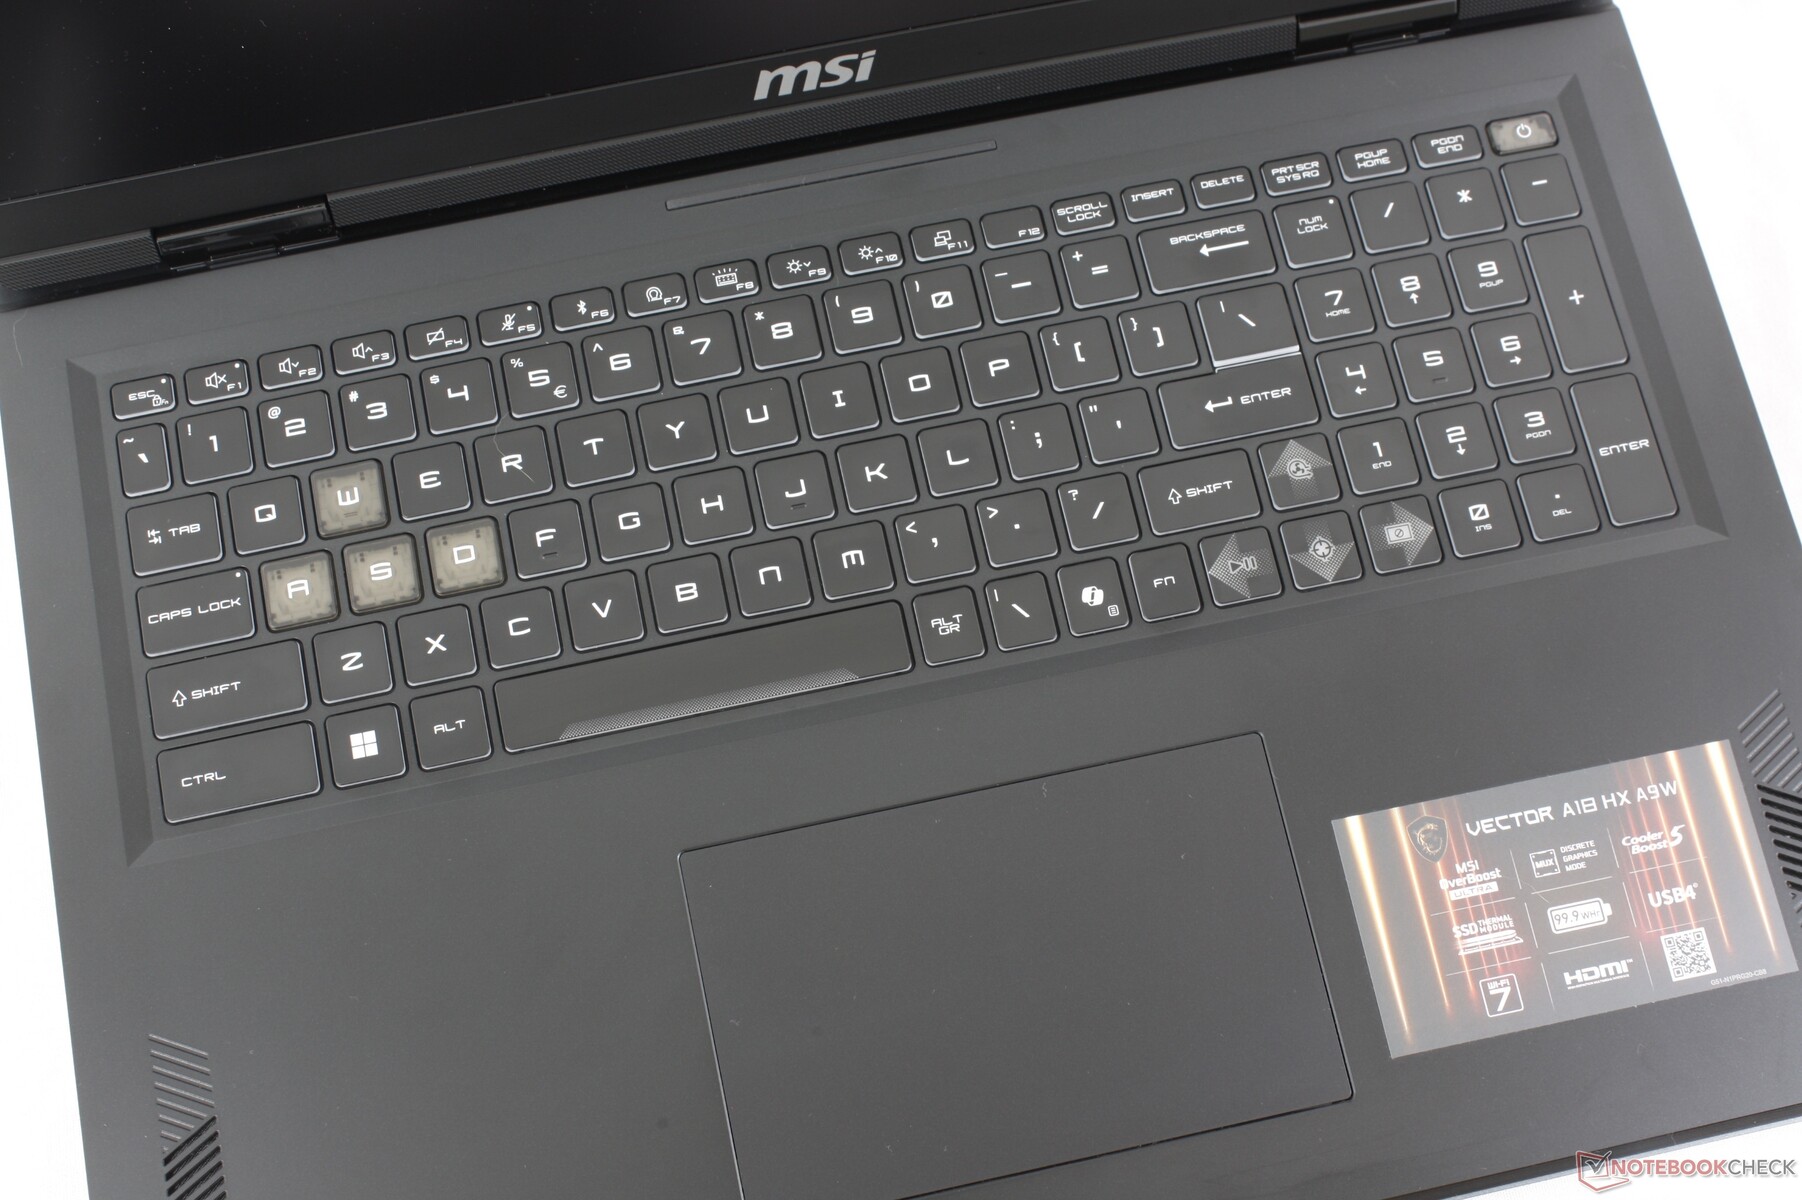
Input Devices
Keyboard & Touchpad
The keyboard is an upgrade from the Vector 16 with slightly larger keys to appear more like the keyboard on the more expensive Raider 18 HX. The arrow keys and numpad in particular feel more spacious than on most other laptops.
Clickpad size is exactly the same as on the Raider 18 HX (13 x 8.2 cm). The one on our unit may be defective as it would frequently become stuck when pushing down on its surface. We recommend double-checking the clickpad immediately after purchasing for any abnormalities.
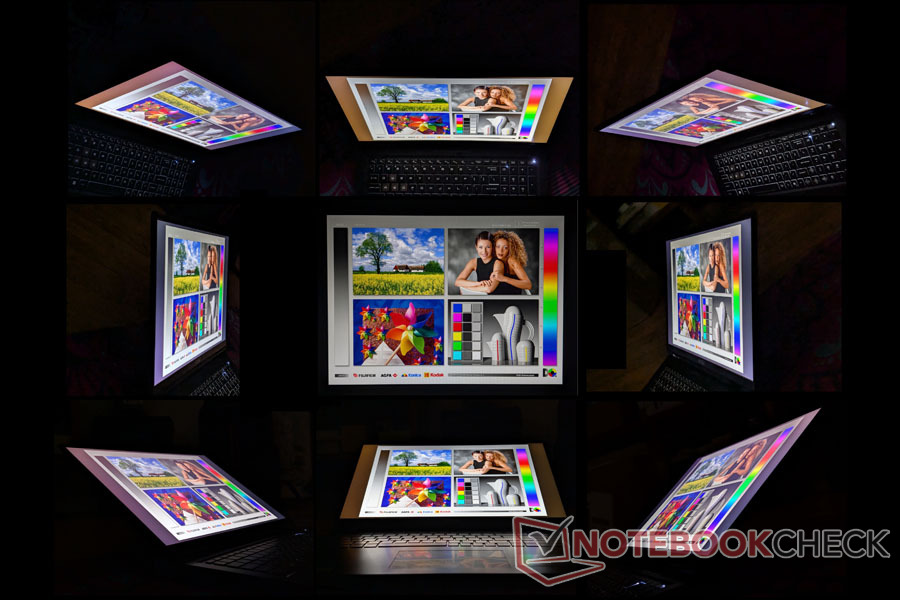
Display
A total of five display options are available as follows. Our measurements reflect only the bolded option on our review configuration:
- 2400p, Mini-LED, 120 Hz
- 1600p, IPS, 240 Hz
- 1200p, IPS, 165 Hz
- 2400p, IPS, 240 Hz
- 1200p, IPS, 144 Hz
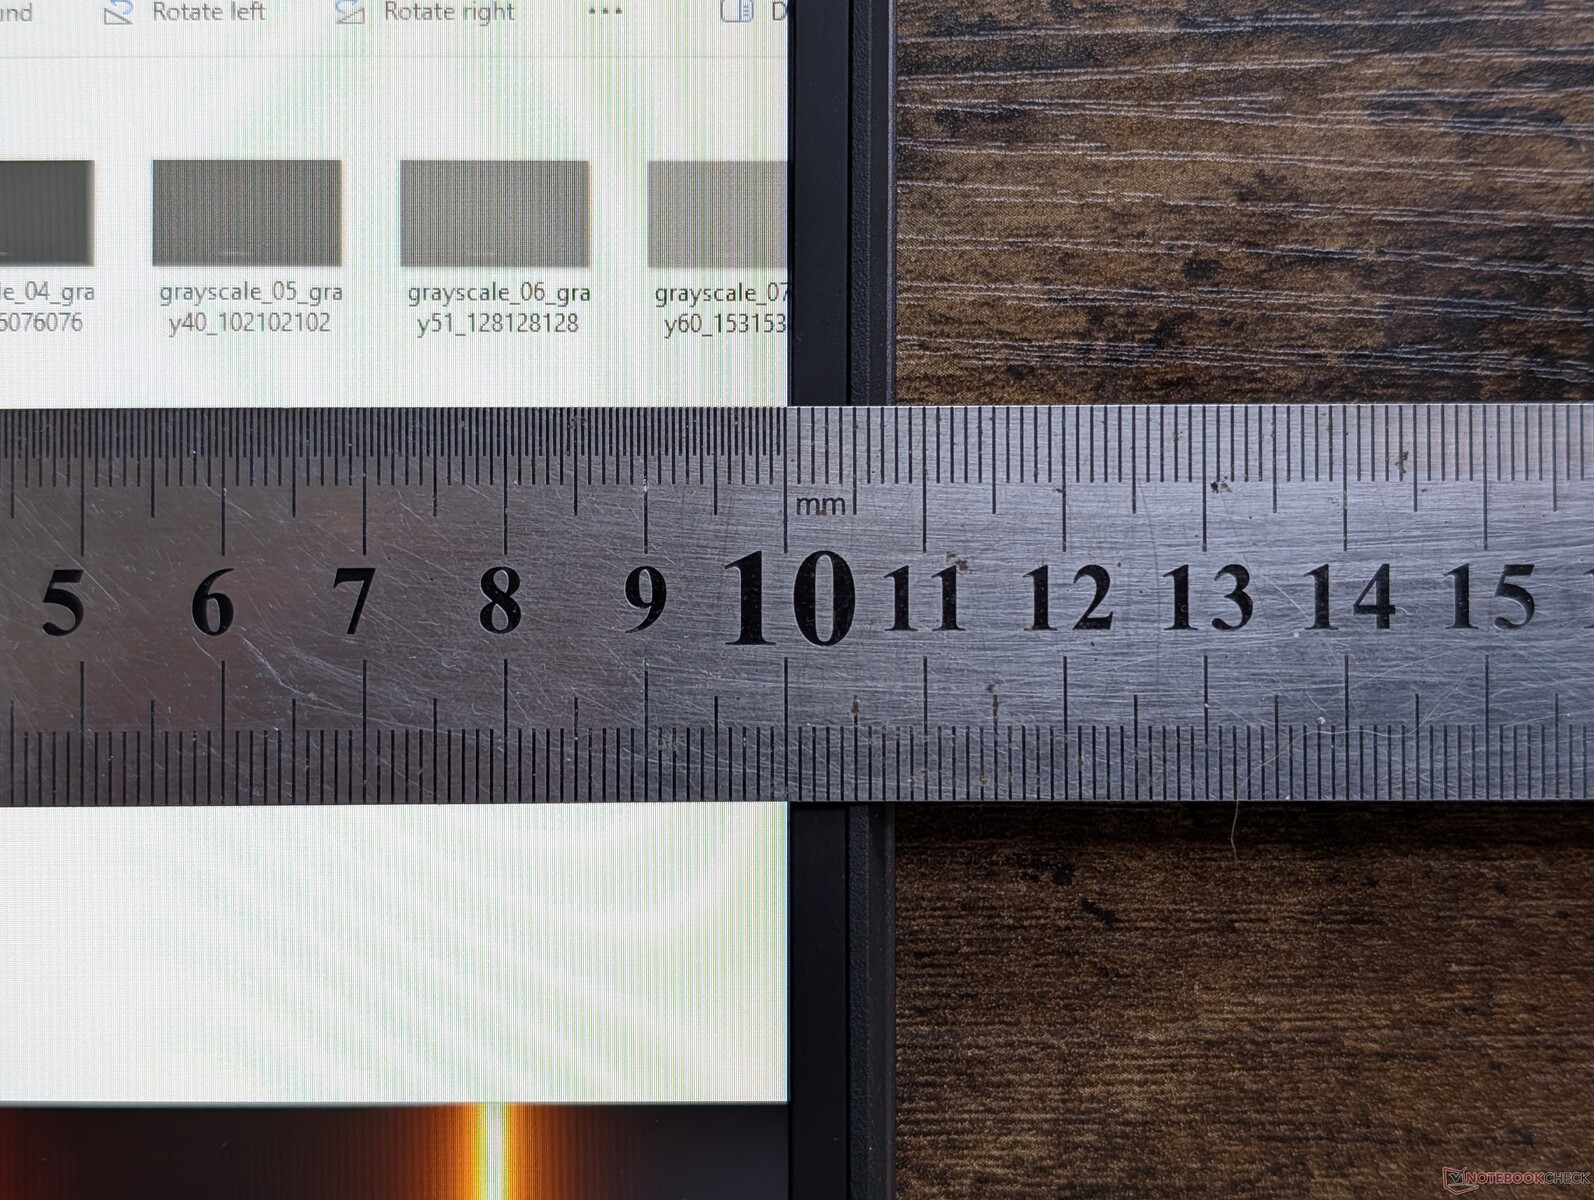
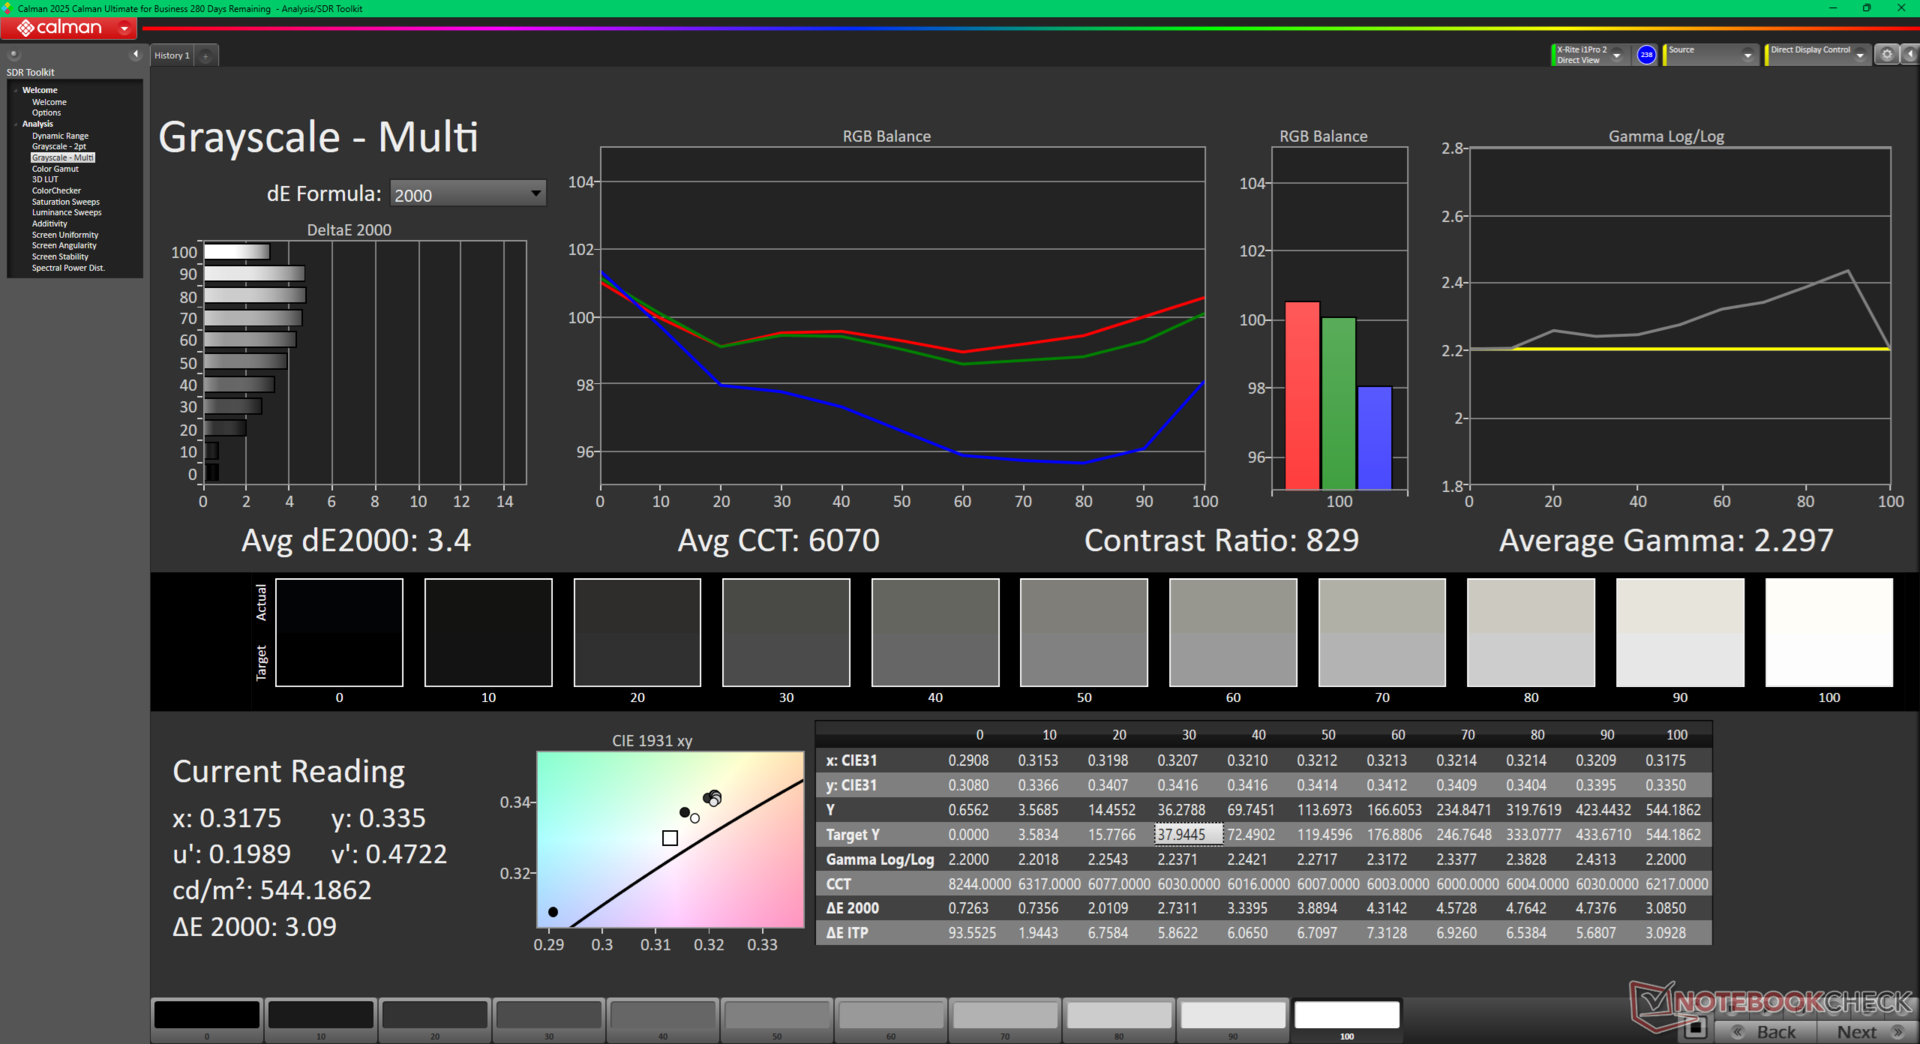
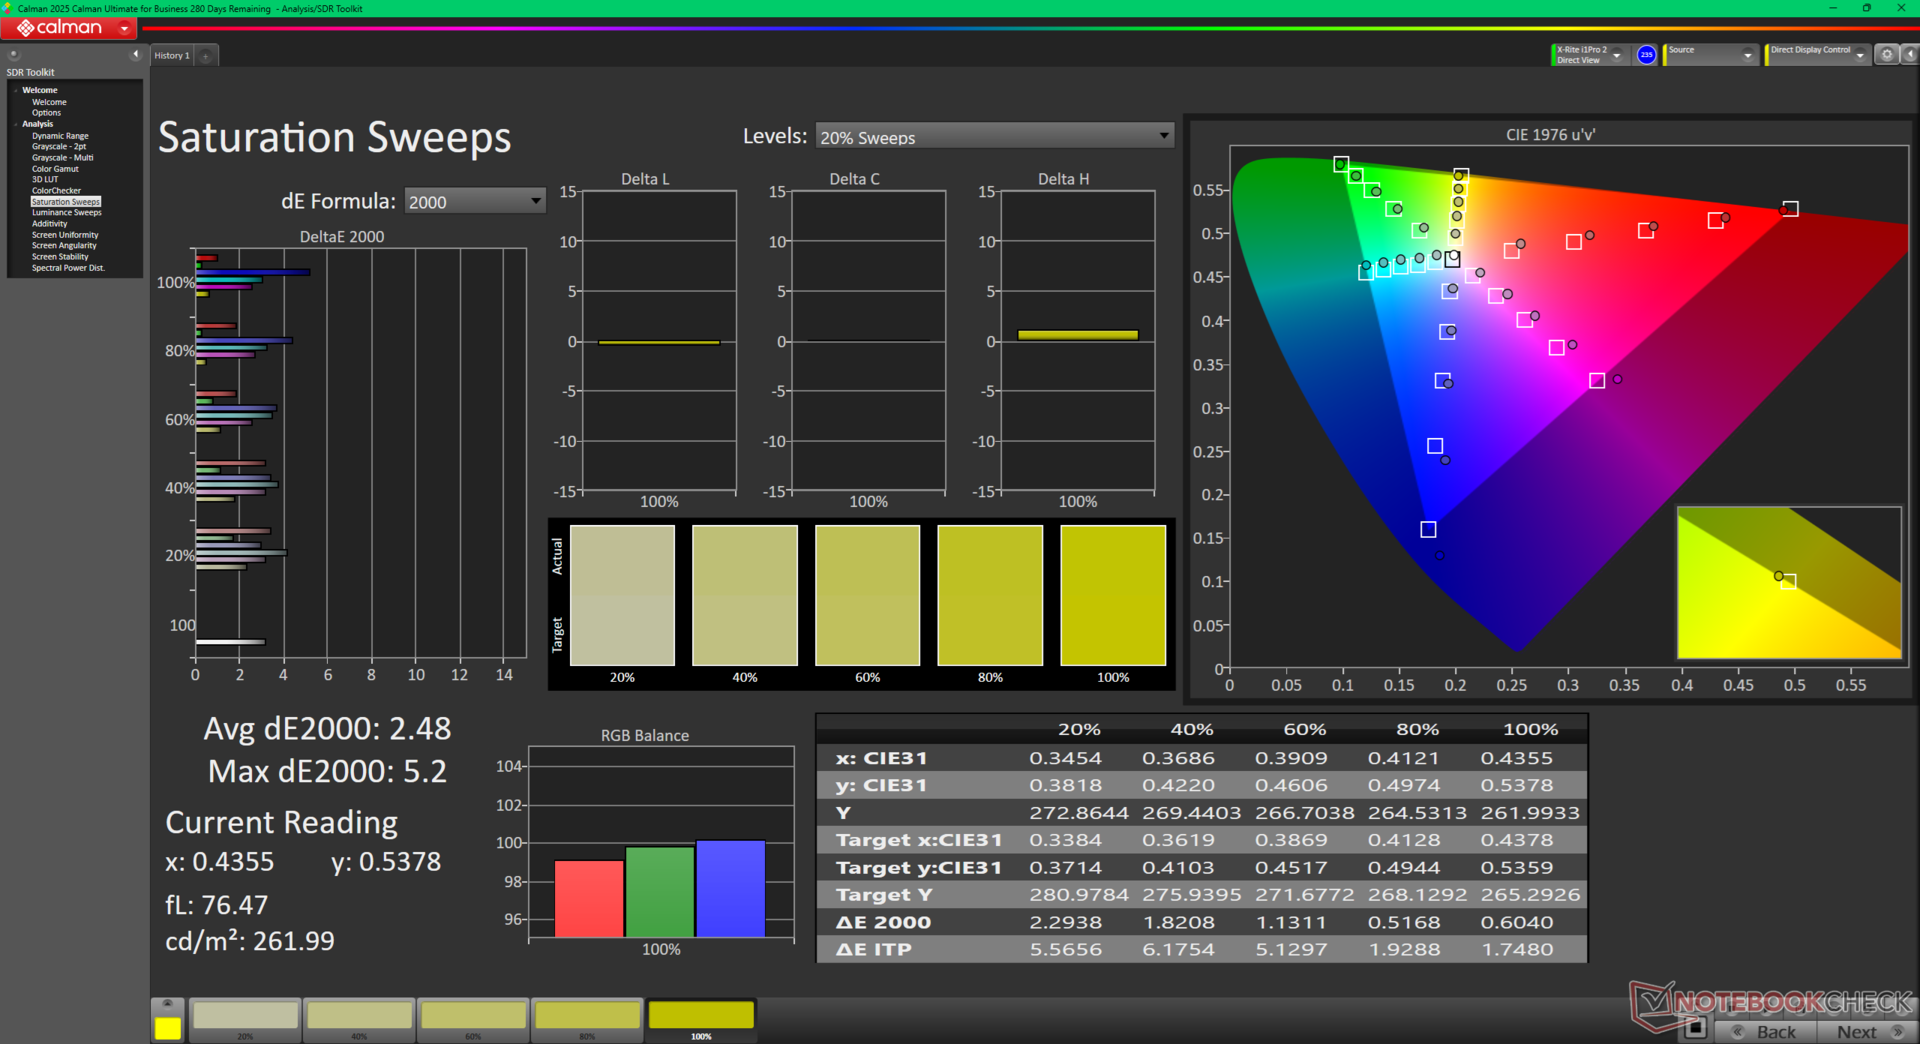
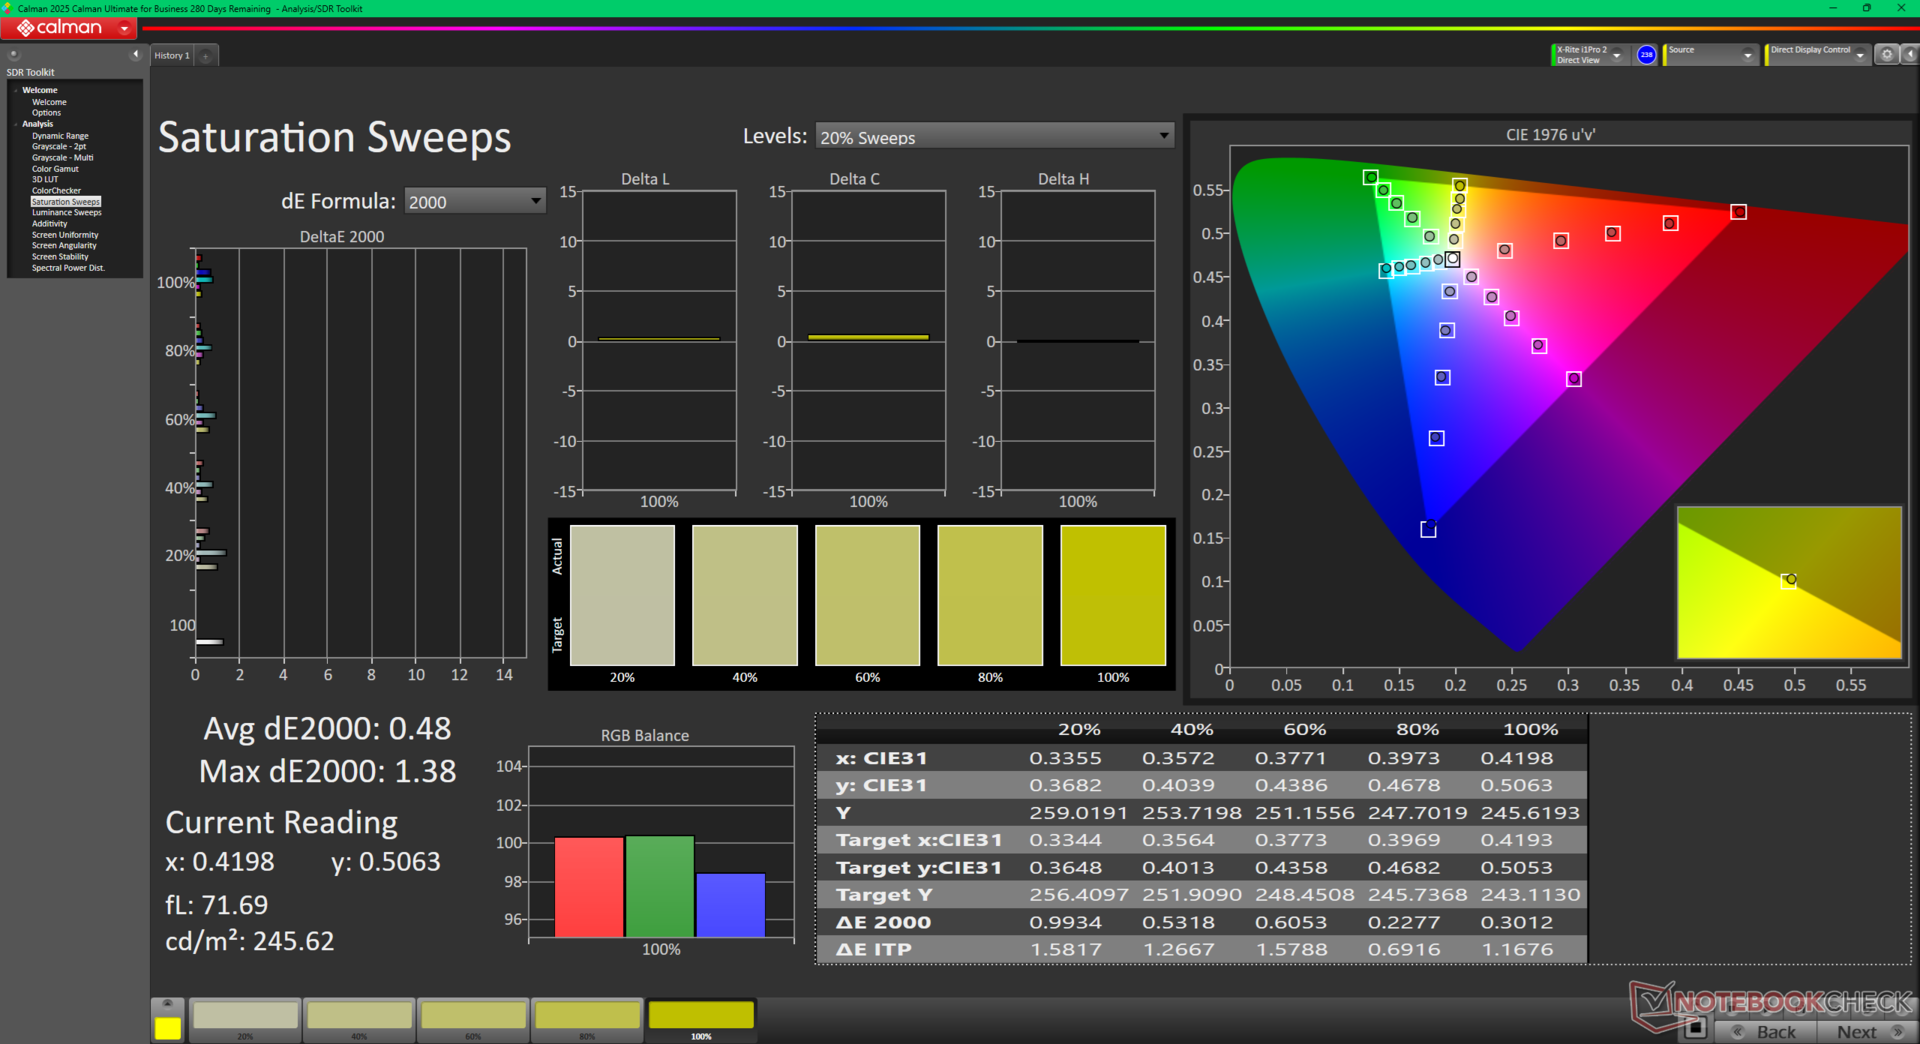
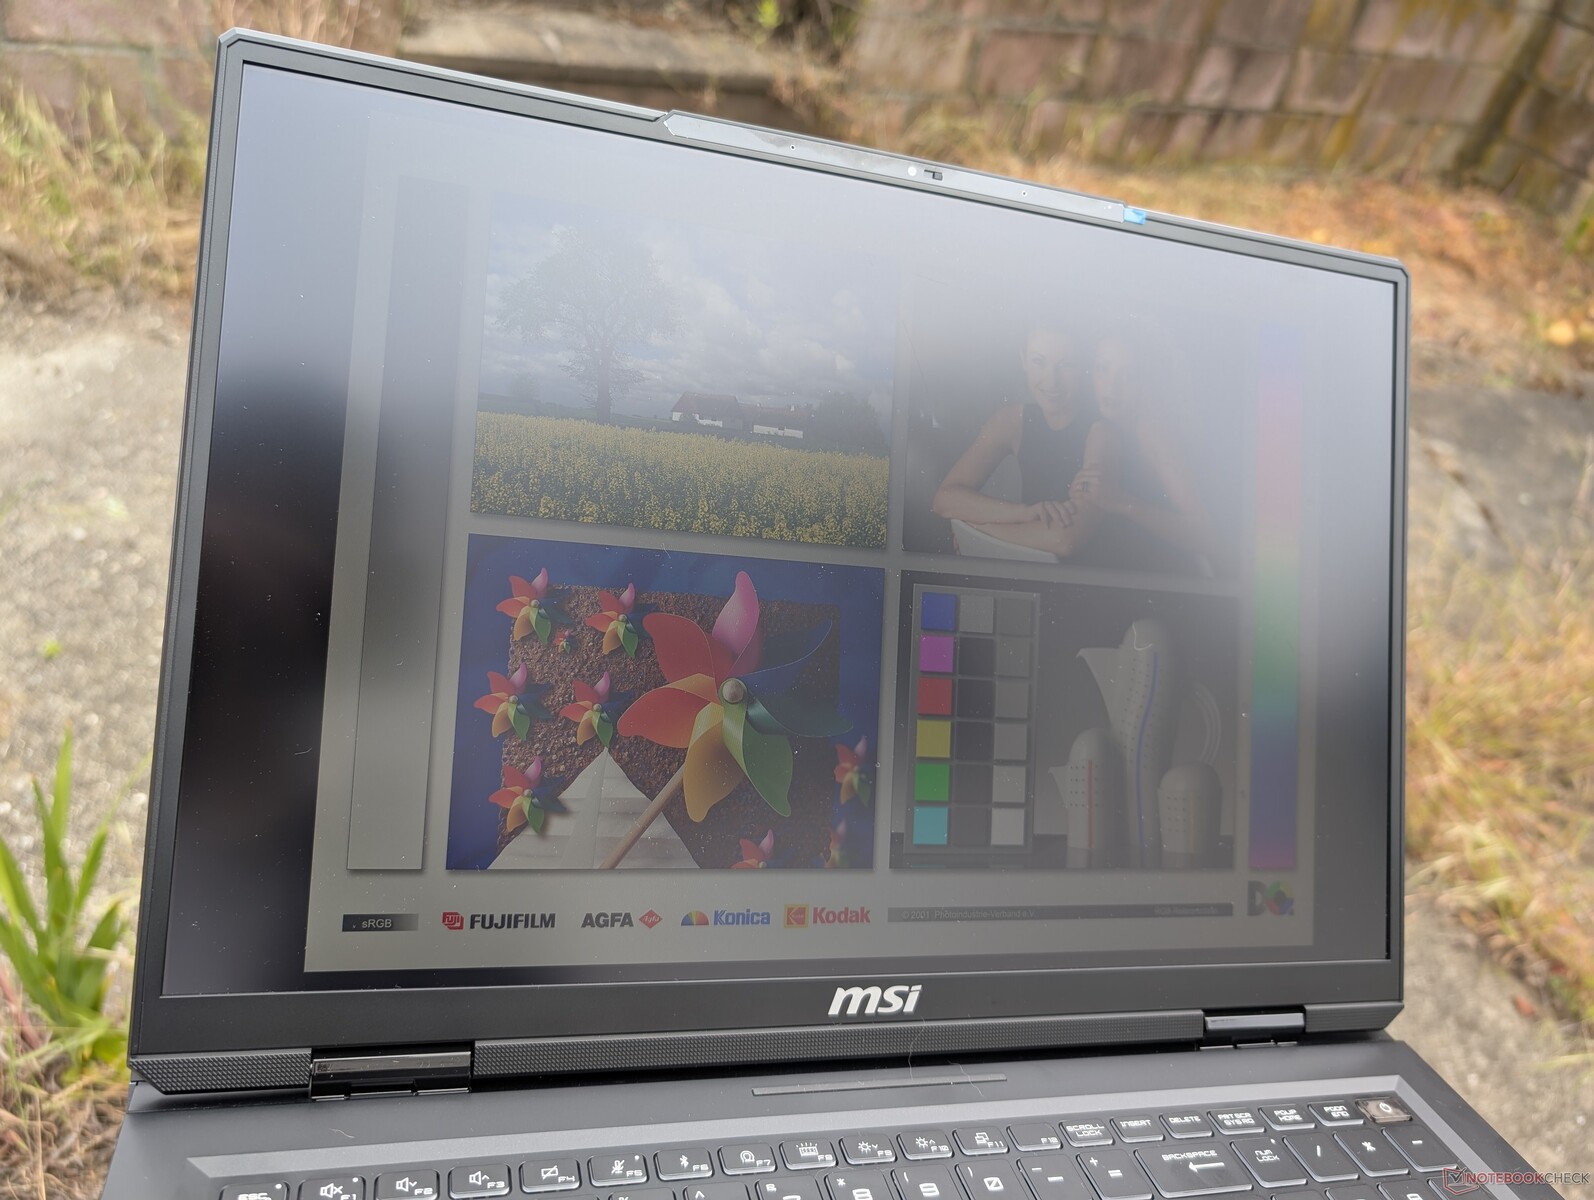
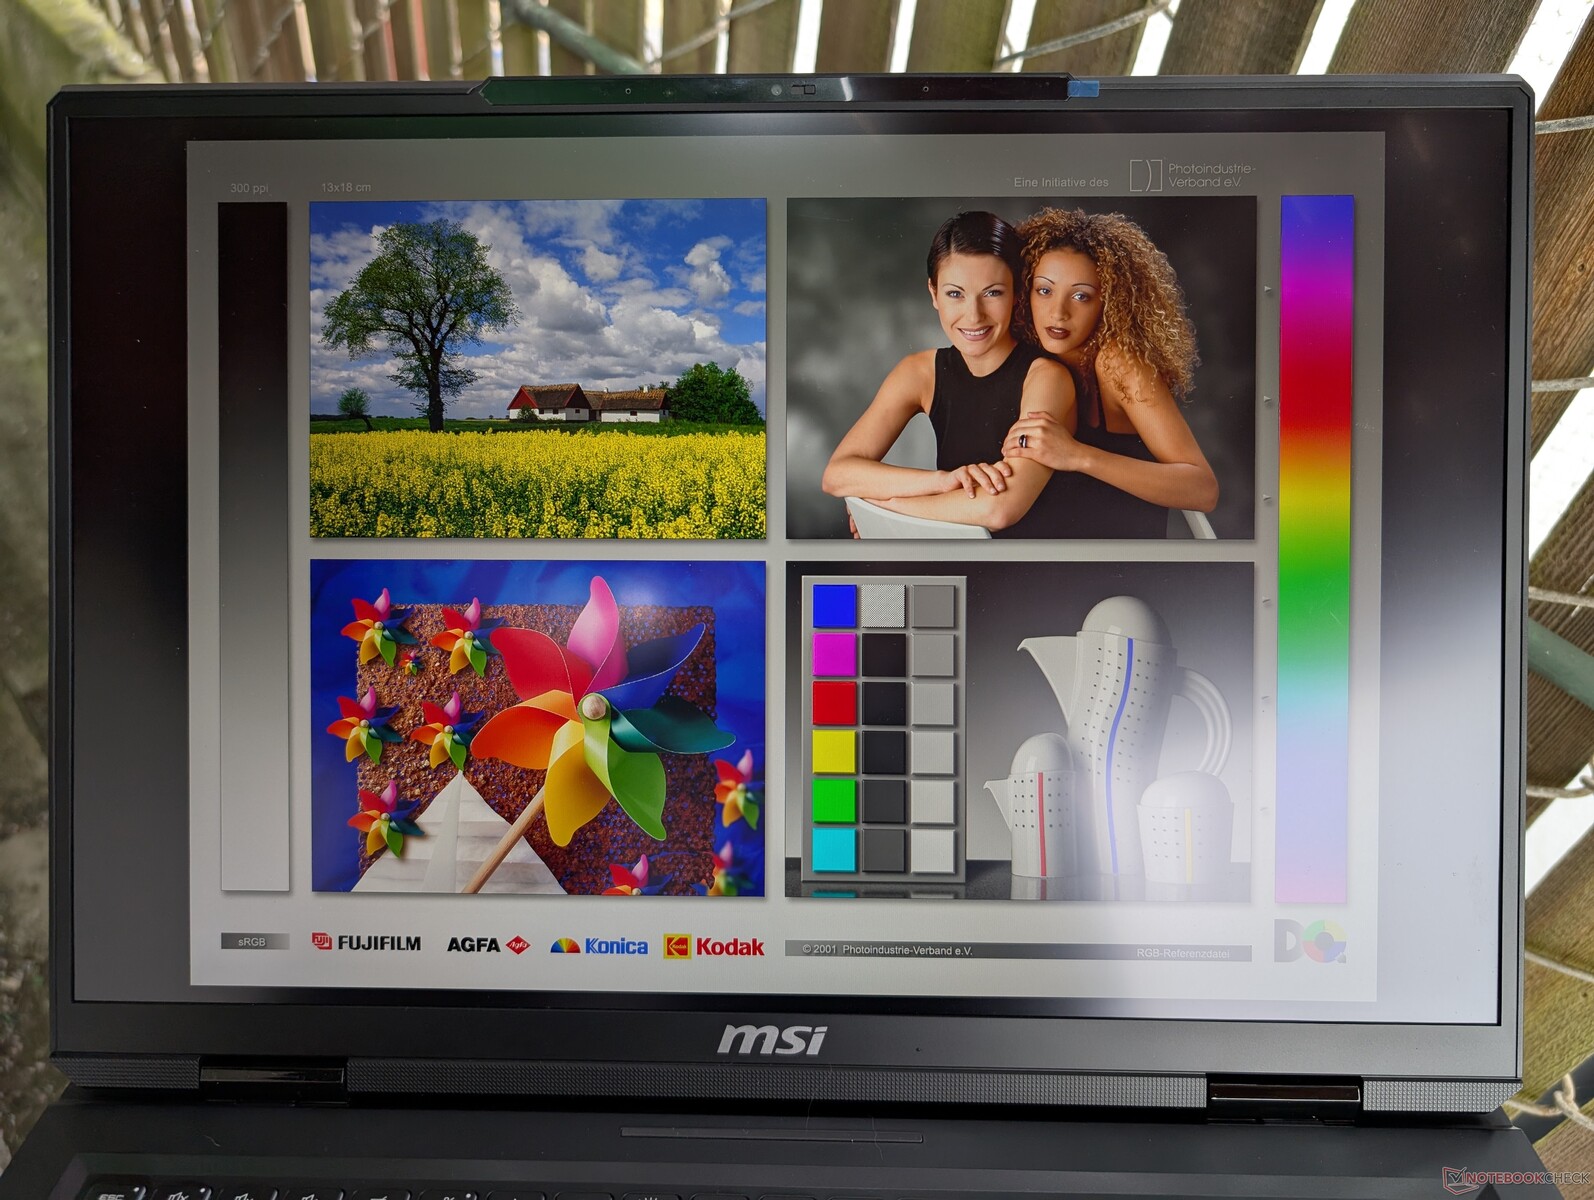
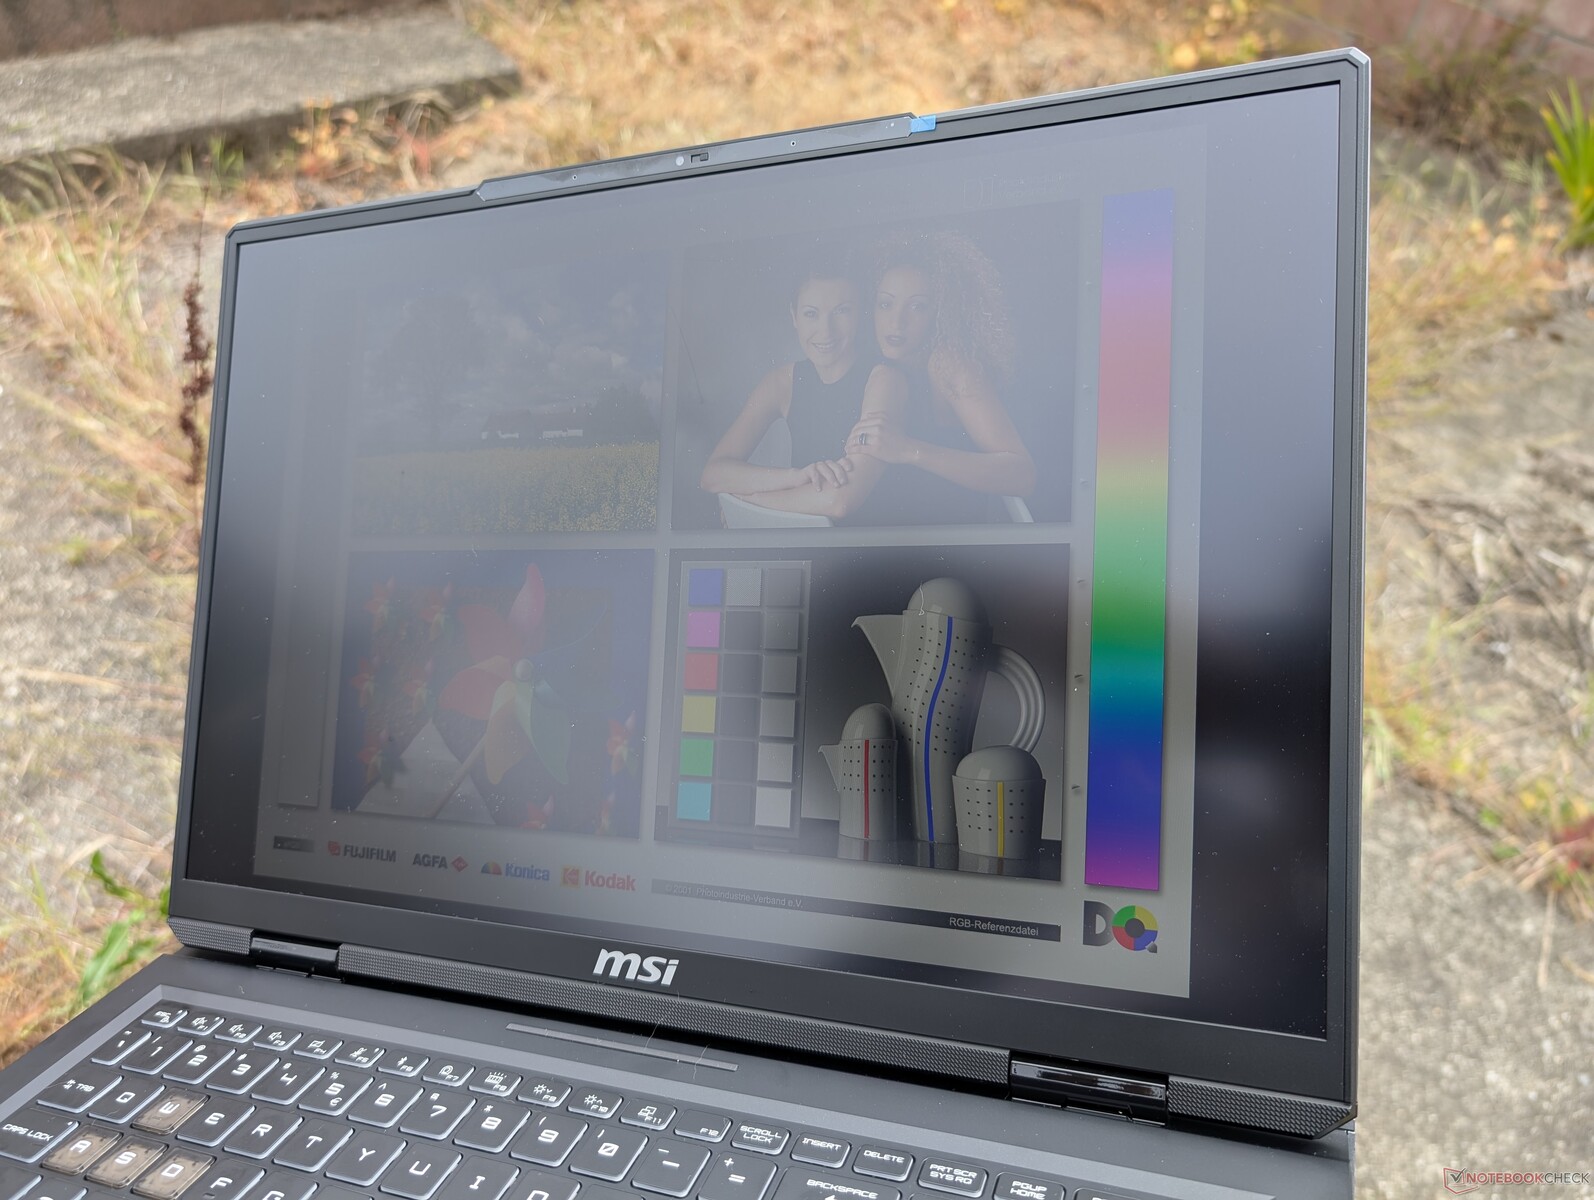
The 1600p240 option balances gaming and content editing well due to its wide P3 colors and fast response times. It's not as bright as mini-LED nor does it support HDR playback, but it is plenty bright for most purposes at over 500 nits on average. Note that G-Sync is not supported on this machine.


| |||||||||||||||||||||||||
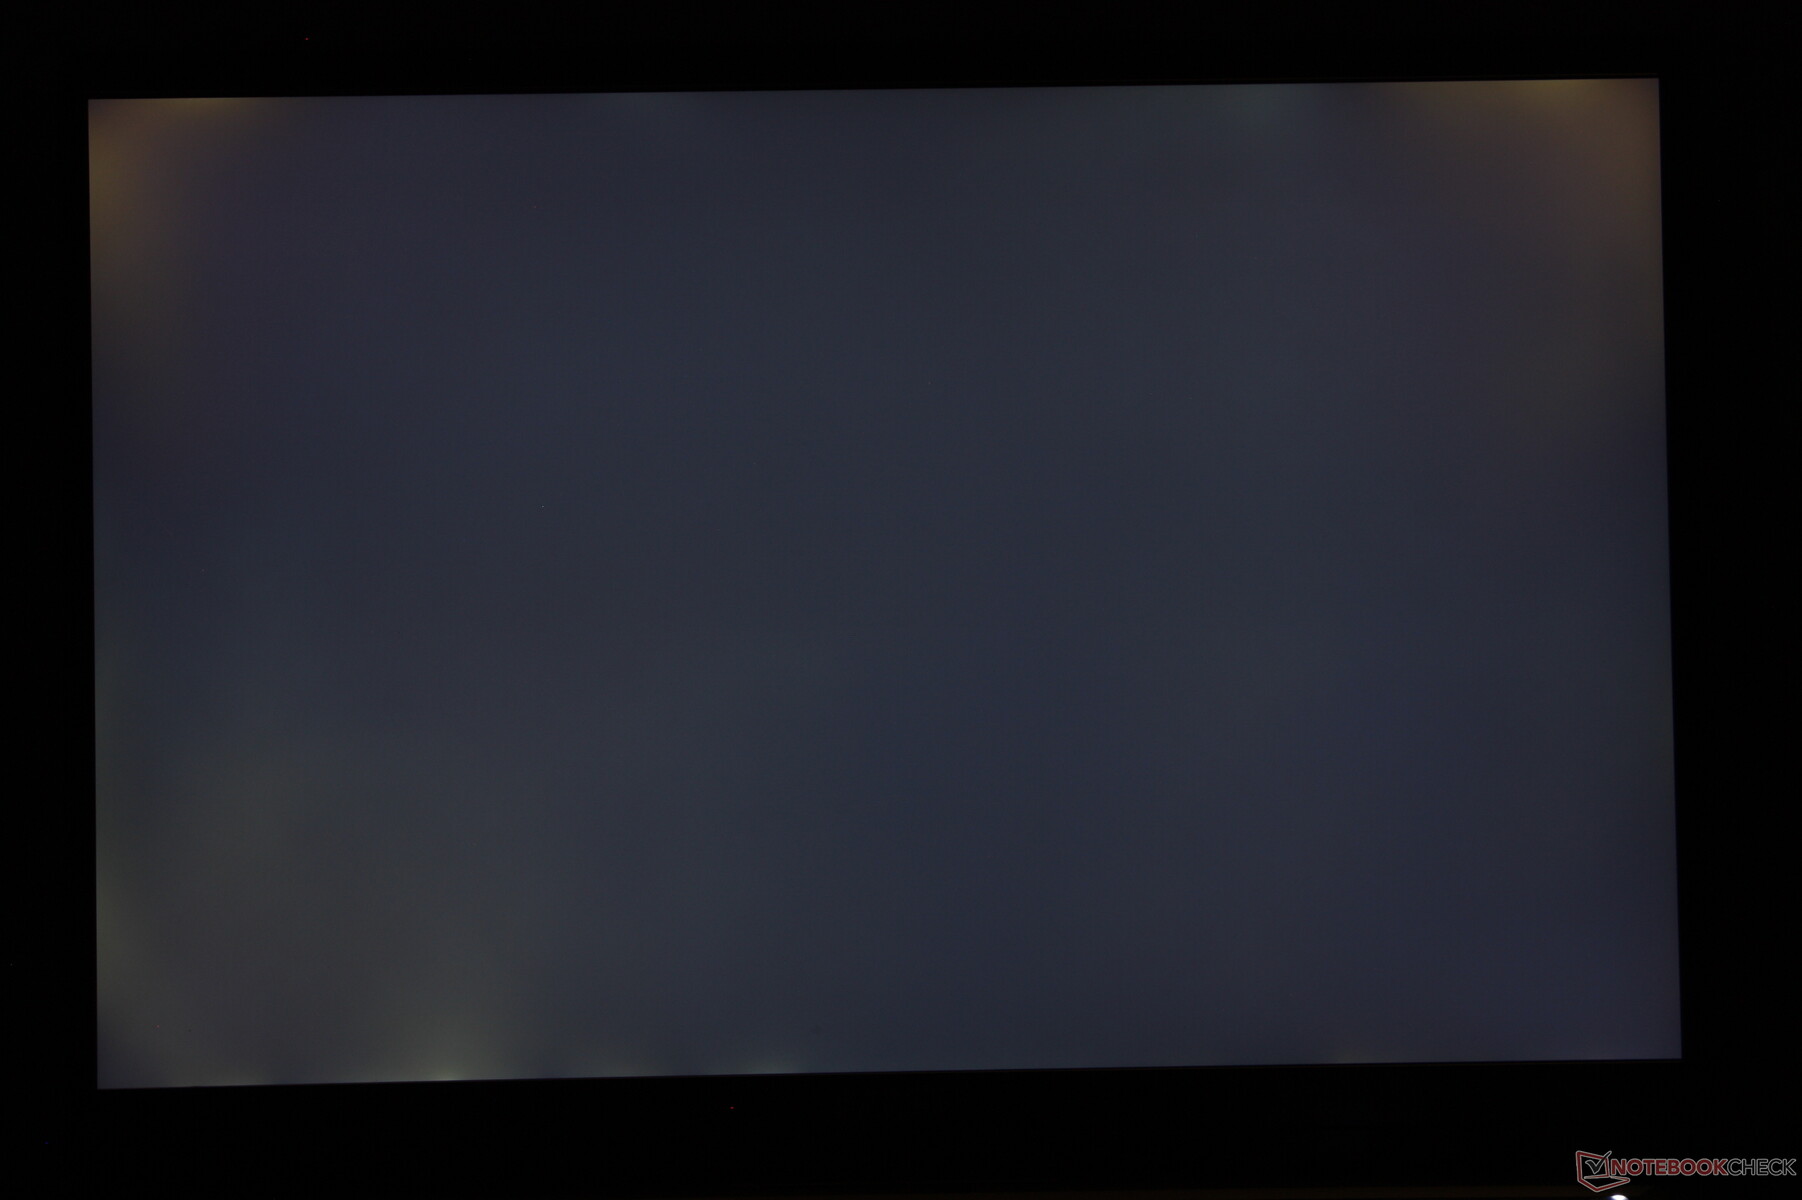
Brightness Distribution: 86 %
Center on Battery: 516.7 cd/m²
Contrast: 970:1 (Black: 0.56 cd/m²)
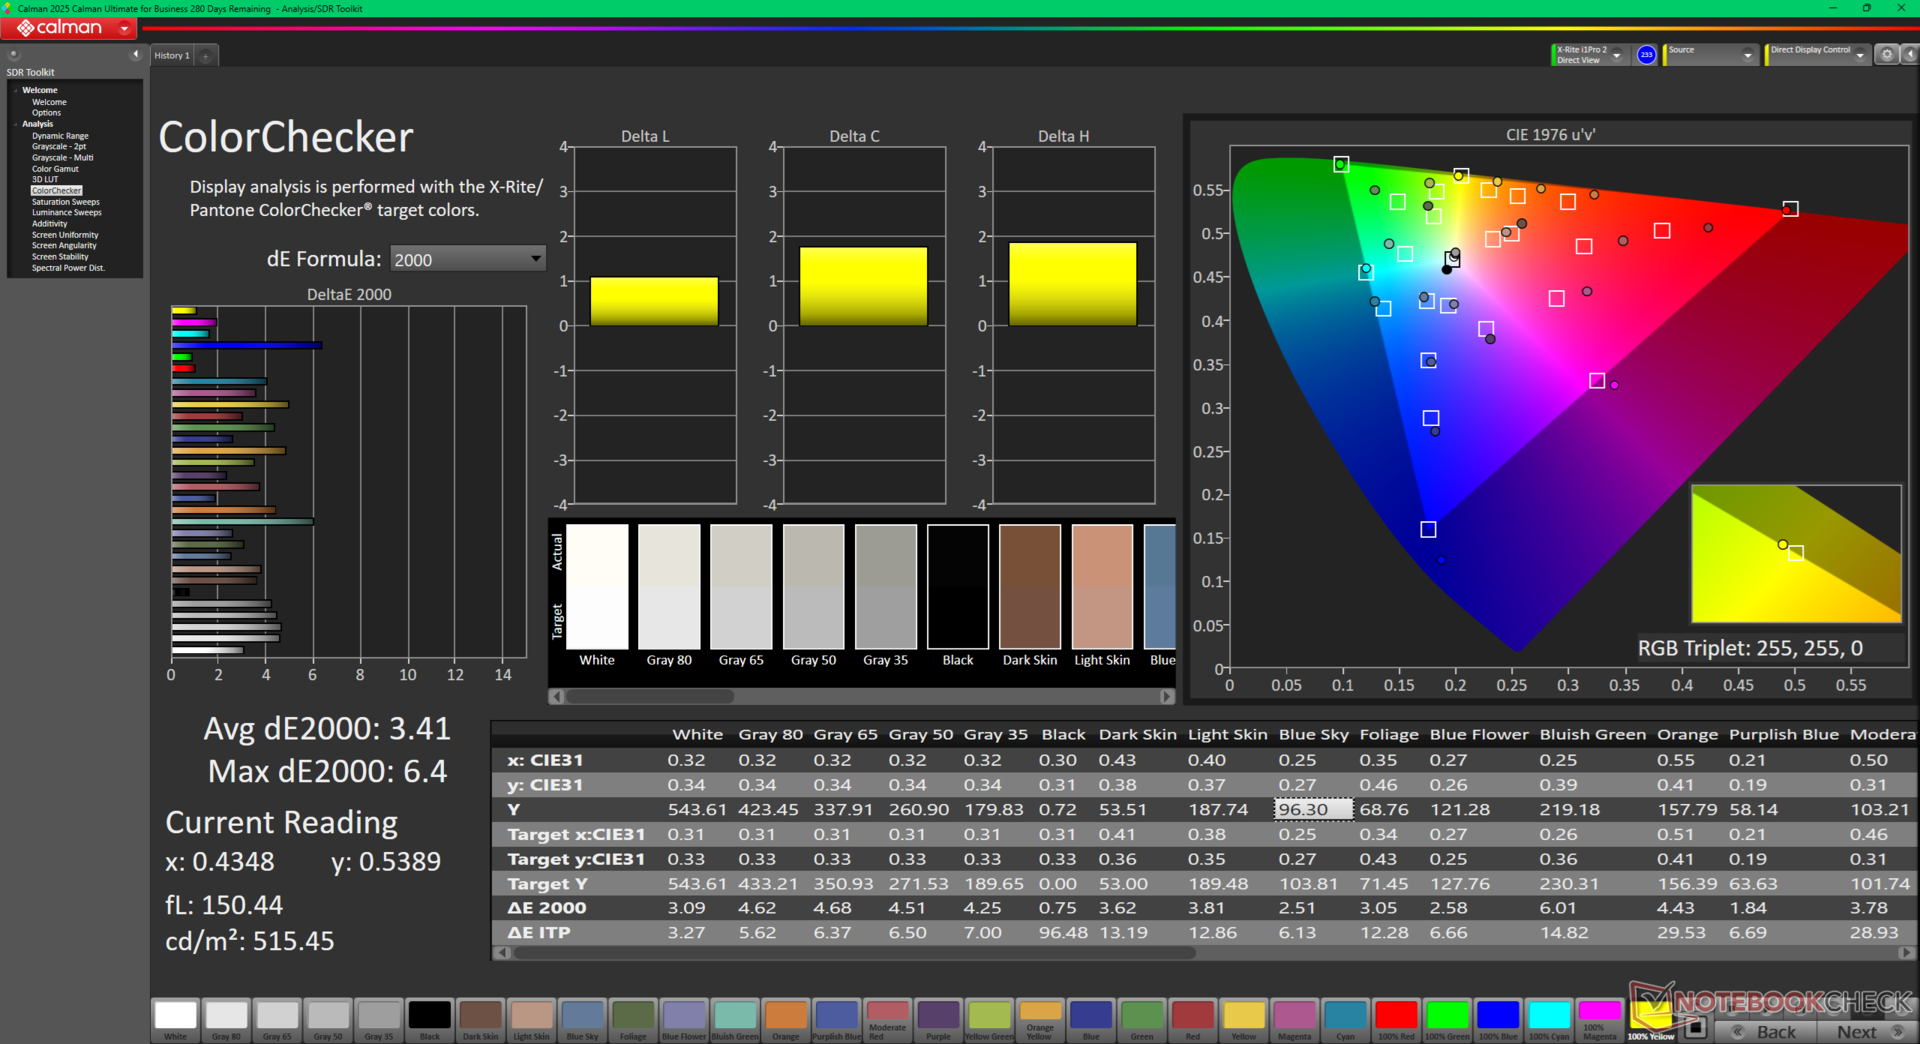
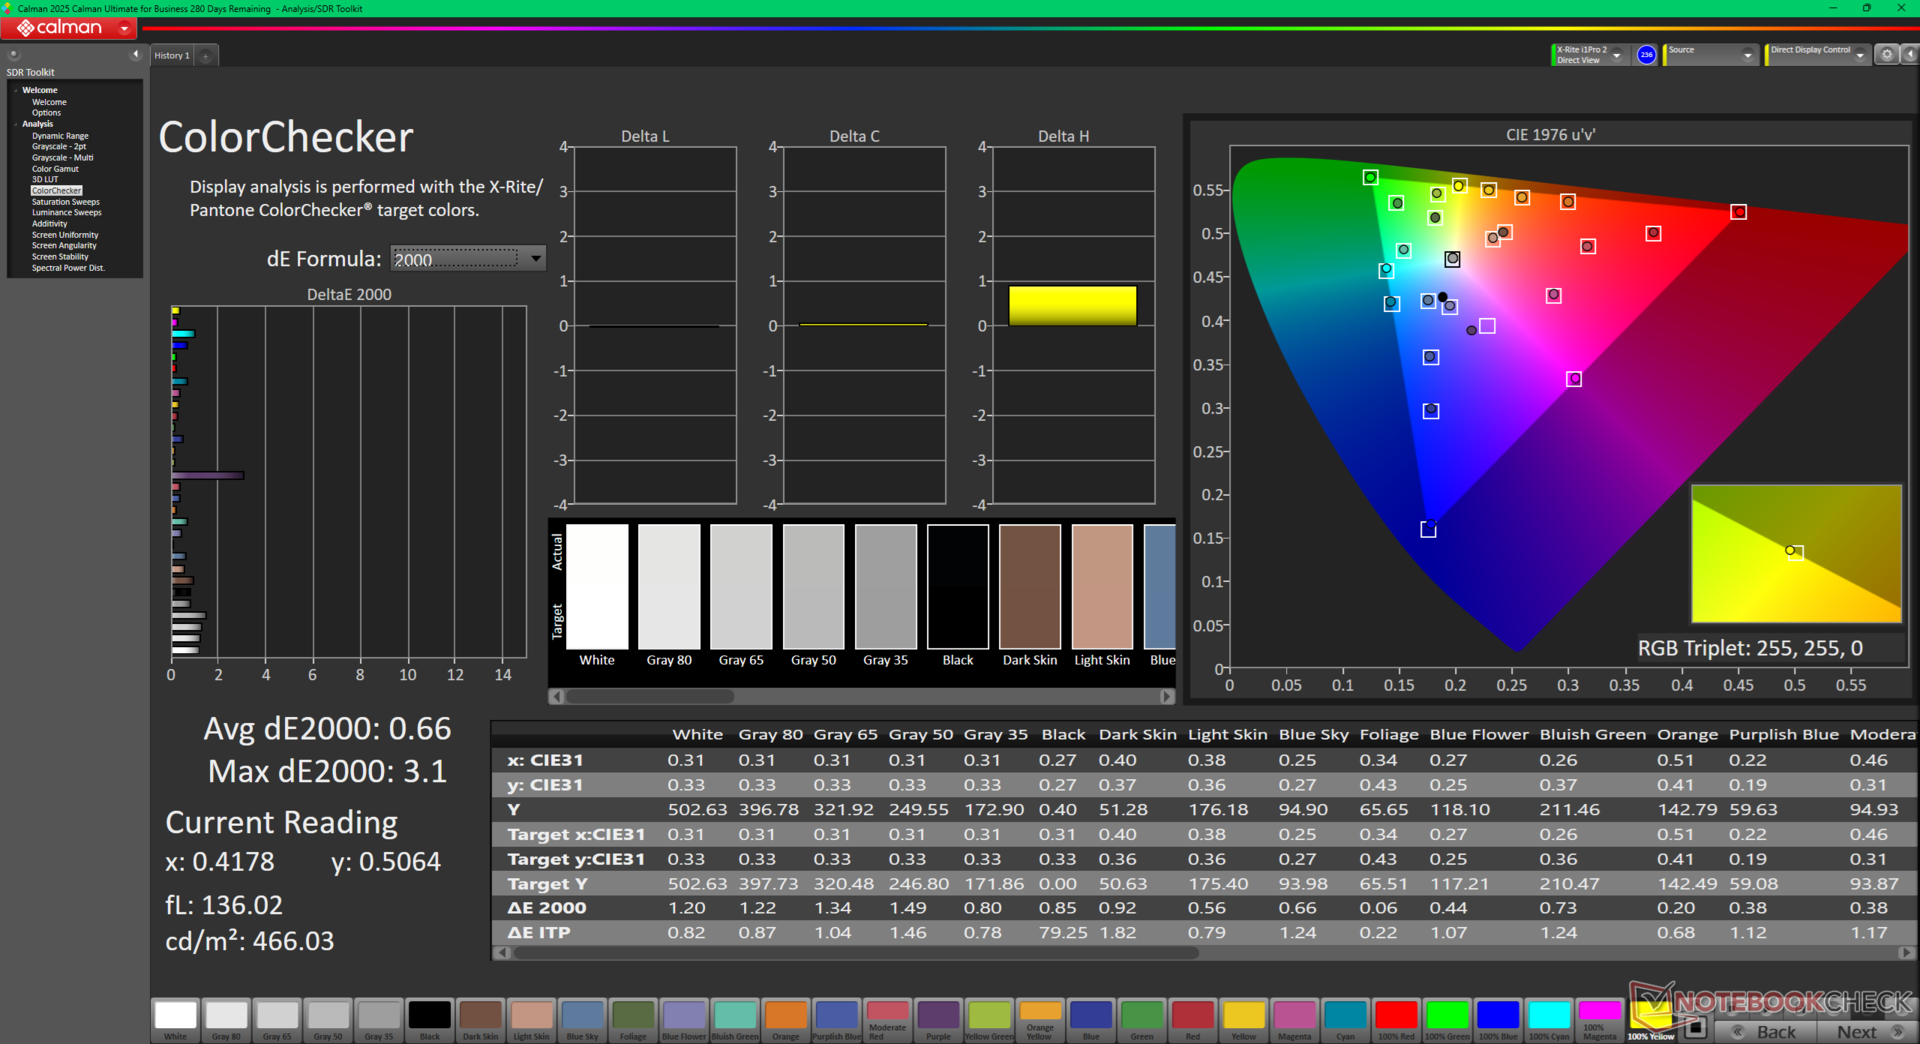
ΔE ColorChecker Calman: 3.41 | ∀{0.5-29.43 Ø4.73}
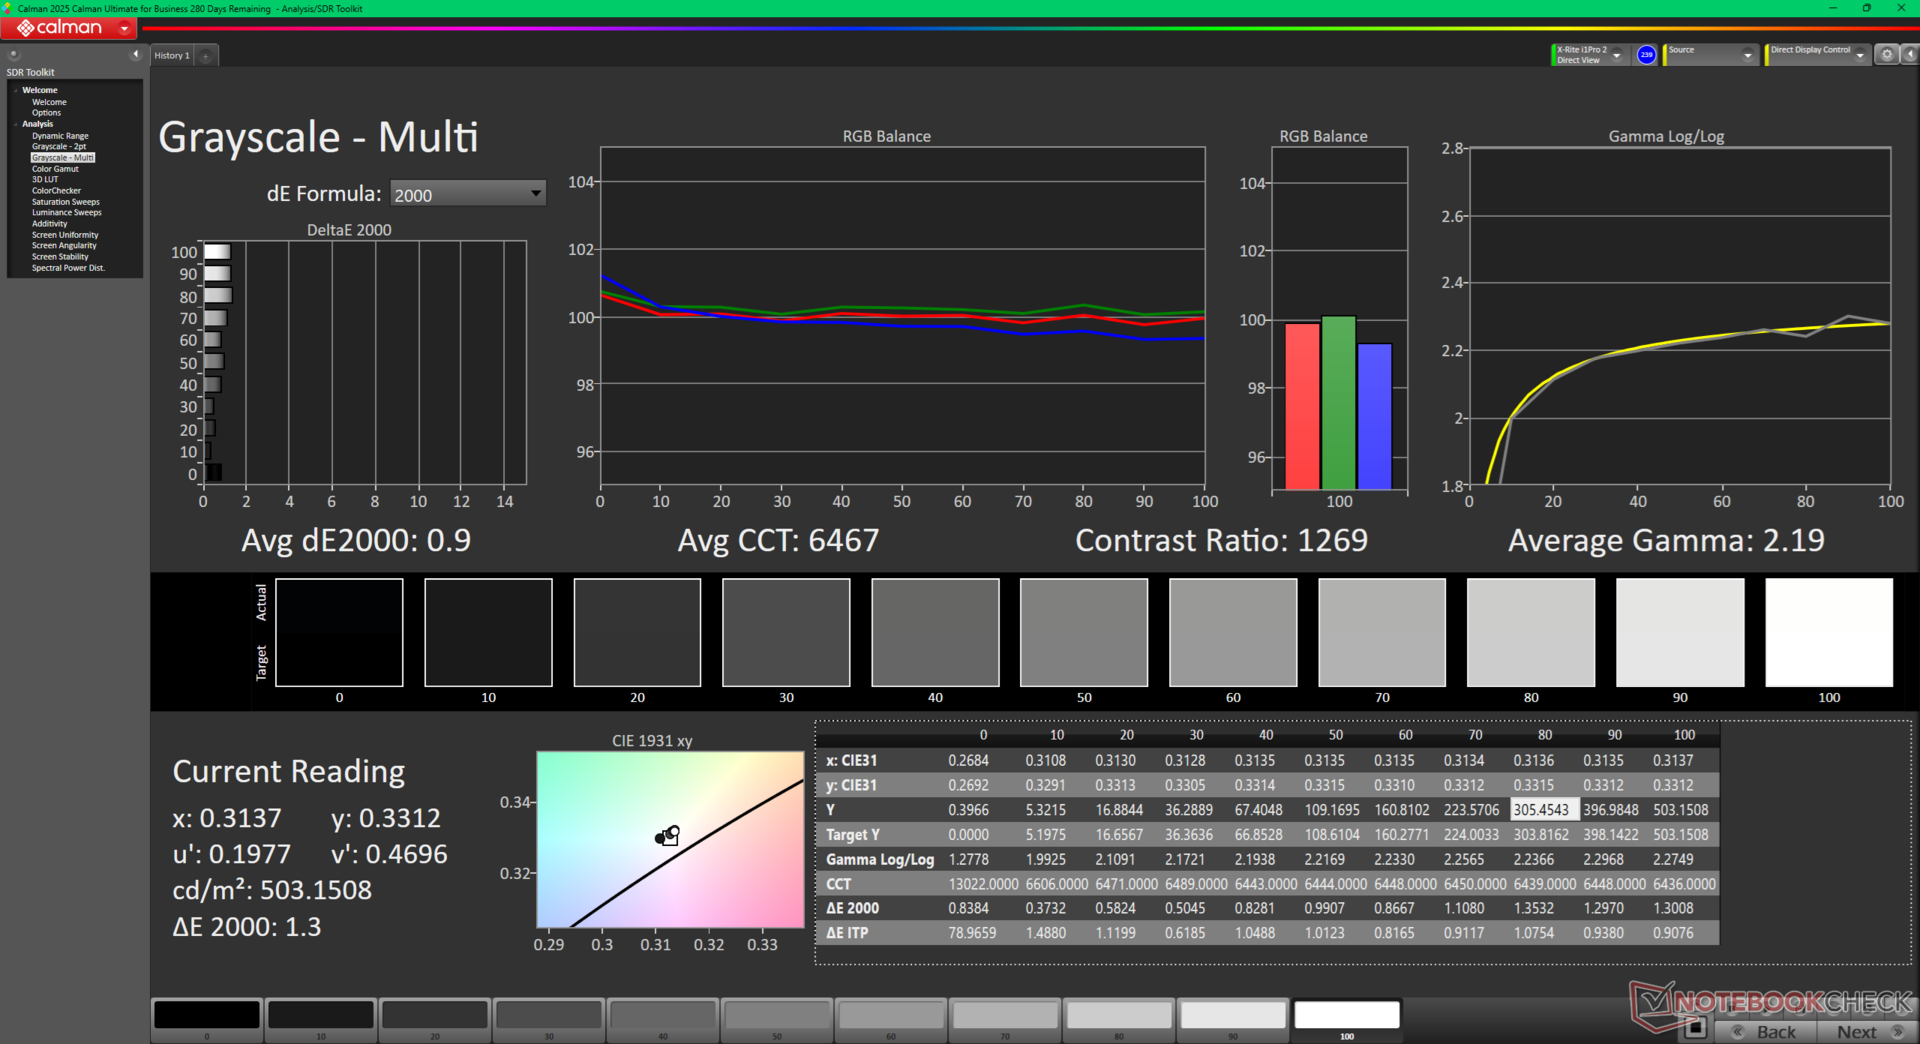
calibrated: 0.66
ΔE Greyscale Calman: 3.4 | ∀{0.09-98 Ø4.98}
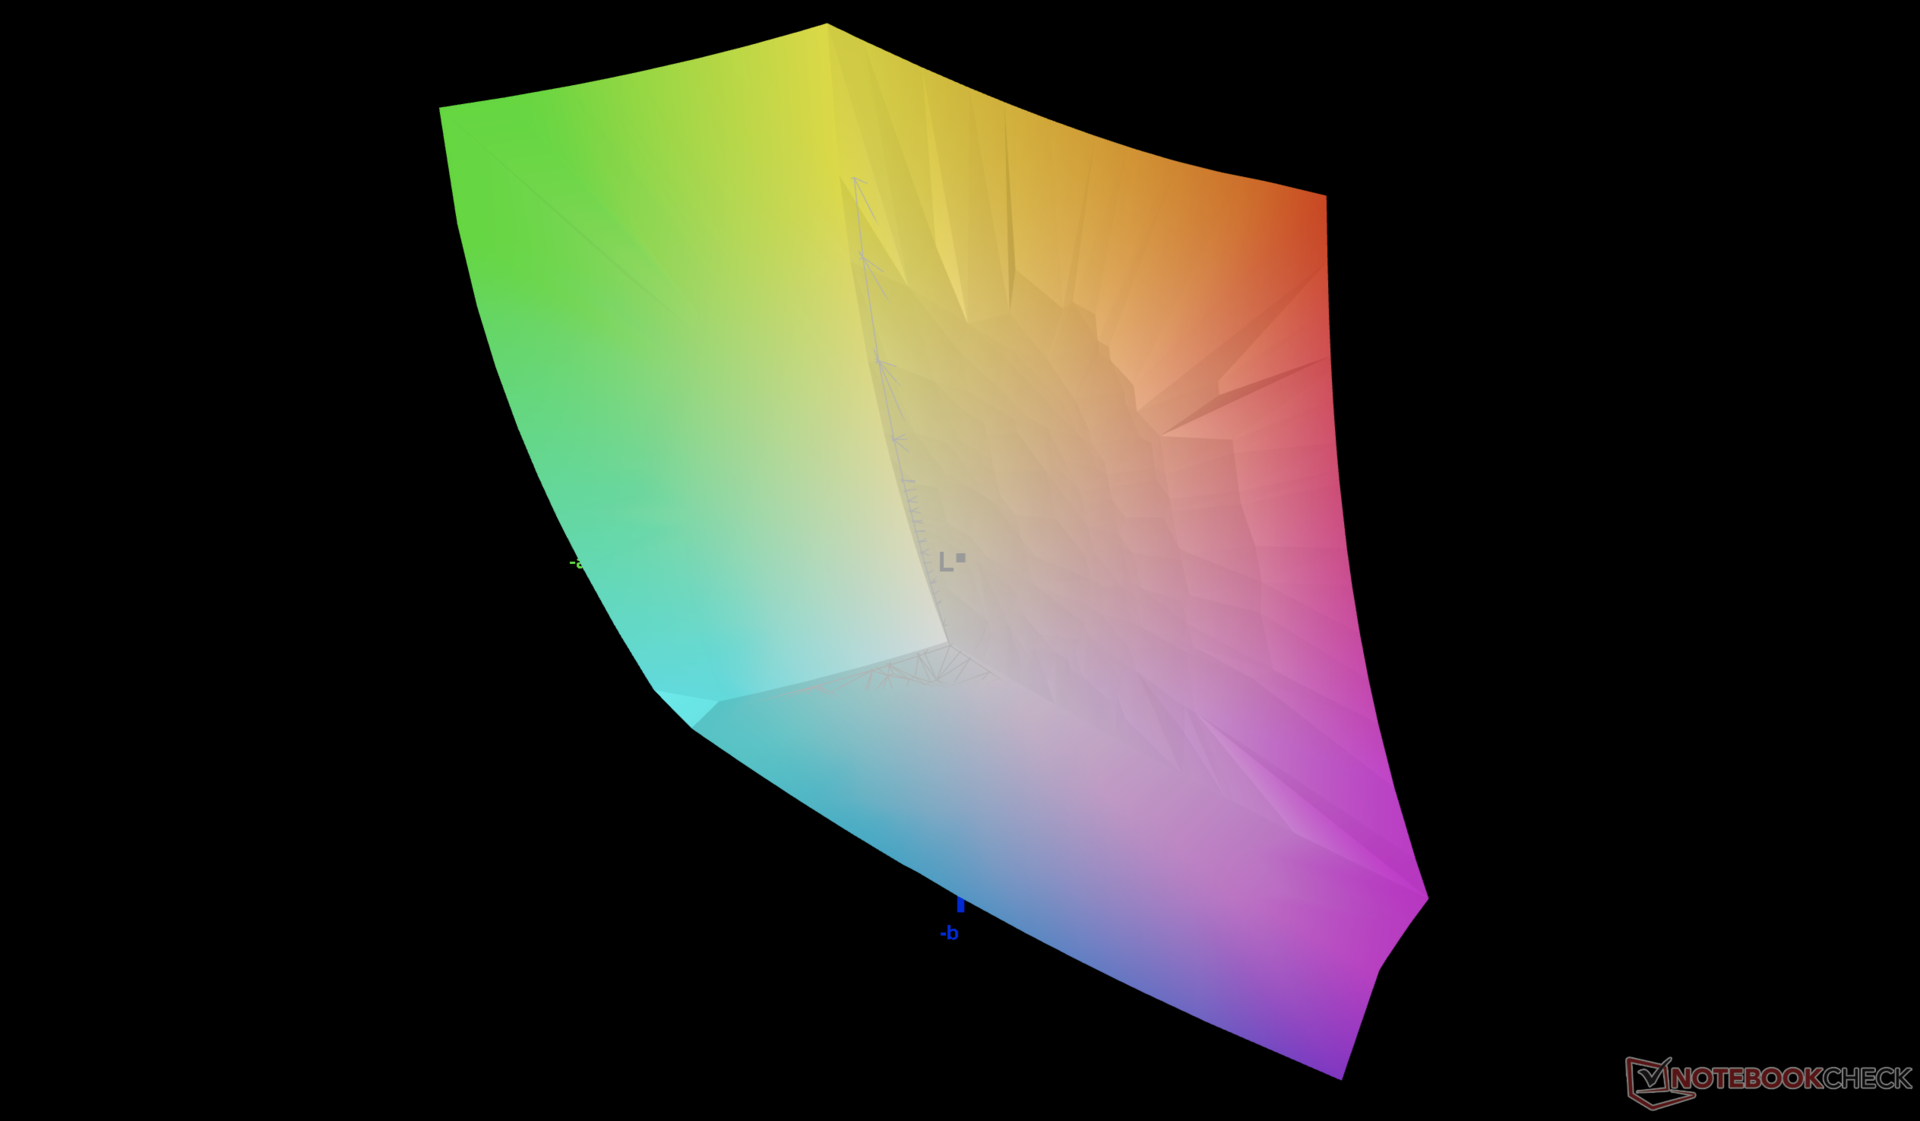
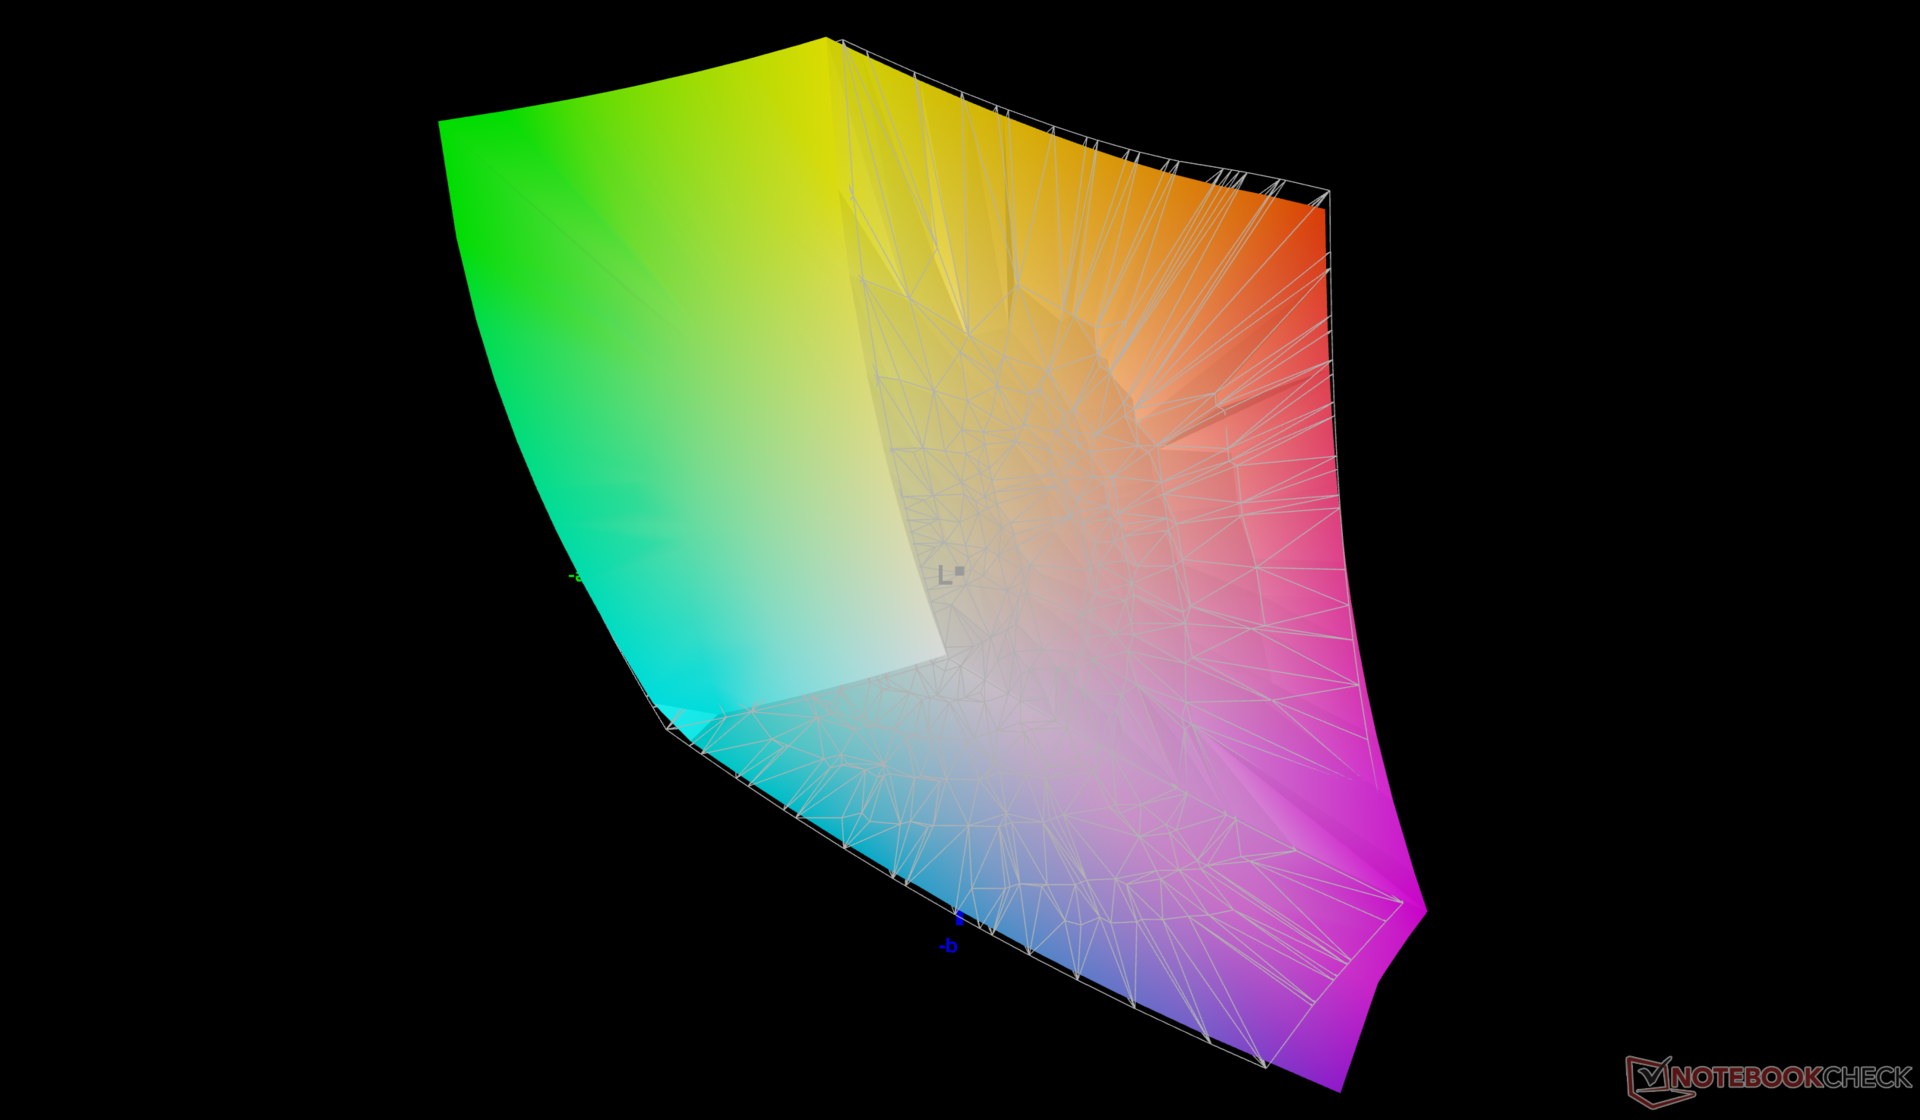
86.3% AdobeRGB 1998 (Argyll 3D)
99.9% sRGB (Argyll 3D)
98.1% Display P3 (Argyll 3D)
Gamma: 2.3
CCT: 6070 K
| MSI Vector A18 HX A9W AU Optronics B180QAN01.0, IPS, 2560x1600, 18", 240 Hz | MSI Raider 18 HX A14V AU Optronics B180ZAN1.0, Mini-LED, 3840x2400, 18", 120 Hz | Asus Strix Scar 18 G835LX N180QDM-NM2, Mini-LED, 2560x1600, 18", 240 Hz | Razer Blade 18 2024 RZ09-0509 BOE NE180QDM-NM1, Mini-LED, 2560x1600, 18", 300 Hz | Alienware m18 R2 BOE NE18NZ1, IPS, 2560x1600, 18", 165 Hz | Acer Predator Helios 18 PH18-72-98MW B180QAN01.2 (AUO45A8), Mini-LED, 2560x1600, 18", 250 Hz | |
|---|---|---|---|---|---|---|
| Display | -1% | 1% | 1% | 1% | 3% | |
| Display P3 Coverage (%) | 98.1 | 96.6 -2% | 99 1% | 99 1% | 97.8 0% | 99.7 2% |
| sRGB Coverage (%) | 99.9 | 99.9 0% | 100 0% | 100 0% | 99.5 0% | 100 0% |
| AdobeRGB 1998 Coverage (%) | 86.3 | 84.8 -2% | 87.2 1% | 86.9 1% | 88.9 3% | 91.6 6% |
| Response Times | -489% | -50% | -75% | -26% | -102% | |
| Response Time Grey 50% / Grey 80% * (ms) | 4.3 ? | 10.4 ? -142% | 7.4 ? -72% | 7.6 ? -77% | 5.3 ? -23% | 8 ? -86% |
| Response Time Black / White * (ms) | 8.1 ? | 75.8 ? -836% | 10.4 ? -28% | 14 ? -73% | 10.4 ? -28% | 17.6 ? -117% |
| PWM Frequency (Hz) | 2606.2 ? | 20610 ? | 26444 ? | 4832 ? | ||
| PWM Amplitude * (%) | 90 | 100 | ||||
| Screen | -55% | 131% | 19% | -0% | 200% | |
| Brightness middle (cd/m²) | 543 | 575.7 6% | 764 41% | 605.4 11% | 271.8 -50% | 722 33% |
| Brightness (cd/m²) | 502 | 574 14% | 747 49% | 600 20% | 275 -45% | 724 44% |
| Brightness Distribution (%) | 86 | 94 9% | 93 8% | 97 13% | 78 -9% | 93 8% |
| Black Level * (cd/m²) | 0.56 | 0.1 82% | 0.62 -11% | 0.27 52% | 0.04 93% | |
| Contrast (:1) | 970 | 7640 688% | 976 1% | 1007 4% | 18050 1761% | |
| Colorchecker dE 2000 * | 3.41 | 3.56 -4% | 1.2 65% | 1.53 55% | 2.48 27% | 3.4 -0% |
| Colorchecker dE 2000 max. * | 6.4 | 8.64 -35% | 2.8 56% | 4.15 35% | 5.59 13% | 5.32 17% |
| Colorchecker dE 2000 calibrated * | 0.66 | 2.69 -308% | 0.56 15% | 1.6 -142% | ||
| Greyscale dE 2000 * | 3.4 | 5.6 -65% | 1.5 56% | 2.6 24% | 3.7 -9% | 3.8 -12% |
| Gamma | 2.3 96% | 2.34 94% | 2.17 101% | 2.22 99% | 2.2 100% | 2.383 92% |
| CCT | 6070 107% | 7872 83% | 6556 99% | 6843 95% | 6355 102% | 7051 92% |
| Total Average (Program / Settings) | -182% /
-114% | 27% /
73% | -18% /
0% | -8% /
-4% | 34% /
115% |
* ... smaller is better
Display Response Times
| ↔ Response Time Black to White | ||
|---|---|---|
| 8.1 ms ... rise ↗ and fall ↘ combined | ↗ 4 ms rise | 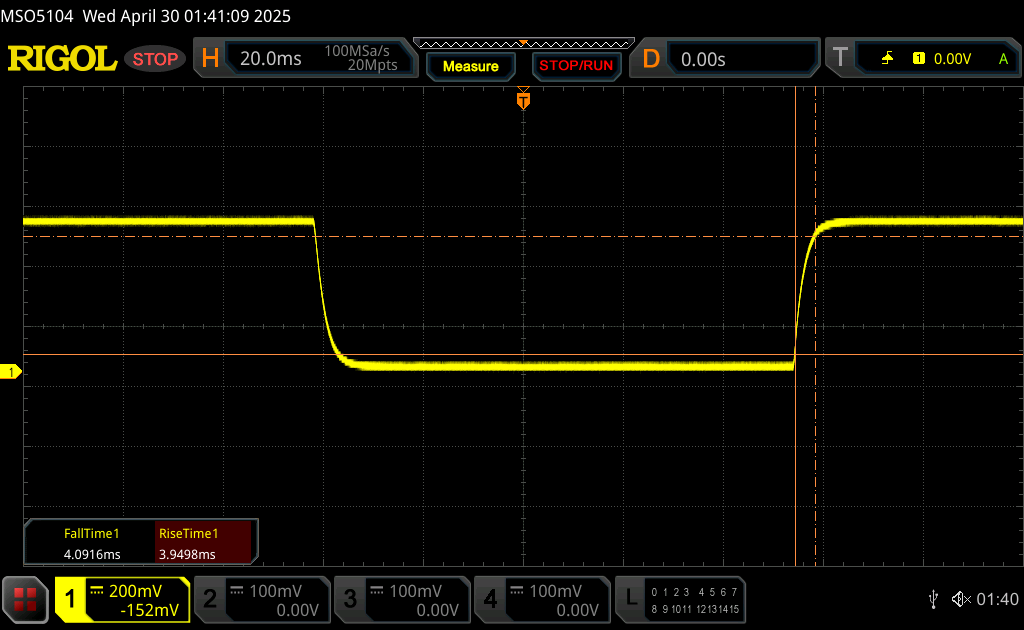 |
| ↘ 4.1 ms fall | ||
| The screen shows fast response rates in our tests and should be suited for gaming. In comparison, all tested devices range from 0.1 (minimum) to 240 (maximum) ms. » 23 % of all devices are better. This means that the measured response time is better than the average of all tested devices (19.9 ms). | ||
| ↔ Response Time 50% Grey to 80% Grey | ||
| 4.3 ms ... rise ↗ and fall ↘ combined | ↗ 1.8 ms rise | 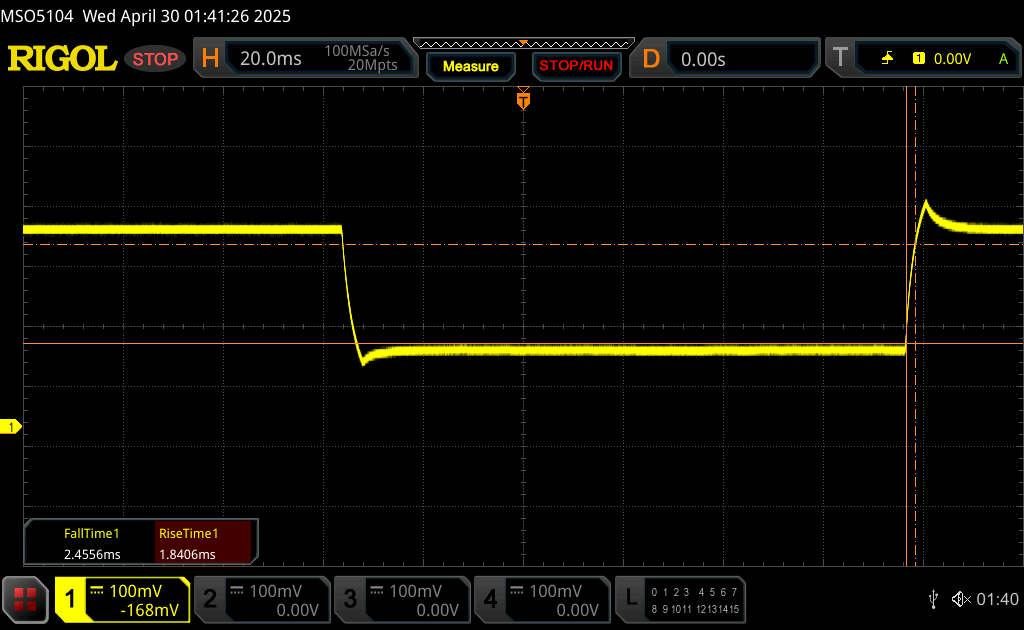 |
| ↘ 2.5 ms fall | ||
| The screen shows very fast response rates in our tests and should be very well suited for fast-paced gaming. In comparison, all tested devices range from 0.165 (minimum) to 636 (maximum) ms. » 16 % of all devices are better. This means that the measured response time is better than the average of all tested devices (31.1 ms). | ||
Screen Flickering / PWM (Pulse-Width Modulation)
| Screen flickering / PWM not detected |  | ||
In comparison: 52 % of all tested devices do not use PWM to dim the display. If PWM was detected, an average of 7819 (minimum: 5 - maximum: 343500) Hz was measured. | |||
Performance
Testing Conditions
We set MSI Center to Extreme Performance mode and discrete GPU mode prior to running the benchmarks below.
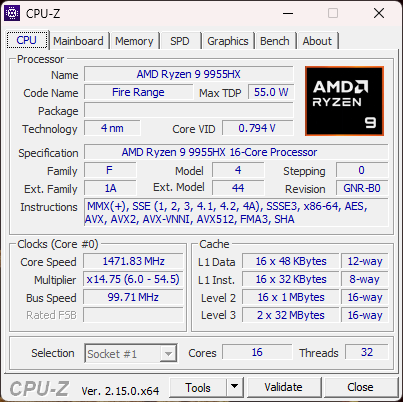
Processor
The Ryzen 9 9955HX is on par with the Core Ultra 9 275HX when it comes to multi-threaded loads while being up to 20 percent slower in single-threaded applications. Most notably, it outperforms the previous generation Core i9-14900HX by 30 percent without needing to draw excessively more power in the process.
Note that this AMD processor lacks an NPU which the target audience of mainstream gamers may not mind.
Cinebench R15 Multi Loop
Cinebench R23: Multi Core | Single Core
Cinebench R20: CPU (Multi Core) | CPU (Single Core)
Cinebench R15: CPU Multi 64Bit | CPU Single 64Bit
Blender: v2.79 BMW27 CPU
7-Zip 18.03: 7z b 4 | 7z b 4 -mmt1
Geekbench 6.6: Multi-Core | Single-Core
Geekbench 5.5: Multi-Core | Single-Core
HWBOT x265 Benchmark v2.2: 4k Preset
LibreOffice : 20 Documents To PDF
R Benchmark 2.5: Overall mean
| CPU Performance rating | |
| Asus Strix Scar 18 G835LX | |
| Average AMD Ryzen 9 9955HX | |
| MSI Vector A18 HX A9W | |
| Alienware m18 R1 AMD | |
| MSI Raider 18 HX A14V | |
| Alienware m18 R1 -2! | |
| Acer Predator Helios 18 N23Q2 | |
| Asus ROG Strix G18 G814JI -2! | |
| Cinebench R23 / Multi Core | |
| MSI Vector A18 HX A9W | |
| Asus Strix Scar 18 G835LX | |
| Average AMD Ryzen 9 9955HX (35960 - 39690, n=9) | |
| Alienware m18 R1 AMD | |
| Alienware m18 R1 | |
| Acer Predator Helios 18 N23Q2 | |
| MSI Raider 18 HX A14V | |
| Asus ROG Strix G18 G814JI | |
| Cinebench R23 / Single Core | |
| Asus Strix Scar 18 G835LX | |
| MSI Raider 18 HX A14V | |
| Average AMD Ryzen 9 9955HX (1828 - 2183, n=9) | |
| Alienware m18 R1 | |
| Acer Predator Helios 18 N23Q2 | |
| Alienware m18 R1 AMD | |
| Asus ROG Strix G18 G814JI | |
| MSI Vector A18 HX A9W | |
| Cinebench R20 / CPU (Multi Core) | |
| MSI Vector A18 HX A9W | |
| Asus Strix Scar 18 G835LX | |
| Average AMD Ryzen 9 9955HX (13963 - 15524, n=9) | |
| Alienware m18 R1 AMD | |
| Alienware m18 R1 | |
| Acer Predator Helios 18 N23Q2 | |
| MSI Raider 18 HX A14V | |
| Asus ROG Strix G18 G814JI | |
| Cinebench R20 / CPU (Single Core) | |
| Asus Strix Scar 18 G835LX | |
| MSI Raider 18 HX A14V | |
| Average AMD Ryzen 9 9955HX (819 - 856, n=9) | |
| MSI Vector A18 HX A9W | |
| Alienware m18 R1 | |
| Acer Predator Helios 18 N23Q2 | |
| Alienware m18 R1 AMD | |
| Asus ROG Strix G18 G814JI | |
| Cinebench R15 / CPU Multi 64Bit | |
| MSI Vector A18 HX A9W | |
| Asus Strix Scar 18 G835LX | |
| Average AMD Ryzen 9 9955HX (5624 - 6103, n=9) | |
| Alienware m18 R1 AMD | |
| Alienware m18 R1 | |
| MSI Raider 18 HX A14V | |
| Acer Predator Helios 18 N23Q2 | |
| Asus ROG Strix G18 G814JI | |
| Cinebench R15 / CPU Single 64Bit | |
| Asus Strix Scar 18 G835LX | |
| Average AMD Ryzen 9 9955HX (320 - 338, n=9) | |
| MSI Vector A18 HX A9W | |
| MSI Raider 18 HX A14V | |
| Alienware m18 R1 AMD | |
| Alienware m18 R1 | |
| Acer Predator Helios 18 N23Q2 | |
| Asus ROG Strix G18 G814JI | |
| Blender / v2.79 BMW27 CPU | |
| Asus ROG Strix G18 G814JI | |
| Acer Predator Helios 18 N23Q2 | |
| MSI Raider 18 HX A14V | |
| Alienware m18 R1 | |
| Alienware m18 R1 AMD | |
| Asus Strix Scar 18 G835LX | |
| Average AMD Ryzen 9 9955HX (80 - 91, n=9) | |
| MSI Vector A18 HX A9W | |
| 7-Zip 18.03 / 7z b 4 | |
| MSI Vector A18 HX A9W | |
| Alienware m18 R1 AMD | |
| Average AMD Ryzen 9 9955HX (132435 - 144064, n=9) | |
| Alienware m18 R1 | |
| Asus Strix Scar 18 G835LX | |
| MSI Raider 18 HX A14V | |
| Acer Predator Helios 18 N23Q2 | |
| Asus ROG Strix G18 G814JI | |
| 7-Zip 18.03 / 7z b 4 -mmt1 | |
| Alienware m18 R1 AMD | |
| Average AMD Ryzen 9 9955HX (7061 - 7462, n=9) | |
| MSI Vector A18 HX A9W | |
| Asus Strix Scar 18 G835LX | |
| Acer Predator Helios 18 N23Q2 | |
| Alienware m18 R1 | |
| MSI Raider 18 HX A14V | |
| Asus ROG Strix G18 G814JI | |
| Geekbench 6.6 / Multi-Core | |
| Asus Strix Scar 18 G835LX | |
| Average AMD Ryzen 9 9955HX (16313 - 19725, n=9) | |
| Acer Predator Helios 18 N23Q2 | |
| MSI Raider 18 HX A14V | |
| Alienware m18 R1 AMD | |
| MSI Vector A18 HX A9W | |
| Geekbench 6.6 / Single-Core | |
| Average AMD Ryzen 9 9955HX (3156 - 3259, n=9) | |
| MSI Vector A18 HX A9W | |
| Asus Strix Scar 18 G835LX | |
| MSI Raider 18 HX A14V | |
| Acer Predator Helios 18 N23Q2 | |
| Alienware m18 R1 AMD | |
| Geekbench 5.5 / Multi-Core | |
| Asus Strix Scar 18 G835LX | |
| MSI Vector A18 HX A9W | |
| Alienware m18 R1 | |
| Average AMD Ryzen 9 9955HX (20576 - 22716, n=9) | |
| Acer Predator Helios 18 N23Q2 | |
| MSI Raider 18 HX A14V | |
| Alienware m18 R1 AMD | |
| Asus ROG Strix G18 G814JI | |
| Geekbench 5.5 / Single-Core | |
| Average AMD Ryzen 9 9955HX (2307 - 2474, n=9) | |
| MSI Vector A18 HX A9W | |
| Asus Strix Scar 18 G835LX | |
| MSI Raider 18 HX A14V | |
| Alienware m18 R1 AMD | |
| Alienware m18 R1 | |
| Acer Predator Helios 18 N23Q2 | |
| Asus ROG Strix G18 G814JI | |
| HWBOT x265 Benchmark v2.2 / 4k Preset | |
| MSI Vector A18 HX A9W | |
| Asus Strix Scar 18 G835LX | |
| Average AMD Ryzen 9 9955HX (38.9 - 43, n=9) | |
| Alienware m18 R1 AMD | |
| Alienware m18 R1 | |
| MSI Raider 18 HX A14V | |
| Acer Predator Helios 18 N23Q2 | |
| Asus ROG Strix G18 G814JI | |
| LibreOffice / 20 Documents To PDF | |
| Asus ROG Strix G18 G814JI | |
| Acer Predator Helios 18 N23Q2 | |
| Alienware m18 R1 | |
| Average AMD Ryzen 9 9955HX (42.2 - 52.4, n=9) | |
| MSI Vector A18 HX A9W | |
| Alienware m18 R1 AMD | |
| Asus Strix Scar 18 G835LX | |
| MSI Raider 18 HX A14V | |
| R Benchmark 2.5 / Overall mean | |
| Asus ROG Strix G18 G814JI | |
| Alienware m18 R1 AMD | |
| Acer Predator Helios 18 N23Q2 | |
| Asus Strix Scar 18 G835LX | |
| Alienware m18 R1 | |
| MSI Raider 18 HX A14V | |
| Average AMD Ryzen 9 9955HX (0.3439 - 0.3737, n=9) | |
| MSI Vector A18 HX A9W | |
* ... smaller is better
AIDA64: FP32 Ray-Trace | FPU Julia | CPU SHA3 | CPU Queen | FPU SinJulia | FPU Mandel | CPU AES | CPU ZLib | FP64 Ray-Trace | CPU PhotoWorxx
| Performance rating | |
| MSI Vector A18 HX A9W | |
| Average AMD Ryzen 9 9955HX | |
| Asus Strix Scar 18 G835LX | |
| Alienware m18 R2 | |
| MSI Raider 18 HX A14V | |
| Razer Blade 18 2024 RZ09-0509 | |
| Acer Predator Helios 18 PH18-72-98MW | |
| AIDA64 / FP32 Ray-Trace | |
| MSI Vector A18 HX A9W | |
| Average AMD Ryzen 9 9955HX (66596 - 85542, n=9) | |
| Asus Strix Scar 18 G835LX | |
| Alienware m18 R2 | |
| MSI Raider 18 HX A14V | |
| Razer Blade 18 2024 RZ09-0509 | |
| Acer Predator Helios 18 PH18-72-98MW | |
| AIDA64 / FPU Julia | |
| MSI Vector A18 HX A9W | |
| Average AMD Ryzen 9 9955HX (191535 - 232031, n=9) | |
| Asus Strix Scar 18 G835LX | |
| Alienware m18 R2 | |
| MSI Raider 18 HX A14V | |
| Razer Blade 18 2024 RZ09-0509 | |
| Acer Predator Helios 18 PH18-72-98MW | |
| AIDA64 / CPU SHA3 | |
| MSI Vector A18 HX A9W | |
| Asus Strix Scar 18 G835LX | |
| Average AMD Ryzen 9 9955HX (8489 - 9780, n=9) | |
| Alienware m18 R2 | |
| MSI Raider 18 HX A14V | |
| Razer Blade 18 2024 RZ09-0509 | |
| Acer Predator Helios 18 PH18-72-98MW | |
| AIDA64 / CPU Queen | |
| MSI Vector A18 HX A9W | |
| Average AMD Ryzen 9 9955HX (153027 - 164154, n=9) | |
| MSI Raider 18 HX A14V | |
| Asus Strix Scar 18 G835LX | |
| Alienware m18 R2 | |
| Acer Predator Helios 18 PH18-72-98MW | |
| Razer Blade 18 2024 RZ09-0509 | |
| AIDA64 / FPU SinJulia | |
| MSI Vector A18 HX A9W | |
| Average AMD Ryzen 9 9955HX (29876 - 32647, n=9) | |
| MSI Raider 18 HX A14V | |
| Alienware m18 R2 | |
| Razer Blade 18 2024 RZ09-0509 | |
| Acer Predator Helios 18 PH18-72-98MW | |
| Asus Strix Scar 18 G835LX | |
| AIDA64 / FPU Mandel | |
| MSI Vector A18 HX A9W | |
| Average AMD Ryzen 9 9955HX (101131 - 128721, n=9) | |
| Asus Strix Scar 18 G835LX | |
| Alienware m18 R2 | |
| MSI Raider 18 HX A14V | |
| Razer Blade 18 2024 RZ09-0509 | |
| Acer Predator Helios 18 PH18-72-98MW | |
| AIDA64 / CPU AES | |
| Average AMD Ryzen 9 9955HX (146979 - 218385, n=9) | |
| MSI Vector A18 HX A9W | |
| Asus Strix Scar 18 G835LX | |
| Alienware m18 R2 | |
| MSI Raider 18 HX A14V | |
| Razer Blade 18 2024 RZ09-0509 | |
| Acer Predator Helios 18 PH18-72-98MW | |
| AIDA64 / CPU ZLib | |
| MSI Vector A18 HX A9W | |
| Average AMD Ryzen 9 9955HX (2186 - 2531, n=9) | |
| Asus Strix Scar 18 G835LX | |
| Alienware m18 R2 | |
| MSI Raider 18 HX A14V | |
| Razer Blade 18 2024 RZ09-0509 | |
| Acer Predator Helios 18 PH18-72-98MW | |
| AIDA64 / FP64 Ray-Trace | |
| MSI Vector A18 HX A9W | |
| Average AMD Ryzen 9 9955HX (35252 - 45446, n=9) | |
| Asus Strix Scar 18 G835LX | |
| Alienware m18 R2 | |
| MSI Raider 18 HX A14V | |
| Razer Blade 18 2024 RZ09-0509 | |
| Acer Predator Helios 18 PH18-72-98MW | |
| AIDA64 / CPU PhotoWorxx | |
| Asus Strix Scar 18 G835LX | |
| Alienware m18 R2 | |
| Razer Blade 18 2024 RZ09-0509 | |
| Acer Predator Helios 18 PH18-72-98MW | |
| MSI Vector A18 HX A9W | |
| Average AMD Ryzen 9 9955HX (35974 - 42495, n=9) | |
| MSI Raider 18 HX A14V | |
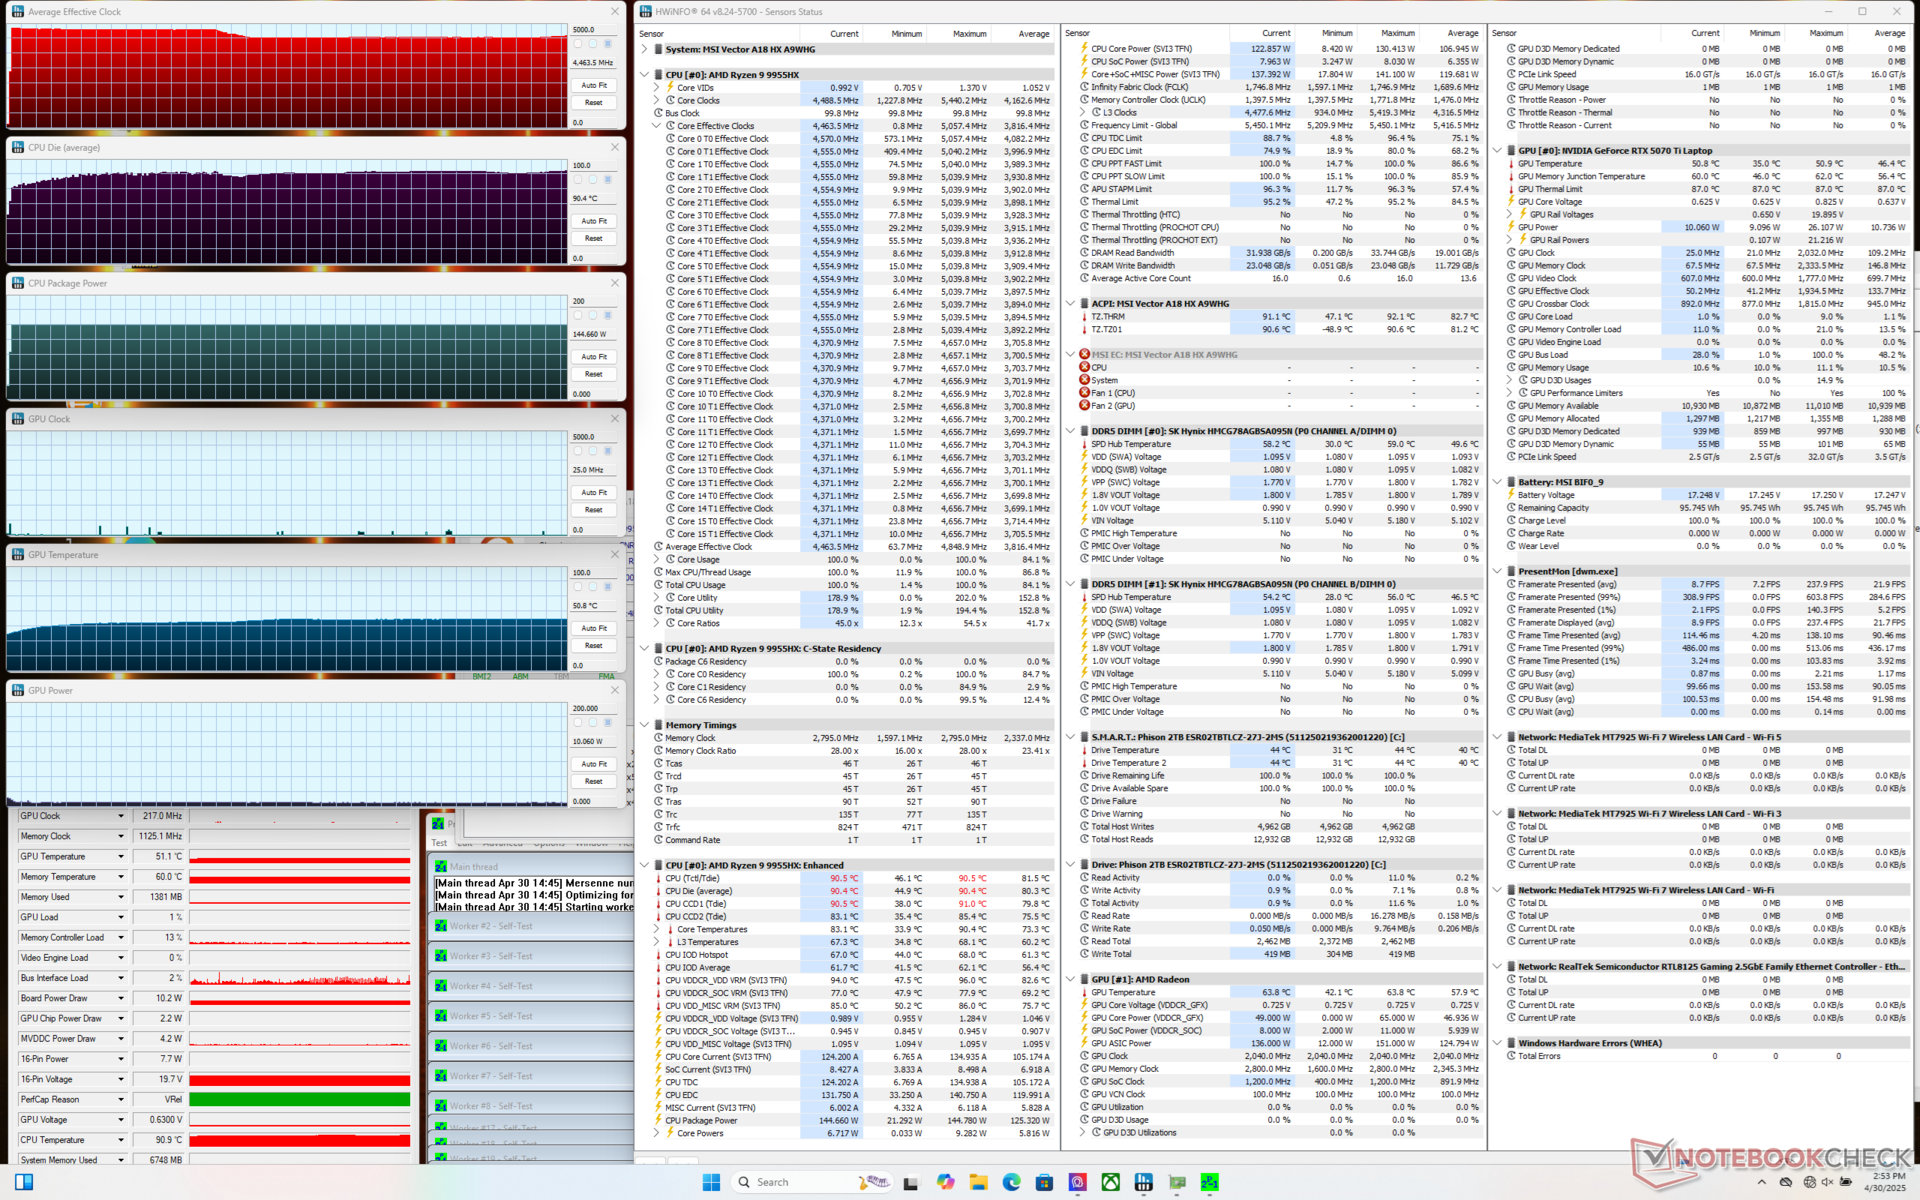
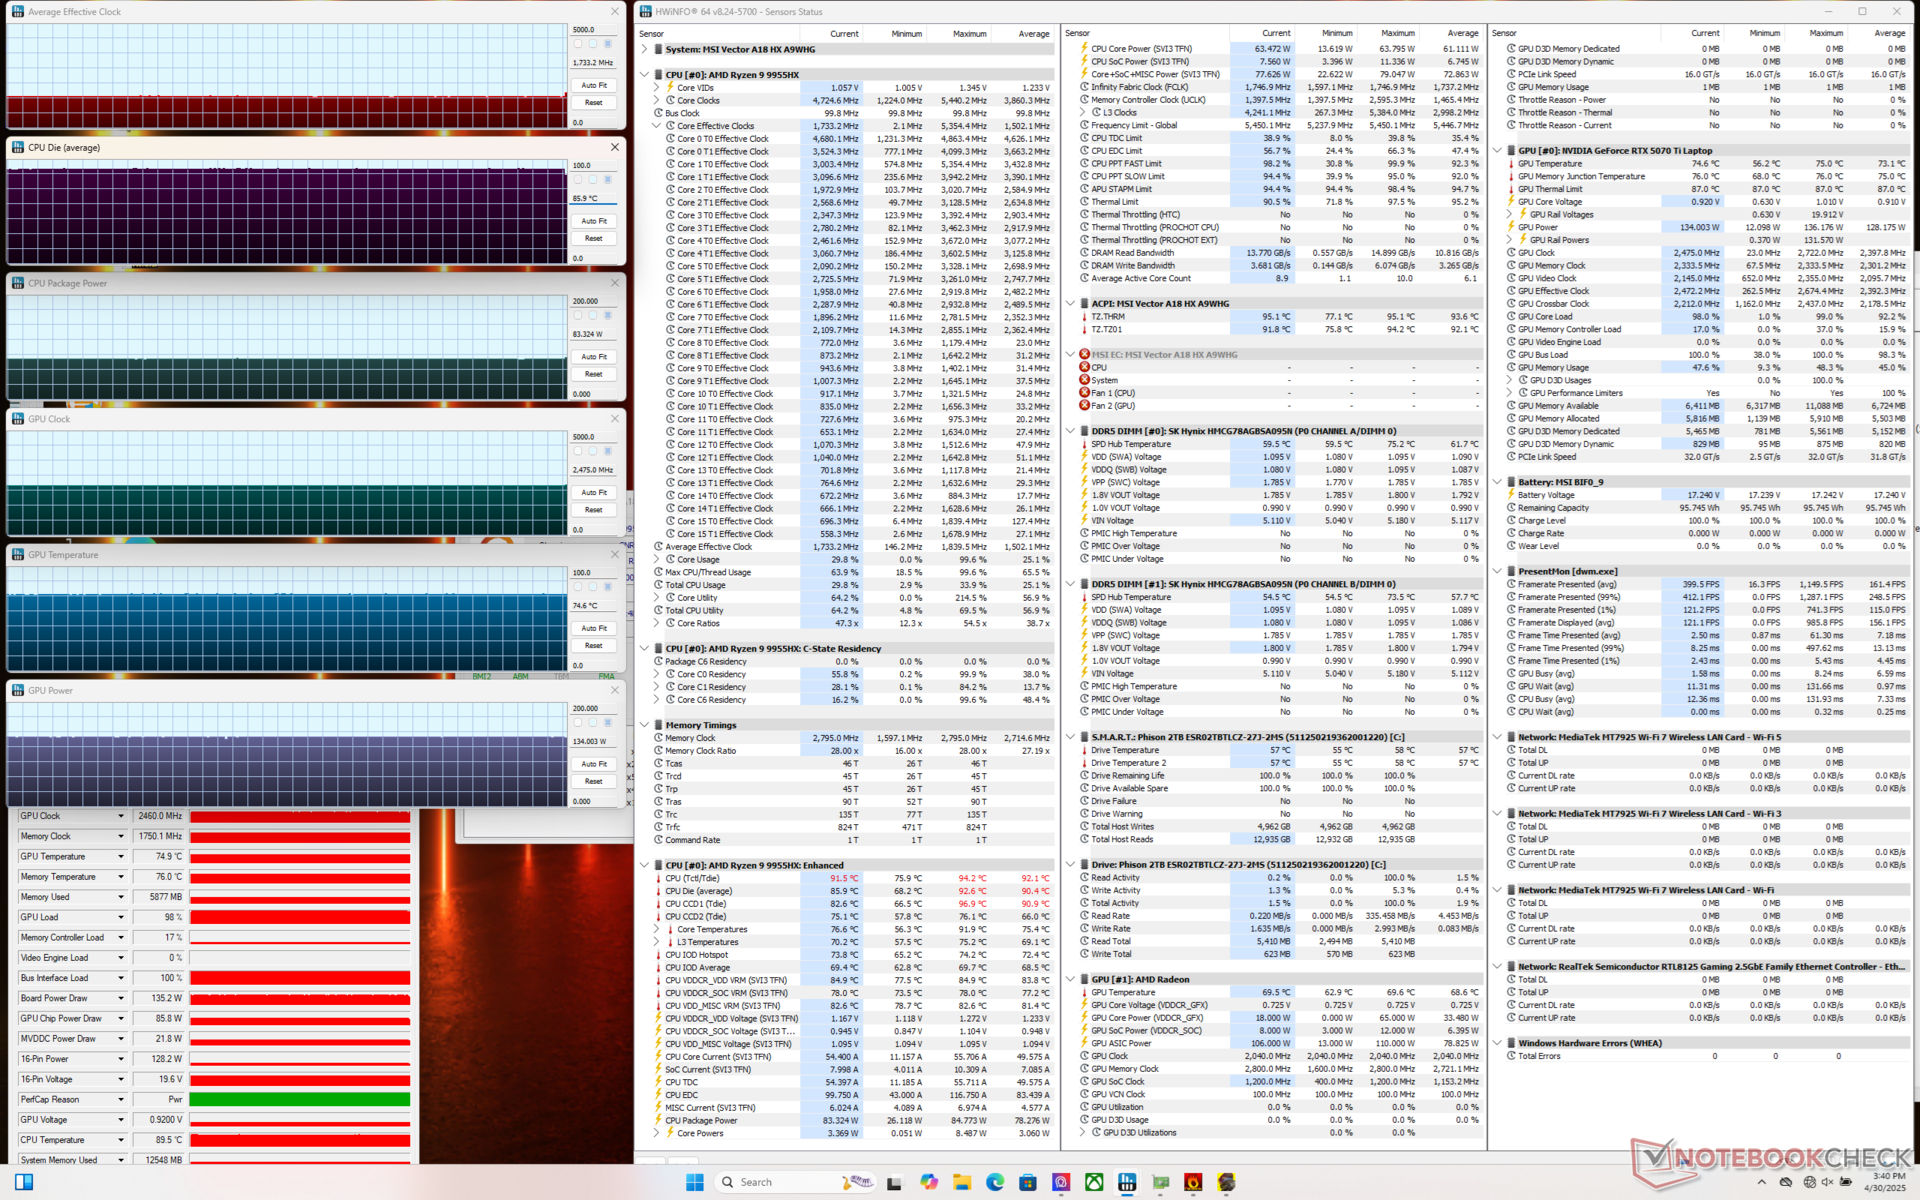
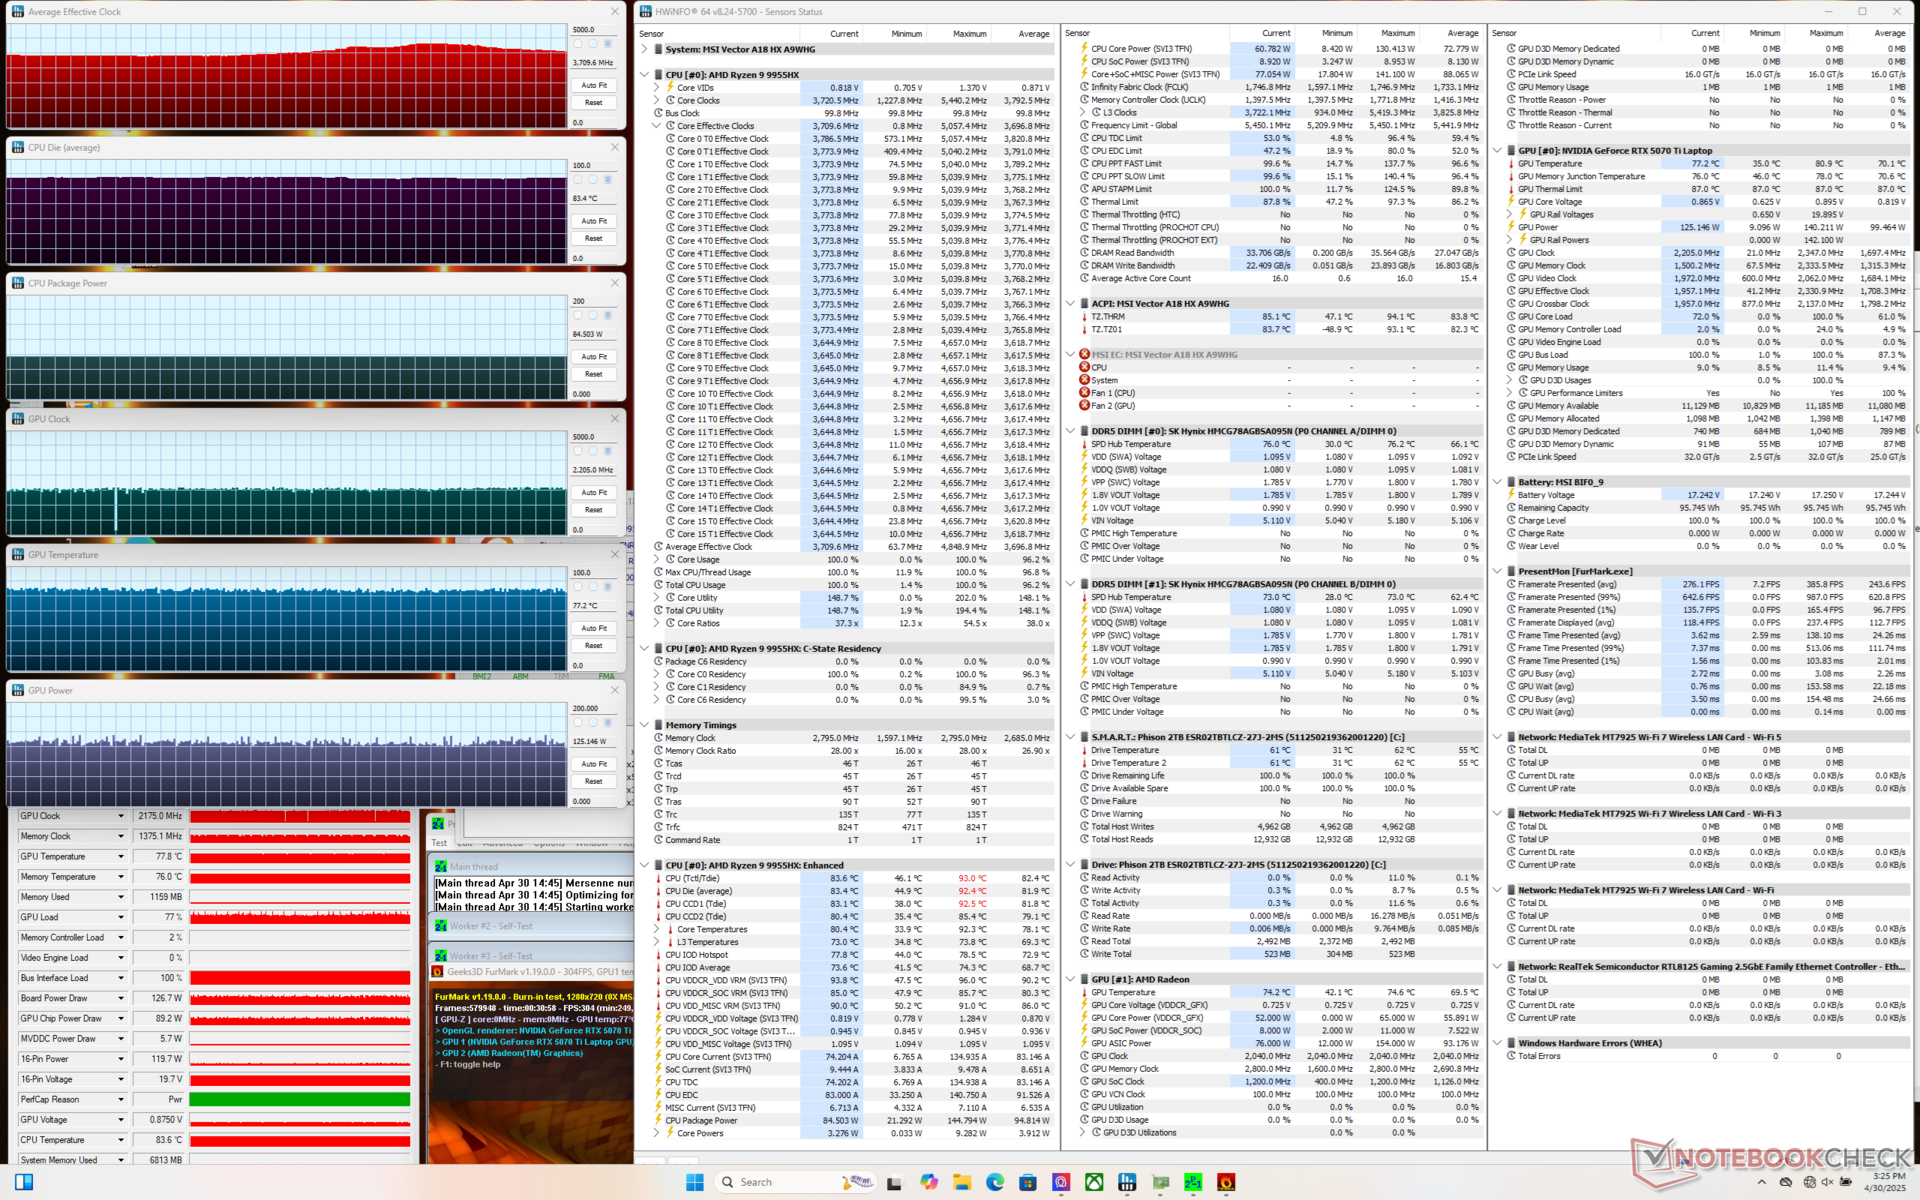
Stress Test
The CPU stabilizes at 4.5 GHz, 145 W, and 91 C when running Prime95. If gaming, the CPU and GPU would stabilize at 86 C and 75 C if on Performance mode or 84 C and 67 C if on Cooler Boost (i.e., maximum fan) mode. Note that the GPU is expected to run warmer if configuring with the 175 W RTX 5080 instead of our 140 W RTX 5070 Ti. Even so, the CPU runs warmer than we would like especially since the Core i9-14900HX in the Raider 18 HX runs several degrees C cooler under similar conditions.
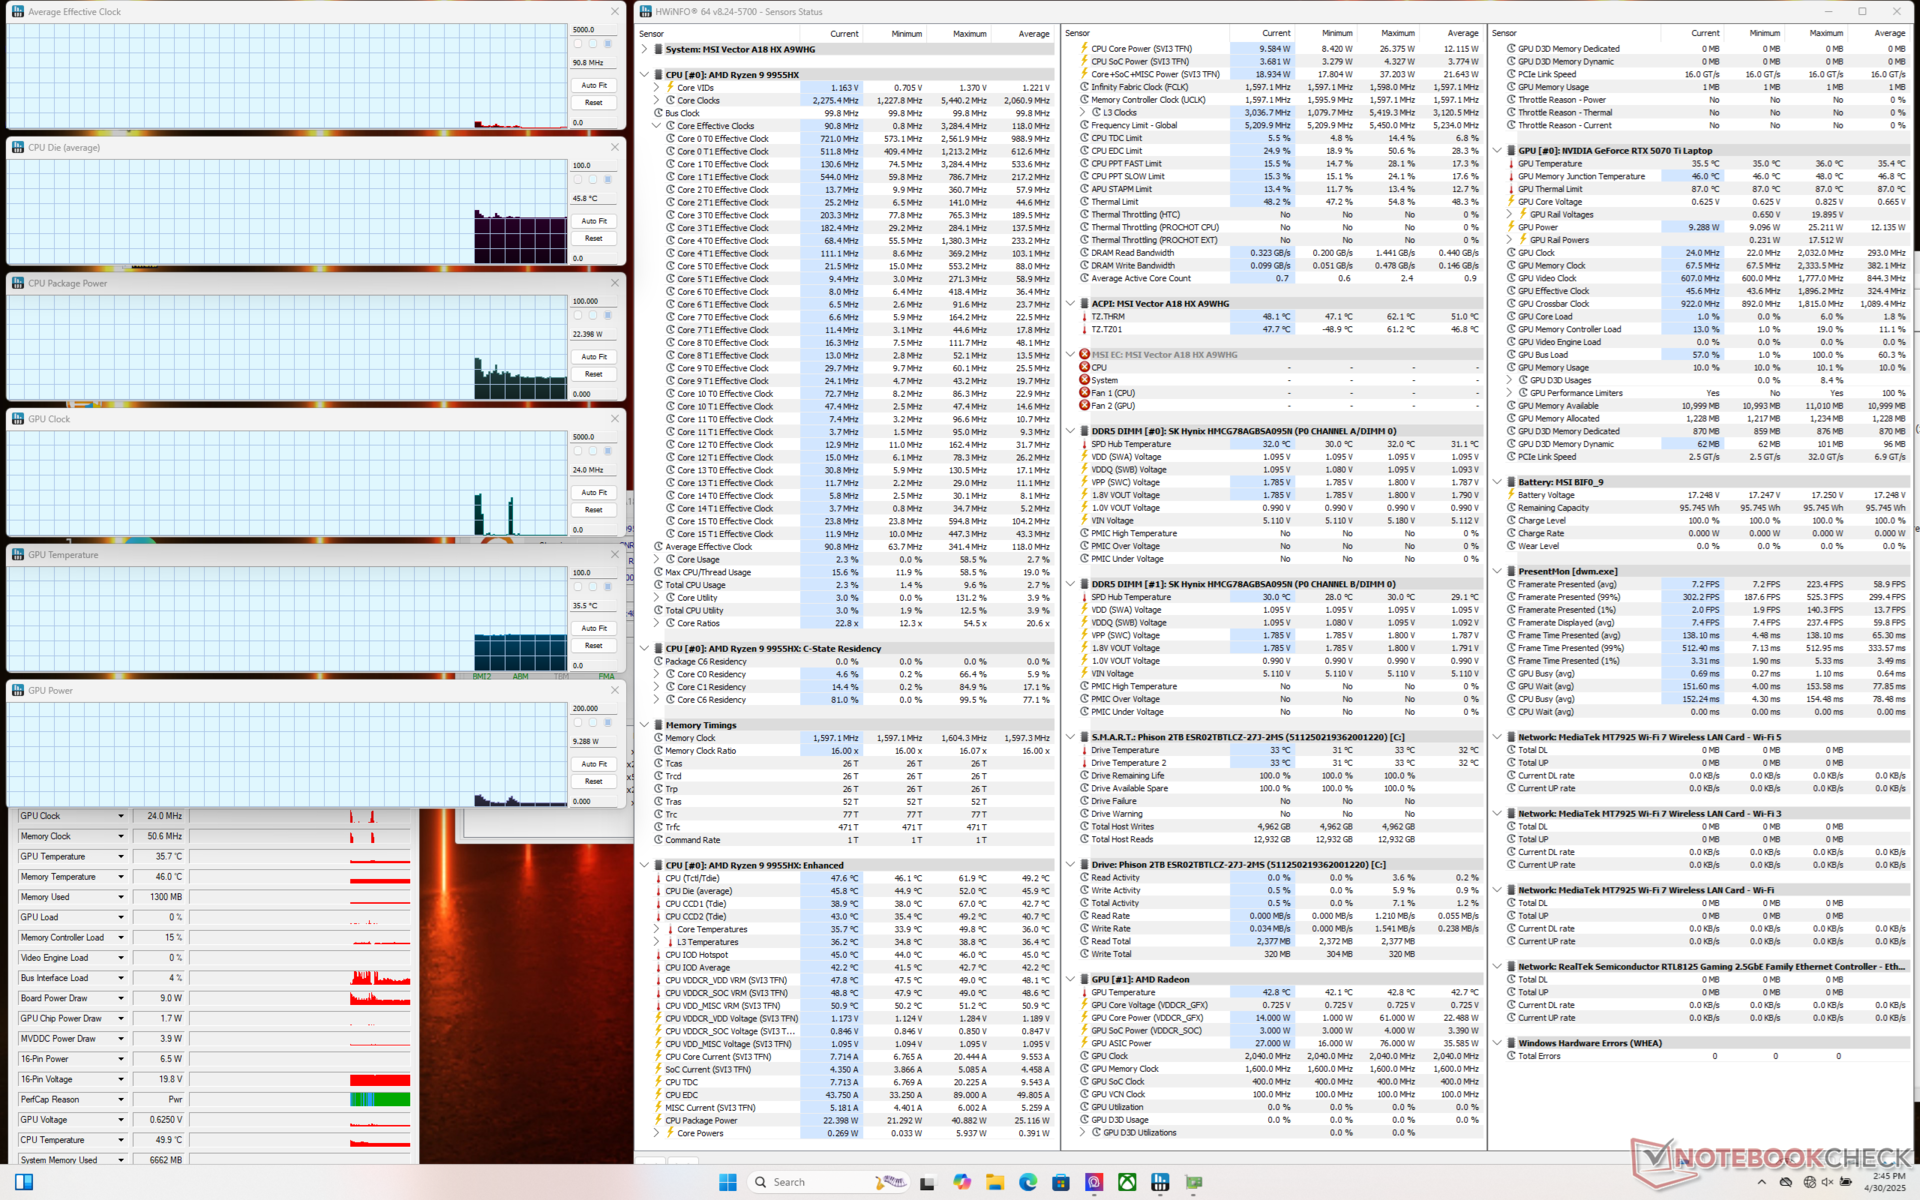
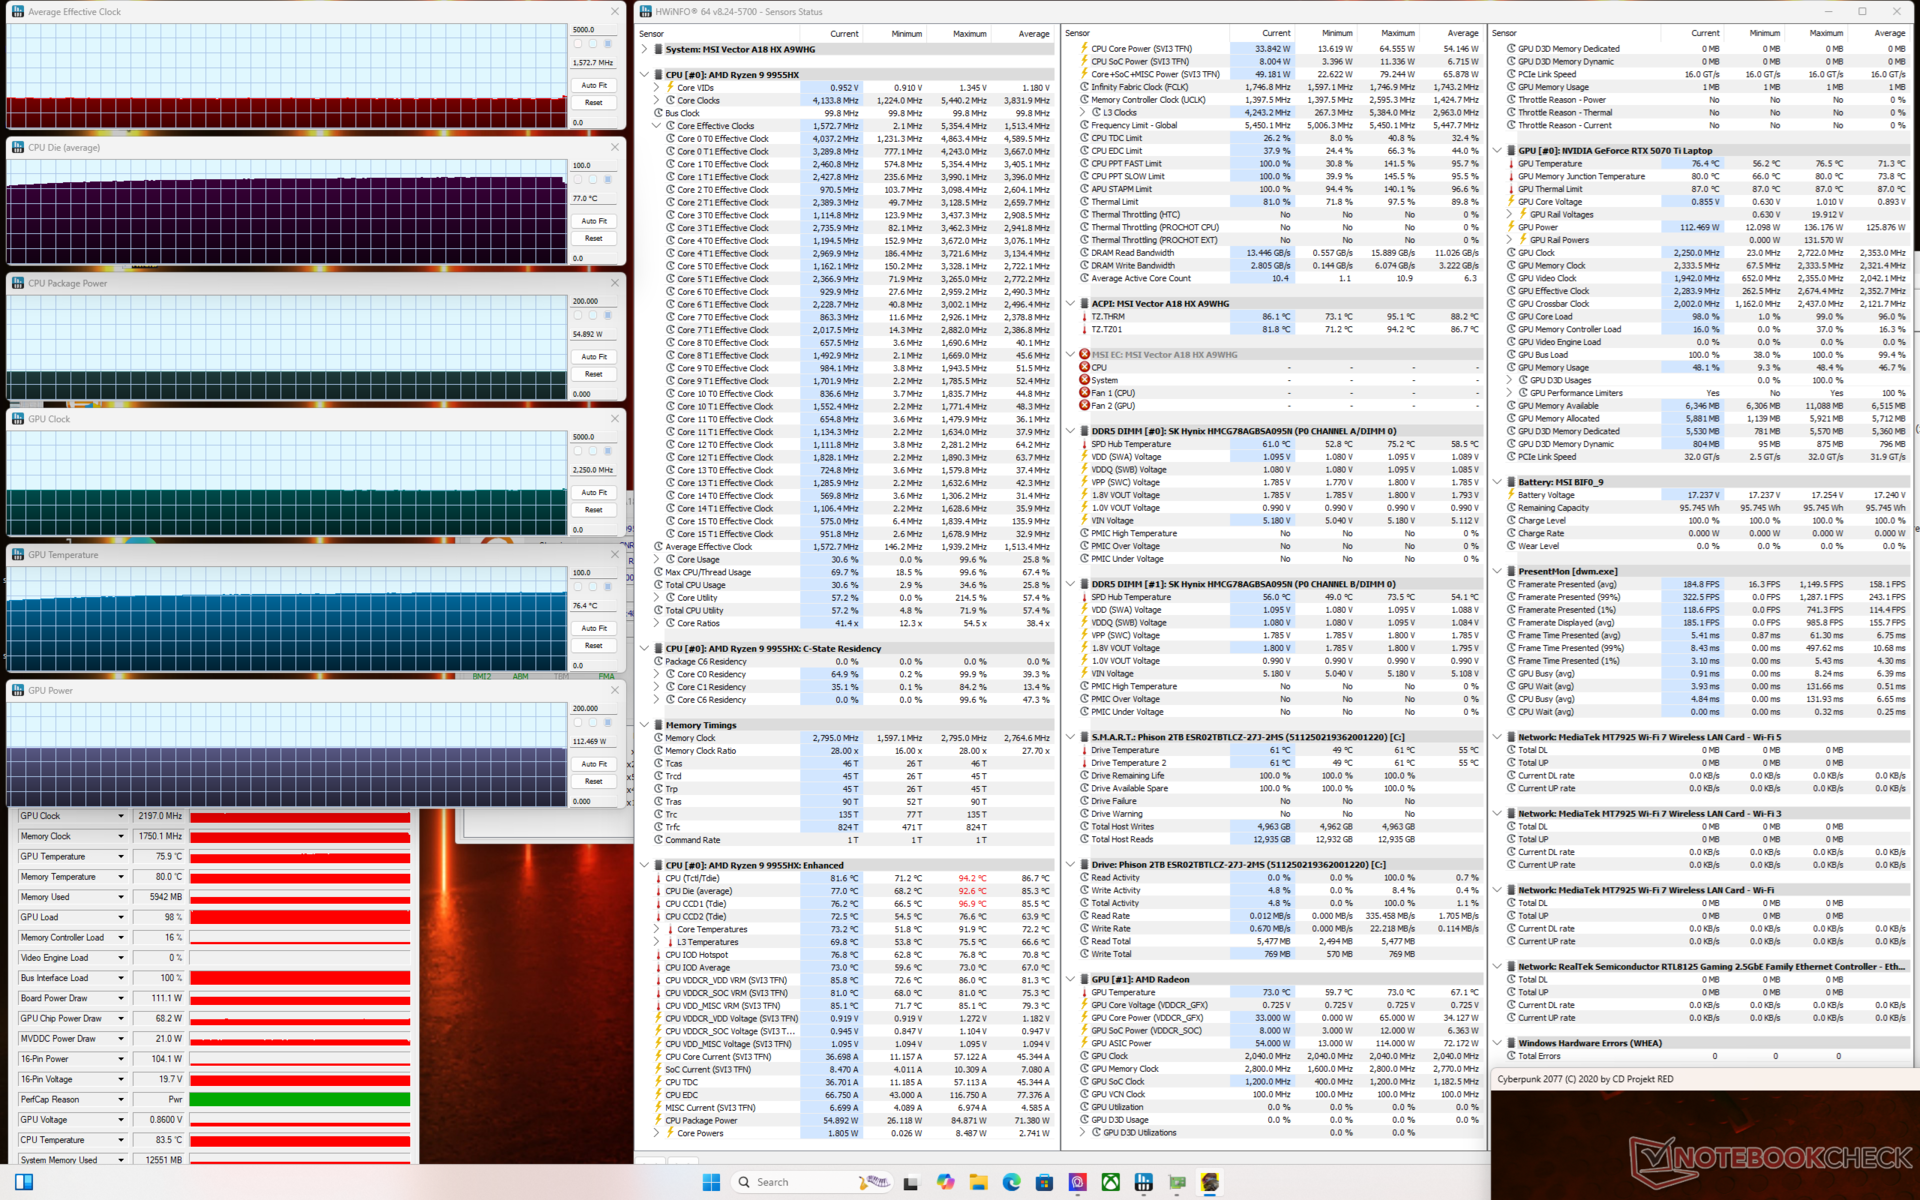

| Average CPU Clock (GHz) | GPU Clock (MHz) | Average CPU Temperature (°C) | Average GPU Temperature (°C) | |
| System Idle | -- | -- | 46 | 36 |
| Prime95 Stress | 4.5 | -- | 91 | 51 |
| Prime95 + FurMark Stress | 3.7 | 2175 | 83 | 77 |
| Cyberpunk 2077 Stress (Balanced mode) | 1.6 | 2250 | 84 | 77 |
| Cyberpunk 2077 Stress (Performance mode) | 1.7 | 2475 | 86 | 75 |
| Cyberpunk 2077 Stress (Performance mode w/ Cooler Boost on) | 1.6 | 2452 | 84 | 67 |
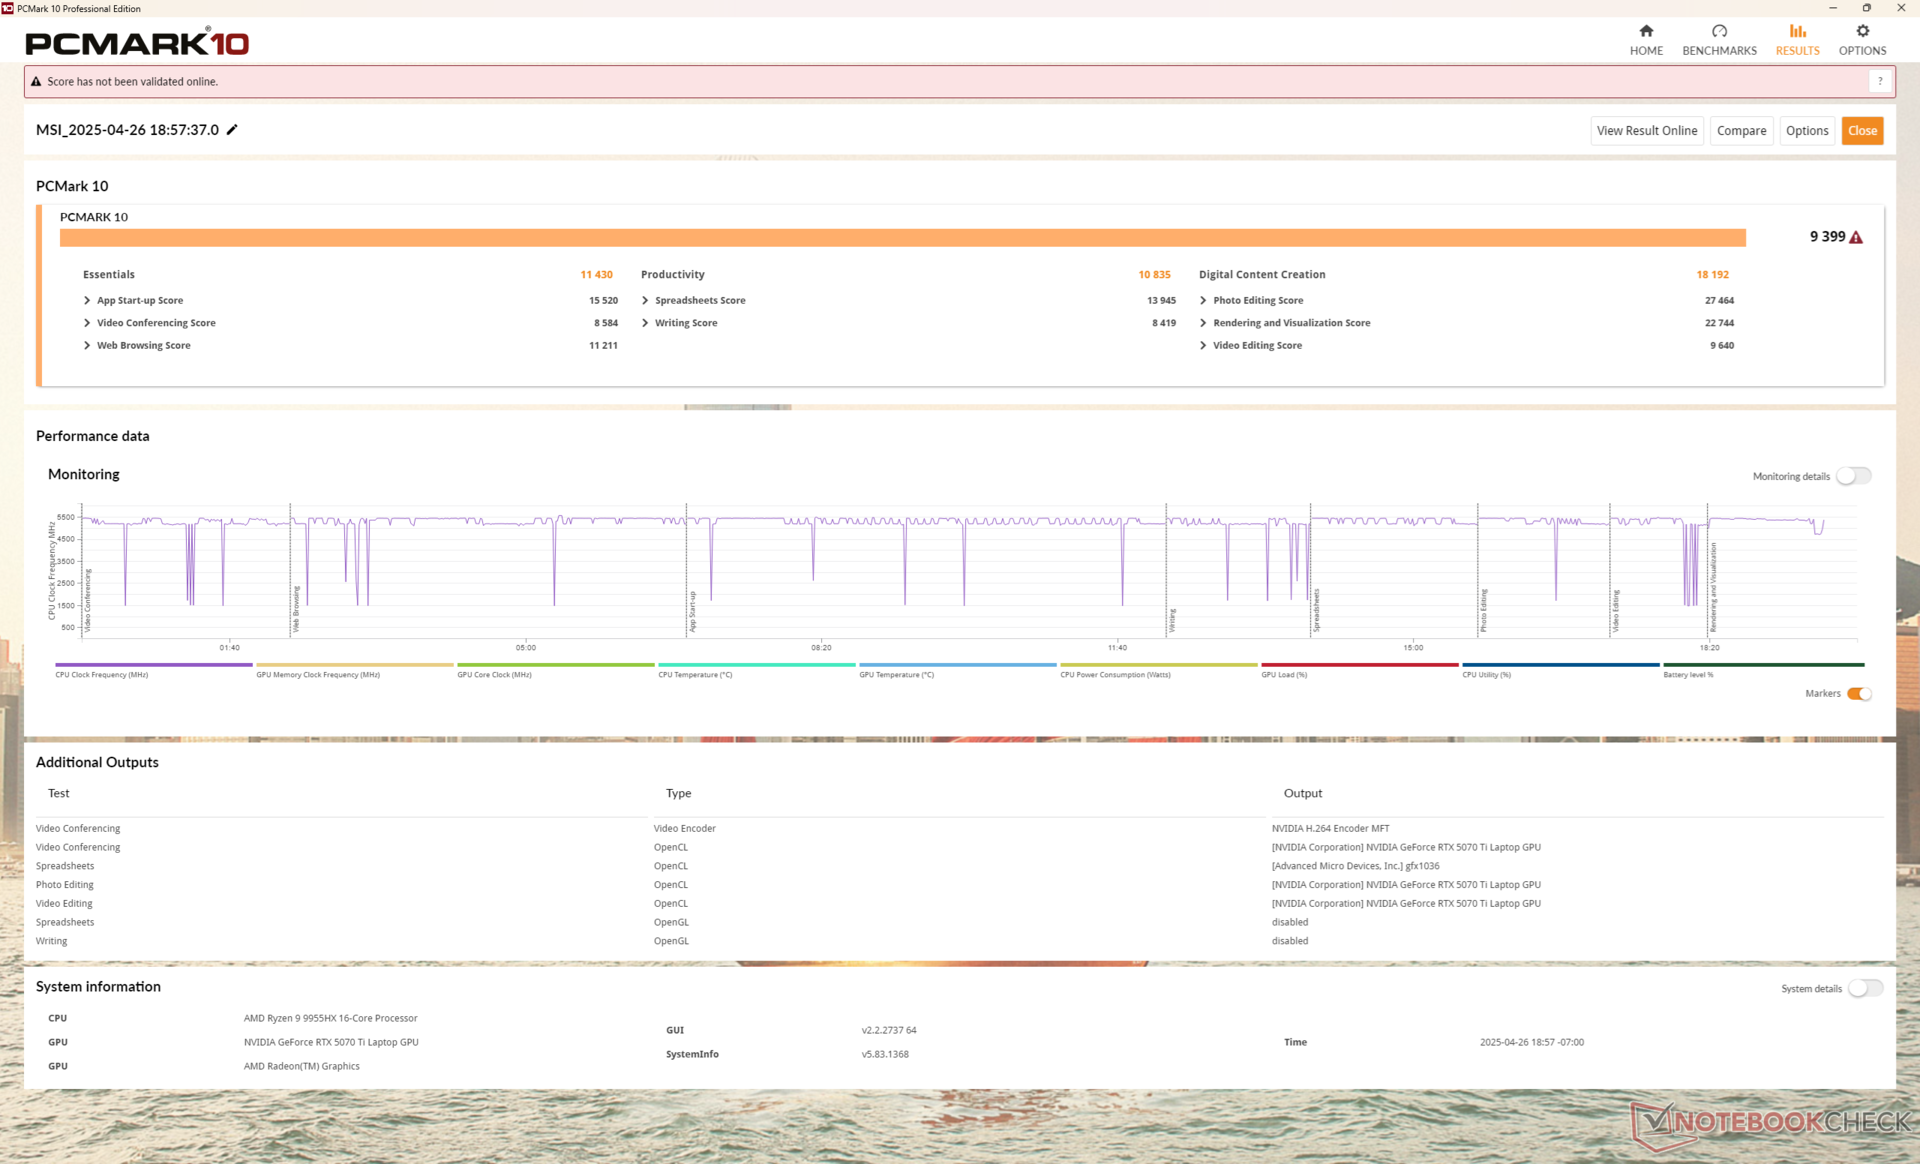
System Performance
CrossMark: Overall | Productivity | Creativity | Responsiveness
WebXPRT 3: Overall
WebXPRT 4: Overall
Mozilla Kraken 1.1: Total
| PCMark 10 / Score | |
| Average AMD Ryzen 9 9955HX, NVIDIA GeForce RTX 5070 Ti Laptop (9208 - 10060, n=3) | |
| MSI Vector A18 HX A9W | |
| Alienware m18 R2 | |
| MSI Raider 18 HX A14V | |
| Razer Blade 18 2024 RZ09-0509 | |
| Asus Strix Scar 18 G835LX | |
| Acer Predator Helios 18 PH18-72-98MW | |
| PCMark 10 / Essentials | |
| MSI Raider 18 HX A14V | |
| Average AMD Ryzen 9 9955HX, NVIDIA GeForce RTX 5070 Ti Laptop (11178 - 11719, n=3) | |
| MSI Vector A18 HX A9W | |
| Alienware m18 R2 | |
| Razer Blade 18 2024 RZ09-0509 | |
| Acer Predator Helios 18 PH18-72-98MW | |
| Asus Strix Scar 18 G835LX | |
| PCMark 10 / Productivity | |
| Average AMD Ryzen 9 9955HX, NVIDIA GeForce RTX 5070 Ti Laptop (10734 - 16314, n=3) | |
| Alienware m18 R2 | |
| MSI Raider 18 HX A14V | |
| MSI Vector A18 HX A9W | |
| Razer Blade 18 2024 RZ09-0509 | |
| Acer Predator Helios 18 PH18-72-98MW | |
| Asus Strix Scar 18 G835LX | |
| PCMark 10 / Digital Content Creation | |
| MSI Vector A18 HX A9W | |
| Asus Strix Scar 18 G835LX | |
| Average AMD Ryzen 9 9955HX, NVIDIA GeForce RTX 5070 Ti Laptop (14454 - 18192, n=3) | |
| Alienware m18 R2 | |
| MSI Raider 18 HX A14V | |
| Razer Blade 18 2024 RZ09-0509 | |
| Acer Predator Helios 18 PH18-72-98MW | |
| CrossMark / Overall | |
| Asus Strix Scar 18 G835LX | |
| MSI Vector A18 HX A9W | |
| Average AMD Ryzen 9 9955HX, NVIDIA GeForce RTX 5070 Ti Laptop (2111 - 2215, n=3) | |
| MSI Raider 18 HX A14V | |
| Alienware m18 R2 | |
| Razer Blade 18 2024 RZ09-0509 | |
| CrossMark / Productivity | |
| Asus Strix Scar 18 G835LX | |
| MSI Raider 18 HX A14V | |
| MSI Vector A18 HX A9W | |
| Average AMD Ryzen 9 9955HX, NVIDIA GeForce RTX 5070 Ti Laptop (1882 - 1999, n=3) | |
| Razer Blade 18 2024 RZ09-0509 | |
| Alienware m18 R2 | |
| CrossMark / Creativity | |
| MSI Vector A18 HX A9W | |
| Average AMD Ryzen 9 9955HX, NVIDIA GeForce RTX 5070 Ti Laptop (2592 - 2660, n=3) | |
| Asus Strix Scar 18 G835LX | |
| Alienware m18 R2 | |
| MSI Raider 18 HX A14V | |
| Razer Blade 18 2024 RZ09-0509 | |
| CrossMark / Responsiveness | |
| MSI Raider 18 HX A14V | |
| Asus Strix Scar 18 G835LX | |
| Alienware m18 R2 | |
| Razer Blade 18 2024 RZ09-0509 | |
| Average AMD Ryzen 9 9955HX, NVIDIA GeForce RTX 5070 Ti Laptop (1608 - 1854, n=3) | |
| MSI Vector A18 HX A9W | |
| WebXPRT 3 / Overall | |
| MSI Vector A18 HX A9W | |
| Asus Strix Scar 18 G835LX | |
| Average AMD Ryzen 9 9955HX, NVIDIA GeForce RTX 5070 Ti Laptop (328 - 361, n=3) | |
| Razer Blade 18 2024 RZ09-0509 | |
| MSI Raider 18 HX A14V | |
| Alienware m18 R2 | |
| WebXPRT 4 / Overall | |
| Asus Strix Scar 18 G835LX | |
| MSI Vector A18 HX A9W | |
| MSI Raider 18 HX A14V | |
| Alienware m18 R2 | |
| Average AMD Ryzen 9 9955HX, NVIDIA GeForce RTX 5070 Ti Laptop (282 - 322, n=3) | |
| Mozilla Kraken 1.1 / Total | |
| Razer Blade 18 2024 RZ09-0509 | |
| MSI Raider 18 HX A14V | |
| Acer Predator Helios 18 PH18-72-98MW | |
| Alienware m18 R2 | |
| Average AMD Ryzen 9 9955HX, NVIDIA GeForce RTX 5070 Ti Laptop (403 - 440, n=3) | |
| Asus Strix Scar 18 G835LX | |
| MSI Vector A18 HX A9W | |
* ... smaller is better
| PCMark 10 Score | 9399 points | |
Help | ||
| AIDA64 / Memory Copy | |
| Asus Strix Scar 18 G835LX | |
| Alienware m18 R2 | |
| Acer Predator Helios 18 PH18-72-98MW | |
| Razer Blade 18 2024 RZ09-0509 | |
| MSI Raider 18 HX A14V | |
| MSI Vector A18 HX A9W | |
| Average AMD Ryzen 9 9955HX (53598 - 62777, n=9) | |
| AIDA64 / Memory Read | |
| Asus Strix Scar 18 G835LX | |
| Alienware m18 R2 | |
| Acer Predator Helios 18 PH18-72-98MW | |
| Razer Blade 18 2024 RZ09-0509 | |
| Average AMD Ryzen 9 9955HX (63953 - 67256, n=9) | |
| MSI Vector A18 HX A9W | |
| MSI Raider 18 HX A14V | |
| AIDA64 / Memory Write | |
| Asus Strix Scar 18 G835LX | |
| Alienware m18 R2 | |
| Acer Predator Helios 18 PH18-72-98MW | |
| MSI Vector A18 HX A9W | |
| Average AMD Ryzen 9 9955HX (65421 - 72060, n=9) | |
| Razer Blade 18 2024 RZ09-0509 | |
| MSI Raider 18 HX A14V | |
| AIDA64 / Memory Latency | |
| Asus Strix Scar 18 G835LX | |
| MSI Vector A18 HX A9W | |
| Average AMD Ryzen 9 9955HX (92.1 - 103.5, n=9) | |
| MSI Raider 18 HX A14V | |
| Razer Blade 18 2024 RZ09-0509 | |
| Alienware m18 R2 | |
| Acer Predator Helios 18 PH18-72-98MW | |
* ... smaller is better
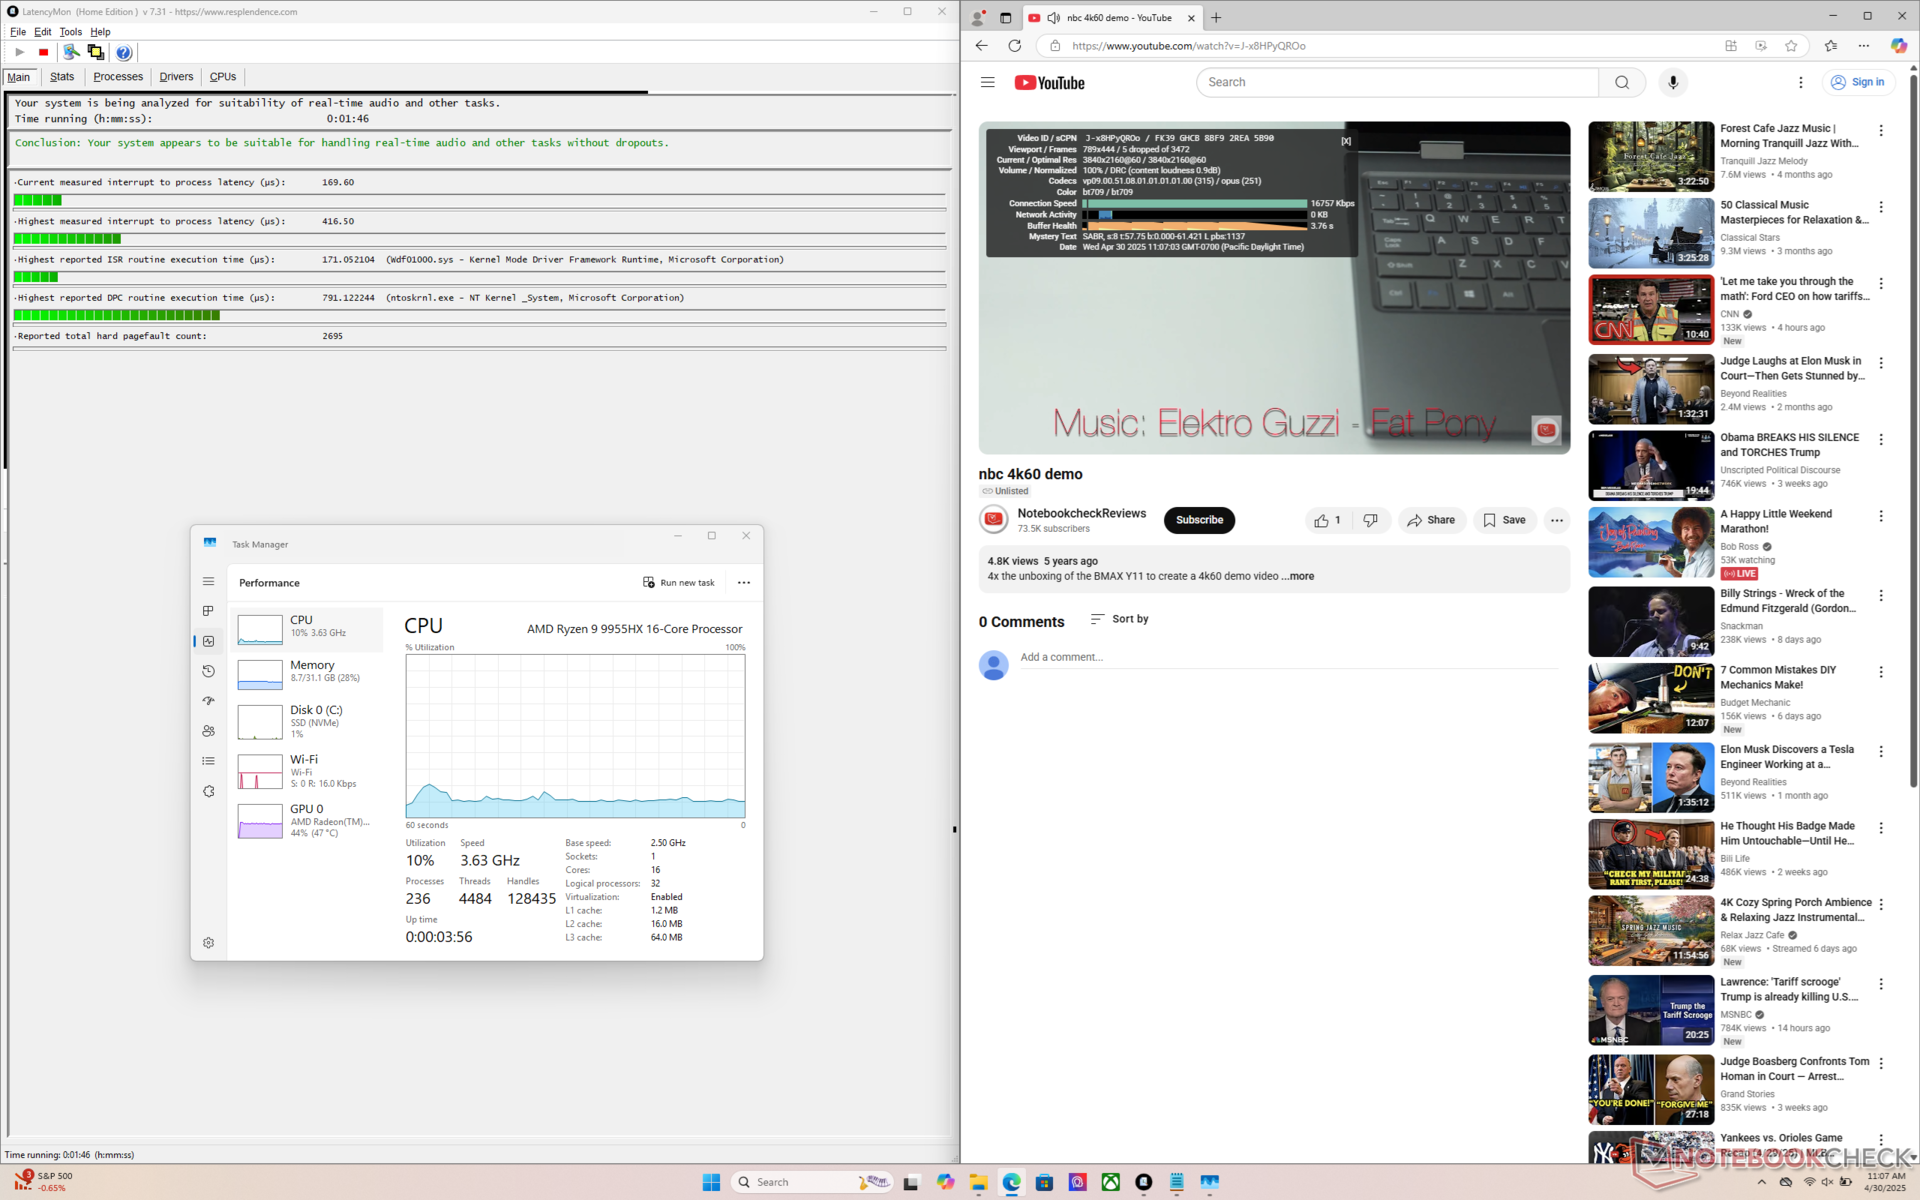
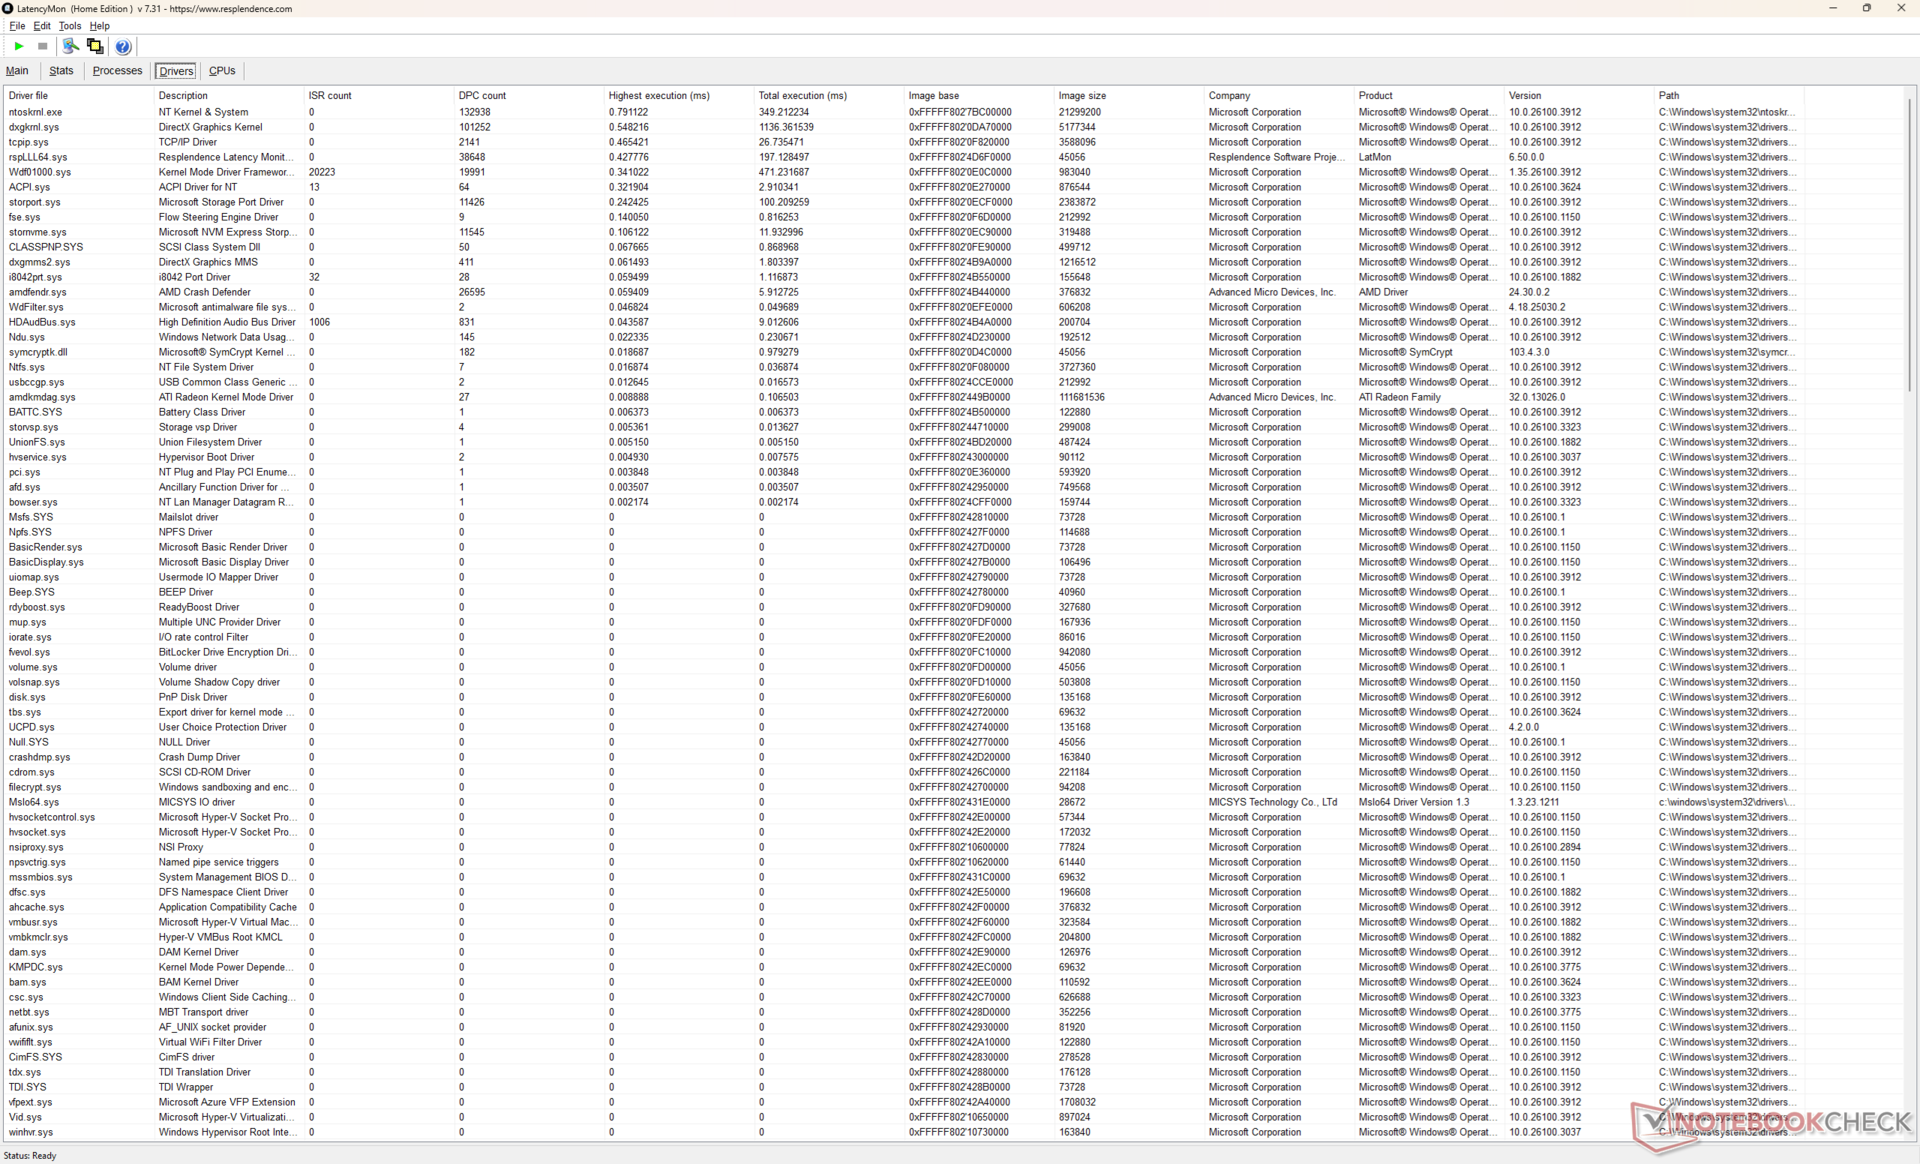
DPC Latency
LatencyMon shows no major DPC issues when opening multiple browser tabs of our homepage. Nonetheless, 4K60 video playback is imperfect with 5 dropped frames recorded within a 60-second timeframe.
| DPC Latencies / LatencyMon - interrupt to process latency (max), Web, Youtube, Prime95 | |
| MSI Raider 18 HX A14V | |
| Acer Predator Helios 18 PH18-72-98MW | |
| Alienware m18 R2 | |
| Razer Blade 18 2024 RZ09-0509 | |
| Asus Strix Scar 18 G835LX | |
| MSI Vector A18 HX A9W | |
* ... smaller is better
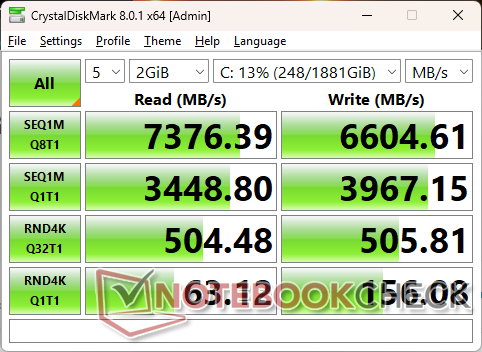
Storage Devices
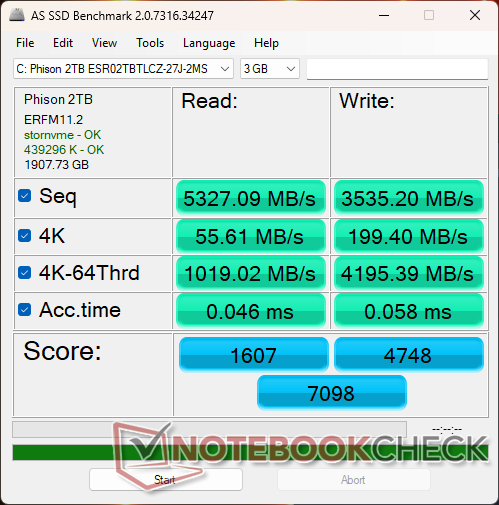
The MSI model is one of the few gaming laptops to include a dedicated SSD heat sink for better PCIe5 SSD support. The PCIe4 drive in our test unit is able to sustain up to ~7000 MB/s transfer rates with no notable throttling behavior.

| Drive Performance rating - Percent | |
| Alienware m18 R2 | |
| MSI Raider 18 HX A14V | |
| Acer Predator Helios 18 PH18-72-98MW | |
| MSI Vector A18 HX A9W | |
| Asus Strix Scar 18 G835LX | |
| Razer Blade 18 2024 RZ09-0509 | |
* ... smaller is better
Disk Throttling: DiskSpd Read Loop, Queue Depth 8
GPU Performance
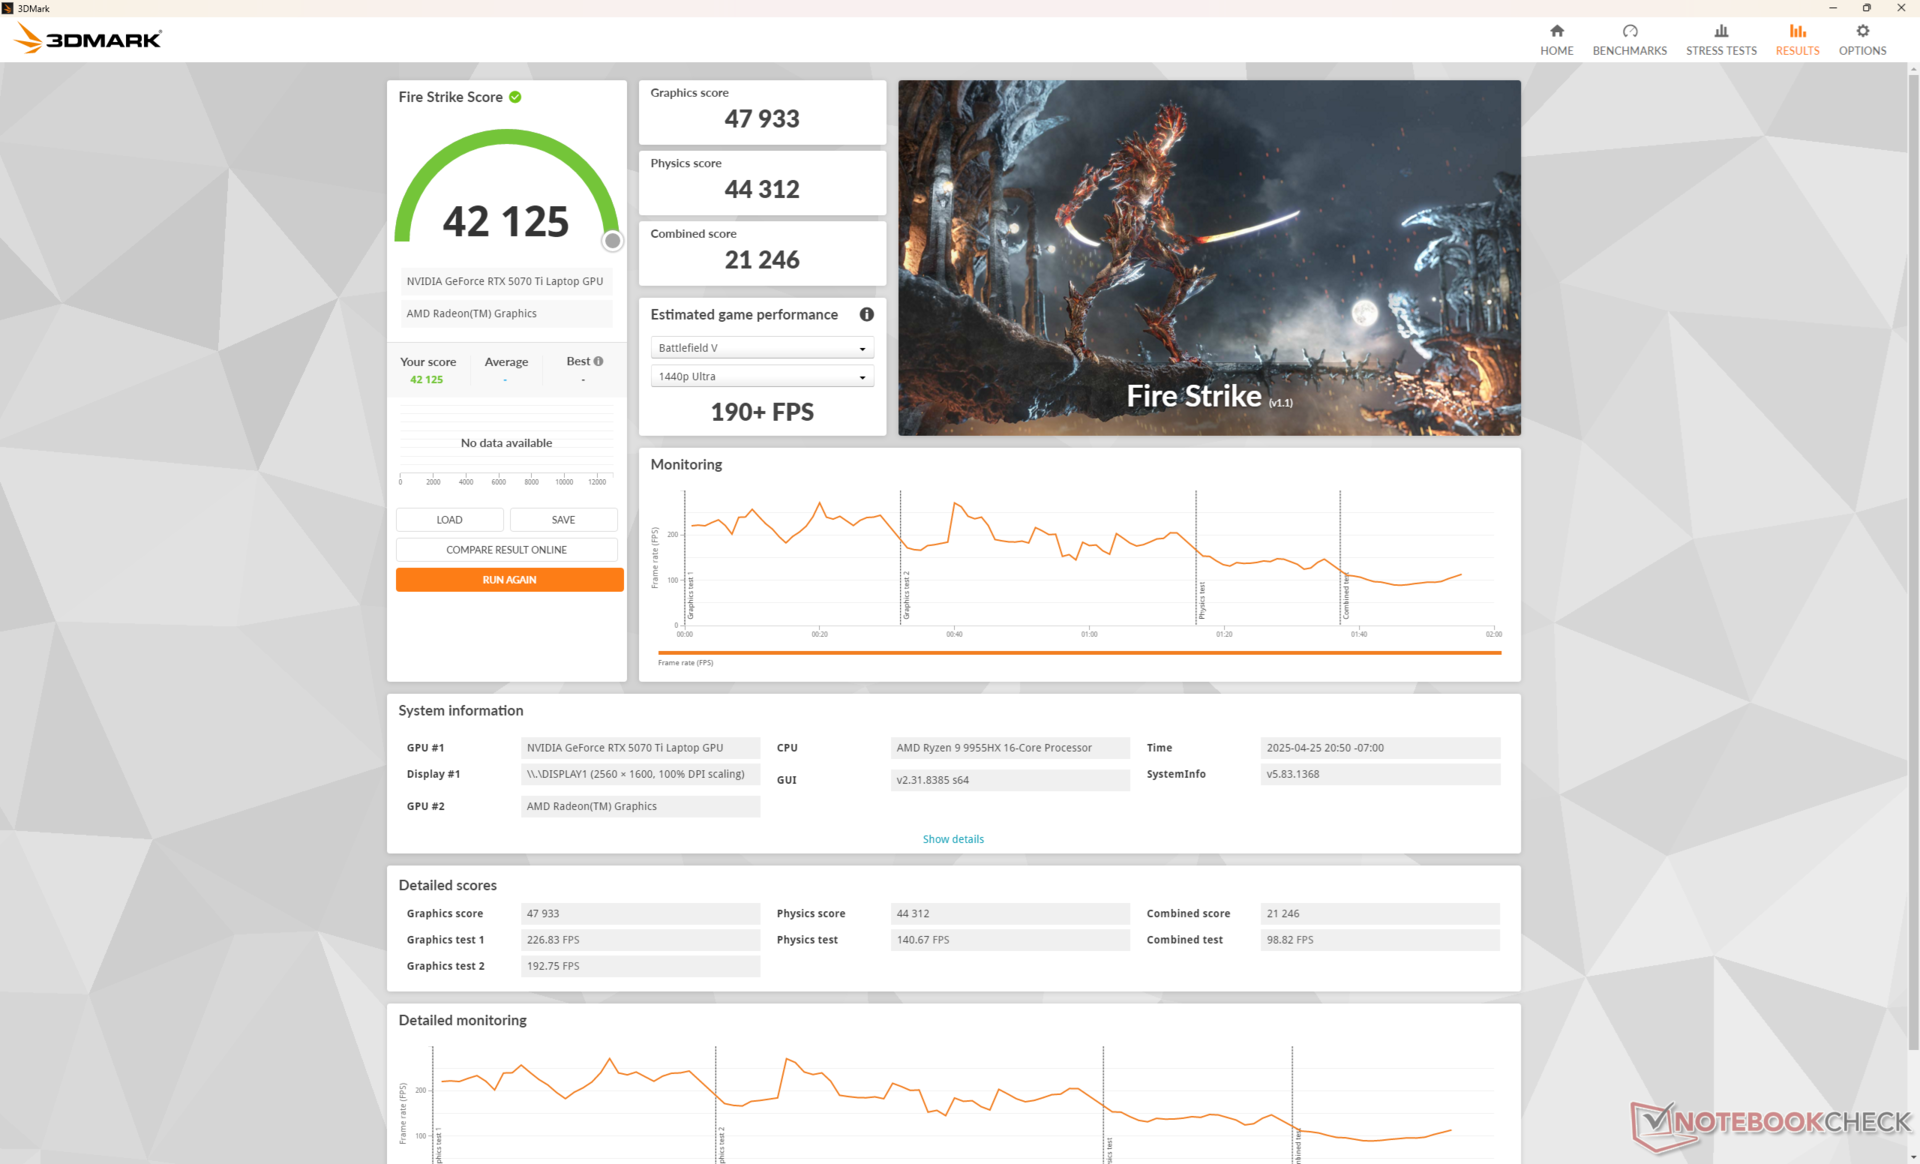
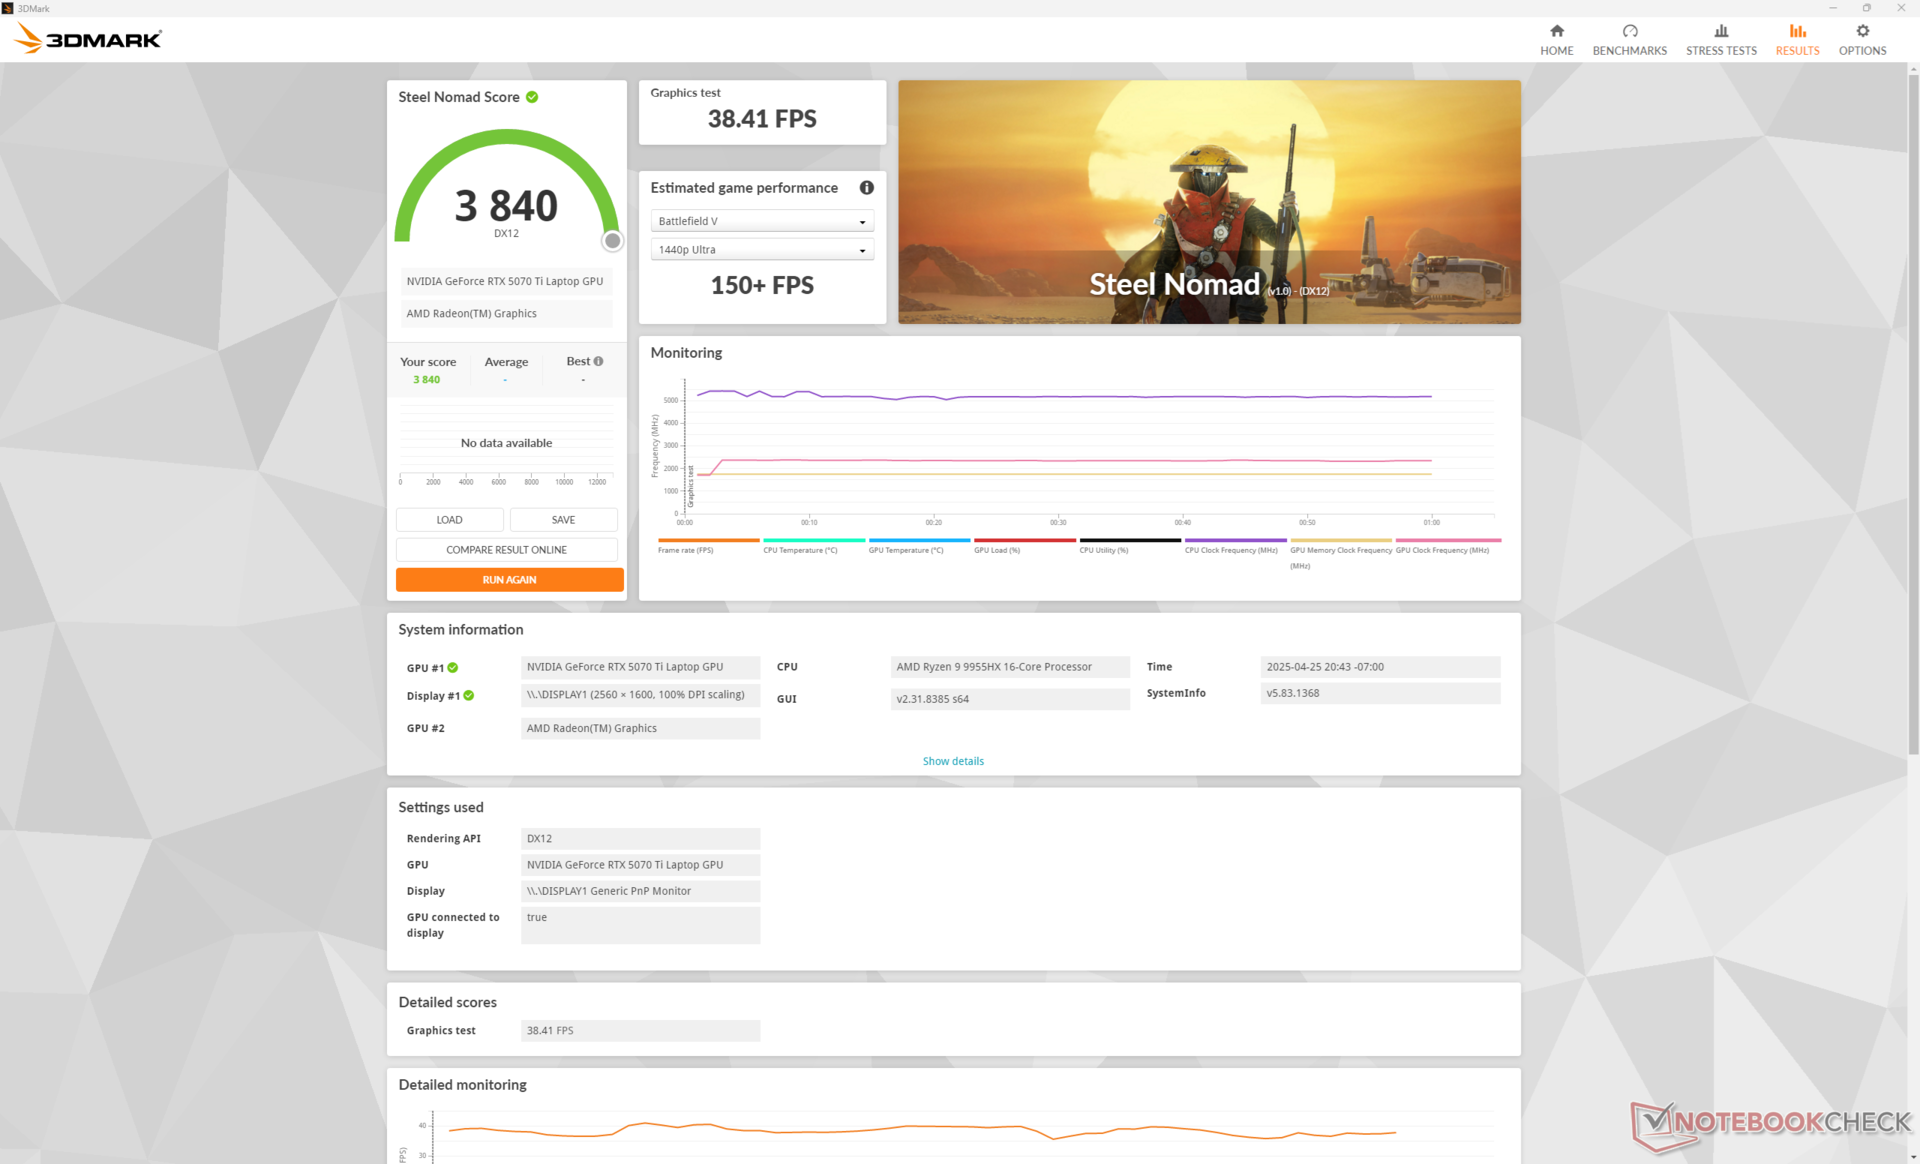
3DMark results with our 140 W GeForce RTX 5070 Ti are almost neck-to-neck with the 175 W GeForce RTX 4080 on the Raider 18 HX. Upgrading to the RTX 5080 configuration can provide a 25 to 30 percent increase in performance for DX12 titles.
| Power Profile | Graphics Score | Physics Score | Combined Score |
| Cooler Boost mode | 48837 | 44787 | 21174 |
| Performance mode | 47933 (-2%) | 44312 (-1%) | 21246 (-0%) |
| Balanced mode | 45444 (-7%) | 40341 (-10%) | 18011 (-15%) |
| Battery power | 4546 (-90%) | 27512 (-39%) | 2426 (-89%) |
The performance difference between Performance mode and Cooler Boost mode (i.e., maximum fan mode) is essentially negligible as shown by our Fire Strike results table above.
| 3DMark 11 Performance | 45350 points | |
| 3DMark Fire Strike Score | 42125 points | |
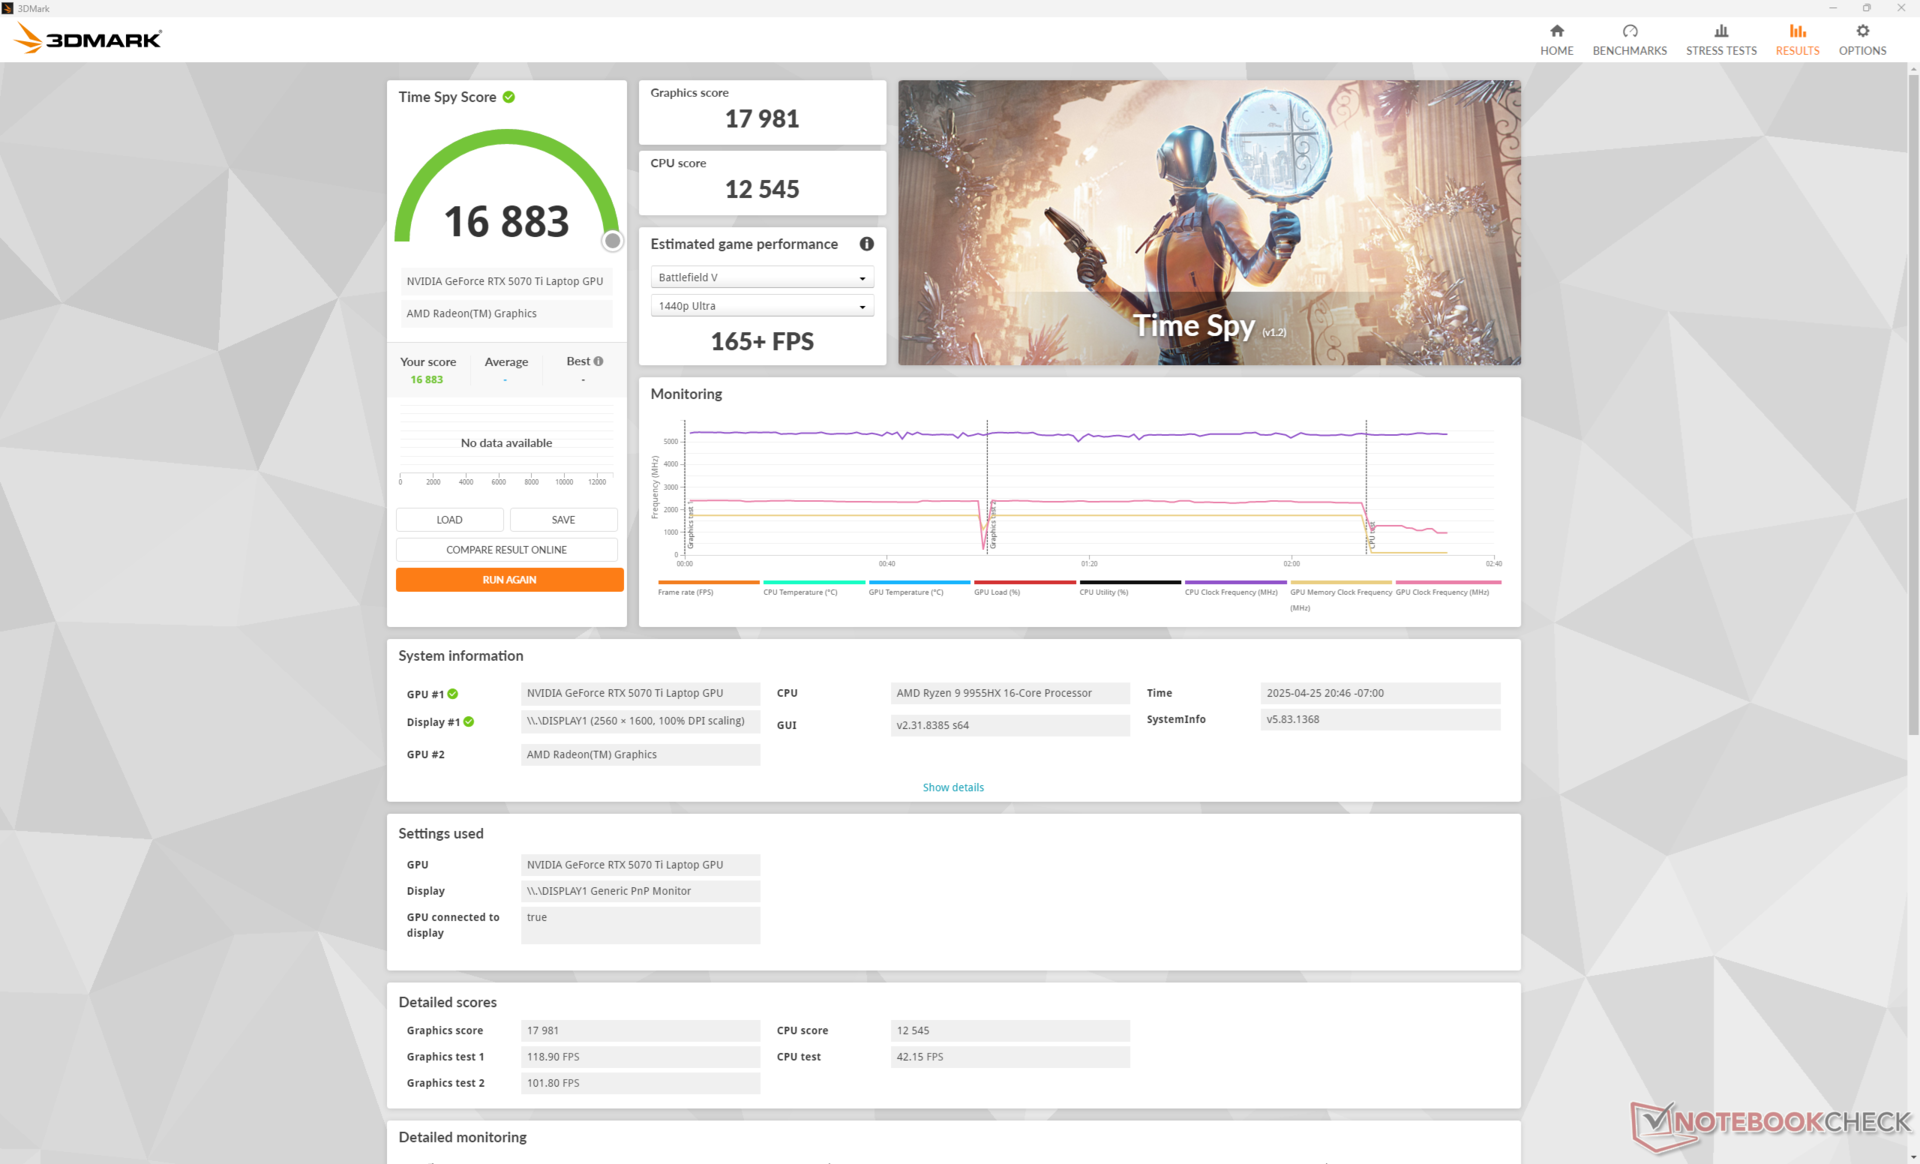
| 3DMark Time Spy Score | 16883 points | |
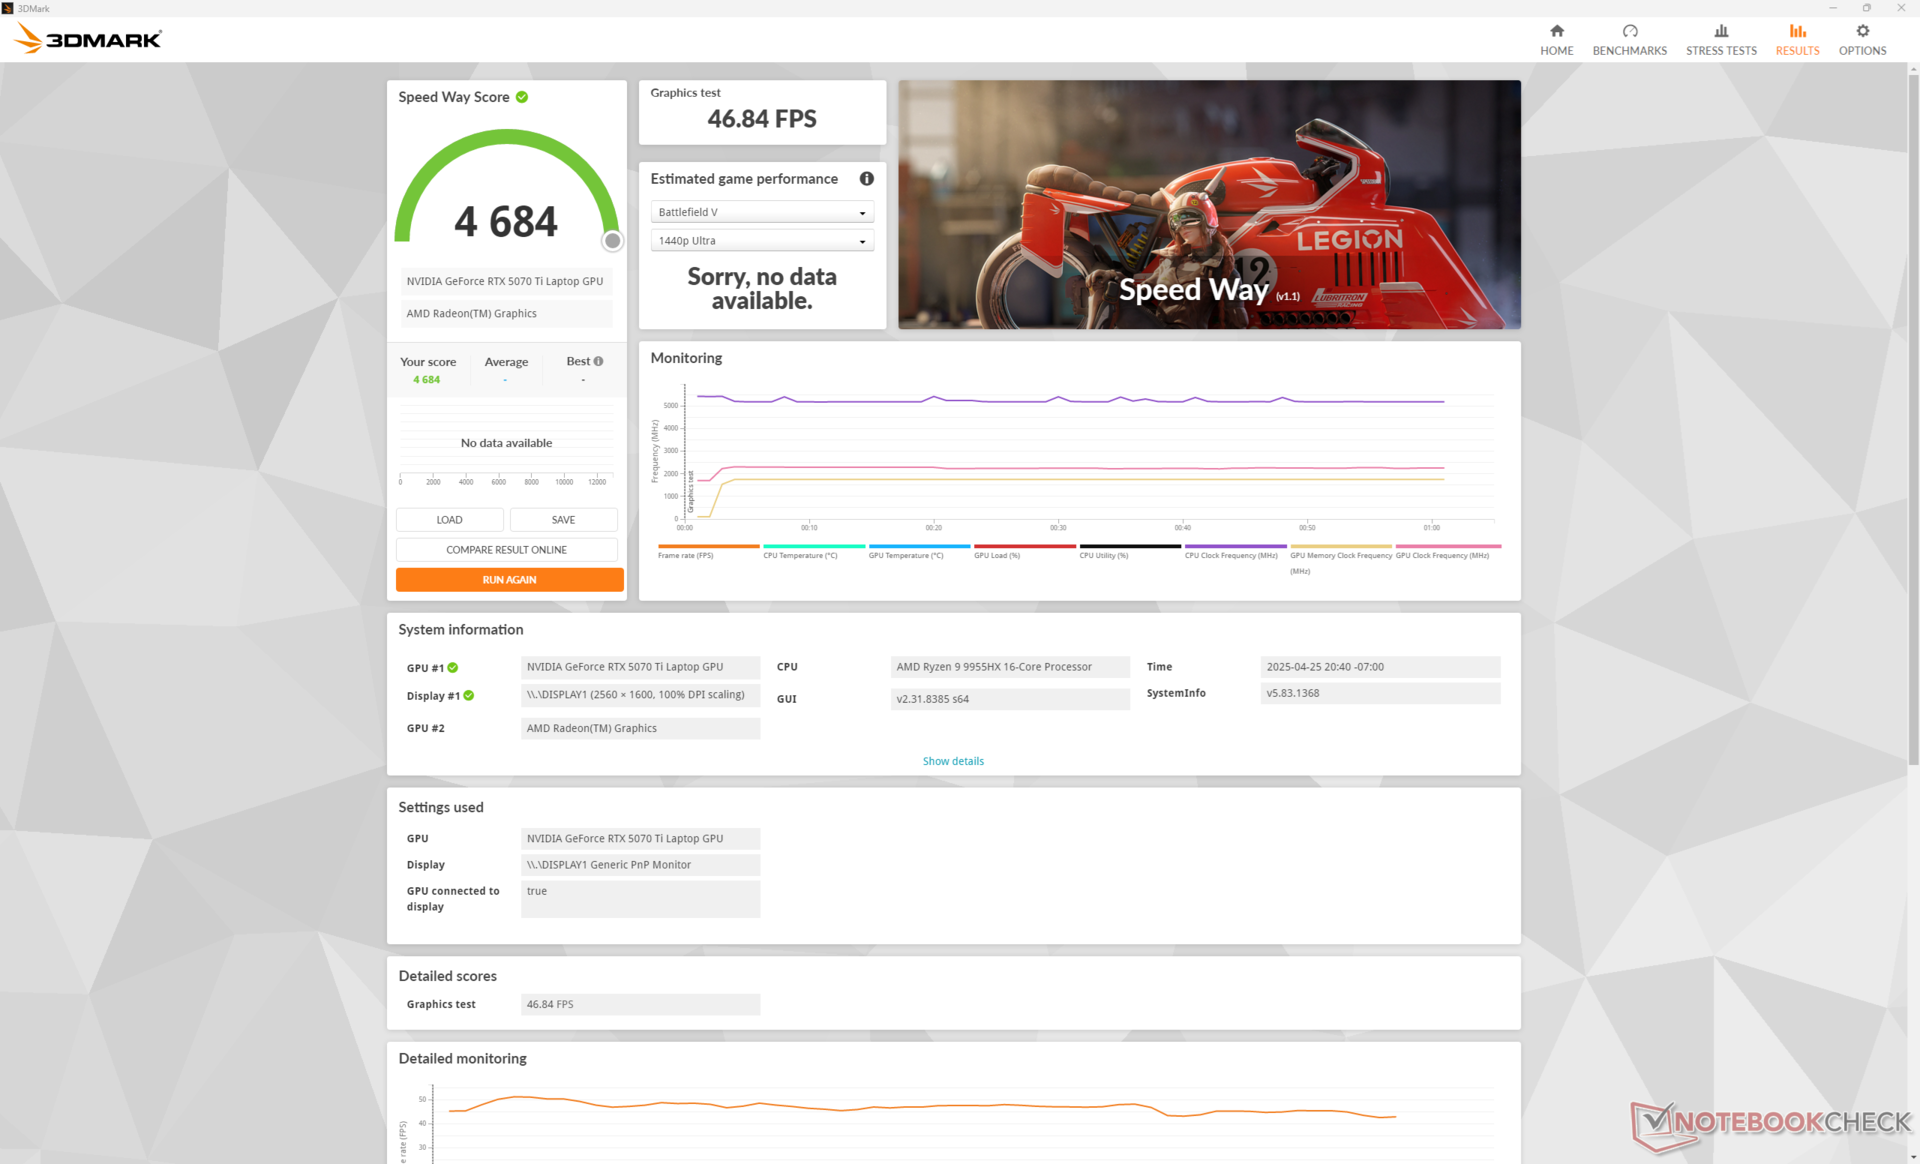
| 3DMark Steel Nomad Score | 3840 points | |
Help | ||
* ... smaller is better
Gaming Performance
The RTX 5070 Ti is powerful enough to run most titles on Ultra settings at the native QHD resolution and a steady 60 FPS. However, more demanding titles like Assassin's Creed Shadows or Monster Hunter Wilds may require DLSS to reach 60+ FPS. Multi Frame Generation works well on supported titles to reach the native refresh rate of the panel when more demanding features like RT are disabled.
Certain titles would constantly crash when enabling maximum 4K settings during testing including Monster Hunter Wilds and Indiana Jones likely due to driver issues. These crashes would otherwise not occur when running on an RTX 5080 or RTX 5090 laptop.
Cyberpunk 2077 ultra FPS Chart
| low | med. | high | ultra | QHD DLSS | QHD FSR | QHD | 4K DLSS | 4K FSR | 4K | |
|---|---|---|---|---|---|---|---|---|---|---|
| Dota 2 Reborn (2015) | 256 | 217 | 215 | 193 | 170.7 | |||||
| Final Fantasy XV Benchmark (2018) | 180.1 | 134.2 | 77.5 | |||||||
| X-Plane 11.11 (2018) | 173.7 | 136.4 | 115.5 | 91.8 | ||||||
| Strange Brigade (2018) | 347 | 246 | 131.7 | |||||||
| Baldur's Gate 3 (2023) | 246.1 | 175.5 | 102.5 | 91.4 | ||||||
| Cyberpunk 2077 (2023) | 203 | 178.7 | 154.1 | 135.5 | 102.1 | 87.5 | 33.6 | 37.1 | ||
| F1 24 (2024) | 114.8 | 115.8 | 113.8 | 72.1 | 61.4 | 35.6 | ||||
| Indiana Jones and the Great Circle (2024) | 107.4 | 99.9 | 82.5 | 43.1 | ||||||
| Monster Hunter Wilds (2025) | 70.8 | 70.6 | 55 | 33.4 | ||||||
| Assassin's Creed Shadows (2025) | 52 | 58 | 45 | 44 | 32 |
Emissions
System Noise
Fan noise and behavior when running low to medium loads are similar to what we experienced on the Raider 18 HX. When gaming, however, fan noise is generally quieter on our Vector A18 at 44 dB(A), 50 dB(A), and 62 dB(A) when on Balanced mode, Performance mode, and Cooler Boost mode, respectively.
Noise level
| Idle |
| 26 / 26 / 32 dB(A) |
| Load |
| 44.4 / 61.6 dB(A) |
 | ||
30 dB silent 40 dB(A) audible 50 dB(A) loud |
||
min: | ||
| MSI Vector A18 HX A9W GeForce RTX 5070 Ti Laptop, R9 9955HX | MSI Raider 18 HX A14V GeForce RTX 4080 Laptop GPU, i9-14900HX, Samsung PM9A1 MZVL22T0HBLB | Asus Strix Scar 18 G835LX GeForce RTX 5090 Laptop, Ultra 9 275HX, WD PC SN8000S 2TB | Razer Blade 18 2024 RZ09-0509 GeForce RTX 4090 Laptop GPU, i9-14900HX | Alienware m18 R2 GeForce RTX 4090 Laptop GPU, i9-14900HX, SK Hynix PC811 HFS002TEM9X152N | Acer Predator Helios 18 PH18-72-98MW GeForce RTX 4090 Laptop GPU, i9-14900HX, 2x SK Hynix HFS001TEJ9X115N (RAID 0) | |
|---|---|---|---|---|---|---|
| Noise | -6% | -3% | 4% | 7% | -16% | |
| off / environment * (dB) | 22.5 | 23.3 -4% | 23.3 -4% | 23.4 -4% | 23.6 -5% | 25 -11% |
| Idle Minimum * (dB) | 26 | 28.6 -10% | 29.8 -15% | 23.9 8% | 23.8 8% | 30 -15% |
| Idle Average * (dB) | 26 | 28.6 -10% | 29.8 -15% | 28.2 -8% | 26.1 -0% | 36 -38% |
| Idle Maximum * (dB) | 32 | 31.3 2% | 29.8 7% | 29 9% | 31.5 2% | 44 -38% |
| Load Average * (dB) | 44.4 | 44.1 1% | 42.9 3% | 36.8 17% | 31.5 29% | 48 -8% |
| Cyberpunk 2077 ultra * (dB) | 49.8 | 59.4 -19% | 53.7 -8% | |||
| Load Maximum * (dB) | 61.6 | 62.7 -2% | 53.7 13% | 61.1 1% | 56.6 8% | 51 17% |
| Witcher 3 ultra * (dB) | 54.1 | 52.1 | 49 |
* ... smaller is better
Temperature
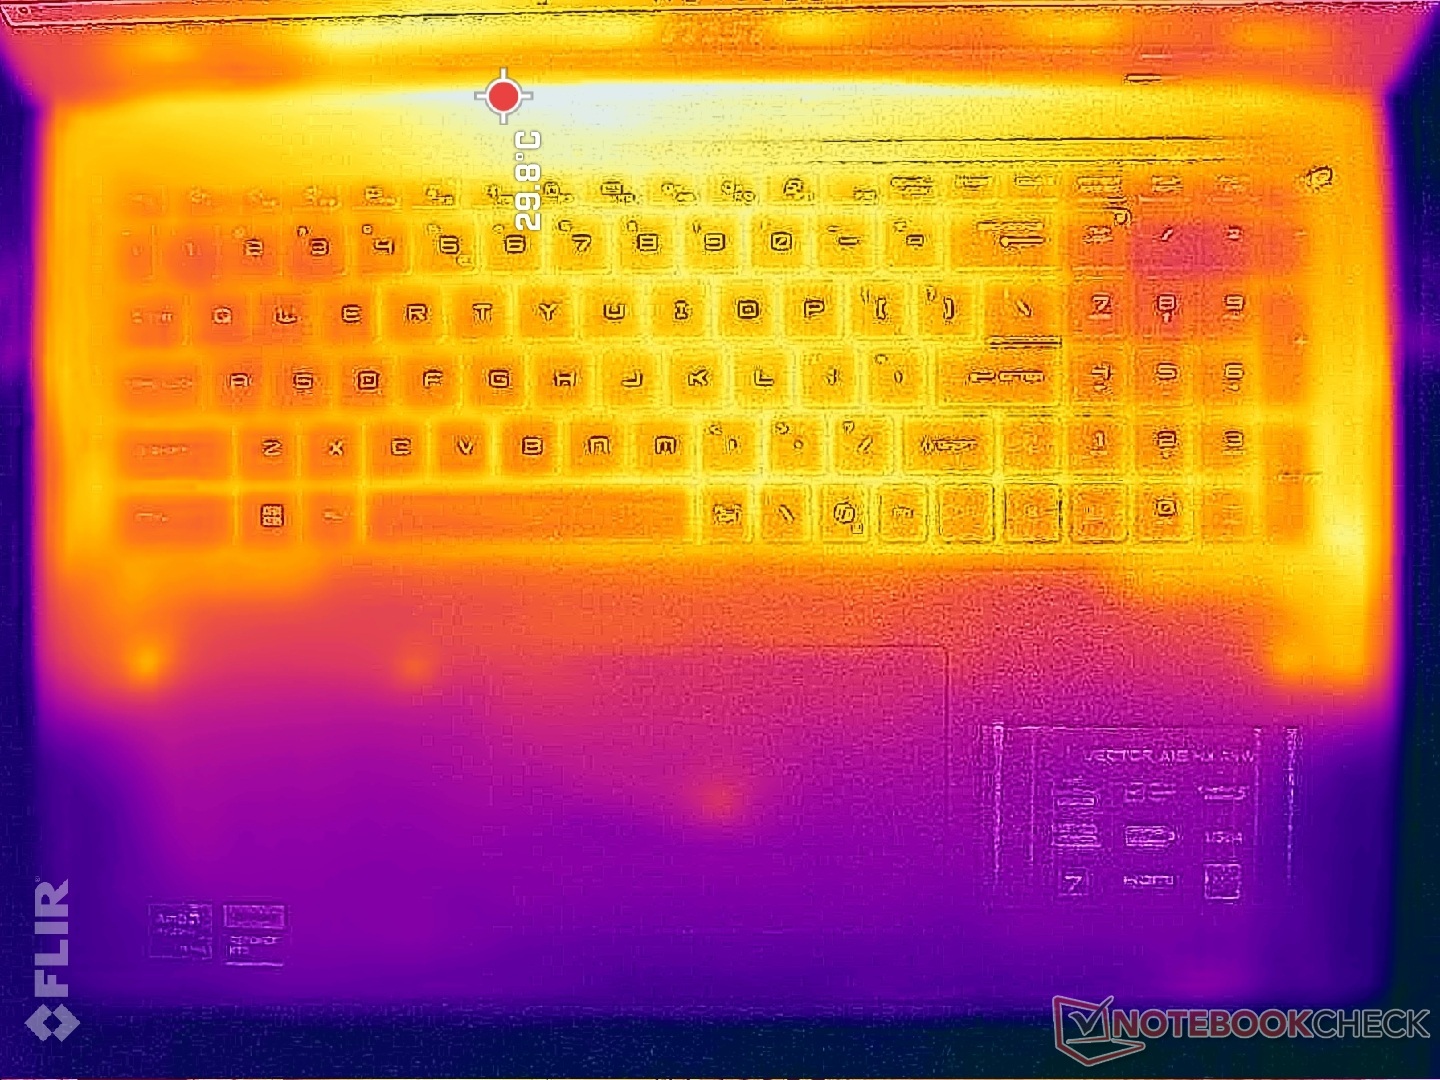
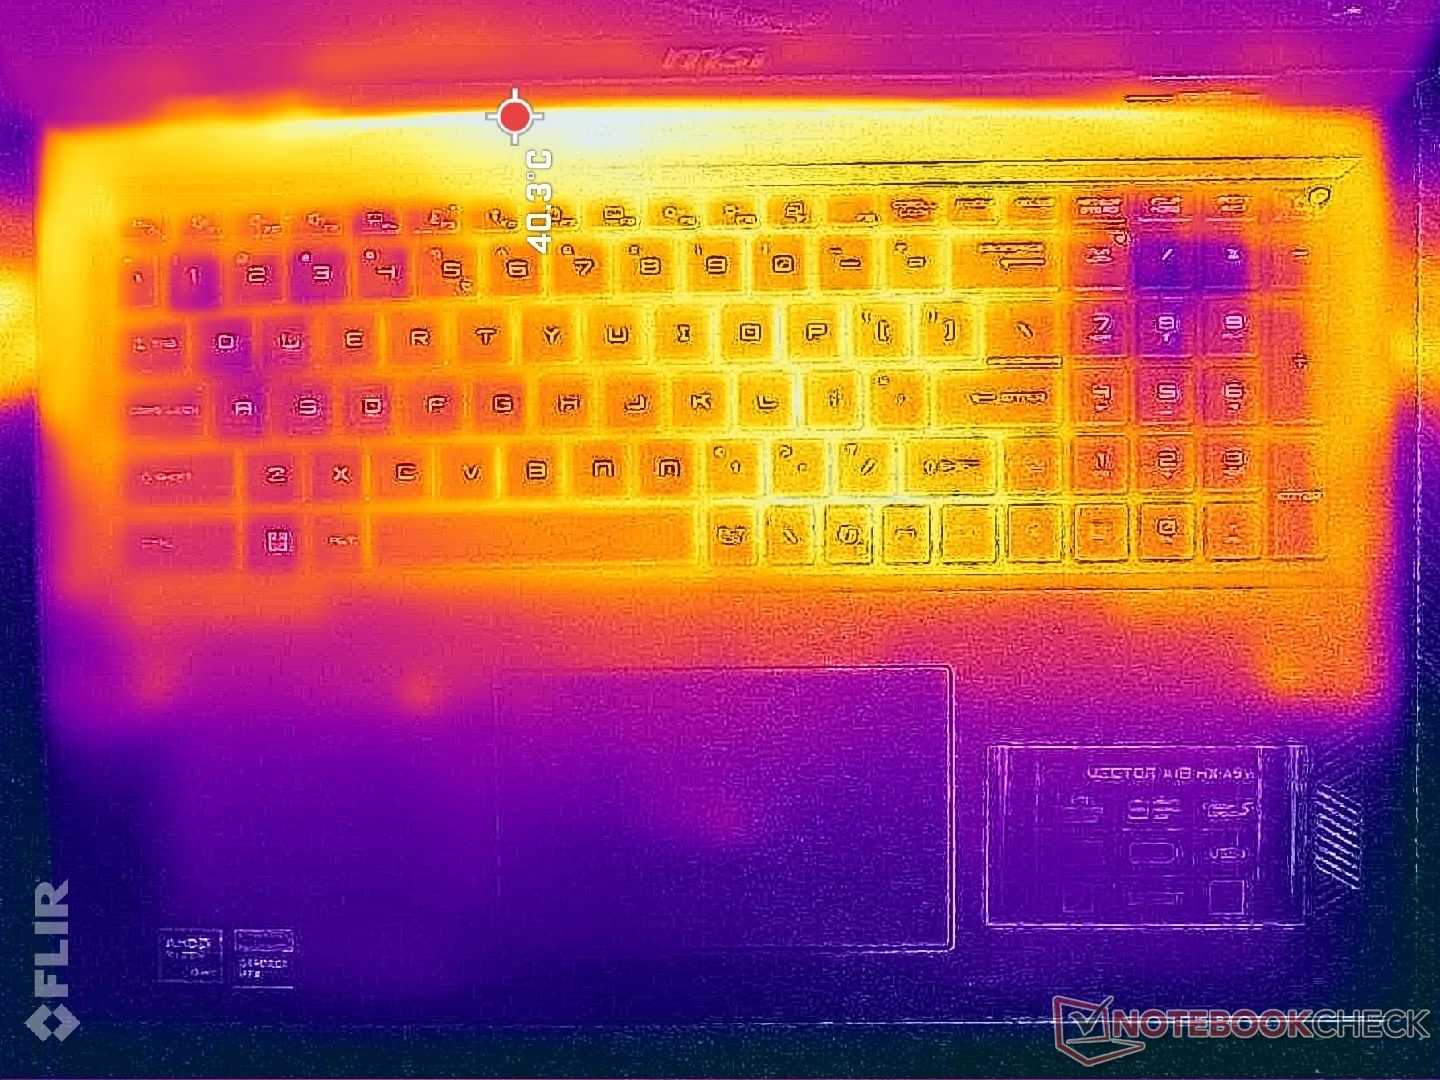
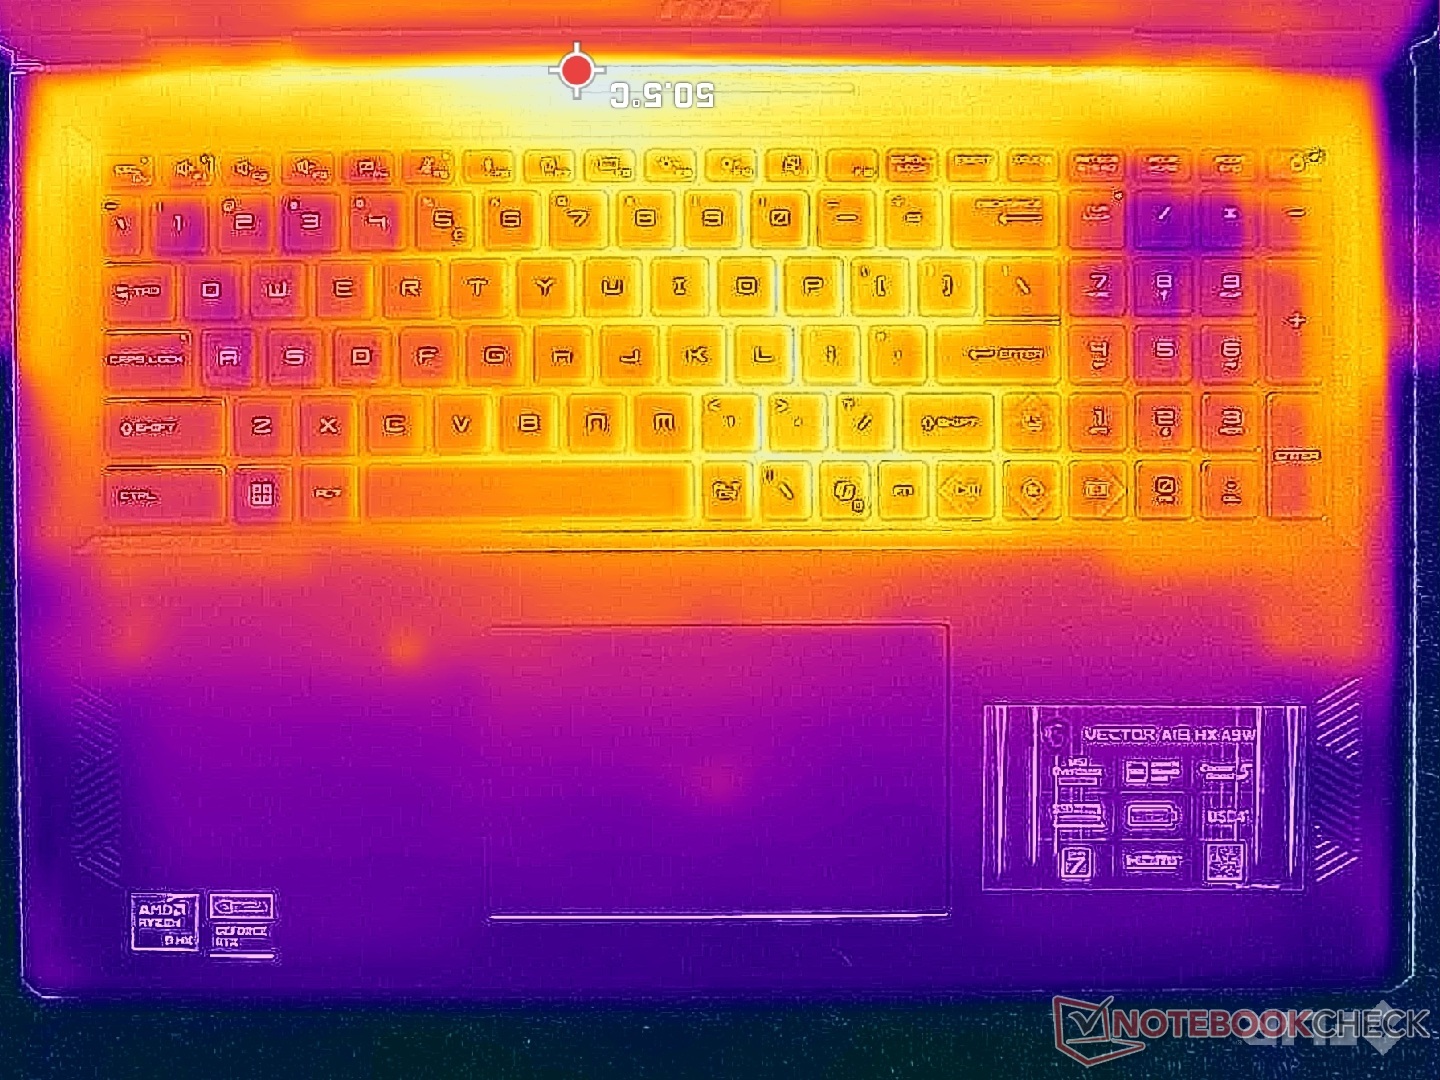
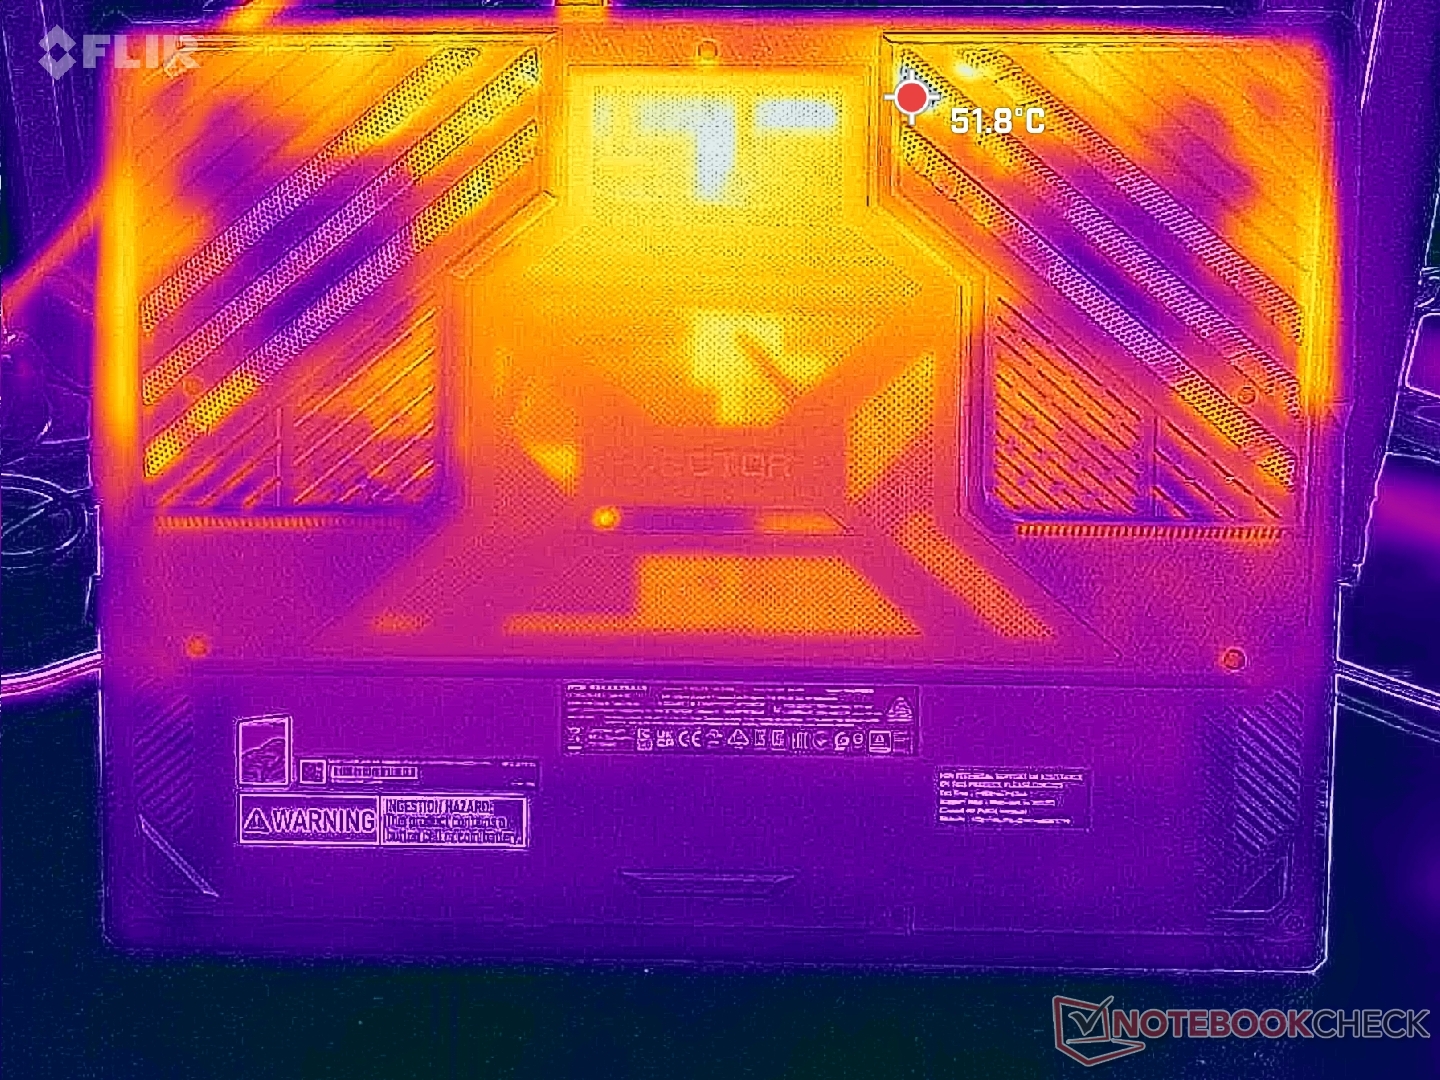
Surface temperatures are warmest on the keyboard center while the WASD keys and numpad areas remain cooler since these are directly above the two internal fans. The palm rests do not heat up appreciably when gaming for more comfortable hands.
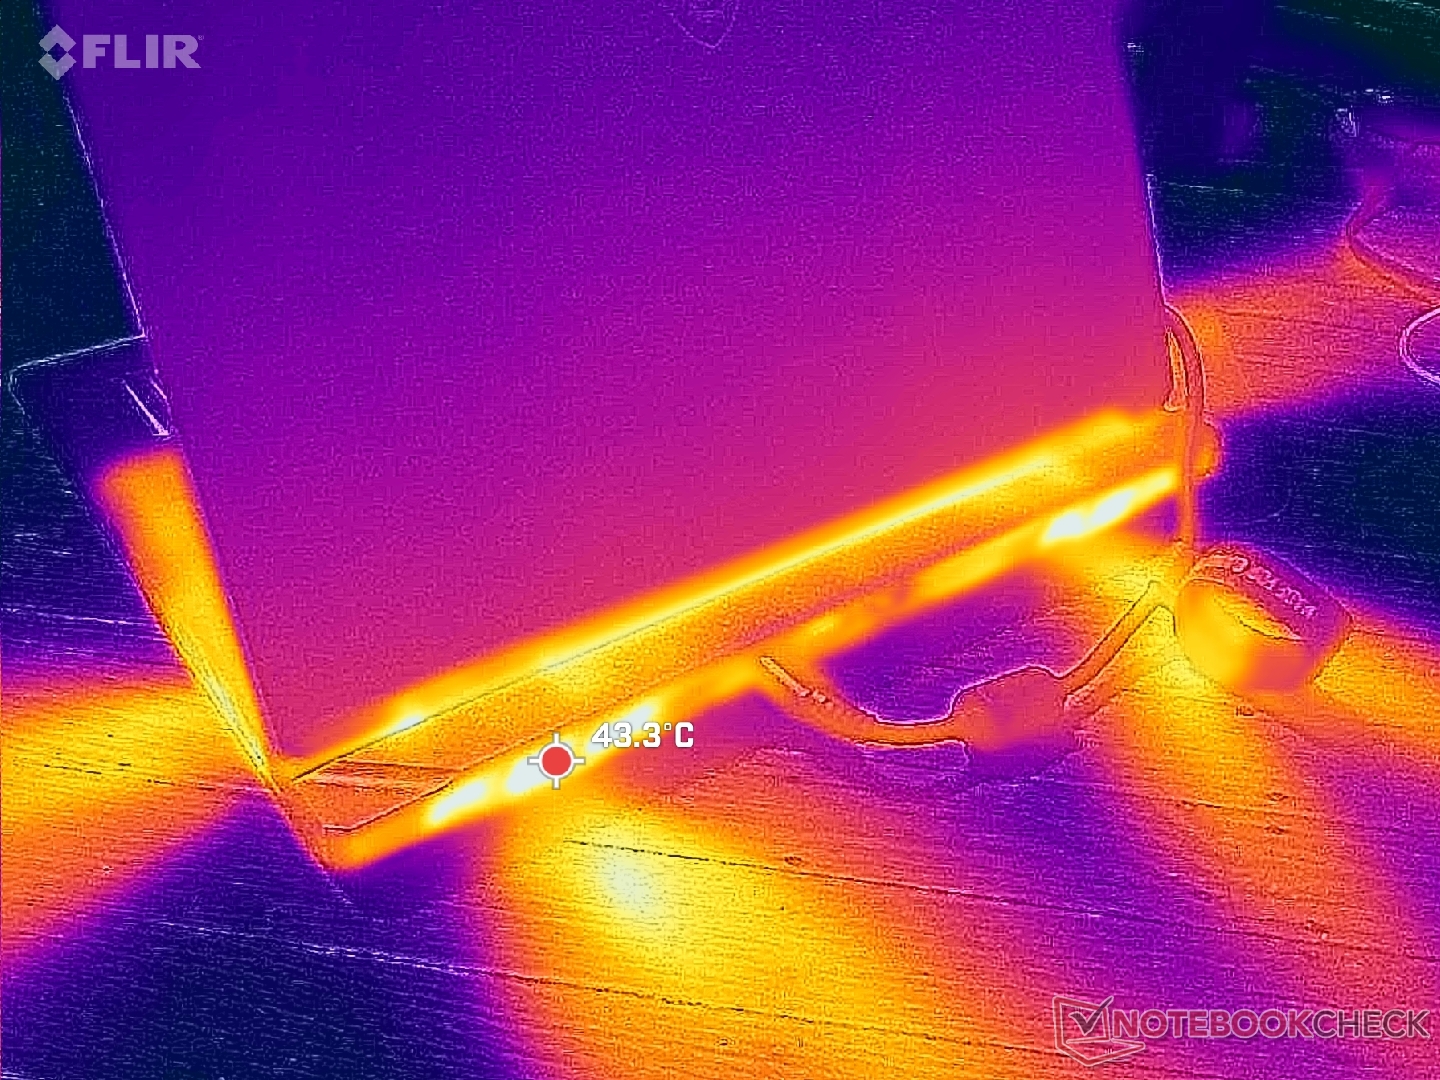
(-) The maximum temperature on the upper side is 46.6 °C / 116 F, compared to the average of 40.4 °C / 105 F, ranging from 21.2 to 68.8 °C for the class Gaming.
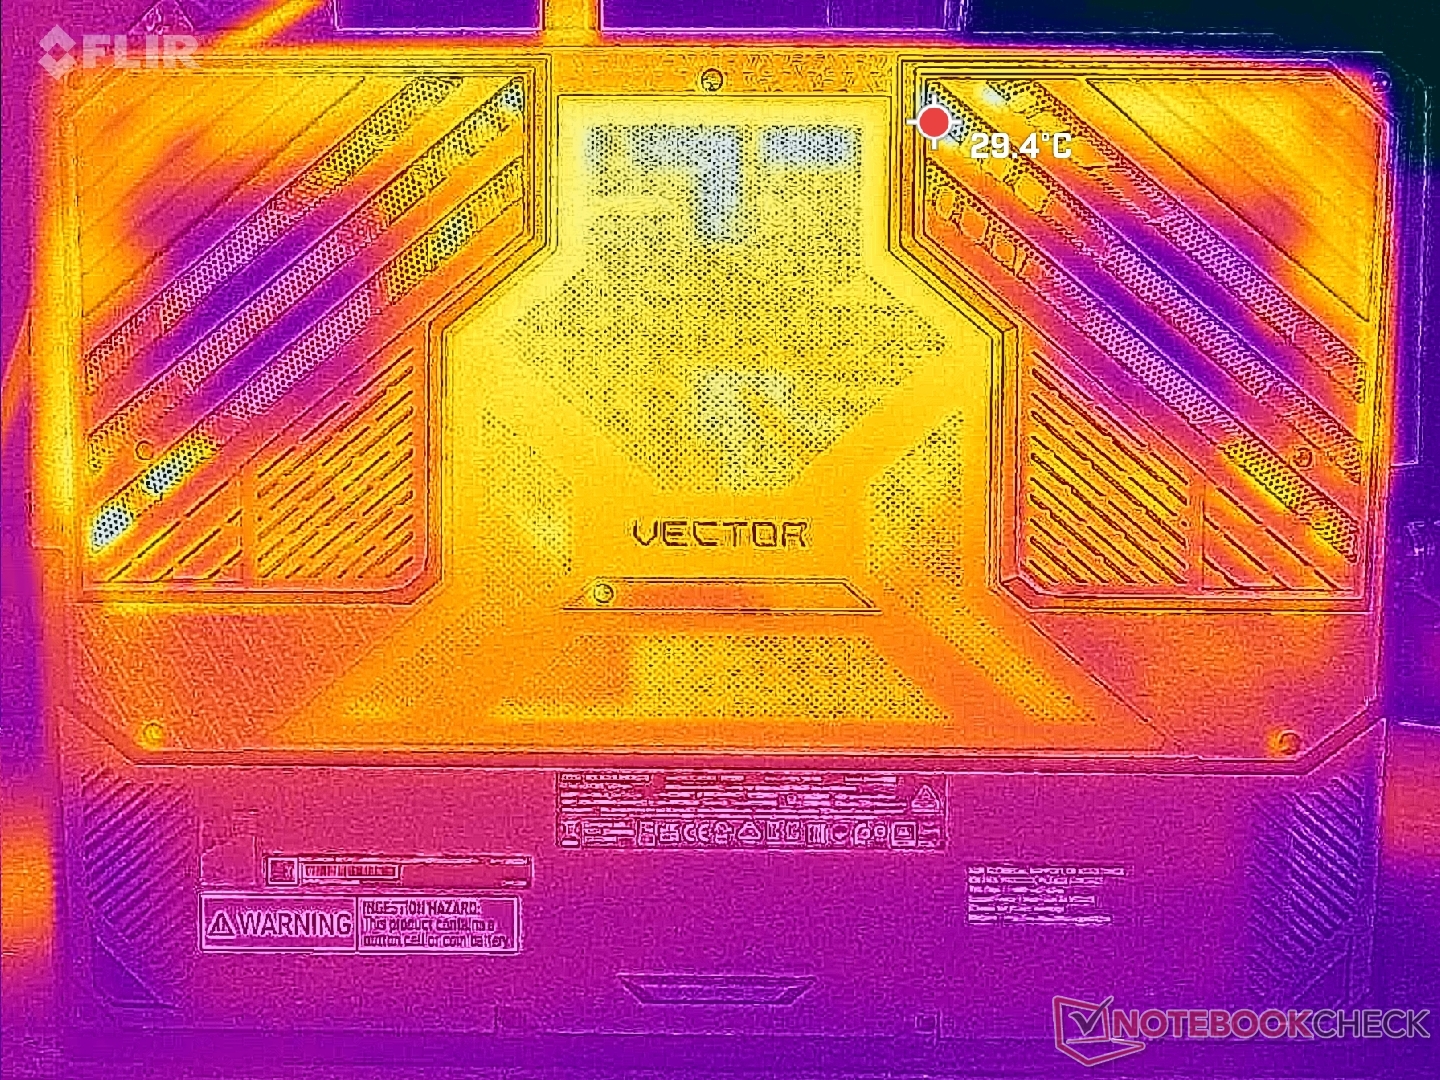
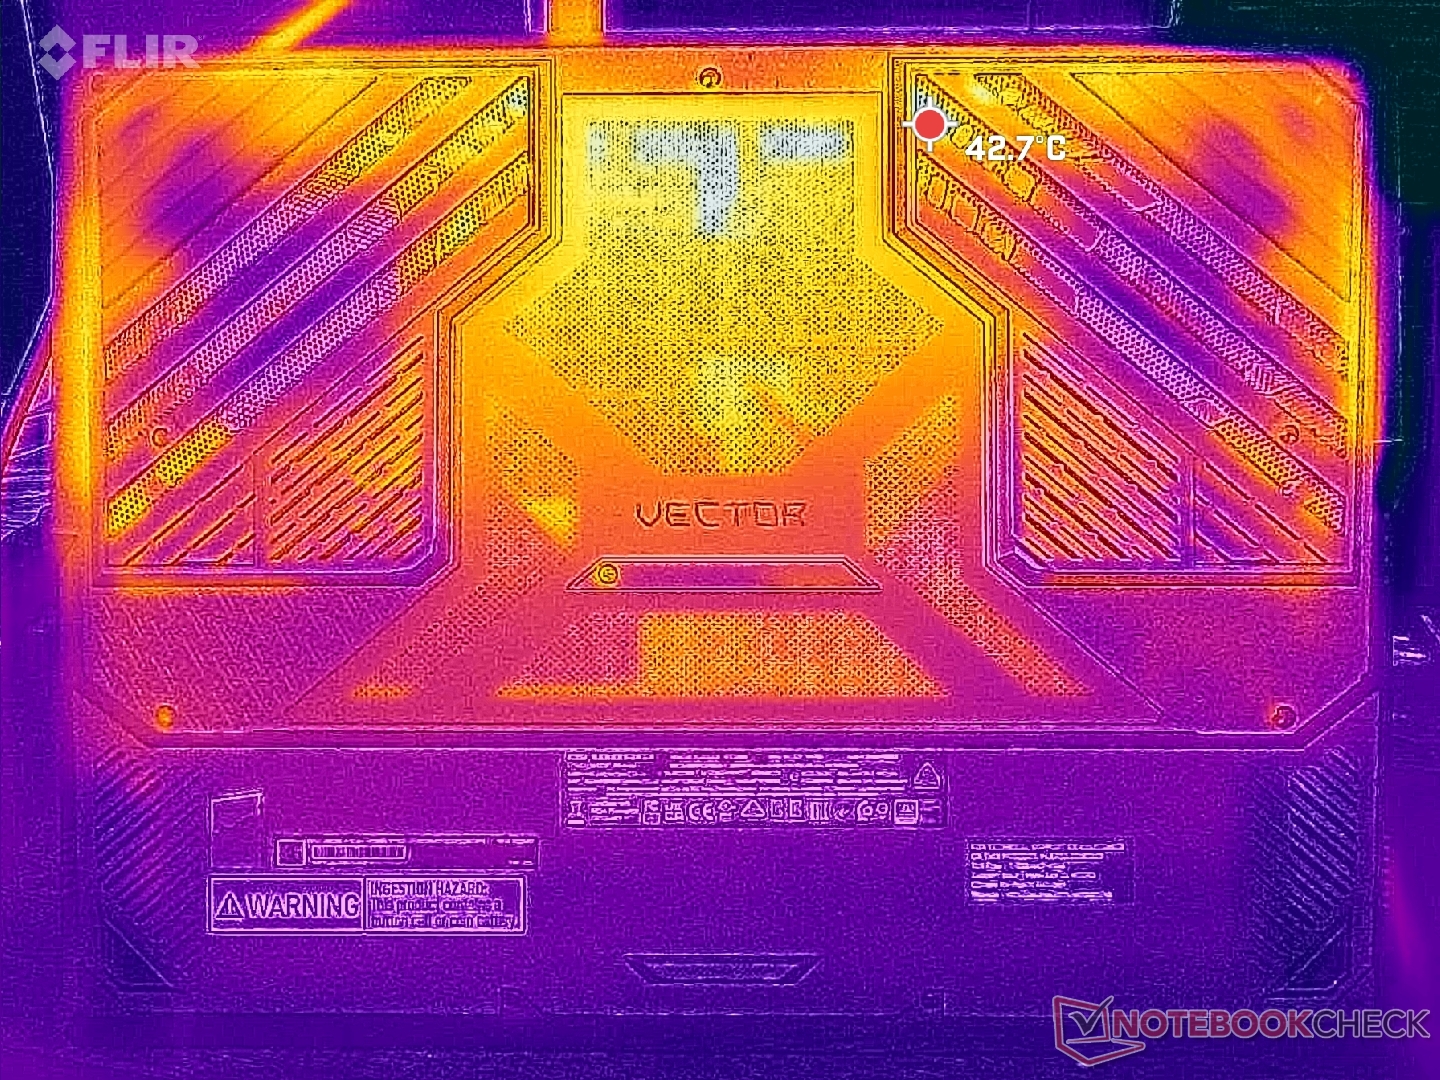
(-) The bottom heats up to a maximum of 45.6 °C / 114 F, compared to the average of 43.2 °C / 110 F
(+) In idle usage, the average temperature for the upper side is 27.4 °C / 81 F, compared to the device average of 33.9 °C / 93 F.
(±) 3: The average temperature for the upper side is 32 °C / 90 F, compared to the average of 33.9 °C / 93 F for the class Gaming.
(+) The palmrests and touchpad are cooler than skin temperature with a maximum of 30.2 °C / 86.4 F and are therefore cool to the touch.
(±) The average temperature of the palmrest area of similar devices was 28.8 °C / 83.8 F (-1.4 °C / -2.6 F).
| MSI Vector A18 HX A9W AMD Ryzen 9 9955HX, NVIDIA GeForce RTX 5070 Ti Laptop | MSI Raider 18 HX A14V Intel Core i9-14900HX, NVIDIA GeForce RTX 4080 Laptop GPU | Asus Strix Scar 18 G835LX Intel Core Ultra 9 275HX, NVIDIA GeForce RTX 5090 Laptop | Razer Blade 18 2024 RZ09-0509 Intel Core i9-14900HX, NVIDIA GeForce RTX 4090 Laptop GPU | Alienware m18 R2 Intel Core i9-14900HX, NVIDIA GeForce RTX 4090 Laptop GPU | Acer Predator Helios 18 PH18-72-98MW Intel Core i9-14900HX, NVIDIA GeForce RTX 4090 Laptop GPU | |
|---|---|---|---|---|---|---|
| Heat | -7% | 2% | -7% | -13% | -11% | |
| Maximum Upper Side * (°C) | 46.6 | 40.8 12% | 45.6 2% | 43.2 7% | 41.2 12% | 43 8% |
| Maximum Bottom * (°C) | 45.6 | 43.4 5% | 46 -1% | 42.6 7% | 34.6 24% | 59 -29% |
| Idle Upper Side * (°C) | 31.2 | 36.4 -17% | 28.9 7% | 36 -15% | 42.8 -37% | 32 -3% |
| Idle Bottom * (°C) | 28.6 | 36.4 -27% | 29.2 -2% | 36.4 -27% | 43.6 -52% | 34 -19% |
* ... smaller is better
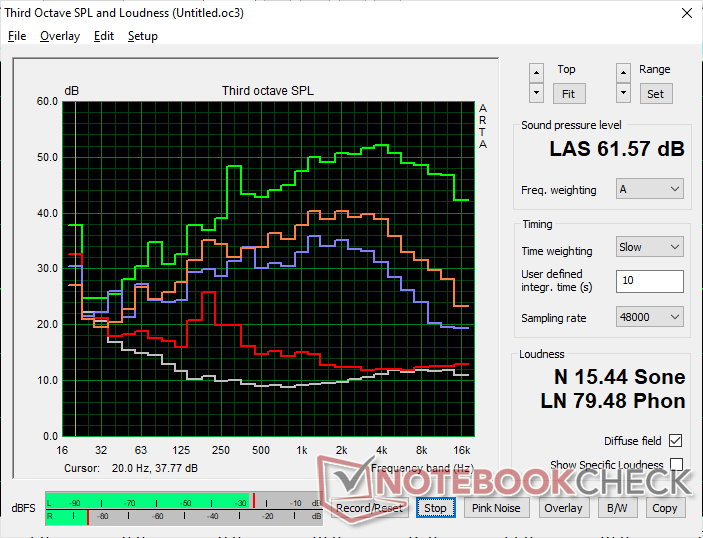
Speakers
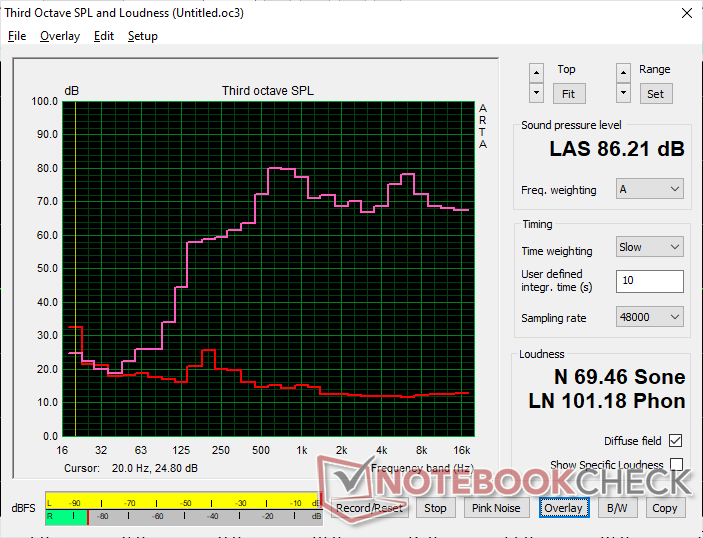
MSI Vector A18 HX A9W audio analysis
(+) | speakers can play relatively loud (86.2 dB)
Bass 100 - 315 Hz
(-) | nearly no bass - on average 16% lower than median
(±) | linearity of bass is average (10.9% delta to prev. frequency)
Mids 400 - 2000 Hz
(±) | higher mids - on average 5.7% higher than median
(±) | linearity of mids is average (7.2% delta to prev. frequency)
Highs 2 - 16 kHz
(+) | balanced highs - only 3.3% away from median
(+) | highs are linear (6.8% delta to prev. frequency)
Overall 100 - 16.000 Hz
(+) | overall sound is linear (13.5% difference to median)
Compared to same class
» 19% of all tested devices in this class were better, 7% similar, 74% worse
» The best had a delta of 6%, average was 18%, worst was 132%
Compared to all devices tested
» 14% of all tested devices were better, 4% similar, 82% worse
» The best had a delta of 4%, average was 24%, worst was 134%
Apple MacBook Pro 16 2021 M1 Pro audio analysis
(+) | speakers can play relatively loud (84.7 dB)
Bass 100 - 315 Hz
(+) | good bass - only 3.8% away from median
(+) | bass is linear (5.2% delta to prev. frequency)
Mids 400 - 2000 Hz
(+) | balanced mids - only 1.3% away from median
(+) | mids are linear (2.1% delta to prev. frequency)
Highs 2 - 16 kHz
(+) | balanced highs - only 1.9% away from median
(+) | highs are linear (2.7% delta to prev. frequency)
Overall 100 - 16.000 Hz
(+) | overall sound is linear (4.6% difference to median)
Compared to same class
» 0% of all tested devices in this class were better, 0% similar, 100% worse
» The best had a delta of 5%, average was 17%, worst was 45%
Compared to all devices tested
» 0% of all tested devices were better, 0% similar, 100% worse
» The best had a delta of 4%, average was 24%, worst was 134%
Energy Management
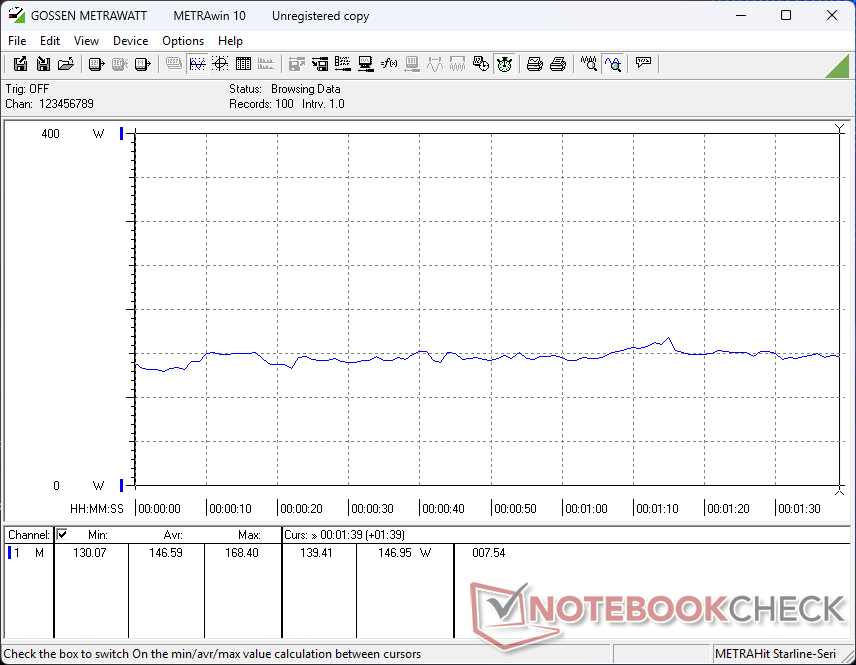
Power Consumption
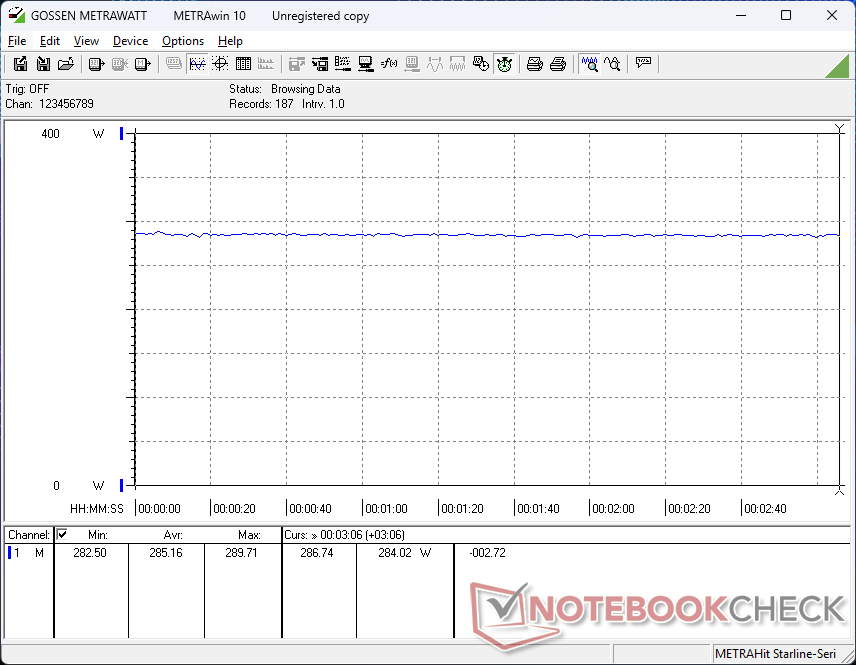
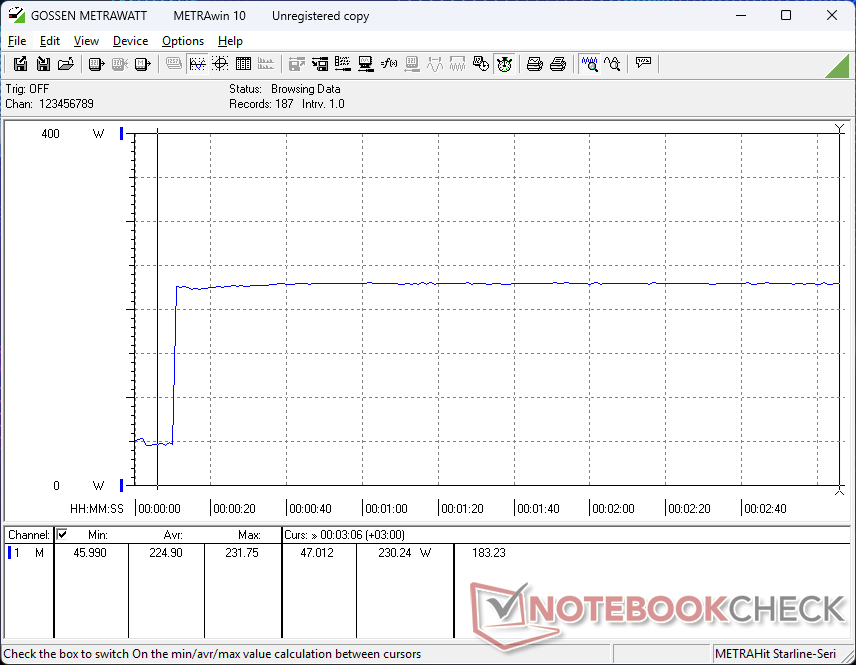
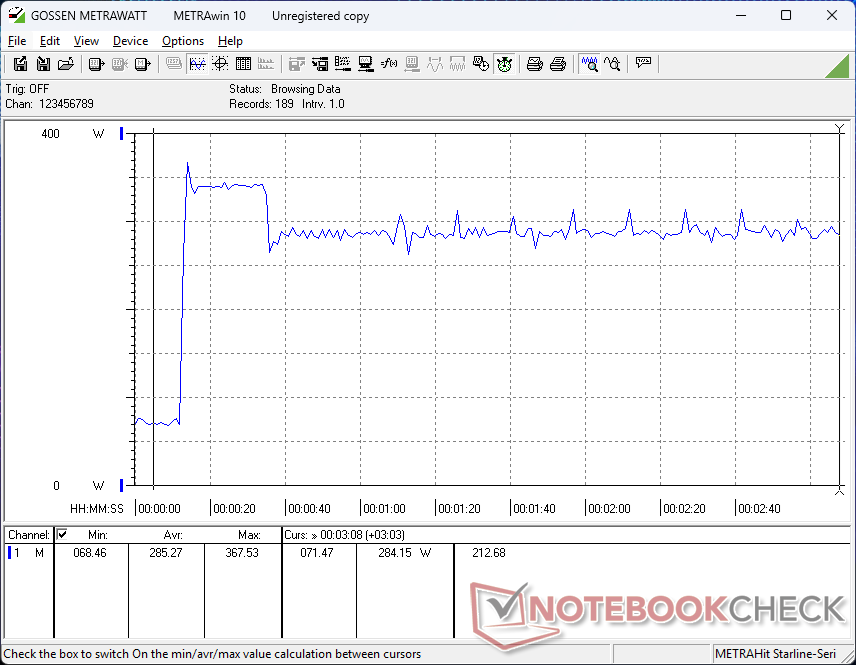
Consumption when running Prime95 is about 10 percent higher than the Core i9-14900HX-powered Raider 18 HX while providing a 30 percent boost to multi-thread performance. Similarly, consumption when running FurMark is about 20 percent less than the RTX 4080-powered Raider 18 HX while being neck-to-neck in graphics performance. The Vector A18 HX is therefore a more efficient gaming laptop with higher performance-per-watt.
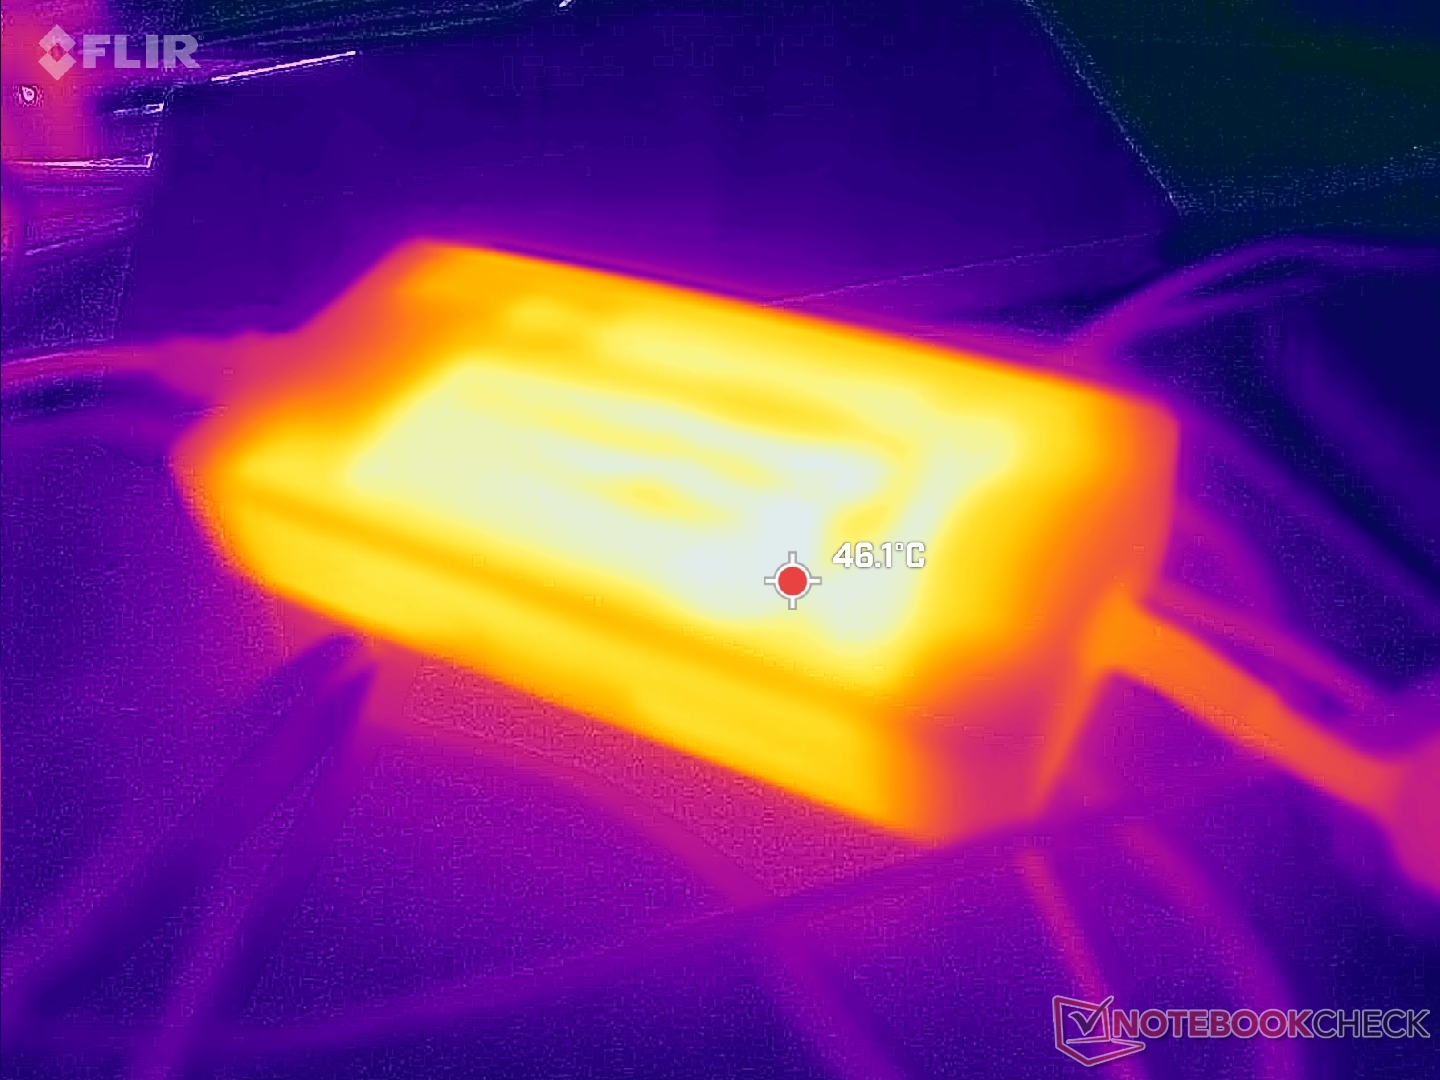
The 400 W AC adapter is quite large at ~18.8 x 8.8 x 3.3 cm. We're only able to record a maximum draw of 297 W on our 140 W RTX 5070 Ti configuration, but the 175 W RTX 5080 configuration will likely demand more.
| Off / Standby | |
| Idle | |
| Load |
|
Key:
min: | |
| MSI Vector A18 HX A9W R9 9955HX, GeForce RTX 5070 Ti Laptop, , IPS, 2560x1600, 18" | MSI Raider 18 HX A14V i9-14900HX, GeForce RTX 4080 Laptop GPU, Samsung PM9A1 MZVL22T0HBLB, Mini-LED, 3840x2400, 18" | Asus Strix Scar 18 G835LX Ultra 9 275HX, GeForce RTX 5090 Laptop, WD PC SN8000S 2TB, Mini-LED, 2560x1600, 18" | Razer Blade 18 2024 RZ09-0509 i9-14900HX, GeForce RTX 4090 Laptop GPU, , Mini-LED, 2560x1600, 18" | Alienware m18 R2 i9-14900HX, GeForce RTX 4090 Laptop GPU, SK Hynix PC811 HFS002TEM9X152N, IPS, 2560x1600, 18" | Acer Predator Helios 18 PH18-72-98MW i9-14900HX, GeForce RTX 4090 Laptop GPU, 2x SK Hynix HFS001TEJ9X115N (RAID 0), Mini-LED, 2560x1600, 18" | |
|---|---|---|---|---|---|---|
| Power Consumption | -0% | 4% | 3% | 14% | 0% | |
| Idle Minimum * (Watt) | 20.8 | 27.7 -33% | 11.4 45% | 25.4 -22% | 10.6 49% | 31 -49% |
| Idle Average * (Watt) | 52.8 | 38.3 27% | 39.2 26% | 37.7 29% | 20.9 60% | 35 34% |
| Idle Maximum * (Watt) | 54.5 | 47.1 14% | 40.2 26% | 57.9 -6% | 40 27% | 43 21% |
| Load Average * (Watt) | 146.6 | 121.2 17% | 161.2 -10% | 128.4 12% | 201.1 -37% | 144 2% |
| Cyberpunk 2077 ultra external monitor * (Watt) | 278 | 306 -10% | 295 -6% | |||
| Cyberpunk 2077 ultra * (Watt) | 285 | 313 -10% | 303 -6% | |||
| Load Maximum * (Watt) | 297.3 | 321.8 -8% | 430.9 -45% | 297.9 -0% | 378.9 -27% | 318 -7% |
| Witcher 3 ultra * (Watt) | 273.1 | 358 | 228 |
* ... smaller is better
Power Consumption Cyberpunk / Stress Test
Power Consumption external Monitor
Battery Life
| MSI Vector A18 HX A9W R9 9955HX, GeForce RTX 5070 Ti Laptop, 99 Wh | MSI Raider 18 HX A14V i9-14900HX, GeForce RTX 4080 Laptop GPU, 99.9 Wh | Asus Strix Scar 18 G835LX Ultra 9 275HX, GeForce RTX 5090 Laptop, 90 Wh | Razer Blade 18 2024 RZ09-0509 i9-14900HX, GeForce RTX 4090 Laptop GPU, 91.7 Wh | Alienware m18 R2 i9-14900HX, GeForce RTX 4090 Laptop GPU, 97 Wh | Acer Predator Helios 18 PH18-72-98MW i9-14900HX, GeForce RTX 4090 Laptop GPU, 90 Wh | |
|---|---|---|---|---|---|---|
| Battery runtime | -25% | 45% | 5% | 26% | -16% | |
| Reader / Idle (h) | 7 | 4.4 -37% | 6.6 -6% | |||
| WiFi v1.3 (h) | 3.8 | 3.3 -13% | 5.5 45% | 4.4 16% | 4.8 26% | 3.2 -16% |
| Load (h) | 1.3 | 1.2 | 1 | 1.1 | ||
| H.264 (h) | 5.8 | |||||
| Cyberpunk 2077 ultra 150cd (h) | 0.7 |
Notebookcheck Rating
MSI Vector A18 HX A9W
- 05/07/2025 v8
Allen Ngo
 Total Sustainability Score:
 Potential Competitors in Comparison
Image | Model / Review | Price | Weight | Height | Display |
|---|---|---|---|---|---|
1. 84.8%  | MSI Vector A18 HX A9W AMD Ryzen 9 9955HX ⎘ NVIDIA GeForce RTX 5070 Ti Laptop ⎘ 32 GB Memory | Amazon: List Price: 3200 USD | 3.5 kg | 32.05 mm | 18.00" 2560x1600 189 PPI IPS |
2. 84.7%  | MSI Raider 18 HX A14V Intel Core i9-14900HX ⎘ NVIDIA GeForce RTX 4080 Laptop GPU ⎘ 64 GB Memory, 2048 GB SSD | Amazon: 1. $74.99 330W 280W Laptop Charger Com... 2. $54.99 Smatree Hard EVA Protective ... 3. $95.99 400W 20V 20A AC Charger Comp... List Price: 3400 USD | 3.6 kg | 32 mm | 18.00" 3840x2400 252 PPI Mini-LED |
3. 88%  | Asus Strix Scar 18 G835LX Intel Core Ultra 9 275HX ⎘ NVIDIA GeForce RTX 5090 Laptop ⎘ 64 GB Memory, 2048 GB SSD | Amazon: List Price: 5799€ | 3.3 kg | 32 mm | 18.00" 2560x1600 168 PPI Mini-LED |
4. 90.5% v7 (old)  | Razer Blade 18 2024 RZ09-0509 Intel Core i9-14900HX ⎘ NVIDIA GeForce RTX 4090 Laptop GPU ⎘ 32 GB Memory | Amazon: List Price: 4500 USD | 3.1 kg | 21.9 mm | 18.00" 2560x1600 168 PPI Mini-LED |
5. 89.5% v7 (old)  | Alienware m18 R2 Intel Core i9-14900HX ⎘ NVIDIA GeForce RTX 4090 Laptop GPU ⎘ 32 GB Memory, 2048 GB SSD | Amazon: 1. $2,475.90 Alienware 18 Area-51 Gaming ... 2. $3,289.70 Alienware 18 Area-51 Gaming ... 3. $3,700.00 Dell Alienware 18 Area-51 Ga... List Price: 3300 USD | 4 kg | 26.7 mm | 18.00" 2560x1600 168 PPI IPS |
6. 87.1% v7 (old)  | Acer Predator Helios 18 PH18-72-98MW Intel Core i9-14900HX ⎘ NVIDIA GeForce RTX 4090 Laptop GPU ⎘ 32 GB Memory, 2048 GB SSD | Amazon: 1. $23.99 DC Power Jack Charging Port ... 2. $69.00 330W 19.5V 16.92A AC Charger... 3. $2,849.00 acer Predator Helios Neo 18"... | 3.3 kg | 29.5 mm | 18.00" 2560x1600 168 PPI Mini-LED |
Transparency
The selection of devices to be reviewed is made by our editorial team. The test sample was provided to the author as a loan by the manufacturer or retailer for the purpose of this review. The lender had no influence on this review, nor did the manufacturer receive a copy of this review before publication. There was no obligation to publish this review. As an independent media company, Notebookcheck is not subjected to the authority of manufacturers, retailers or publishers.
This is how Notebookcheck is testing
Every year, Notebookcheck independently reviews hundreds of laptops and smartphones using standardized procedures to ensure that all results are comparable. We have continuously developed our test methods for around 20 years and set industry standards in the process. In our test labs, high-quality measuring equipment is utilized by experienced technicians and editors. These tests involve a multi-stage validation process. Our complex rating system is based on hundreds of well-founded measurements and benchmarks, which maintains objectivity. Further information on our test methods can be found here.
