Razer Blade 18 2024 review: First laptop to market with both mini-LED and Thunderbolt 5
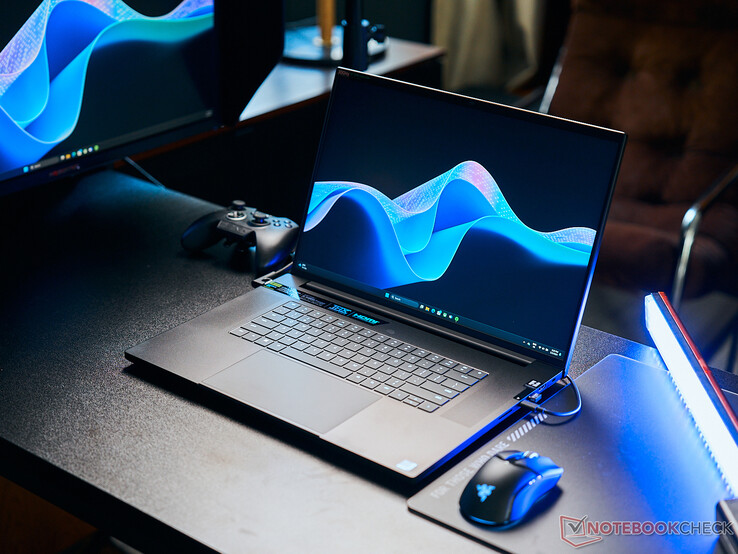
The Razer Blade 18 made its debut in 2023 with a design heavily inspired by the aging Blade 17. For 2024, the latest revision utilizes the same chassis design as the previous year but with additional high-level features to attract performance hunters and enthusiasts. These new options include a Core i9-14900HX Raptor Lake CPU, Thunderbolt 5 connectivity, and an optional 4K 16:10 200 Hz IPS display. The latter two in particular are debuting first on the Razer system before eventually appearing on other manufacturers.
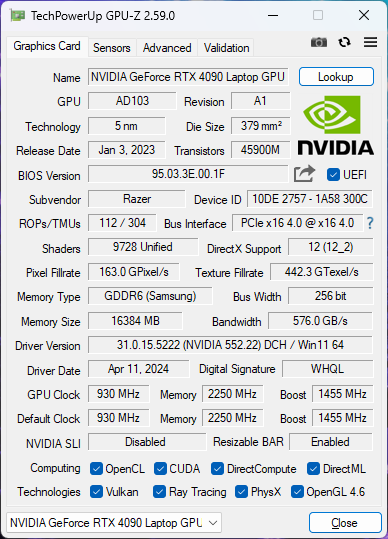
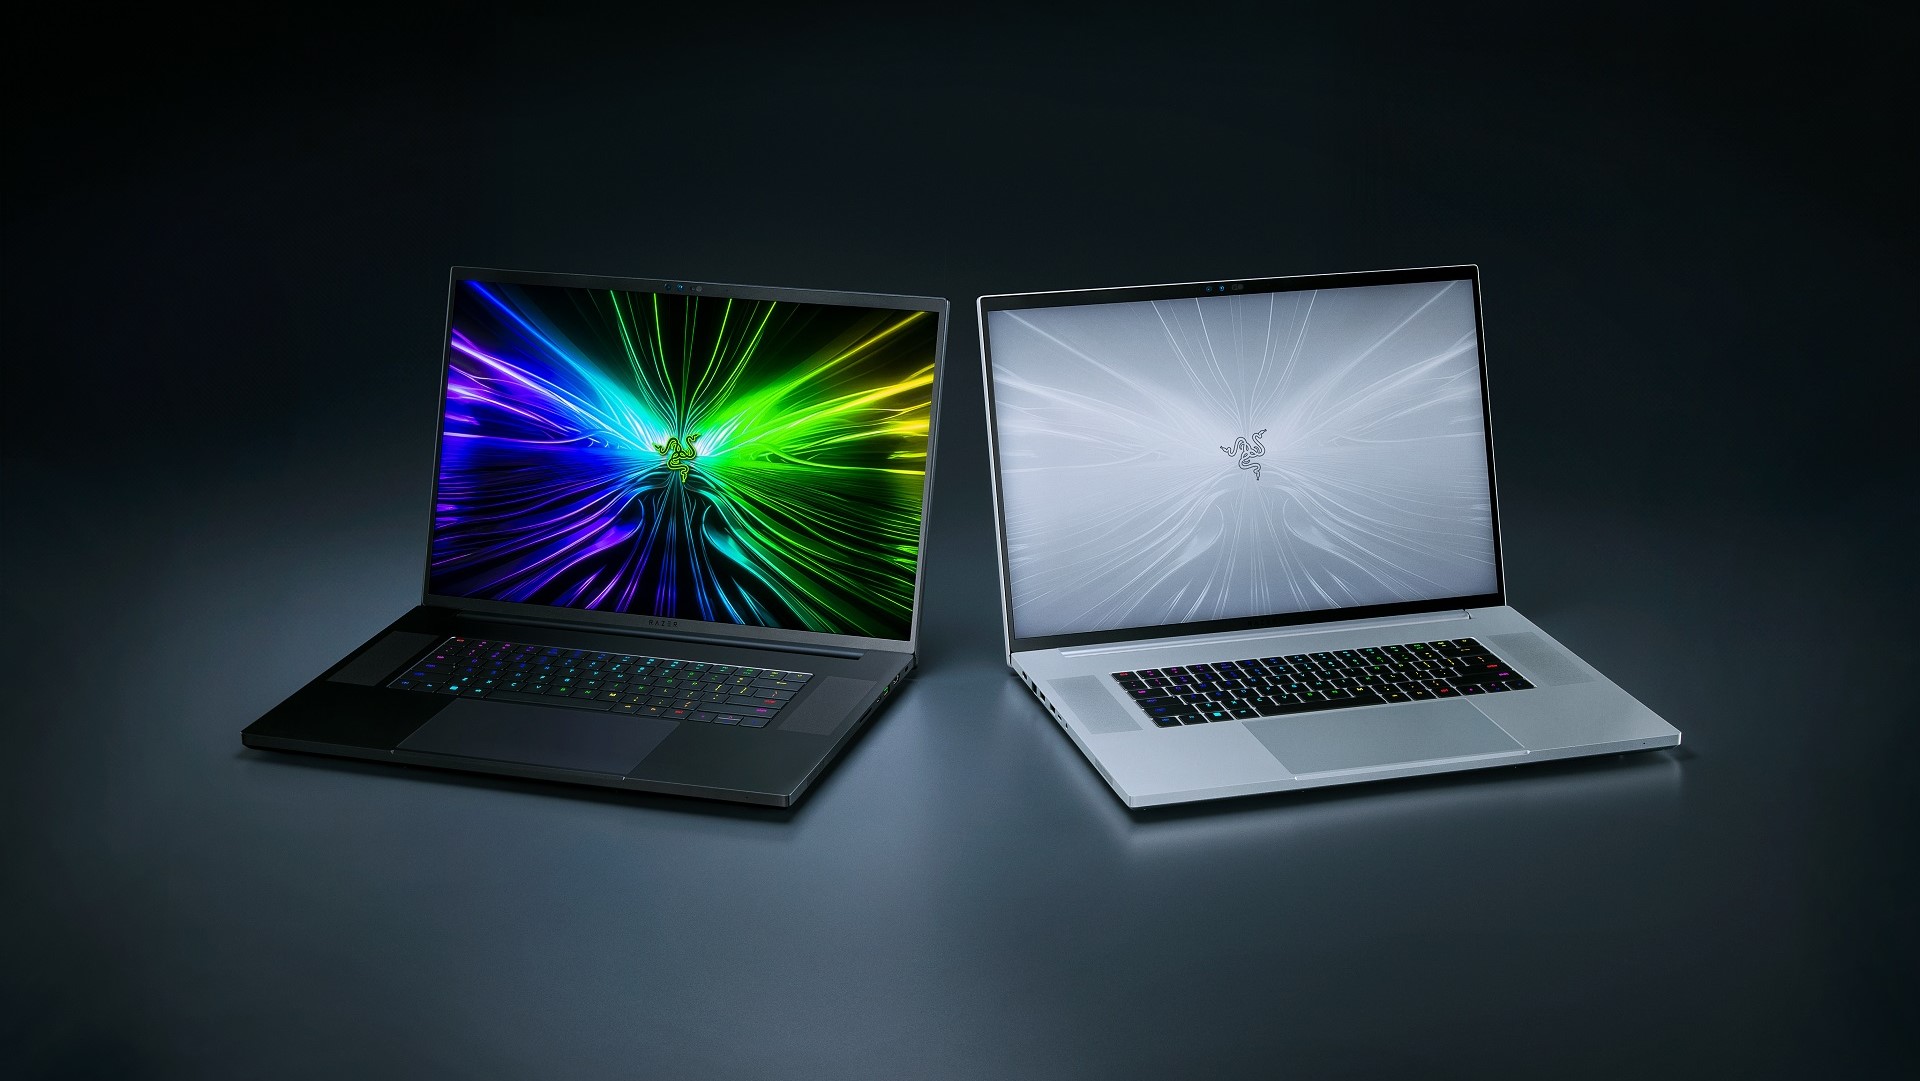
Our configuration in review comes with the 175 W GeForce RTX 4090 GPU, 2 TB SSD, and 2560 x 1600 300 Hz Mini-LED display for approximately $4500 USD. Other SKUs ship with the GeForce RTX 4070/4080 or aforementioned 4K 200 Hz IPS display, but all configurations at the moment come with the same Core i9-14900HX CPU. The alternate Mercury White color is only available with select configurations.
There are a small handful of competitors to the Blade 18 including the MSI Titan 18, Asus ROG Strix Scar 18, Acer Predator Helios 18, or the massive Alienware m18 R2.
More Razer reviews:
Potential Competitors in Comparison
Rating | Date | Model | Weight | Height | Size | Resolution | Price |
|---|---|---|---|---|---|---|---|
| 90.5 % v7 (old) | 05 / 2024 | Razer Blade 18 2024 RZ09-0509 i9-14900HX, GeForce RTX 4090 Laptop GPU | 3.1 kg | 21.9 mm | 18.00" | 2560x1600 | |
| 89.5 % v7 (old) | 03 / 2024 | Alienware m18 R2 i9-14900HX, GeForce RTX 4090 Laptop GPU | 4 kg | 26.7 mm | 18.00" | 2560x1600 | |
| 87.2 % v7 (old) | 08 / 2023 | Asus ROG Strix Scar 17 G733PYV-LL053X R9 7945HX3D, GeForce RTX 4090 Laptop GPU | 2.9 kg | 28.3 mm | 17.30" | 2560x1440 | |
| 88.8 % v7 (old) | 01 / 2024 | MSI Titan 18 HX A14VIG i9-14900HX, GeForce RTX 4090 Laptop GPU | 3.6 kg | 32.1 mm | 18.00" | 3840x2400 | |
| 88.3 % v7 (old) | 02 / 2024 | Asus ROG Strix Scar 18 G834JYR (2024) i9-14900HX, GeForce RTX 4090 Laptop GPU | 3.1 kg | 30.8 mm | 18.00" | 2560x1600 | |
| 91.1 % v7 (old) | 02 / 2024 | Razer Blade 16 2024, RTX 4090 i9-14900HX, GeForce RTX 4090 Laptop GPU | 2.5 kg | 22 mm | 16.00" | 2560x1600 |
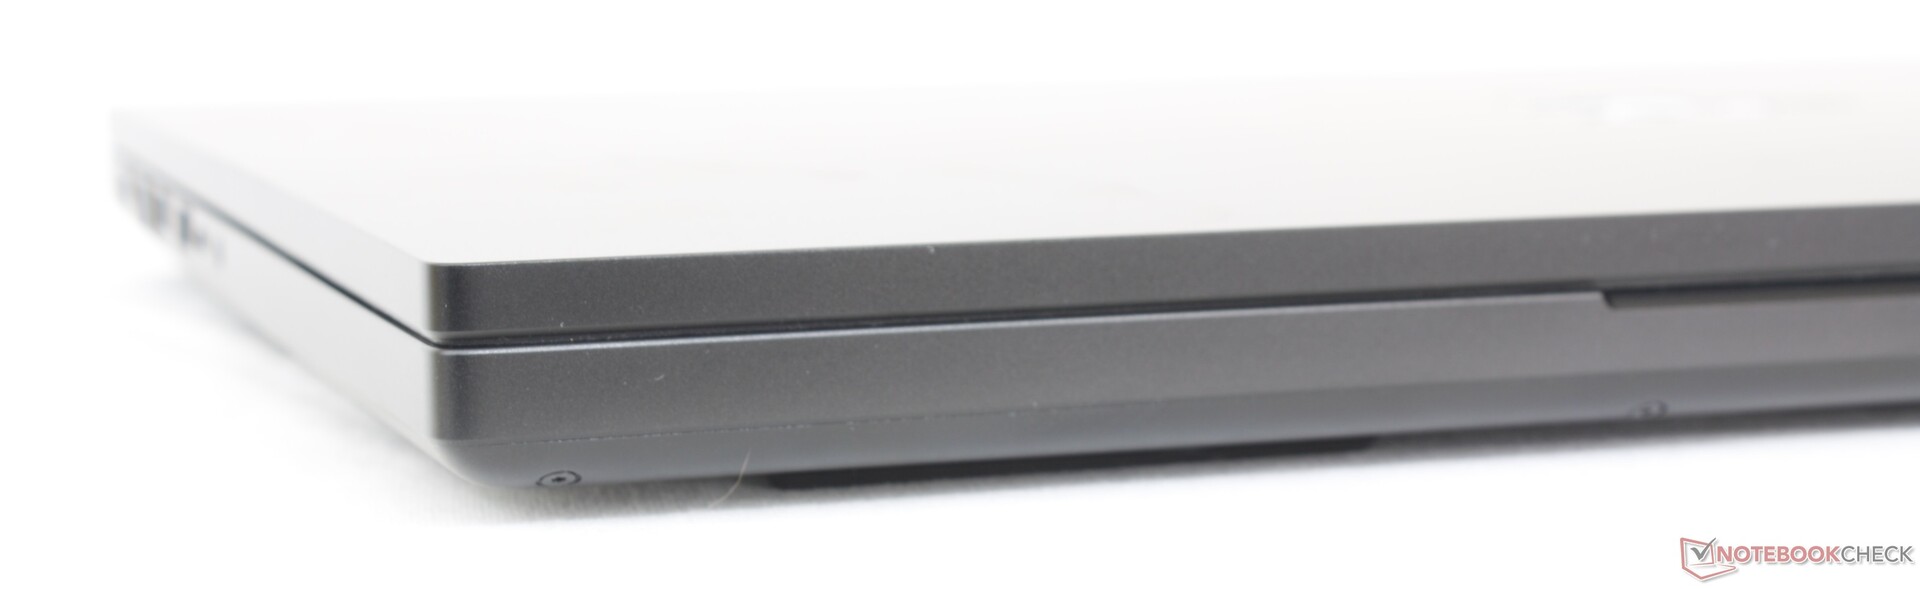
Case — As Sharp As Ever
We recommend checking out our review on the 2023 Blade 18 to learn more about the physical features of the model as all our comments still apply for the 2024 version. While there are no changes to the keyboard or chassis to tell the two years apart, there is actually one small addition to help visually distinguish them; the 2024 model now includes a manual webcam slider whereas the 2023 model did not.
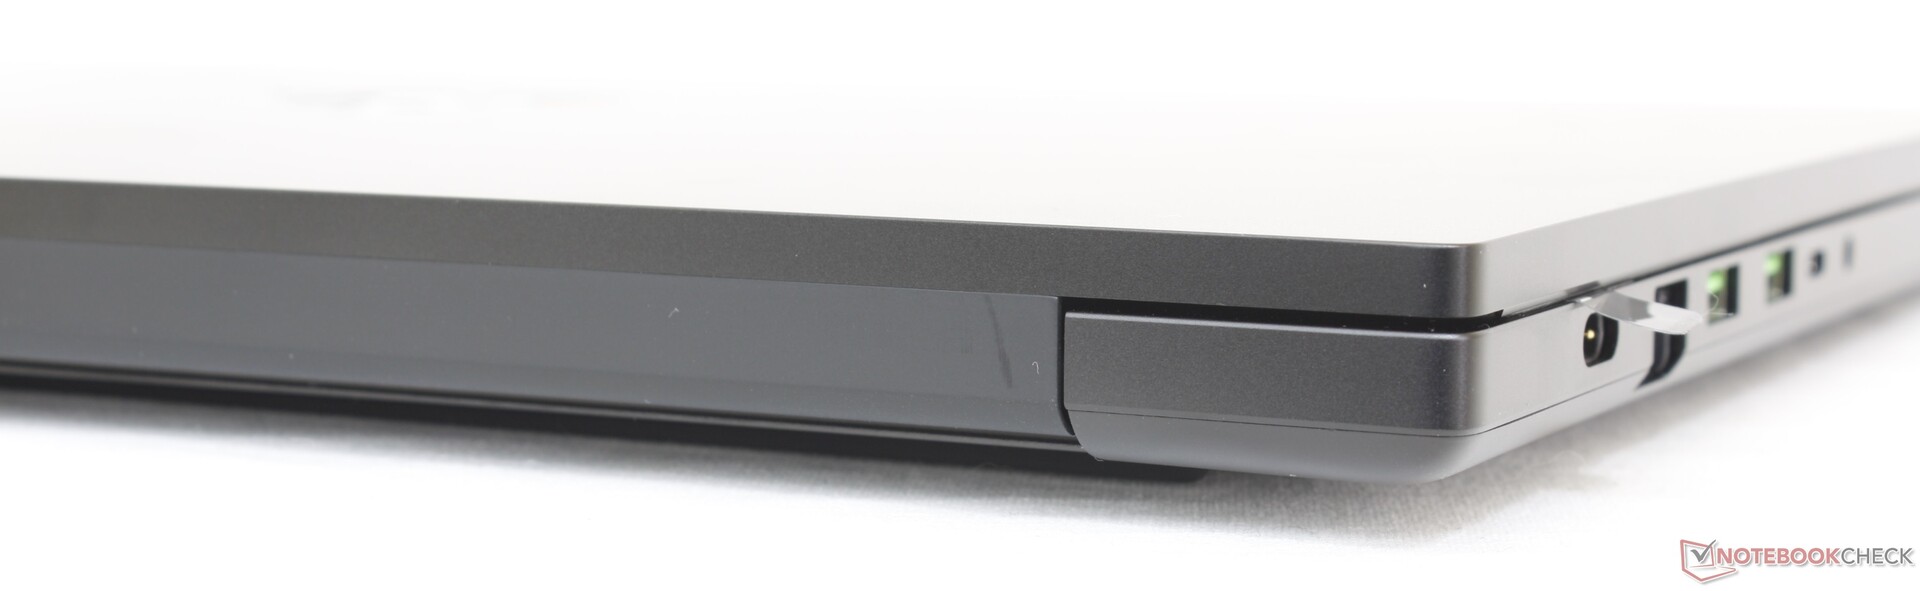
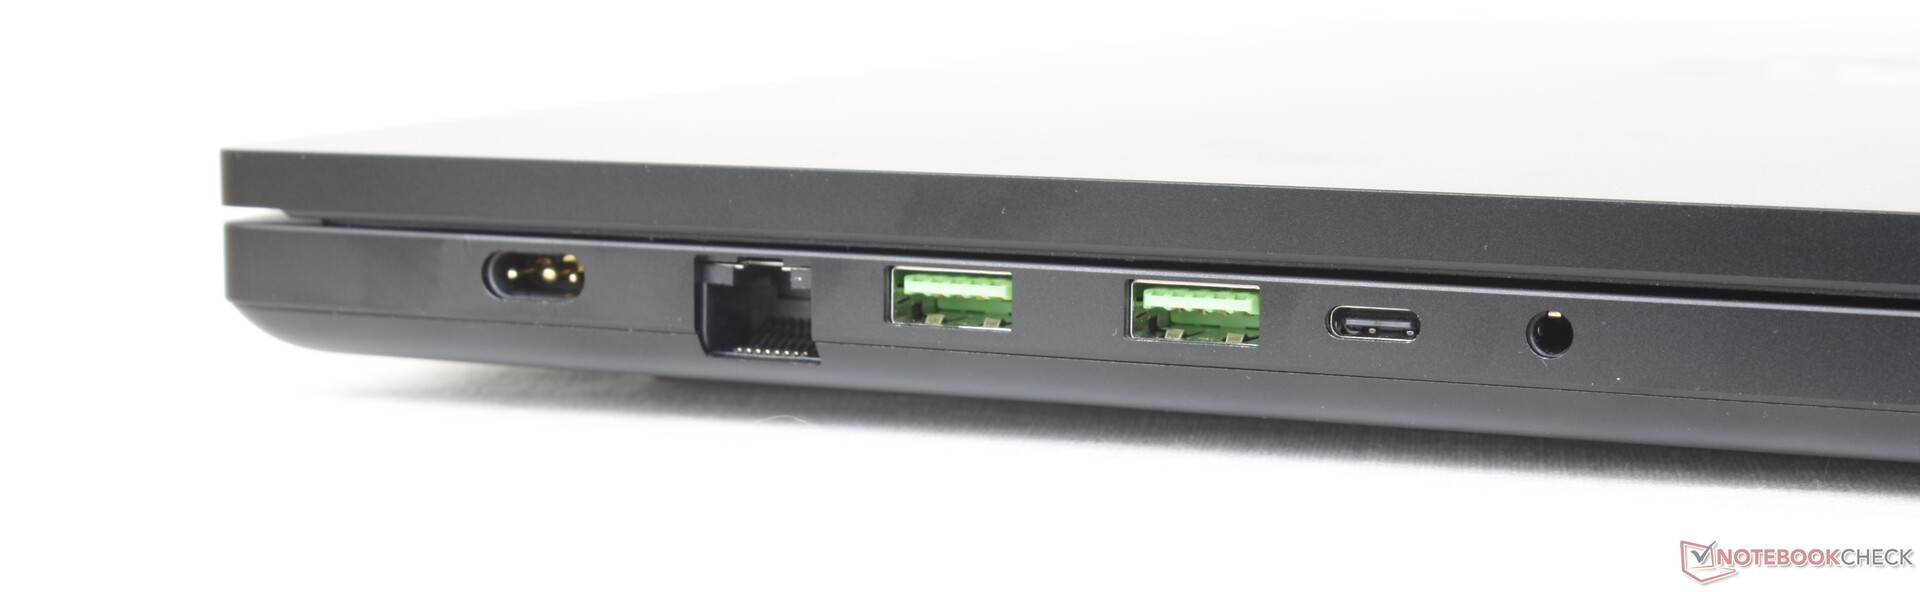
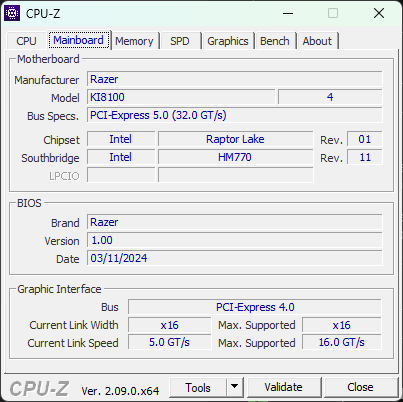
Connectivity — Futureproofing With Thunderbolt 5
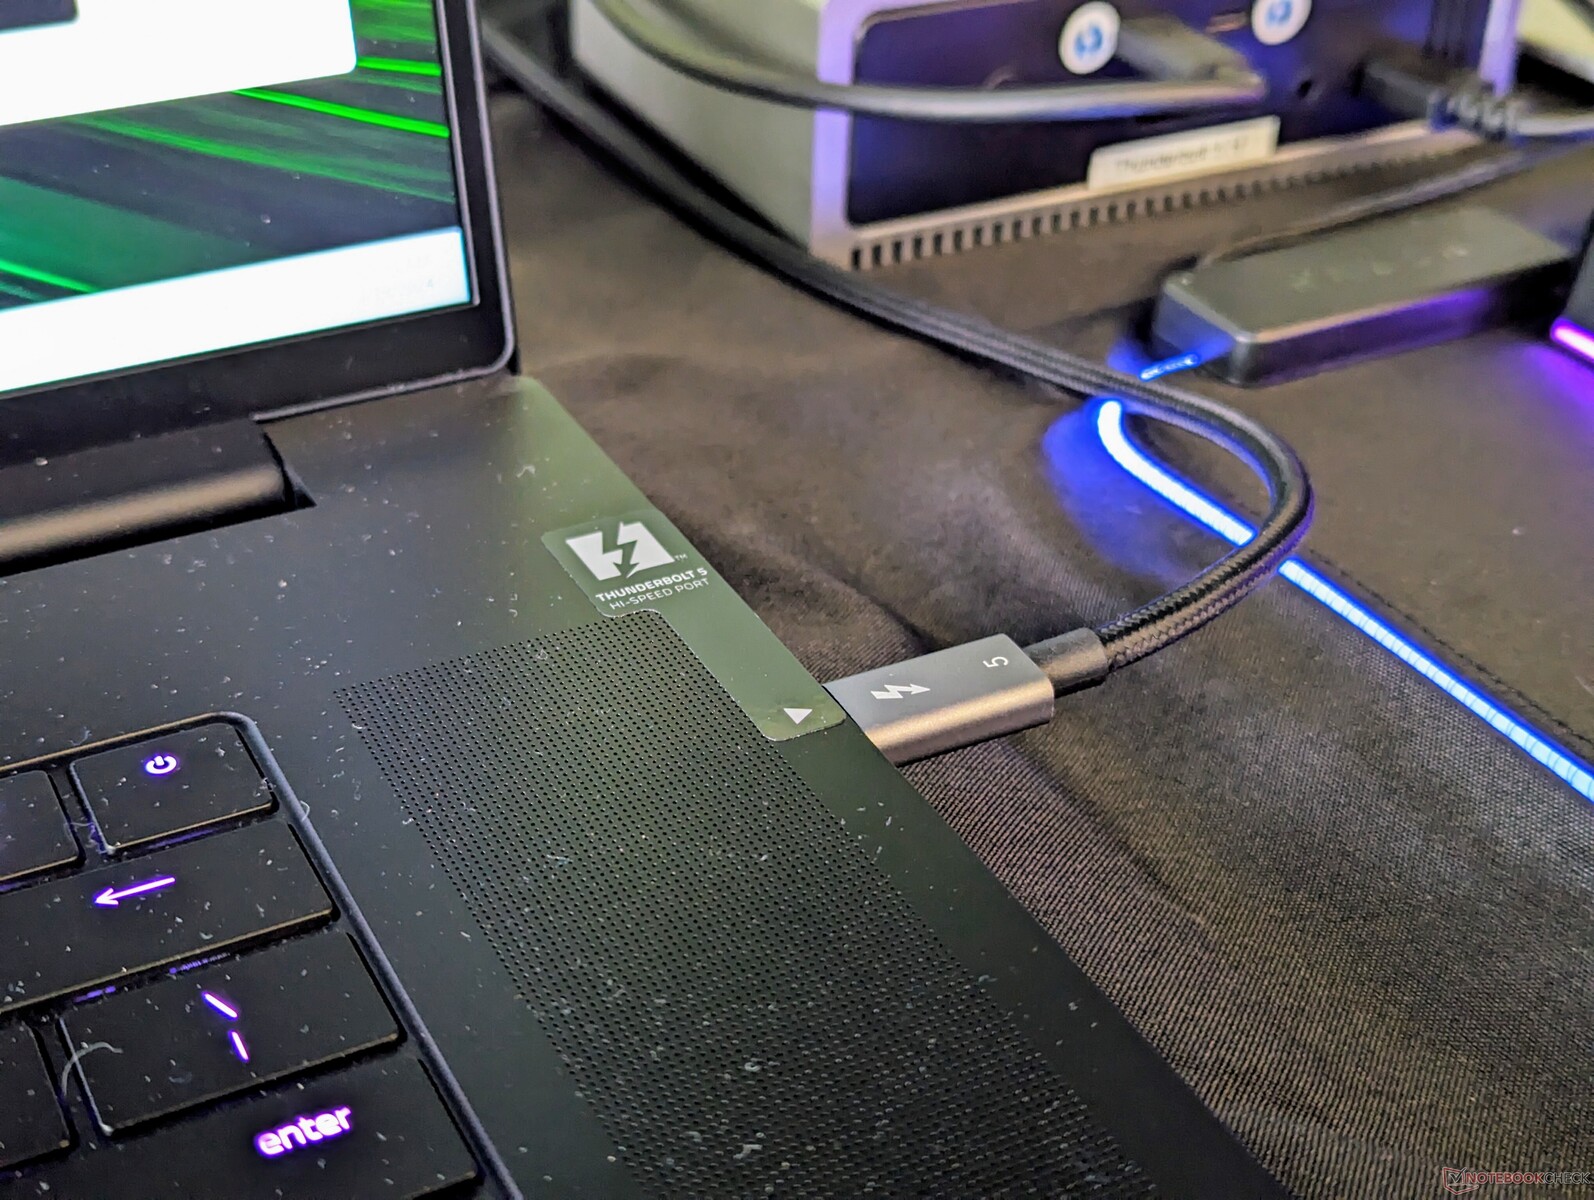
The Thunderbolt 4 port has been upgraded to Thunderbolt 5 for the 2024 model. Note that this applies only to the Type-C port along the right edge and so the Type-C port along the left edge is still limited to USB 3.2 Gen. 2 connectivity. When compared to Thunderbolt 4, Thunderbolt 5 supports double the bandwidth (80 Gbps vs. 40 Gbps) with additional lanes reserved for more demanding external devices like eGPUs.
The Thunderbolt 5 specification also supports downstream charging of up to 240 W. On the Blade 18, however, USB-C charging is still limited to 100 W or less than a third of the main barrel 330 W AC adapter. To be fair, no laptop as of this writing supports full 240 W USB-C charging as additional hardware adjustments are required to fully exploit the new specification.
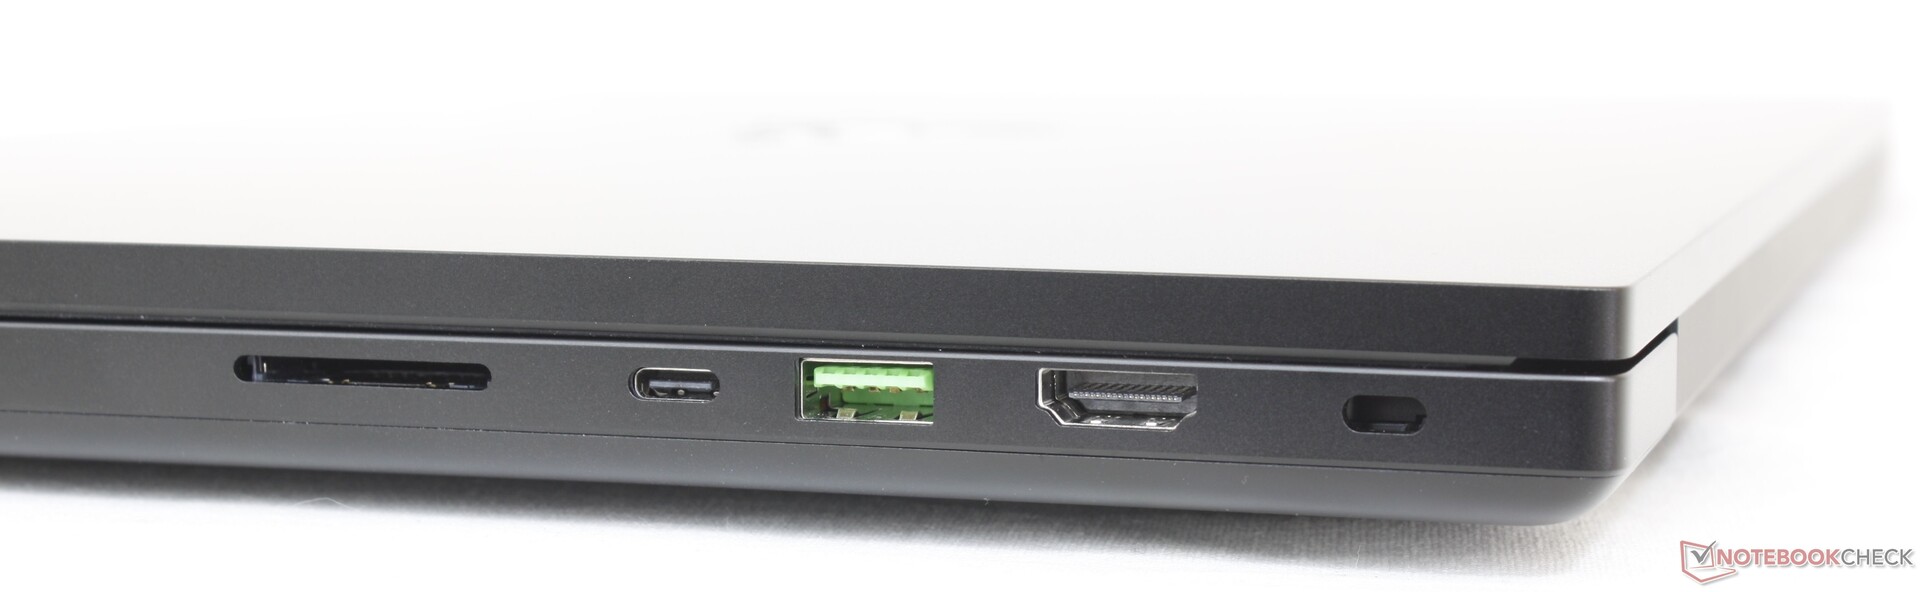
SD Card Reader
| SD Card Reader | |
| average JPG Copy Test (av. of 3 runs) | |
| Alienware m18 R2 (Toshiba Exceria Pro SDXC 64 GB UHS-II) | |
| Razer Blade 18 2024 RZ09-0509 (Toshiba Exceria Pro SDXC 64 GB UHS-II) | |
| Razer Blade 16 2024, RTX 4090 | |
| MSI Titan 18 HX A14VIG (Toshiba Exceria Pro SDXC 64 GB UHS-II) | |
| maximum AS SSD Seq Read Test (1GB) | |
| Razer Blade 18 2024 RZ09-0509 (Toshiba Exceria Pro SDXC 64 GB UHS-II) | |
| Alienware m18 R2 (Toshiba Exceria Pro SDXC 64 GB UHS-II) | |
| Razer Blade 16 2024, RTX 4090 | |
| MSI Titan 18 HX A14VIG (Toshiba Exceria Pro SDXC 64 GB UHS-II) | |
Communication
WLAN has been upgraded to the Intel BE200 for both Bluetooth 5.4 and Wi-Fi 7 support. The vast majority of users still do not have Wi-Fi 7 routers, however, and so only a select few will notice any performance improvements for now.
| Networking | |
| iperf3 transmit AXE11000 | |
| Razer Blade 16 2024, RTX 4090 | |
| Razer Blade 18 2024 RZ09-0509 | |
| MSI Titan 18 HX A14VIG | |
| Asus ROG Strix Scar 18 G834JYR (2024) | |
| Alienware m18 R2 | |
| iperf3 receive AXE11000 | |
| Asus ROG Strix Scar 18 G834JYR (2024) | |
| Razer Blade 16 2024, RTX 4090 | |
| Razer Blade 18 2024 RZ09-0509 | |
| Alienware m18 R2 | |
| MSI Titan 18 HX A14VIG | |
| iperf3 transmit AXE11000 6GHz | |
| Razer Blade 16 2024, RTX 4090 | |
| Razer Blade 18 2024 RZ09-0509 | |
| MSI Titan 18 HX A14VIG | |
| Alienware m18 R2 | |
| iperf3 receive AXE11000 6GHz | |
| Razer Blade 16 2024, RTX 4090 | |
| MSI Titan 18 HX A14VIG | |
| Razer Blade 18 2024 RZ09-0509 | |
| Alienware m18 R2 | |
Webcam
The 5 MP + IR webcam hasn't changed aside from the new shutter slider for privacy. Interestingly, this is the only 18-inch gaming laptop with a 5 MP webcam as the competing Titan HX, Alienware m18 R2, and ROG Strix Scar 18 come with just 1 MP to 2 MP cameras in comparison.


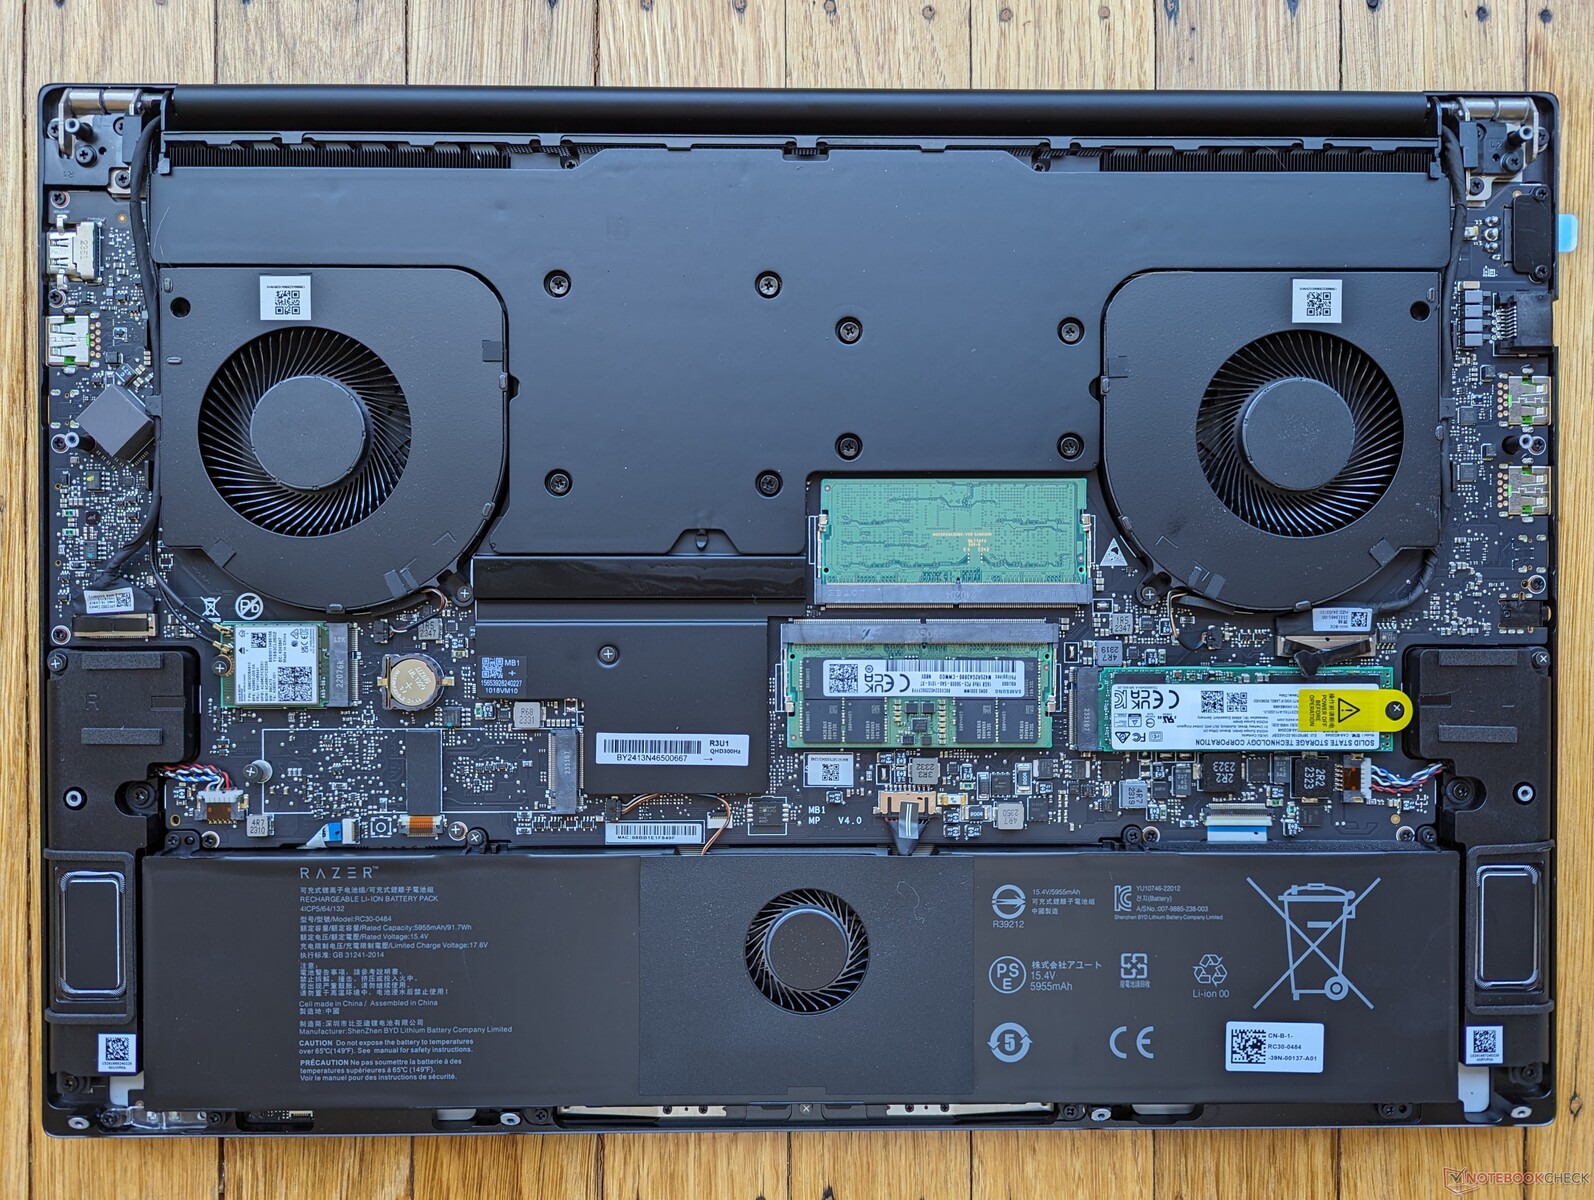
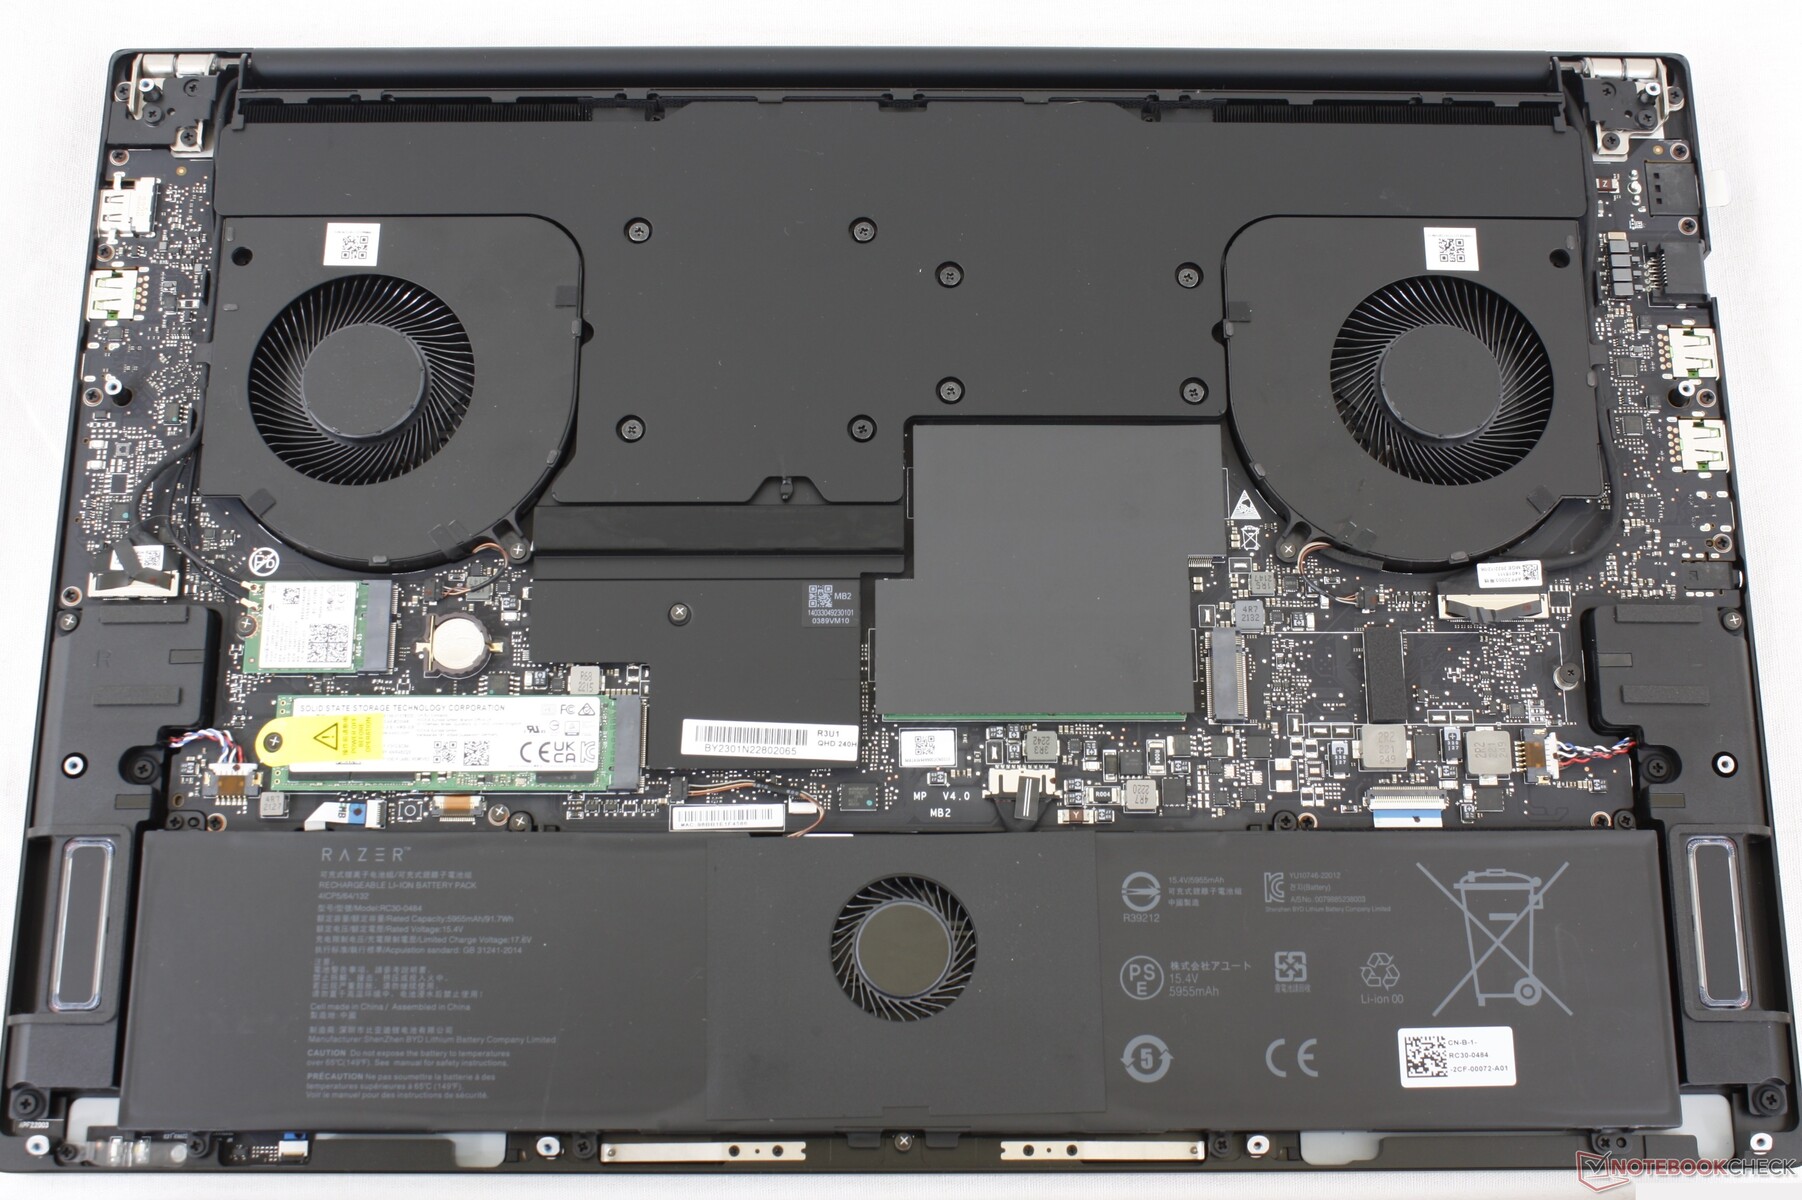
Maintenance
The 2024 model features slightly larger speakers near the front corners. Otherwise, there are no notable differences when compared to the 2023 version.
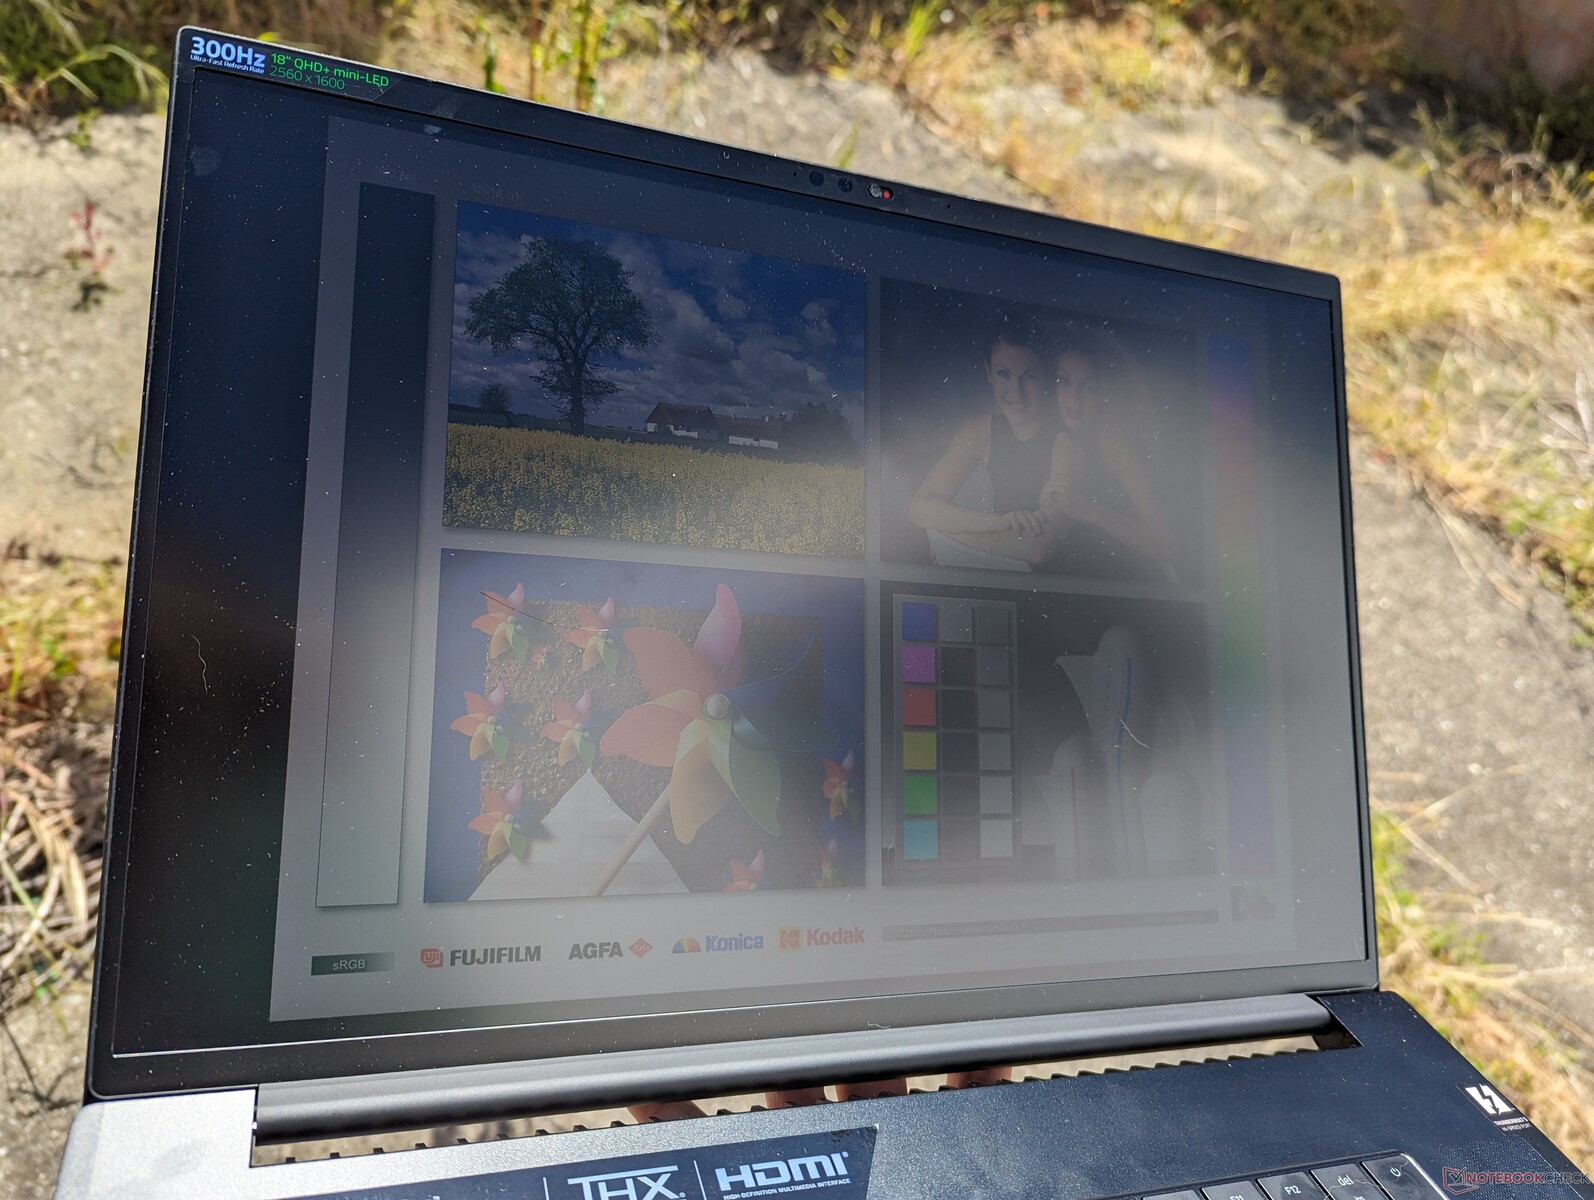
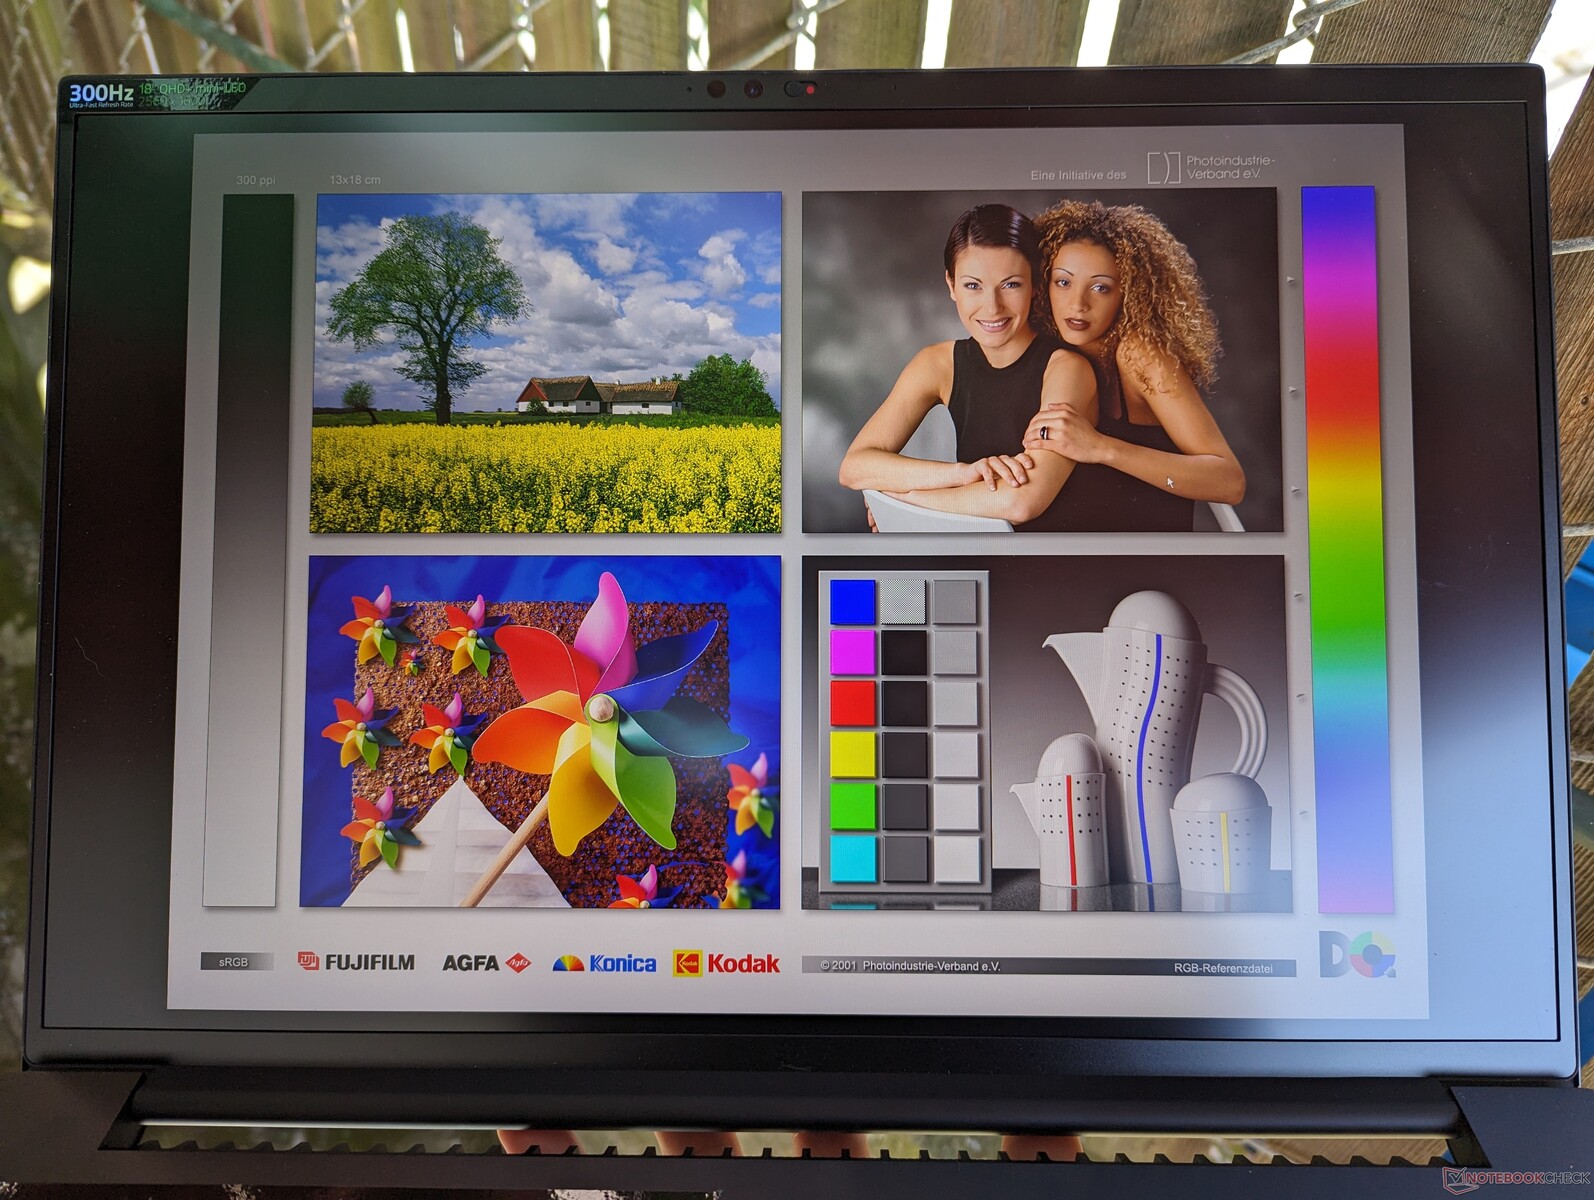
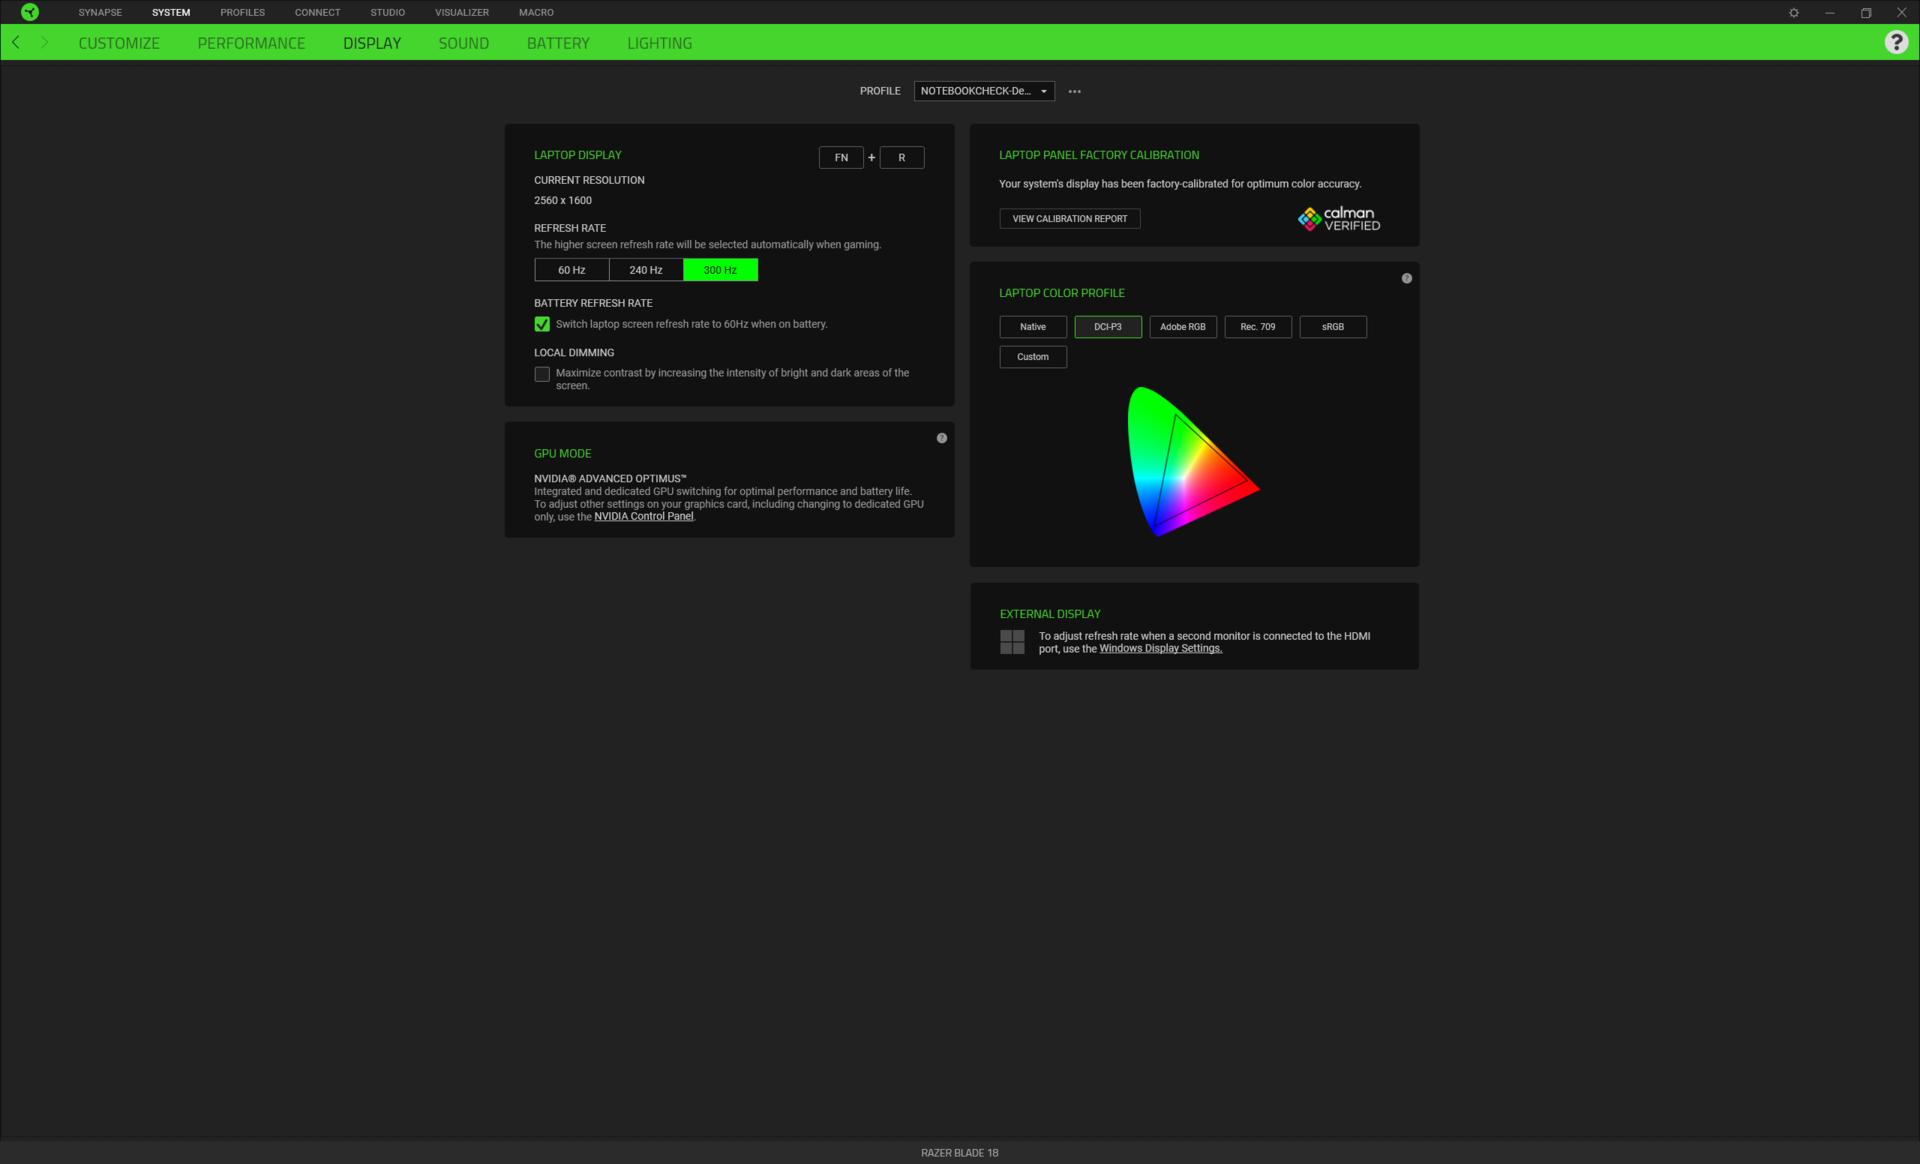
Display — QHD+ 300 Hz Mini-LED

The QHD+ 240 Hz panel on the 2023 Blade 18 has been replaced with two new options this year:
- QHD+ (2560 x 1600), 300 Hz, Mini-LED, HDR1000
- 4K UHD+ (3840 x 2400), 200 Hz, IPS, HDR400
Both panels offer G-Sync, factory calibration, full DCI-P3 colors, and fast <3 ms response times to be fit for both hardcore gaming and most editing tasks. Our specific test unit has been configured with the bolded option. Note that this exact BOE NE180QDM-NM1 panel can also be found on the ROG Strix Scar 18 meaning that the Razer and Asus laptops can offer comparable viewing experiences.
When compared to IPS and OLED, mini-LED provides deeper black levels than IPS and brighter whites than OLED to better comply with HDR requirements. For example, laptops with high-end IPS or OLED panels typically cover HDR400 or HDR500 while mini-LED often satisfy HDR1000 for more vibrant multimedia playback. Maximum brightness on our Blade 18 unit can reach 1227 nits when both HDR and local dimming are enabled compared to just 712 nits when HDR is enabled but with local dimming off. Brightness is otherwise limited to ~600 nits on SDR mode which is still much brighter than most other gaming laptops.
| Display Setting | SDR Mode w/ Local Dimming Off | SDR Mode w/ Local Dimming On | HDR Mode w/ Local Dimming Off | HDR Mode w/ Local Dimming On |
| Maximum Brightness (nits) | 605 | 602 | 712 | 1227 |
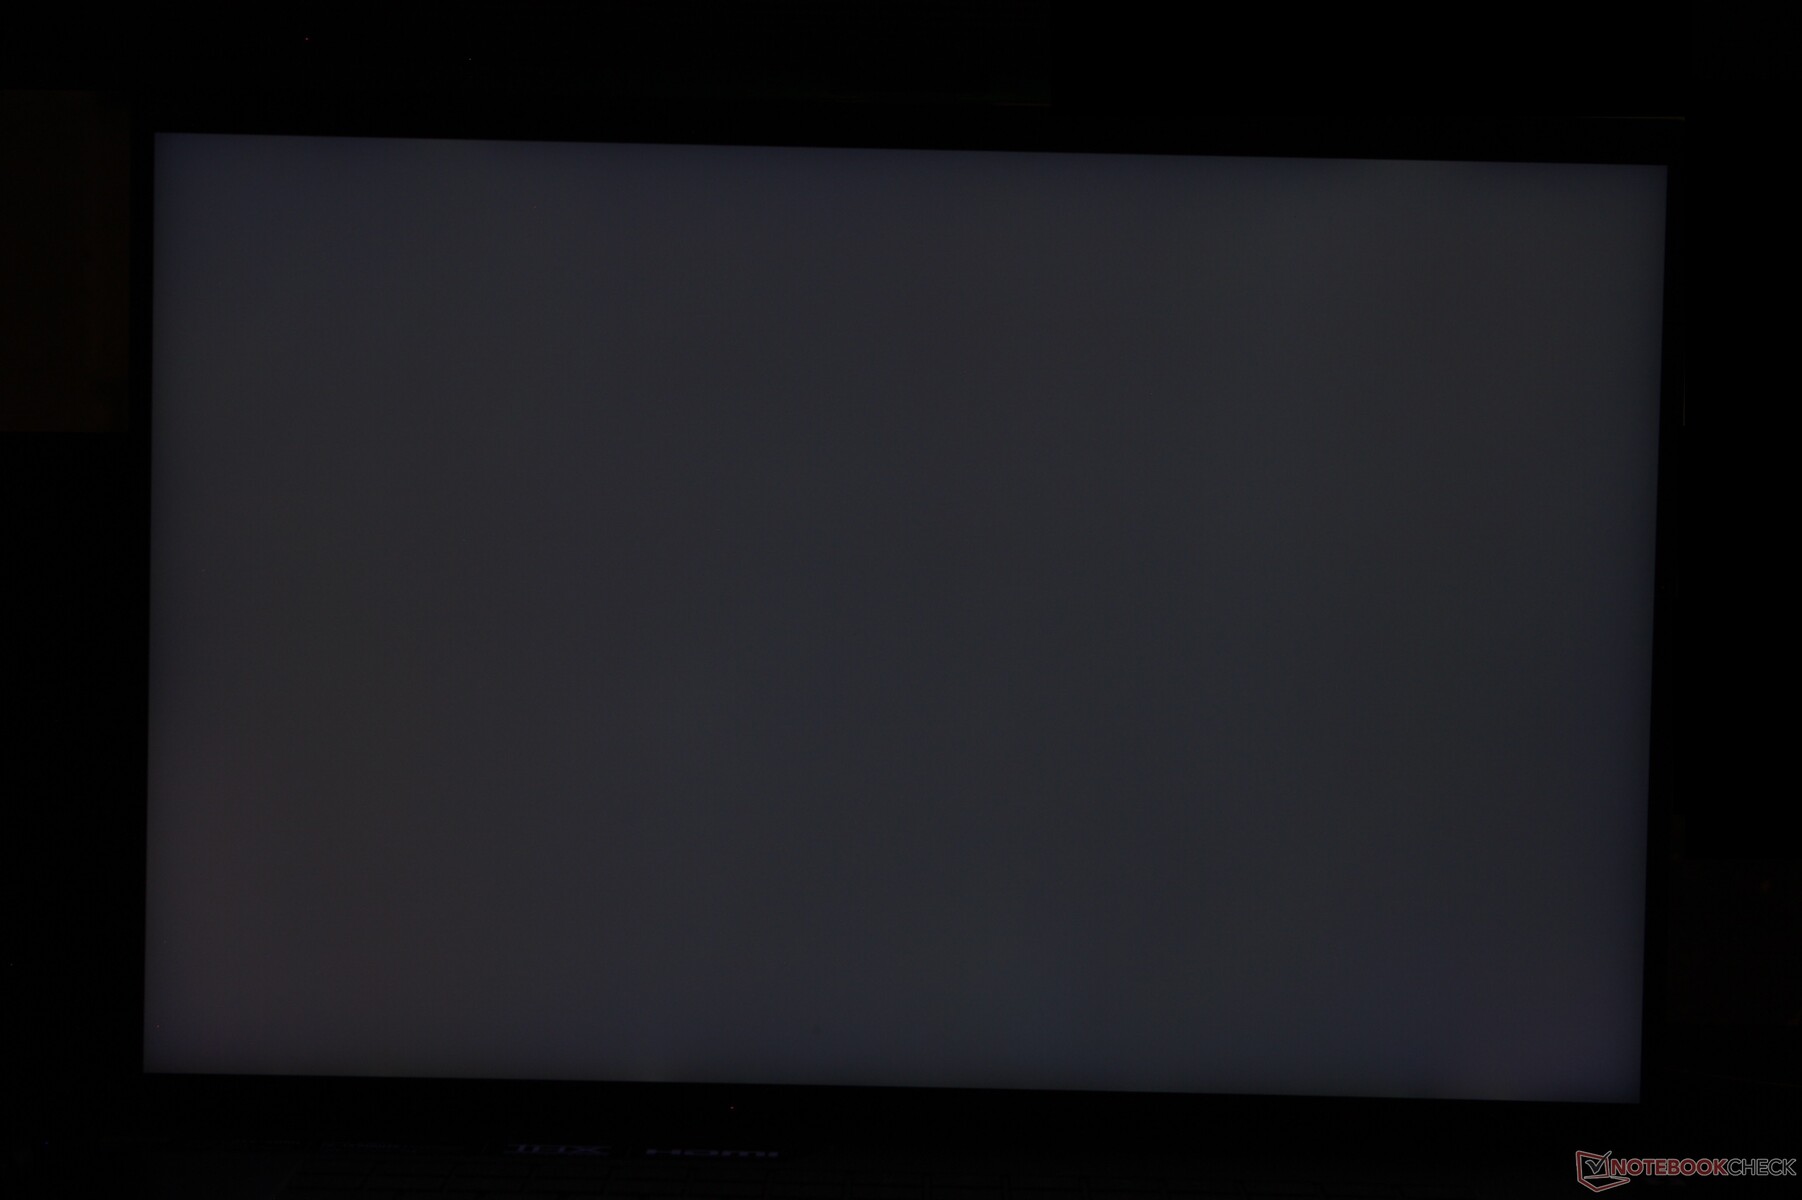

Black levels and thus contrast are also affected by local dimming. We're able to measure a black level of 0.62 nits with local dimming off versus 0.22 nits with local dimming on for much higher contrast levels especially when HDR is enabled. Local dimming may not be necessary or even recommended for browsing or editing purposes due to its inherent "halo" effect, but it's worth enabling for HDR videos and games where the drawback is less noticeable.
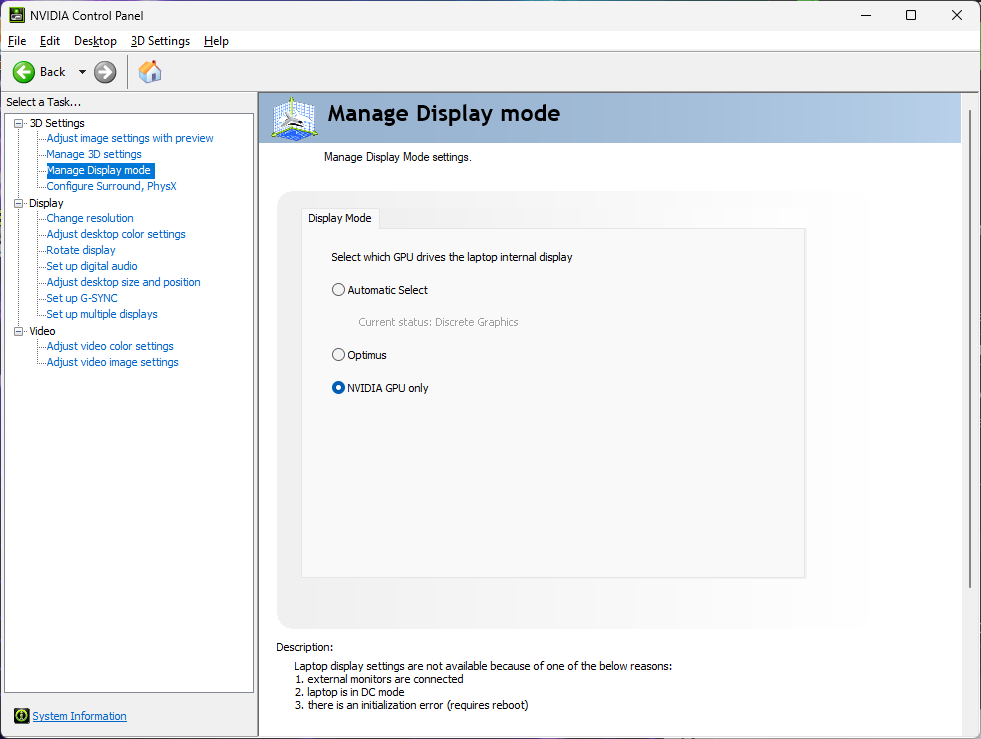
Keep in mind that the panel refresh rate supports up to 300 Hz on dGPU mode only as it is otherwise limited to 240 Hz on Optimus mode. A dynamic refresh rate down to 60 Hz is supported only on Optimus mode.
| |||||||||||||||||||||||||
Brightness Distribution: 97 %
Center on Battery: 605.4 cd/m²
Contrast: 976:1 (Black: 0.62 cd/m²)
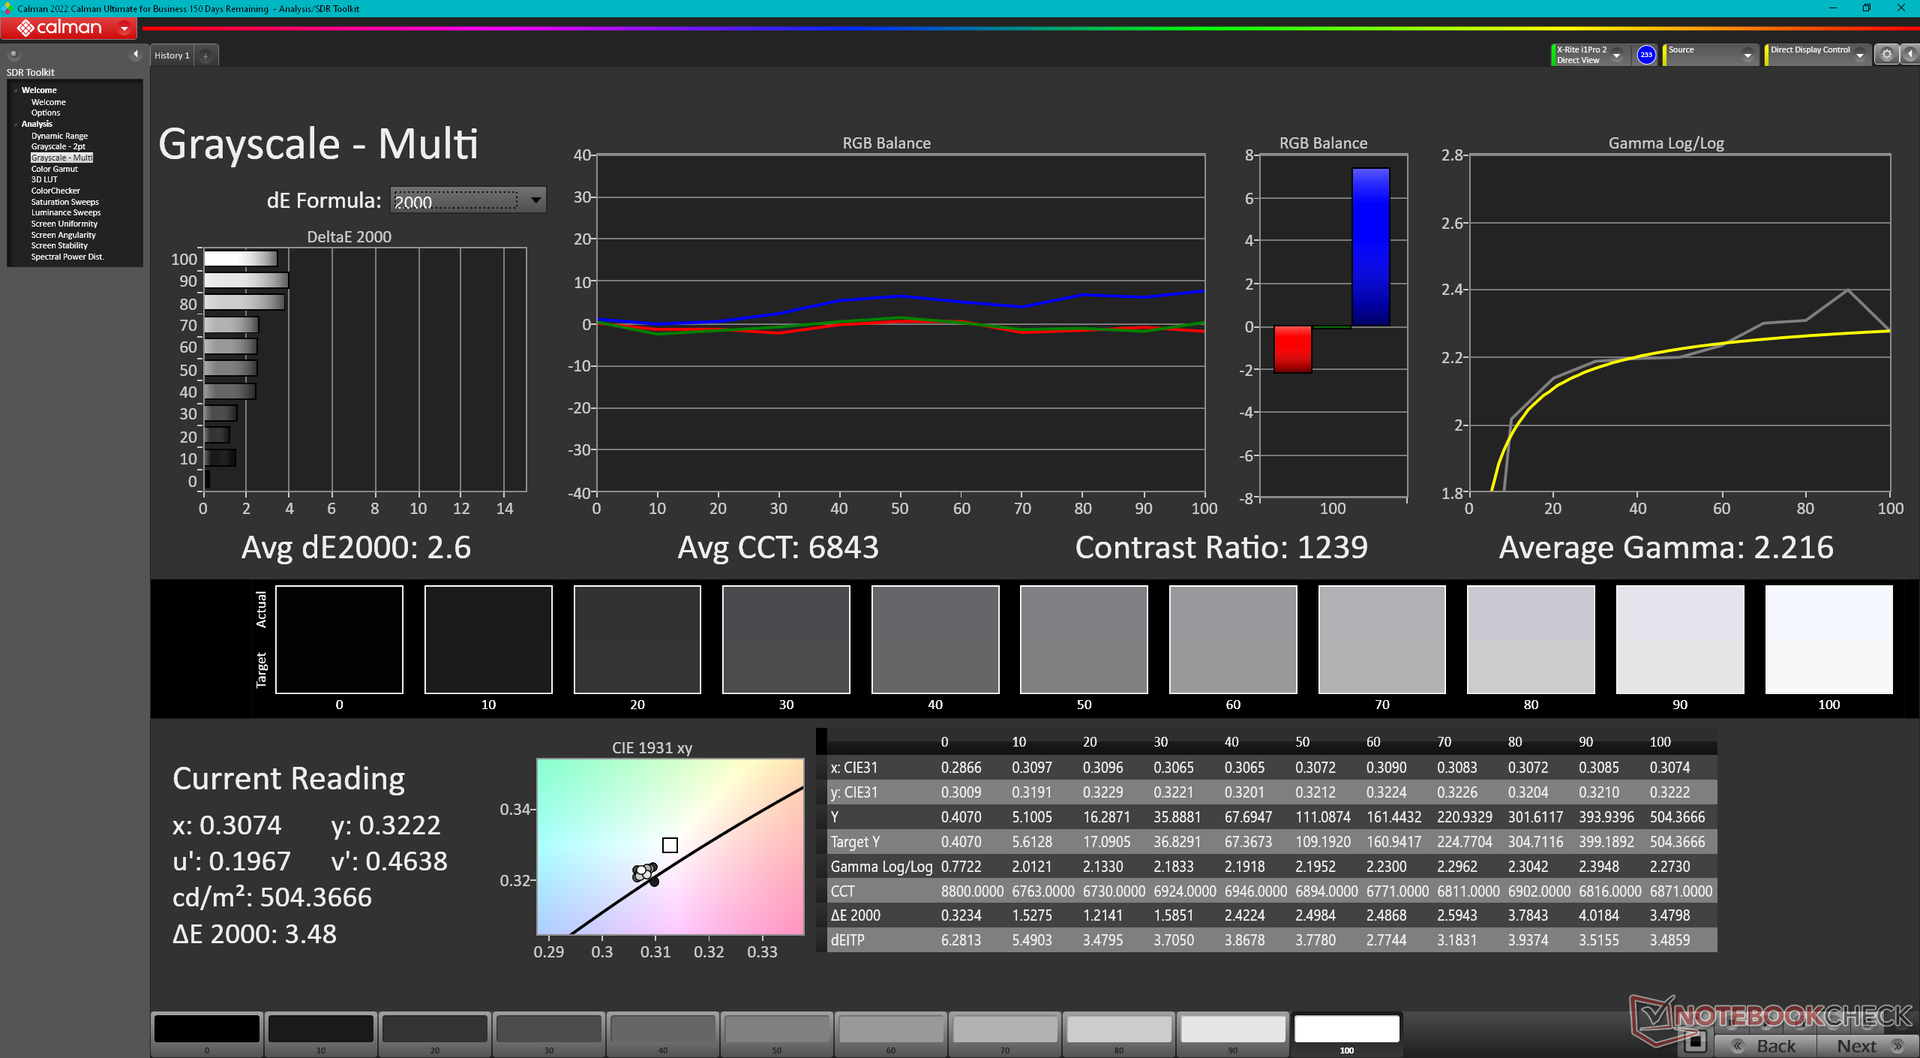
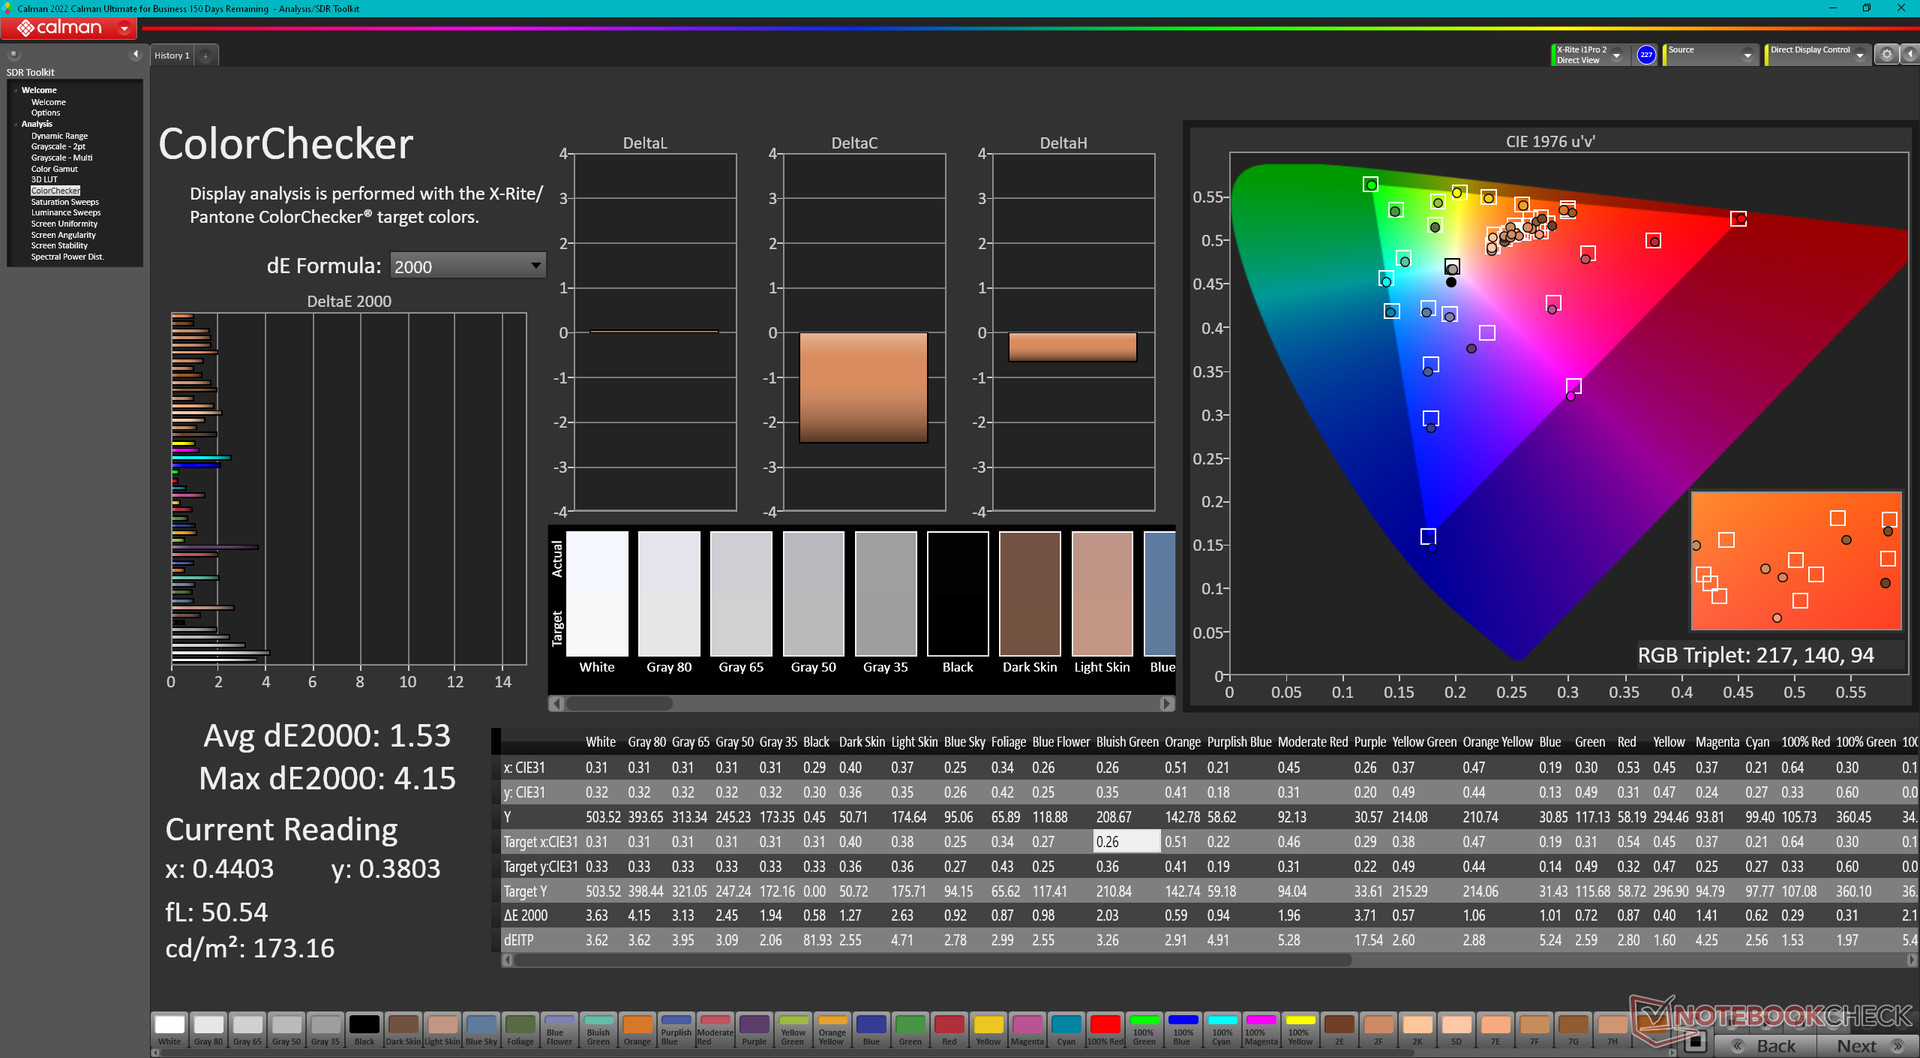
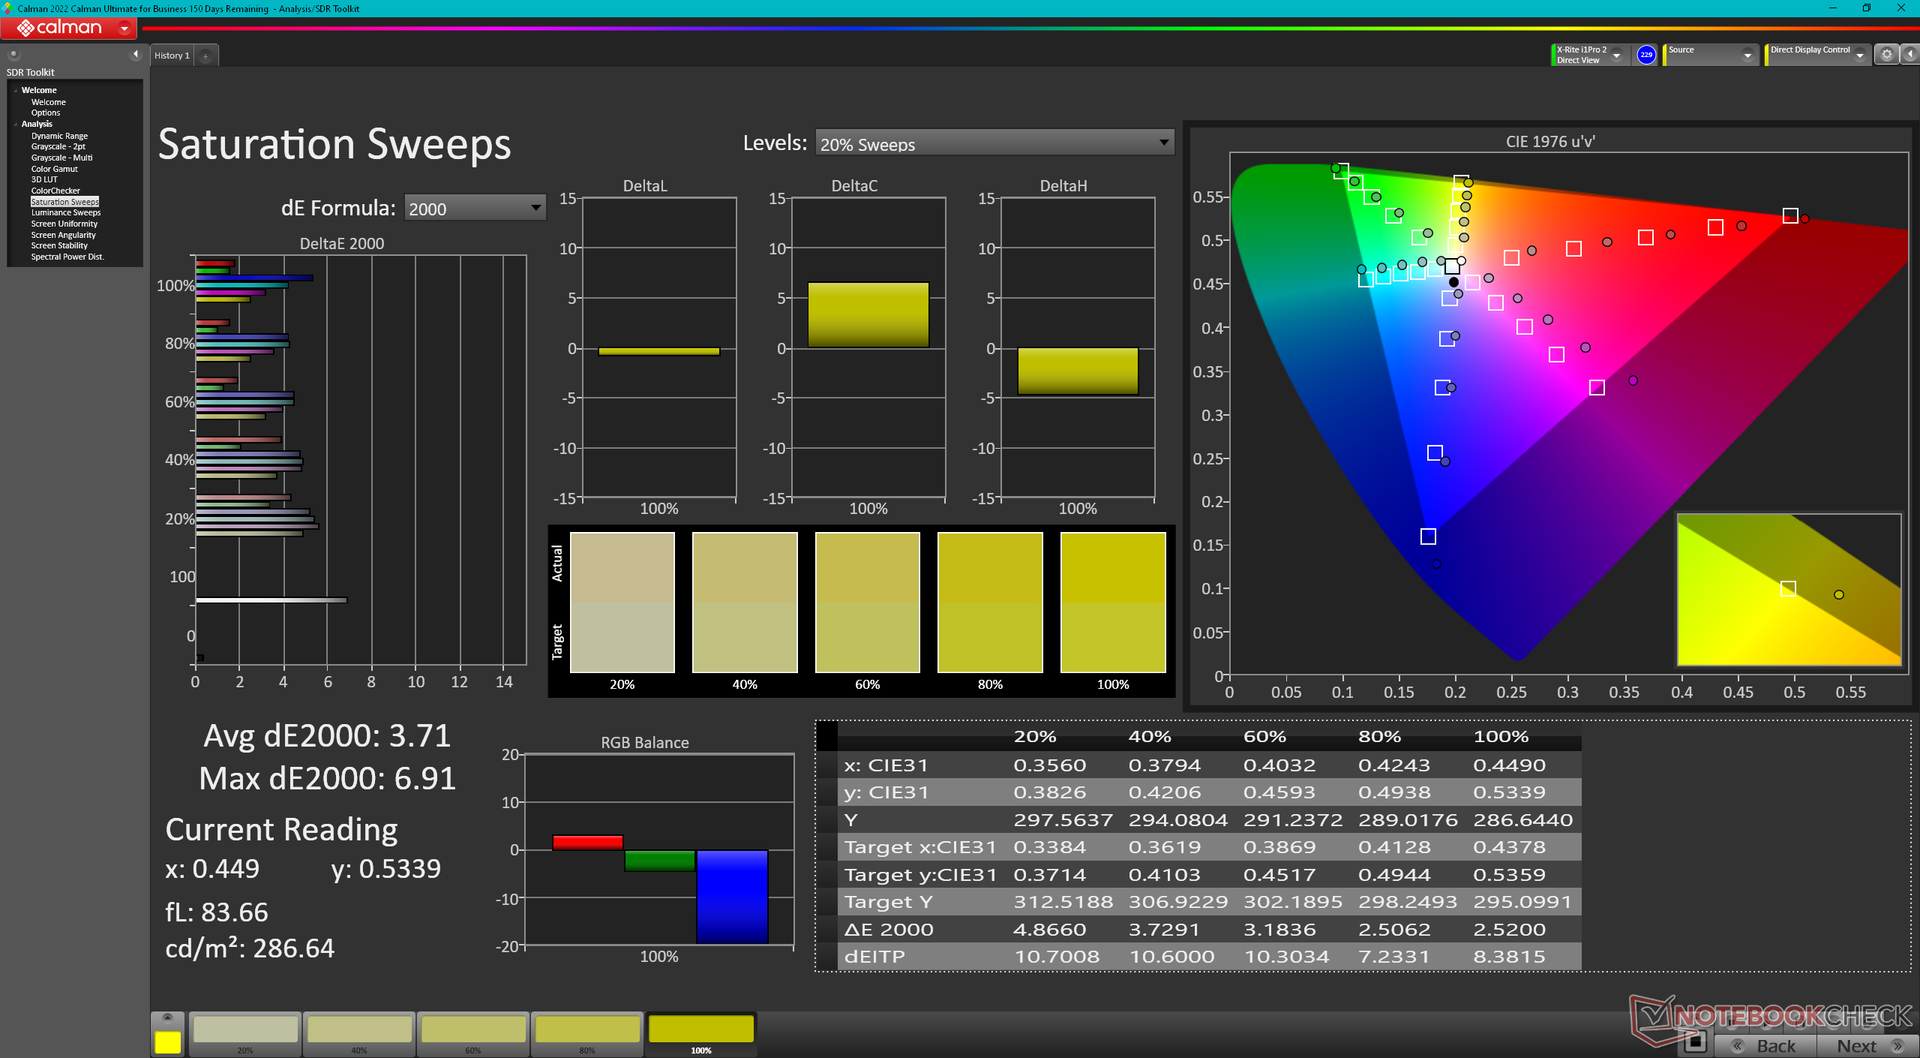
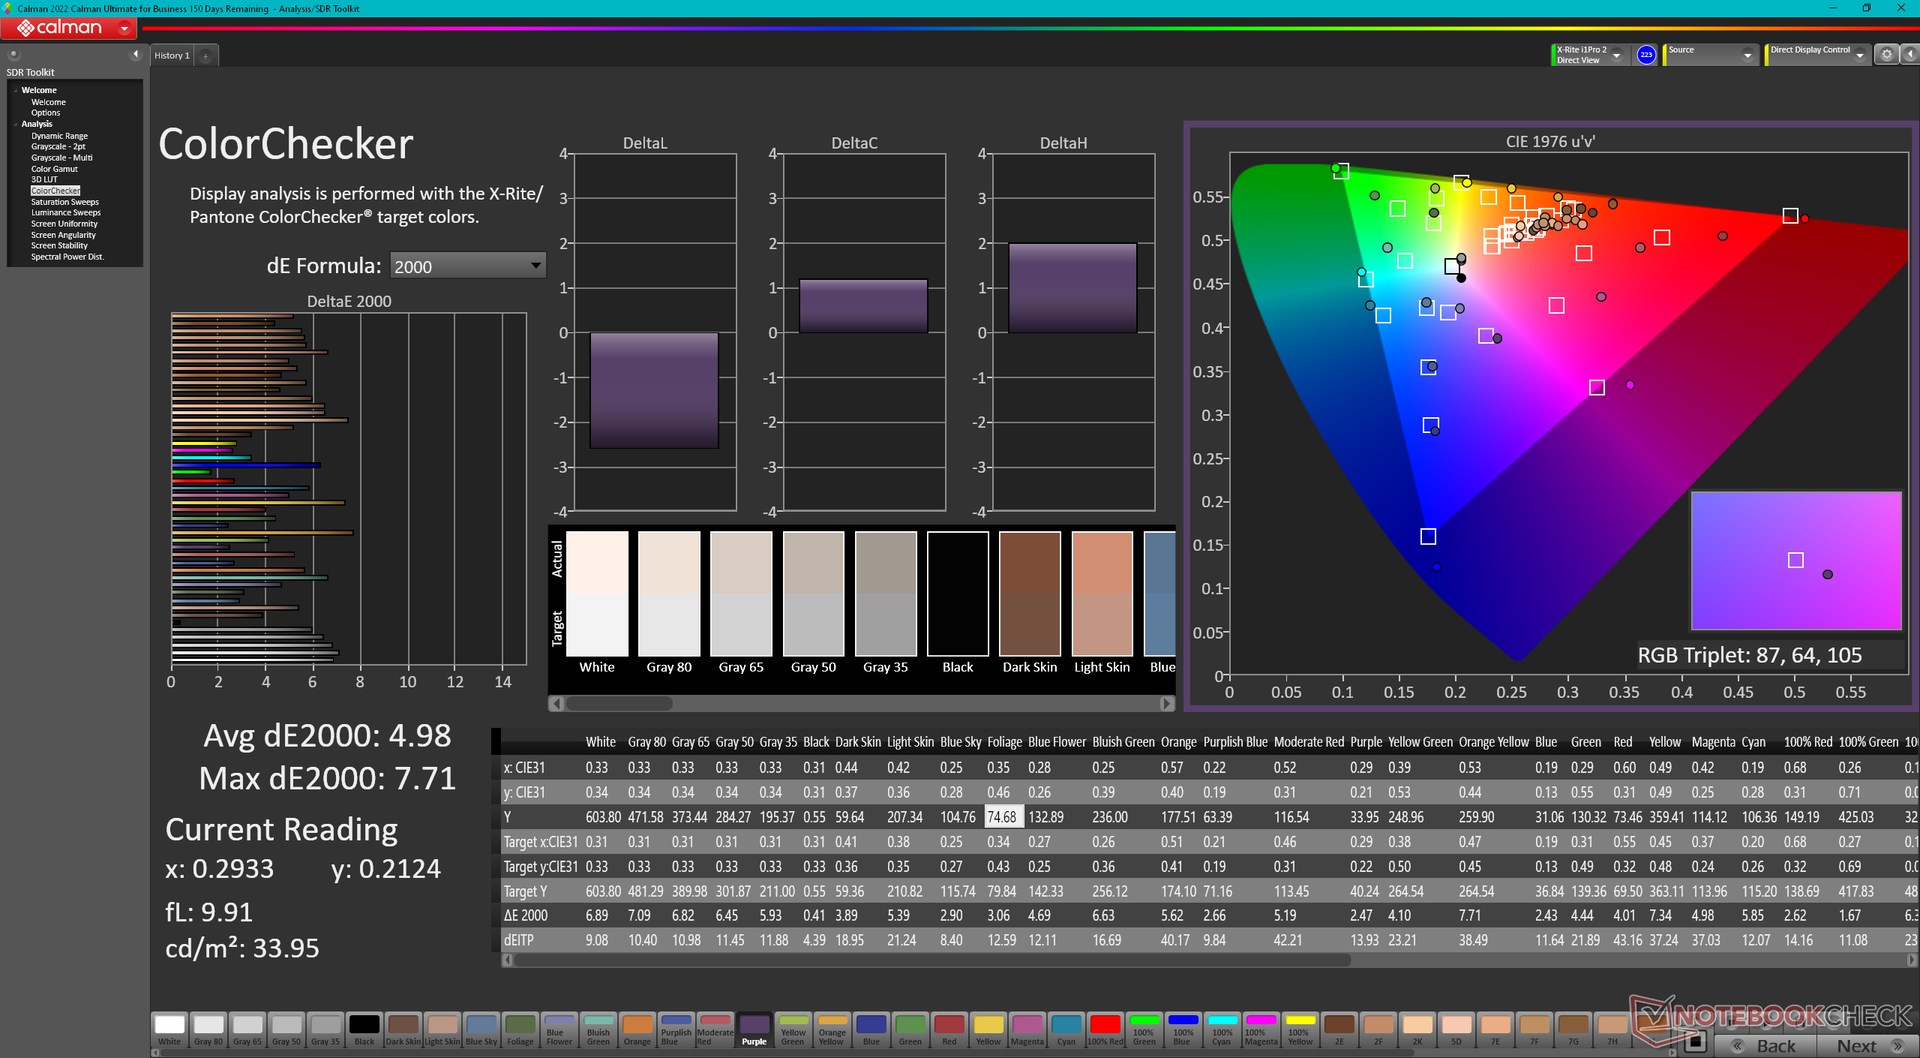
ΔE ColorChecker Calman: 1.53 | ∀{0.5-29.43 Ø4.72}
ΔE Greyscale Calman: 2.6 | ∀{0.09-98 Ø4.97}
86.9% AdobeRGB 1998 (Argyll 3D)
100% sRGB (Argyll 3D)
99% Display P3 (Argyll 3D)
Gamma: 2.22
CCT: 6843 K
| Razer Blade 18 2024 RZ09-0509 BOE NE180QDM-NM1, Mini-LED, 2560x1600, 18" | Razer Blade 18 RTX 4070 AU Optronics B180QAN01.0, IPS, 2560x1600, 18" | Alienware m18 R2 BOE NE18NZ1, IPS, 2560x1600, 18" | MSI Titan 18 HX A14VIG AU Optronics B180ZAN01.0, Mini-LED, 3840x2400, 18" | Asus ROG Strix Scar 18 G834JYR (2024) BOE NE180QDM-NM1, Mini LED, 2560x1600, 18" | |
|---|---|---|---|---|---|
| Display | -1% | 0% | -1% | 2% | |
| Display P3 Coverage (%) | 99 | 96.9 -2% | 97.8 -1% | 98.1 -1% | 99.9 1% |
| sRGB Coverage (%) | 100 | 99.8 0% | 99.5 0% | 99.8 0% | 100 0% |
| AdobeRGB 1998 Coverage (%) | 86.9 | 85.3 -2% | 88.9 2% | 86.2 -1% | 90 4% |
| Response Times | 44% | 28% | -249% | -17% | |
| Response Time Grey 50% / Grey 80% * (ms) | 7.6 ? | 4.2 ? 45% | 5.3 ? 30% | 8.6 ? -13% | 12 ? -58% |
| Response Time Black / White * (ms) | 14 ? | 8 ? 43% | 10.4 ? 26% | 81.8 ? -484% | 10.7 ? 24% |
| PWM Frequency (Hz) | 26444 ? | 2592 ? | 5733 ? | ||
| Screen | -20% | -26% | -45% | 202% | |
| Brightness middle (cd/m²) | 605.4 | 549.6 -9% | 271.8 -55% | 467.5 -23% | 937 55% |
| Brightness (cd/m²) | 600 | 524 -13% | 275 -54% | 459 -23% | 934 56% |
| Brightness Distribution (%) | 97 | 89 -8% | 78 -20% | 90 -7% | 89 -8% |
| Black Level * (cd/m²) | 0.62 | 0.53 15% | 0.27 56% | 0.066 89% | |
| Contrast (:1) | 976 | 1037 6% | 1007 3% | 14197 1355% | |
| Colorchecker dE 2000 * | 1.53 | 3.32 -117% | 2.48 -62% | 3.77 -146% | 1.52 1% |
| Colorchecker dE 2000 max. * | 4.15 | 6.63 -60% | 5.59 -35% | 6.12 -47% | 2.82 32% |
| Greyscale dE 2000 * | 2.6 | 2 23% | 3.7 -42% | 3.2 -23% | 1.7 35% |
| Gamma | 2.22 99% | 2.29 96% | 2.2 100% | 2.43 91% | 2.042 108% |
| CCT | 6843 95% | 6319 103% | 6355 102% | 6478 100% | 6578 99% |
| Colorchecker dE 2000 calibrated * | 2.7 | 0.56 | 2.94 | 1.21 | |
| Total Average (Program / Settings) | 8% /
-6% | 1% /
-12% | -98% /
-70% | 62% /
122% |
* ... smaller is better
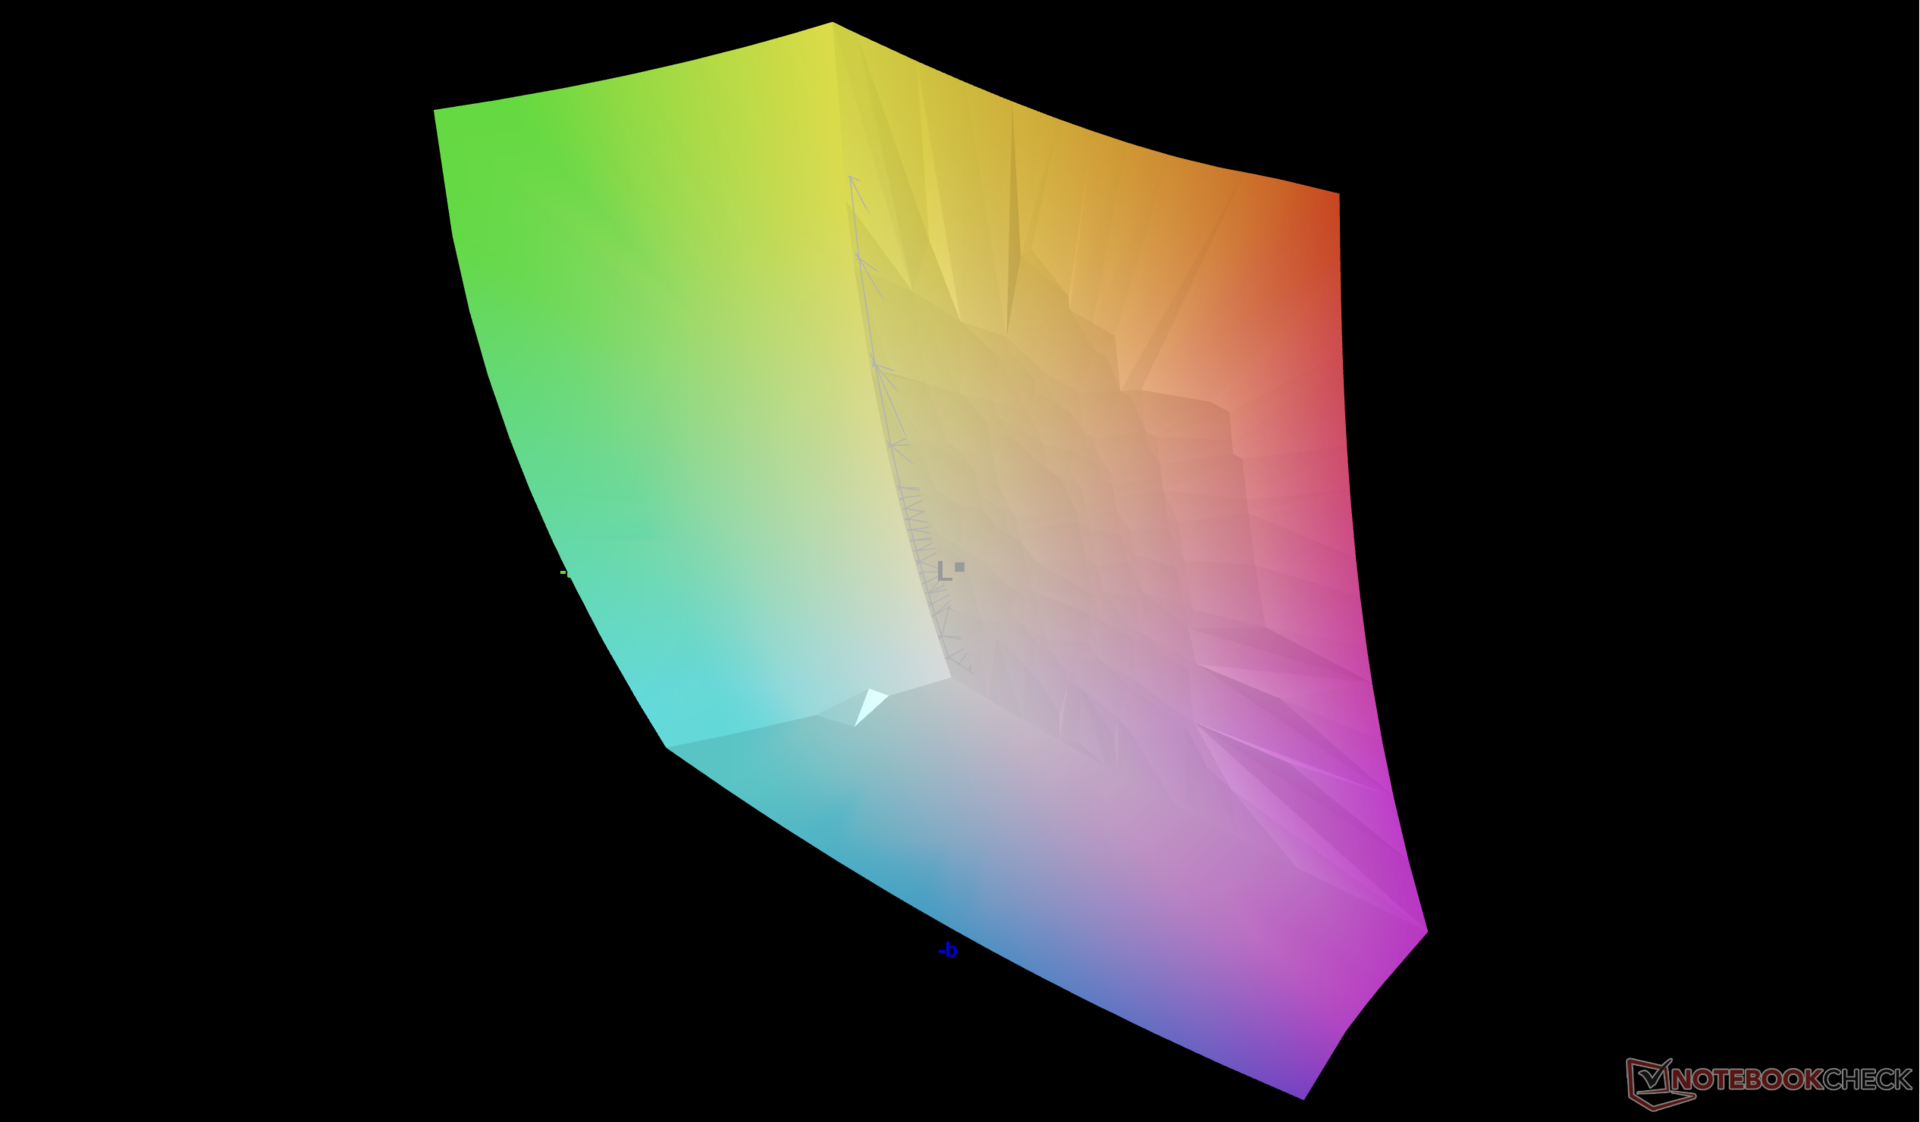
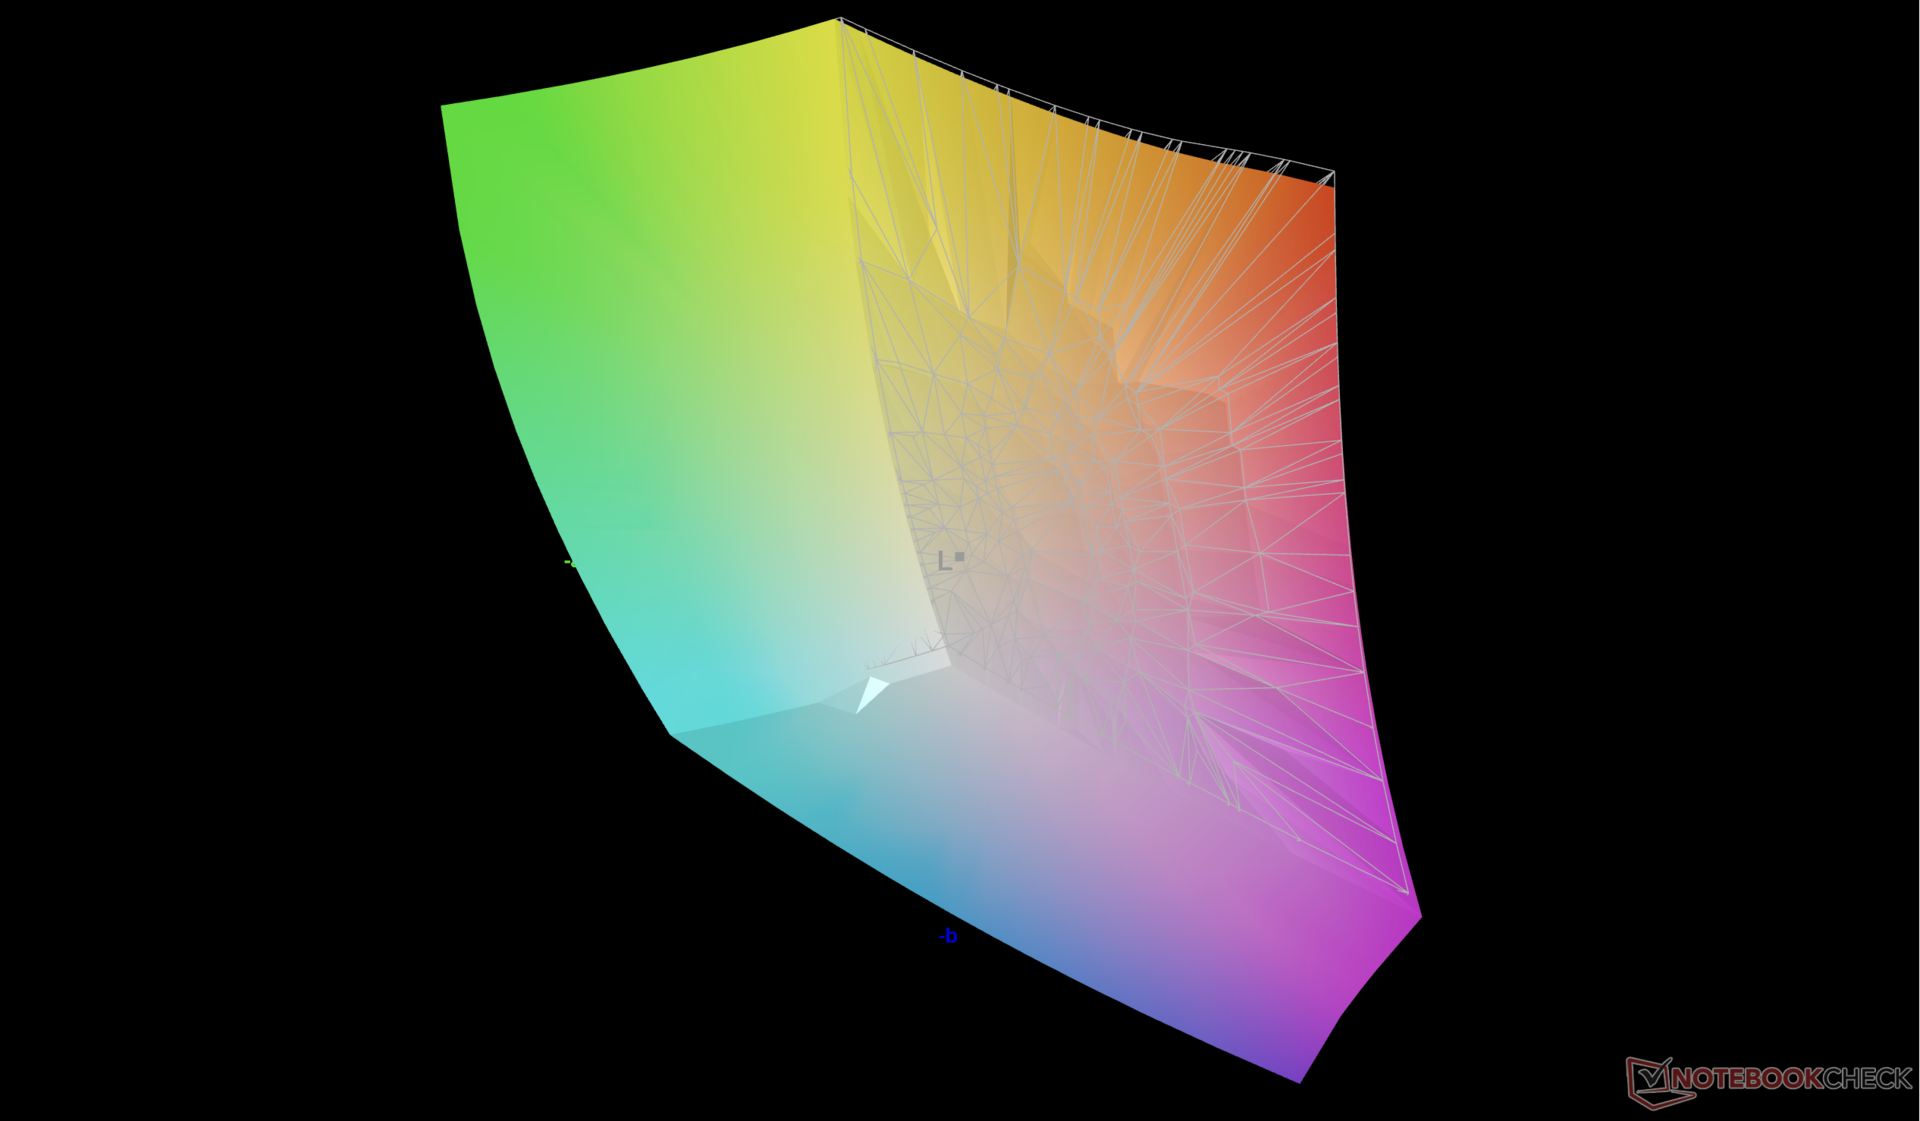
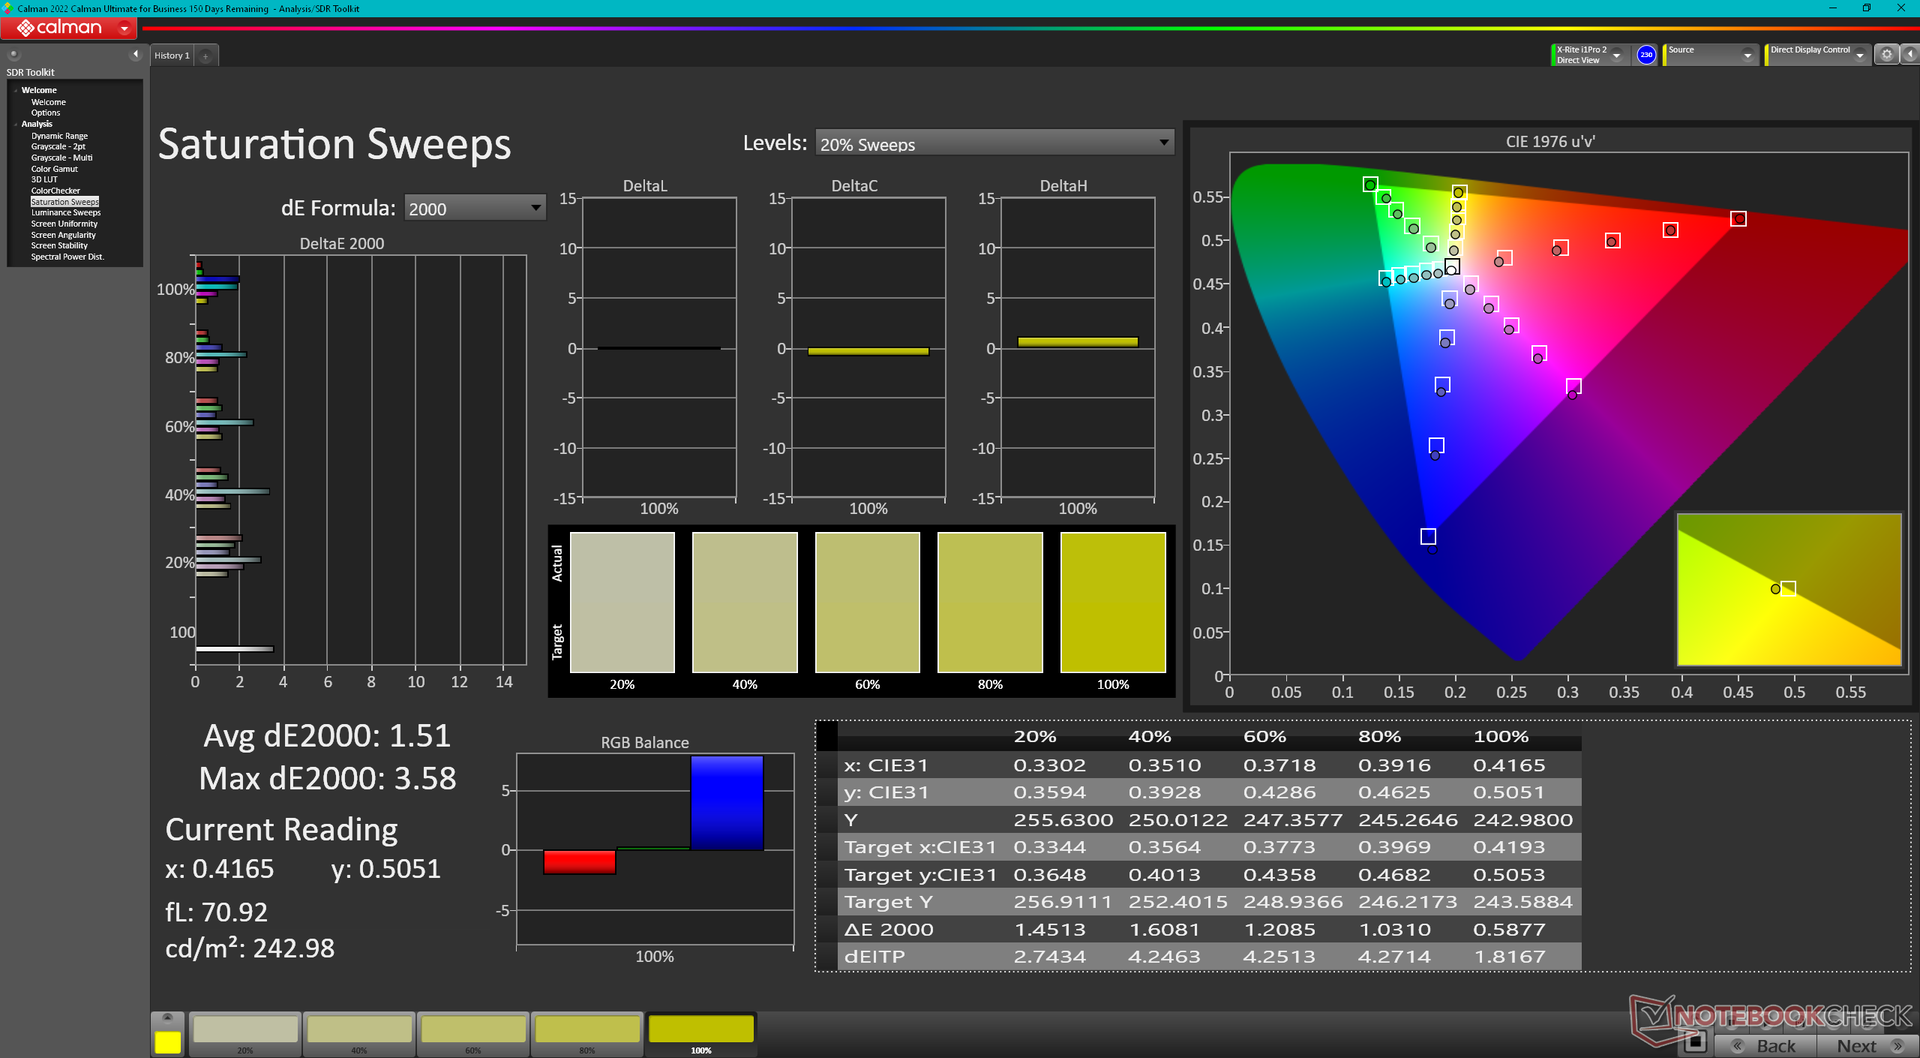
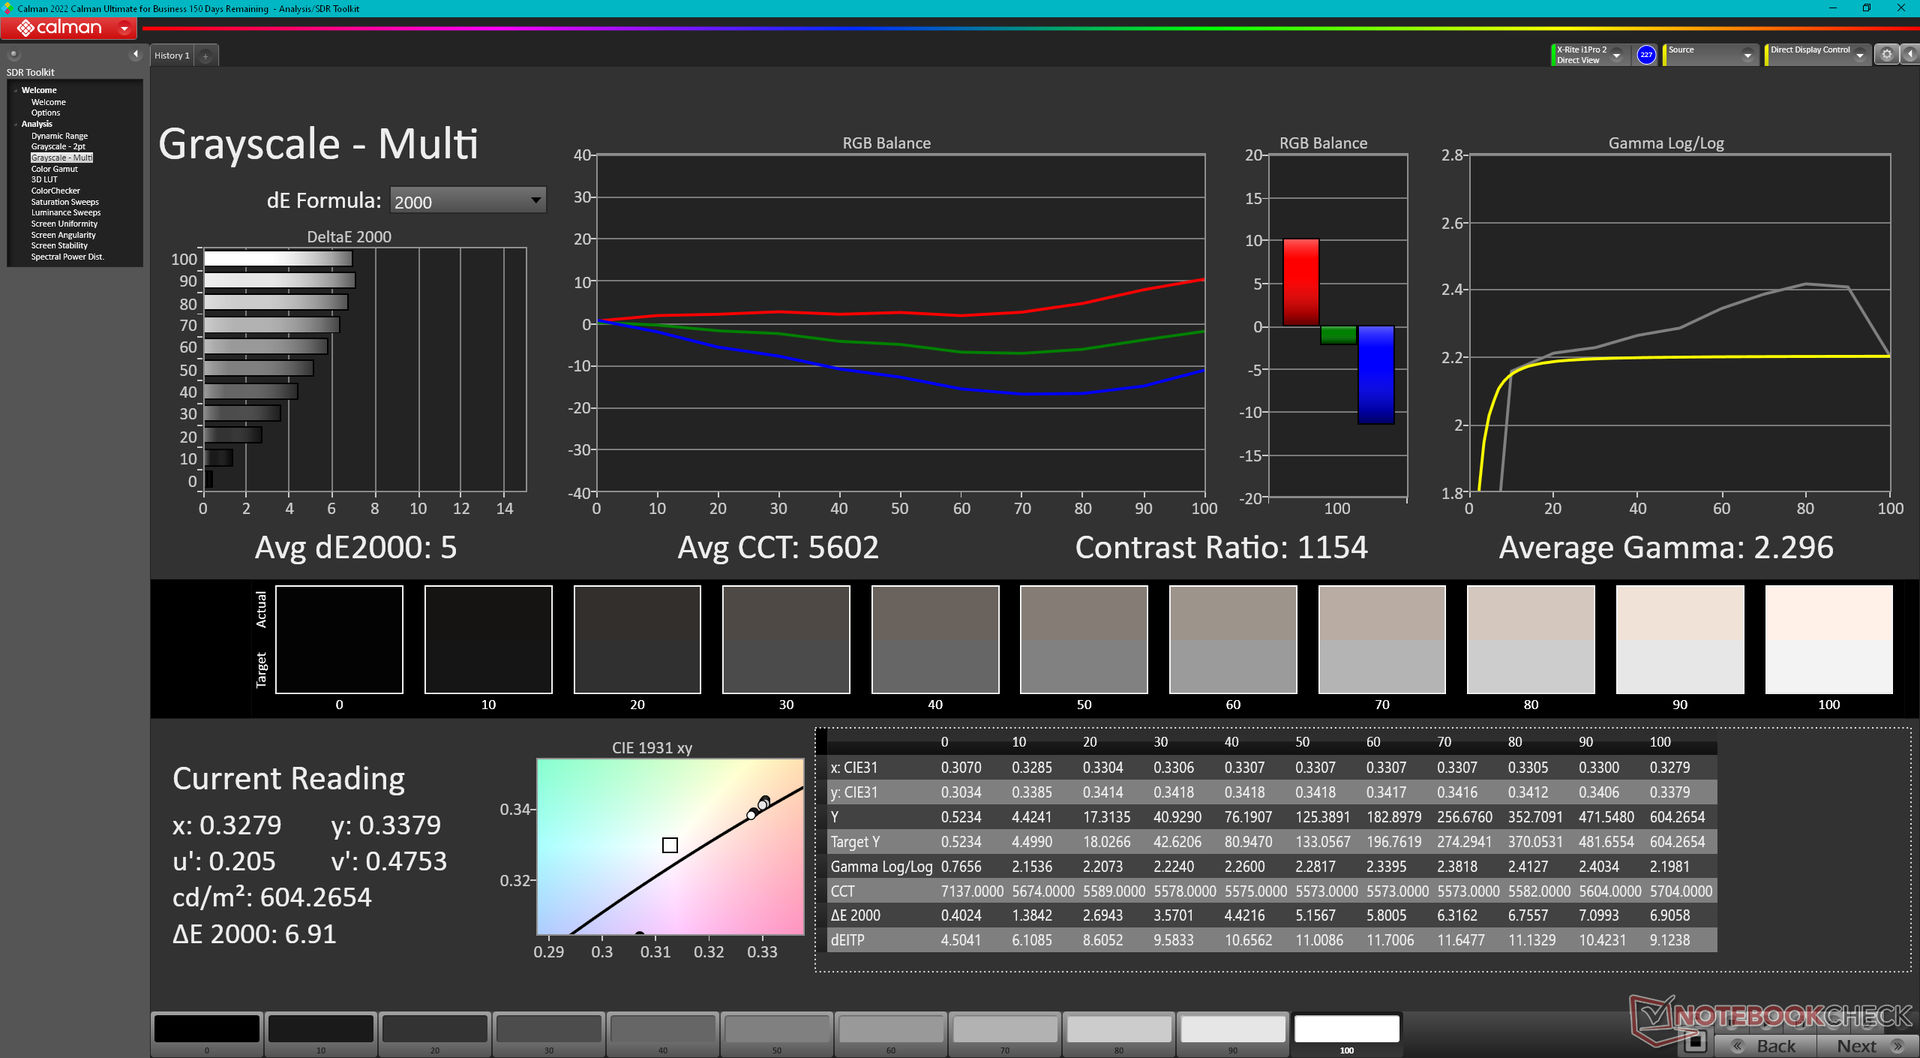
The P3 standard is fully represented as advertised. Colors, however, annoyingly shift when changing between Optimus and dGPU modes. sRGB colors are accurate with average DeltaE grayscale and ColorChecker values of just 2.6 and 1.53, respectively, but P3 colors are more inaccurate even when set to P3 mode. Color temperature, for example, automatically becomes warmer at 5600K when set to P3. There may be a bug with how P3 colors are represented when changing between different GPU modes.
Display Response Times
| ↔ Response Time Black to White | ||
|---|---|---|
| 14 ms ... rise ↗ and fall ↘ combined | ↗ 6.6 ms rise | 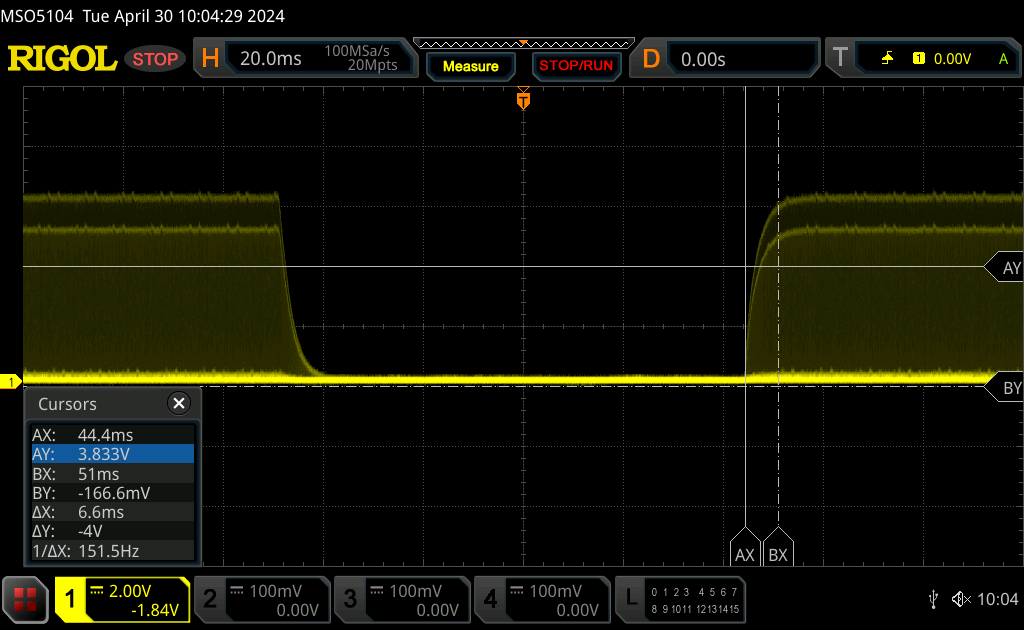 |
| ↘ 7.4 ms fall | ||
| The screen shows good response rates in our tests, but may be too slow for competitive gamers. In comparison, all tested devices range from 0.1 (minimum) to 240 (maximum) ms. » 34 % of all devices are better. This means that the measured response time is better than the average of all tested devices (19.8 ms). | ||
| ↔ Response Time 50% Grey to 80% Grey | ||
| 7.6 ms ... rise ↗ and fall ↘ combined | ↗ 3.6 ms rise | 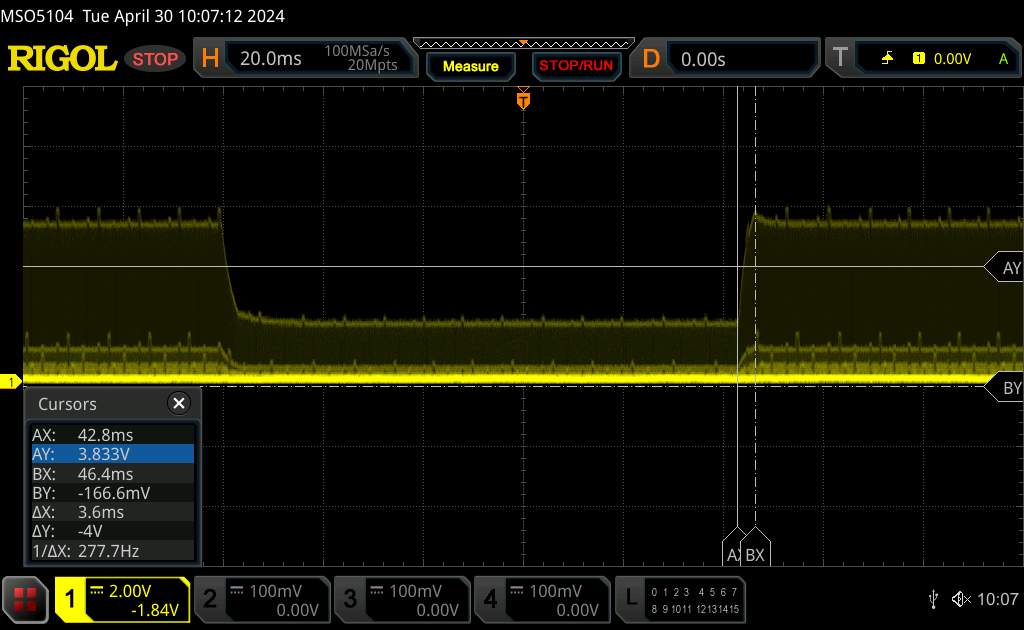 |
| ↘ 4 ms fall | ||
| The screen shows very fast response rates in our tests and should be very well suited for fast-paced gaming. In comparison, all tested devices range from 0.165 (minimum) to 636 (maximum) ms. » 20 % of all devices are better. This means that the measured response time is better than the average of all tested devices (31 ms). | ||
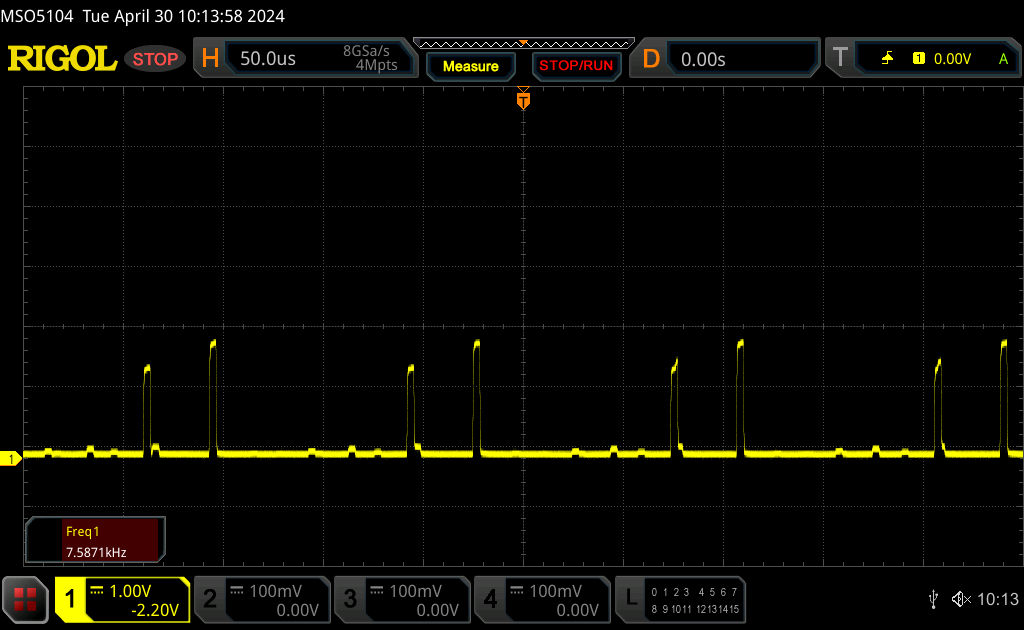
Screen Flickering / PWM (Pulse-Width Modulation)
| Screen flickering / PWM detected | 26444 Hz | ≤ 100 % brightness setting | 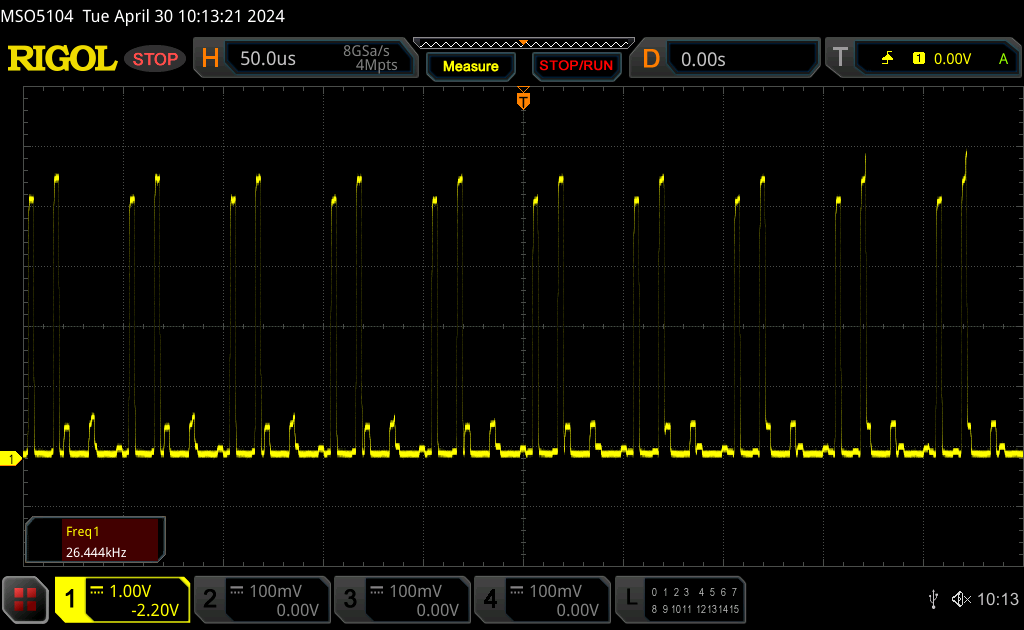 |
The display backlight flickers at 26444 Hz (worst case, e.g., utilizing PWM) Flickering detected at a brightness setting of 100 % and below. There should be no flickering or PWM above this brightness setting. The frequency of 26444 Hz is quite high, so most users sensitive to PWM should not notice any flickering. In comparison: 52 % of all tested devices do not use PWM to dim the display. If PWM was detected, an average of 7750 (minimum: 5 - maximum: 343500) Hz was measured. | |||
Flickering is present much like on other laptops with mini-LED options. However, its frequency is extremely high and therefore less likely to cause eyestrain for sensitive users. Flickering intensity also appears to drop significantly once brightness levels are reduced to <50 percent and so lower brightness levels may not be a bad idea.

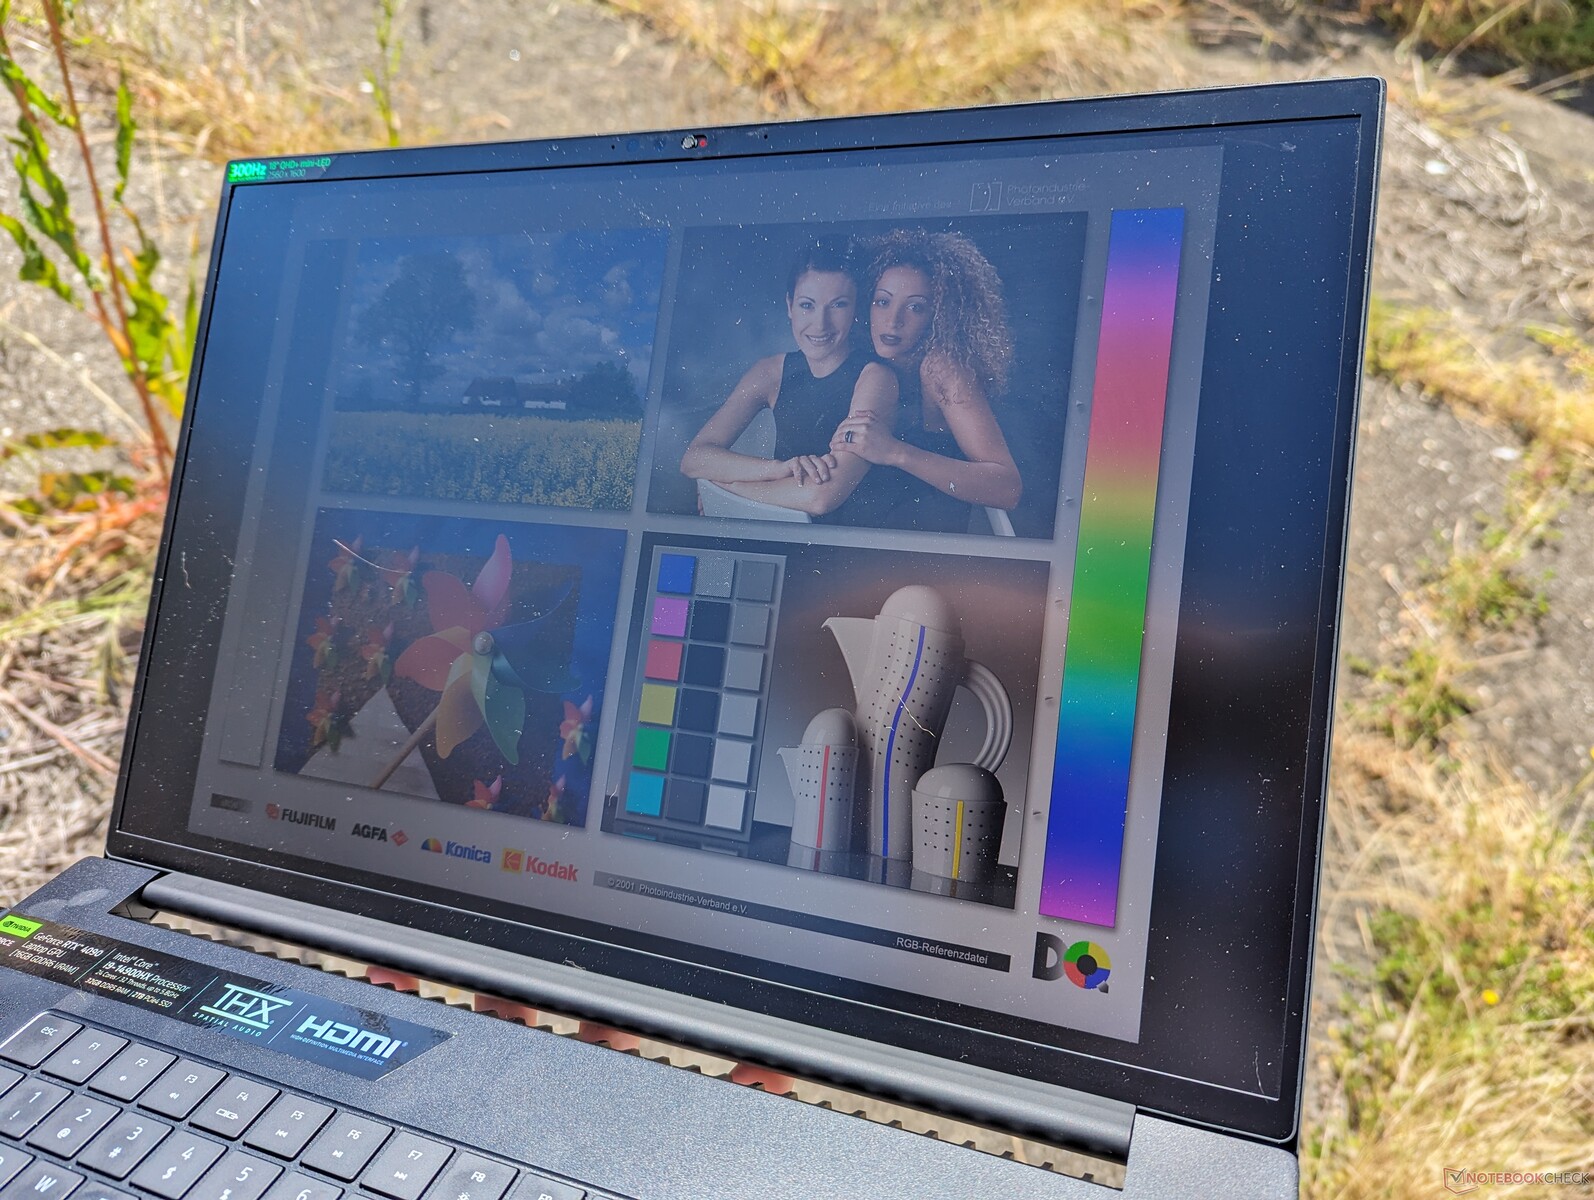
Outdoor visibility is decent under shade especially since the matte overlay minimizes glare. However, direct sunlight should still be avoided for an optimal viewing experience.
Performance — Same As Yesteryear
Testing Conditions
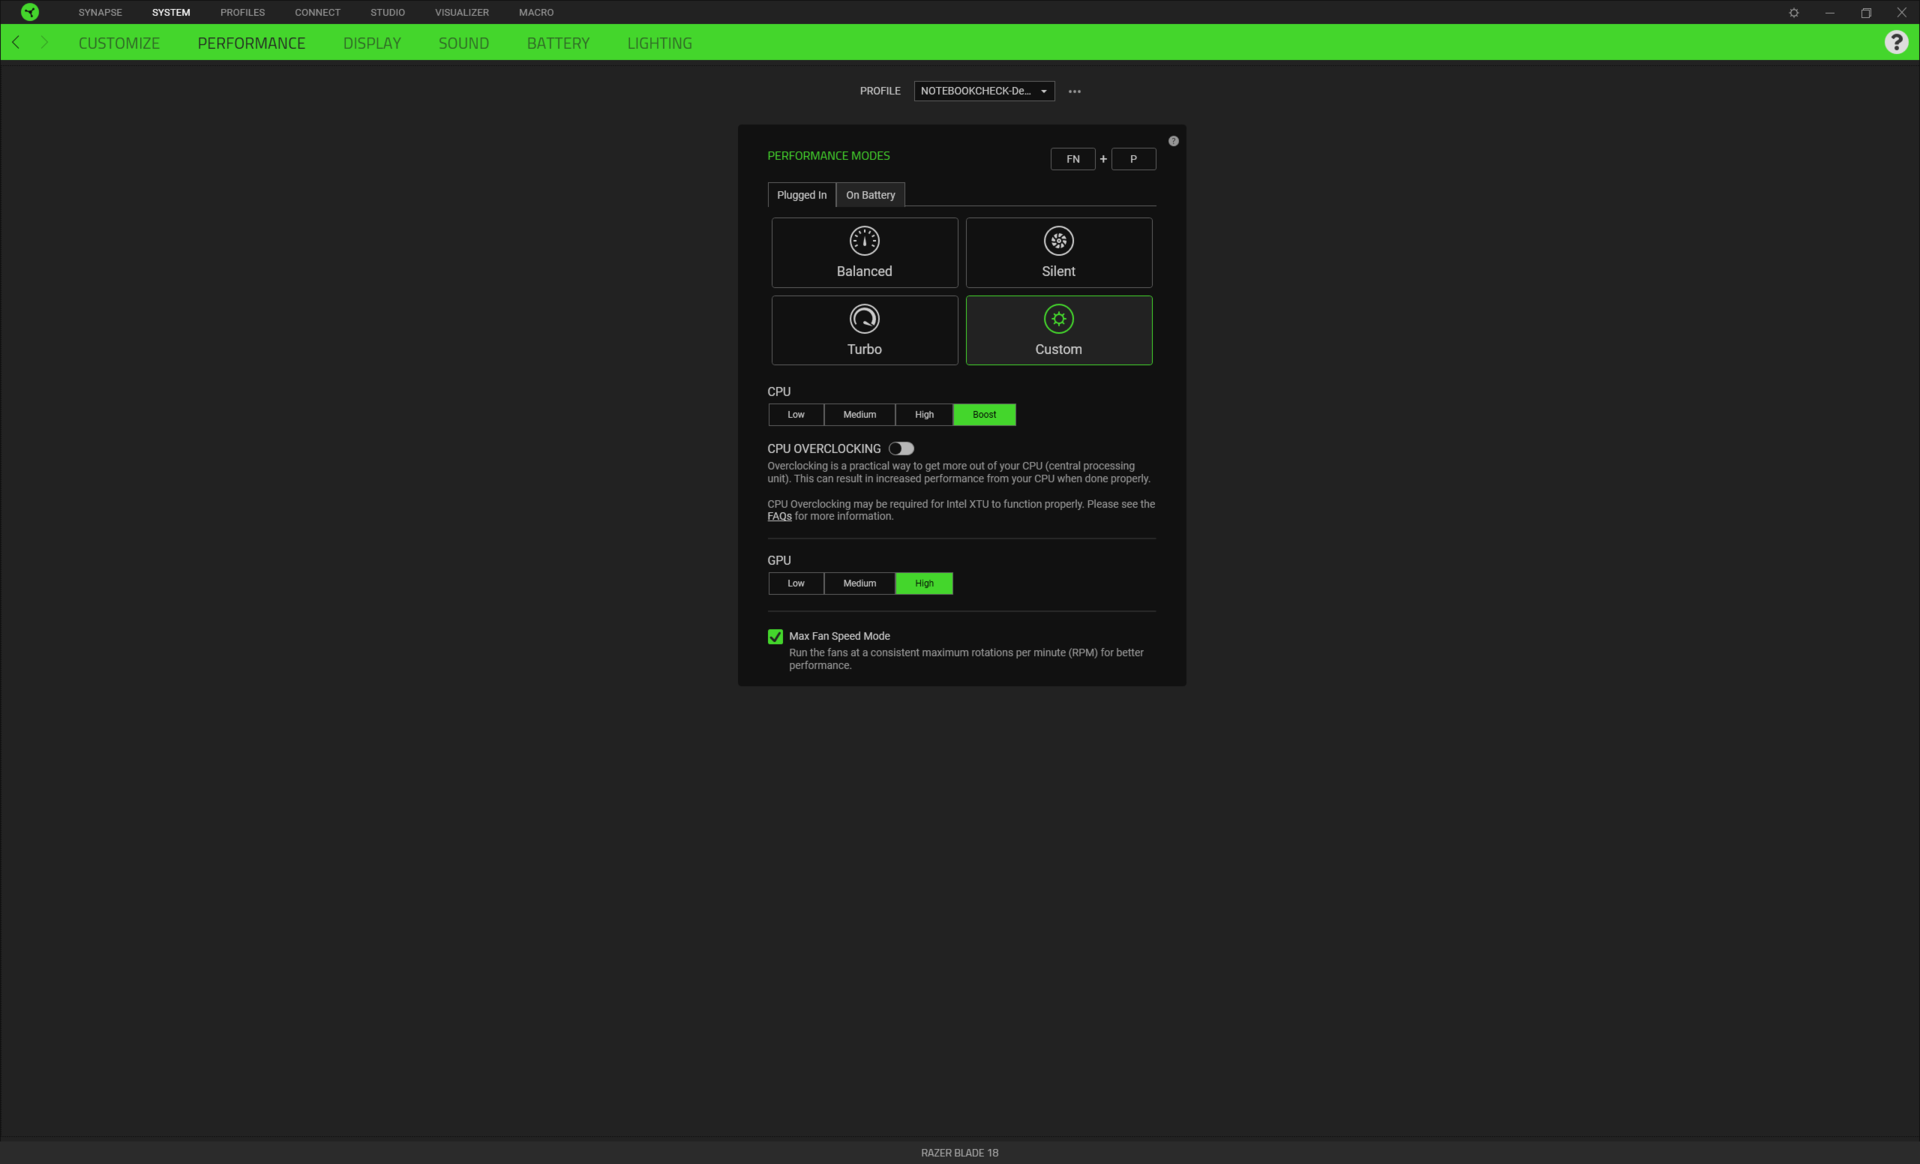
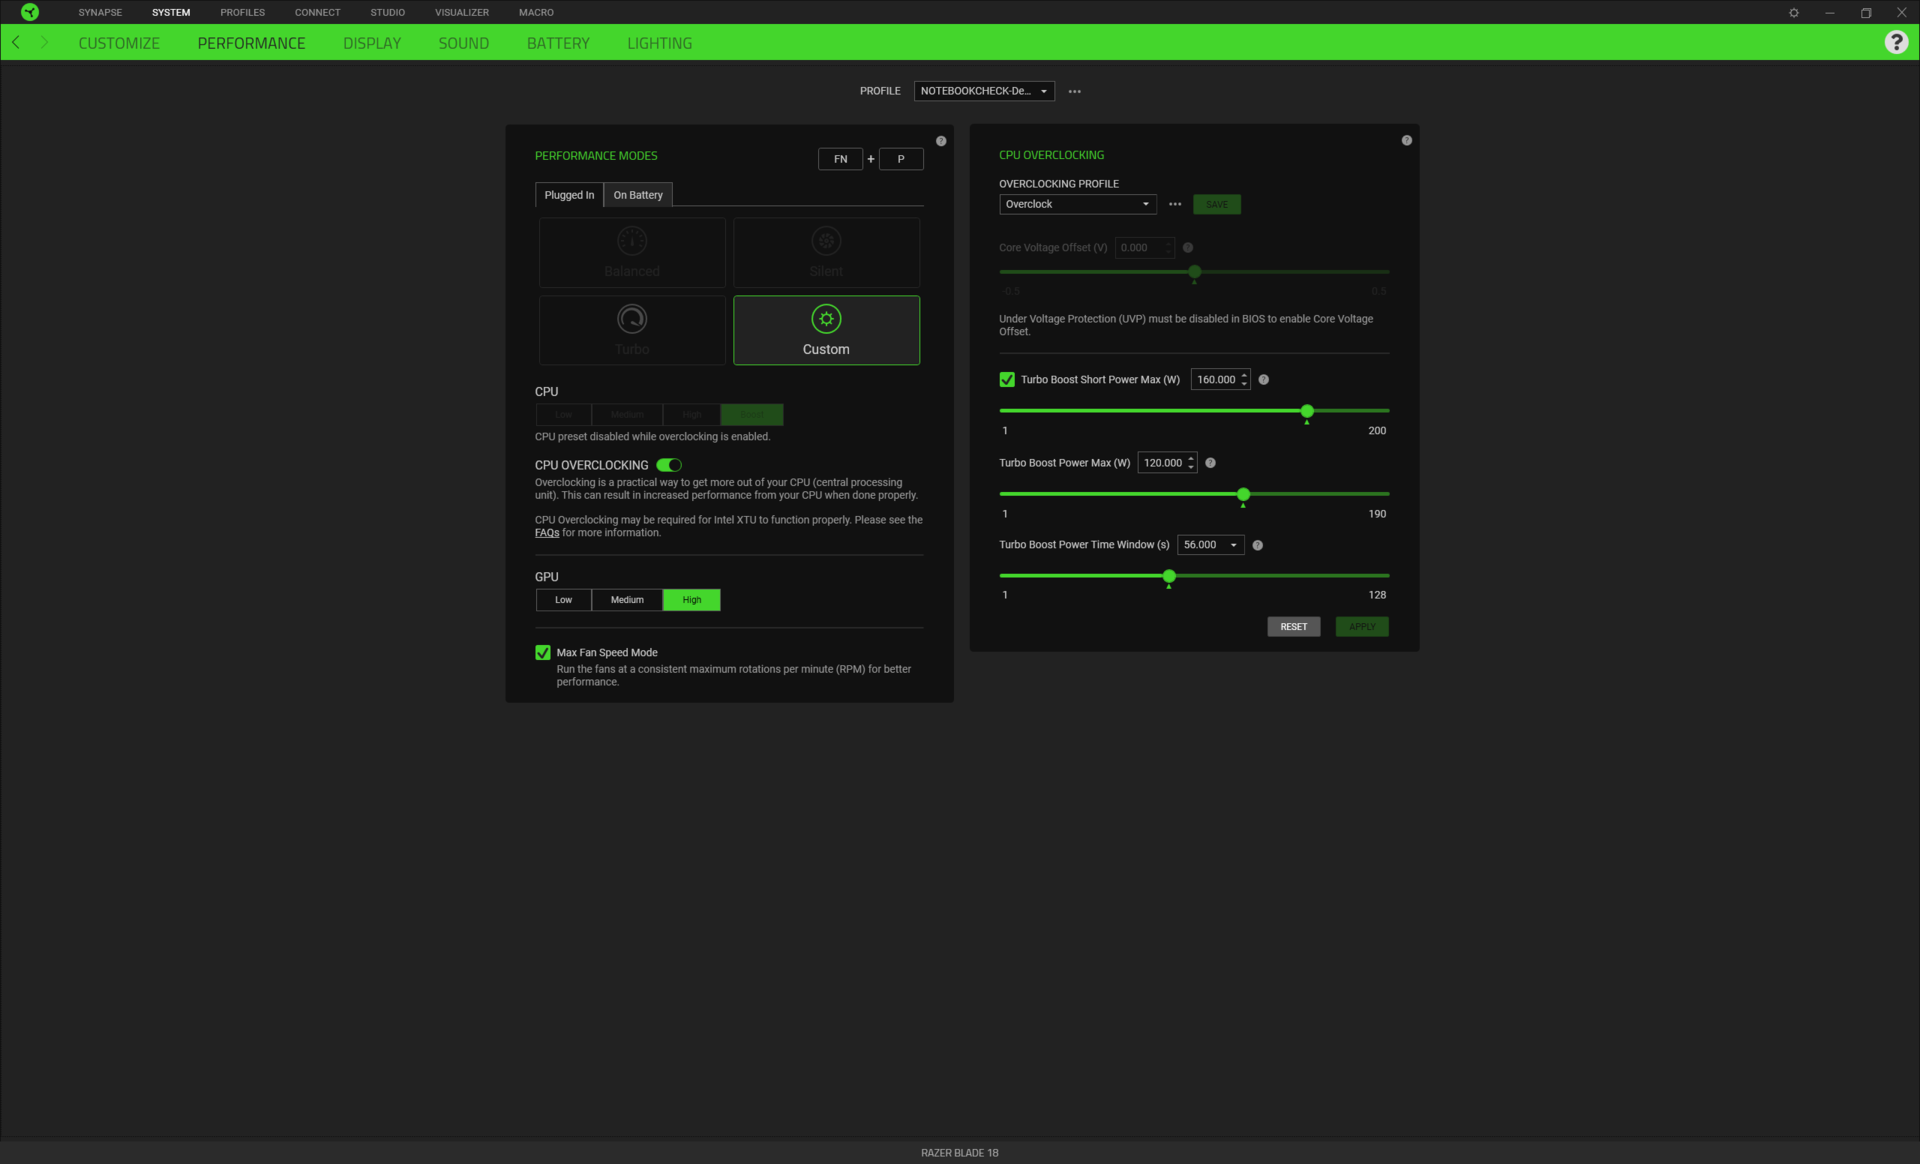
Razer continues to update Synapse with additional features and tick boxes for improved customization. New this year are Turbo mode, Max Fan mode, and integrated display functions like color profiles and hotkeys to adjust refresh rate. Note that the new Turbo mode is essentially equivalent to Custom mode as our tests below will show. Razer says they added Turbo mode to make it easier for users to select the "best" mode for gaming, but we think this may have the opposite effect as there are now too many confusing modes to choose from. All our tests below were performed on Custom mode with the CPU and GPU set to Boost and High, respectively, unless otherwise stated.
Perhaps the most important feature to keep in mind is the local dimming toggle under the Display tab. Interestingly, Razer has this turned off by default even though local dimming is one of the key selling points of mini-LED. Toggling this feature can greatly impact brightness levels in HDR mode as noted above.
Processor
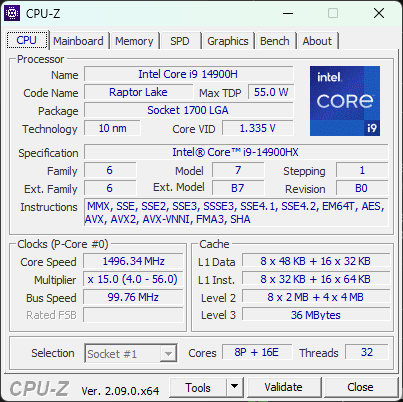
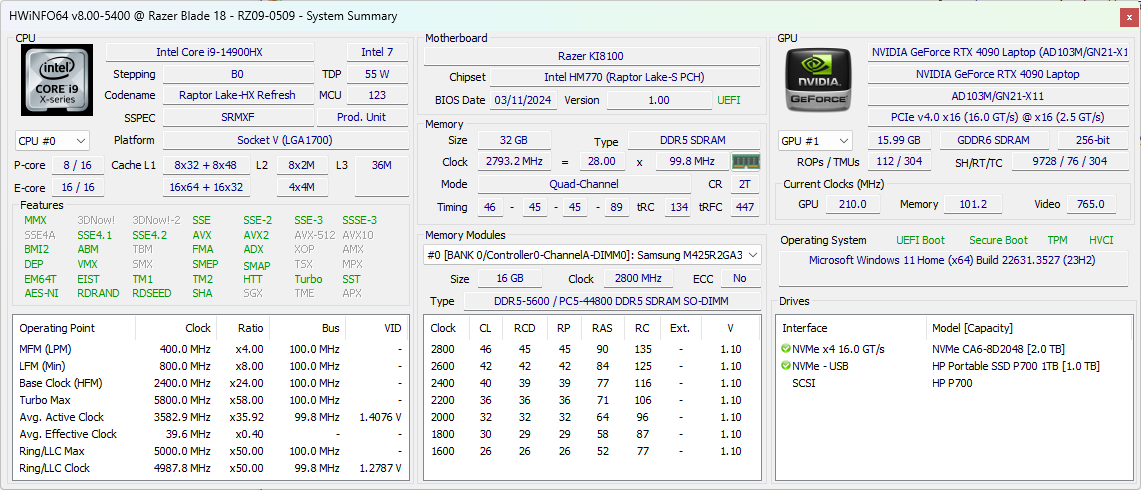
Whereas the jump from 12th gen Core i9-12900HX to 13th gen Core i9-13900HX would entail a 25 to 30 percent performance boost, the jump from 13th gen Core i9-13900HX to 14th gen Core i9-14900HX is essentially a flat line. Benchmark results between our 2023 and 2024 Blade 18 models would be within 5 percentage points of each other in both single- and multi-threaded workloads. The i9-14900HX is informally described as a rebrand of the i9-13900HX and our numbers reflect this.
| Power Profile | CineBench R23 xT Score (Points) | Sustained CPU Power Level (W) | Cyberpunk 2077 QHD Ultra (FPS) |
| Balanced | 14269 | 55 -> 45 | 65.13 |
| Turbo | 27029 | 135 -> 125 | 84.69 |
| Custom w/ Max Fan On | 27167 | 135 -> 125 | 85.46 |
Interestingly, CPU results from our Razer system would be slightly but consistently slower than most other gaming laptops with the same CPU such as the Alienware m18 R2 or MSI Titan 18 HX. We suspect that this was done on purpose in order to allow for more overclocking headroom via the Synapse software. CPU Turbo Boost performance and TDP levels are tied to the different power profiles as shown in the table above.
Cinebench R15 Multi Loop
Cinebench R23: Multi Core | Single Core
Cinebench R20: CPU (Multi Core) | CPU (Single Core)
Cinebench R15: CPU Multi 64Bit | CPU Single 64Bit
Blender: v2.79 BMW27 CPU
7-Zip 18.03: 7z b 4 | 7z b 4 -mmt1
Geekbench 6.7: Multi-Core | Single-Core
Geekbench 5.5: Multi-Core | Single-Core
HWBOT x265 Benchmark v2.2: 4k Preset
LibreOffice : 20 Documents To PDF
R Benchmark 2.5: Overall mean
* ... smaller is better
AIDA64: FP32 Ray-Trace | FPU Julia | CPU SHA3 | CPU Queen | FPU SinJulia | FPU Mandel | CPU AES | CPU ZLib | FP64 Ray-Trace | CPU PhotoWorxx
| Performance rating | |
| Asus ROG Strix Scar 17 G733PYV-LL053X | |
| Alienware m18 R2 | |
| MSI Titan 18 HX A14VIG | |
| Razer Blade 16 2024, RTX 4090 | |
| Asus ROG Strix Scar 18 G834JYR (2024) | |
| Average of class Gaming | |
| Razer Blade 18 2024 RZ09-0509 | |
| Average Intel Core i9-14900HX | |
| AIDA64 / FP32 Ray-Trace | |
| Asus ROG Strix Scar 17 G733PYV-LL053X | |
| Average of class Gaming (10227 - 85542, n=103, last 2 years) | |
| MSI Titan 18 HX A14VIG | |
| Alienware m18 R2 | |
| Razer Blade 16 2024, RTX 4090 | |
| Asus ROG Strix Scar 18 G834JYR (2024) | |
| Razer Blade 18 2024 RZ09-0509 | |
| Average Intel Core i9-14900HX (13098 - 33474, n=36) | |
| AIDA64 / FPU Julia | |
| Asus ROG Strix Scar 17 G733PYV-LL053X | |
| MSI Titan 18 HX A14VIG | |
| Alienware m18 R2 | |
| Average of class Gaming (51376 - 238426, n=103, last 2 years) | |
| Asus ROG Strix Scar 18 G834JYR (2024) | |
| Razer Blade 18 2024 RZ09-0509 | |
| Razer Blade 16 2024, RTX 4090 | |
| Average Intel Core i9-14900HX (67573 - 166040, n=36) | |
| AIDA64 / CPU SHA3 | |
| Asus ROG Strix Scar 17 G733PYV-LL053X | |
| MSI Titan 18 HX A14VIG | |
| Alienware m18 R2 | |
| Average of class Gaming (2180 - 9817, n=103, last 2 years) | |
| Asus ROG Strix Scar 18 G834JYR (2024) | |
| Razer Blade 16 2024, RTX 4090 | |
| Razer Blade 18 2024 RZ09-0509 | |
| Average Intel Core i9-14900HX (3589 - 7979, n=36) | |
| AIDA64 / CPU Queen | |
| Asus ROG Strix Scar 17 G733PYV-LL053X | |
| MSI Titan 18 HX A14VIG | |
| Asus ROG Strix Scar 18 G834JYR (2024) | |
| Alienware m18 R2 | |
| Razer Blade 16 2024, RTX 4090 | |
| Average Intel Core i9-14900HX (118405 - 148966, n=36) | |
| Razer Blade 18 2024 RZ09-0509 | |
| Average of class Gaming (49785 - 173351, n=89, last 2 years) | |
| AIDA64 / FPU SinJulia | |
| Asus ROG Strix Scar 17 G733PYV-LL053X | |
| MSI Titan 18 HX A14VIG | |
| Alienware m18 R2 | |
| Asus ROG Strix Scar 18 G834JYR (2024) | |
| Razer Blade 16 2024, RTX 4090 | |
| Razer Blade 18 2024 RZ09-0509 | |
| Average Intel Core i9-14900HX (10475 - 18517, n=36) | |
| Average of class Gaming (4424 - 33636, n=103, last 2 years) | |
| AIDA64 / FPU Mandel | |
| Asus ROG Strix Scar 17 G733PYV-LL053X | |
| Average of class Gaming (25115 - 128721, n=103, last 2 years) | |
| Alienware m18 R2 | |
| MSI Titan 18 HX A14VIG | |
| Razer Blade 16 2024, RTX 4090 | |
| Asus ROG Strix Scar 18 G834JYR (2024) | |
| Razer Blade 18 2024 RZ09-0509 | |
| Average Intel Core i9-14900HX (32543 - 83662, n=36) | |
| AIDA64 / CPU AES | |
| Asus ROG Strix Scar 17 G733PYV-LL053X | |
| Average Intel Core i9-14900HX (86964 - 241777, n=36) | |
| MSI Titan 18 HX A14VIG | |
| Alienware m18 R2 | |
| Razer Blade 16 2024, RTX 4090 | |
| Asus ROG Strix Scar 18 G834JYR (2024) | |
| Razer Blade 18 2024 RZ09-0509 | |
| Average of class Gaming (39258 - 247074, n=103, last 2 years) | |
| AIDA64 / CPU ZLib | |
| MSI Titan 18 HX A14VIG | |
| Alienware m18 R2 | |
| Asus ROG Strix Scar 17 G733PYV-LL053X | |
| Razer Blade 16 2024, RTX 4090 | |
| Razer Blade 18 2024 RZ09-0509 | |
| Average Intel Core i9-14900HX (1054 - 2292, n=36) | |
| Asus ROG Strix Scar 18 G834JYR (2024) | |
| Average of class Gaming (574 - 2531, n=103, last 2 years) | |
| AIDA64 / FP64 Ray-Trace | |
| Asus ROG Strix Scar 17 G733PYV-LL053X | |
| Average of class Gaming (5509 - 45446, n=103, last 2 years) | |
| Alienware m18 R2 | |
| MSI Titan 18 HX A14VIG | |
| Razer Blade 16 2024, RTX 4090 | |
| Razer Blade 18 2024 RZ09-0509 | |
| Asus ROG Strix Scar 18 G834JYR (2024) | |
| Average Intel Core i9-14900HX (6809 - 18349, n=36) | |
| AIDA64 / CPU PhotoWorxx | |
| Alienware m18 R2 | |
| Asus ROG Strix Scar 18 G834JYR (2024) | |
| Razer Blade 16 2024, RTX 4090 | |
| Razer Blade 18 2024 RZ09-0509 | |
| Average Intel Core i9-14900HX (23903 - 54702, n=36) | |
| Average of class Gaming (12271 - 89891, n=103, last 2 years) | |
| Asus ROG Strix Scar 17 G733PYV-LL053X | |
| MSI Titan 18 HX A14VIG | |
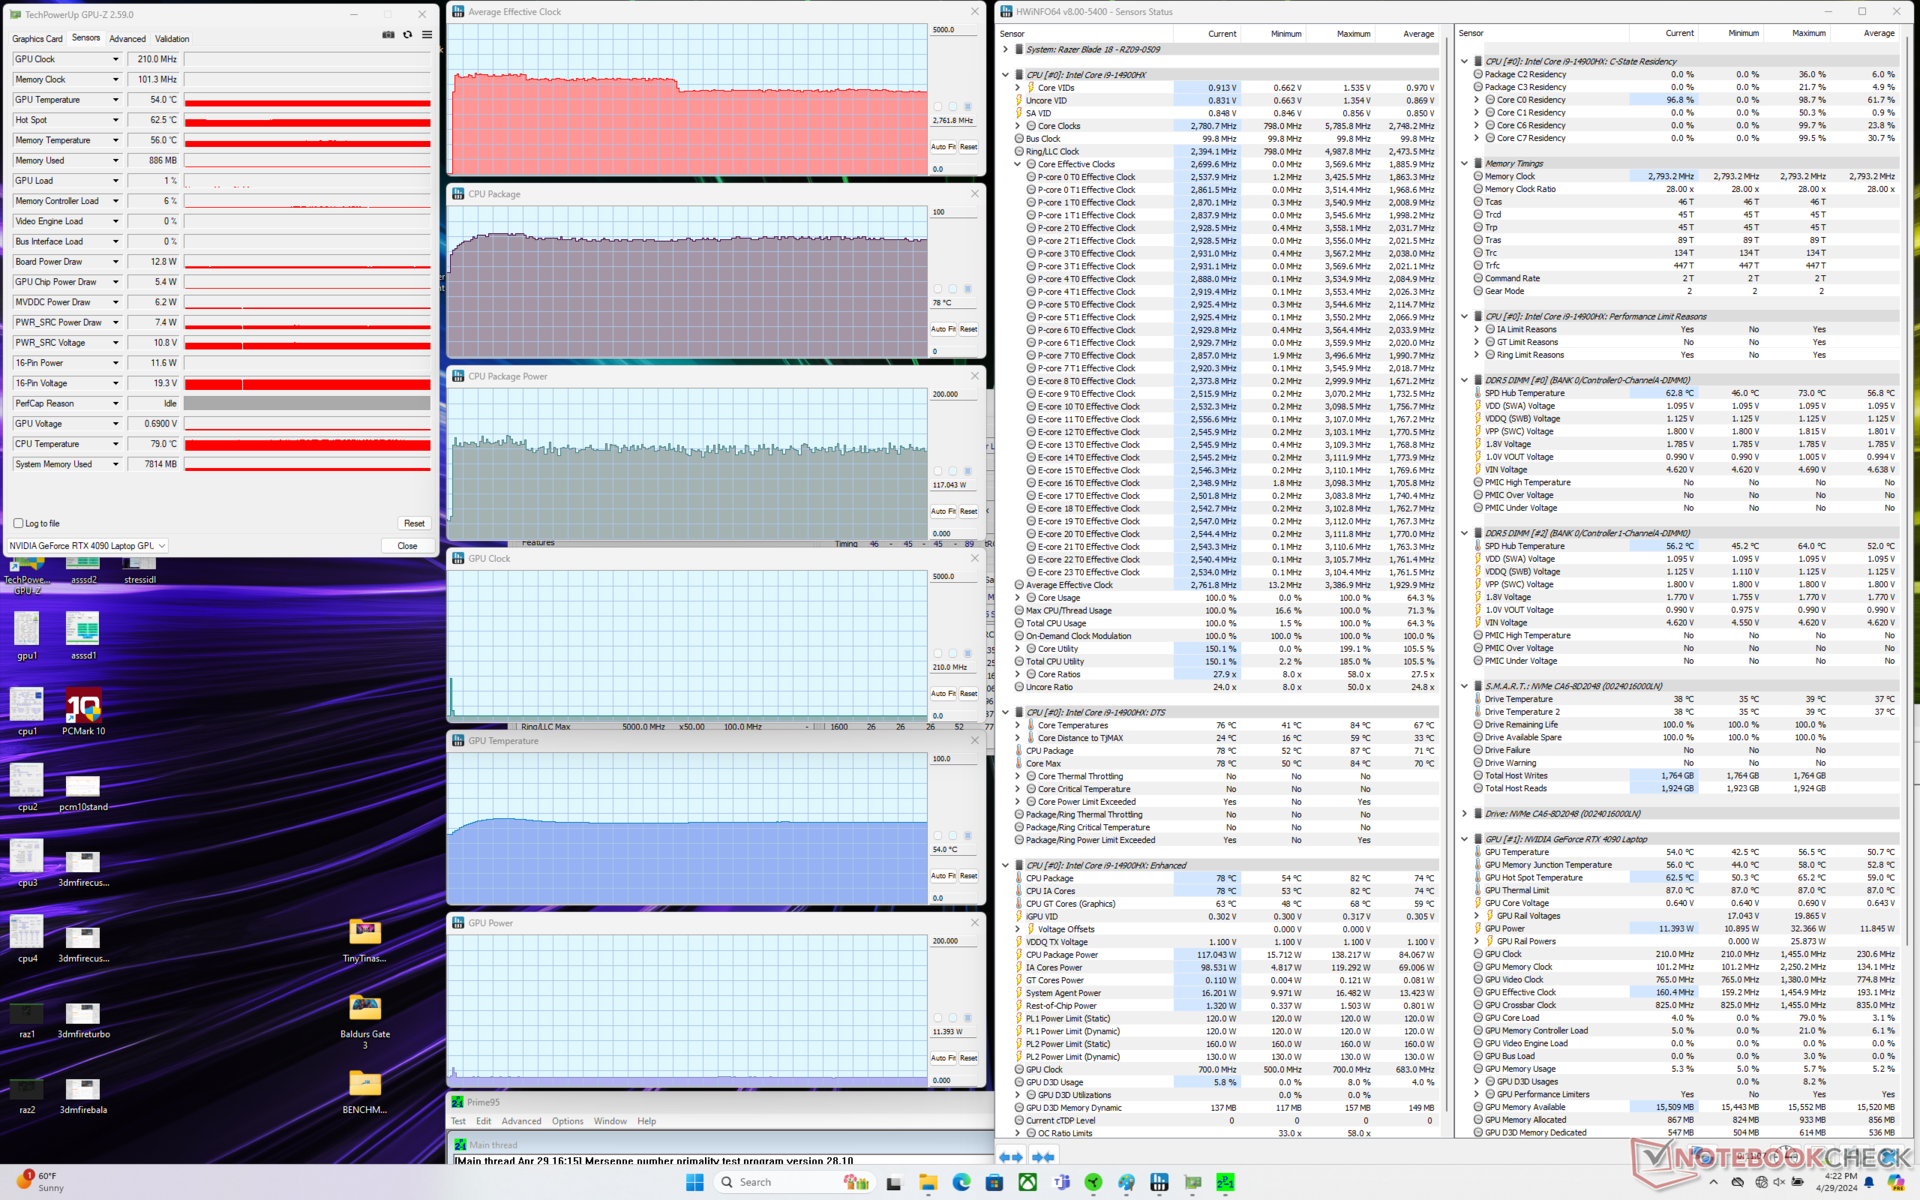
Stress Test
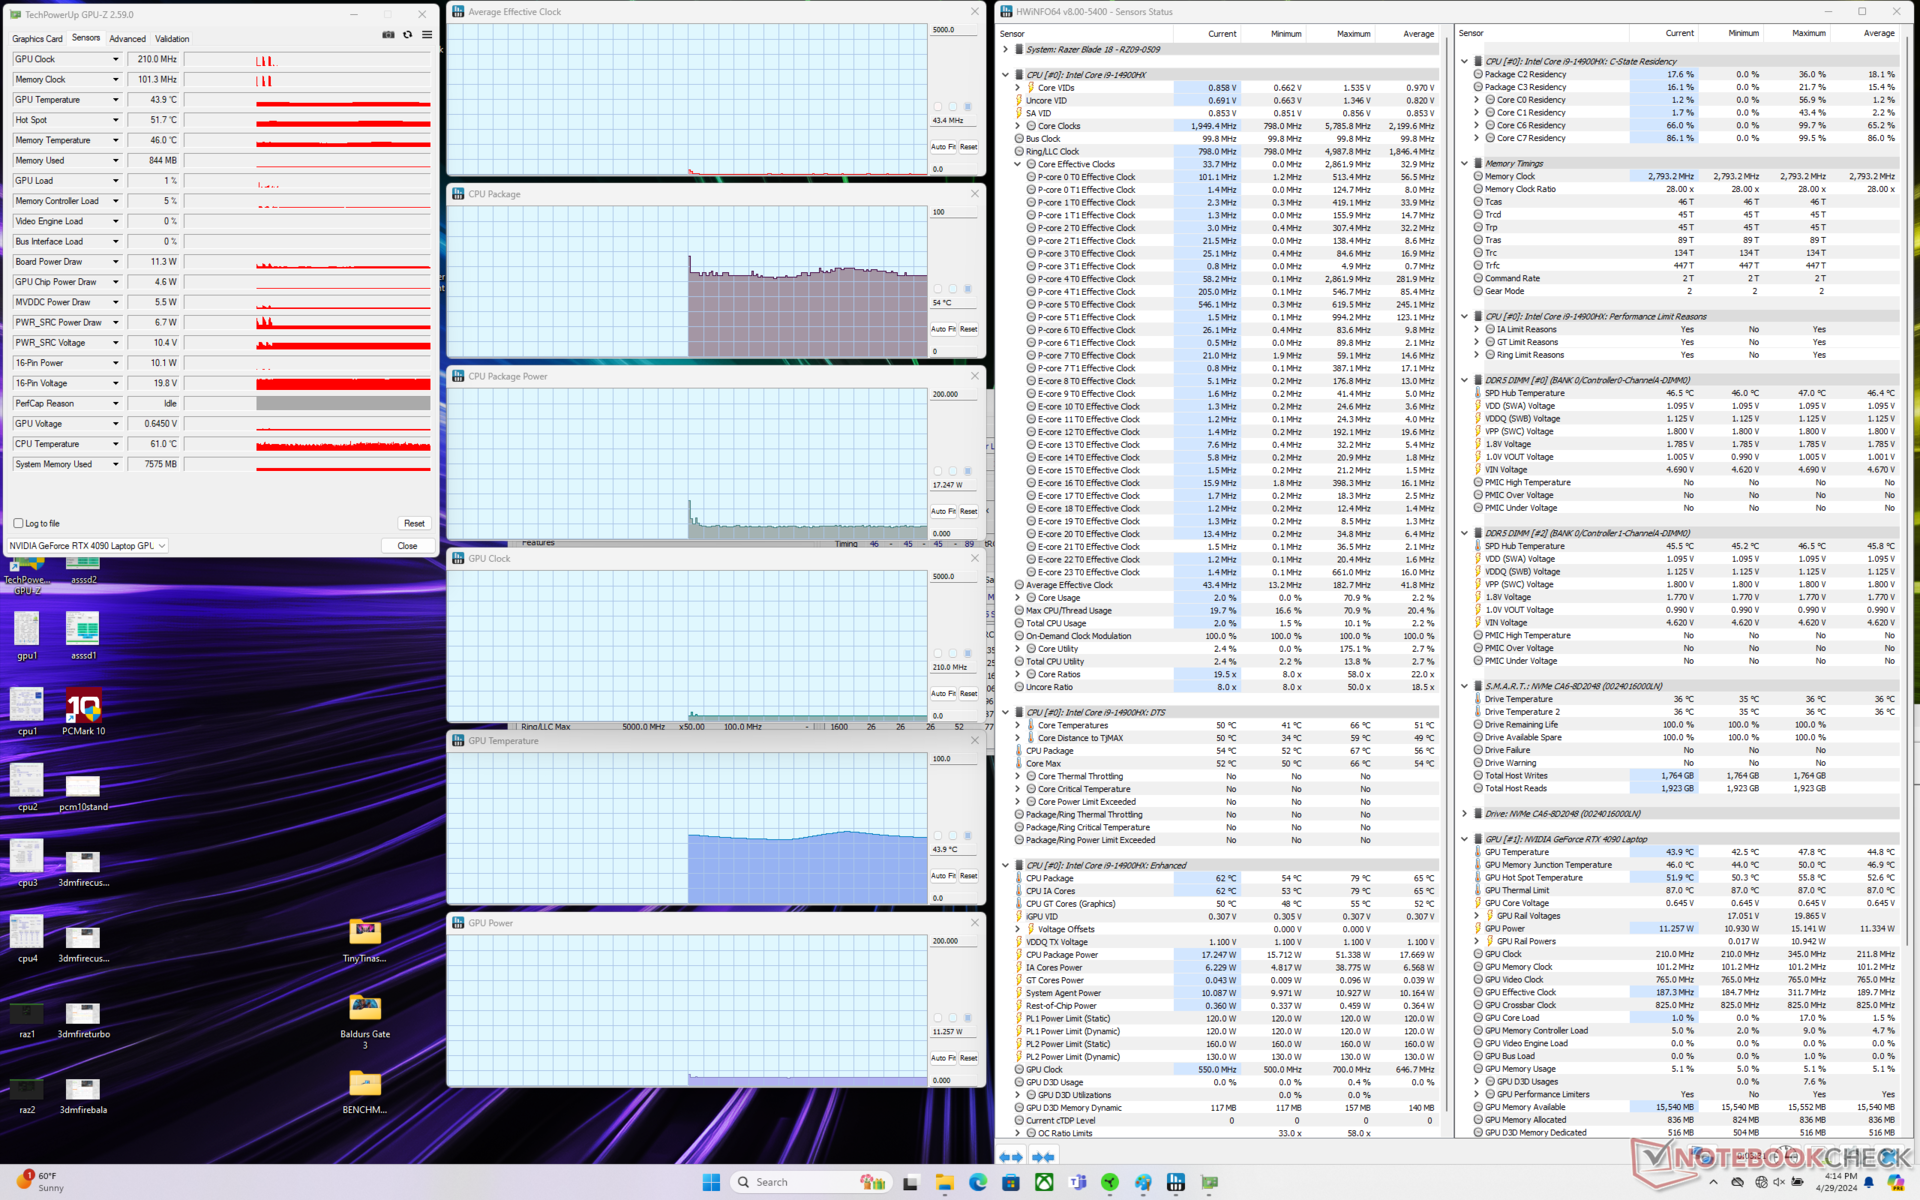
CPU power draw when running Prime95 would stabilize at around 117 W to be very close to what we recorded on last year's Blade 18 at 114 W. When paired with their nearly identical performance numbers as noted in the section above, this further cements the fact that the newer Raptor Lake-HX refresh series offers little to no benefits over the older Core i9-13950HX.
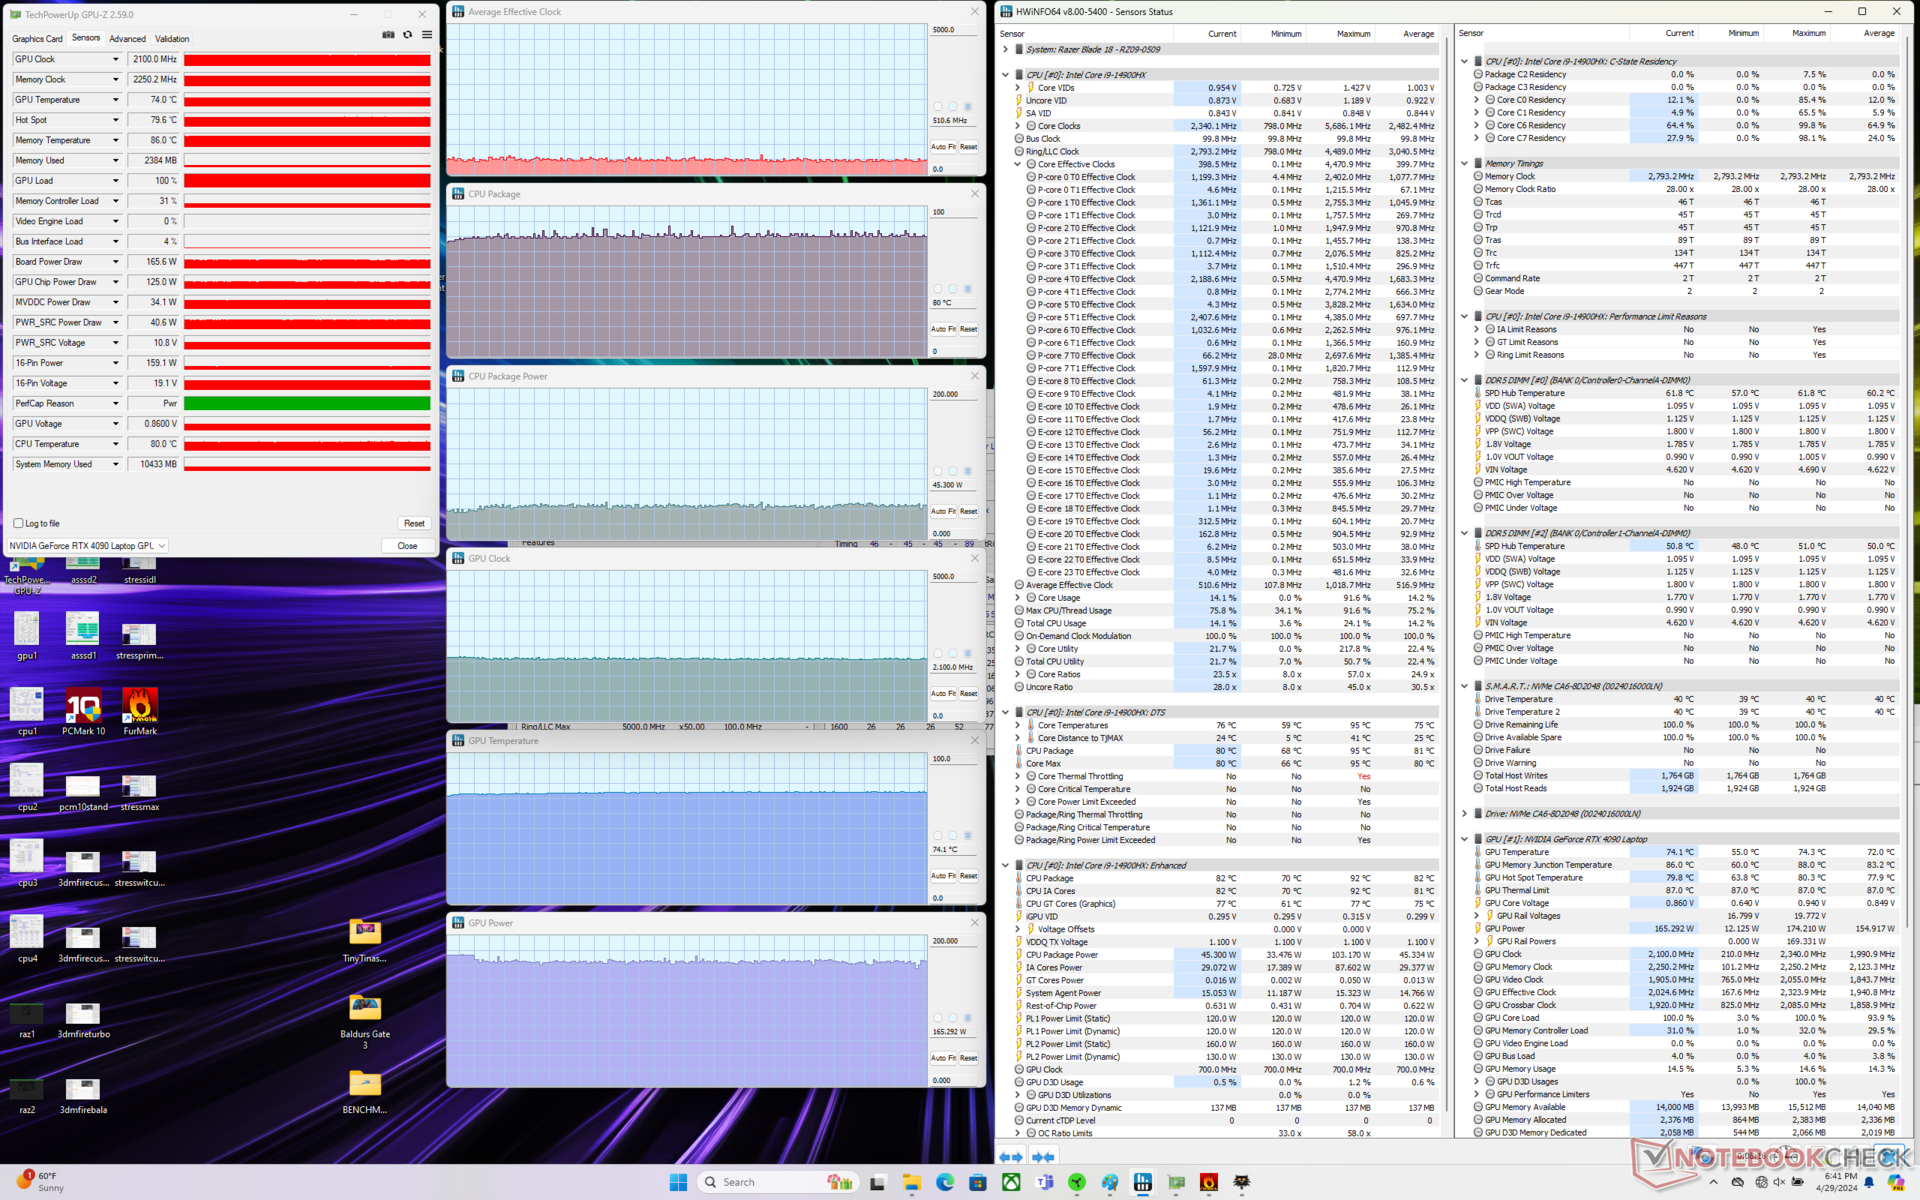
Running Witcher 3 to represent typical gaming loads shows no major performance differences between Max Fan on or Max Fan off since GPU board power draw would remain almost the same at a steady 172 W. Dropping to Turbo mode reduces GPU power draw by just a few watts to be indiscernible in practice. CPU and GPU temperatures would stabilize at 80 C and 74 C, respectively, compared to 87 C and 64 C on the much heavier and slightly faster Alienware m18 R2.
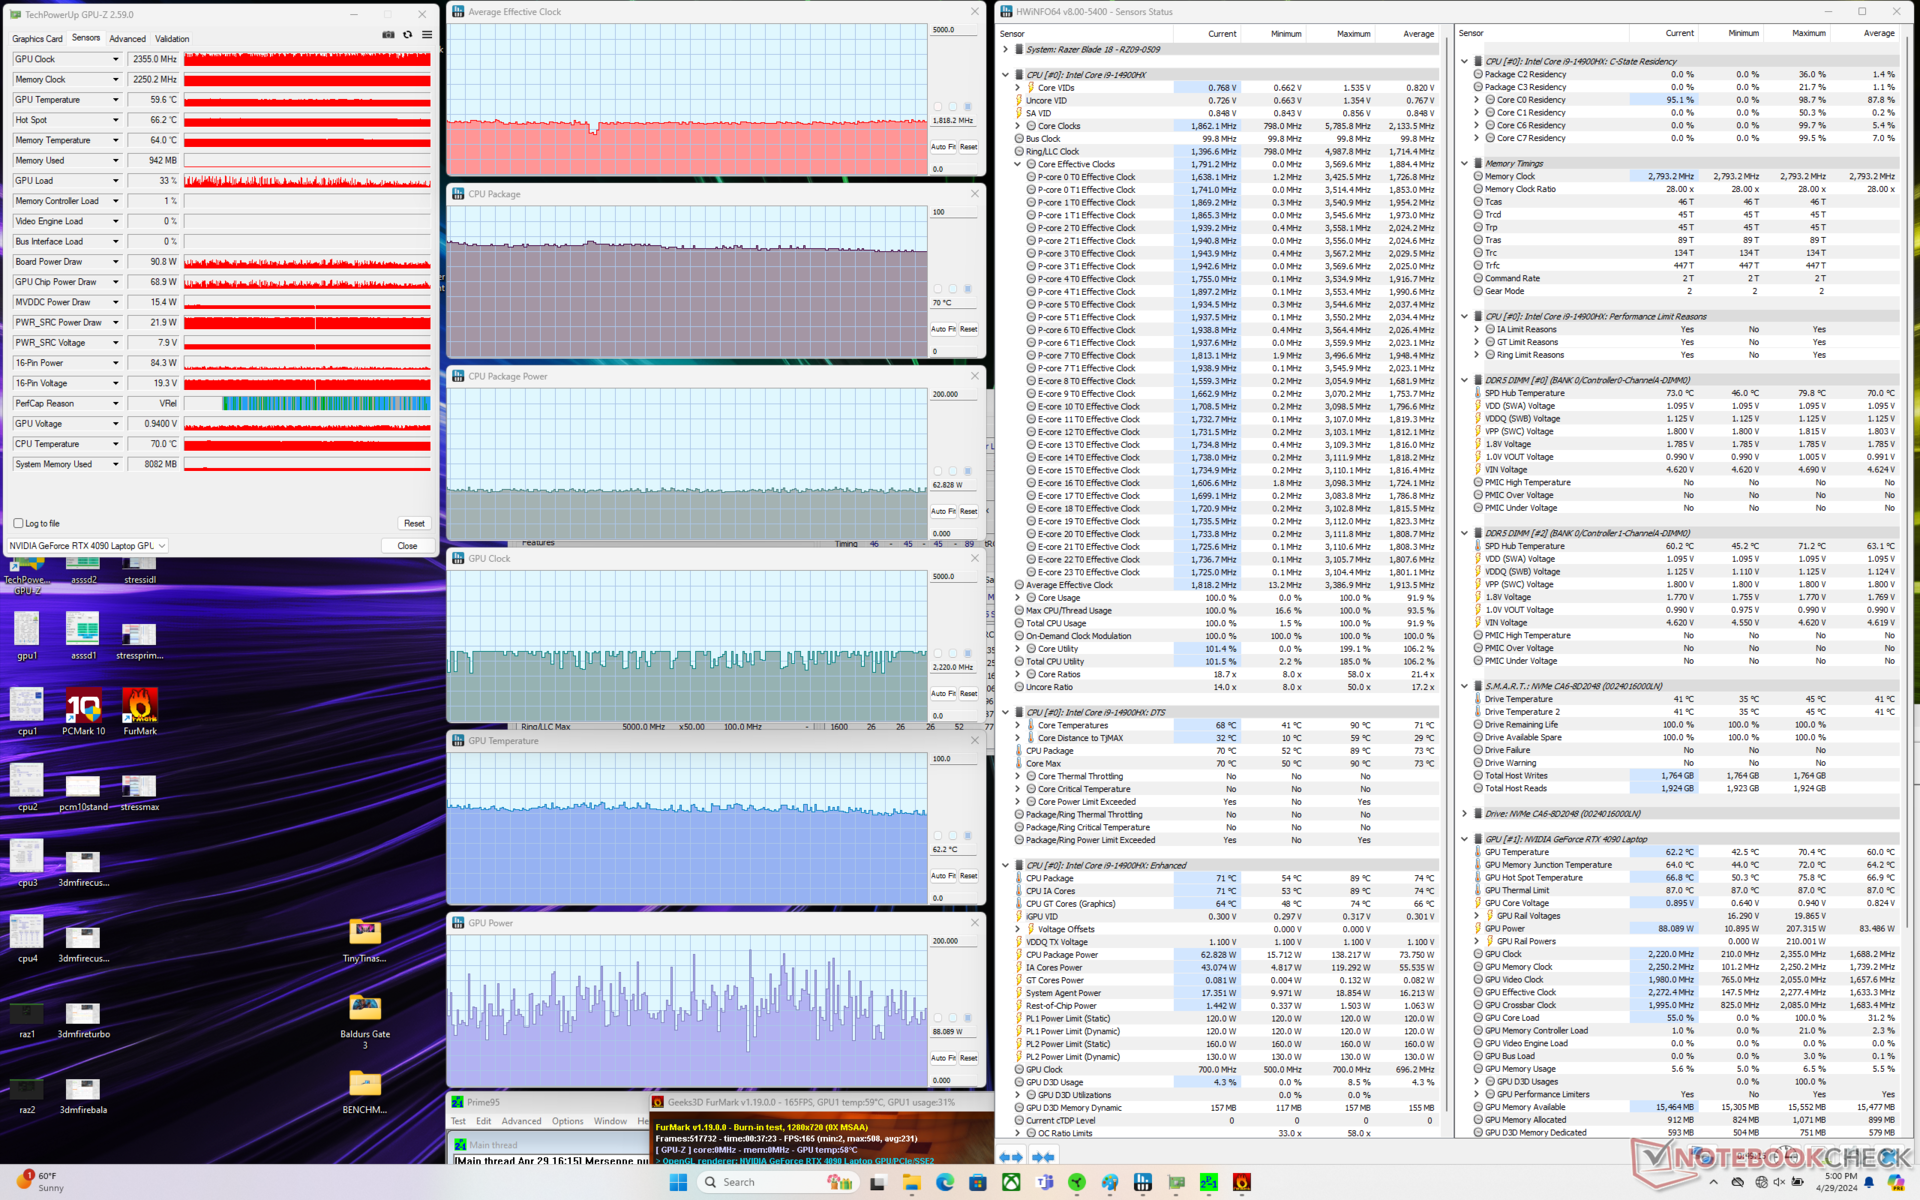
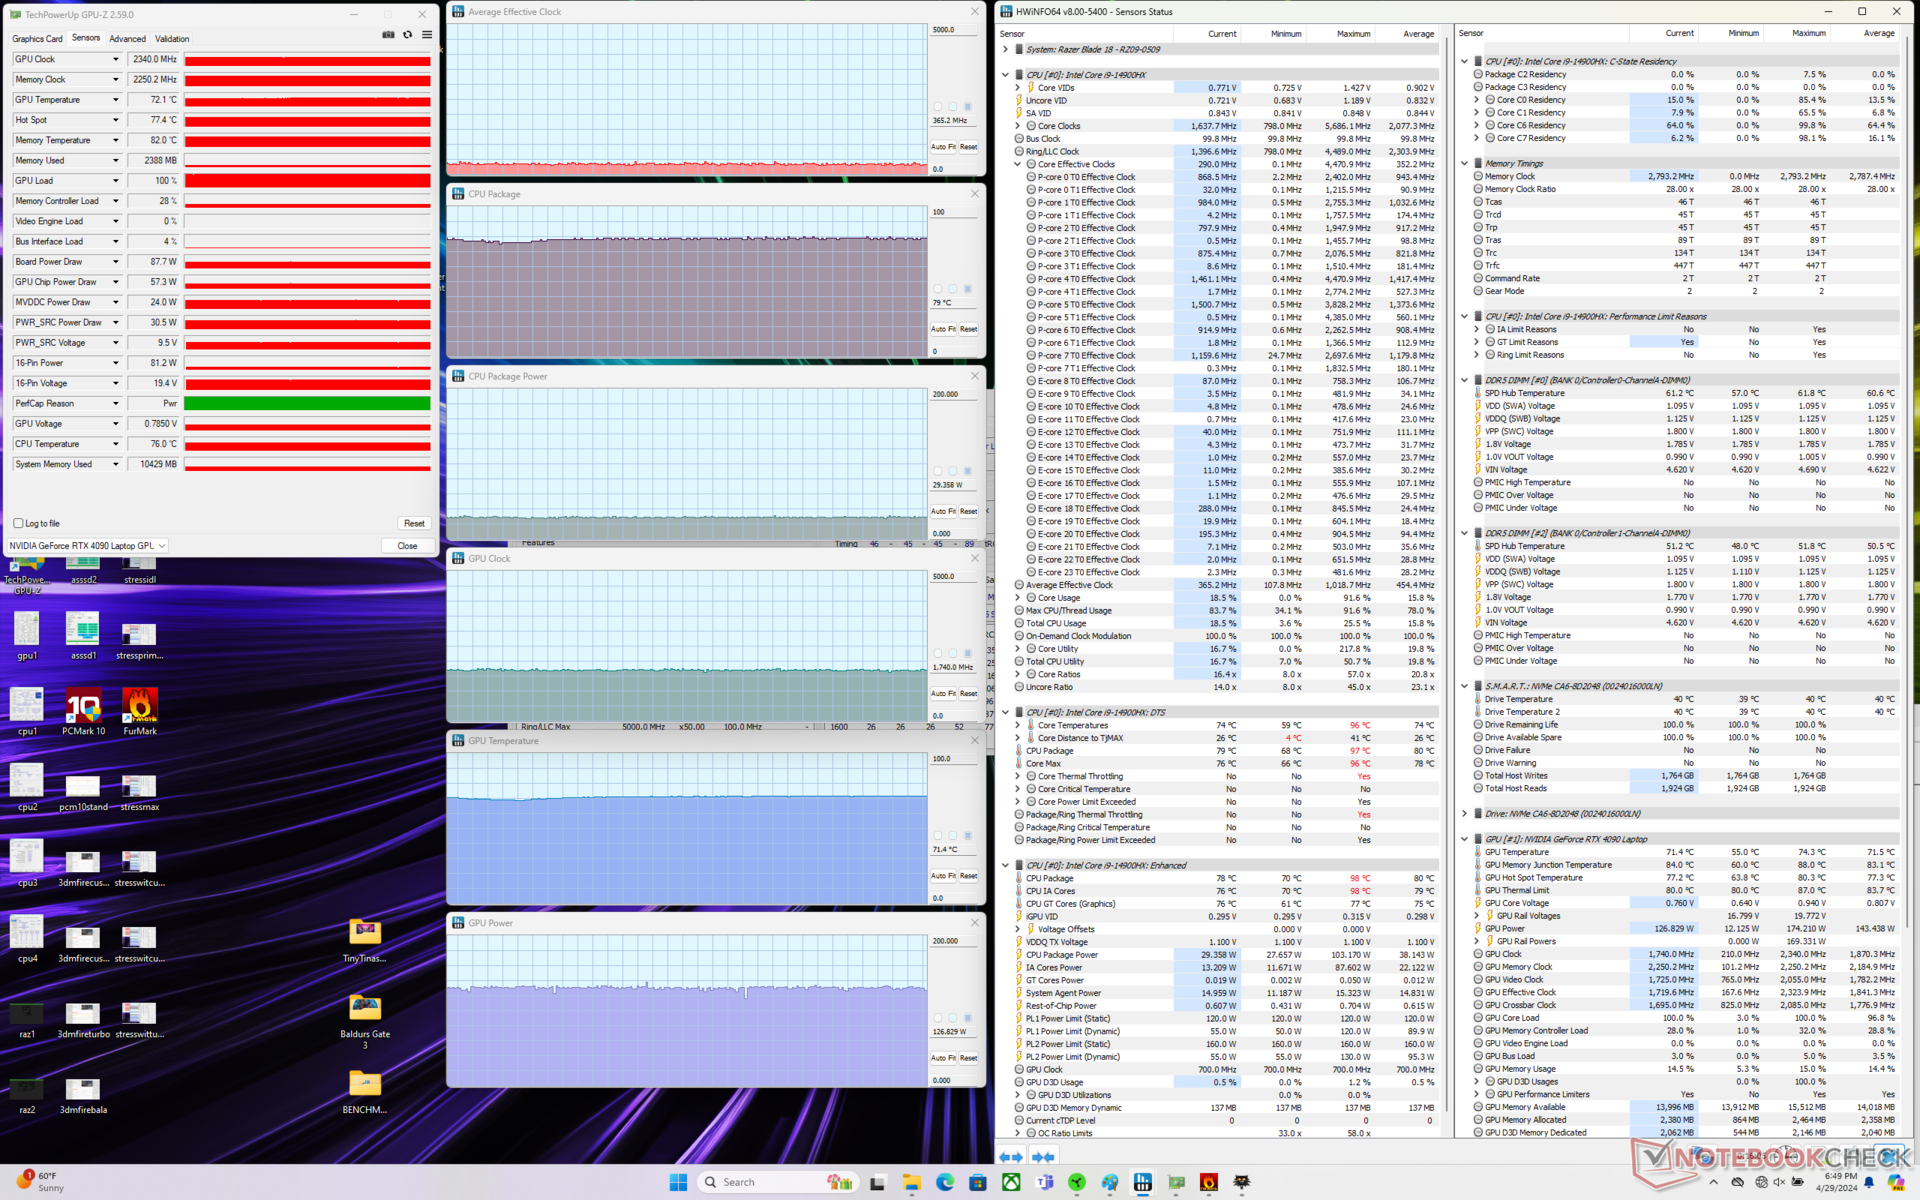
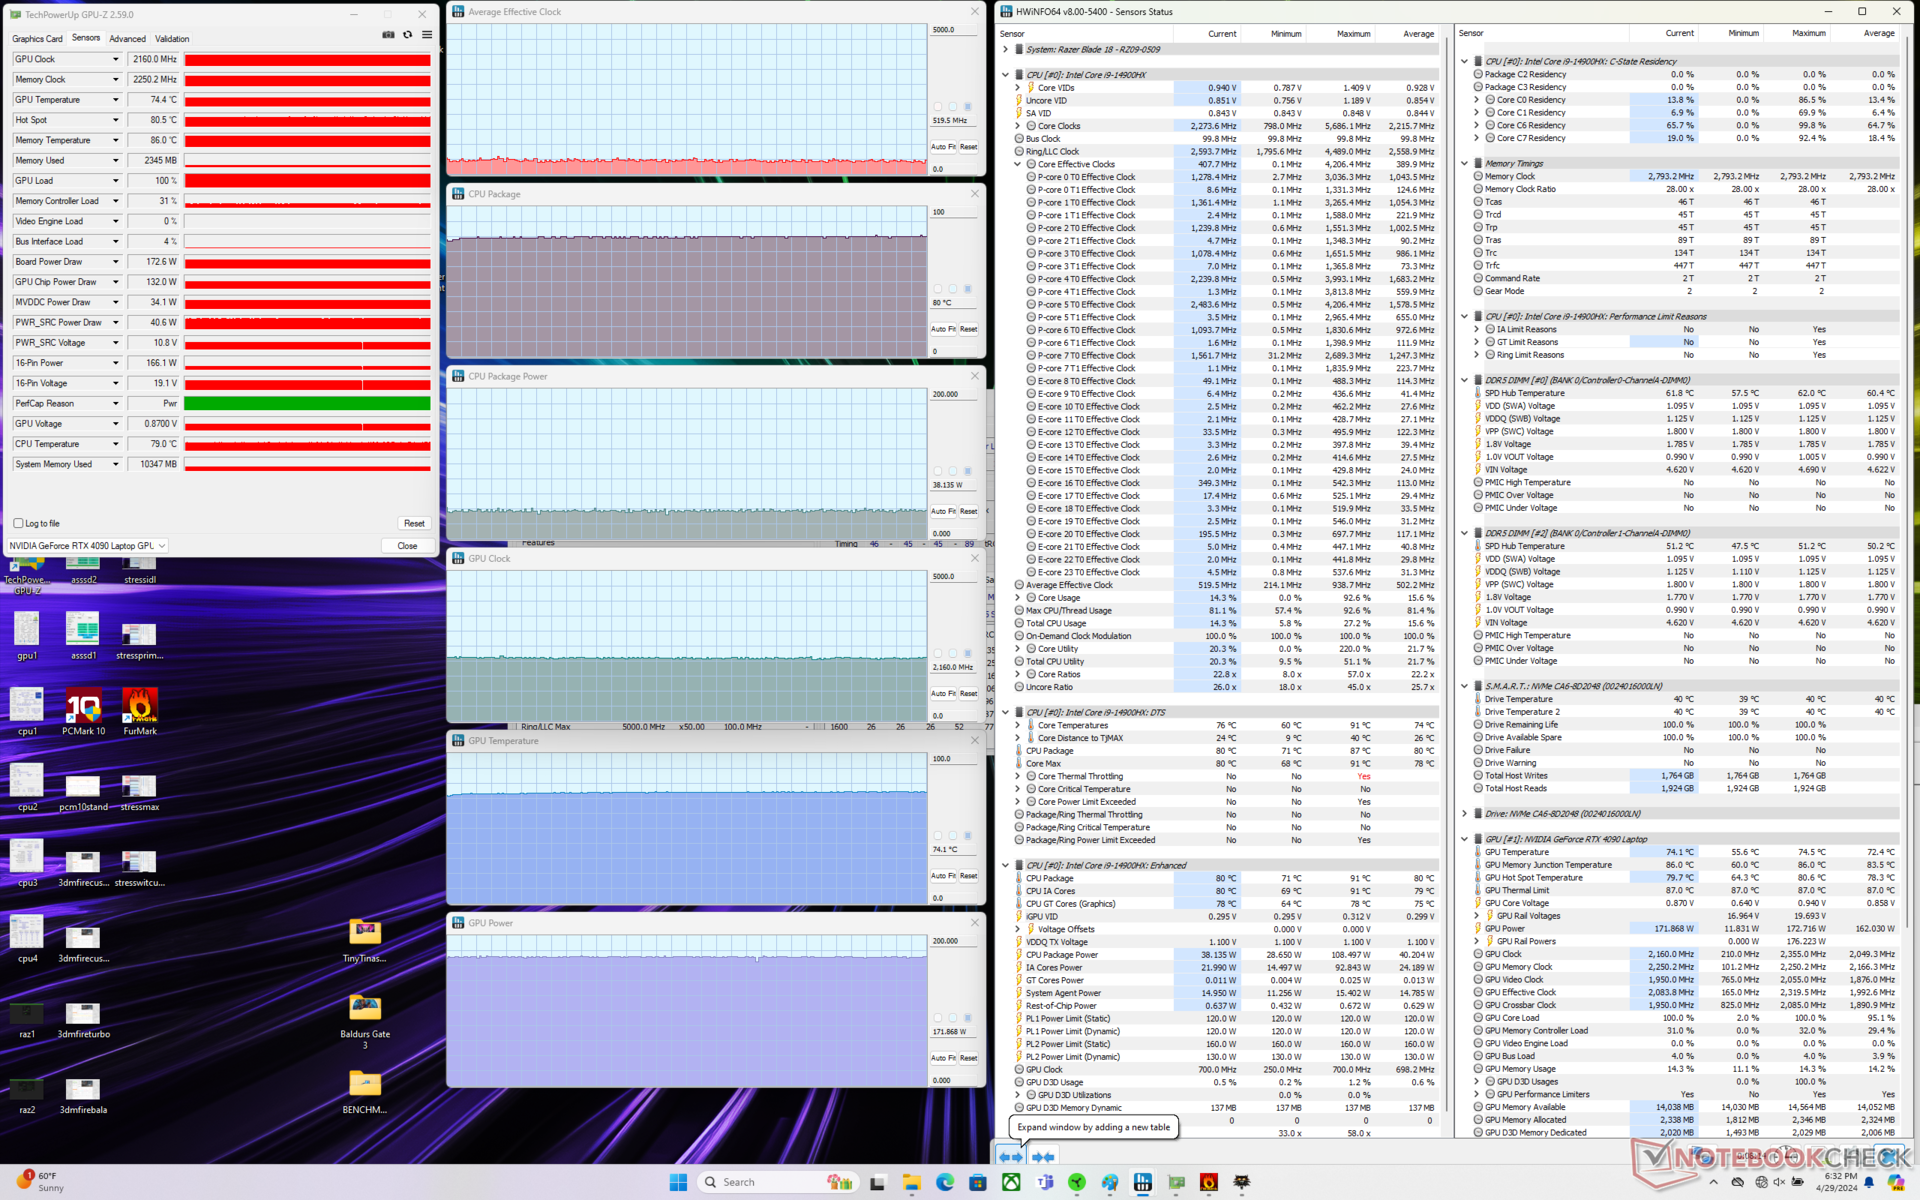
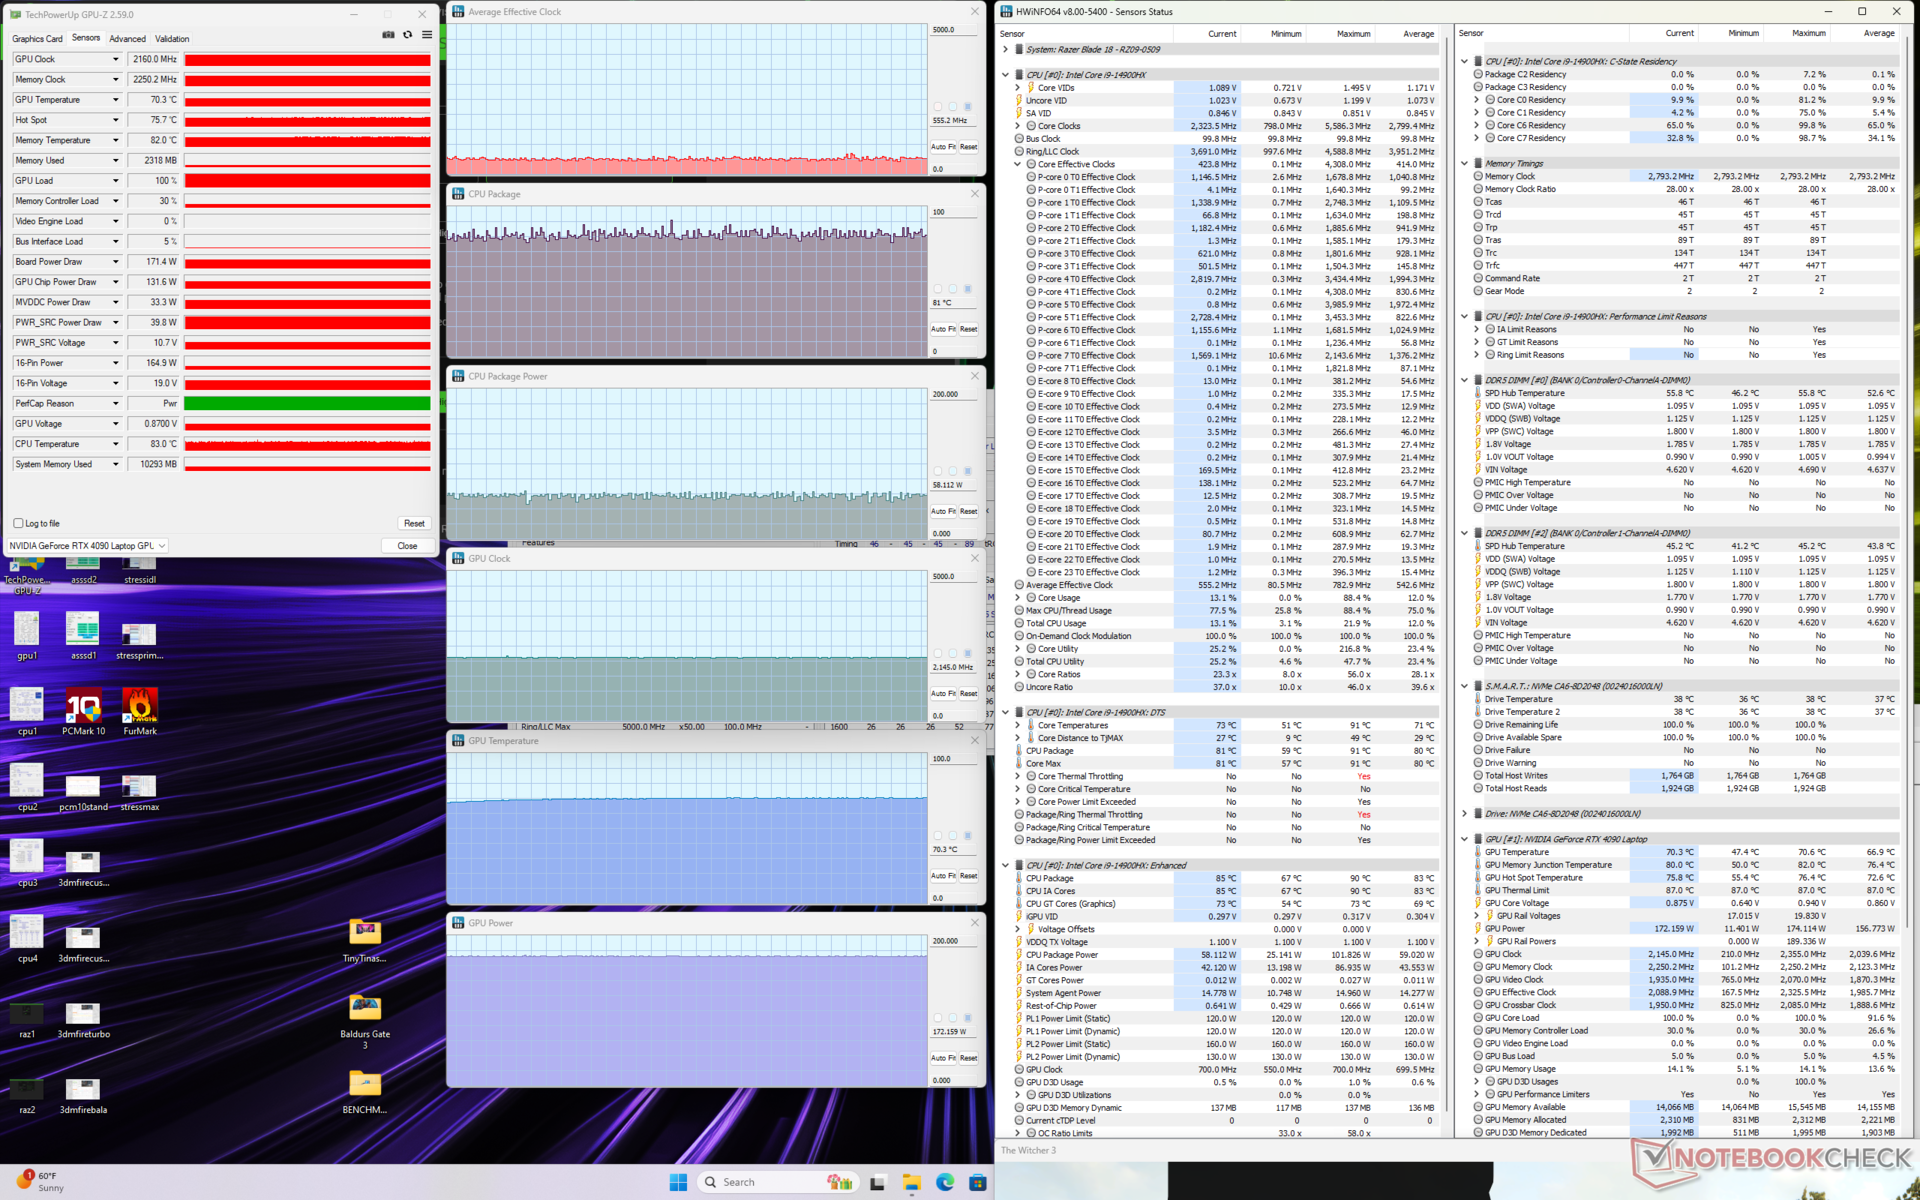
| Average Effective CPU Clock (GHz) | GPU Clock (MHz) | Average CPU Temperature (°C) | Average GPU Temperature (°C) | GPU Board Power Draw | |
| System Idle | -- | -- | 54 | 44 | -- |
| Prime95 Stress | 2.8 | -- | 78 | 54 | -- |
| Prime95 + FurMark Stress | 1.8 | 1515 - 2340 | 70 | 62 | 42 - 181 |
| Witcher 3 Stress (Custom Mode w/ Max Fan On) | ~0.6 | 2145 | 81 | 70 | 172 |
| Witcher 3 Stress (Custom Mode w/ Max Fan Off) | ~0.5 | 2160 | 80 | 74 | 172 |
| Witcher 3 Stress (Turbo Mode) | ~0.5 | 2100 | 80 | 74 | 165 |
| Witcher 3 Stress (Balanced Mode) | ~0.4 | 1740 | 79 | 71 | 127 |
System Performance
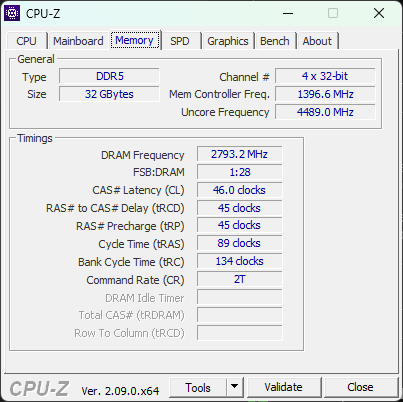
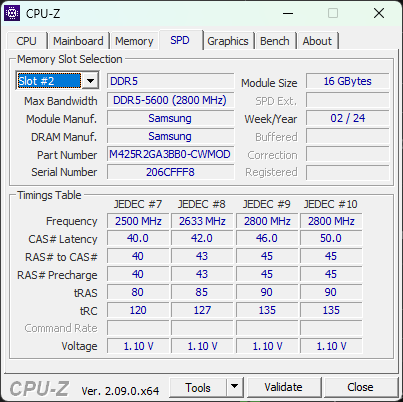
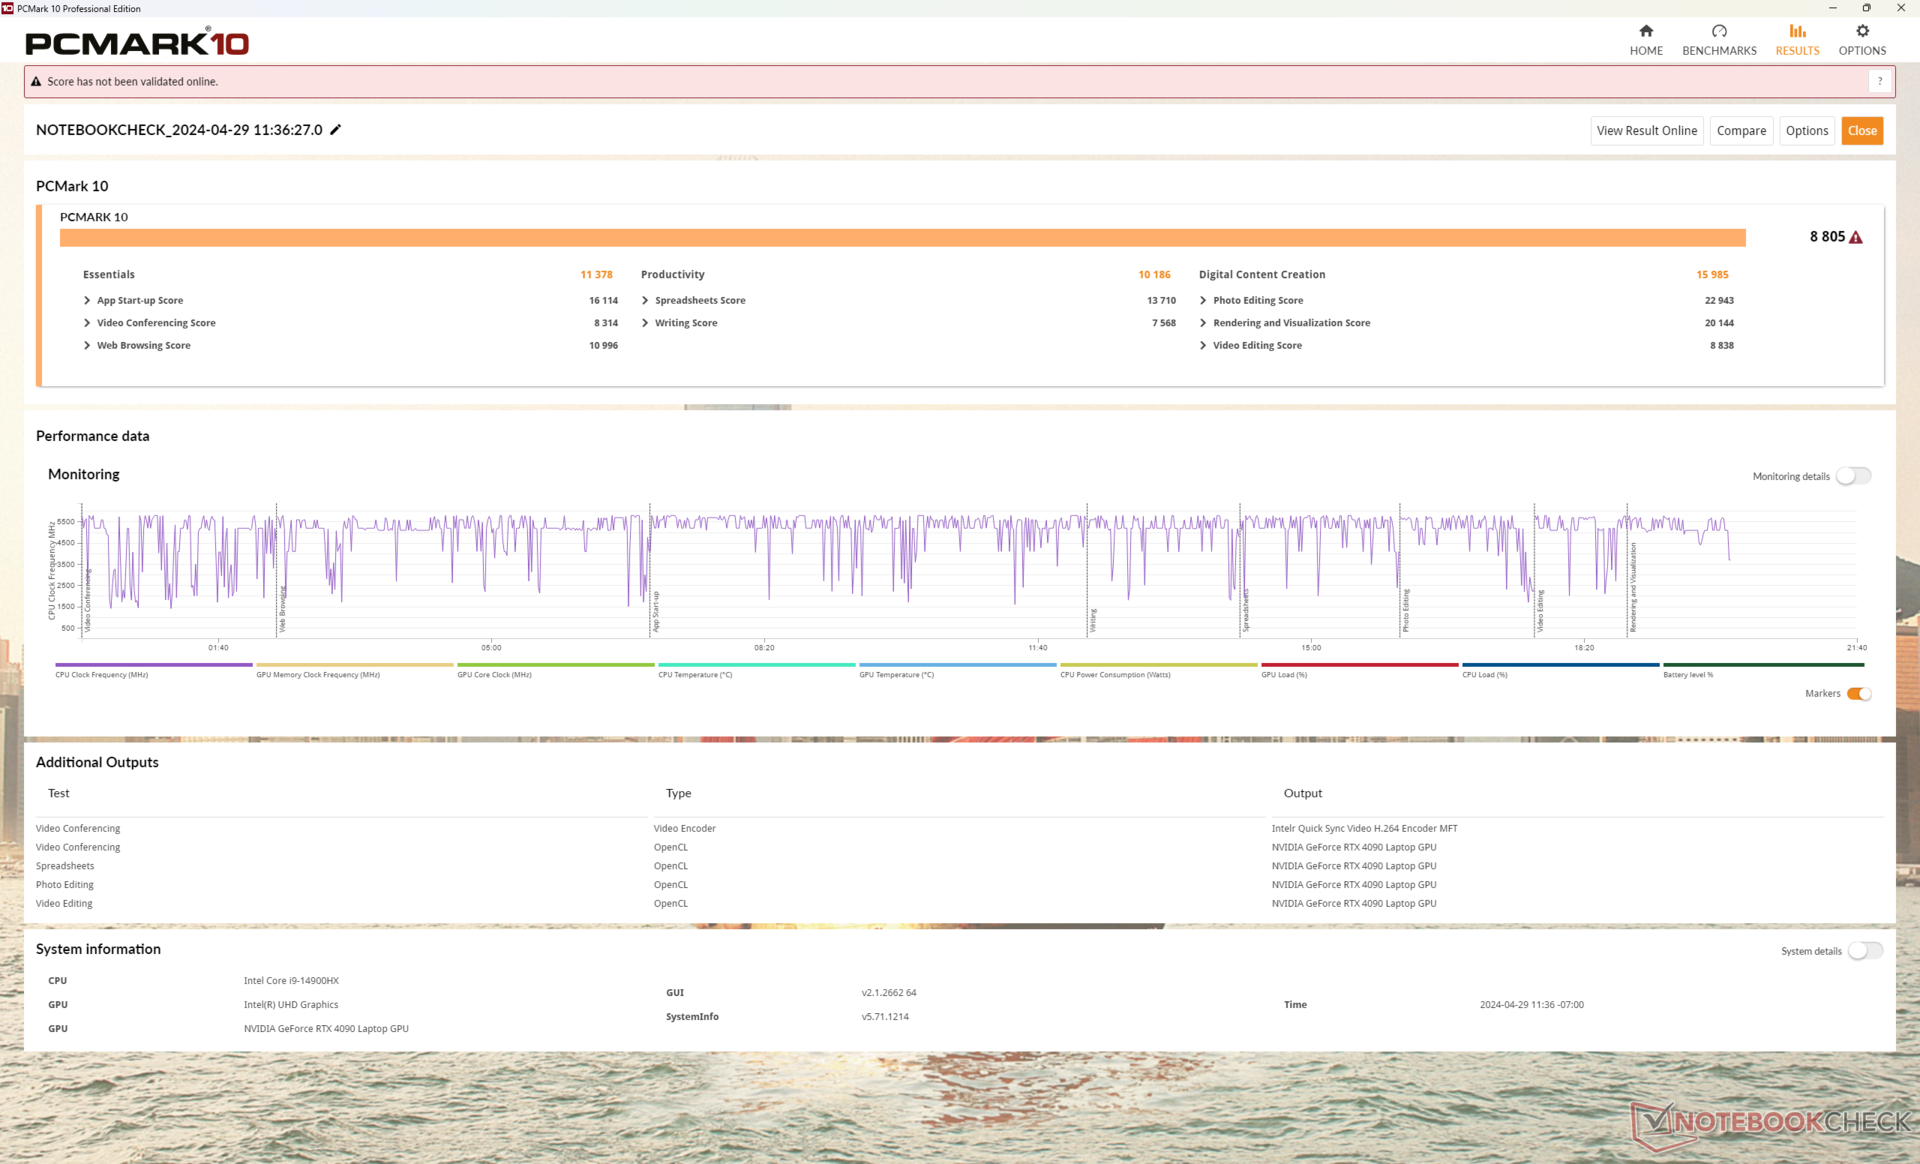
PCMark scores are on par with other gaming laptops with similar Raptor Lake-HX CPUs and GeForce RTX 4090 GPUs including systems with the older Core i9-13900HX. RAM speed has not changed from the 2023 model.
We encountered a couple of bugs when putting the system to Sleep mode. The system would continue to run very warm on Sleep mode when set to dGPU mode. If set to Optimus mode, the system would appear to enter Sleep mode normally. The screen would sometimes freeze for several seconds when waking from Sleep as well.
Meanwhile, the G-Sync issues we experienced on the 2023 model are not present on our 2024 unit.
CrossMark: Overall | Productivity | Creativity | Responsiveness
WebXPRT 3: Overall
WebXPRT 4: Overall
Mozilla Kraken 1.1: Total
| PCMark 10 / Score | |
| Alienware m18 R2 | |
| Asus ROG Strix Scar 17 G733PYV-LL053X | |
| MSI Titan 18 HX A14VIG | |
| Razer Blade 18 2024 RZ09-0509 | |
| Asus ROG Strix Scar 18 G834JYR (2024) | |
| Average Intel Core i9-14900HX, NVIDIA GeForce RTX 4090 Laptop GPU (8230 - 9234, n=13) | |
| Razer Blade 16 2024, RTX 4090 | |
| PCMark 10 / Essentials | |
| MSI Titan 18 HX A14VIG | |
| Asus ROG Strix Scar 17 G733PYV-LL053X | |
| Alienware m18 R2 | |
| Asus ROG Strix Scar 18 G834JYR (2024) | |
| Razer Blade 18 2024 RZ09-0509 | |
| Average Intel Core i9-14900HX, NVIDIA GeForce RTX 4090 Laptop GPU (10778 - 11628, n=13) | |
| Razer Blade 16 2024, RTX 4090 | |
| PCMark 10 / Productivity | |
| Alienware m18 R2 | |
| Razer Blade 16 2024, RTX 4090 | |
| Asus ROG Strix Scar 17 G733PYV-LL053X | |
| Average Intel Core i9-14900HX, NVIDIA GeForce RTX 4090 Laptop GPU (9458 - 11759, n=13) | |
| Asus ROG Strix Scar 18 G834JYR (2024) | |
| MSI Titan 18 HX A14VIG | |
| Razer Blade 18 2024 RZ09-0509 | |
| PCMark 10 / Digital Content Creation | |
| MSI Titan 18 HX A14VIG | |
| Alienware m18 R2 | |
| Asus ROG Strix Scar 17 G733PYV-LL053X | |
| Razer Blade 18 2024 RZ09-0509 | |
| Asus ROG Strix Scar 18 G834JYR (2024) | |
| Average Intel Core i9-14900HX, NVIDIA GeForce RTX 4090 Laptop GPU (13219 - 16462, n=13) | |
| Razer Blade 16 2024, RTX 4090 | |
| CrossMark / Overall | |
| Asus ROG Strix Scar 18 G834JYR (2024) | |
| Razer Blade 16 2024, RTX 4090 | |
| Average Intel Core i9-14900HX, NVIDIA GeForce RTX 4090 Laptop GPU (1877 - 2344, n=10) | |
| Asus ROG Strix Scar 17 G733PYV-LL053X | |
| Alienware m18 R2 | |
| Razer Blade 18 2024 RZ09-0509 | |
| MSI Titan 18 HX A14VIG | |
| CrossMark / Productivity | |
| Asus ROG Strix Scar 18 G834JYR (2024) | |
| Razer Blade 16 2024, RTX 4090 | |
| Average Intel Core i9-14900HX, NVIDIA GeForce RTX 4090 Laptop GPU (1738 - 2162, n=10) | |
| Asus ROG Strix Scar 17 G733PYV-LL053X | |
| Razer Blade 18 2024 RZ09-0509 | |
| Alienware m18 R2 | |
| MSI Titan 18 HX A14VIG | |
| CrossMark / Creativity | |
| Asus ROG Strix Scar 18 G834JYR (2024) | |
| Razer Blade 16 2024, RTX 4090 | |
| Asus ROG Strix Scar 17 G733PYV-LL053X | |
| Alienware m18 R2 | |
| Average Intel Core i9-14900HX, NVIDIA GeForce RTX 4090 Laptop GPU (2195 - 2660, n=10) | |
| Razer Blade 18 2024 RZ09-0509 | |
| MSI Titan 18 HX A14VIG | |
| CrossMark / Responsiveness | |
| Asus ROG Strix Scar 18 G834JYR (2024) | |
| Average Intel Core i9-14900HX, NVIDIA GeForce RTX 4090 Laptop GPU (1478 - 2327, n=10) | |
| Razer Blade 16 2024, RTX 4090 | |
| Alienware m18 R2 | |
| Razer Blade 18 2024 RZ09-0509 | |
| Asus ROG Strix Scar 17 G733PYV-LL053X | |
| MSI Titan 18 HX A14VIG | |
| WebXPRT 3 / Overall | |
| Asus ROG Strix Scar 17 G733PYV-LL053X | |
| Razer Blade 18 2024 RZ09-0509 | |
| Razer Blade 16 2024, RTX 4090 | |
| MSI Titan 18 HX A14VIG | |
| Alienware m18 R2 | |
| Average Intel Core i9-14900HX, NVIDIA GeForce RTX 4090 Laptop GPU (279 - 339, n=10) | |
| Asus ROG Strix Scar 18 G834JYR (2024) | |
| WebXPRT 4 / Overall | |
| Asus ROG Strix Scar 17 G733PYV-LL053X | |
| Alienware m18 R2 | |
| Asus ROG Strix Scar 18 G834JYR (2024) | |
| Average Intel Core i9-14900HX, NVIDIA GeForce RTX 4090 Laptop GPU (246 - 309, n=8) | |
| MSI Titan 18 HX A14VIG | |
| Mozilla Kraken 1.1 / Total | |
| Average Intel Core i9-14900HX, NVIDIA GeForce RTX 4090 Laptop GPU (428 - 535, n=11) | |
| MSI Titan 18 HX A14VIG | |
| Razer Blade 16 2024, RTX 4090 | |
| Asus ROG Strix Scar 18 G834JYR (2024) | |
| Razer Blade 18 2024 RZ09-0509 | |
| Alienware m18 R2 | |
| Asus ROG Strix Scar 17 G733PYV-LL053X | |
* ... smaller is better
| PCMark 10 Score | 8805 points | |
Help | ||
| AIDA64 / Memory Copy | |
| Asus ROG Strix Scar 18 G834JYR (2024) | |
| Alienware m18 R2 | |
| Razer Blade 16 2024, RTX 4090 | |
| Razer Blade 18 RTX 4070 | |
| Razer Blade 18 2024 RZ09-0509 | |
| Average Intel Core i9-14900HX (38028 - 83392, n=36) | |
| MSI Titan 18 HX A14VIG | |
| Asus ROG Strix Scar 17 G733PYV-LL053X | |
| AIDA64 / Memory Read | |
| Asus ROG Strix Scar 18 G834JYR (2024) | |
| Razer Blade 16 2024, RTX 4090 | |
| Razer Blade 18 RTX 4070 | |
| Alienware m18 R2 | |
| Razer Blade 18 2024 RZ09-0509 | |
| Average Intel Core i9-14900HX (43306 - 87568, n=36) | |
| Asus ROG Strix Scar 17 G733PYV-LL053X | |
| MSI Titan 18 HX A14VIG | |
| AIDA64 / Memory Write | |
| Asus ROG Strix Scar 18 G834JYR (2024) | |
| Alienware m18 R2 | |
| Razer Blade 18 RTX 4070 | |
| Razer Blade 16 2024, RTX 4090 | |
| Average Intel Core i9-14900HX (37146 - 80589, n=36) | |
| Razer Blade 18 2024 RZ09-0509 | |
| Asus ROG Strix Scar 17 G733PYV-LL053X | |
| MSI Titan 18 HX A14VIG | |
| AIDA64 / Memory Latency | |
| MSI Titan 18 HX A14VIG | |
| Asus ROG Strix Scar 17 G733PYV-LL053X | |
| Razer Blade 18 2024 RZ09-0509 | |
| Alienware m18 R2 | |
| Average Intel Core i9-14900HX (76.1 - 105, n=36) | |
| Razer Blade 18 RTX 4070 | |
| Razer Blade 16 2024, RTX 4090 | |
| Asus ROG Strix Scar 18 G834JYR (2024) | |
* ... smaller is better
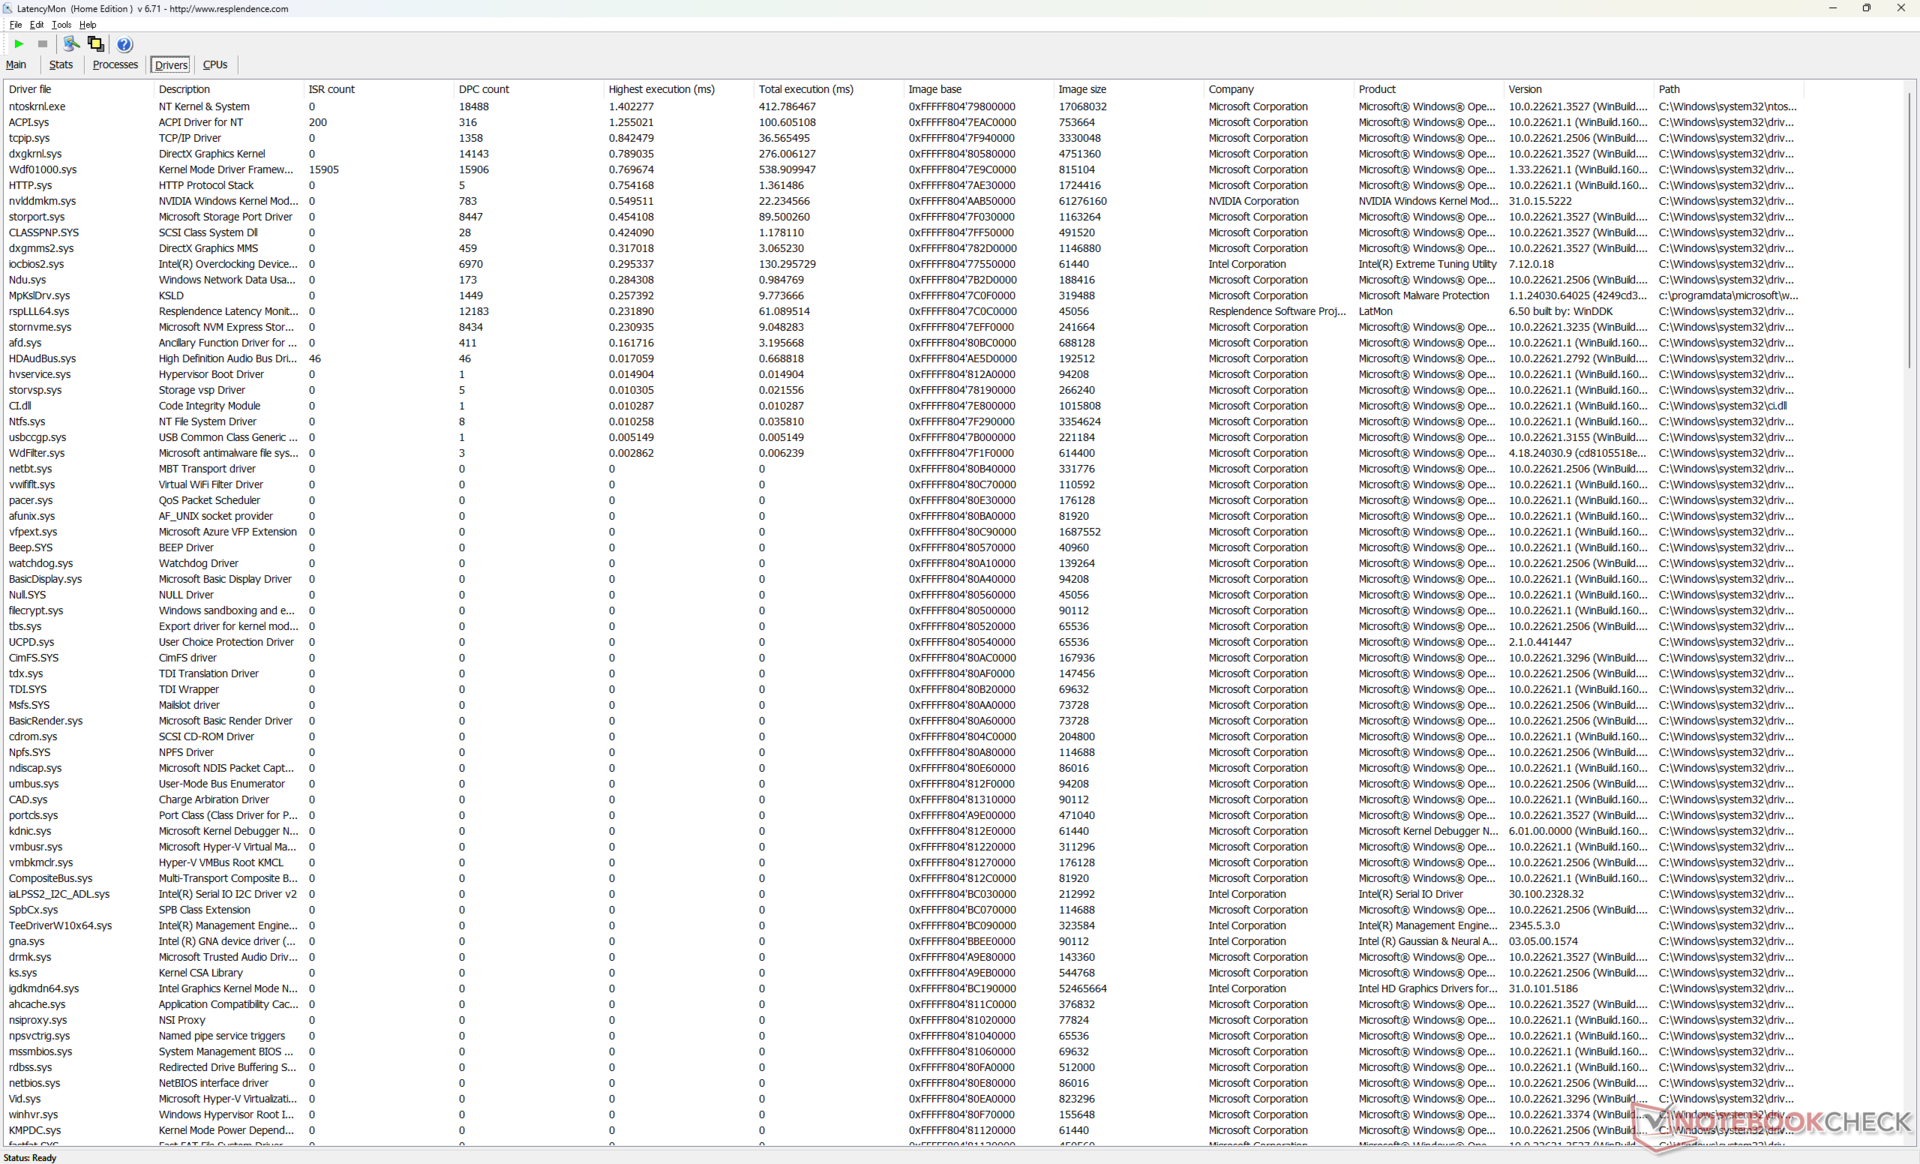
DPC Latency
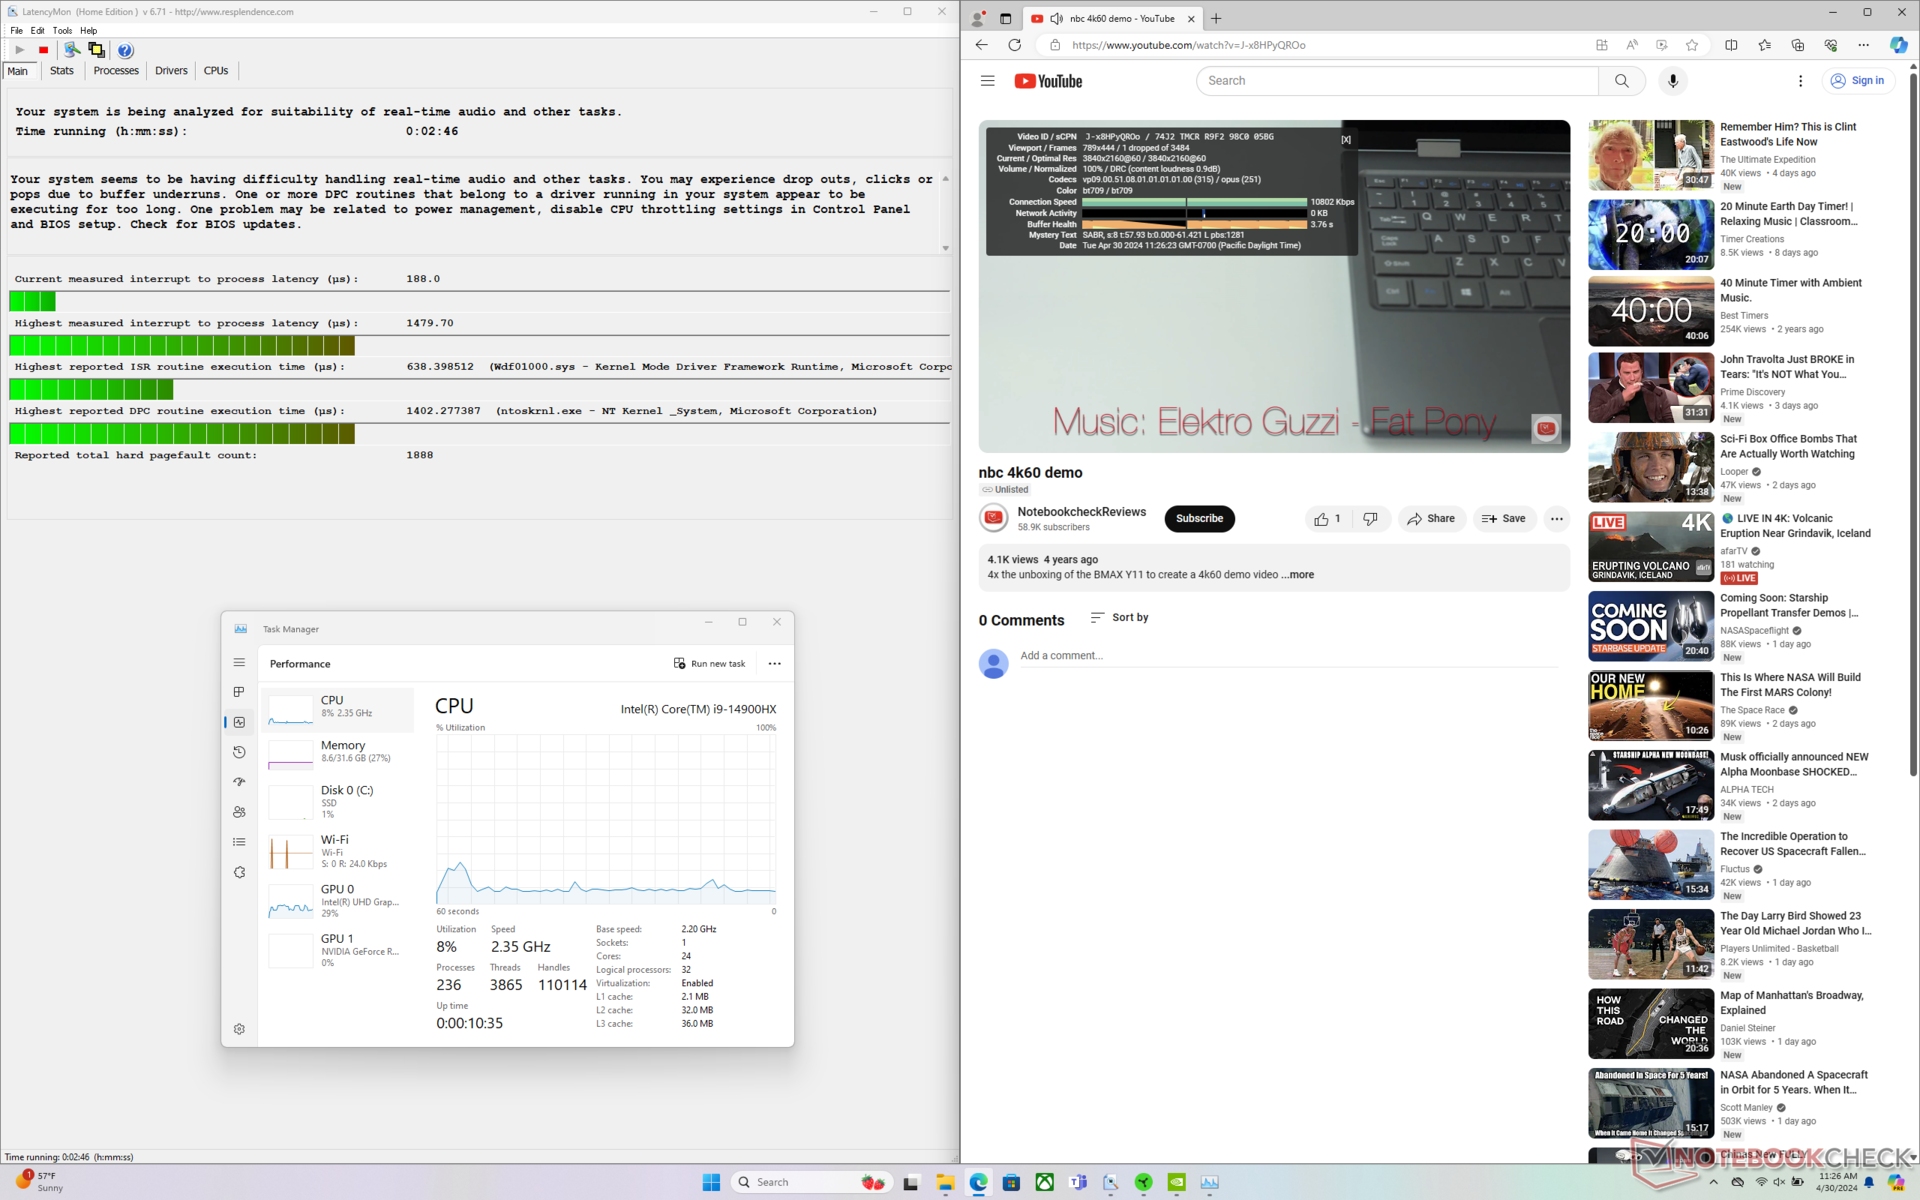
LatencyMon reveals only minor DPC issues when opening multiple browser tabs of our homepage. 4K60 video playback is also perfect with no dropped frames recorded save for the single frame when taking the screenshot.
| DPC Latencies / LatencyMon - interrupt to process latency (max), Web, Youtube, Prime95 | |
| Alienware m18 R2 | |
| MSI Titan 18 HX A14VIG | |
| Razer Blade 18 2024 RZ09-0509 | |
| Razer Blade 16 2024, RTX 4090 | |
| Asus ROG Strix Scar 18 G834JYR (2024) | |
| Asus ROG Strix Scar 17 G733PYV-LL053X | |
* ... smaller is better
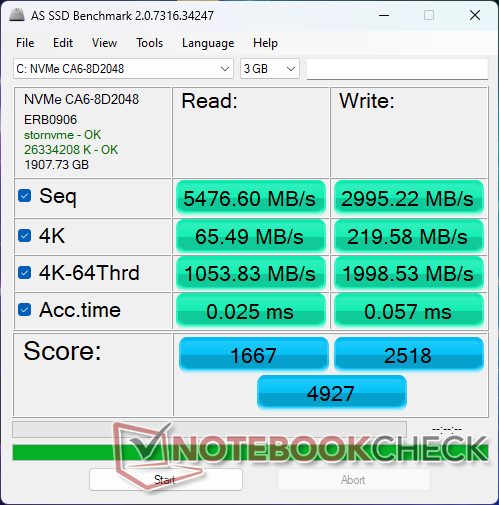
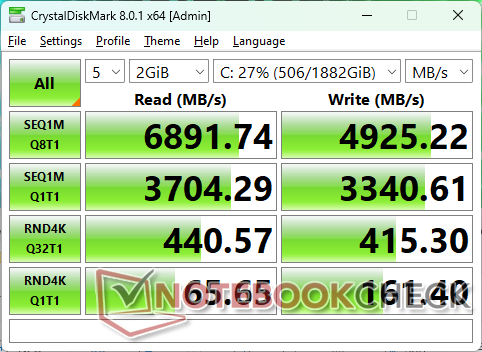
Storage Devices
Both our 2023 and 2024 Blade 18 units come with Micron CA6 NVMe SSDs whereas most other Blade models ship with Samsung drives instead. Read and write rates of smaller 4K blocks can be on the slow side, but it otherwise exhibits no performance throttling issues.
PCIe5 SSD options are not available likely due to costs and limited supply.

* ... smaller is better
Disk Throttling: DiskSpd Read Loop, Queue Depth 8
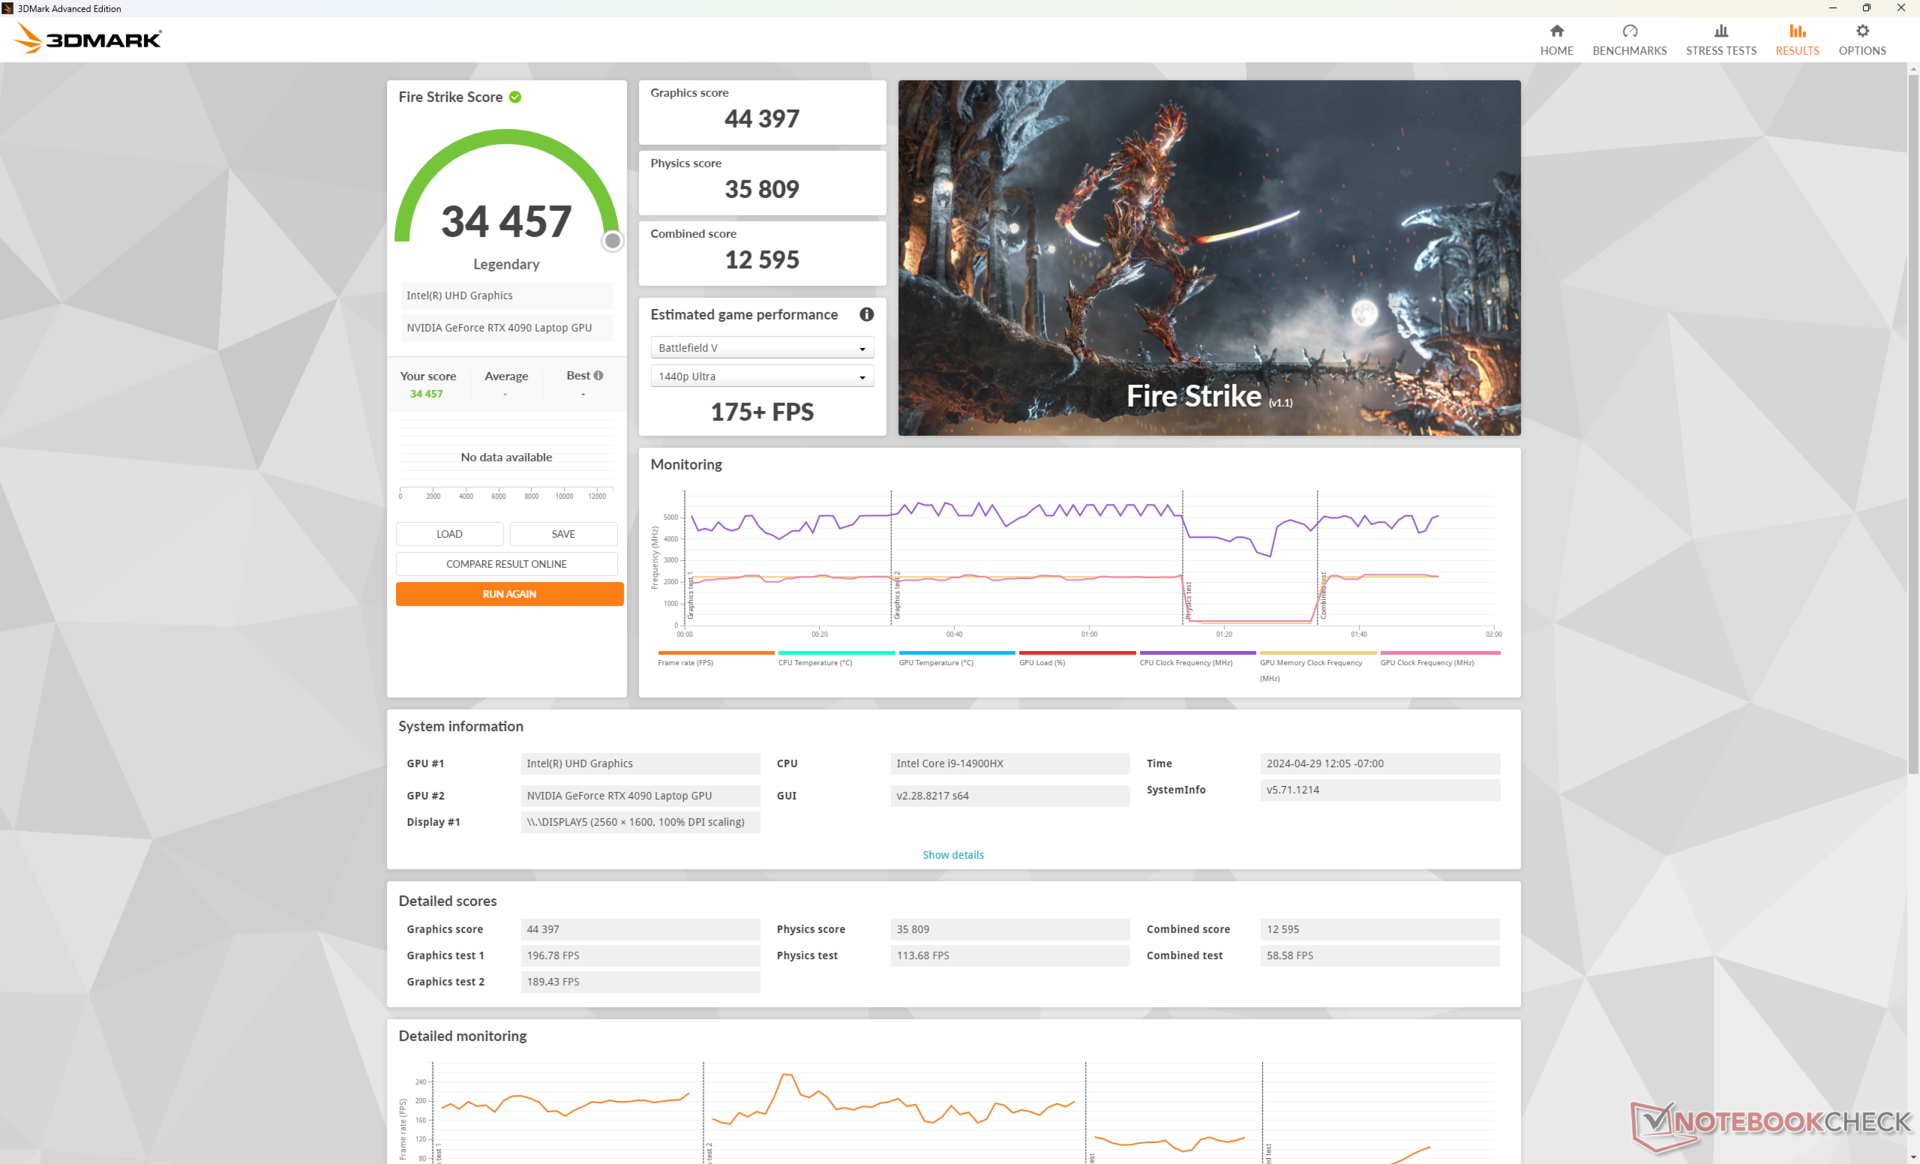
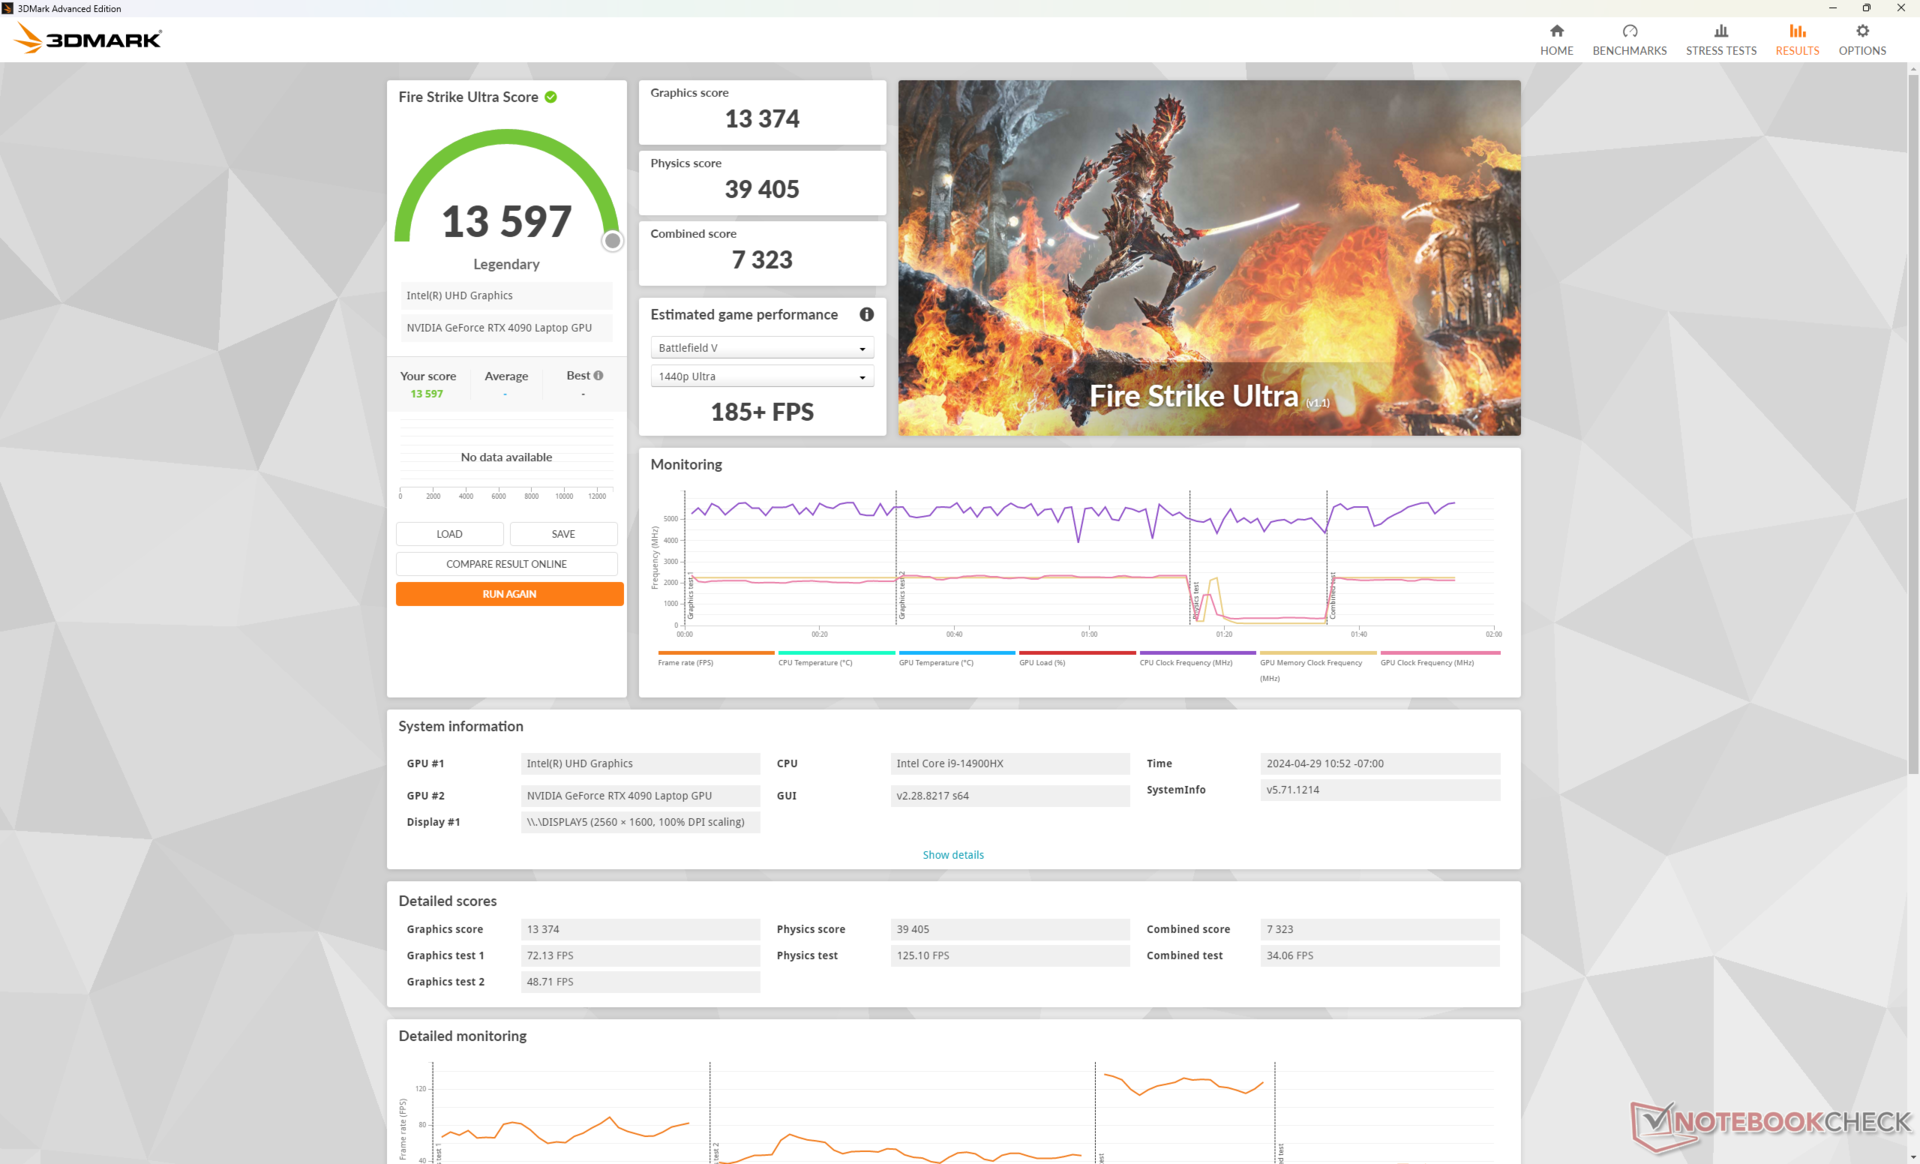
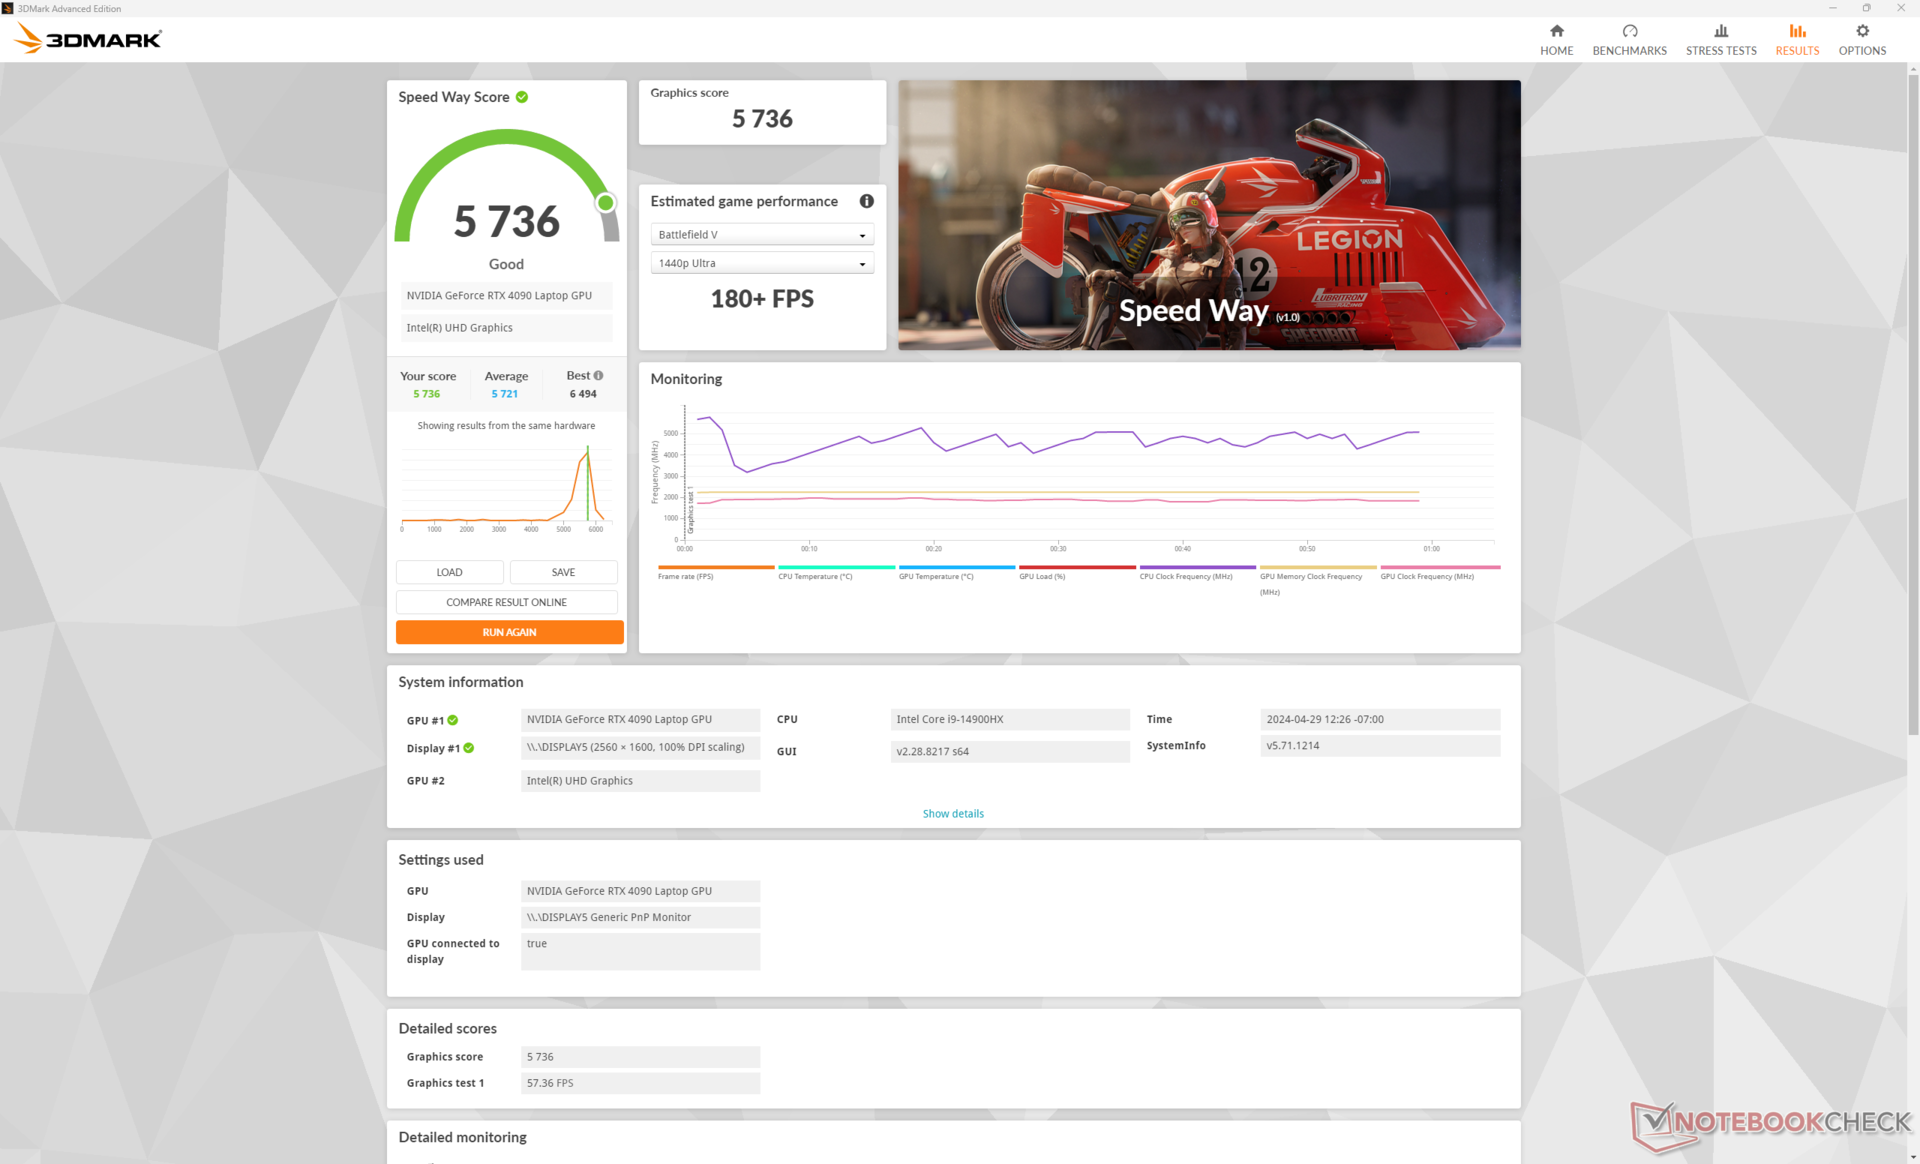
Gaming Performance — RTX 4090 For The Second Year In A Row
Raw graphics performance from the mobile GeForce RTX 4090 is essentially identical to the Blade 16 which also features 175 W TGP graphics. Thus, the Blade 18 will not run games noticeably faster than its smaller counterpart. Downgrading to the RTX 4080 or 4070 configuration is expected to impact performance by about 10 percent and 35 to 40 percent, respectively. The MSI Titan 18 HX can run the same GPU slightly faster than the Razer, but it is also significantly larger and heavier.
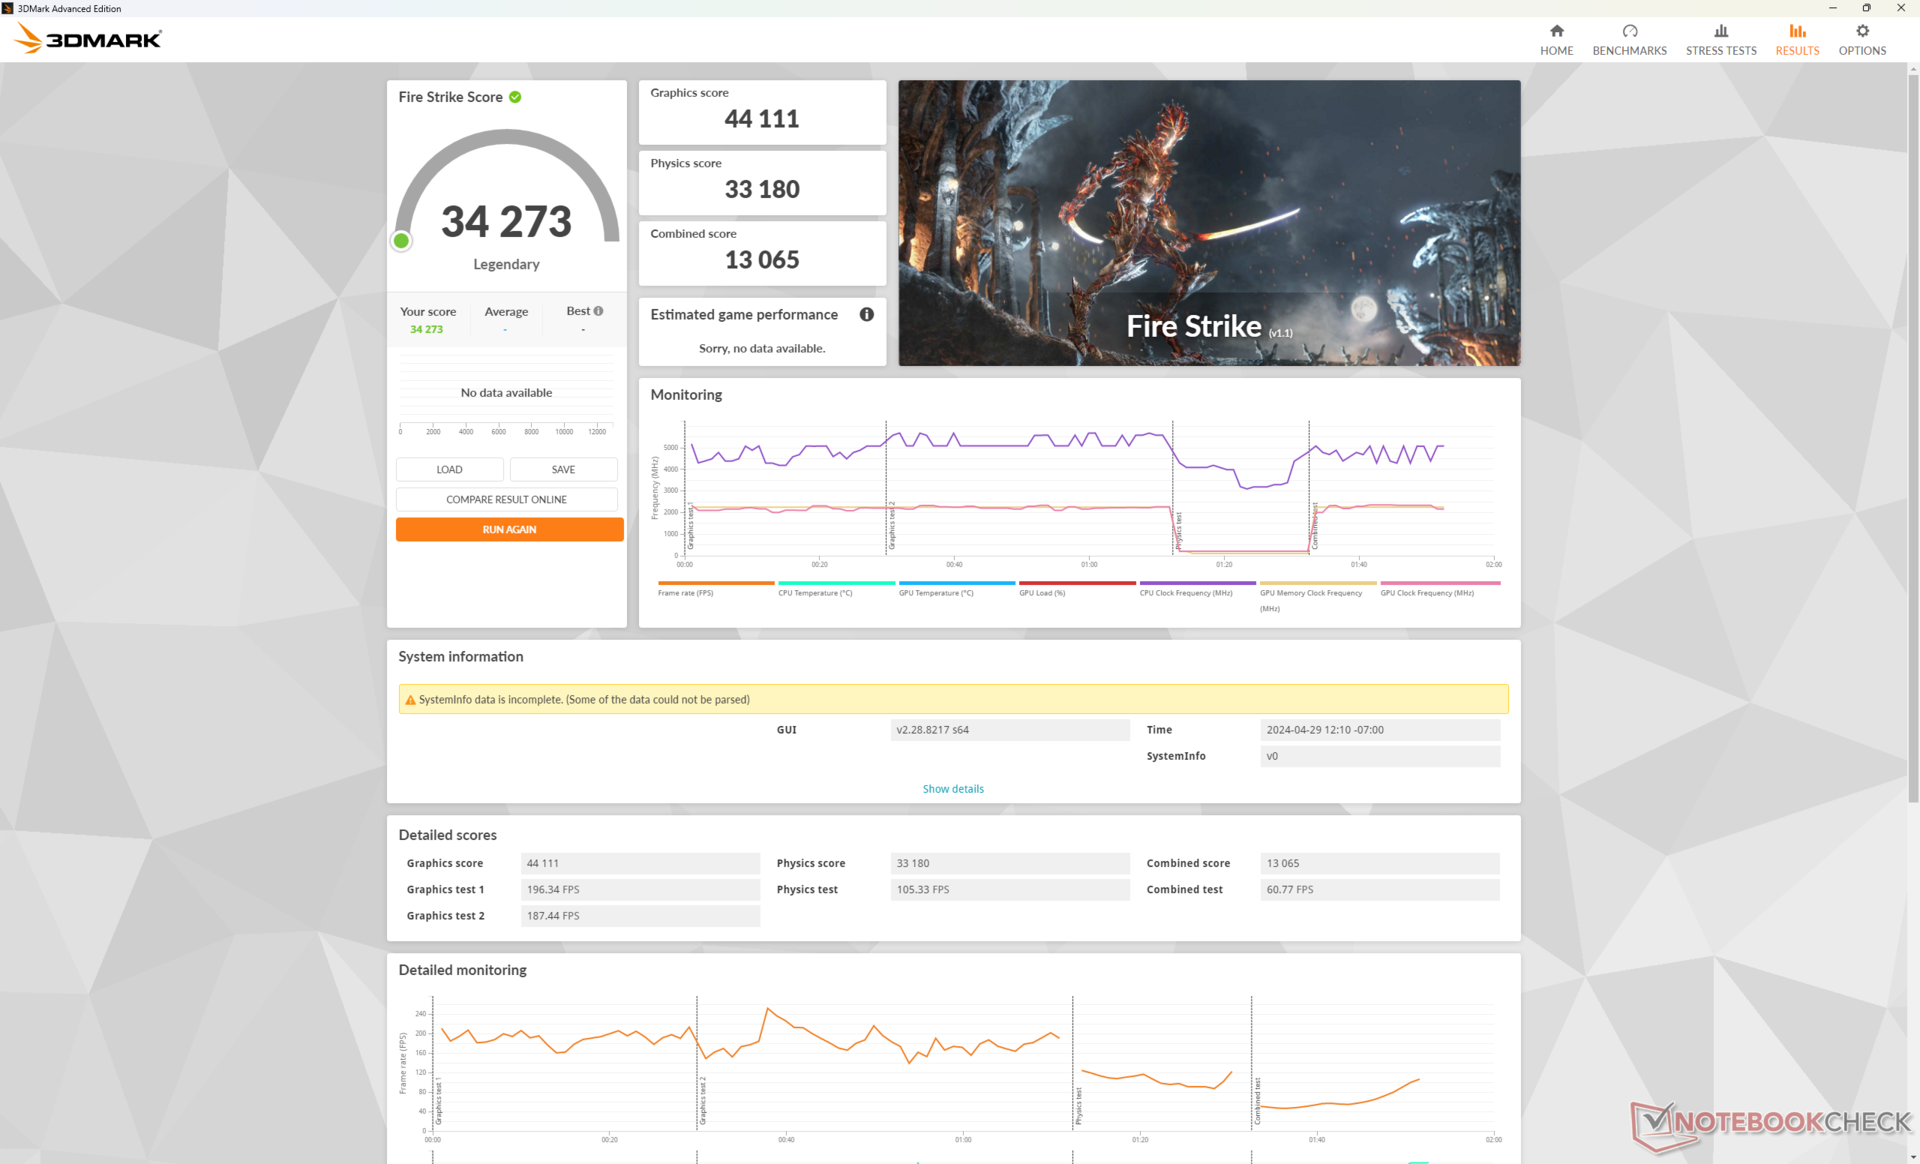
Keep in mind that Max Fan mode has little to no impact on system performance as shown by our Fire Strike results table below. Enabling Max Fan mode to get the most out of the GPU is therefore not necessary. Even Turbo mode appears to have no significant impact on performance when gaming.
| Power Profile | Graphics Score | Physics Score | Combined Score |
| Custom Profile w/ Max Fan On | 44702 | 38887 | 12094 |
| Custom Profile w/ Max Fan Off | 44397 (-1%) | 35809 (-8%) | 12595 (-0%) |
| Turbo Mode | 44111 (-1%) | 33180 (-15%) | 13065 (-0%) |
| Balanced Mode | 36832 (-18%) | 25159 (-35%) | 6109 (-49%) |
| Battery Power | 18581 (-58%) | 23066 (-41%) | 5093 (-58%) |
Advanced Optimus is supported for switching between dGPU and Optimus modes. However, there is no iGPU only mode for additional power savings unlike on recent Alienware laptops.
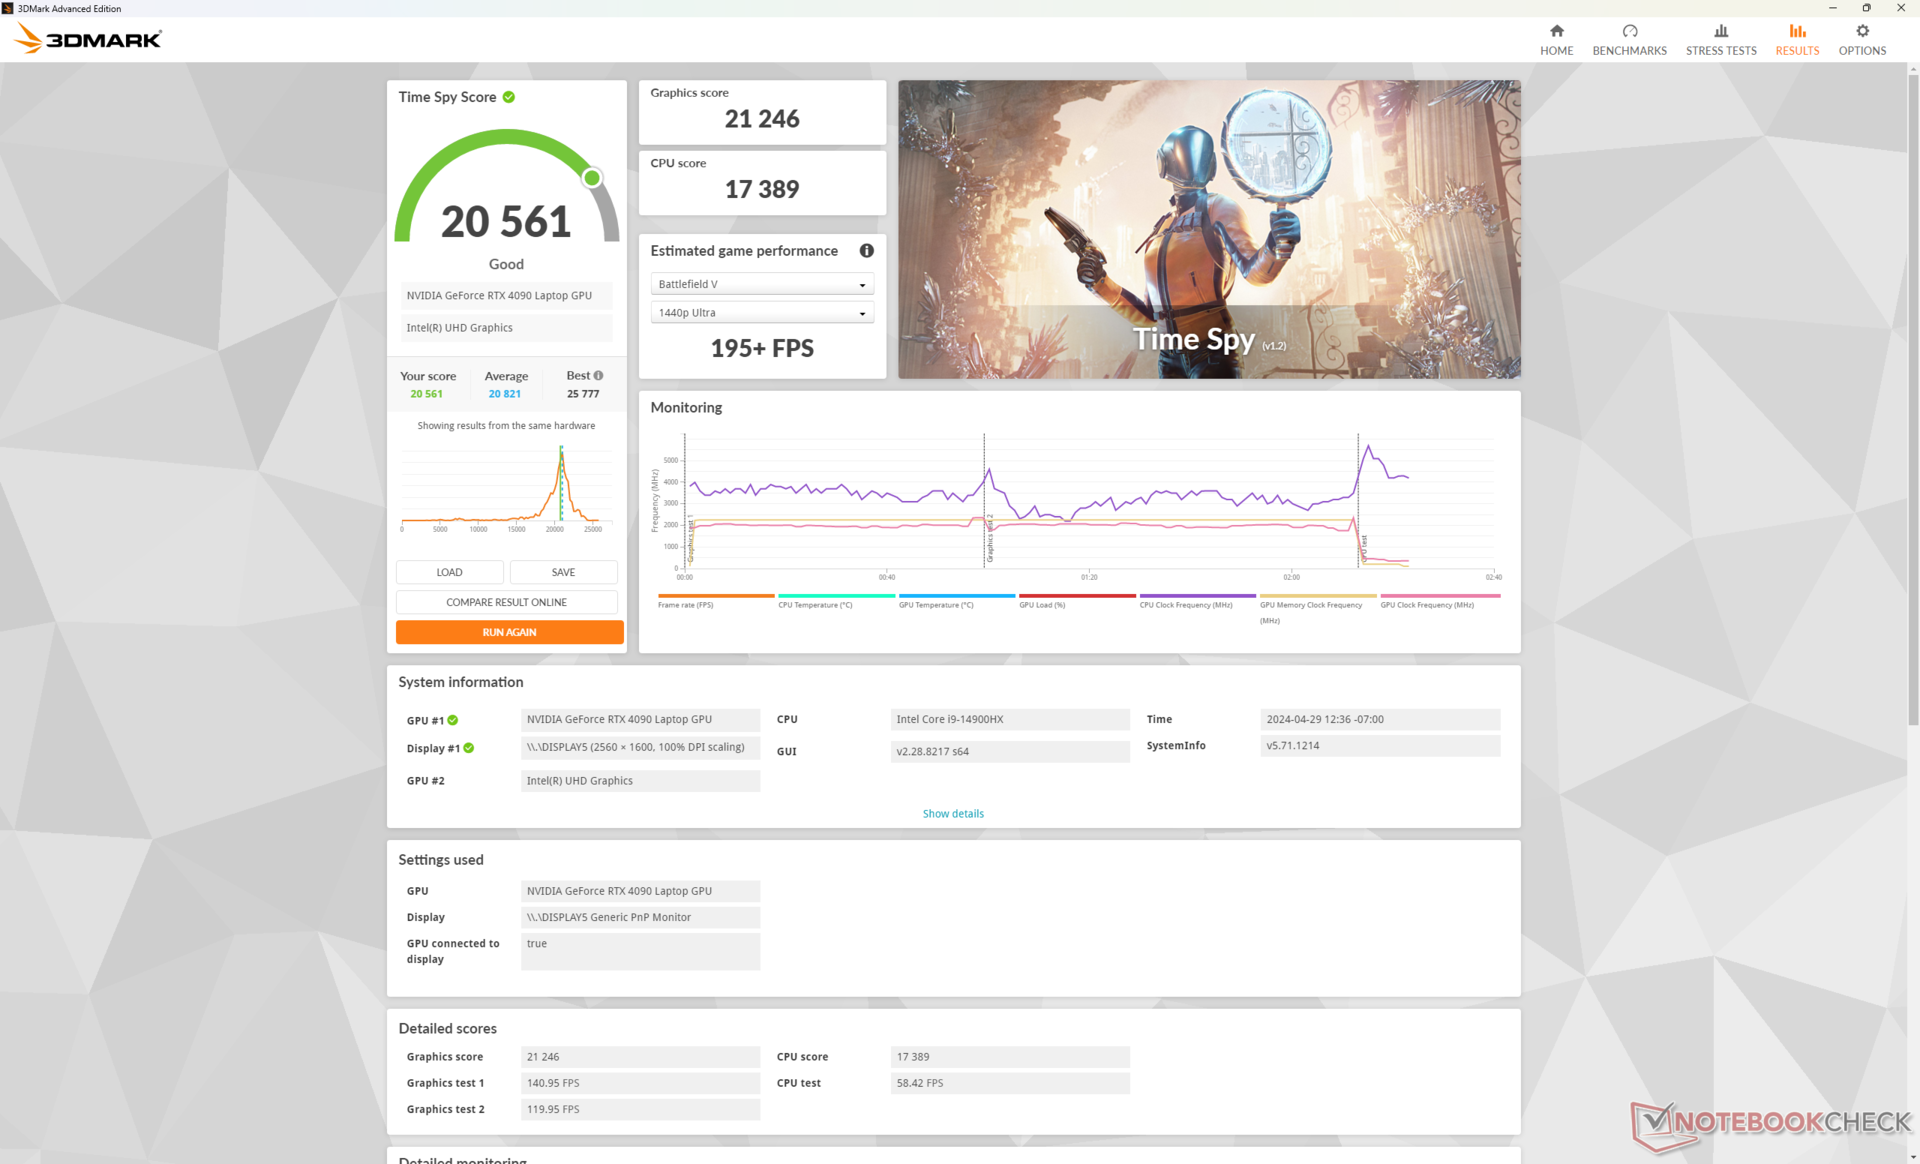
| 3DMark 11 Performance | 45938 points | |
| 3DMark Fire Strike Score | 34597 points | |
| 3DMark Time Spy Score | 20561 points | |
Help | ||
* ... smaller is better
| The Witcher 3 - 1920x1080 Ultra Graphics & Postprocessing (HBAO+) | |
| MSI Titan 18 HX A14VIG | |
| Asus ROG Strix Scar 17 G733PYV-LL053X | |
| Alienware m18 R2 | |
| Razer Blade 16 2024, RTX 4090 | |
| Razer Blade 18 2024 RZ09-0509 | |
| Average of class Gaming (104.7 - 240, n=6, last 2 years) | |
| Asus ROG Strix Scar 18 G834JYR (2024) | |
Witcher 3 FPS Chart
| low | med. | high | ultra | QHD | 4K DLSS | 4K | |
|---|---|---|---|---|---|---|---|
| GTA V (2015) | 129.8 | 126.6 | 165.4 | ||||
| The Witcher 3 (2015) | 193 | 154.6 | 149.8 | ||||
| Dota 2 Reborn (2015) | 213 | 191.8 | 180.5 | 164 | 147 | ||
| Final Fantasy XV Benchmark (2018) | 156.9 | 139.1 | 87.3 | ||||
| X-Plane 11.11 (2018) | 183.8 | 158.2 | 127.2 | 107.2 | |||
| Strange Brigade (2018) | 325 | 268 | 149.2 | ||||
| F1 23 (2023) | 110.9 | 73.1 | 37.1 | ||||
| Baldur's Gate 3 (2023) | 160.5 | 119.2 | 94.4 | 70.5 | |||
| Cyberpunk 2077 (2023) | 101.25 | 83.38 | 37.38 | ||||
| Assassin's Creed Mirage (2023) | 124 | 114 | 98 | 73 | |||
| Alan Wake 2 (2023) | 114.1 | 79.4 | 60.8 | 42.3 | |||
| Call of Duty Modern Warfare 3 2023 (2023) | 174 | 132 | 92 | 87 |
Emissions — Loud Only When Necessary
System Noise
Fan noise is generally louder than what we recorded on our 2023 Blade 18 largely due to our GPU configuration differences. The fans would pulse more frequently between 24 and 29 dB(A) even when set to Balanced and Optimus mode. This is loud enough to be noticeable but never bothersome.
Perhaps most importantly for gamers, fan noise can be very different depending on the power profile setting. When running Witcher 3 with Max Fan mode active, for example, fan noise would be as high as 61 dB(A) compared to just 54 dB(A) with Max Fan mode off. Since there are no performance differences between Max Fan on and off under stock settings, we recommend gaming with Max Fan off to keep noise levels down. Fan noise on Turbo mode would be identical to Max Fan off which aligns with our performance results above.
When compared to competitors, the Blade 18 is comparable if not slightly louder than the Alienware m18 R2 or ROG Strix Scar 18 running on the same GeForce RTX 4090 GPU. Headphones are recommended when fan levels reach >50 dB(A) especially for games where footsteps and other small audio cues are vital for gameplay.
Noise level
| Idle |
| 23.9 / 28.2 / 29 dB(A) |
| Load |
| 36.8 / 61.1 dB(A) |
 | ||
30 dB silent 40 dB(A) audible 50 dB(A) loud |
||
min: | ||
| Razer Blade 18 2024 RZ09-0509 GeForce RTX 4090 Laptop GPU, i9-14900HX | Razer Blade 18 RTX 4070 GeForce RTX 4070 Laptop GPU, i9-13950HX, SSSTC CA6-8D1024 | Alienware m18 R2 GeForce RTX 4090 Laptop GPU, i9-14900HX, SK Hynix PC811 HFS002TEM9X152N | MSI Titan 18 HX A14VIG GeForce RTX 4090 Laptop GPU, i9-14900HX, 2x Samsung PM9A1a MZVL22T0HDLB (RAID 0) | Asus ROG Strix Scar 18 G834JYR (2024) GeForce RTX 4090 Laptop GPU, i9-14900HX, Samsung PM9A1a MZVL22T0HDLB | Razer Blade 16 2024, RTX 4090 GeForce RTX 4090 Laptop GPU, i9-14900HX, Samsung PM9A1 MZVL22T0HBLB | |
|---|---|---|---|---|---|---|
| Noise | 7% | 3% | 1% | -5% | 6% | |
| off / environment * (dB) | 23.4 | 23.5 -0% | 23.6 -1% | 22.8 3% | 24 -3% | 23 2% |
| Idle Minimum * (dB) | 23.9 | 23.8 -0% | 23.8 -0% | 23.8 -0% | 27 -13% | 23 4% |
| Idle Average * (dB) | 28.2 | 23.8 16% | 26.1 7% | 23.8 16% | 28 1% | 23 18% |
| Idle Maximum * (dB) | 29 | 26.8 8% | 31.5 -9% | 28 3% | 32 -10% | 27.66 5% |
| Load Average * (dB) | 36.8 | 37.3 -1% | 31.5 14% | 38 -3% | 50 -36% | 43.76 -19% |
| Witcher 3 ultra * (dB) | 54.1 | 48 11% | 52.1 4% | 57.3 -6% | 50 8% | 46.81 13% |
| Load Maximum * (dB) | 61.1 | 53.5 12% | 56.6 7% | 62.8 -3% | 52 15% | 50.37 18% |
* ... smaller is better
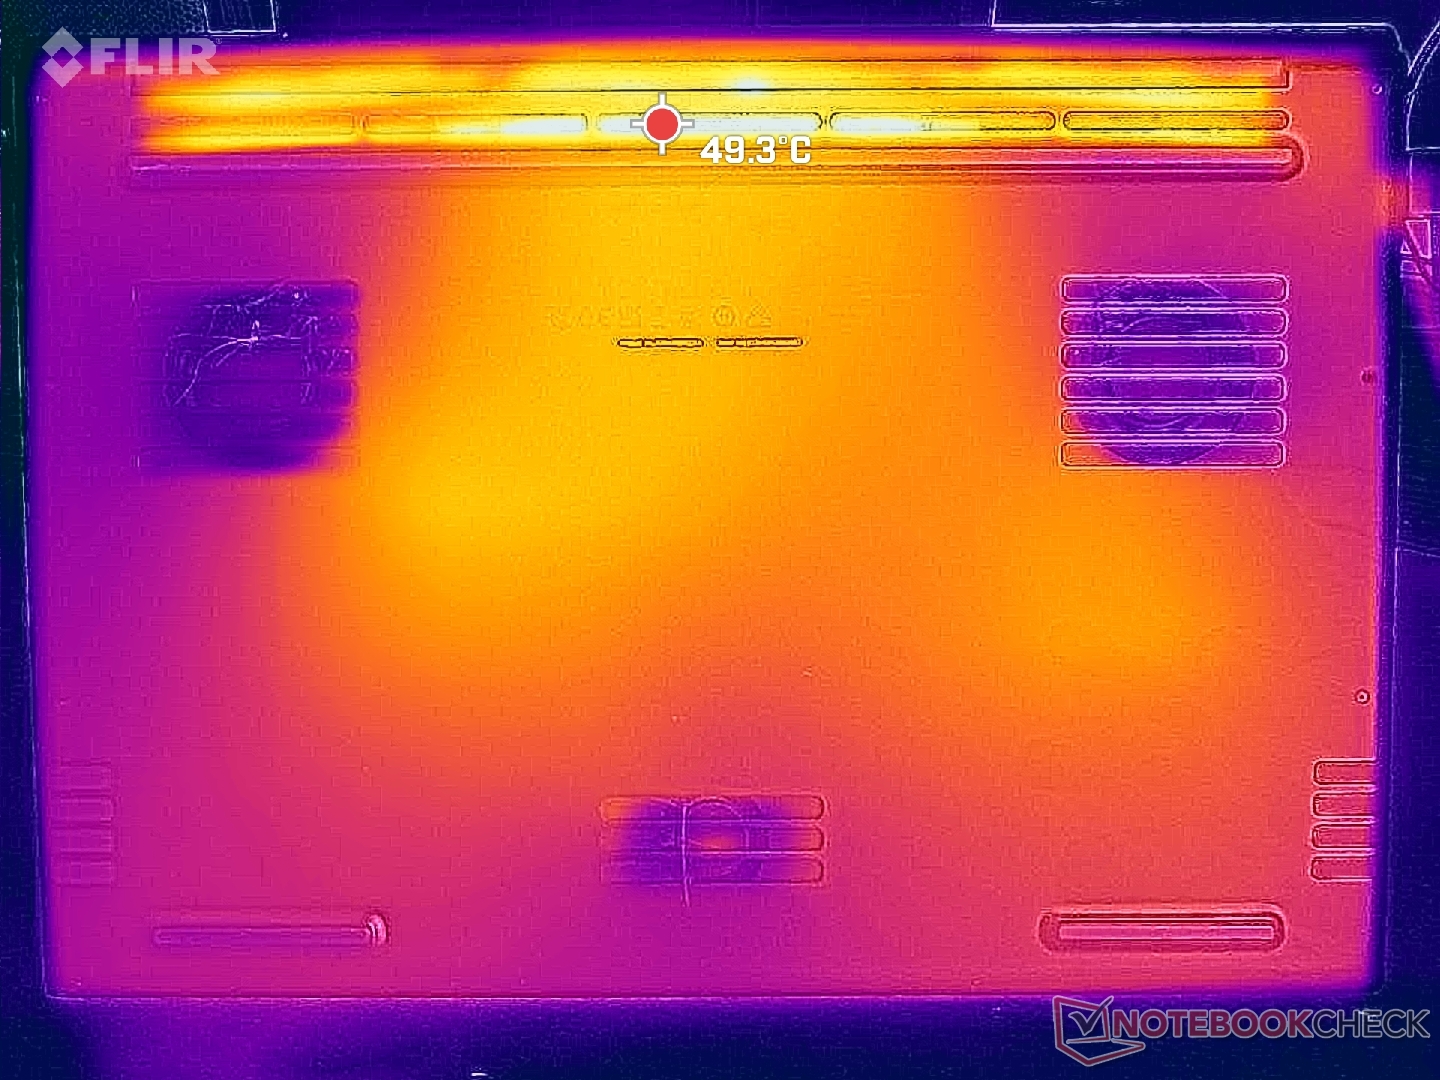
Temperature
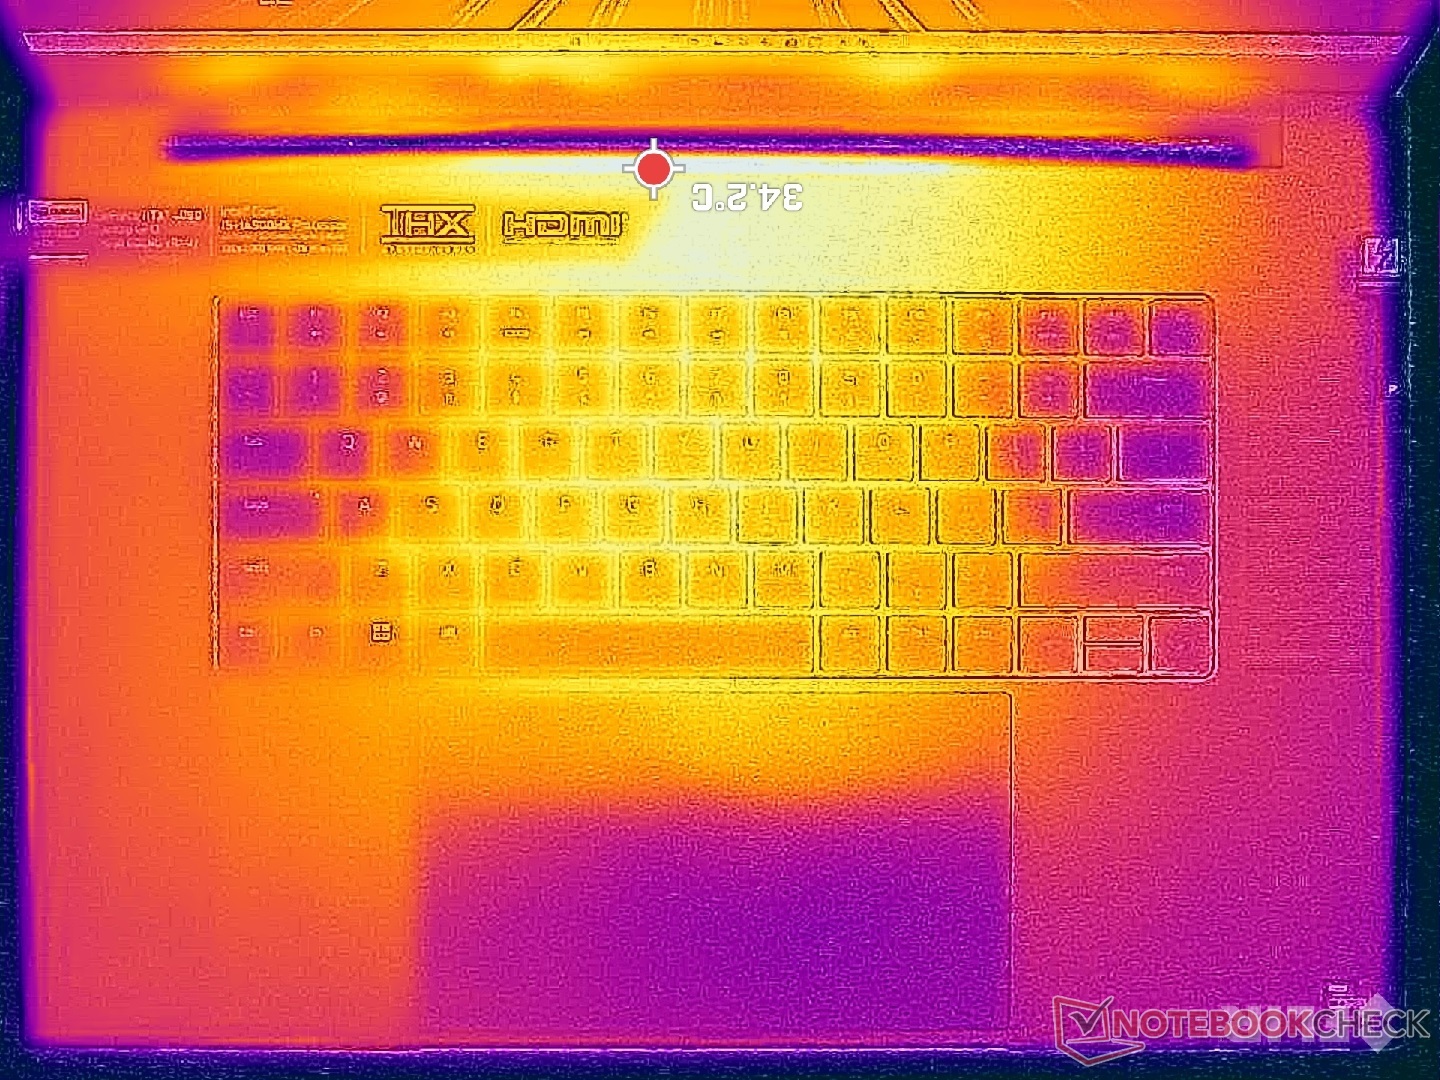
Surface temperatures when gaming are noticeably warmer than what we recorded on our 2023 unit, but this is again mostly due to GPU differences in our configurations. Razer has made no changes to the underlying cooling solution.
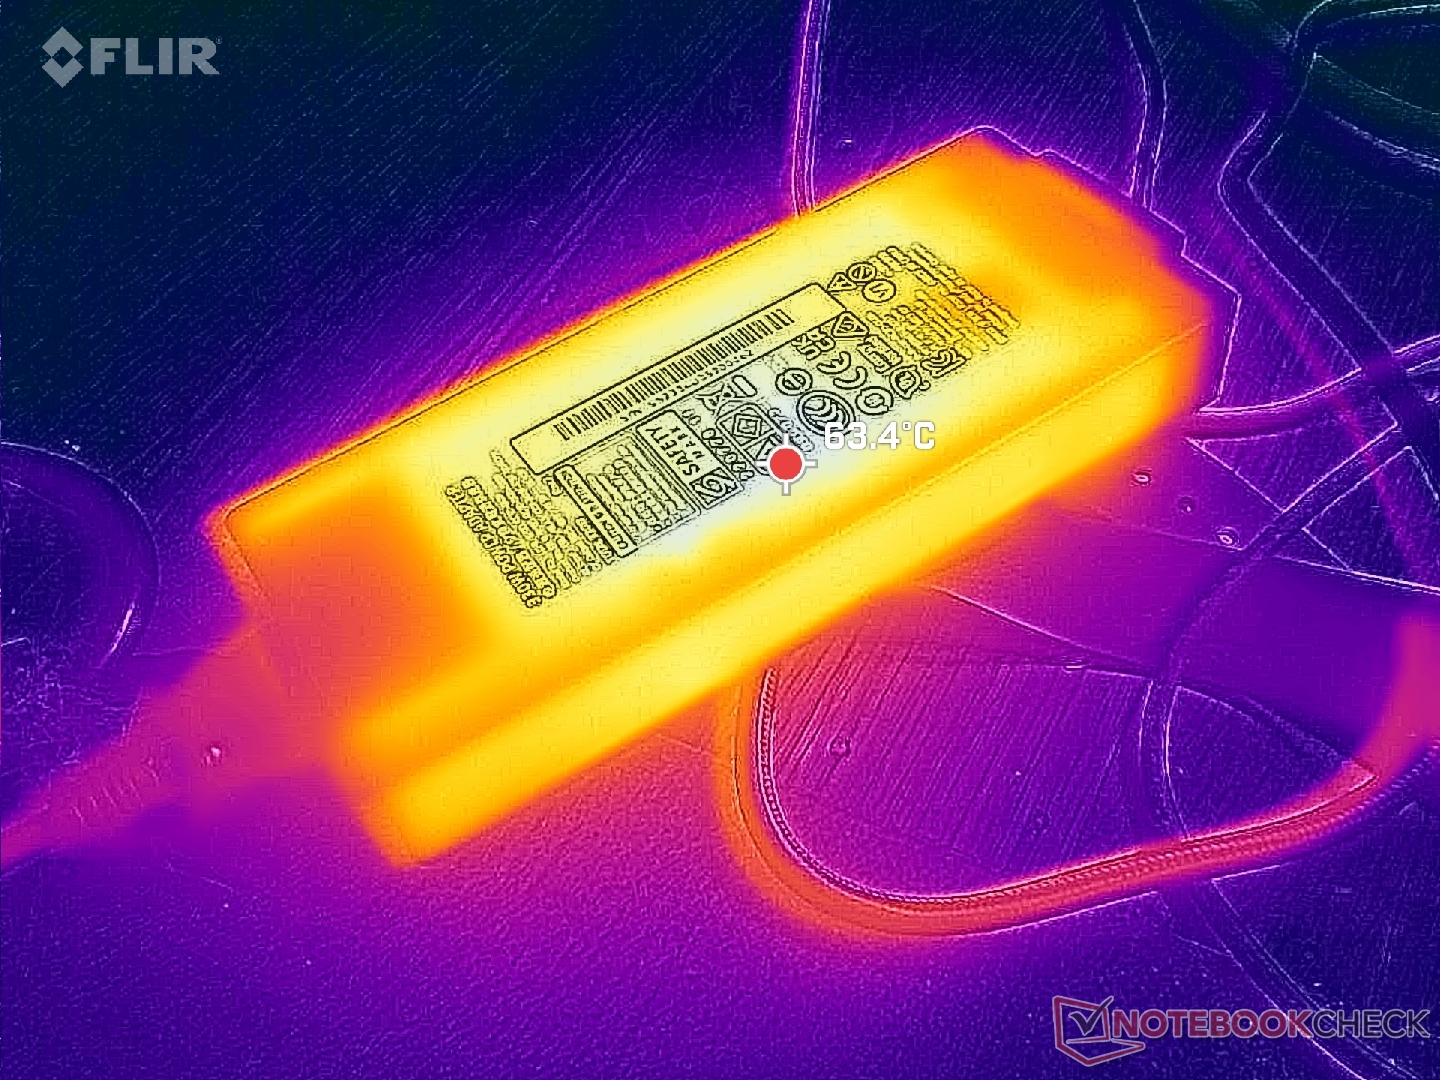
Razer power bricks continue to be some of the smallest and yet warmest in the market. For example, our adapter would reach over 63 C when gaming compared to just 54 C on the Alienware m18 R2 adapter. Warmer temperatures are by design when it comes to GaN chargers.
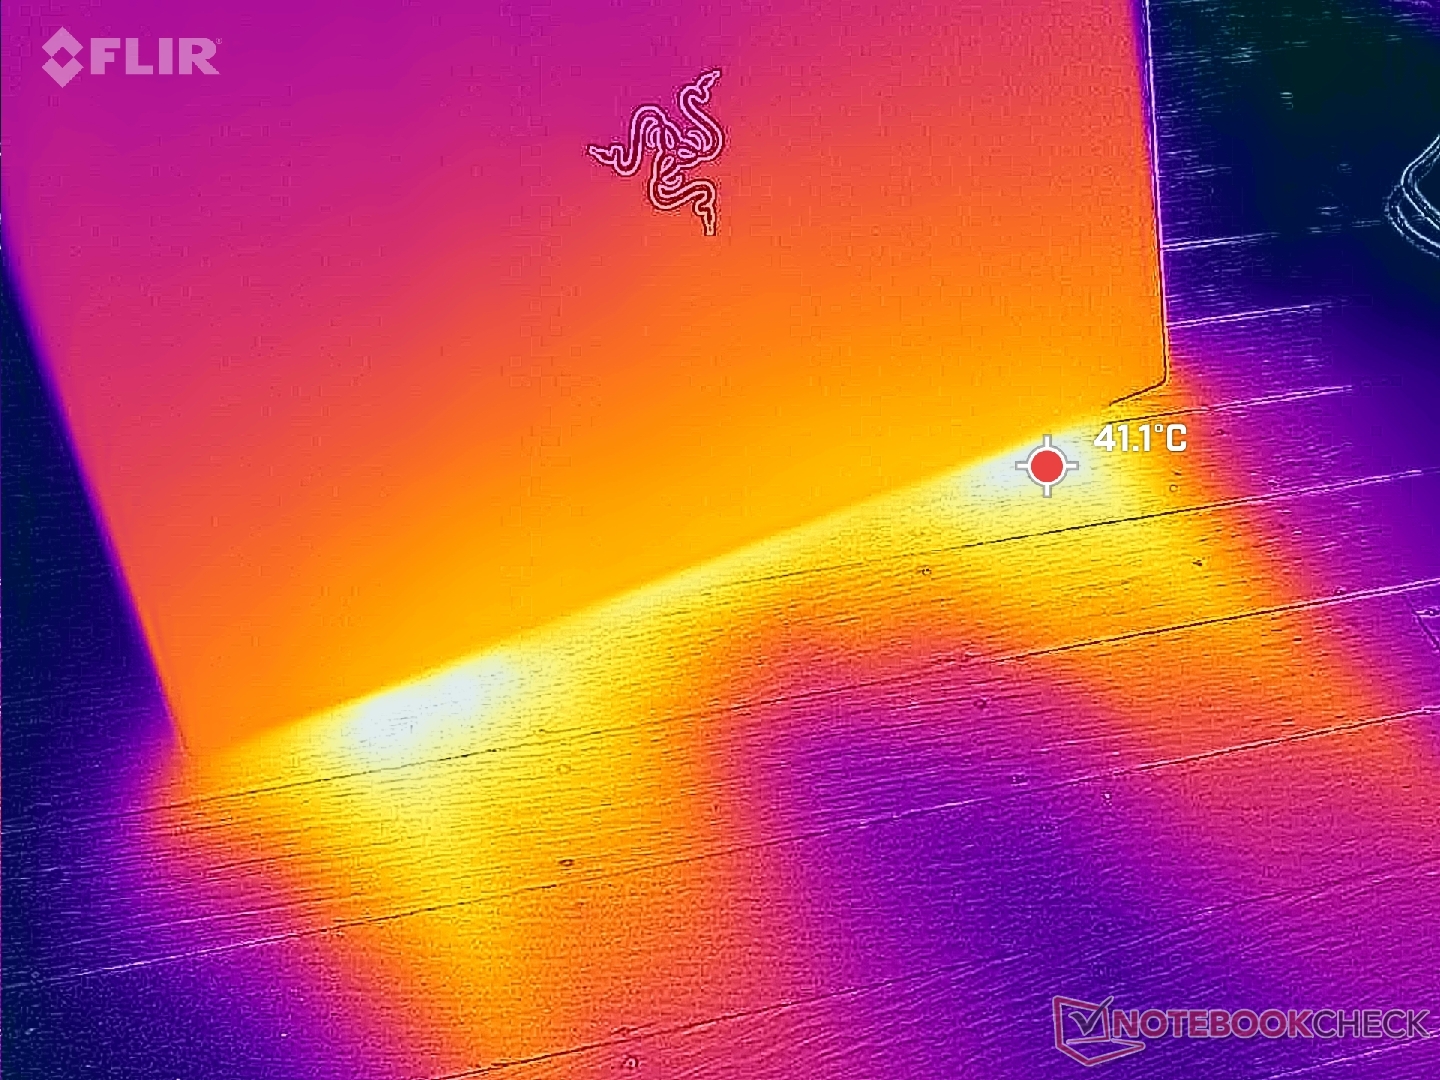
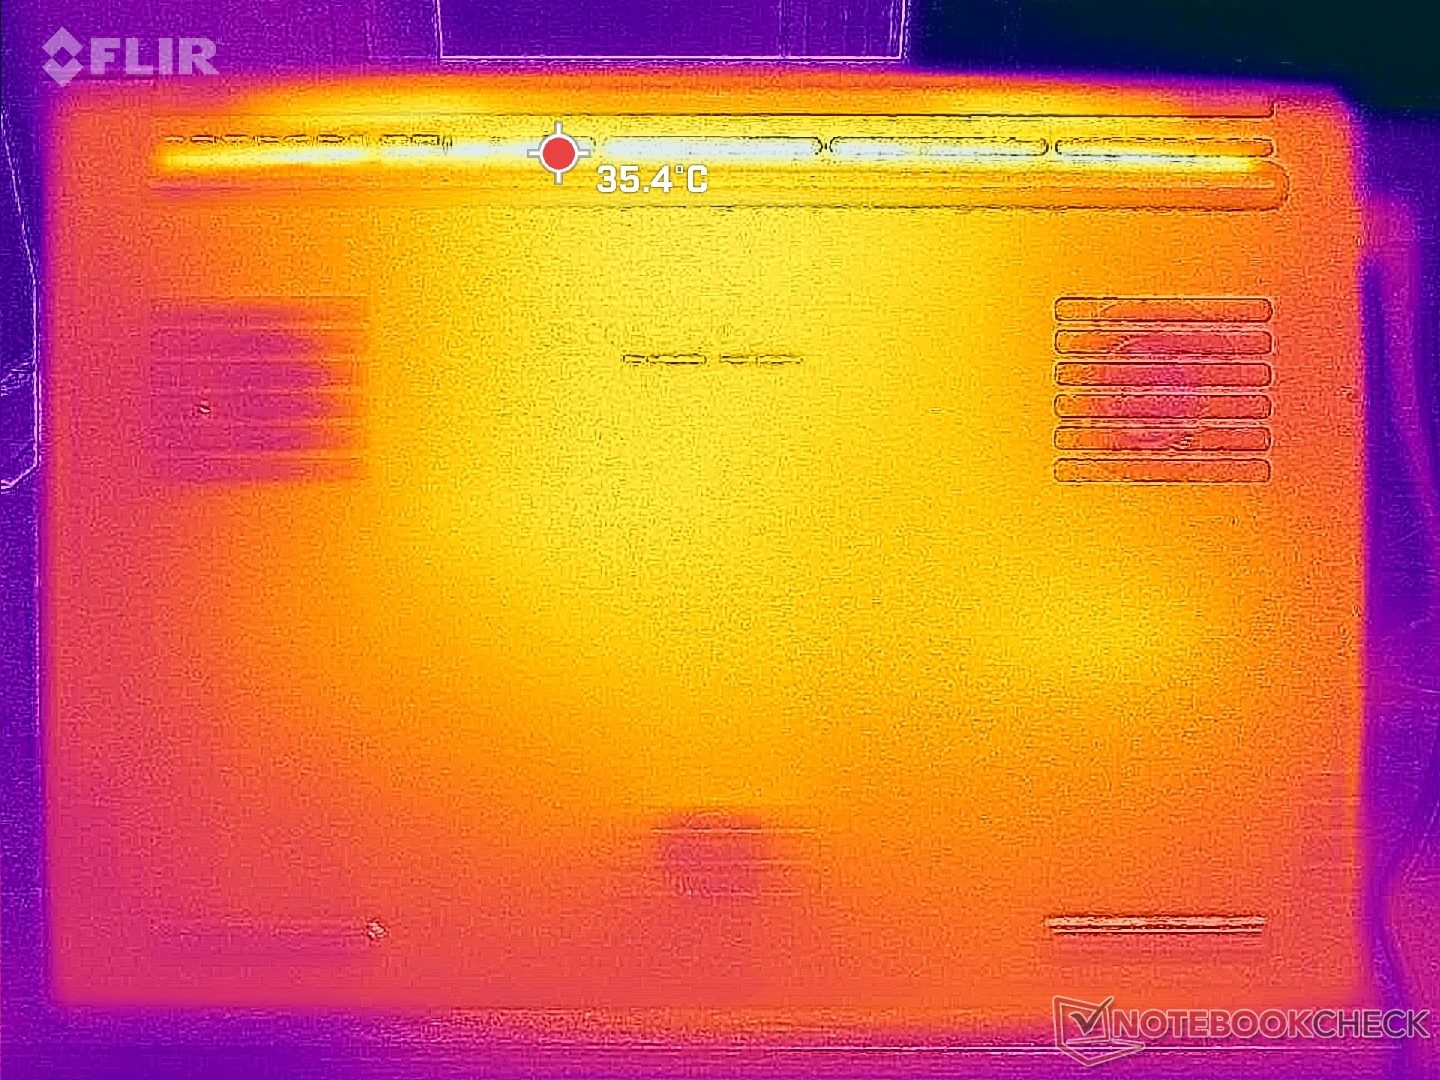
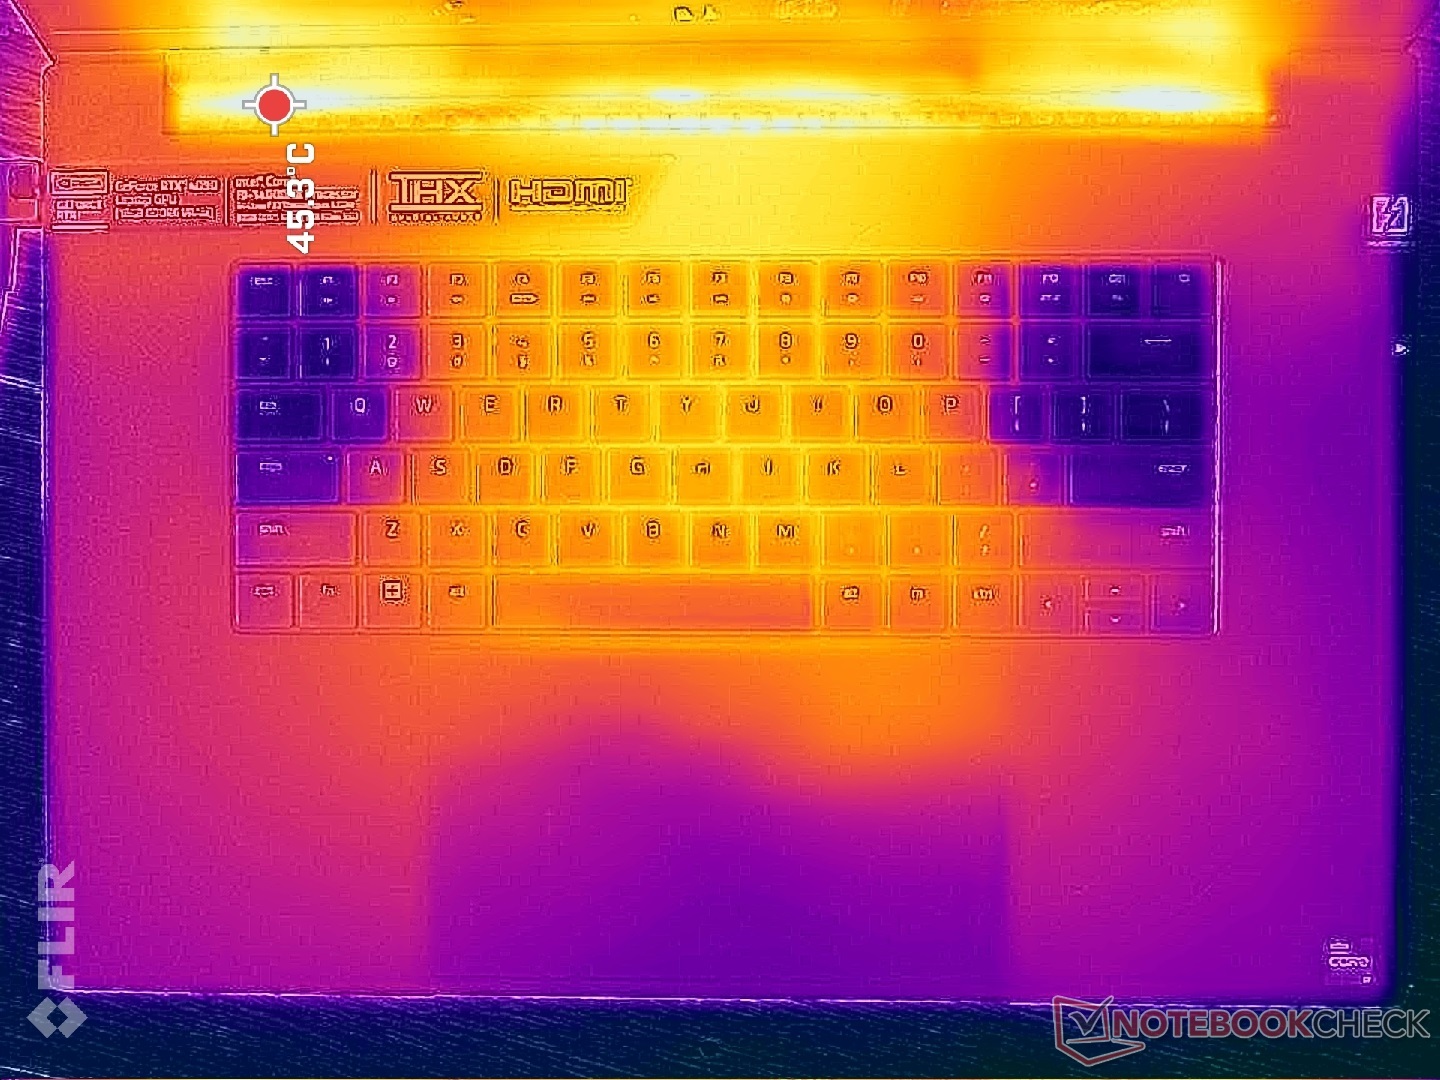
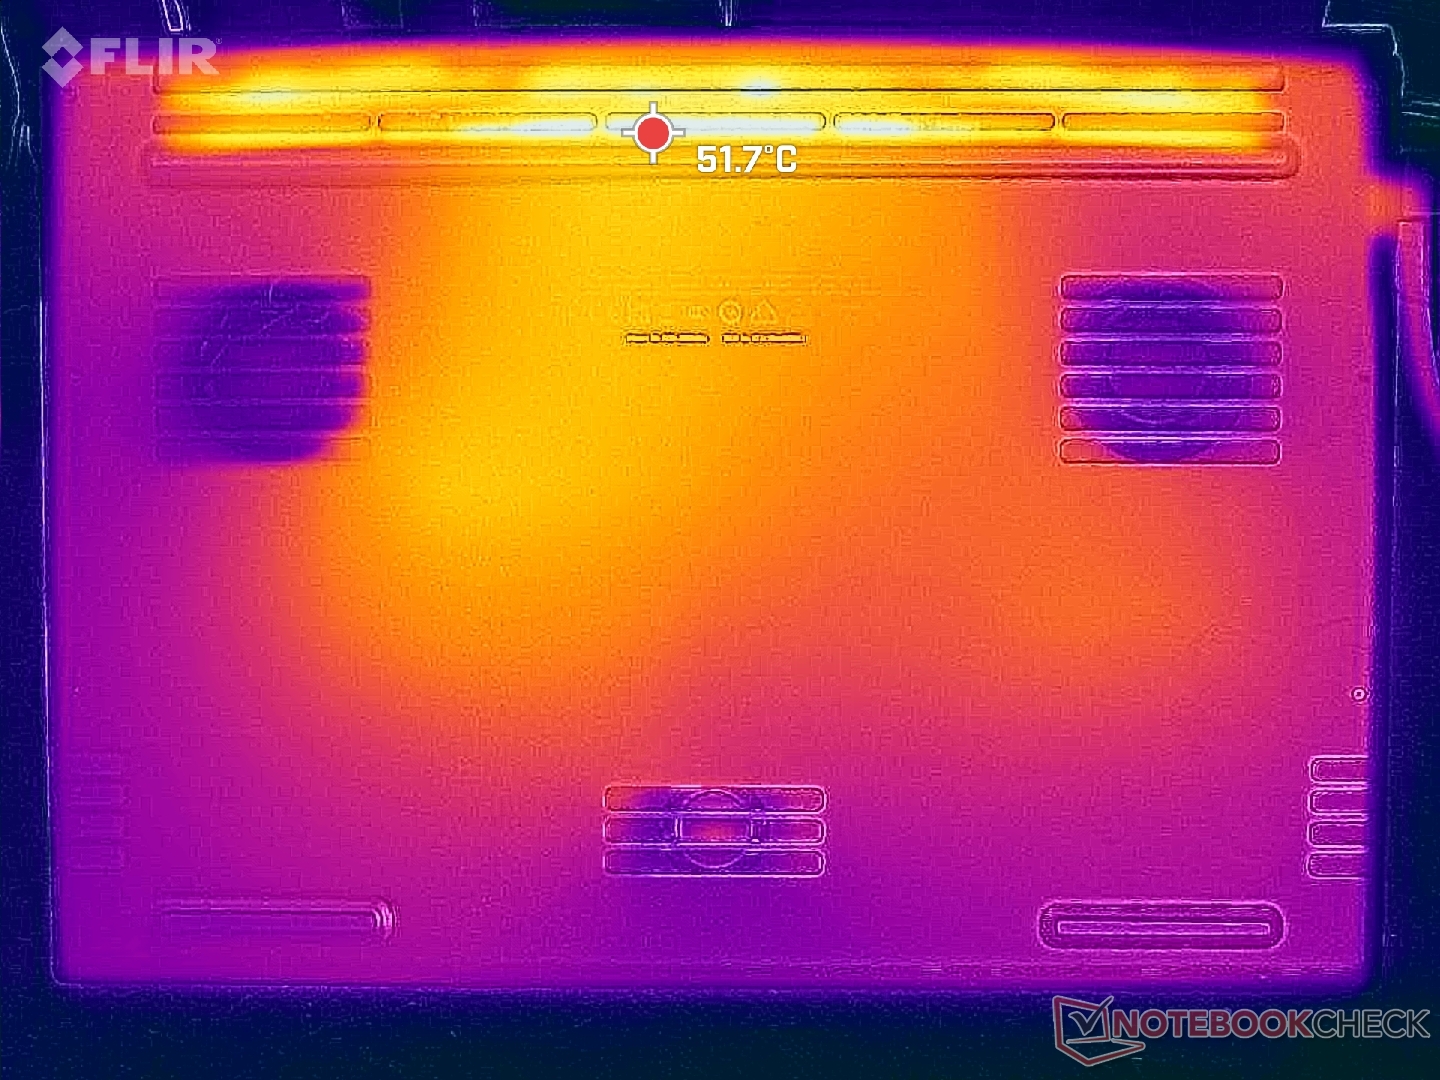
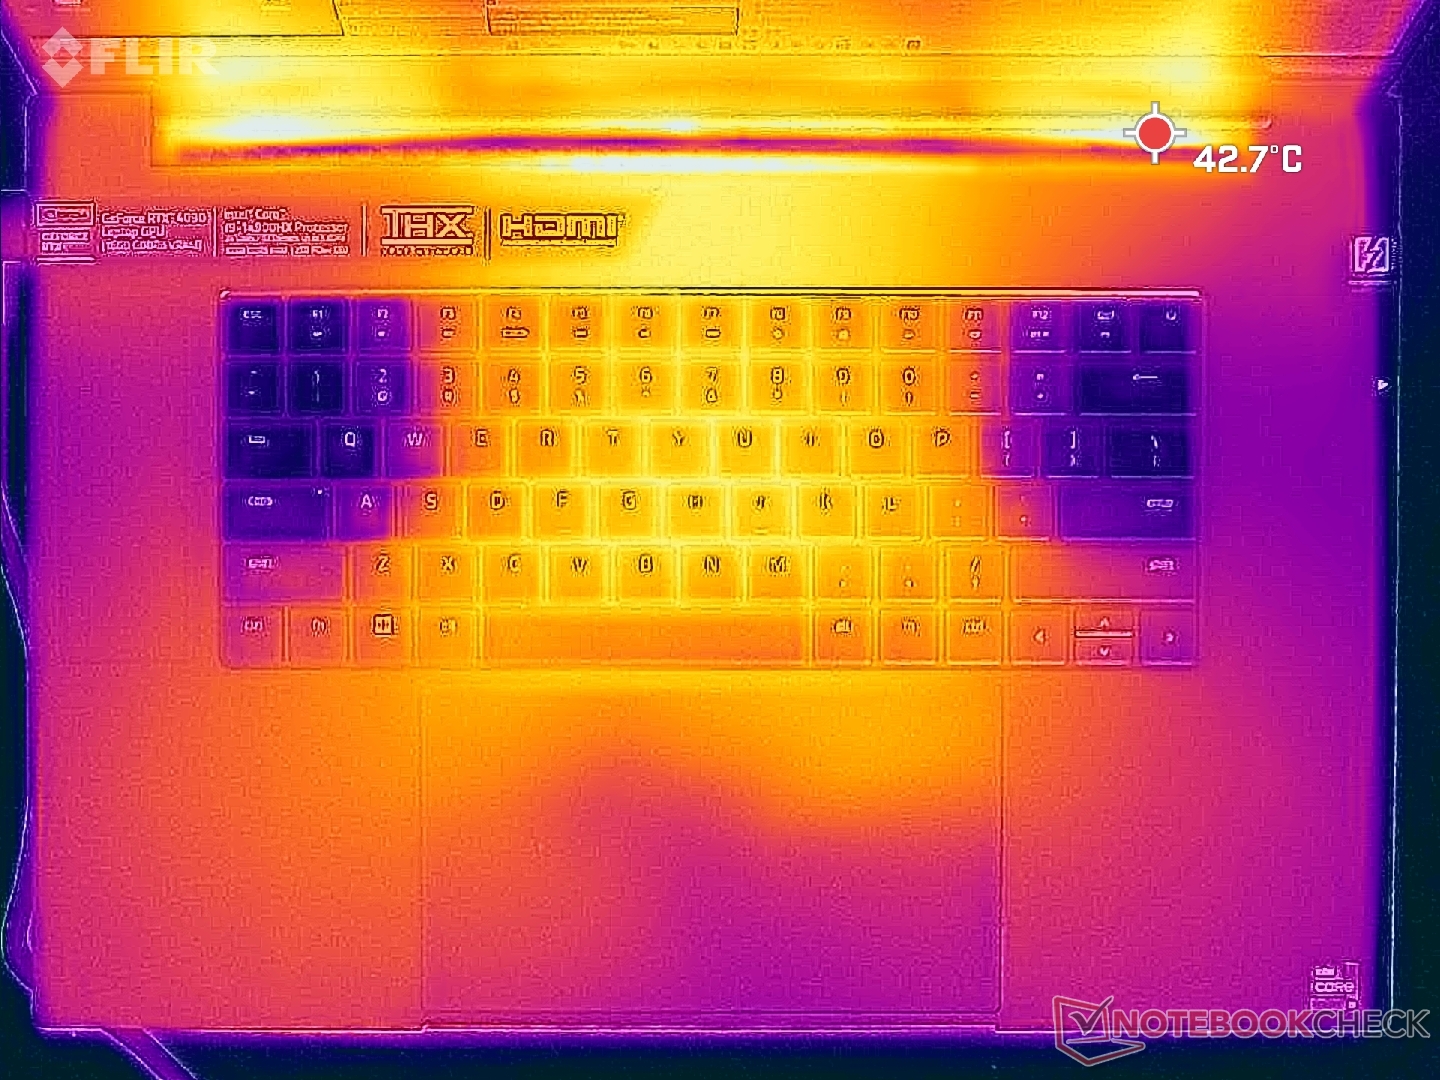
(±) The maximum temperature on the upper side is 43.2 °C / 110 F, compared to the average of 40.4 °C / 105 F, ranging from 21.2 to 68.8 °C for the class Gaming.
(±) The bottom heats up to a maximum of 42.6 °C / 109 F, compared to the average of 43.2 °C / 110 F
(+) In idle usage, the average temperature for the upper side is 31.3 °C / 88 F, compared to the device average of 33.9 °C / 93 F.
(±) Playing The Witcher 3, the average temperature for the upper side is 34.9 °C / 95 F, compared to the device average of 33.9 °C / 93 F.
(±) The palmrests and touchpad can get very hot to the touch with a maximum of 36.2 °C / 97.2 F.
(-) The average temperature of the palmrest area of similar devices was 28.8 °C / 83.8 F (-7.4 °C / -13.4 F).
| Razer Blade 18 2024 RZ09-0509 Intel Core i9-14900HX, NVIDIA GeForce RTX 4090 Laptop GPU | Razer Blade 18 RTX 4070 Intel Core i9-13950HX, NVIDIA GeForce RTX 4070 Laptop GPU | Alienware m18 R2 Intel Core i9-14900HX, NVIDIA GeForce RTX 4090 Laptop GPU | MSI Titan 18 HX A14VIG Intel Core i9-14900HX, NVIDIA GeForce RTX 4090 Laptop GPU | Asus ROG Strix Scar 18 G834JYR (2024) Intel Core i9-14900HX, NVIDIA GeForce RTX 4090 Laptop GPU | Razer Blade 16 2024, RTX 4090 Intel Core i9-14900HX, NVIDIA GeForce RTX 4090 Laptop GPU | |
|---|---|---|---|---|---|---|
| Heat | 12% | -4% | 7% | 3% | 7% | |
| Maximum Upper Side * (°C) | 43.2 | 39.2 9% | 41.2 5% | 37.8 13% | 49 -13% | 45 -4% |
| Maximum Bottom * (°C) | 42.6 | 35.6 16% | 34.6 19% | 37.6 12% | 47 -10% | 45 -6% |
| Idle Upper Side * (°C) | 36 | 31.8 12% | 42.8 -19% | 34.8 3% | 29 19% | 29 19% |
| Idle Bottom * (°C) | 36.4 | 33.2 9% | 43.6 -20% | 36 1% | 31 15% | 30 18% |
* ... smaller is better
Speakers
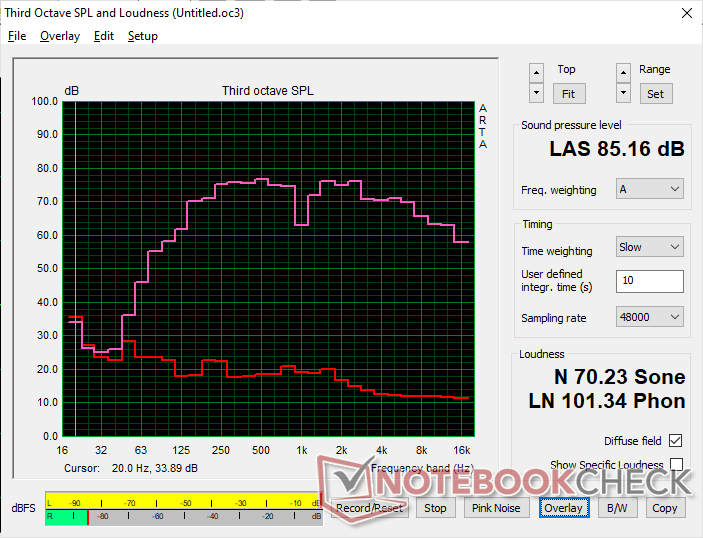
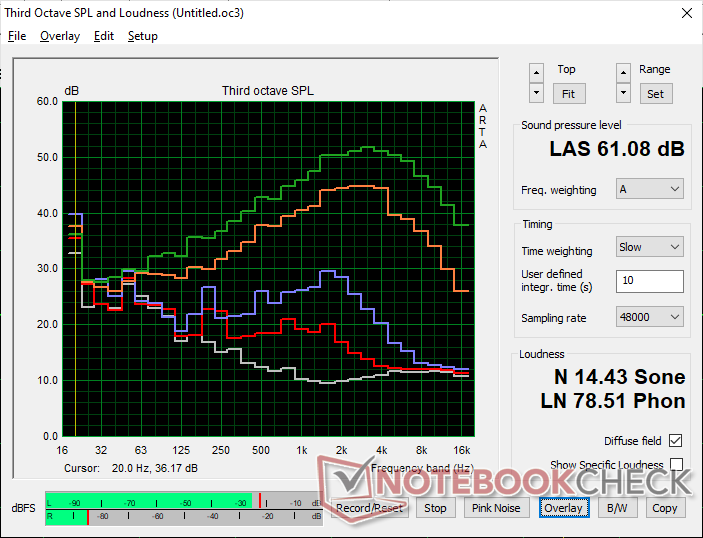
Razer Blade 18 2024 RZ09-0509 audio analysis
(+) | speakers can play relatively loud (85.2 dB)
Bass 100 - 315 Hz
(±) | reduced bass - on average 5.3% lower than median
(+) | bass is linear (6.5% delta to prev. frequency)
Mids 400 - 2000 Hz
(+) | balanced mids - only 4.5% away from median
(±) | linearity of mids is average (7.1% delta to prev. frequency)
Highs 2 - 16 kHz
(+) | balanced highs - only 2.9% away from median
(+) | highs are linear (4% delta to prev. frequency)
Overall 100 - 16.000 Hz
(+) | overall sound is linear (9.3% difference to median)
Compared to same class
» 3% of all tested devices in this class were better, 2% similar, 95% worse
» The best had a delta of 6%, average was 18%, worst was 132%
Compared to all devices tested
» 3% of all tested devices were better, 1% similar, 96% worse
» The best had a delta of 4%, average was 23%, worst was 134%
Apple MacBook Pro 16 2021 M1 Pro audio analysis
(+) | speakers can play relatively loud (84.7 dB)
Bass 100 - 315 Hz
(+) | good bass - only 3.8% away from median
(+) | bass is linear (5.2% delta to prev. frequency)
Mids 400 - 2000 Hz
(+) | balanced mids - only 1.3% away from median
(+) | mids are linear (2.1% delta to prev. frequency)
Highs 2 - 16 kHz
(+) | balanced highs - only 1.9% away from median
(+) | highs are linear (2.7% delta to prev. frequency)
Overall 100 - 16.000 Hz
(+) | overall sound is linear (4.6% difference to median)
Compared to same class
» 0% of all tested devices in this class were better, 0% similar, 100% worse
» The best had a delta of 5%, average was 17%, worst was 45%
Compared to all devices tested
» 0% of all tested devices were better, 0% similar, 100% worse
» The best had a delta of 4%, average was 23%, worst was 134%
Energy Management
Power Consumption
Consumption is higher across the board as to be expected due to the display and GPU differences between our 2023 and 2024 test units. Idling on desktop on Optimus mode, minimum brightness level, and 60 Hz refresh rate demands approximately 25 W while idling on dGPU mode, maximum brightness level, and 300 Hz refresh rate will draw over 2x more.
Running Witcher 3 demands about 70 W more from our RTX 4090-powered 2024 test unit than our RTX 4070-powered 2023 unit under similar conditions. As a result, lower-end RTX 4070 configurations ship with a smaller 280 W GaN adapter while RTX 4080/4090 configurations ship with the slightly larger 330 W GaN adapter (~18 x 7.5 x 2.5 cm vs. ~16.3 x 7 x 2.5 cm).
Interestingly, power consumption on Standby mode would be as low as <1 W if on Optimus mode or as high as 35 W if on discrete GPU mode. This aligns with our observations above related to the abnormally warm system when on Standby if dGPU mode is active.
| Off / Standby | |
| Idle | |
| Load |
|
Key:
min: | |
| Razer Blade 18 2024 RZ09-0509 i9-14900HX, GeForce RTX 4090 Laptop GPU, , Mini-LED, 2560x1600, 18" | Razer Blade 18 RTX 4070 i9-13950HX, GeForce RTX 4070 Laptop GPU, SSSTC CA6-8D1024, IPS, 2560x1600, 18" | Alienware m18 R2 i9-14900HX, GeForce RTX 4090 Laptop GPU, SK Hynix PC811 HFS002TEM9X152N, IPS, 2560x1600, 18" | MSI Titan 18 HX A14VIG i9-14900HX, GeForce RTX 4090 Laptop GPU, 2x Samsung PM9A1a MZVL22T0HDLB (RAID 0), Mini-LED, 3840x2400, 18" | Asus ROG Strix Scar 18 G834JYR (2024) i9-14900HX, GeForce RTX 4090 Laptop GPU, Samsung PM9A1a MZVL22T0HDLB, Mini LED, 2560x1600, 18" | |
|---|---|---|---|---|---|
| Power Consumption | 10% | 3% | 3% | 26% | |
| Idle Minimum * (Watt) | 25.4 | 24.5 4% | 10.6 58% | 13.2 48% | 14 45% |
| Idle Average * (Watt) | 37.7 | 34.1 10% | 20.9 45% | 25.4 33% | 17 55% |
| Idle Maximum * (Watt) | 57.9 | 47.7 18% | 40 31% | 53.5 8% | 24 59% |
| Load Average * (Watt) | 128.4 | 140 -9% | 201.1 -57% | 151.4 -18% | 143 -11% |
| Witcher 3 ultra * (Watt) | 273.1 | 202 26% | 358 -31% | 336 -23% | 251 8% |
| Load Maximum * (Watt) | 297.9 | 261 12% | 378.9 -27% | 395.2 -33% | 302 -1% |
* ... smaller is better
Battery Life
Runtimes are about the same as before if not just slightly longer by only 20 minutes or so. Note that our WLAN test already accounts for Optimus mode and the slower 60 Hz refresh rate meaning that battery life would be even shorter on dGPU mode with both local dimming and high refresh rates active.
It's unrealistic to expect long runtimes from an 18-inch gaming powerhouse, but competitors like the ROG Strix Scar 18 or Alienware m18 R2 still have the Razer beat in this regard.
| Razer Blade 18 2024 RZ09-0509 i9-14900HX, GeForce RTX 4090 Laptop GPU, 91.7 Wh | Razer Blade 18 RTX 4070 i9-13950HX, GeForce RTX 4070 Laptop GPU, 91.7 Wh | Alienware m18 R2 i9-14900HX, GeForce RTX 4090 Laptop GPU, 97 Wh | MSI Titan 18 HX A14VIG i9-14900HX, GeForce RTX 4090 Laptop GPU, 99.9 Wh | Asus ROG Strix Scar 18 G834JYR (2024) i9-14900HX, GeForce RTX 4090 Laptop GPU, 90 Wh | Razer Blade 16 2024, RTX 4090 i9-14900HX, GeForce RTX 4090 Laptop GPU, 95.2 Wh | |
|---|---|---|---|---|---|---|
| Battery runtime | 9% | 9% | 1% | 53% | 28% | |
| Reader / Idle (h) | 6.6 | 7 6% | 5.9 -11% | 10.2 55% | ||
| WiFi v1.3 (h) | 4.4 | 4 -9% | 4.8 9% | 4.2 -5% | 7.7 75% | 5.5 25% |
| Load (h) | 1 | 1.3 30% | 1.2 20% | 1.3 30% | 1.3 30% | |
| H.264 (h) | 7.5 | 7.6 |
Pros
Cons
Verdict — All About Those New Display Options
With no new Nvidia GPUs to incorporate this year and no real gains from the new Raptor Lake-HX refresh series, Razer had to look elsewhere to make the 2024 Blade 18 more appealing than its visually identical 2023 predecessor. In this case, the latest model includes new display options alongside Thunderbolt 5 support to be one of the first gaming laptops in the market with both mini-LED and next generation Thunderbolt. Other smaller updates like Wi-Fi 7 and a webcam shutter are welcomed but nonetheless only minor upgrades. Gamers who aren't enamored by these specific features should instead consider the 2023 Blade 18 which can offer the same gaming performance and user experience for hundreds of dollars less.
Thunderbolt 5, mini-LED, and Wi-Fi 7 help to distinguish the 2024 Blade 18 from yesteryear. Performance hunters, however, will find no major differences between the 2023 and 2024 models.
As for mini-LED on laptops, the panel is at its best with both HDR and local dimming active for supported games and video. Otherwise, you'll have to continuously toggle local dimming on and off depending on your workloads to avoid the halo effect. If you plan on using the Blade 18 primarily for gaming and multimedia, then the 2K mini-LED display might be the optimal option. Conversely, users who seldom enable HDR and want the Blade 18 primarily for professional purposes like content creation, editing, or CAD work should consider the higher resolution 4K IPS configuration which pairs well with the large 18-inch screen size. Razer has both sides of the coin covered in this regard.
Finally, it's worth mentioning that 4K mini-LED is available on the MSI Titan 18 whereas it is missing on the Razer. The trade-off is that the MSI system does not support G-Sync and so there is no "ultimate" 18-inch mini-LED panel for the time being.
Price and Availability
Amazon is now shipping our mini-LED configuration for $4500 USD. Alternatively, users can purchase directly from Razer with more configuration options between the 2023 and 2024 models.
Razer Blade 18 2024 RZ09-0509
- 05/05/2024 v7 (old)
Allen Ngo
Transparency
The selection of devices to be reviewed is made by our editorial team. The test sample was provided to the author as a loan by the manufacturer or retailer for the purpose of this review. The lender had no influence on this review, nor did the manufacturer receive a copy of this review before publication. There was no obligation to publish this review. As an independent media company, Notebookcheck is not subjected to the authority of manufacturers, retailers or publishers.
This is how Notebookcheck is testing
Every year, Notebookcheck independently reviews hundreds of laptops and smartphones using standardized procedures to ensure that all results are comparable. We have continuously developed our test methods for around 20 years and set industry standards in the process. In our test labs, high-quality measuring equipment is utilized by experienced technicians and editors. These tests involve a multi-stage validation process. Our complex rating system is based on hundreds of well-founded measurements and benchmarks, which maintains objectivity. Further information on our test methods can be found here.
Price comparison
