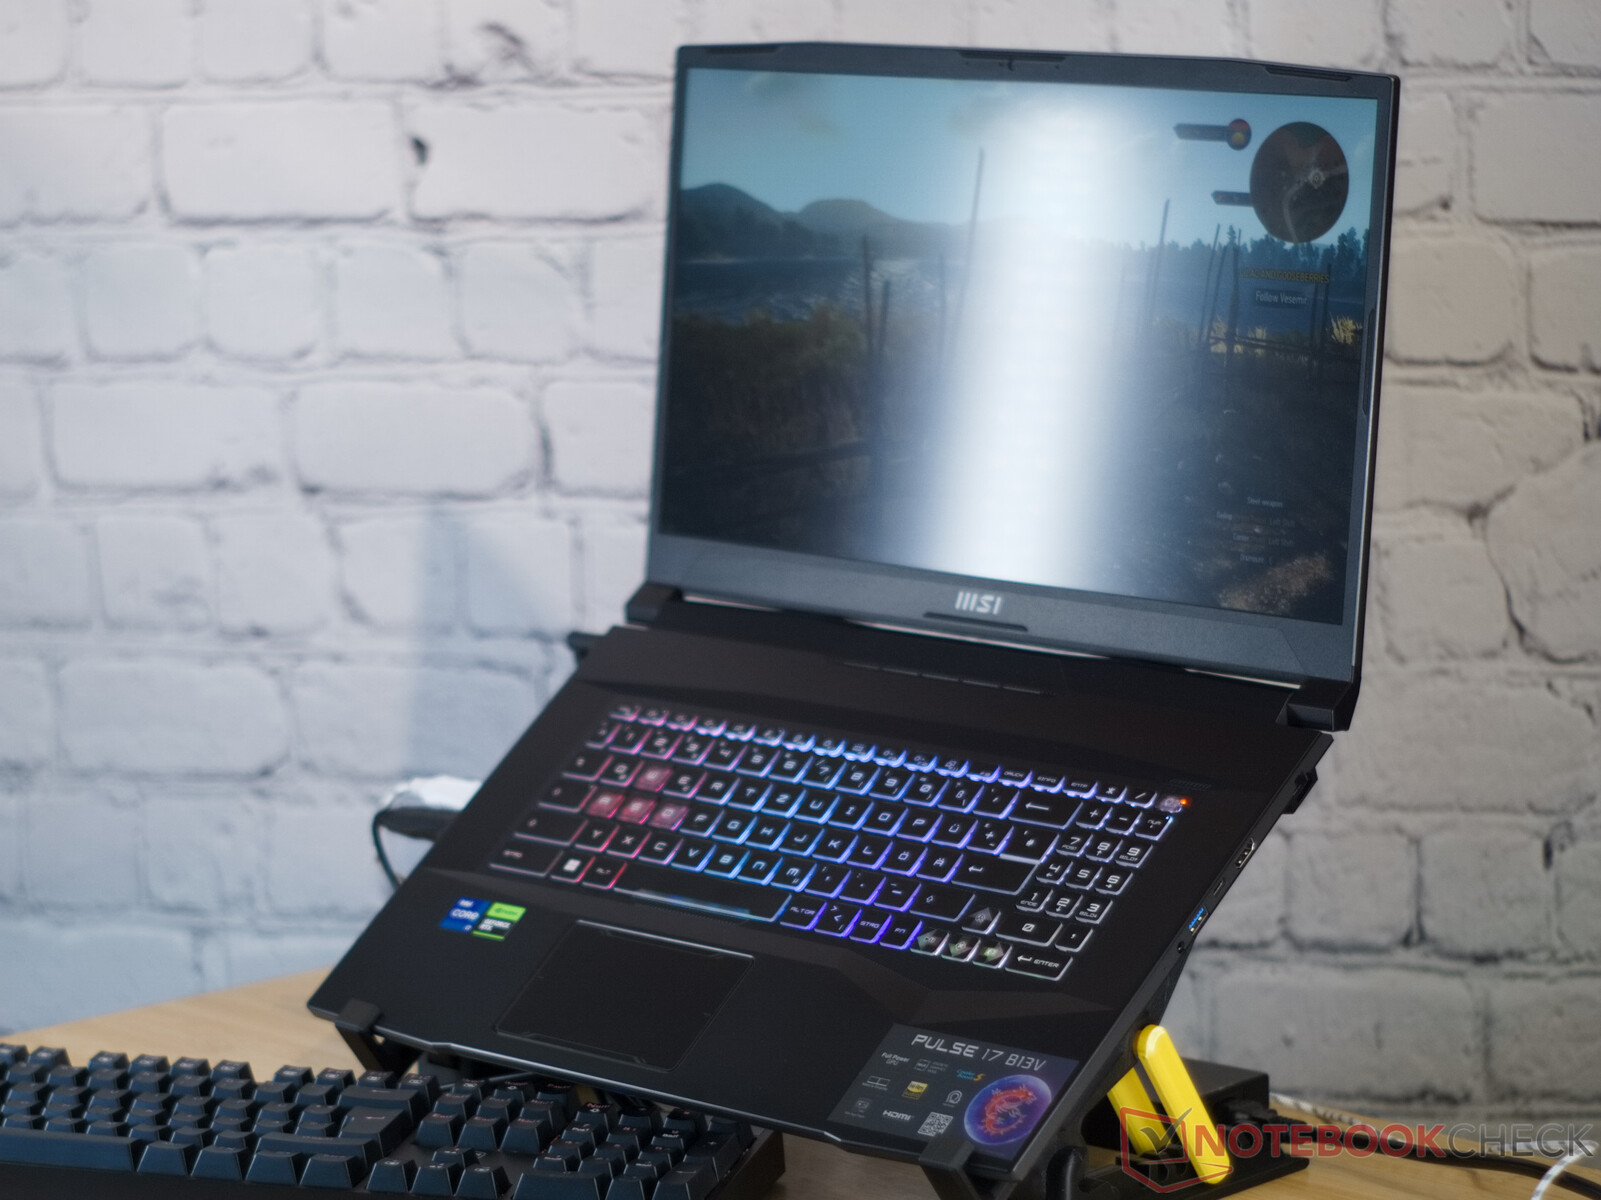
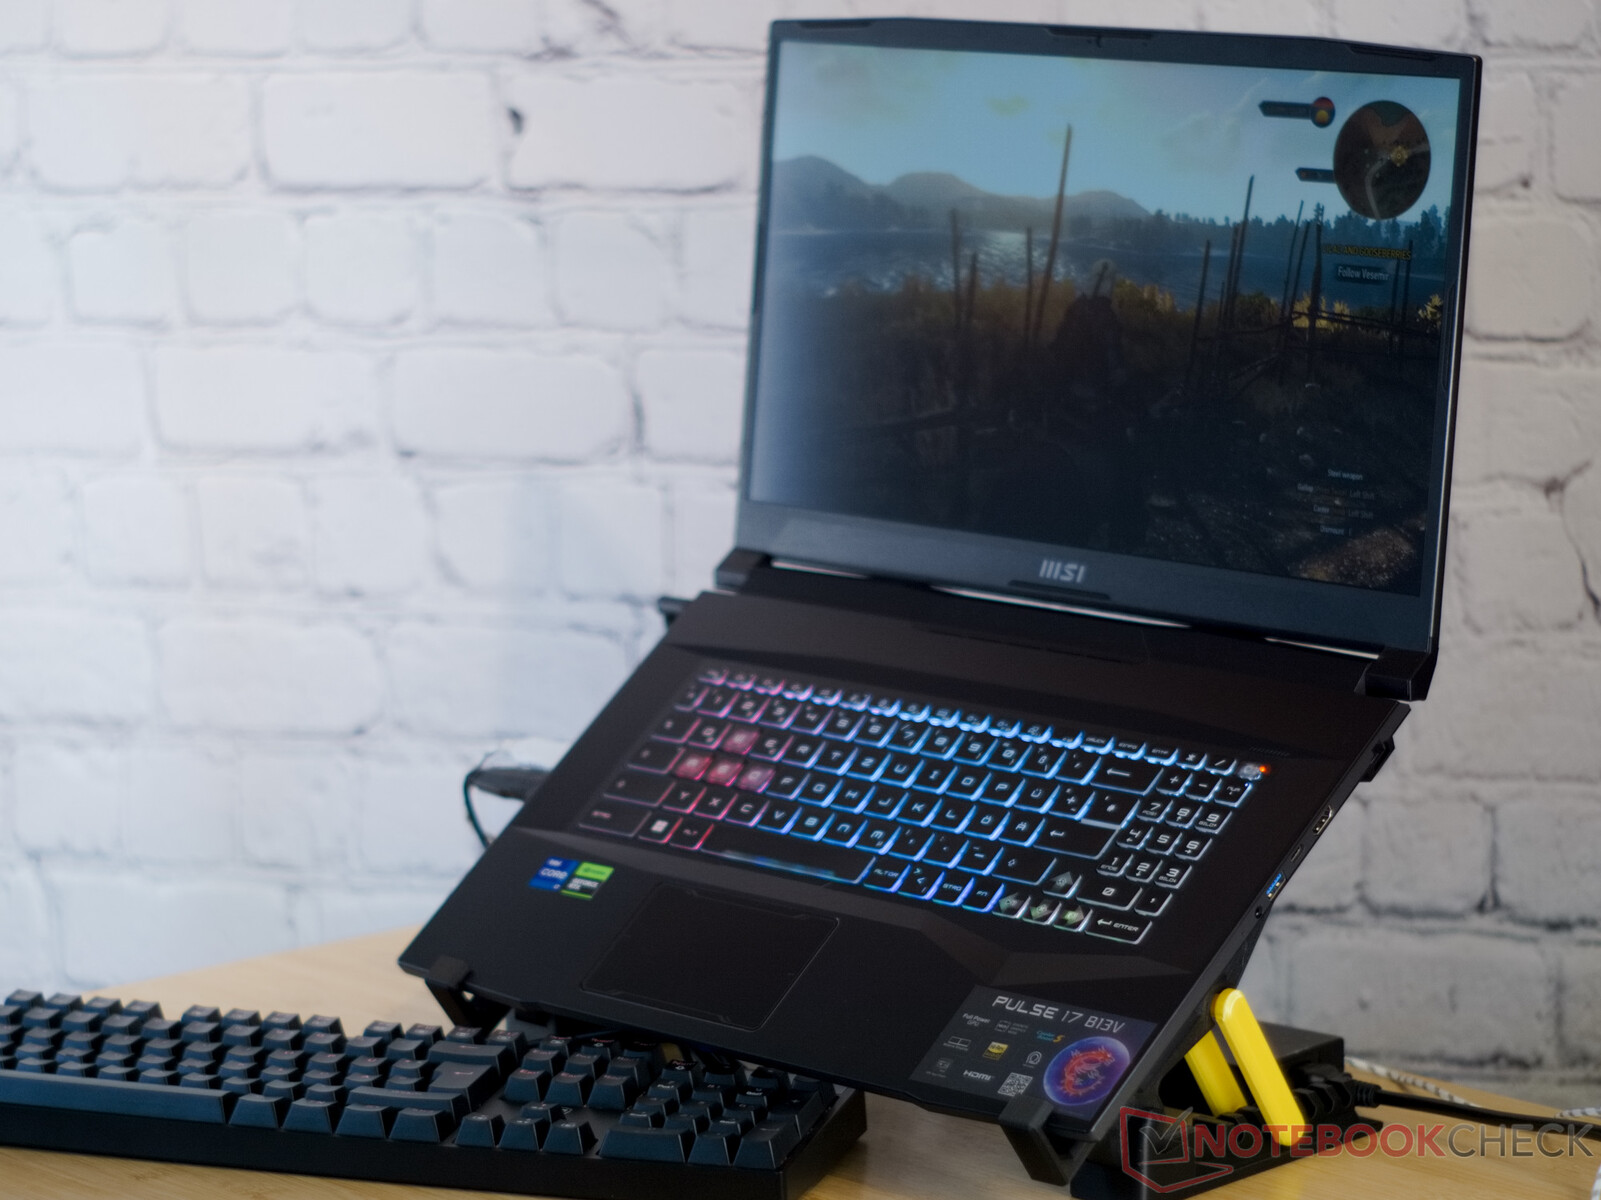
MSI Pulse 17 B13V gaming laptop review: With quiet wings
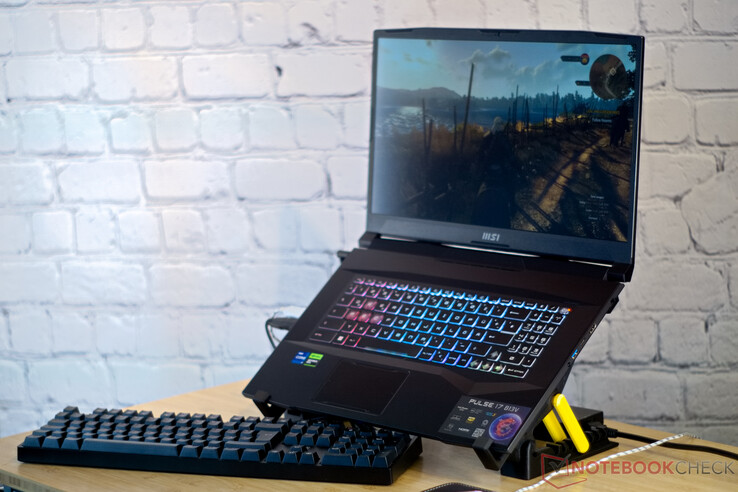
With the MSI Pulse 17, the Red Dragon brings a gaming laptop whose exterior reminds a bit of science fiction. This impression results from the display lid made of anodized aluminum, many edges and corners, and even the honeycomb grid on the bottom of the 17-inch laptop. But inside the laptop run current components, and our test unit is equipped with an Intel Core i7-13700H and Nvidia GeForce RTX 4070. When we tested the predecessor in the beginning of the year, the performance of the laptop was convincing. But we also noticed that the Pulse GL76 lacked G-Sync, MUX, Advanced Optimus, and Thunderbolt support. The noise level of the fans in the gaming laptop also gave some reason for complaint.
MSI has now reworked the laptop significantly, introducing many improvements all over, in addition to the new design, chip generations, and cryptic name. With this, the powerful device rises significantly in our ratings. We compare the laptop with the Asus ROG Strix G17 G713PI, the MSI Katana 17 B13VFK, and the Schenker XMG Focus 17 (E23).
Possible Competitors in Comparison
Rating | Date | Model | Weight | Height | Size | Resolution | Price |
|---|---|---|---|---|---|---|---|
| 86.3 % v7 (old) | 07 / 2023 | MSI Pulse 17 B13VGK i7-13700H, GeForce RTX 4070 Laptop GPU | 2.7 kg | 27.2 mm | 17.30" | 1920x1080 | |
| 83.2 % v7 (old) | 01 / 2023 | MSI Pulse GL76 12UGK i7-12700H, GeForce RTX 3070 Laptop GPU | 2.6 kg | 24.2 mm | 17.30" | 1920x1080 | |
| 82.1 % v7 (old) | 02 / 2023 | MSI Katana 17 B13VFK i7-13620H, GeForce RTX 4060 Laptop GPU | 2.8 kg | 25.2 mm | 17.30" | 1920x1080 | |
| 87.2 % v7 (old) | 07 / 2023 | Acer Nitro 17 AN17-51-71ER i7-13700H, GeForce RTX 4060 Laptop GPU | 3 kg | 30.3 mm | 17.30" | 2560x1440 | |
| 85.9 % v7 (old) | 06 / 2023 | Schenker XMG Focus 17 (E23) i9-13900HX, GeForce RTX 4070 Laptop GPU | 2.9 kg | 29.3 mm | 17.30" | 2560x1440 | |
| 88.4 % v7 (old) | 04 / 2023 | Asus ROG Strix G17 G713PI R9 7945HX, GeForce RTX 4070 Laptop GPU | 2.8 kg | 30.7 mm | 17.30" | 2560x1440 |
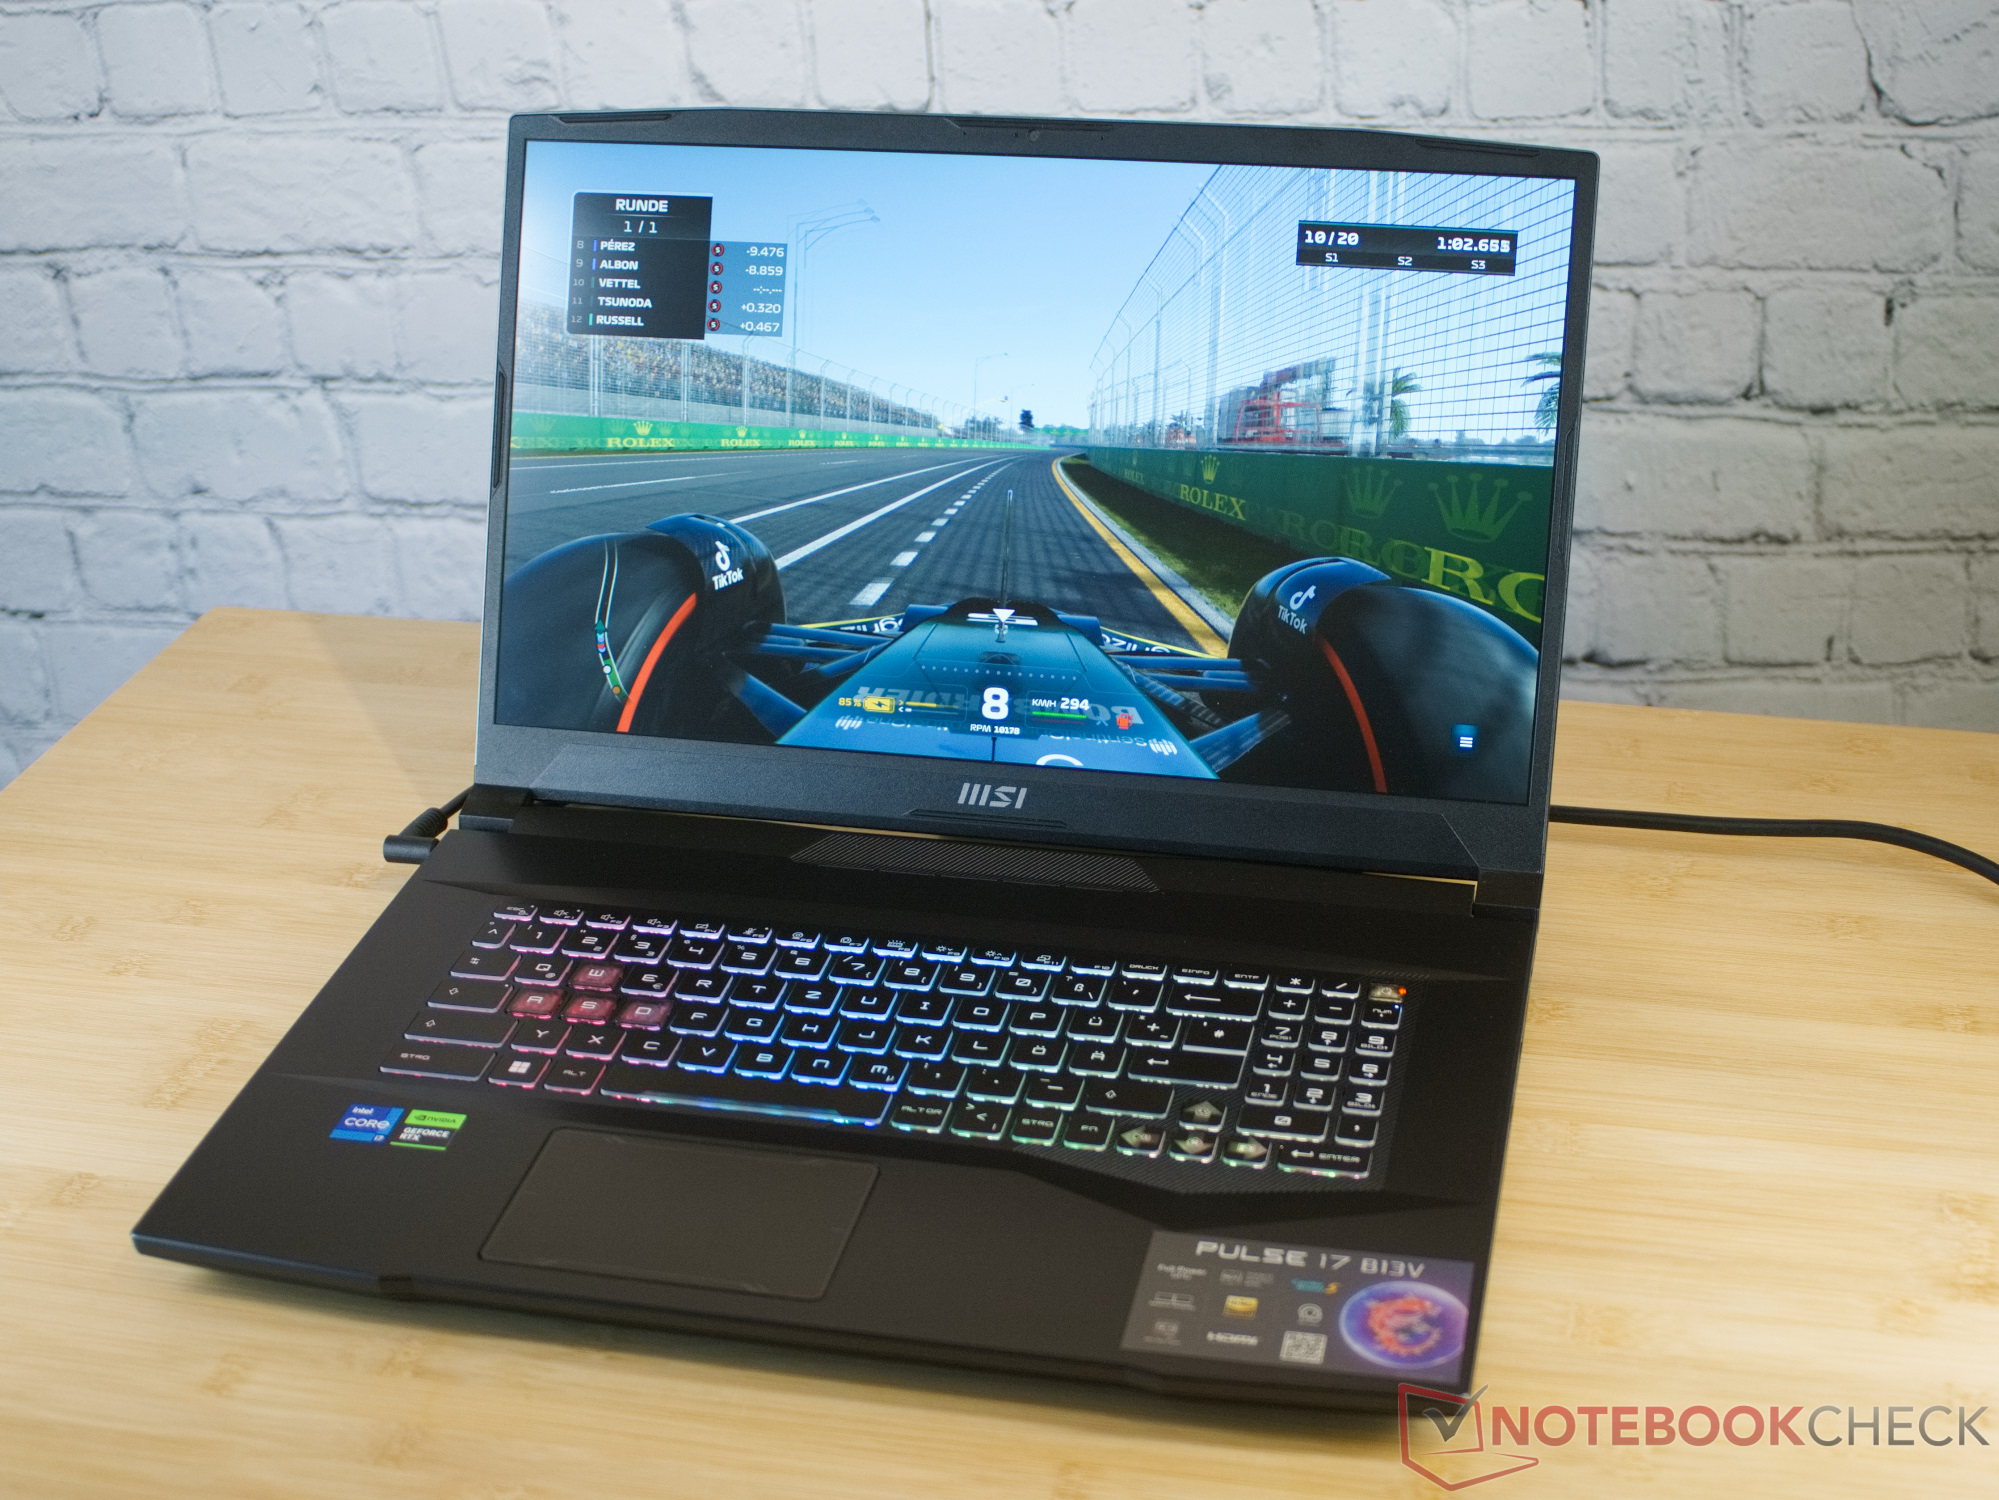
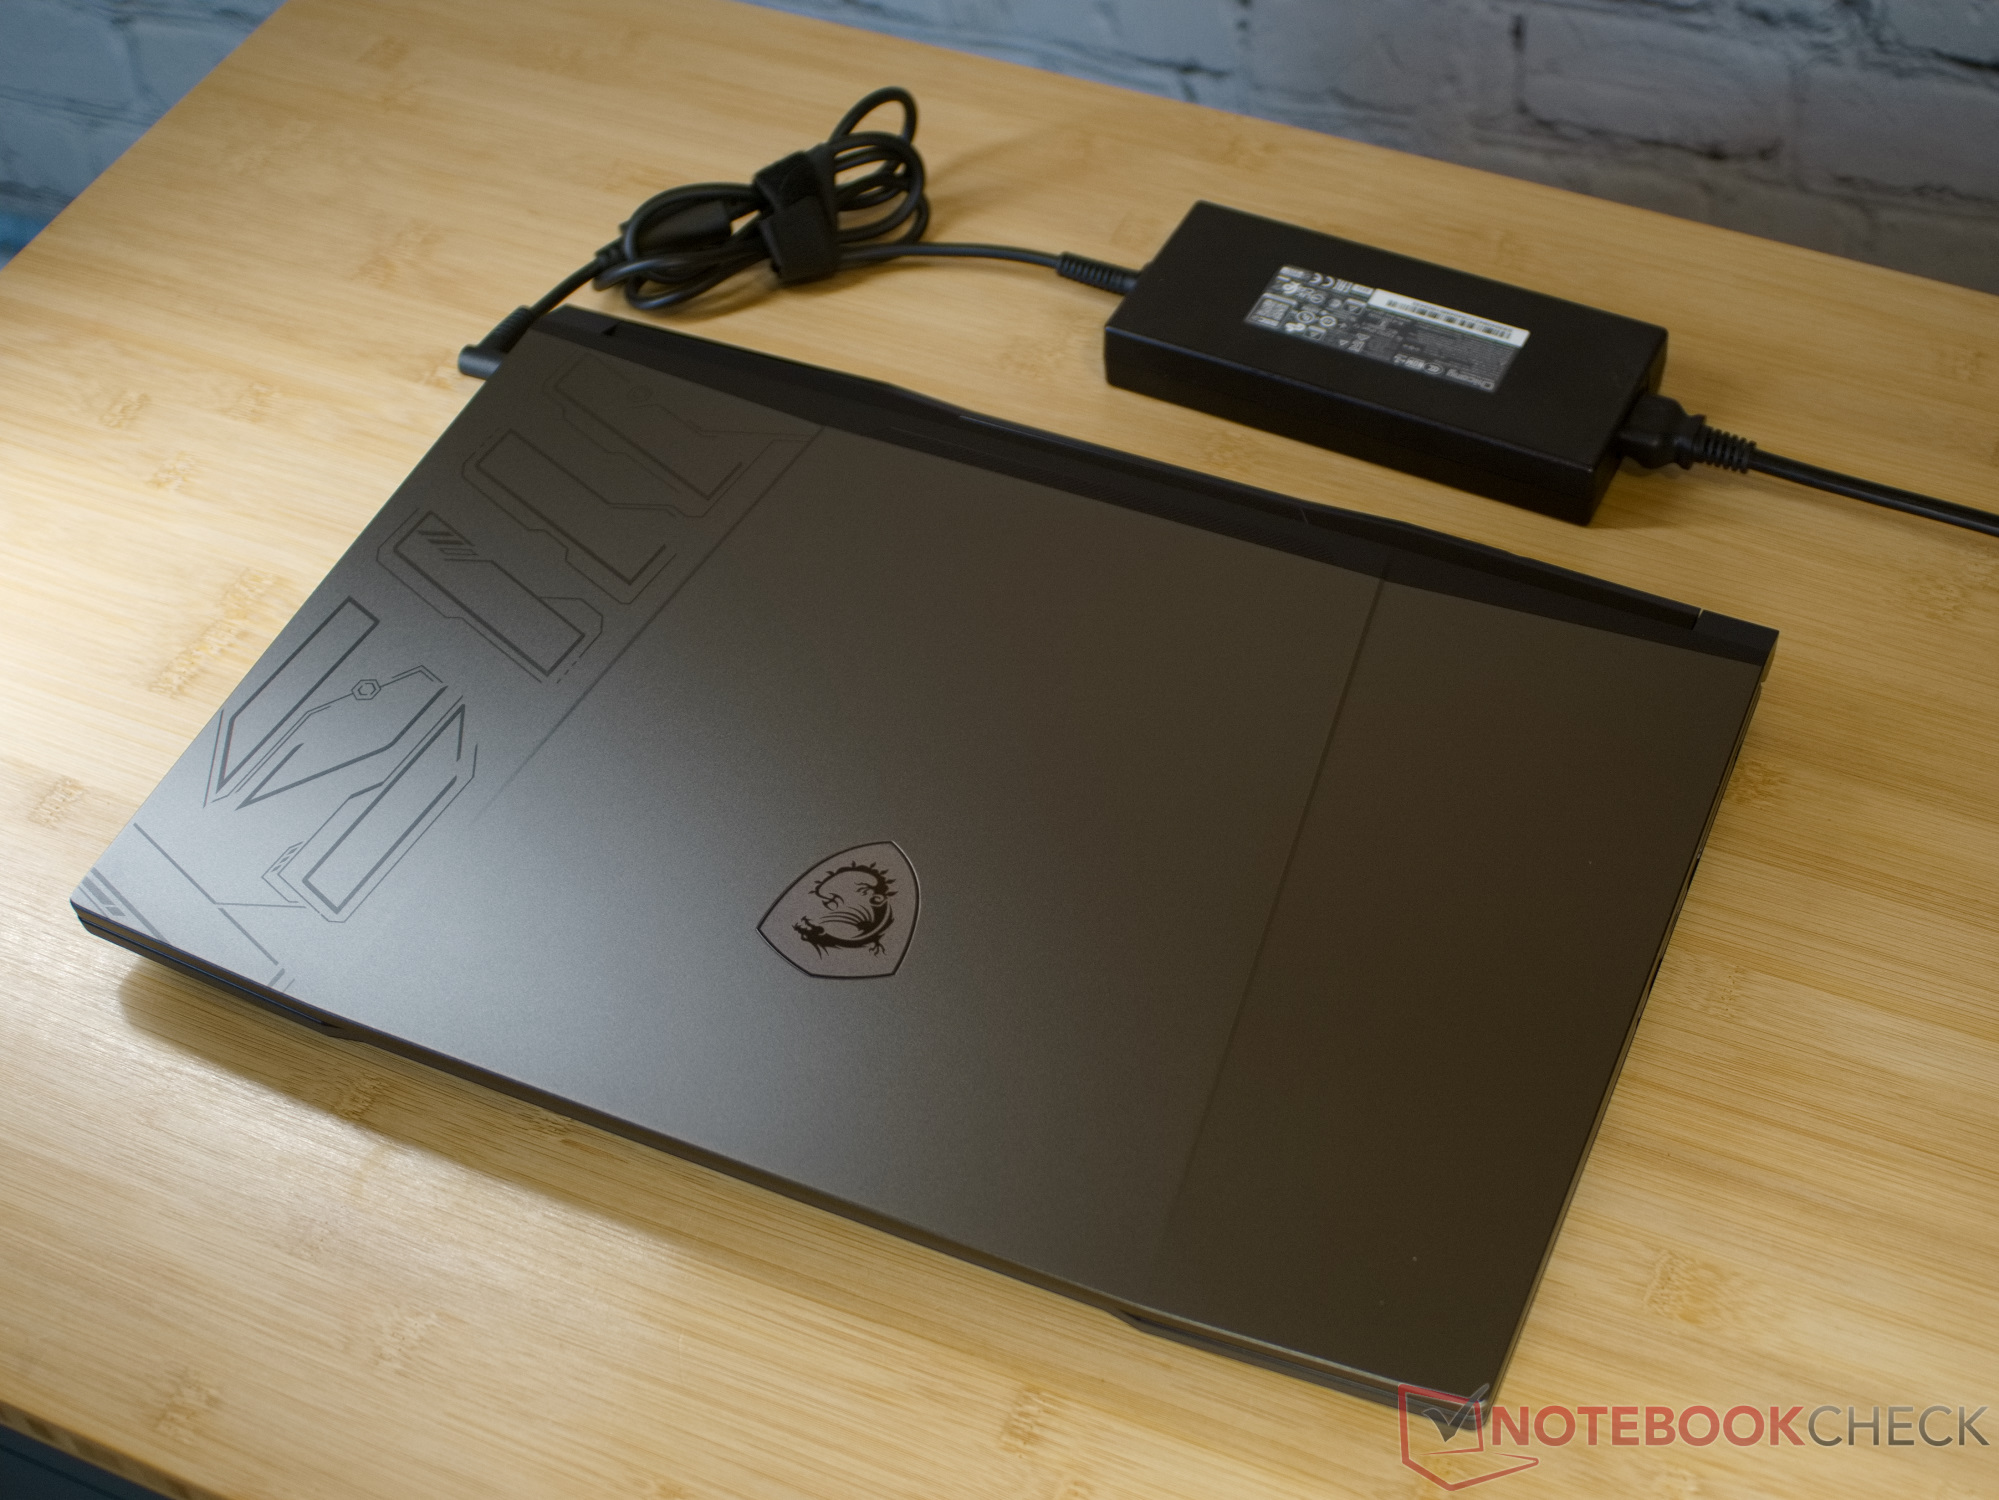
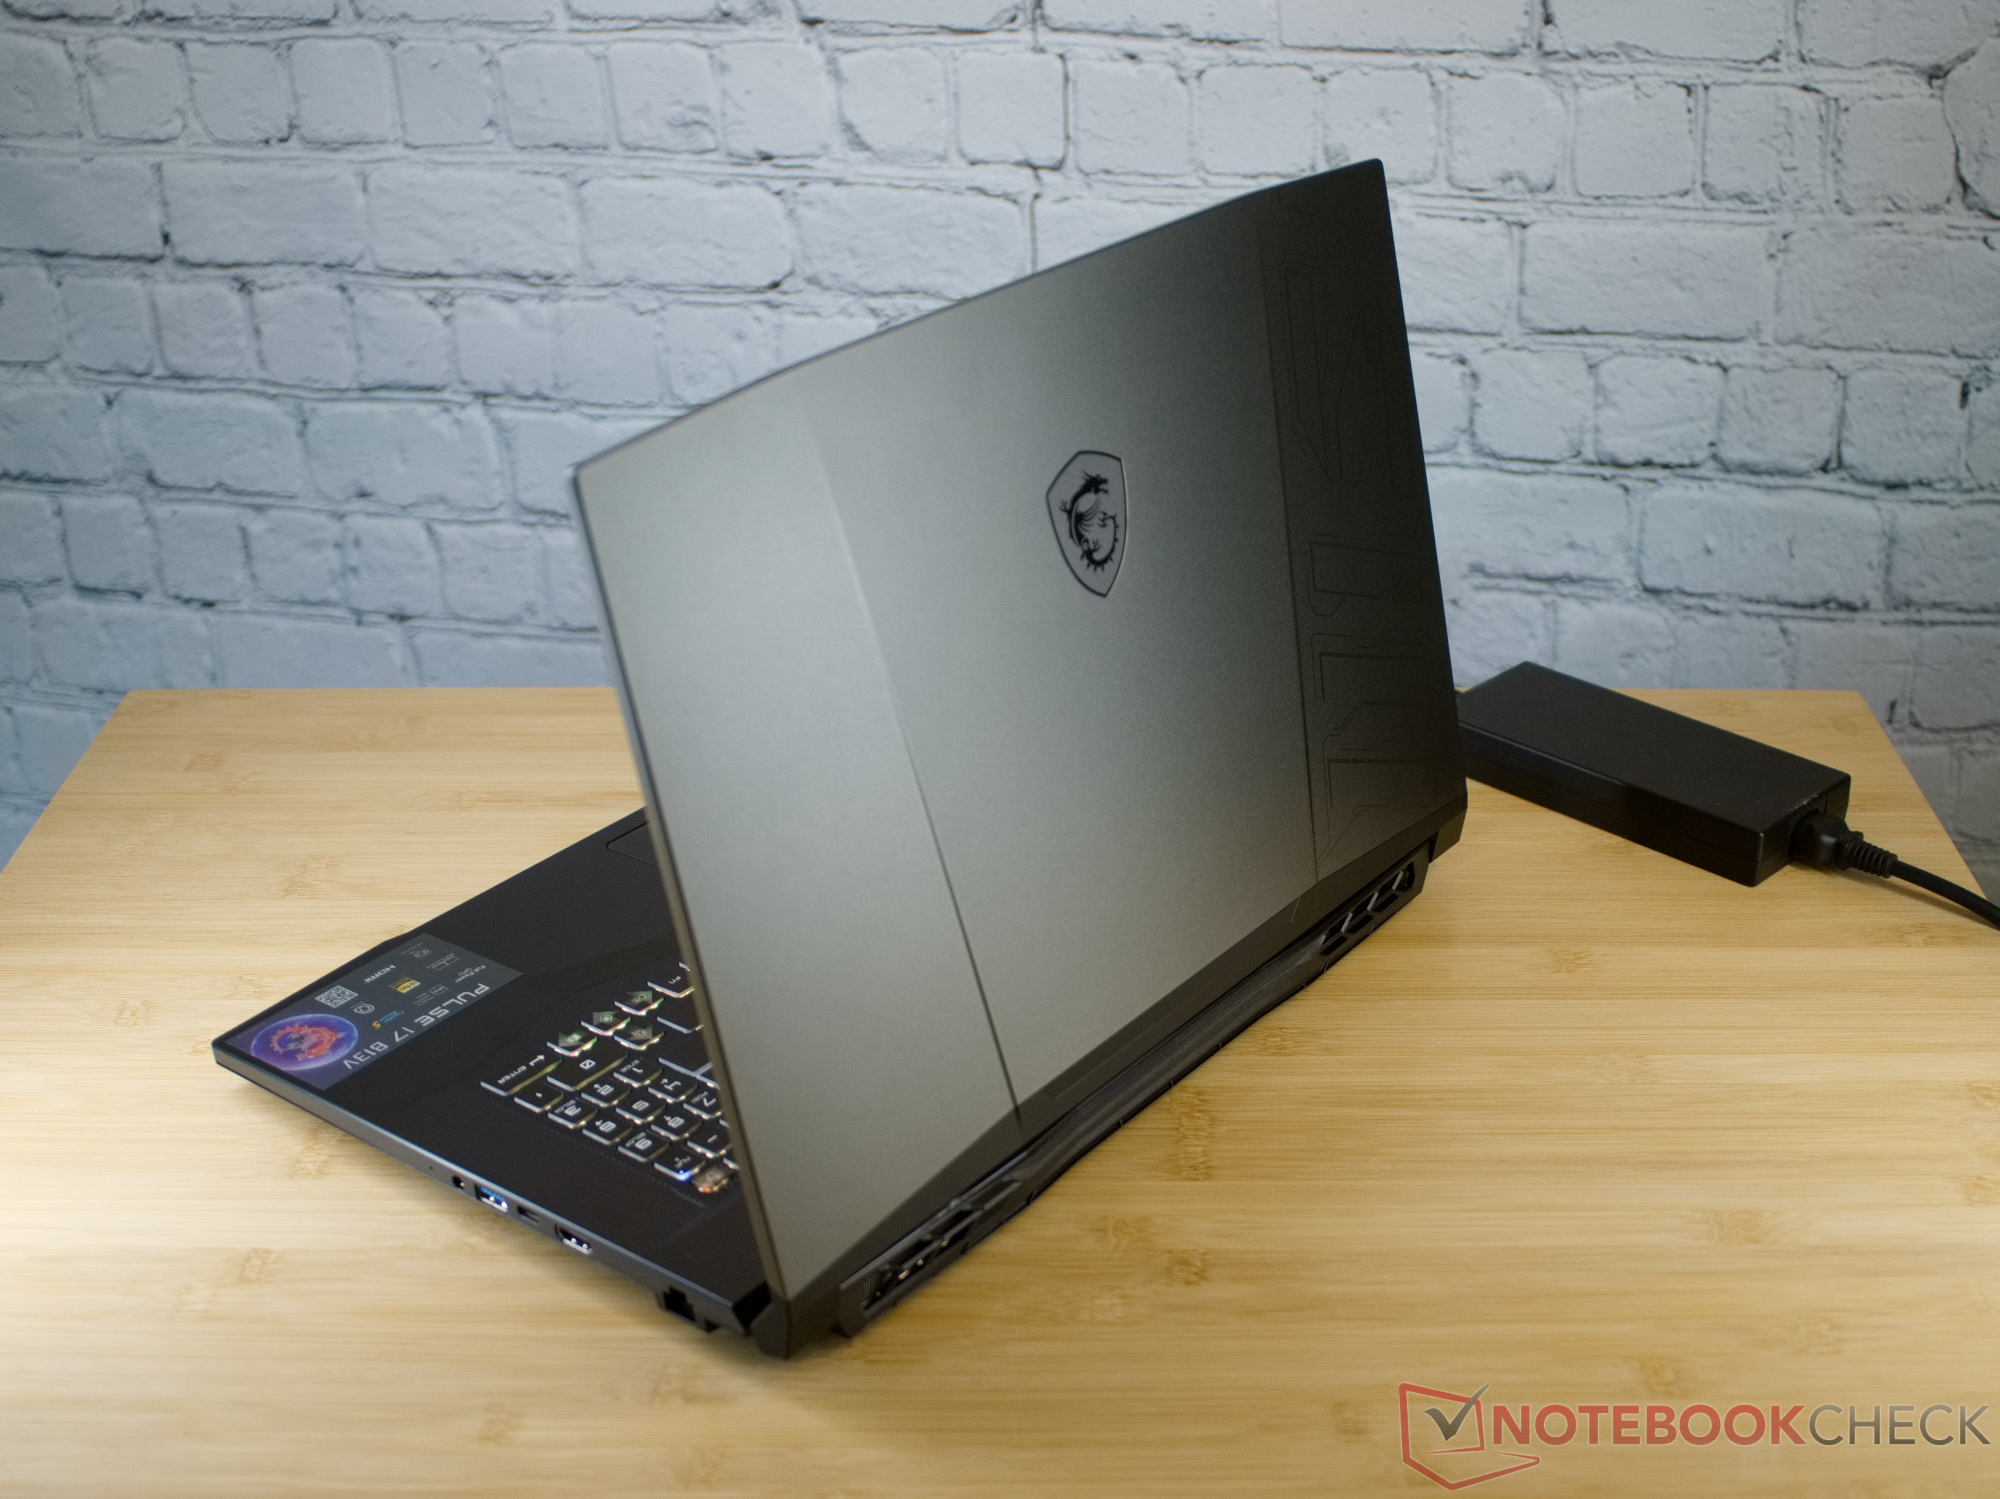
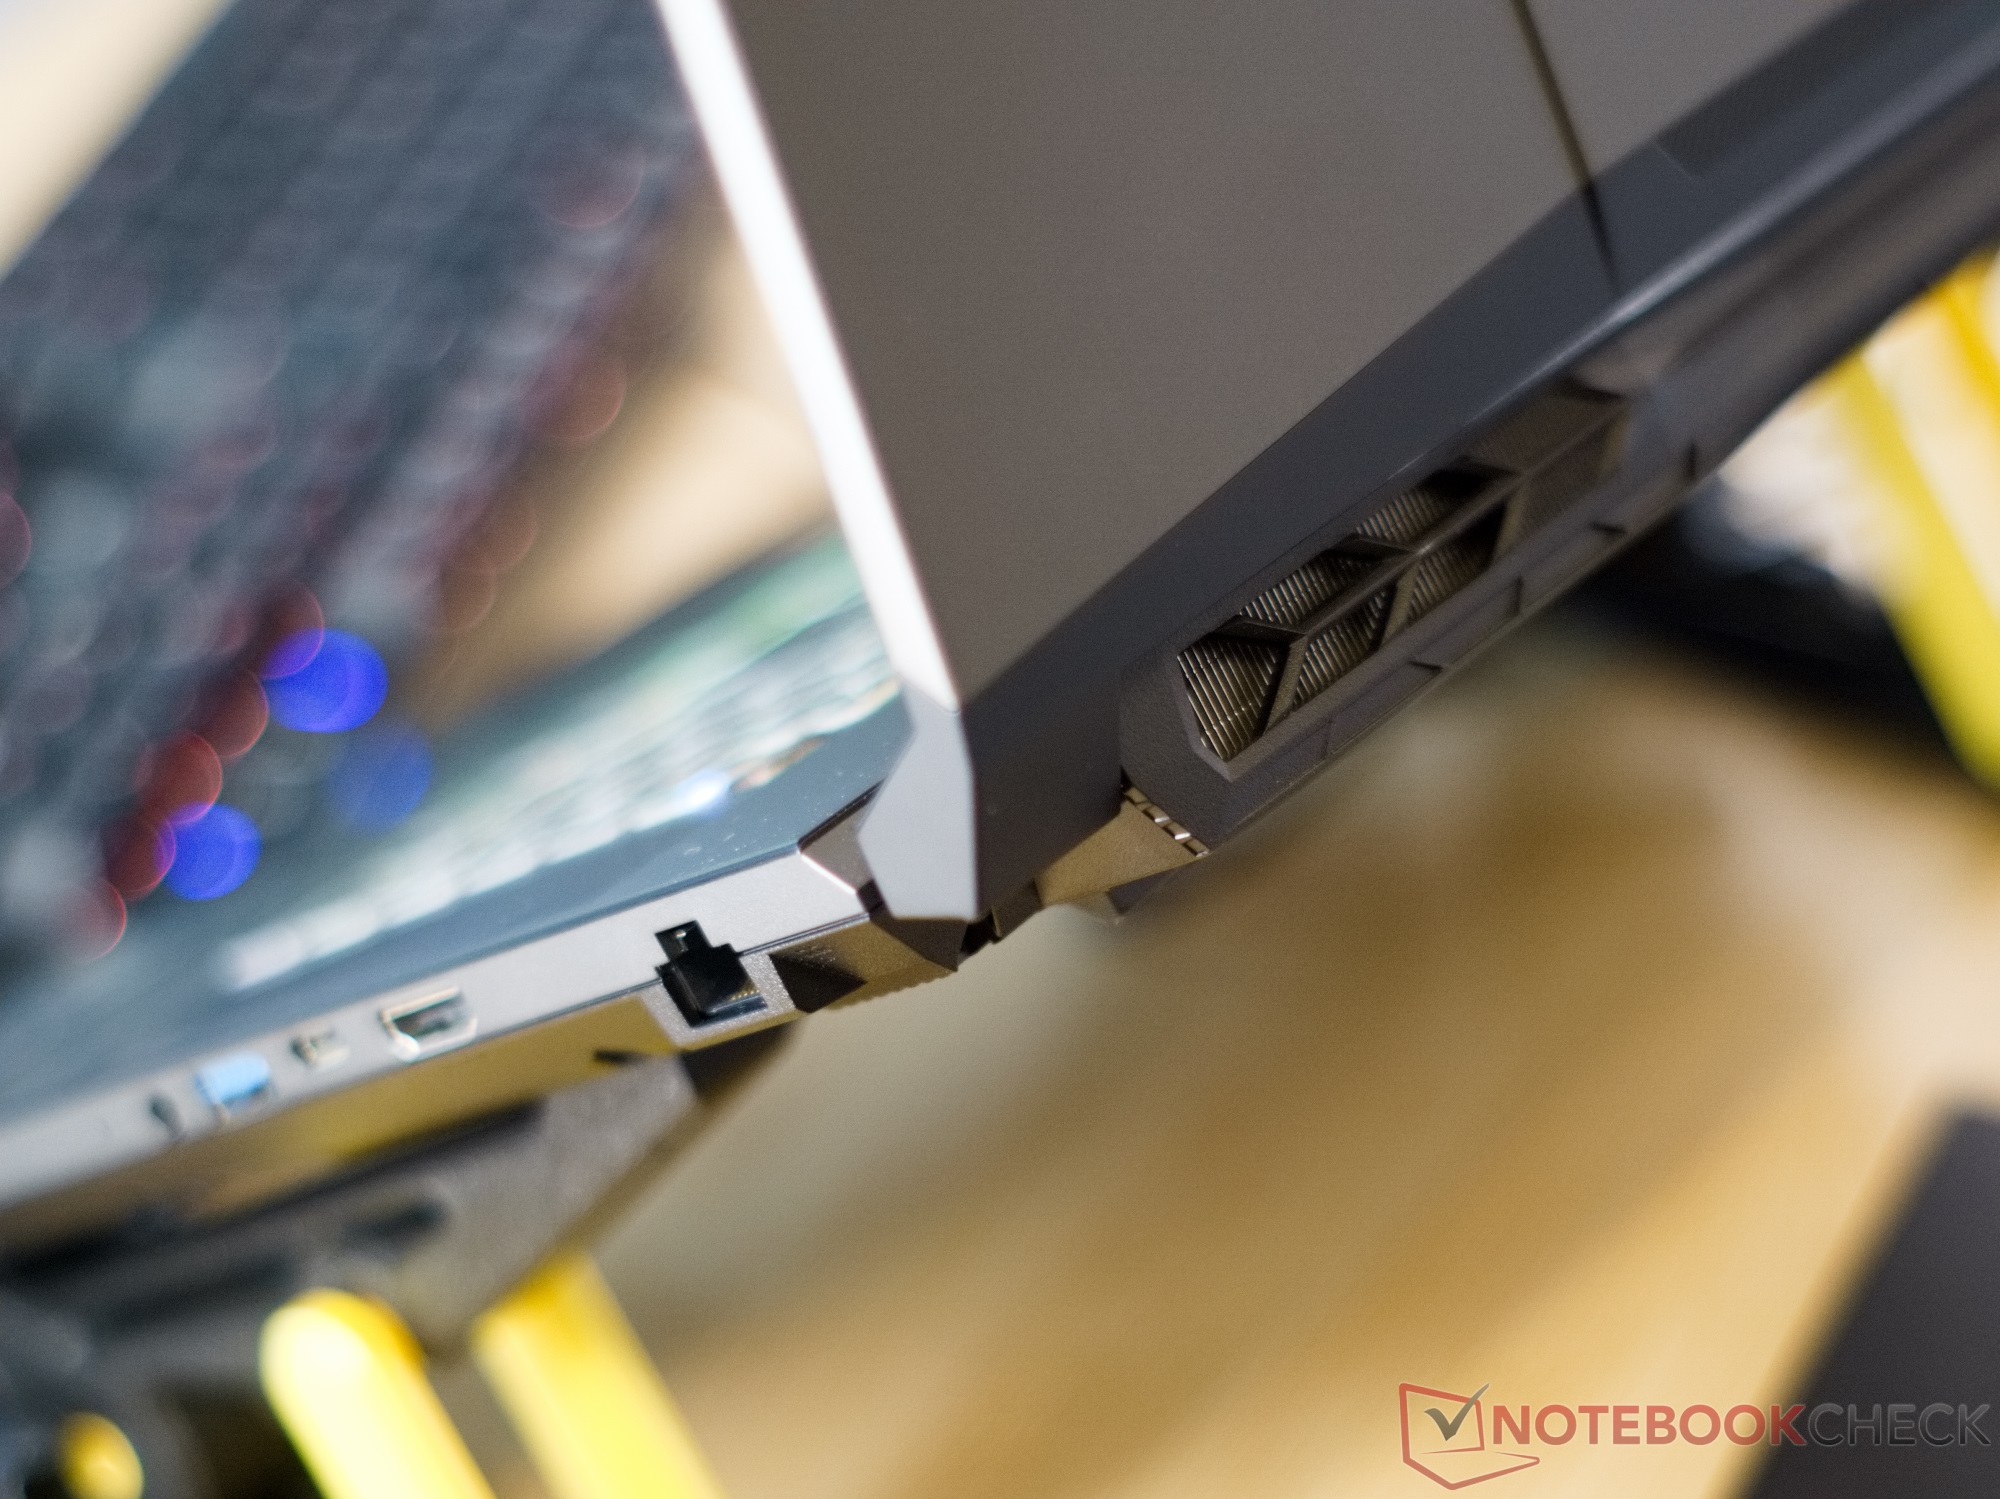
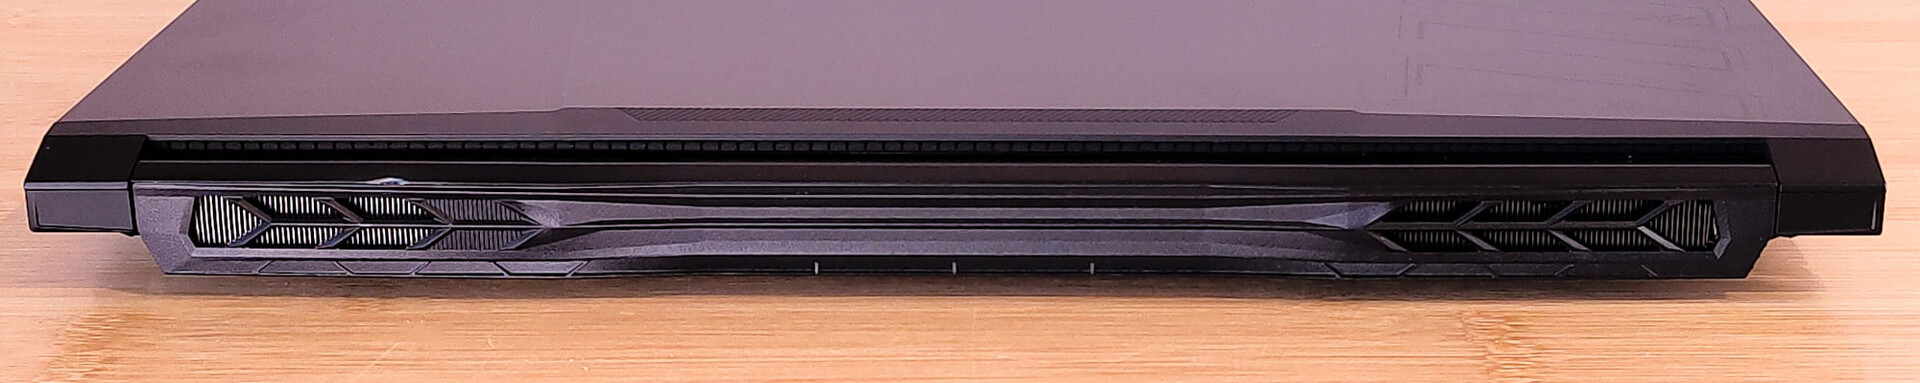
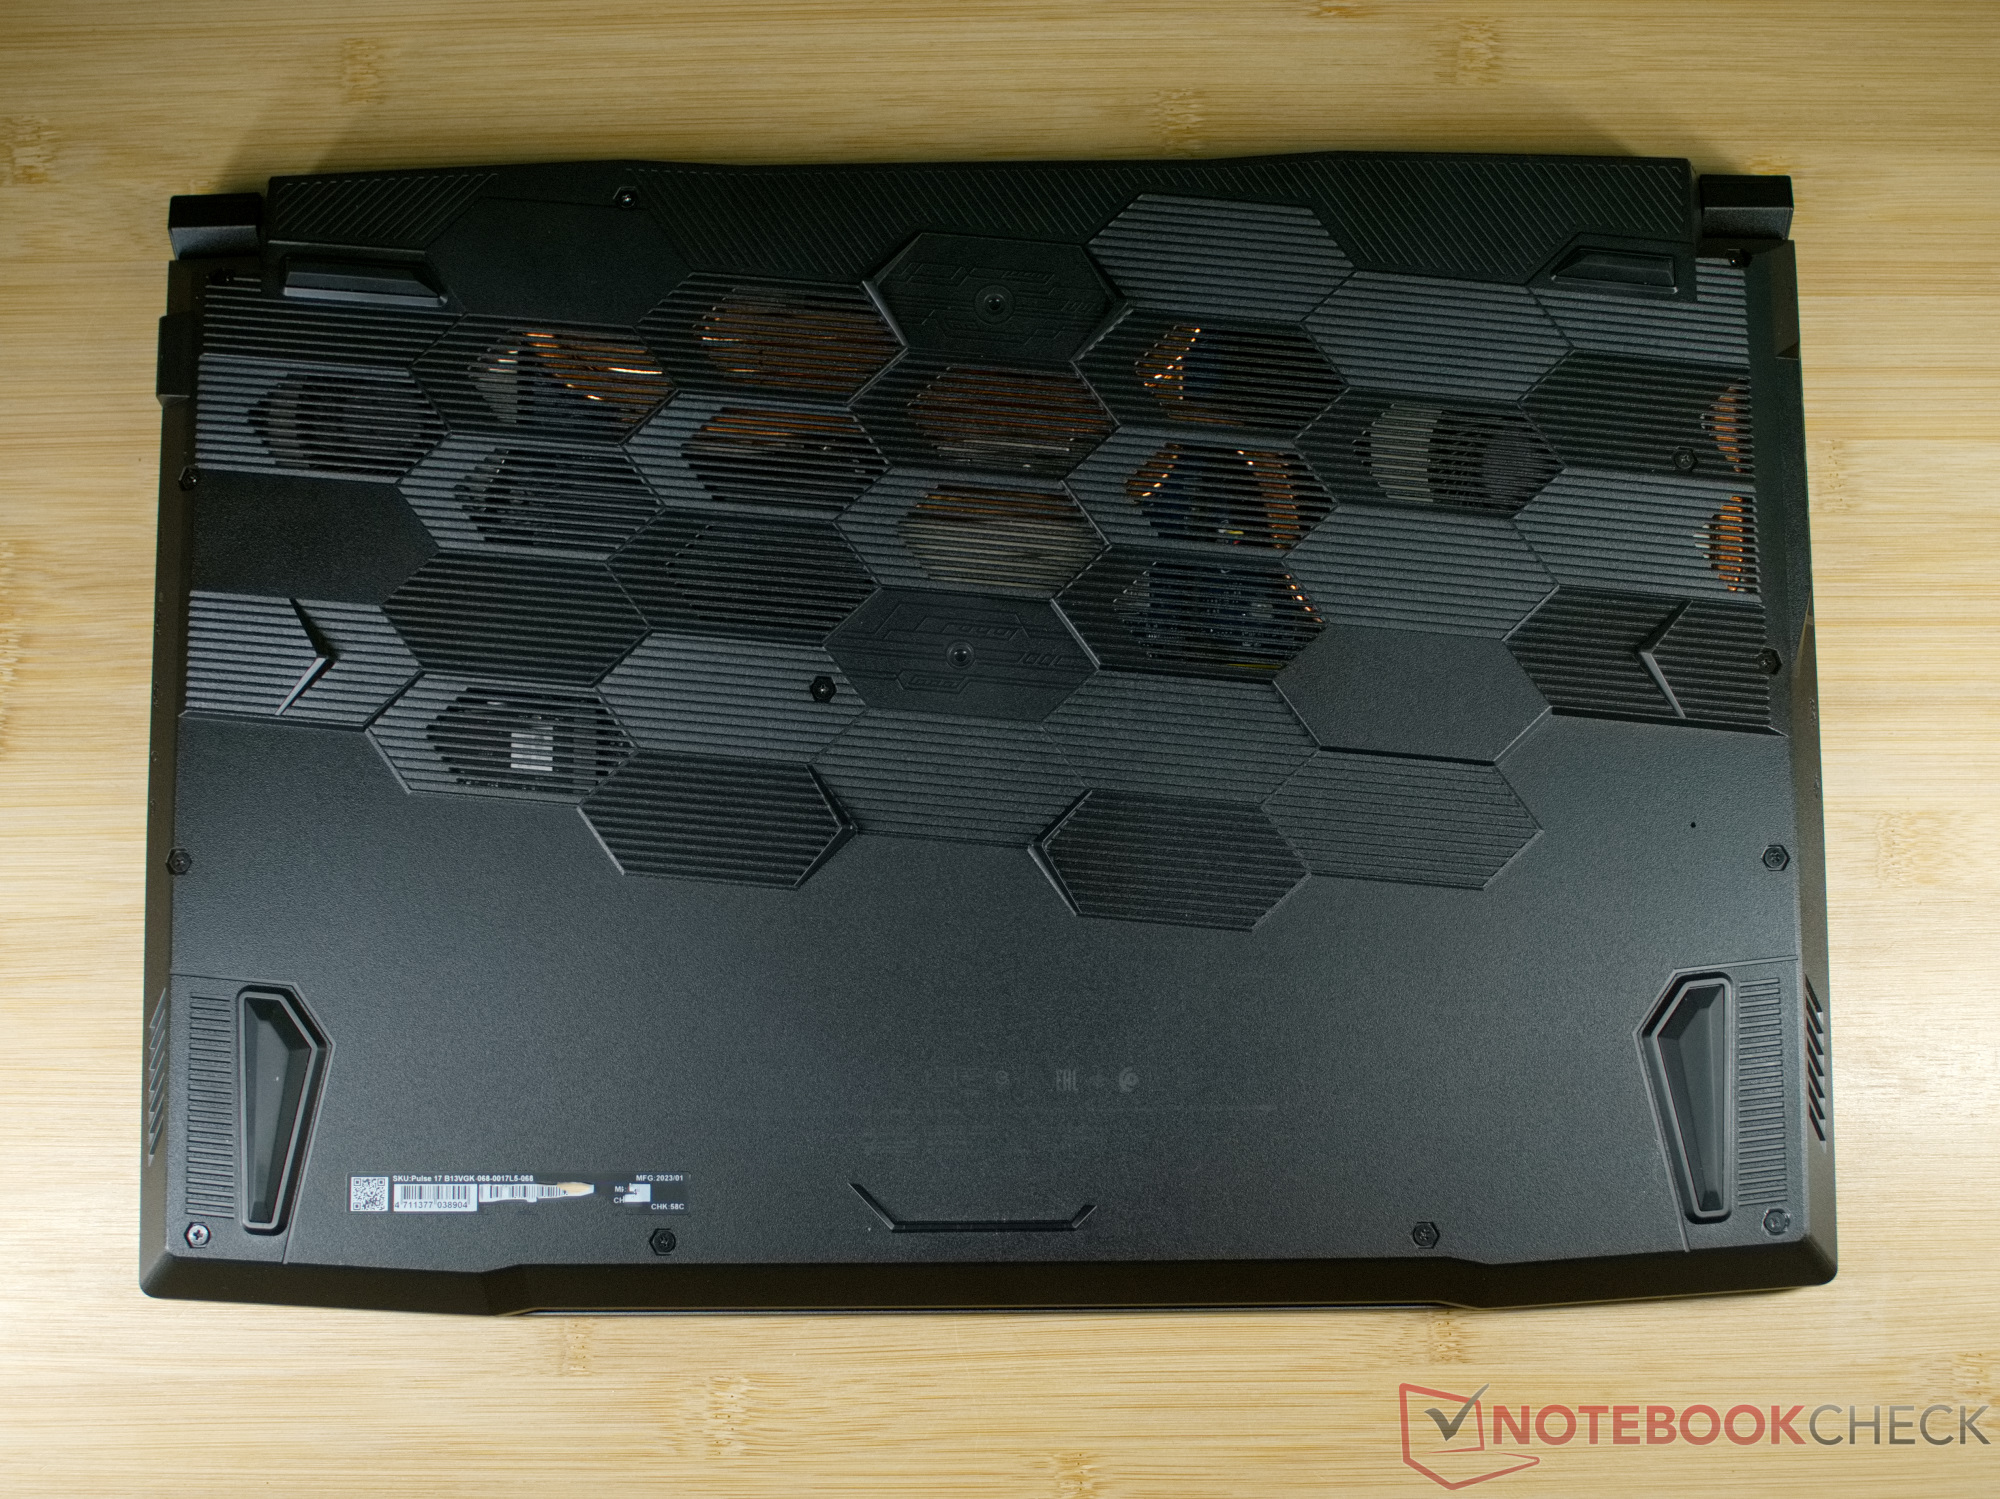
Case - Aluminum display lid with sci-fi looks
Almost all the current gaming laptops from MSI are designed with a similar concept. Again and again, MSI uses the aggressive lines on the display lid as well as the edgy hinges and the honeycomb pattern on the case bottom. In the Pulse 17, the aluminum display lid is ornamented by some edges that give an additional sci-fi feel to the laptop. Underneath the lid, the futuristic theme continues with MSI also adding many design elements here.
At the same time, the case of the MSI Pulse 17 is quite robust, but the large size of the laptop also means that it is still possible to warp or press in the plastic elements slightly. However, the Pulse 17 presents itself as a solid device overall. The large display can be opened by 180° and is able to hold its position to some extent. The hinges are almost too easy to move, and some slight vibrations or tapping on the display will already move it a bit.
With a weight of 2.7 kg (~6 lb), the MSI Pulse 17 is the lightweight among its similarly sized competitors. Only the predecessor model weighs less. Aside from that, the current gaming laptops in our comparison differ fairly little in terms of how they fill up the bag.
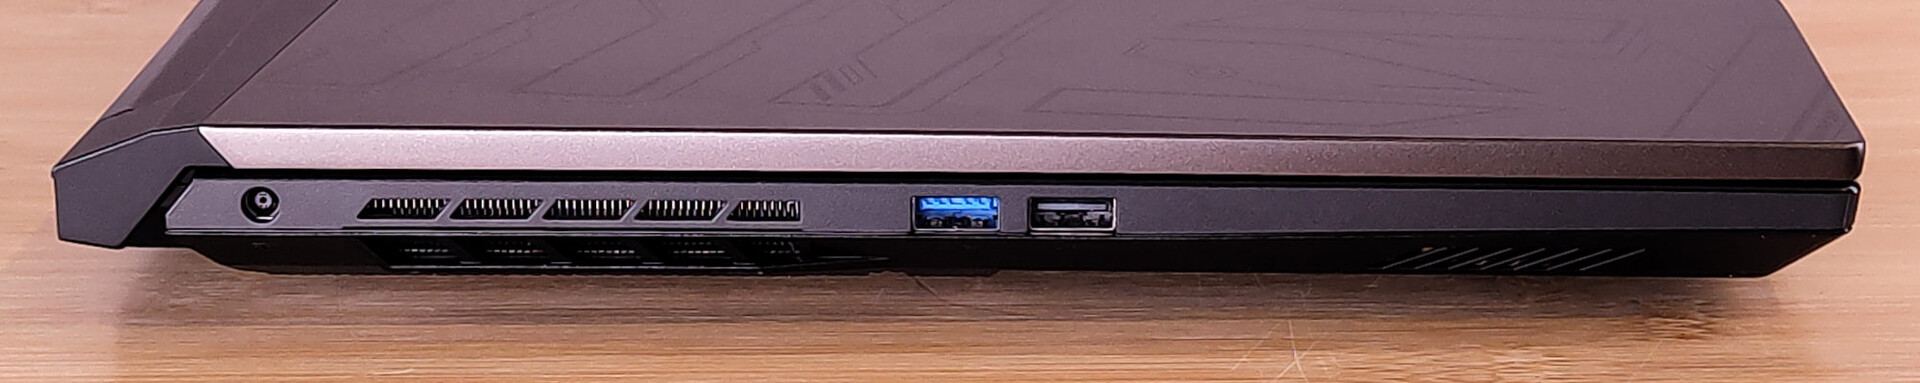
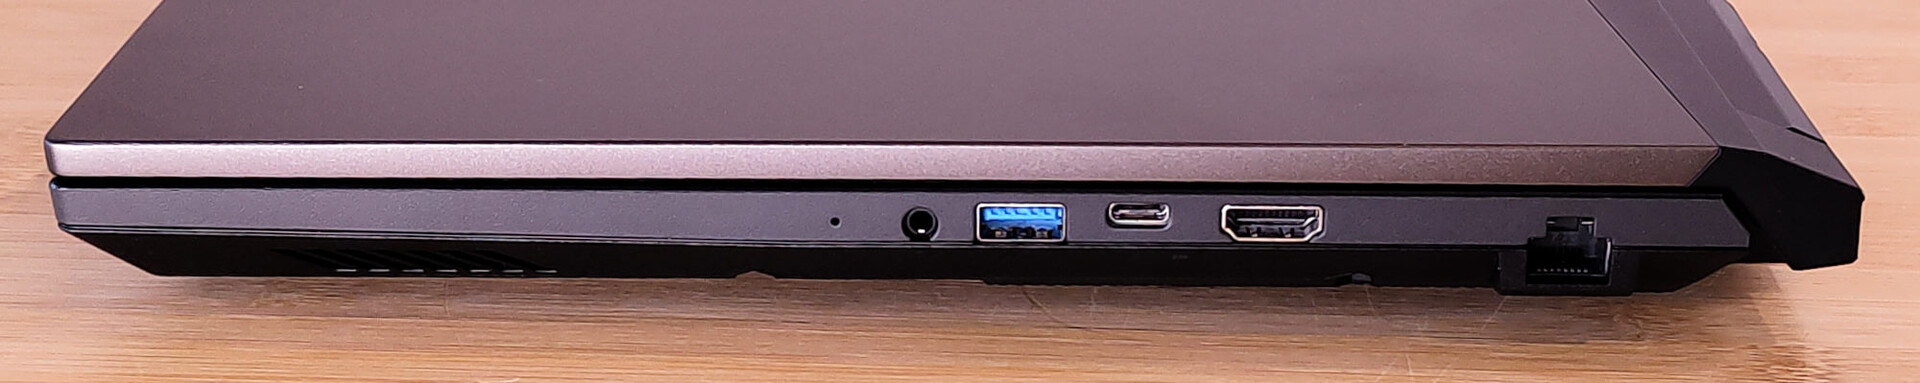
Equipment - No Thunderbolt and only USB 3.2 Gen 1
The fact that the Pulse offers two USB connections on each side is a clever design, allowing both left and right handed users to keep their cables out of the way. One of the USB ports on the right side is a USB-C connection, but unfortunately it only supports data transfer and DisplayPort.
Communication
With Gigabit LAN and WiFi 6 from the Intel AX201 module, the Pulse 17 isn't really up to date in terms of network technology. On the other hand, our test unit shows that high and stable transfer speeds are also possible in the 5-GHz network.
Webcam
The webcam of the MSI Pulse 17 is also anything but modern. It offers HD resolution and produces rather blurry images with strong chromatic deviations at contrasting edges.


Accessories
Aside from the usual paperwork, a sticker with the red dragon, and the charger for the laptop, we don't find any additional accessories in the box.
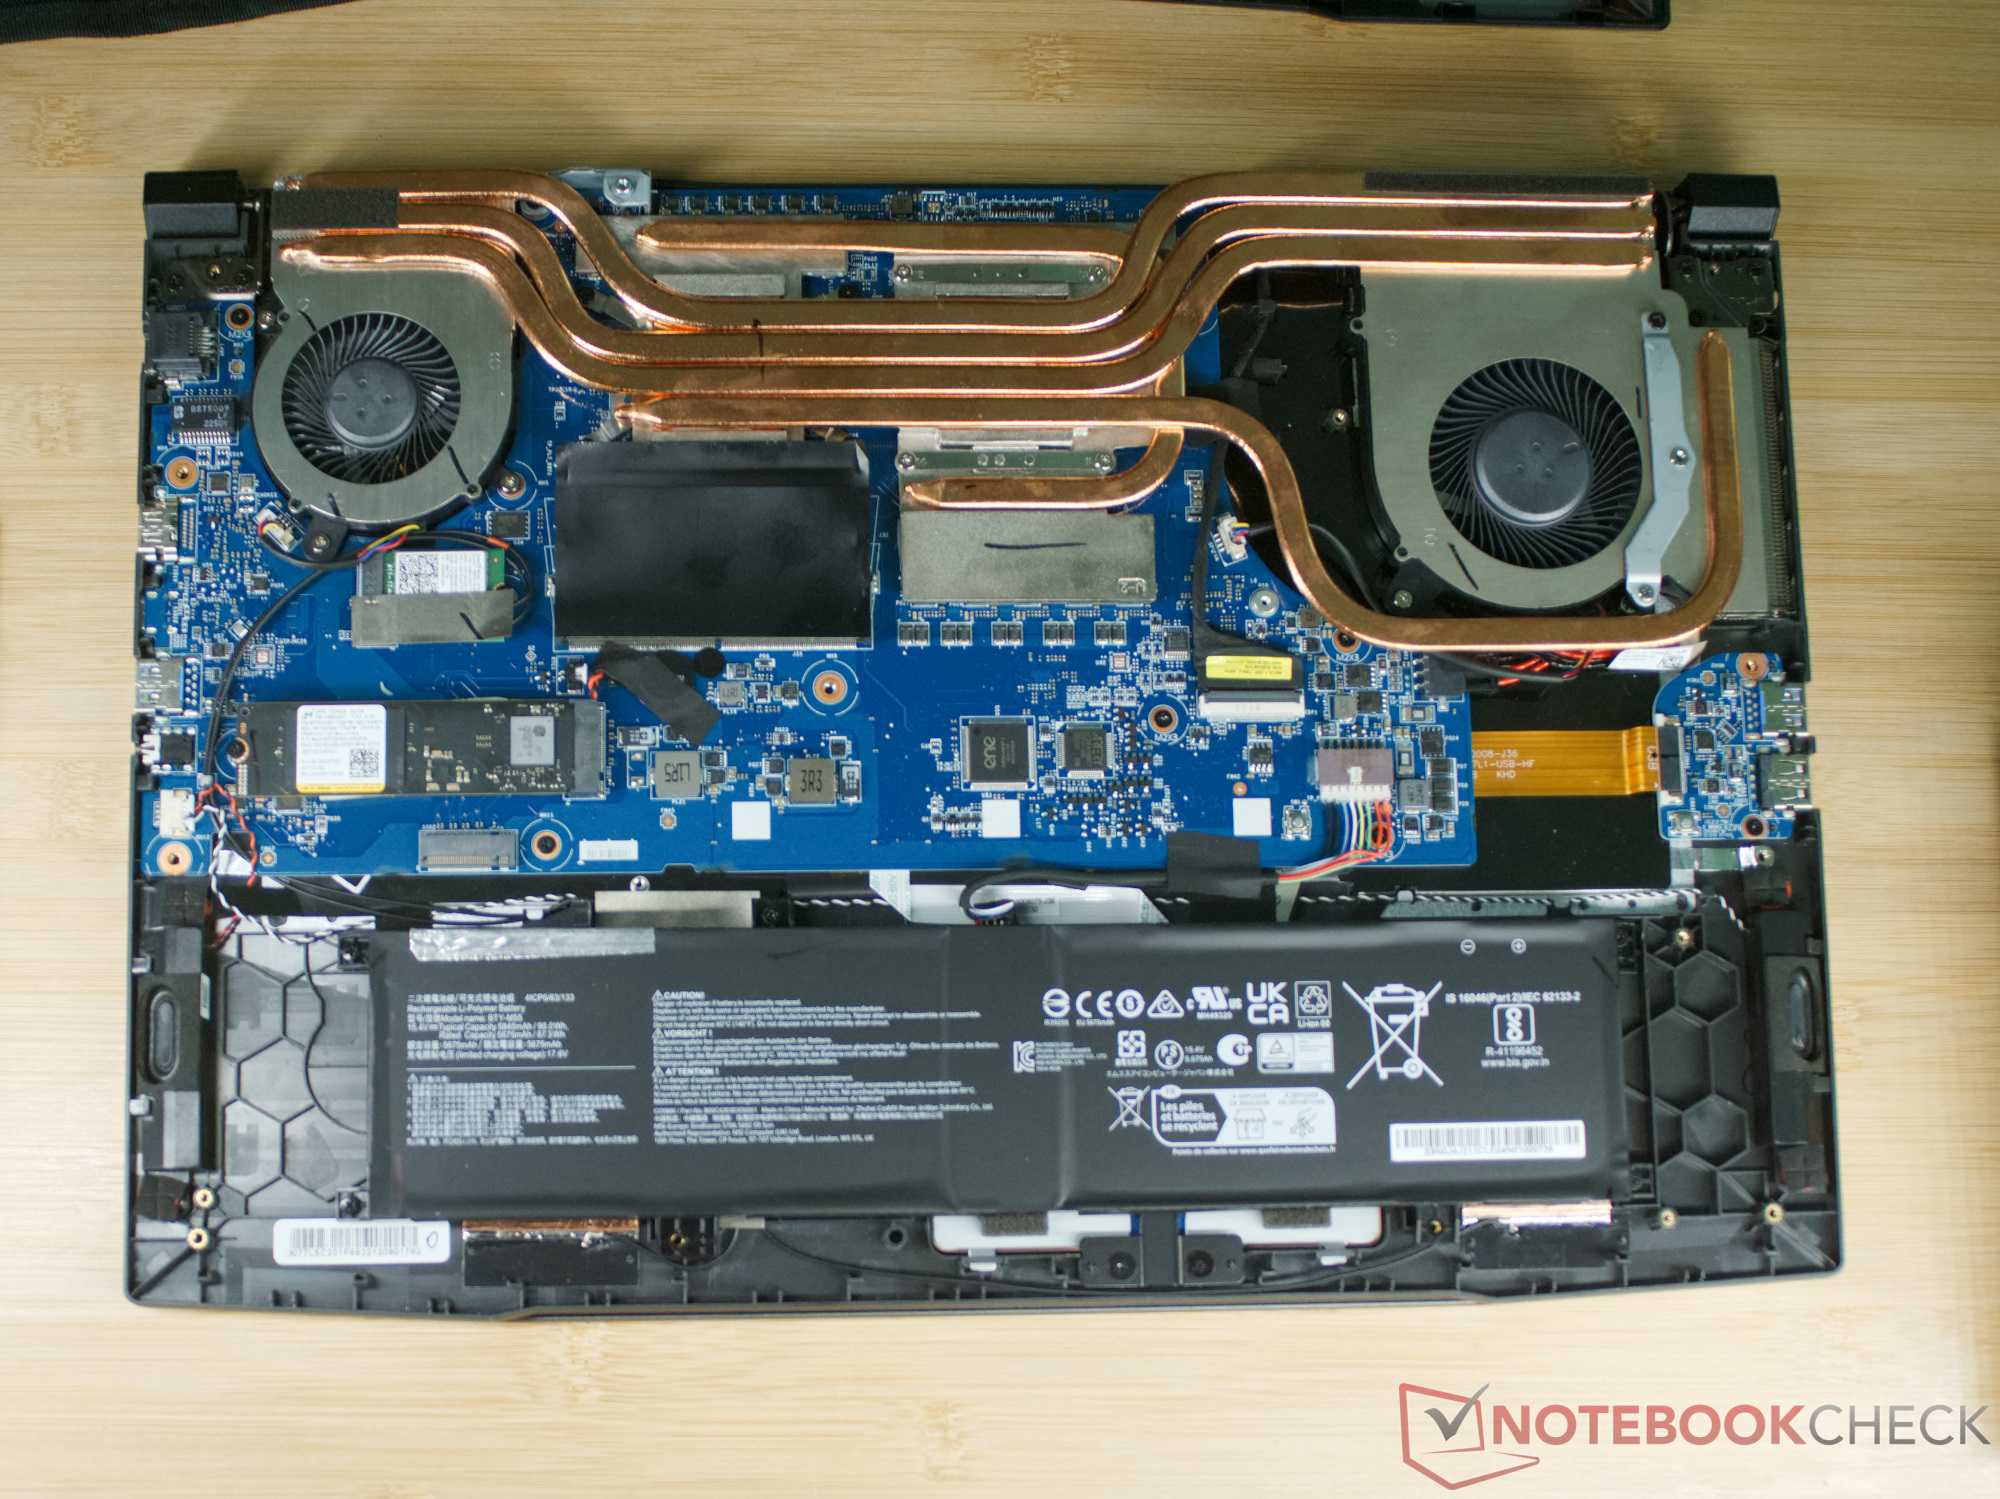
Maintenance
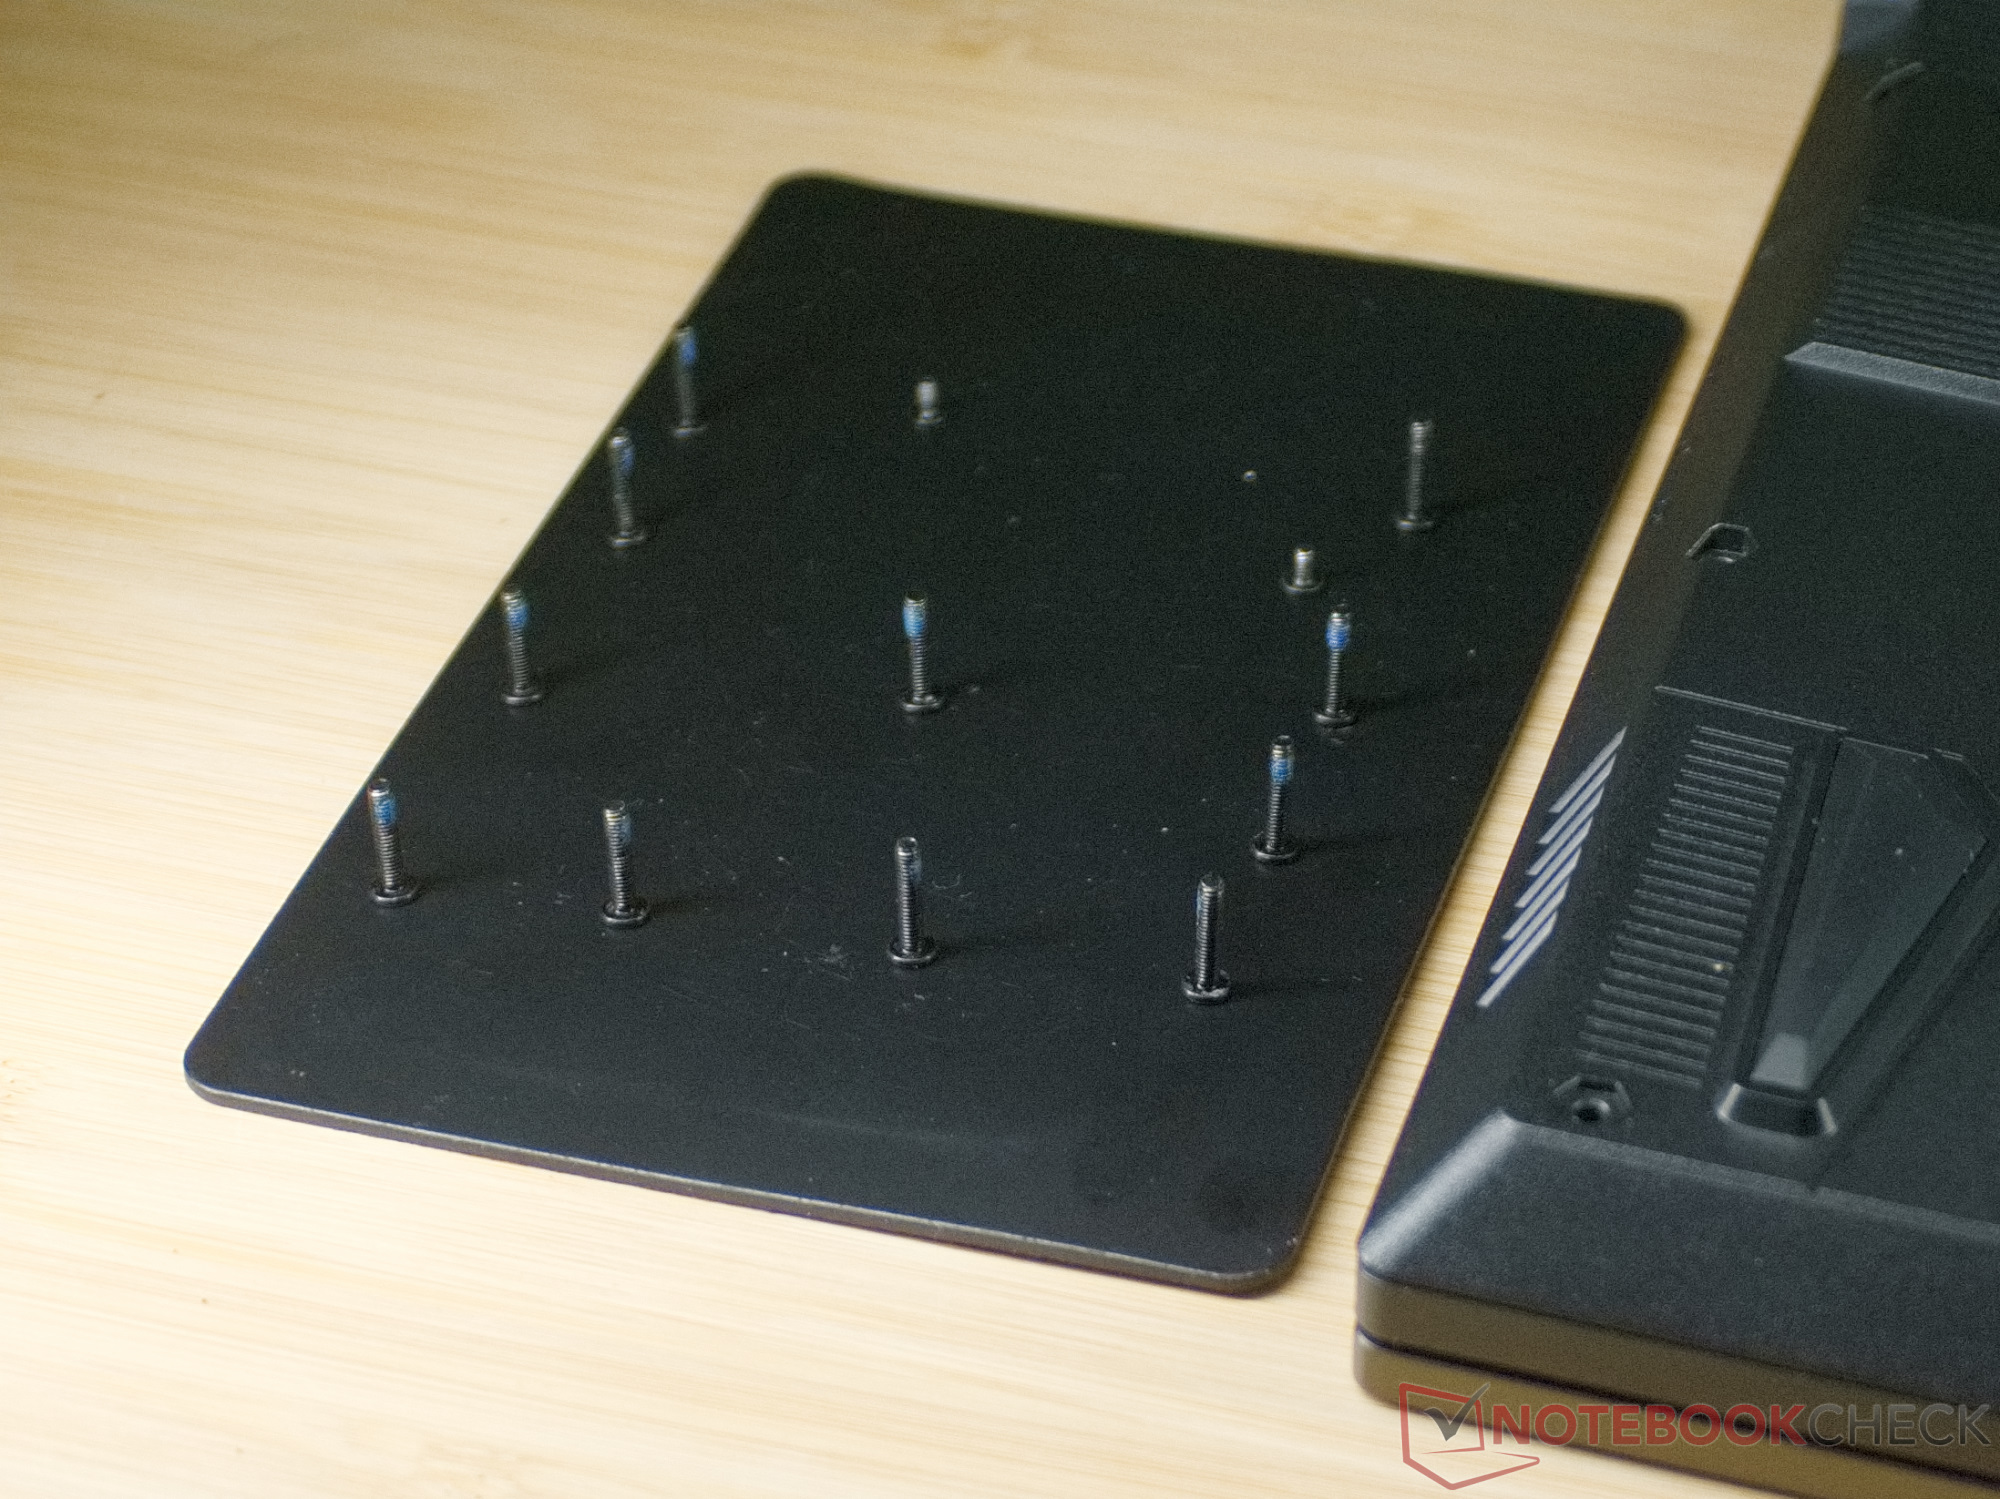
One of the 13 Phillips PH0 screws that hold the bottom of the case is protected by a sticker seal in our test unit. Even though MSI emphasizes repeatedly that this is not relevant for the warranty, some vendors might protest if the seal is broken in a warranty case.
When removing the 13 screws, you should also mark their position, since two of the screws are significantly shorter. The bottom cover is also secured by several clips, but those can be opened easily with a plastic prying tool, allowing you to lift off the bottom cover afterwards.
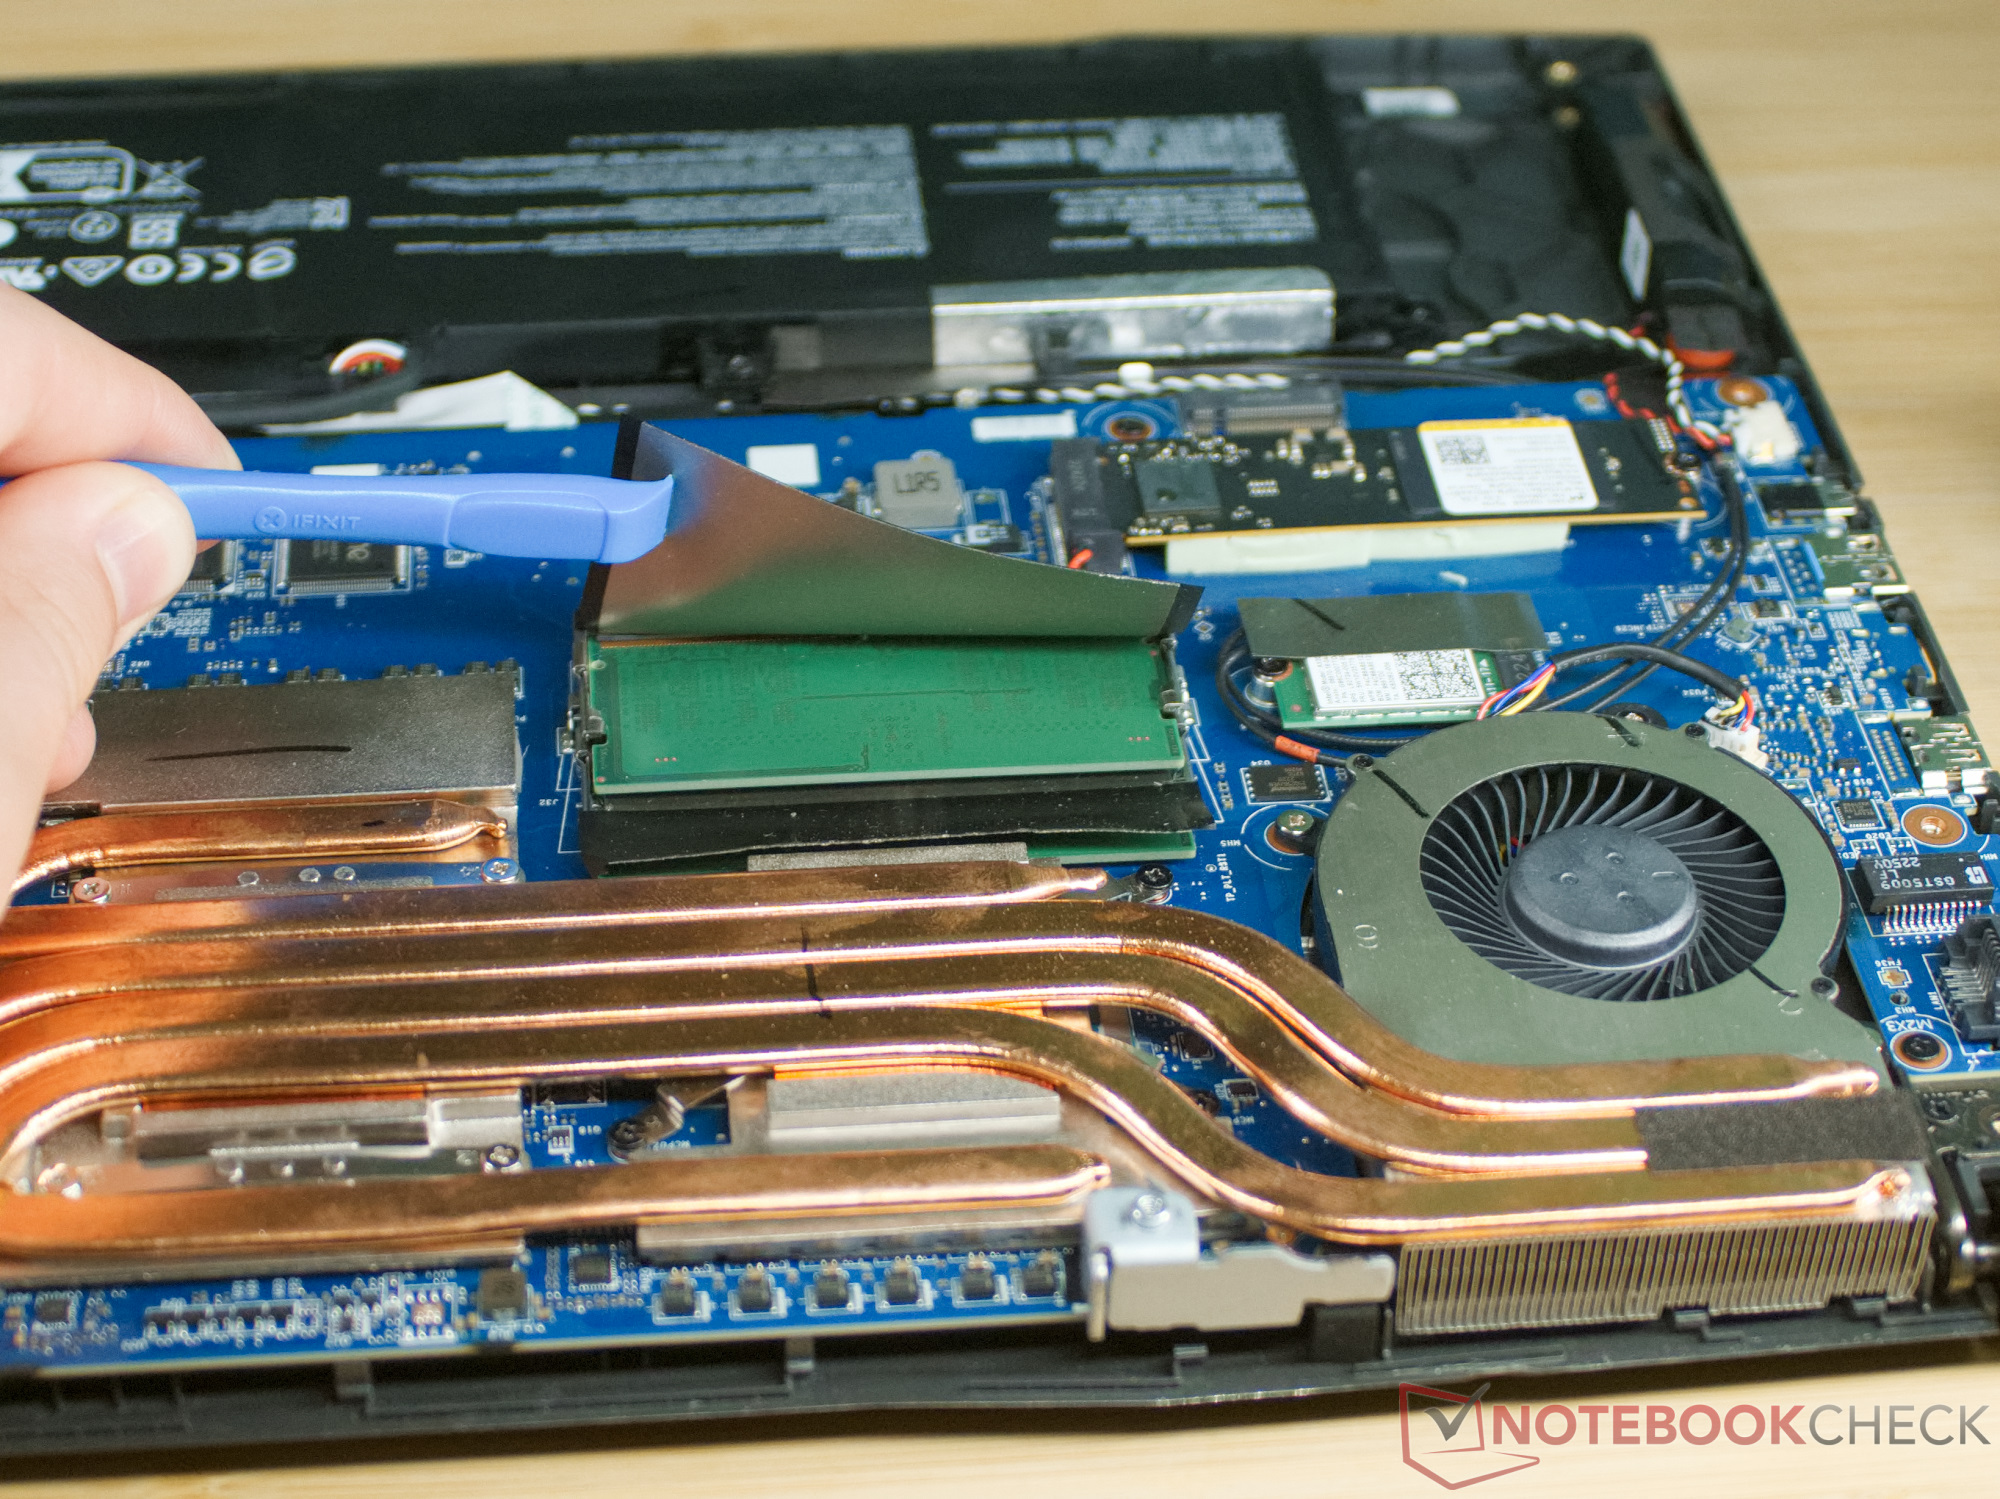
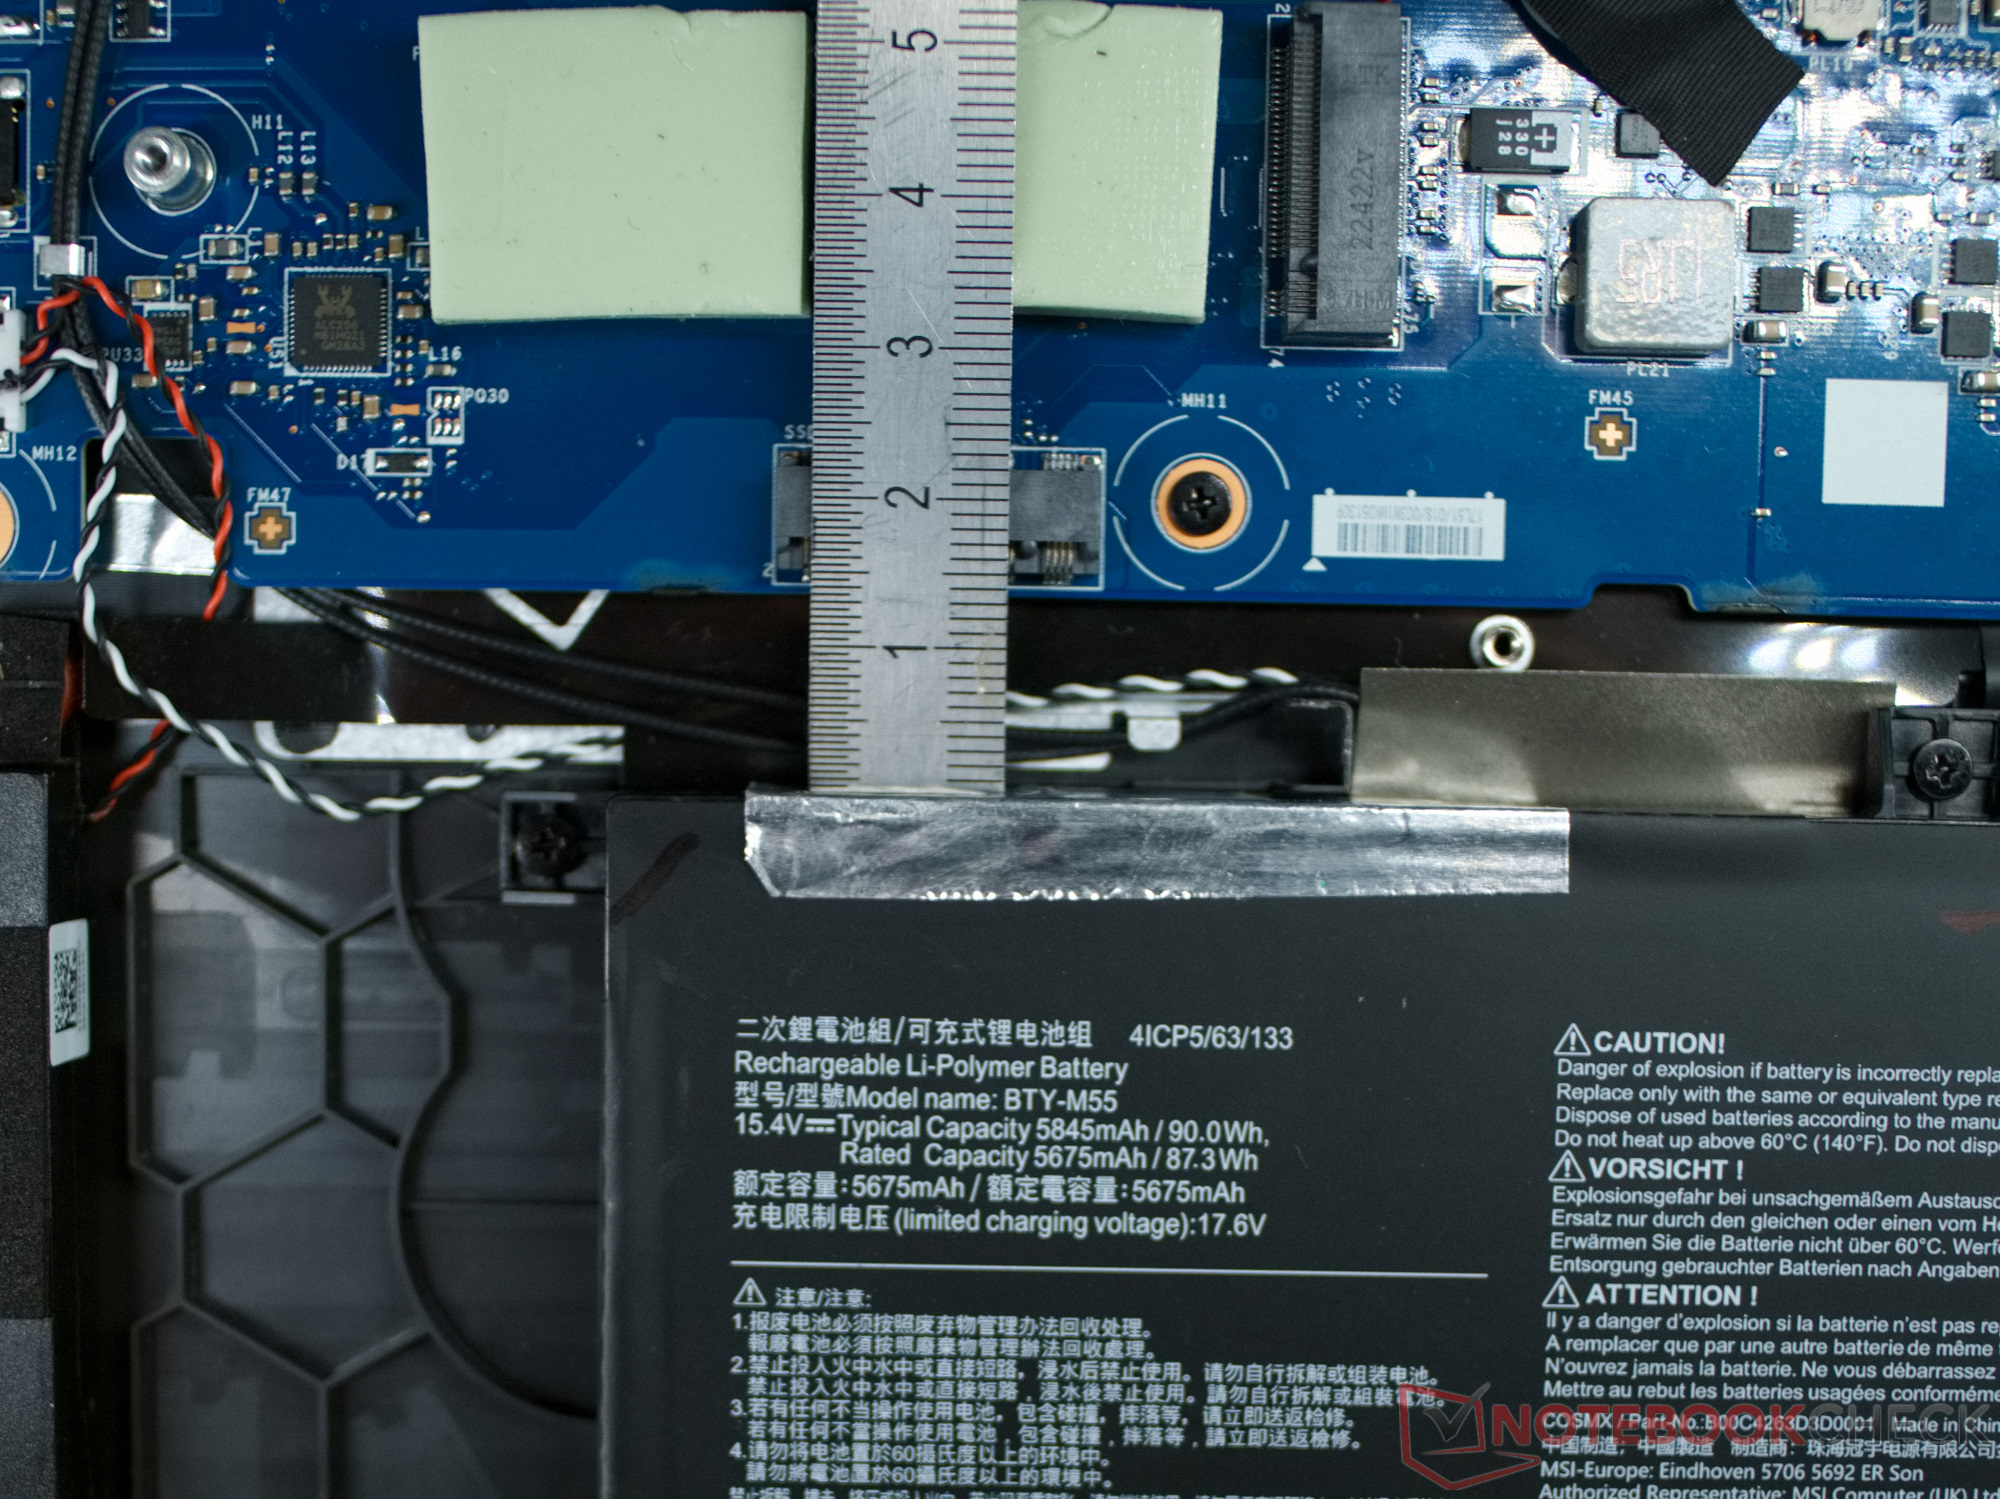
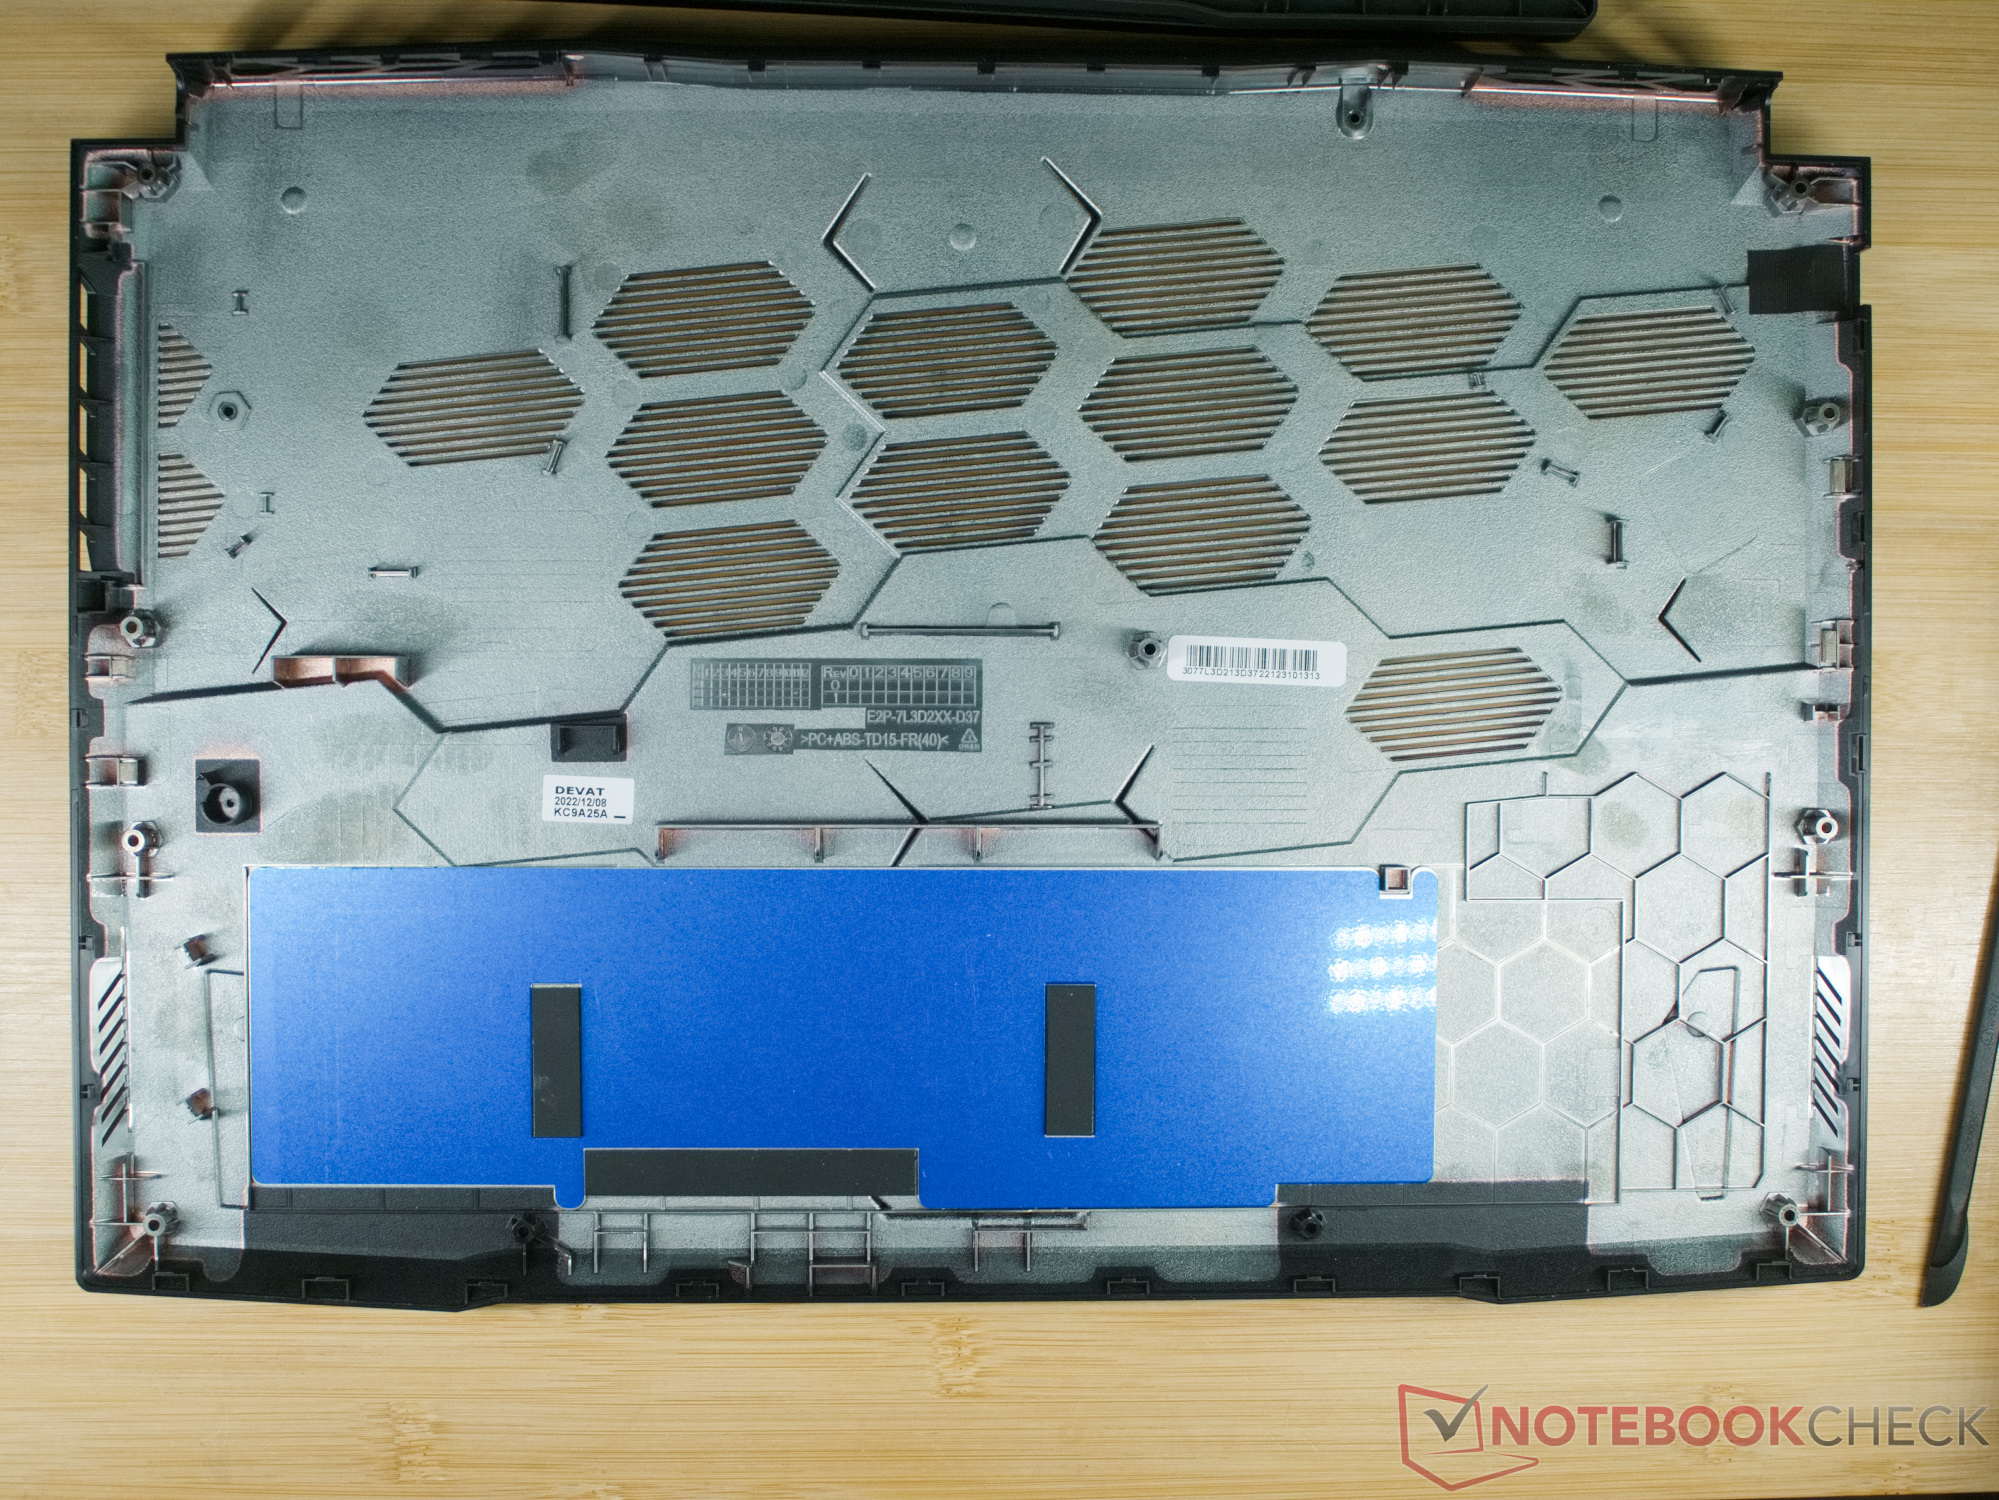
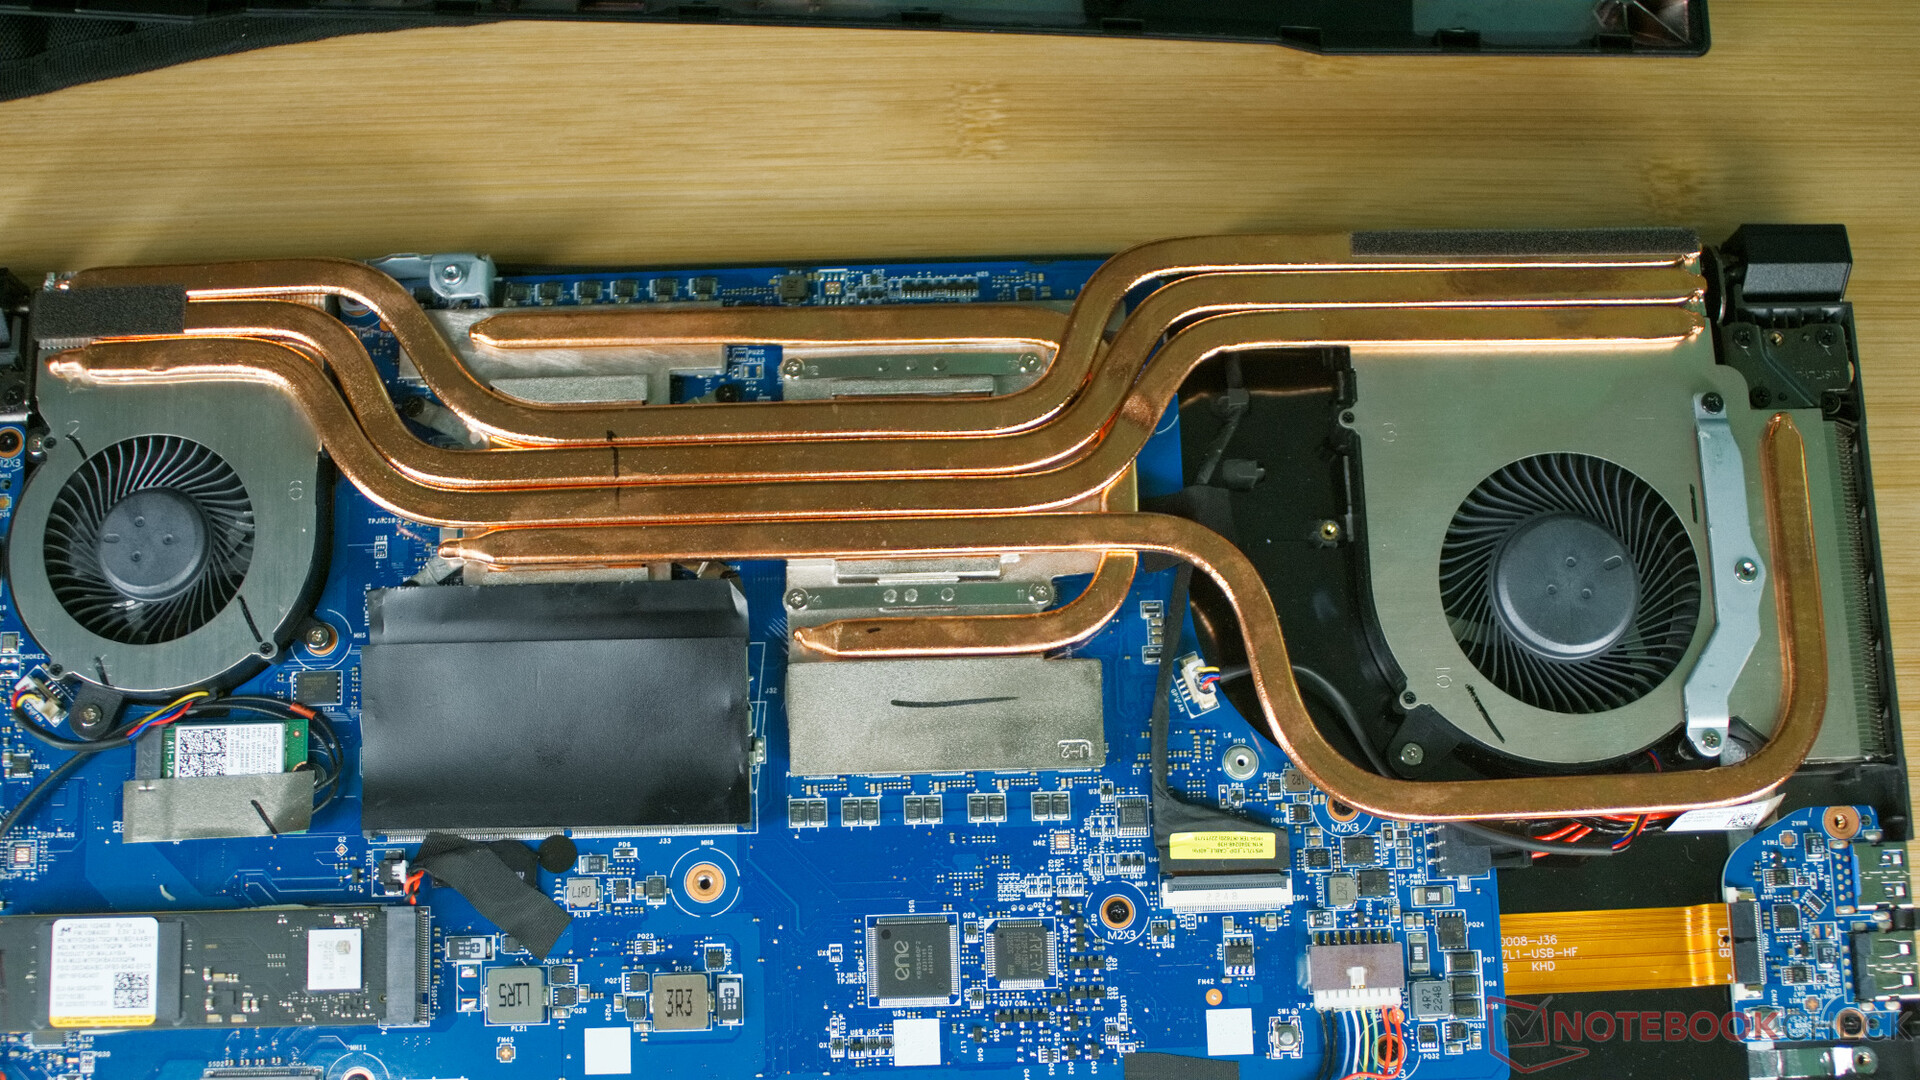
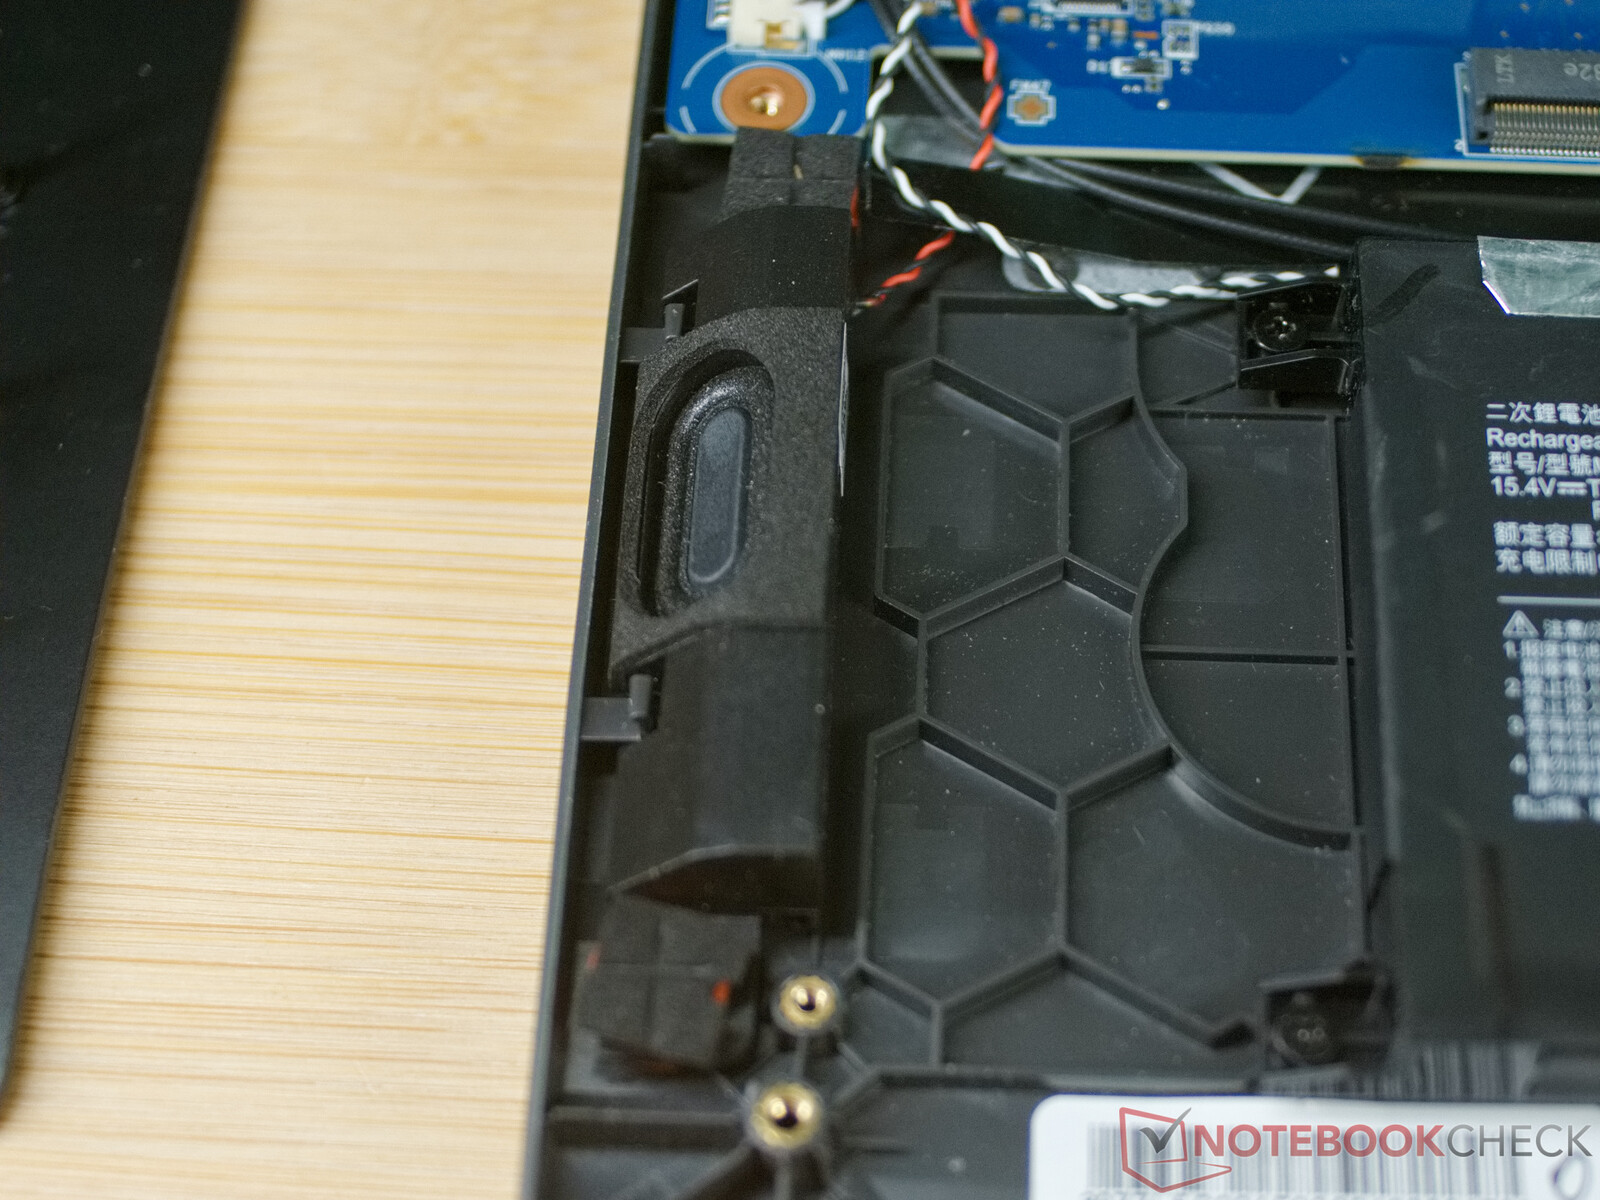
Inside the laptop, we find a fairly modular construction, so that the RAM, NVMe SSD, and WLAN/Modul can be replaced quickly. The battery, speakers, and the board with the two USB connections can also be replaced easily. However, those who regularly like to remove the dust between the fans and cooling fins have to remove the whole cooling system to be able to do this.
The laptop also offers a second M.2 PCIe slot, but unfortunately that is blocked by the battery. So you can probably only install a second SSD with a solution using adapters and cables.
Warranty
MSI offers a 24-month warranty to buyers in Europe.
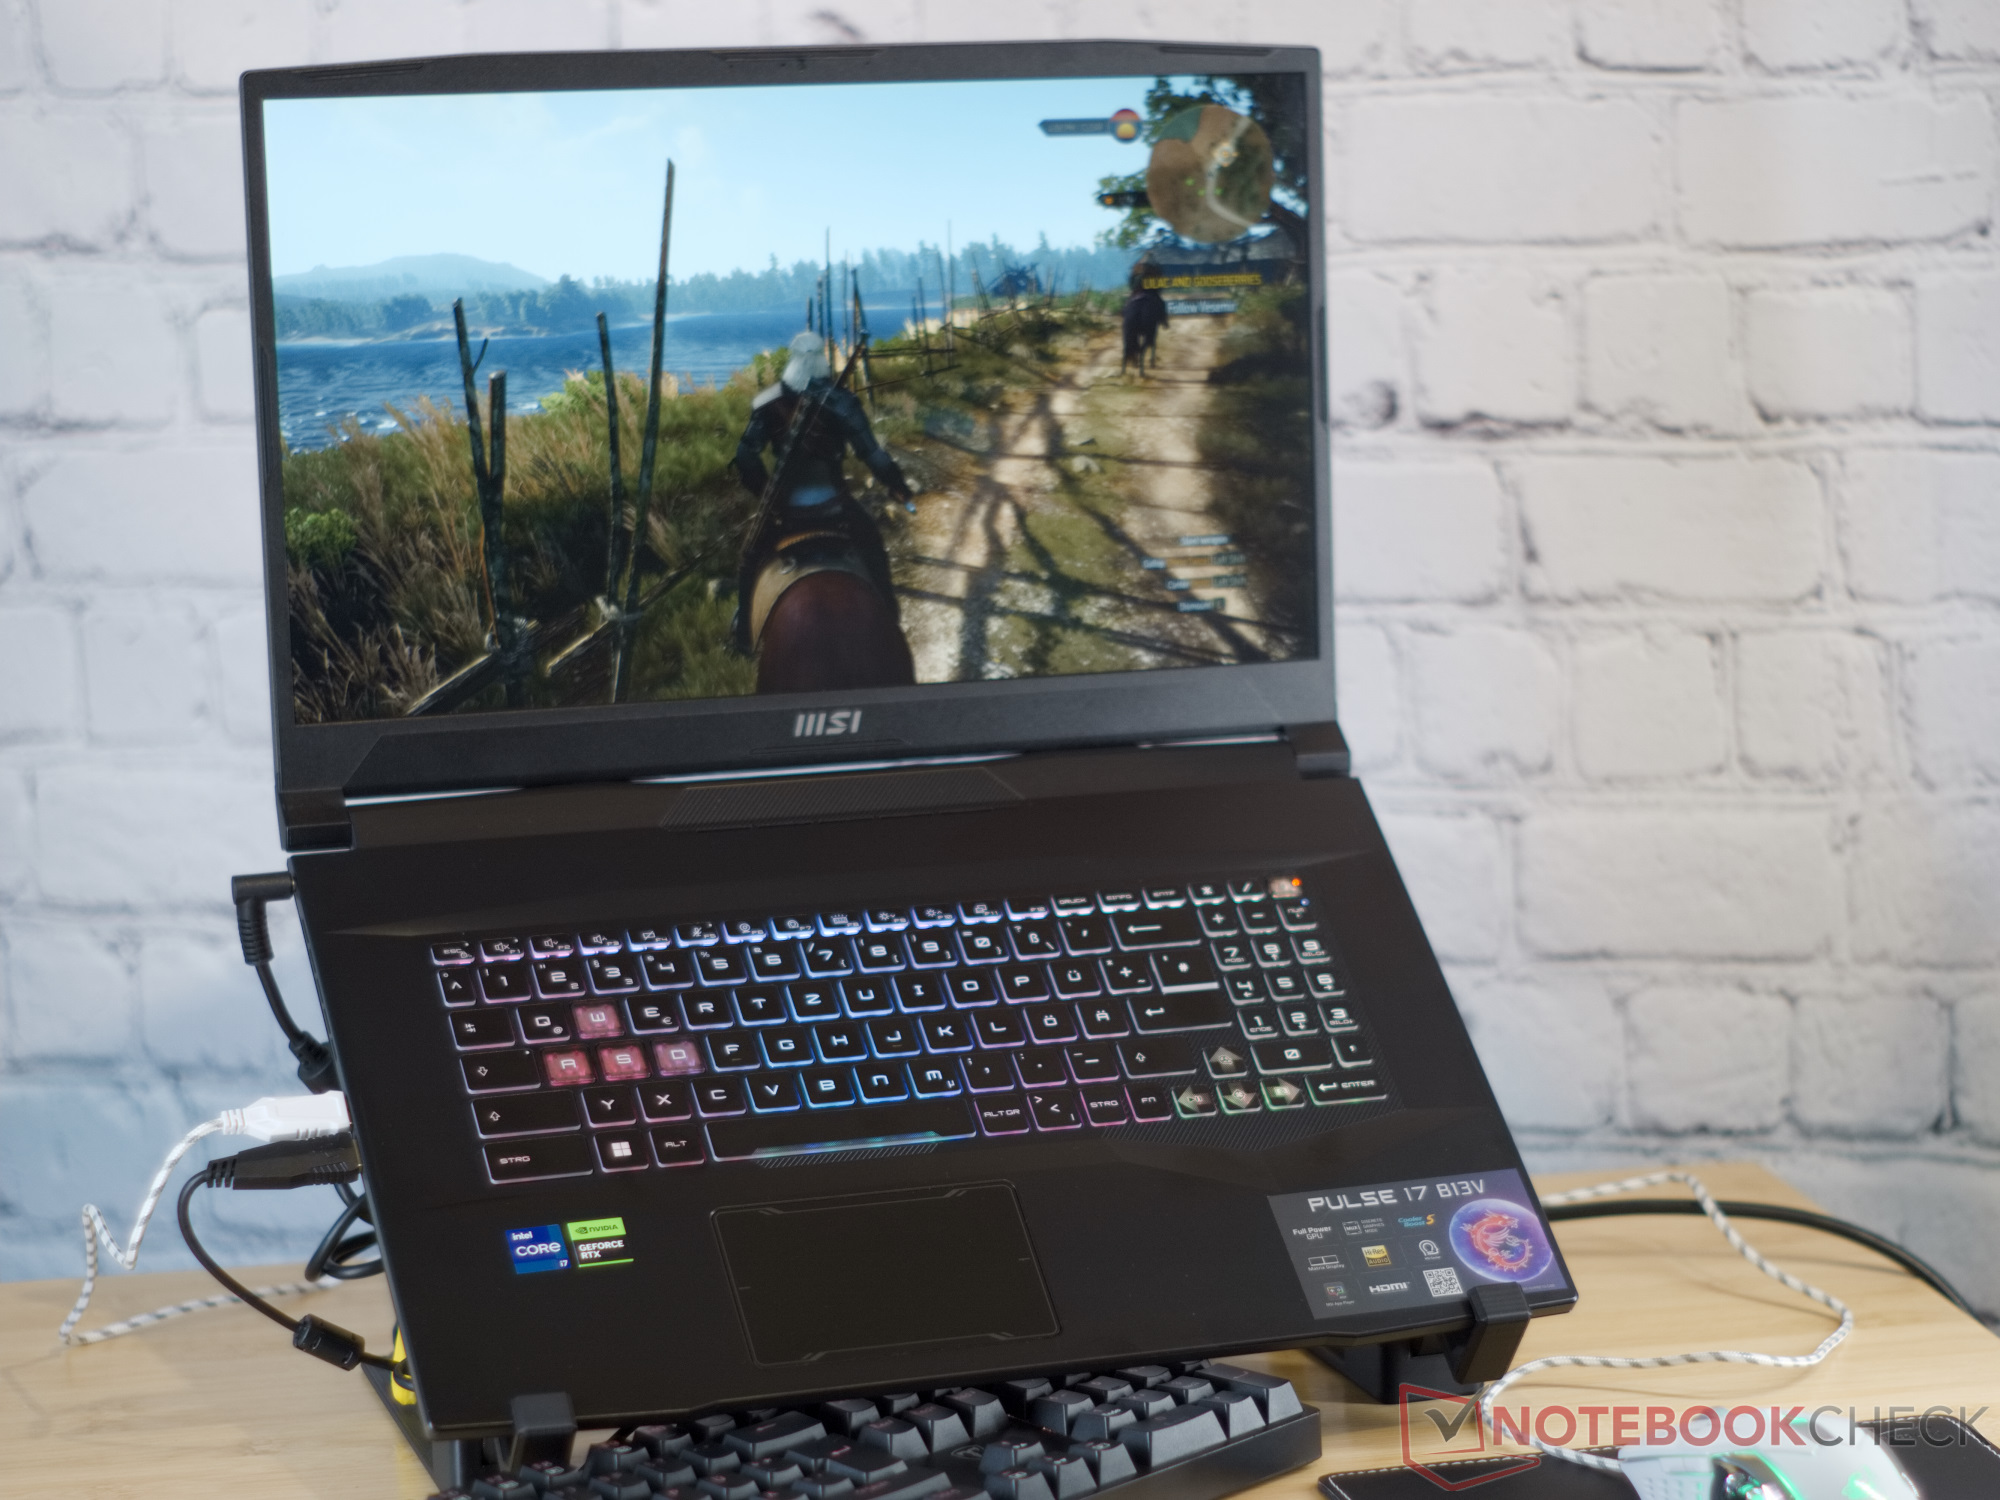
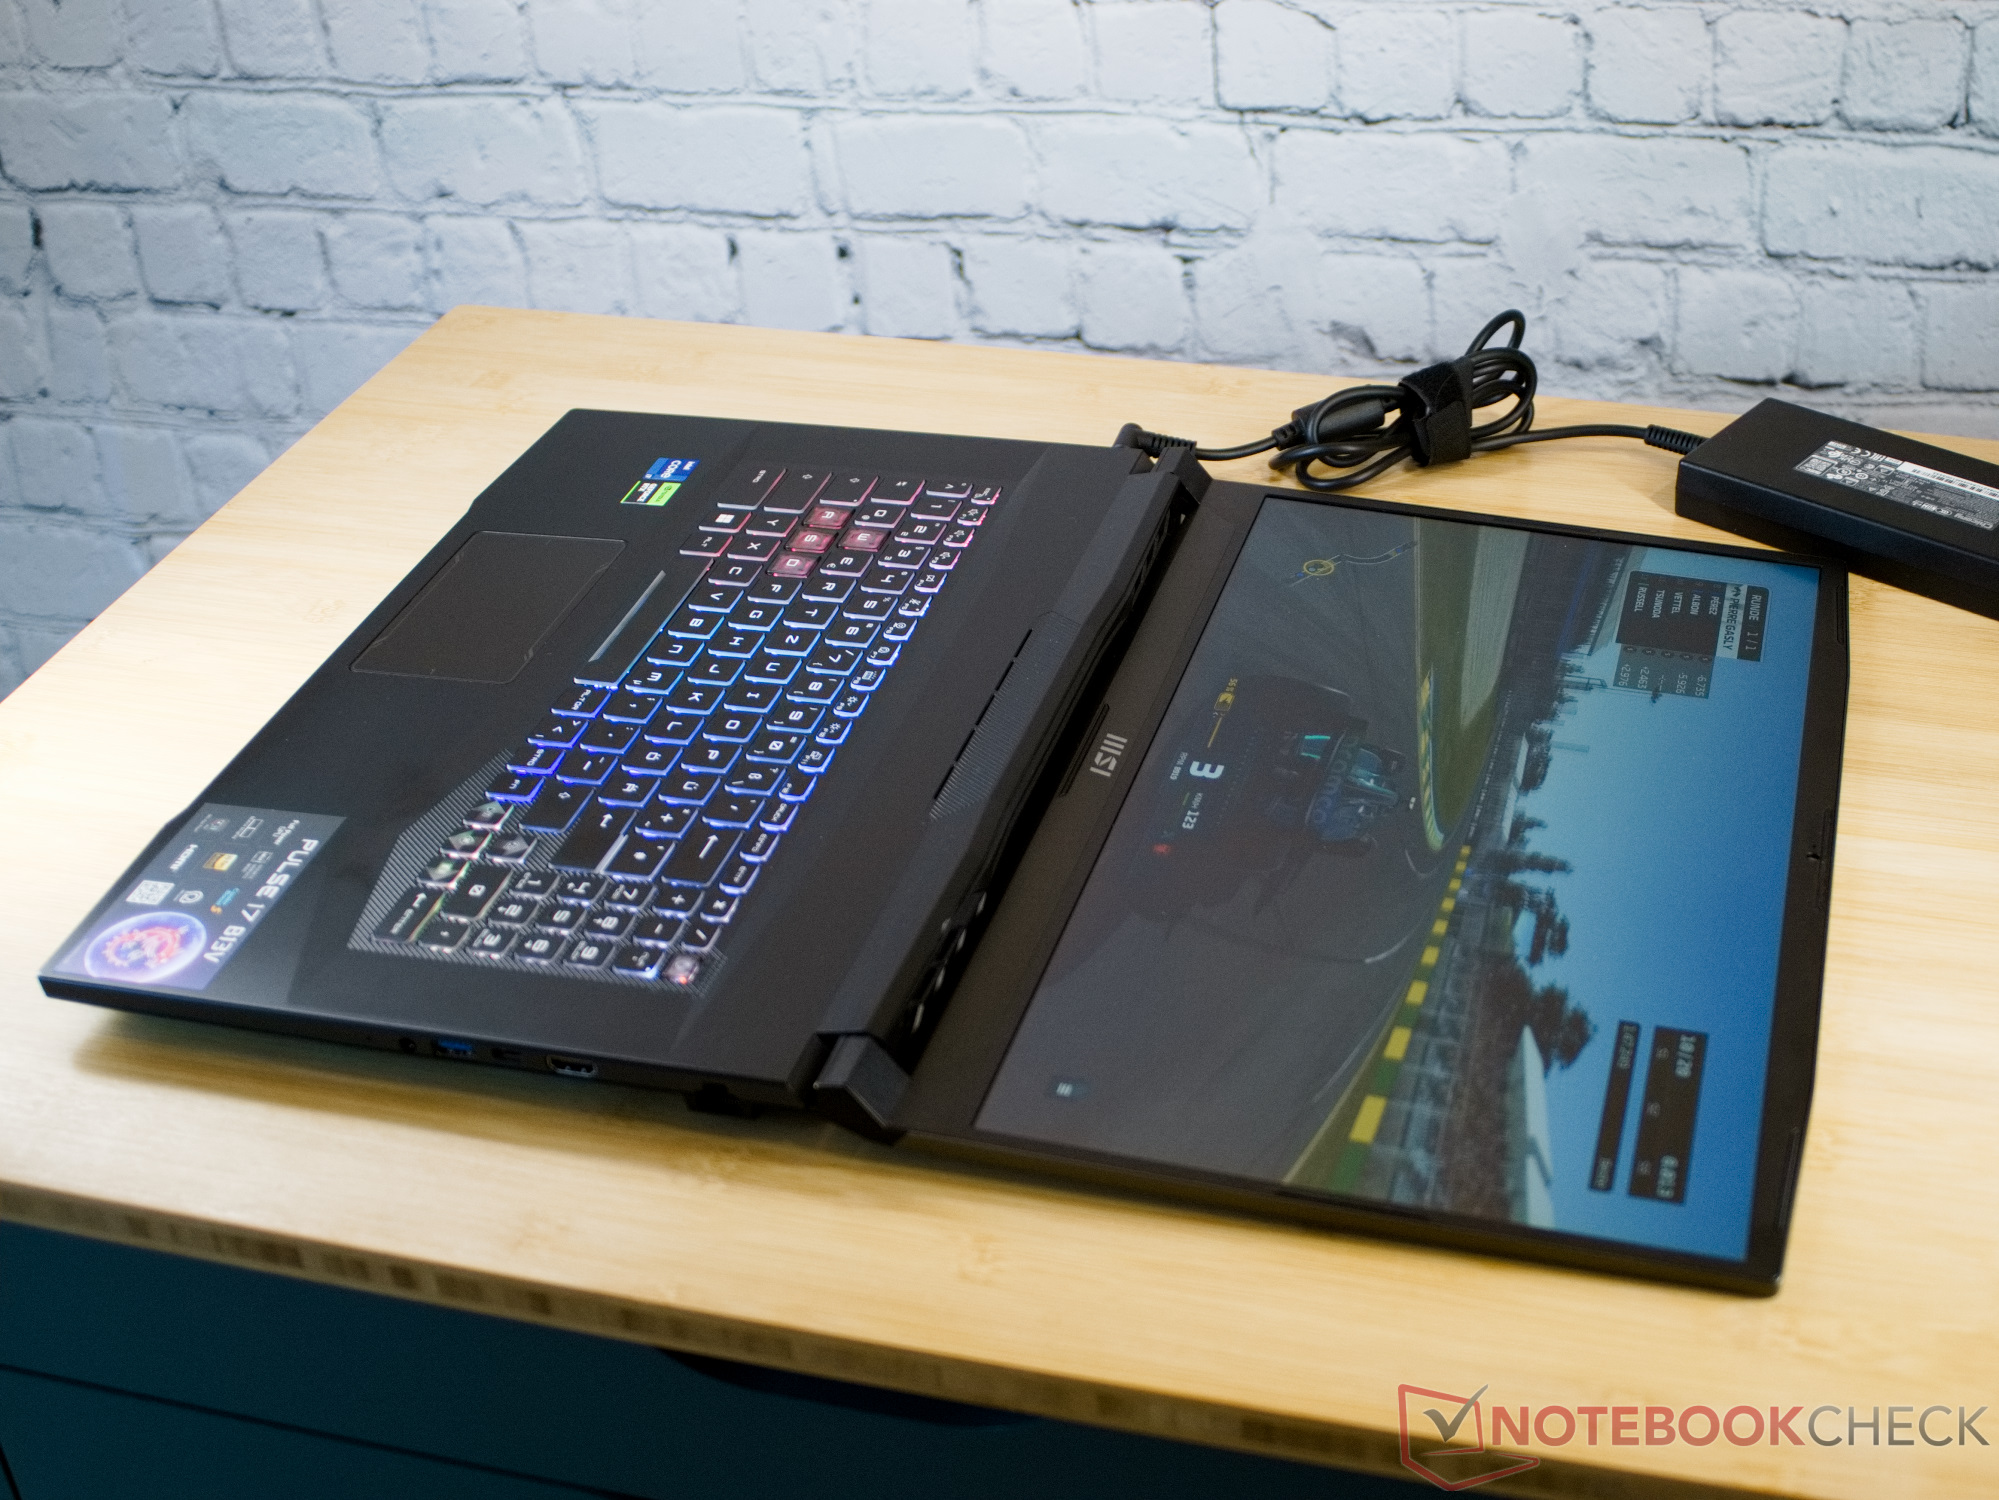
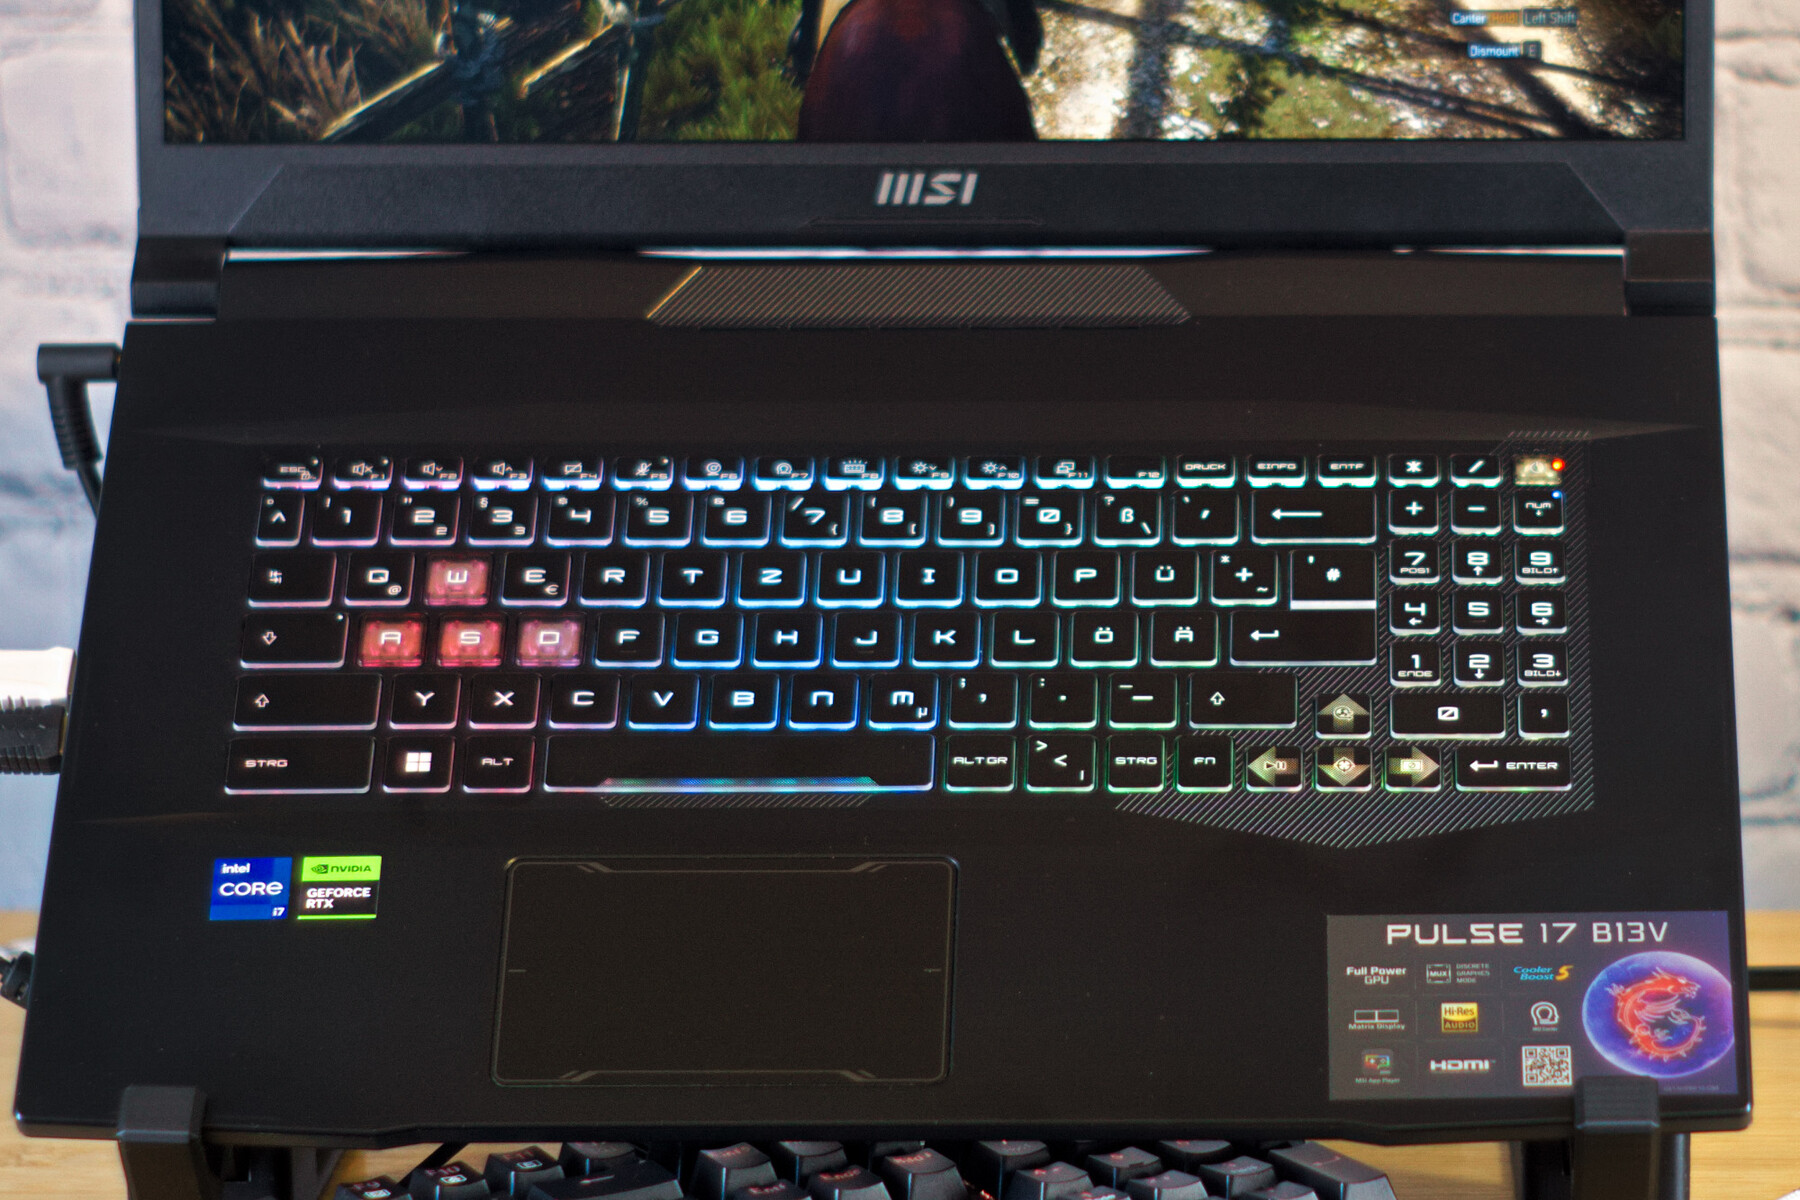
Input Devices - Four RGB zones and a small touchpad in the MSI Pulse
Keyboard
The MSI Control Center allows you to control the RGB background illumination of the MSI Pluse 17 keyboard. The manufacturer also allows using third-party software to change the colors and effects in the four illumination zones of the keyboard. The transparent W, A, S, and D keys are particularly emphasized here. The keyboard offers a good haptic feedback and key stroke of about 1.2 mm (~0.05 in).
Touchpad
The touchpad of the Pulse 17 is relatively small, but this also means that it doesn't get in the way of the palms when gaming. With its smooth surface, crisp keys, and high precision, it works well in general.
Display - Less than 60% sRGB coverage
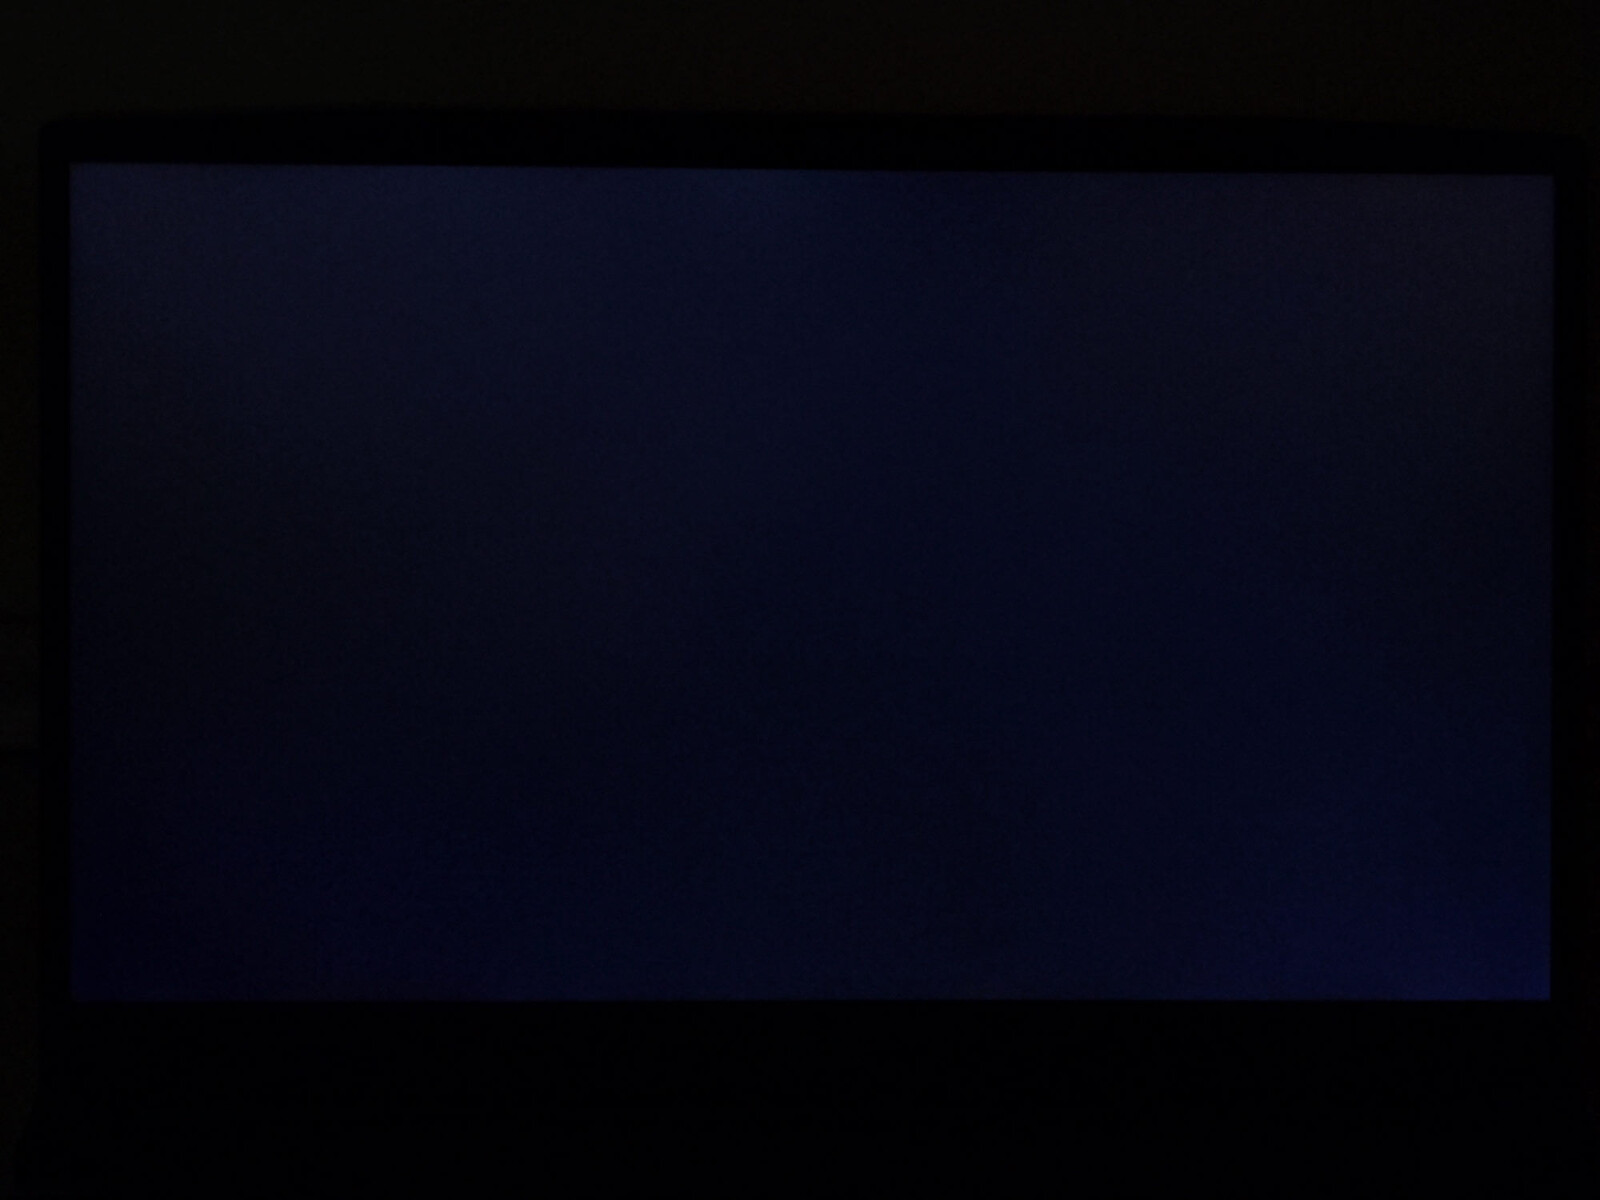
In a gaming laptop, the display should be very responsive, completely cover the sRGB color space, and offer a high contrast. Of these, only a high contrast ratio speaks for the display of the MSI Pulse. Even though the matte display isn't particularly bright at an average brightness of 250 cd/m², the low black value ensures the high contrast ratio. The brightness distribution isn't particularly even, but at least we don't notice any visible light halos.
This means that the display of the Pulse 17 is significantly worse compared to that of the Pulse GL76. The response times have almost doubled in comparison, becoming almost 6 times slower at times, and the number of displayable colors has been reduced to almost half. So MSI has performed a significant downgrade of the display.
| |||||||||||||||||||||||||
Brightness Distribution: 91 %
Center on Battery: 253 cd/m²
Contrast: 1814:1 (Black: 0.14 cd/m²)
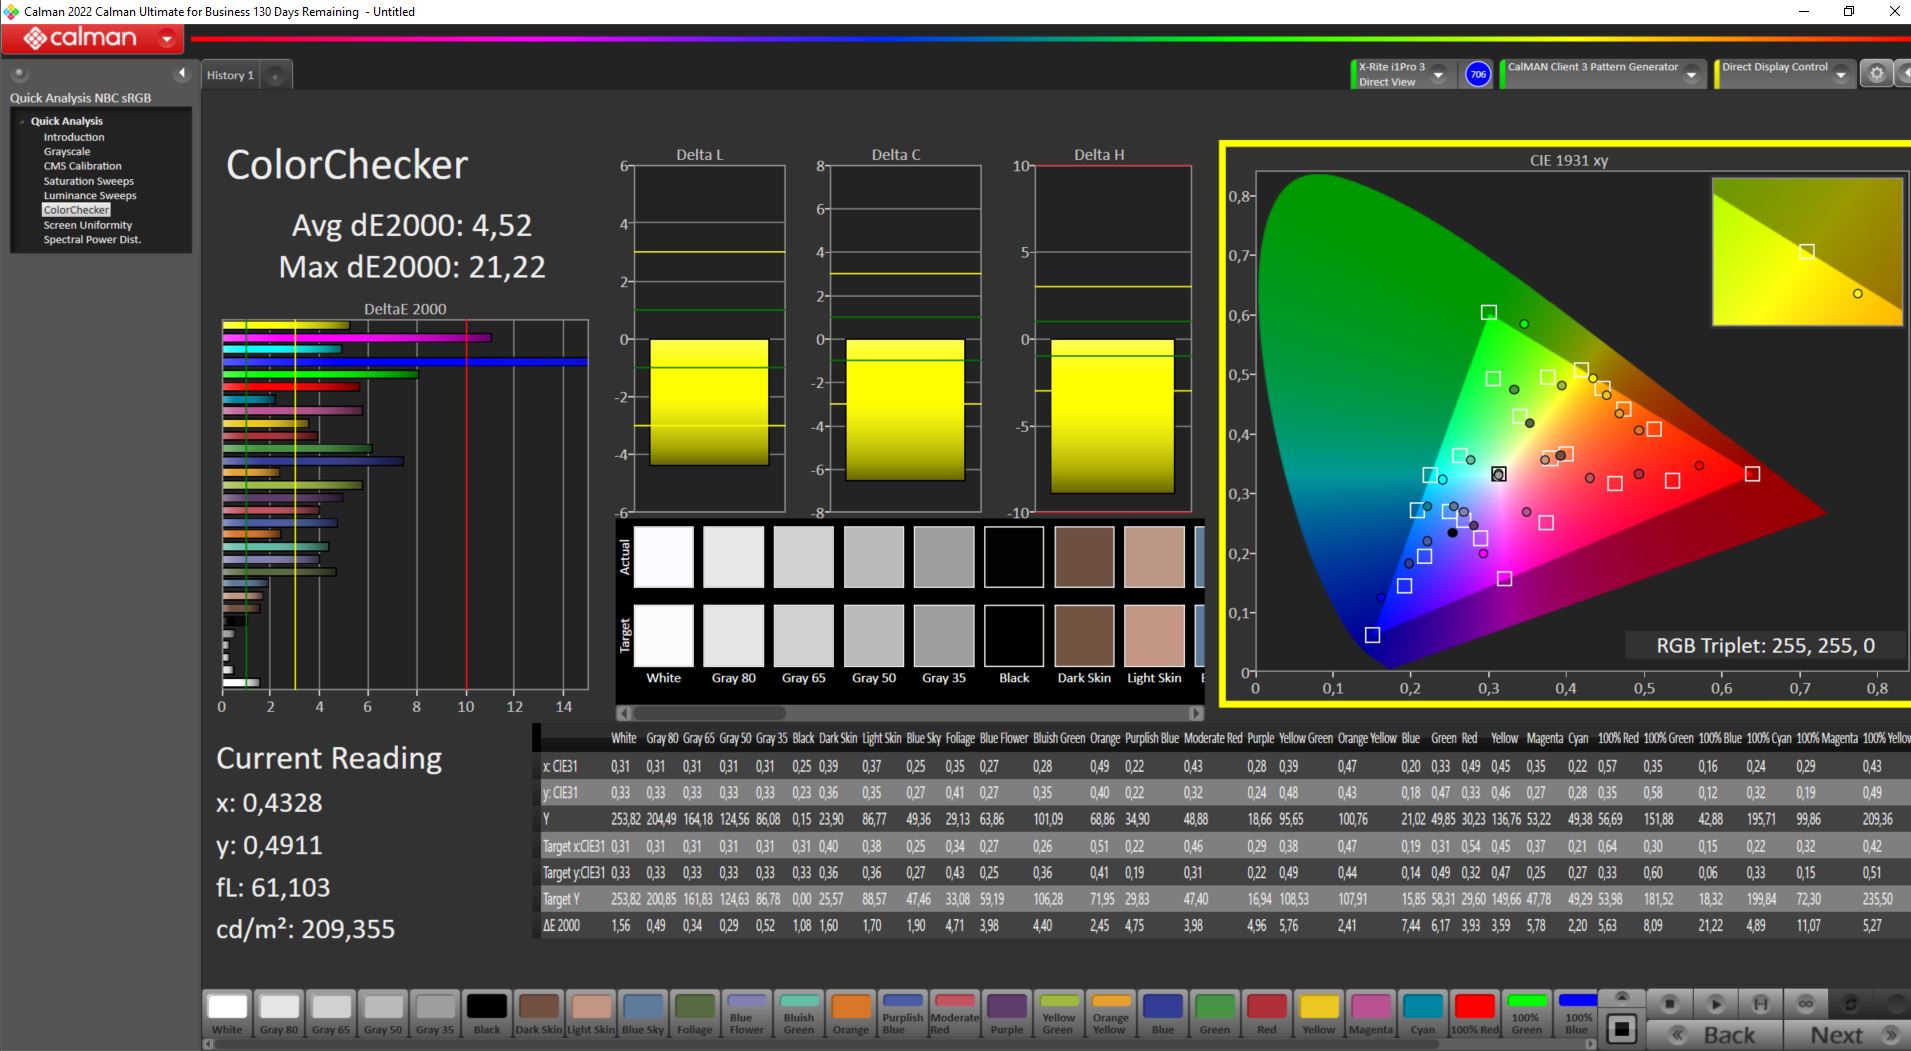
ΔE ColorChecker Calman: 4.52 | ∀{0.5-29.43 Ø4.71}
calibrated: 4.52
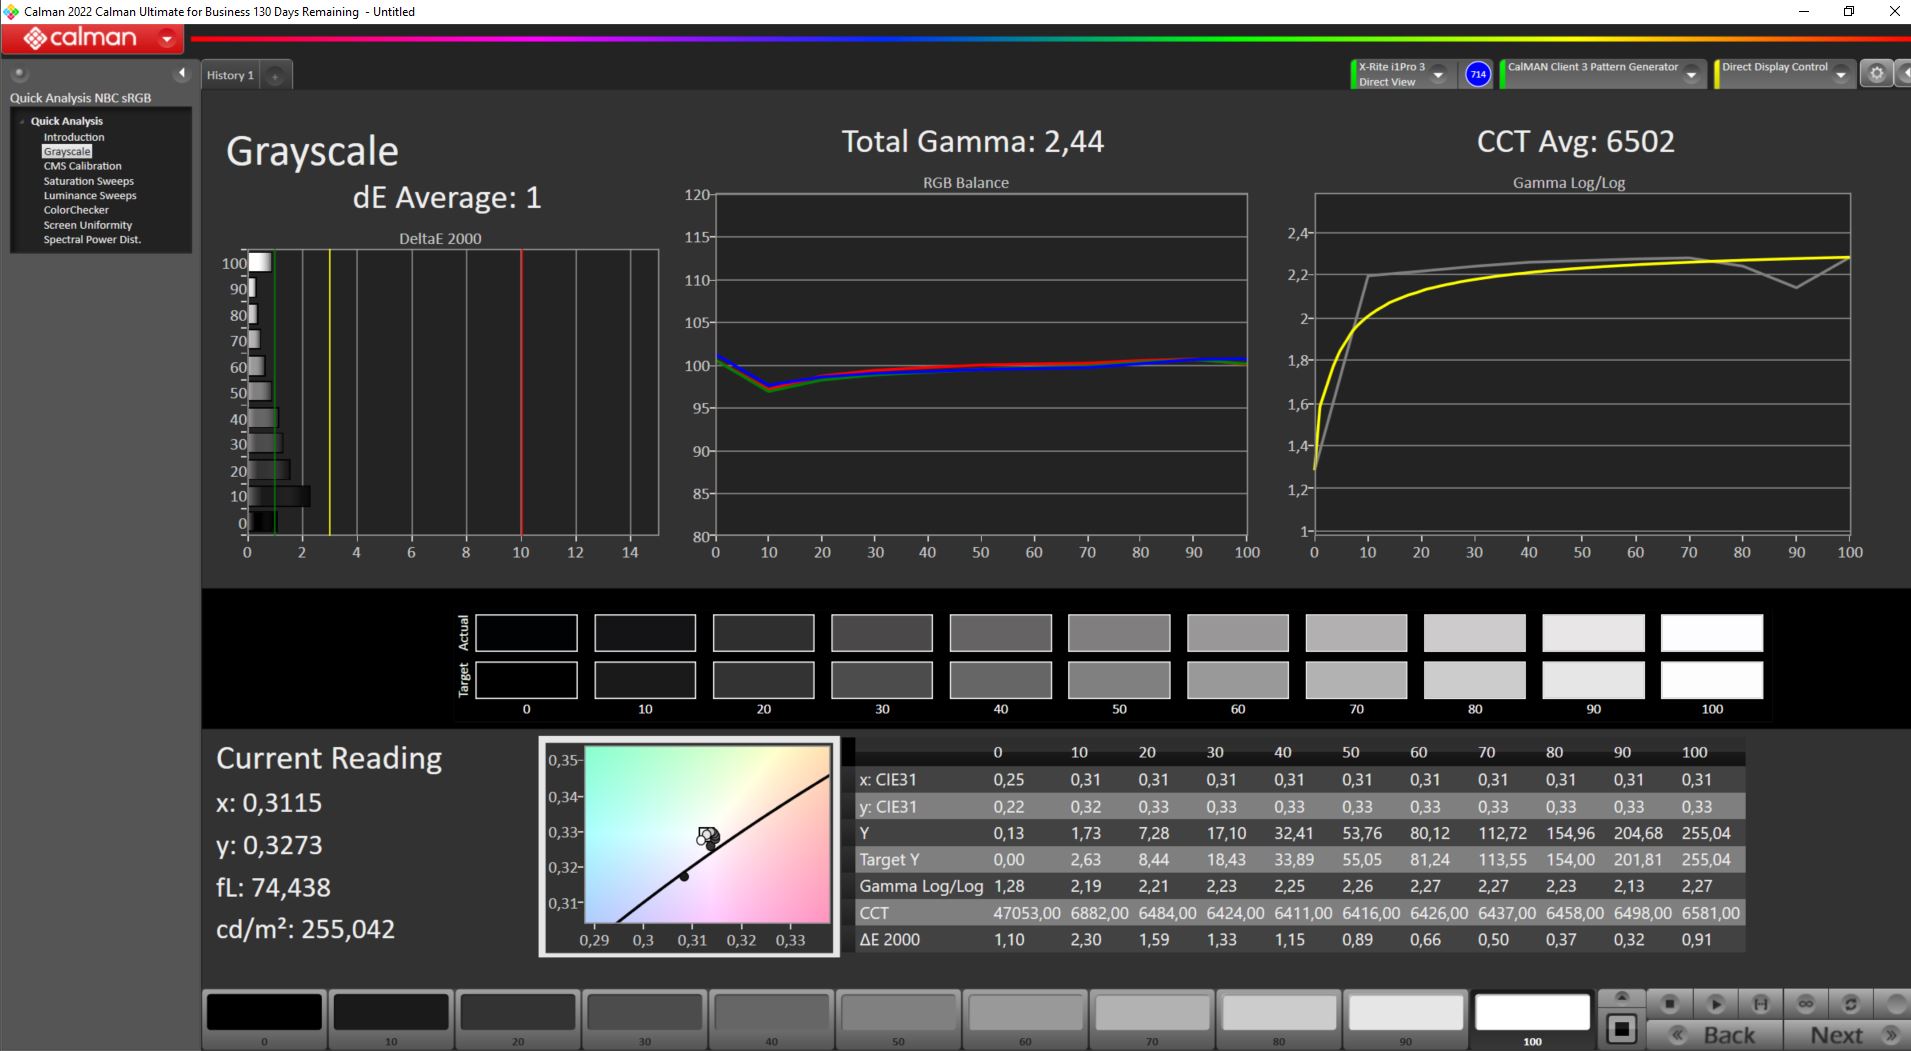
ΔE Greyscale Calman: 1 | ∀{0.09-98 Ø4.96}
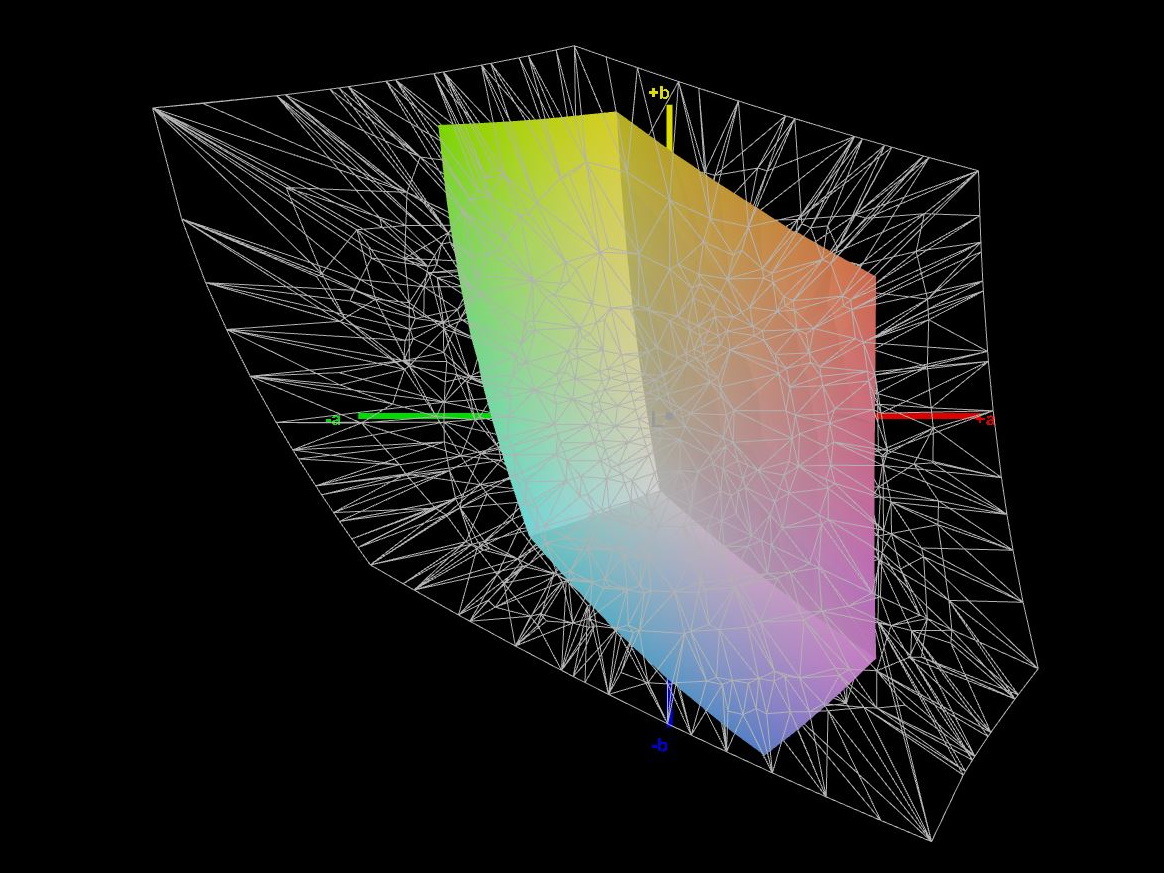
39.7% AdobeRGB 1998 (Argyll 3D)
57.5% sRGB (Argyll 3D)
38.4% Display P3 (Argyll 3D)
Gamma: 2.44
CCT: 6502 K
| MSI Pulse 17 B13VGK AU Optronics B173HAN04.9, IPS, 1920x1080, 17.3" | MSI Pulse GL76 12UGK Sharp LQ173M1JW08, IPS, 1920x1080, 17.3" | MSI Katana 17 B13VFK B173HAN04.9, IPS LED, 1920x1080, 17.3" | Acer Nitro 17 AN17-51-71ER BOE0B7C NE173QHM-NY6, , 2560x1440, 17.3" | Schenker XMG Focus 17 (E23) BOE09F9 NE173QHM-NZ1, IPS, 2560x1440, 17.3" | Asus ROG Strix G17 G713PI BOE0B69, IPS, 2560x1440, 17.3" | |
|---|---|---|---|---|---|---|
| Display | 82% | 6% | 115% | 113% | 115% | |
| Display P3 Coverage (%) | 38.4 | 71.9 87% | 40.8 6% | 98.3 156% | 96.6 152% | 98.3 156% |
| sRGB Coverage (%) | 57.5 | 99.9 74% | 61 6% | 100 74% | 99.9 74% | 100 74% |
| AdobeRGB 1998 Coverage (%) | 39.7 | 73.7 86% | 42.2 6% | 85.7 116% | 84.5 113% | 85.9 116% |
| Response Times | 69% | -8% | 60% | 51% | 74% | |
| Response Time Grey 50% / Grey 80% * (ms) | 31.2 ? | 4.6 ? 85% | 33 ? -6% | 14.8 ? 53% | 16.4 ? 47% | 5.3 ? 83% |
| Response Time Black / White * (ms) | 23.6 ? | 11.2 ? 53% | 26 ? -10% | 8 ? 66% | 10.8 ? 54% | 8.6 ? 64% |
| PWM Frequency (Hz) | ||||||
| Screen | -55% | -13% | -50% | -10% | 2% | |
| Brightness middle (cd/m²) | 254 | 337.7 33% | 267 5% | 361 42% | 349 37% | 327 29% |
| Brightness (cd/m²) | 250 | 331 32% | 256 2% | 326 30% | 318 27% | 320 28% |
| Brightness Distribution (%) | 91 | 82 -10% | 93 2% | 87 -4% | 82 -10% | 89 -2% |
| Black Level * (cd/m²) | 0.14 | 0.31 -121% | 0.21 -50% | 0.6 -329% | 0.56 -300% | 0.38 -171% |
| Contrast (:1) | 1814 | 1089 -40% | 1271 -30% | 602 -67% | 623 -66% | 861 -53% |
| Colorchecker dE 2000 * | 4.52 | 4.12 9% | 4.7 -4% | 3.83 15% | 1.08 76% | 1.01 78% |
| Colorchecker dE 2000 max. * | 21.22 | 8.89 58% | 20.4 4% | 5.71 73% | 3.05 86% | 4.01 81% |
| Colorchecker dE 2000 calibrated * | 4.52 | 0.98 78% | 4.5 -0% | 3.48 23% | 1.08 76% | 0.41 91% |
| Greyscale dE 2000 * | 1 | 6.3 -530% | 1.5 -50% | 3.29 -229% | 1.14 -14% | 1.6 -60% |
| Gamma | 2.44 90% | 2.48 89% | 2.12 104% | 2.29 96% | 2.41 91% | 2.168 101% |
| CCT | 6502 100% | 6542 99% | 6552 99% | 6679 97% | 6687 97% | 6659 98% |
| Total Average (Program / Settings) | 32% /
-8% | -5% /
-9% | 42% /
1% | 51% /
25% | 64% /
37% |
* ... smaller is better
The AdobeRGB and DisplayP3 color spaces are only covered to less than 40%, and even sRGB isn't covered to 60% by the Pulse 17.
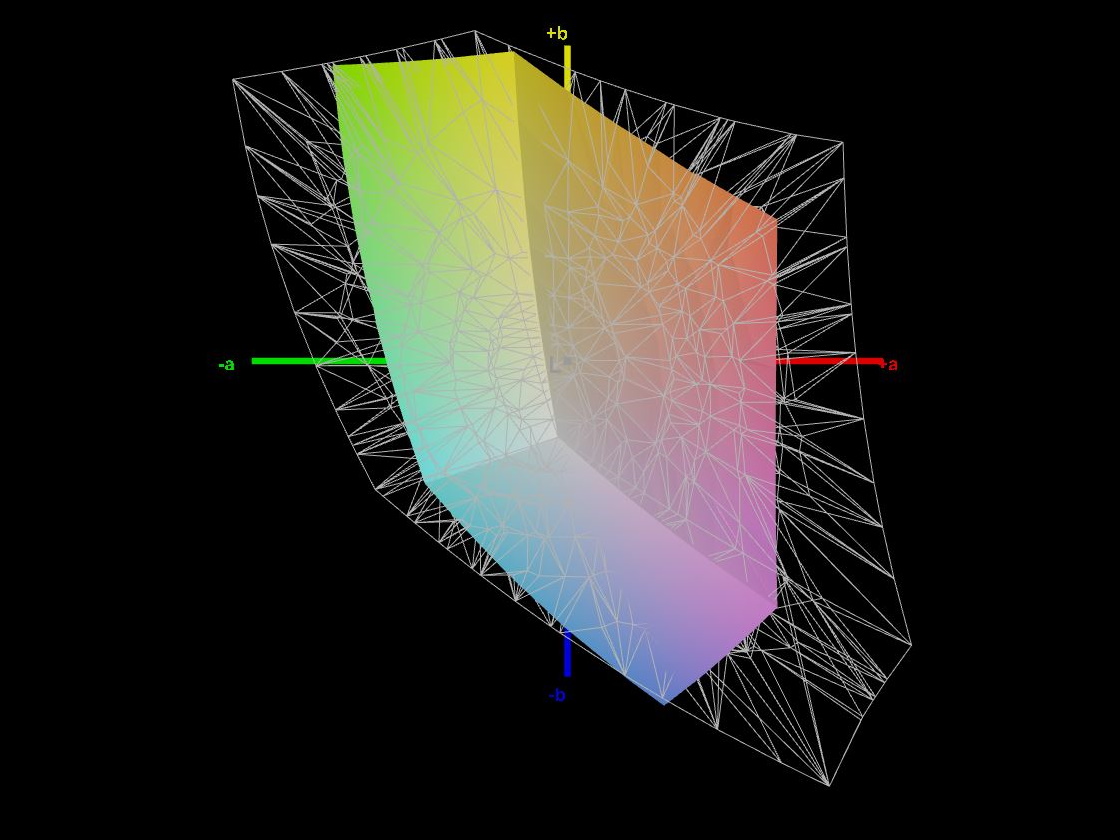
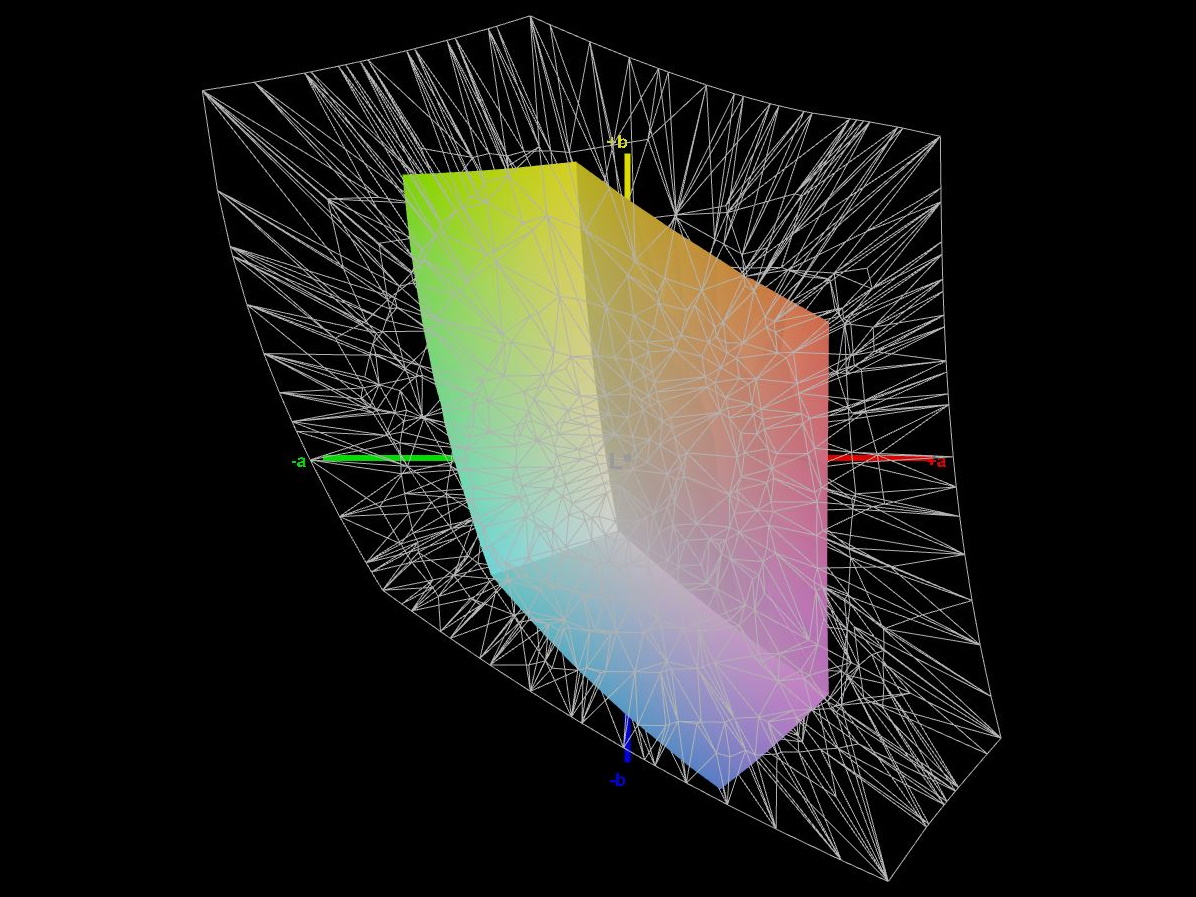
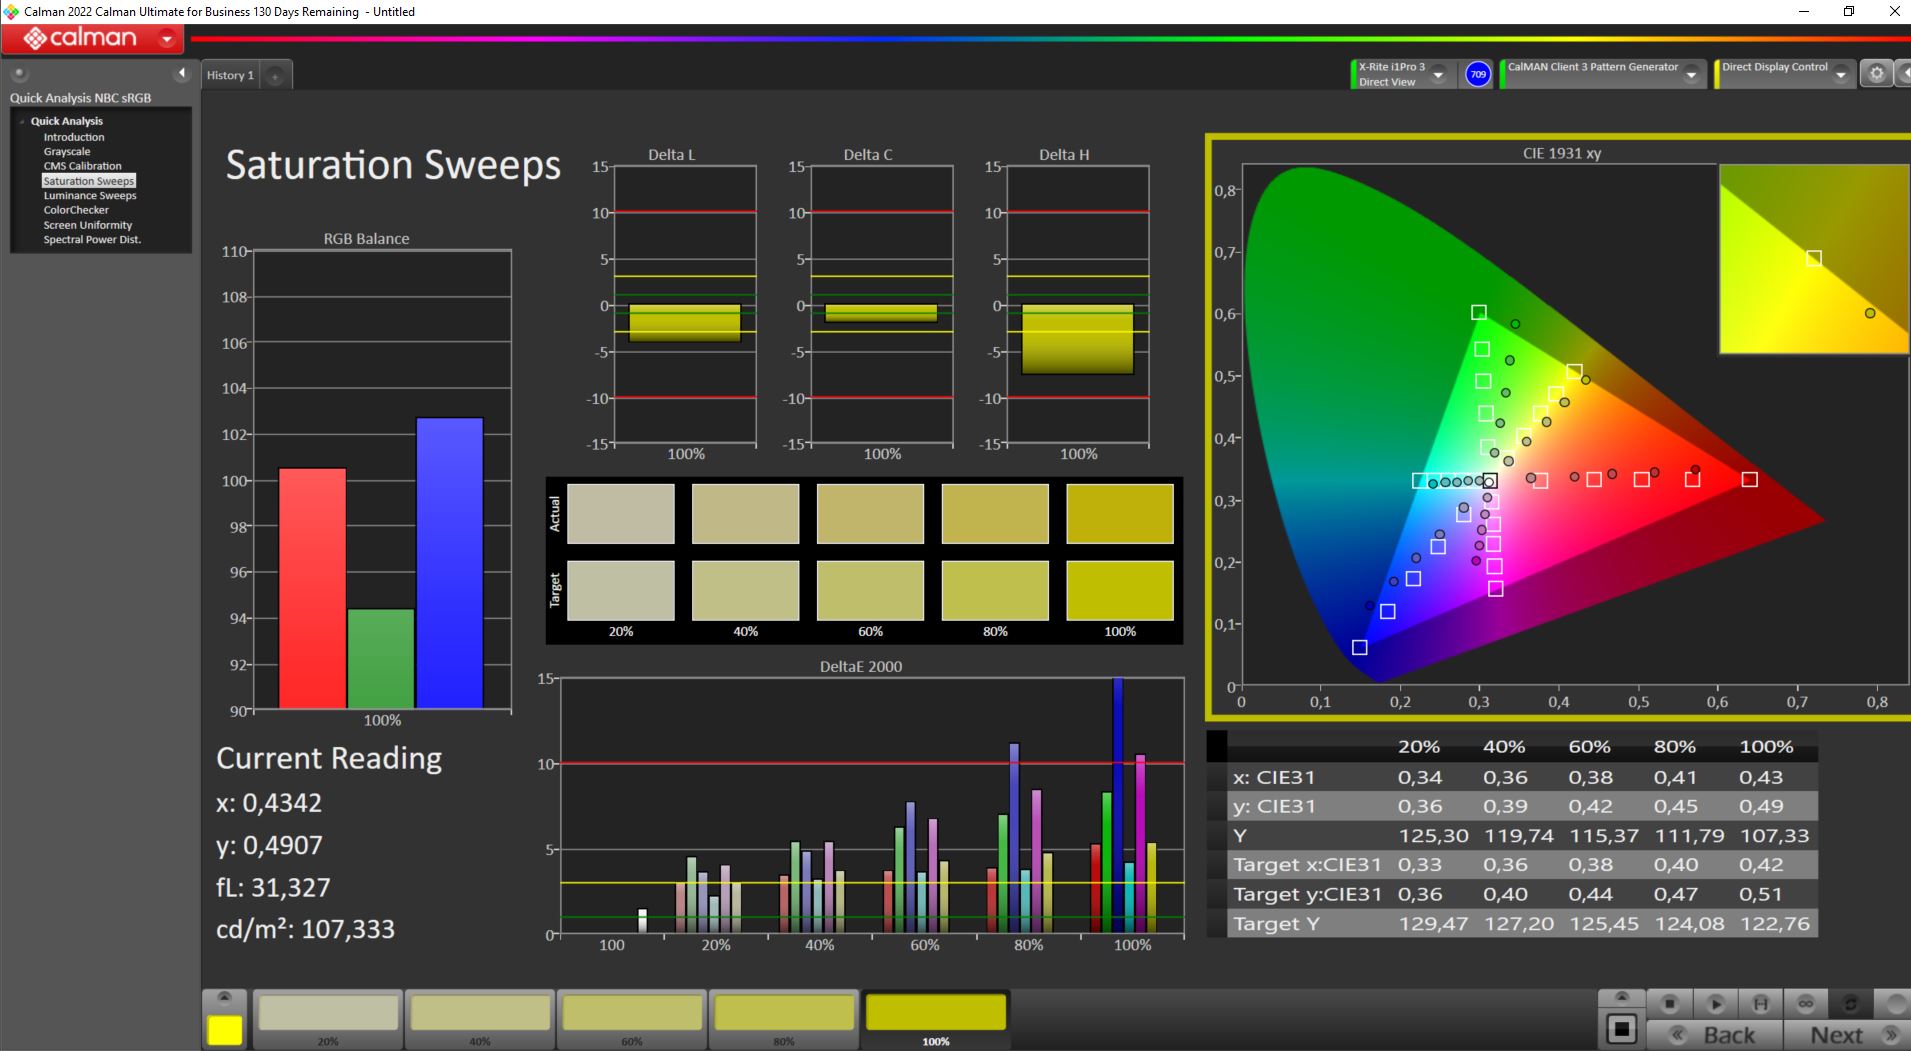
At least, the Calman test shows a good result in the display of the grayscale. However, evaluating the accuracy of the color reproduction with the Calman ColorChecker clearly reveals the limits of the display. At only 60% of the sRGB color space, the display clearly lacks large parts of the colors, ending up correspondingly far from the color scale in red, green, and blue colors. This results in a maximum color deviation of ΔΕ 21.22. This is a very high maximum deviation that isn't reached by any of our other comparison laptops. But the display fares slightly better in the average color deviations. However, an additional calibration doesn't change the result, so that even the MSI Katana ends up with lower color deviations using our ICC profile.
Display Response Times
| ↔ Response Time Black to White | ||
|---|---|---|
| 23.6 ms ... rise ↗ and fall ↘ combined | ↗ 12.2 ms rise | 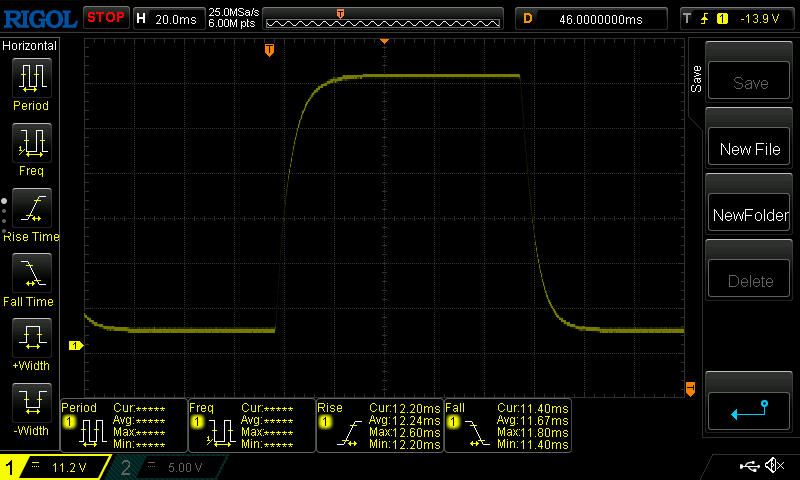 |
| ↘ 11.4 ms fall | ||
| The screen shows good response rates in our tests, but may be too slow for competitive gamers. In comparison, all tested devices range from 0.1 (minimum) to 240 (maximum) ms. » 54 % of all devices are better. This means that the measured response time is worse than the average of all tested devices (19.8 ms). | ||
| ↔ Response Time 50% Grey to 80% Grey | ||
| 31.2 ms ... rise ↗ and fall ↘ combined | ↗ 14.2 ms rise | 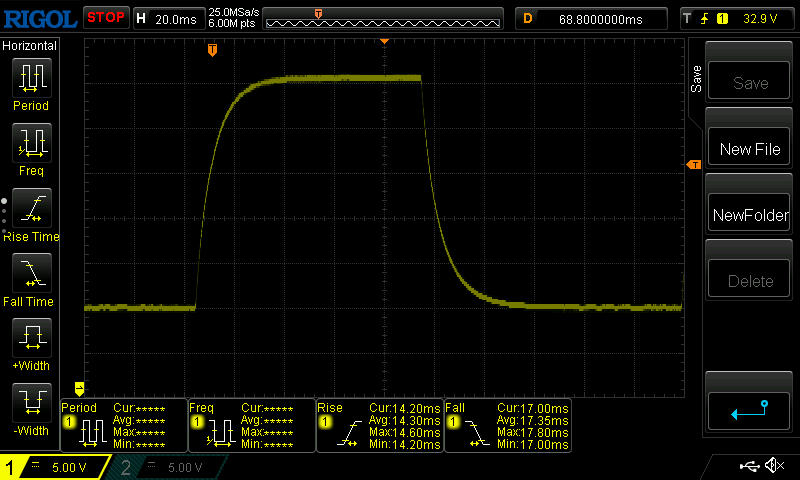 |
| ↘ 17 ms fall | ||
| The screen shows slow response rates in our tests and will be unsatisfactory for gamers. In comparison, all tested devices range from 0.165 (minimum) to 636 (maximum) ms. » 42 % of all devices are better. This means that the measured response time is similar to the average of all tested devices (31 ms). | ||
Screen Flickering / PWM (Pulse-Width Modulation)
| Screen flickering / PWM not detected | 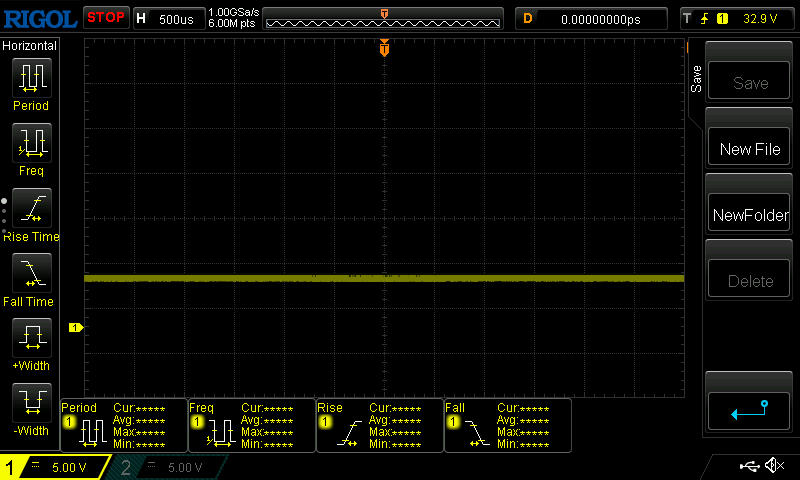 | ||
In comparison: 52 % of all tested devices do not use PWM to dim the display. If PWM was detected, an average of 7757 (minimum: 5 - maximum: 343500) Hz was measured. | |||
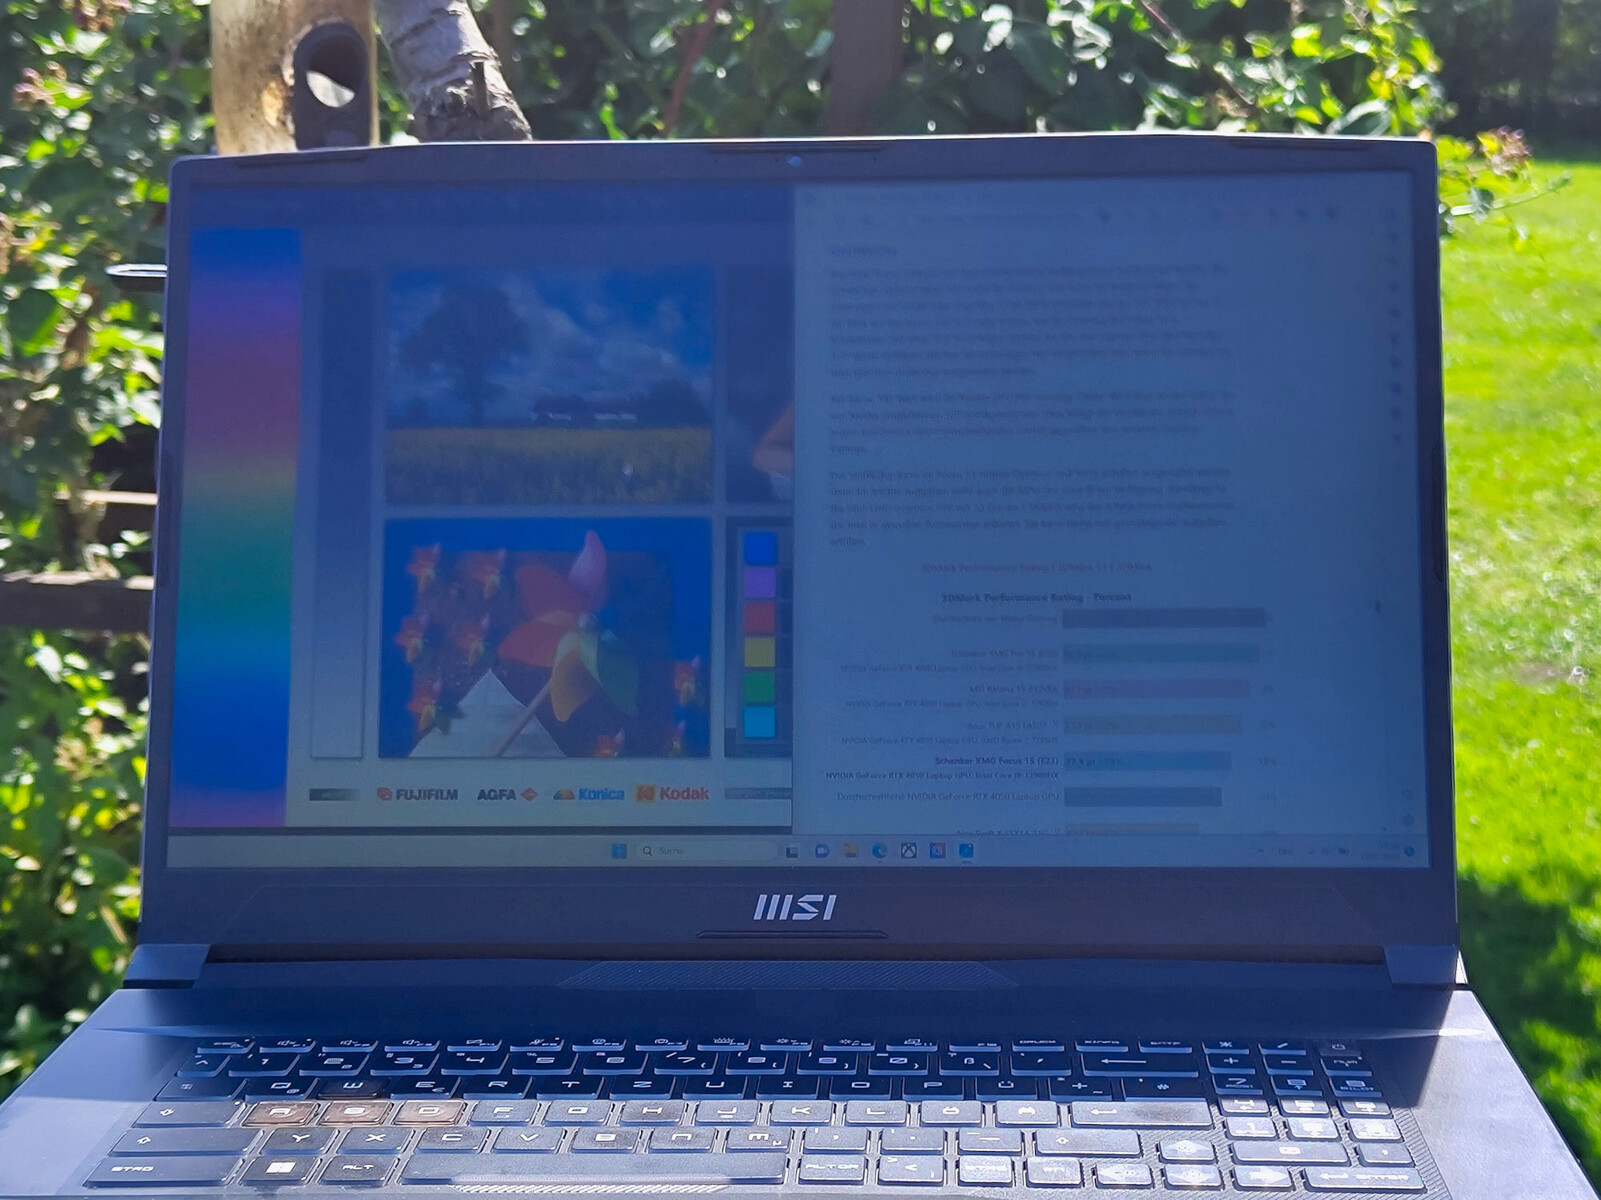
The viewing angles of the Pulse 17 IPS panel are fairly stable in terms of the color reproduction, but significantly losing in brightness with increasing angle. When using it outdoors, the laptop is only convincing to a limited extent, since the display isn't bright enough to be visible in bright sun light. Even in our studio illumination, it becomes quickly clear that the display is rather dark, with the matte surface still showing a relatively large amount of reflections.

Performance - Very powerful Intel Core i7-13700H
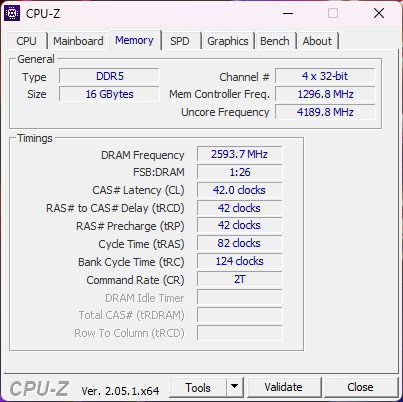
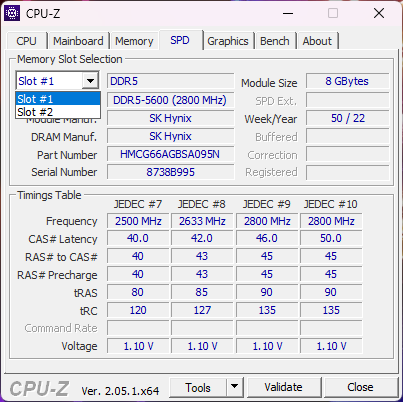
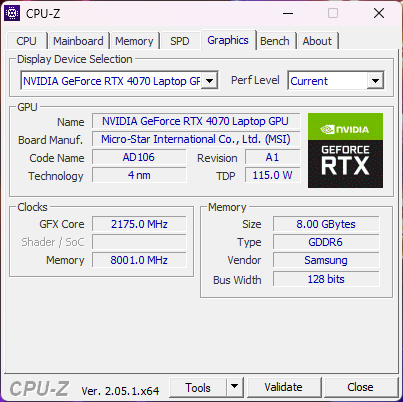
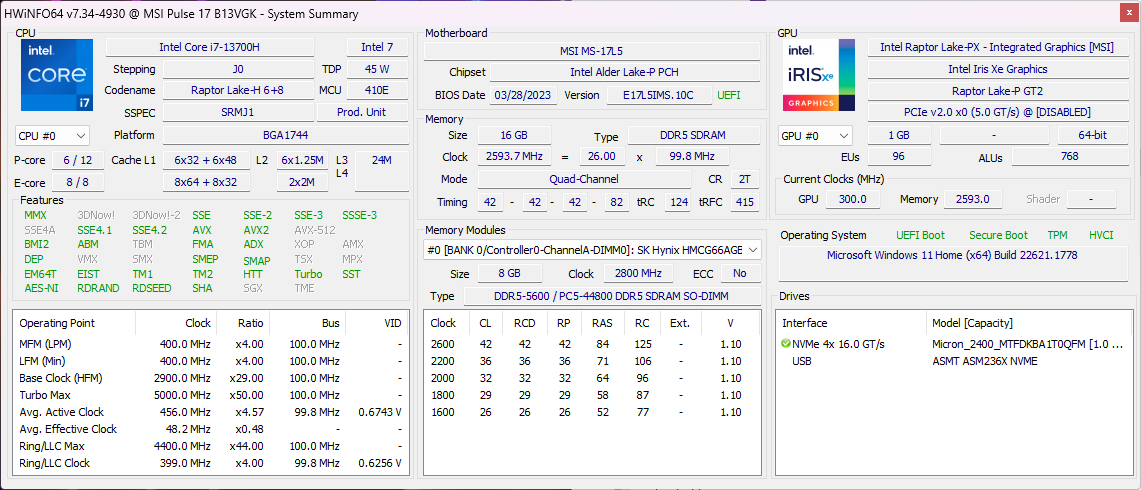
The MSI Pulse 17 B13V is available in two equipment configurations that only differ in terms of their GPU. While our test unit uses an Nvidia GeForce RTX 4070, the other configuration comes with an RTX 4060. As processor, the Intel Core i7-13700H is used. It is accompanied by 16 GB of DDR5-5200 RAM and an SSD with a 1 TB capacity. With such a powerful hardware configuration, our test unit is suitable for gaming at resolutions above Full HD.
Power Control and Test Conditions
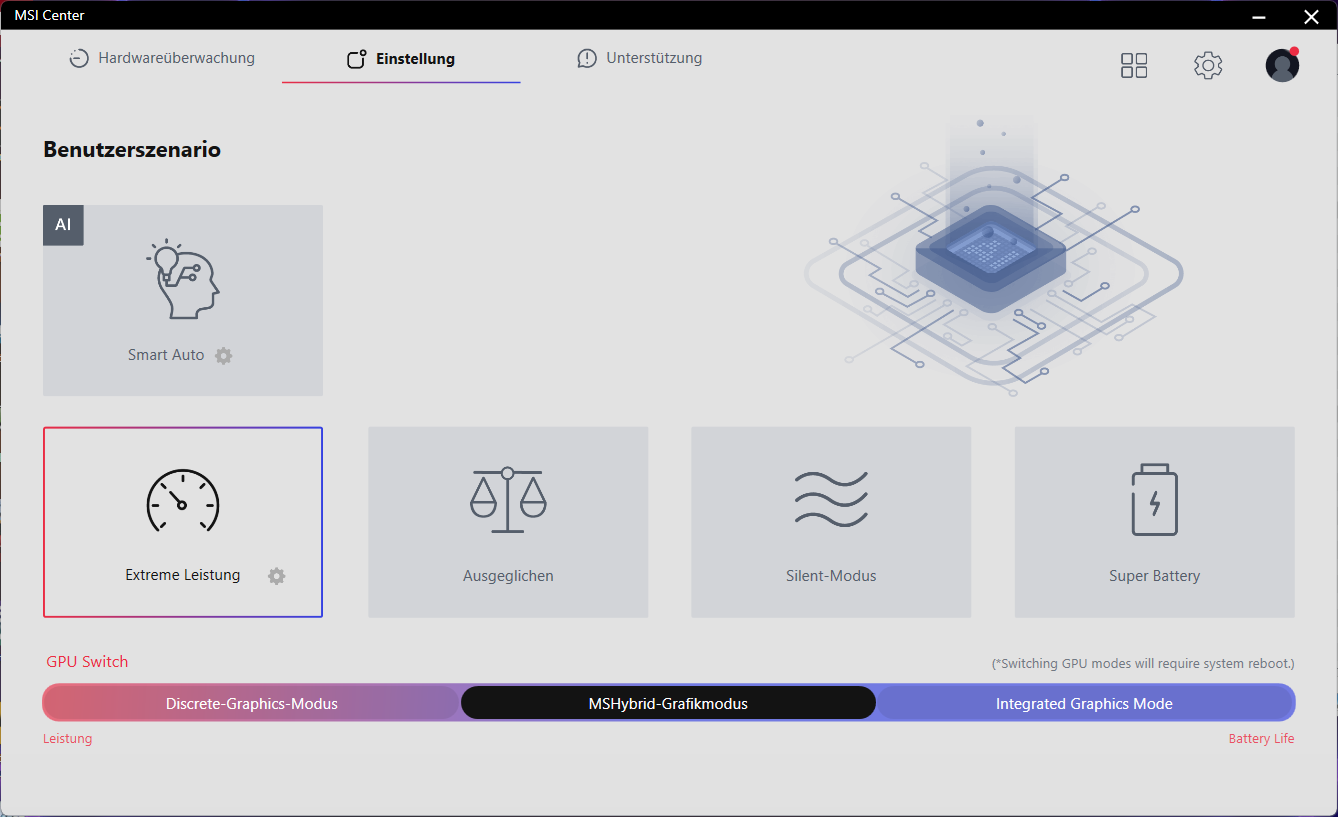
MSI offers three performance profiles and a battery saving mode in the Pulse 17. In addition, you could also use MSI's AI mode. When the CPU runs alone, it is able to use a PL1 of 90 watts in Extreme Performance mode, with a powerful boost performance (PL2) of 140 watts. In Balanced mode, PL1 and PL2 are at 70 and 120 watts respectively. The Quiet Operation mode where the fans are not audible runs at 30 watts without boost.
But what is more interesting for a gaming laptop is the performance while gaming. In all three performance modes this hardly differs in the first 10 minutes during our test. Only the temperatures reach different values. The Performance and Balanced modes ensure constant CPU and GPU temperatures. In Quiet Operation mode, the temperatures rise so high that the performance is throttled, dropping significantly after about 10 minutes.
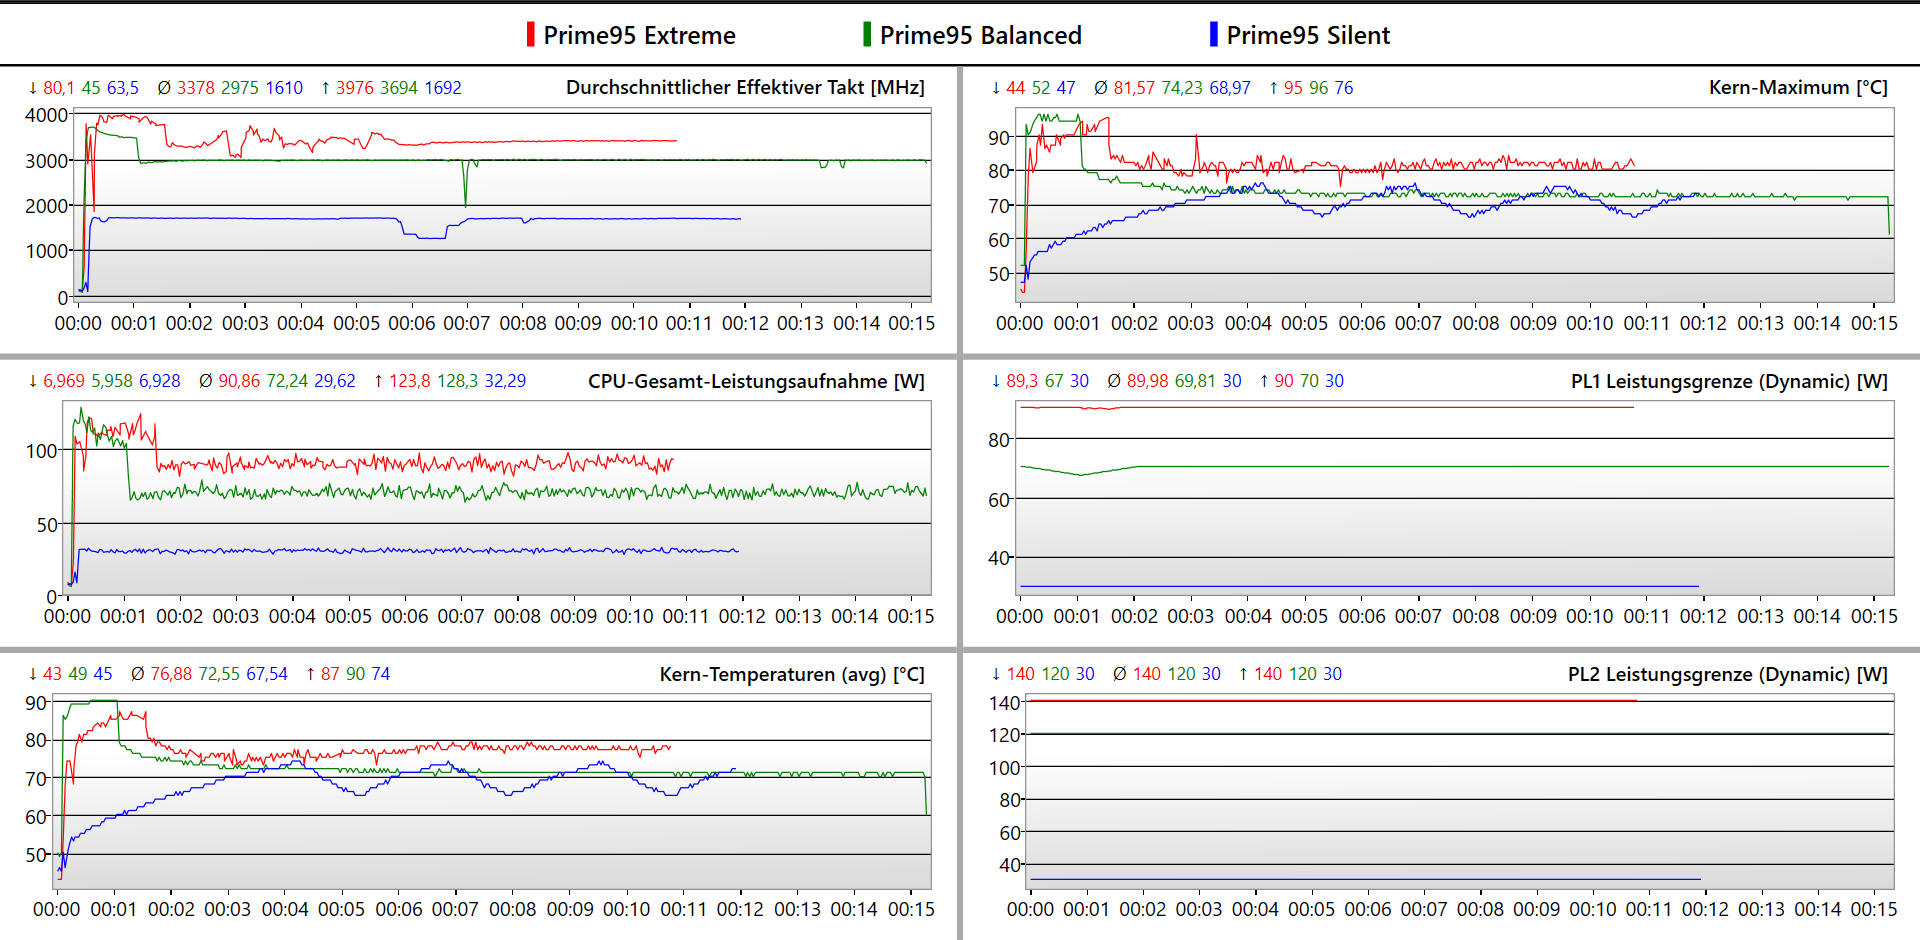
We therefore decided to run all the generic benchmarks in Performance mode and the gaming benchmarks in Balanced mode. In all our tested games, we also ran an additional benchmark with the highest quality settings in Performance mode. The achieved frame rates differed by less than one percentage point throughout. This means that Performance mode hardly achieves any FPS advantage when gaming.
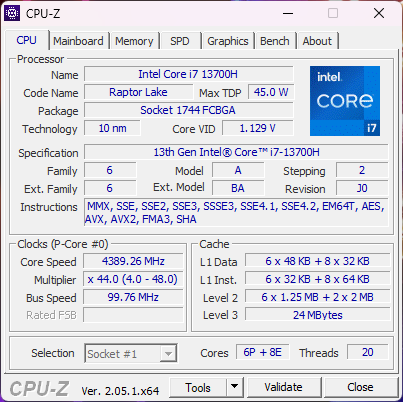
Processor
With six P and eight E cores, the Intel Core i7-13700H in the Pulse 17 is able to handle 20 threads. The processor is provided with a relatively high amount of power and in this way able to place just barely ahead of the other comparison devices with the Core i7. However, the XMG Focus 17 with a Core i9 and the Asus ROG Strix G17 with a Ryzen 9 significantly surpass the i7 processors.
Cinebench R15 Multi Constant Load Test
Cinebench R23: Multi Core | Single Core
Cinebench R20: CPU (Multi Core) | CPU (Single Core)
Cinebench R15: CPU Multi 64Bit | CPU Single 64Bit
Blender: v2.79 BMW27 CPU
7-Zip 18.03: 7z b 4 | 7z b 4 -mmt1
Geekbench 5.5: Multi-Core | Single-Core
HWBOT x265 Benchmark v2.2: 4k Preset
LibreOffice : 20 Documents To PDF
R Benchmark 2.5: Overall mean
| CPU Performance rating | |
| Asus ROG Strix G17 G713PI | |
| Schenker XMG Focus 17 (E23) | |
| Average of class Gaming | |
| MSI Pulse 17 B13VGK | |
| MSI Pulse GL76 12UGK | |
| Average Intel Core i7-13700H | |
| MSI Katana 17 B13VFK | |
| Acer Nitro 17 AN17-51-71ER | |
| Cinebench R23 / Multi Core | |
| Asus ROG Strix G17 G713PI | |
| Schenker XMG Focus 17 (E23) | |
| Average of class Gaming (10488 - 42661, n=107, last 2 years) | |
| Acer Nitro 17 AN17-51-71ER | |
| MSI Pulse 17 B13VGK | |
| MSI Pulse GL76 12UGK | |
| MSI Katana 17 B13VFK | |
| Average Intel Core i7-13700H (5890 - 20034, n=29) | |
| Cinebench R23 / Single Core | |
| Average of class Gaming (1166 - 2415, n=107, last 2 years) | |
| Schenker XMG Focus 17 (E23) | |
| Asus ROG Strix G17 G713PI | |
| MSI Katana 17 B13VFK | |
| Average Intel Core i7-13700H (1323 - 1914, n=29) | |
| MSI Pulse GL76 12UGK | |
| MSI Pulse 17 B13VGK | |
| Acer Nitro 17 AN17-51-71ER | |
| Cinebench R20 / CPU (Multi Core) | |
| Average of class Gaming (4029 - 16433, n=106, last 2 years) | |
| Schenker XMG Focus 17 (E23) | |
| Asus ROG Strix G17 G713PI | |
| MSI Pulse 17 B13VGK | |
| Acer Nitro 17 AN17-51-71ER | |
| MSI Pulse GL76 12UGK | |
| MSI Katana 17 B13VFK | |
| Average Intel Core i7-13700H (2322 - 7674, n=29) | |
| Cinebench R20 / CPU (Single Core) | |
| Average of class Gaming (442 - 913, n=106, last 2 years) | |
| Schenker XMG Focus 17 (E23) | |
| Asus ROG Strix G17 G713PI | |
| Average Intel Core i7-13700H (508 - 741, n=29) | |
| MSI Katana 17 B13VFK | |
| MSI Pulse GL76 12UGK | |
| MSI Pulse 17 B13VGK | |
| Acer Nitro 17 AN17-51-71ER | |
| Cinebench R15 / CPU Multi 64Bit | |
| Asus ROG Strix G17 G713PI | |
| Schenker XMG Focus 17 (E23) | |
| Average of class Gaming (1578 - 6330, n=105, last 2 years) | |
| Acer Nitro 17 AN17-51-71ER | |
| MSI Pulse 17 B13VGK | |
| MSI Pulse GL76 12UGK | |
| Average Intel Core i7-13700H (905 - 2982, n=29) | |
| MSI Katana 17 B13VFK | |
| Cinebench R15 / CPU Single 64Bit | |
| Average of class Gaming (188.8 - 350, n=106, last 2 years) | |
| Asus ROG Strix G17 G713PI | |
| Schenker XMG Focus 17 (E23) | |
| Average Intel Core i7-13700H (213 - 278, n=29) | |
| MSI Katana 17 B13VFK | |
| MSI Pulse GL76 12UGK | |
| MSI Pulse 17 B13VGK | |
| Acer Nitro 17 AN17-51-71ER | |
| Blender / v2.79 BMW27 CPU | |
| Average Intel Core i7-13700H (169 - 555, n=29) | |
| MSI Katana 17 B13VFK | |
| MSI Pulse GL76 12UGK | |
| Acer Nitro 17 AN17-51-71ER | |
| MSI Pulse 17 B13VGK | |
| Average of class Gaming (79 - 330, n=104, last 2 years) | |
| Schenker XMG Focus 17 (E23) | |
| Asus ROG Strix G17 G713PI | |
| 7-Zip 18.03 / 7z b 4 | |
| Asus ROG Strix G17 G713PI | |
| Schenker XMG Focus 17 (E23) | |
| Average of class Gaming (33491 - 148086, n=105, last 2 years) | |
| MSI Pulse 17 B13VGK | |
| Acer Nitro 17 AN17-51-71ER | |
| MSI Pulse GL76 12UGK | |
| MSI Katana 17 B13VFK | |
| Average Intel Core i7-13700H (27322 - 76344, n=29) | |
| 7-Zip 18.03 / 7z b 4 -mmt1 | |
| Asus ROG Strix G17 G713PI | |
| Schenker XMG Focus 17 (E23) | |
| Average of class Gaming (4199 - 7436, n=105, last 2 years) | |
| Average Intel Core i7-13700H (4825 - 6238, n=29) | |
| MSI Katana 17 B13VFK | |
| MSI Pulse GL76 12UGK | |
| MSI Pulse 17 B13VGK | |
| Acer Nitro 17 AN17-51-71ER | |
| Geekbench 5.5 / Multi-Core | |
| Asus ROG Strix G17 G713PI | |
| Schenker XMG Focus 17 (E23) | |
| Average of class Gaming (6460 - 28263, n=105, last 2 years) | |
| MSI Pulse 17 B13VGK | |
| Acer Nitro 17 AN17-51-71ER | |
| MSI Pulse GL76 12UGK | |
| Average Intel Core i7-13700H (6165 - 14215, n=29) | |
| MSI Katana 17 B13VFK | |
| Geekbench 5.5 / Single-Core | |
| Average of class Gaming (986 - 2474, n=105, last 2 years) | |
| Asus ROG Strix G17 G713PI | |
| Schenker XMG Focus 17 (E23) | |
| Average Intel Core i7-13700H (1362 - 1919, n=29) | |
| MSI Katana 17 B13VFK | |
| MSI Pulse 17 B13VGK | |
| MSI Pulse GL76 12UGK | |
| Acer Nitro 17 AN17-51-71ER | |
| HWBOT x265 Benchmark v2.2 / 4k Preset | |
| Asus ROG Strix G17 G713PI | |
| Average of class Gaming (11.5 - 44.4, n=105, last 2 years) | |
| Schenker XMG Focus 17 (E23) | |
| MSI Pulse 17 B13VGK | |
| Acer Nitro 17 AN17-51-71ER | |
| MSI Pulse GL76 12UGK | |
| MSI Katana 17 B13VFK | |
| Average Intel Core i7-13700H (6.72 - 21.2, n=29) | |
| LibreOffice / 20 Documents To PDF | |
| MSI Pulse 17 B13VGK | |
| MSI Katana 17 B13VFK | |
| Acer Nitro 17 AN17-51-71ER | |
| Schenker XMG Focus 17 (E23) | |
| Average of class Gaming (33.2 - 88.8, n=105, last 2 years) | |
| Average Intel Core i7-13700H (31.3 - 62.4, n=29) | |
| MSI Pulse GL76 12UGK | |
| Asus ROG Strix G17 G713PI | |
| R Benchmark 2.5 / Overall mean | |
| Acer Nitro 17 AN17-51-71ER | |
| MSI Pulse 17 B13VGK | |
| MSI Pulse GL76 12UGK | |
| Average Intel Core i7-13700H (0.4308 - 0.607, n=29) | |
| MSI Katana 17 B13VFK | |
| Average of class Gaming (0.3439 - 0.759, n=106, last 2 years) | |
| Schenker XMG Focus 17 (E23) | |
| Asus ROG Strix G17 G713PI | |
* ... smaller is better
AIDA64: FP32 Ray-Trace | FPU Julia | CPU SHA3 | CPU Queen | FPU SinJulia | FPU Mandel | CPU AES | CPU ZLib | FP64 Ray-Trace | CPU PhotoWorxx
| Performance rating | |
| Asus ROG Strix G17 G713PI | |
| Average of class Gaming | |
| Schenker XMG Focus 17 (E23) | |
| Acer Nitro 17 AN17-51-71ER | |
| MSI Pulse 17 B13VGK | |
| MSI Pulse GL76 12UGK | |
| Average Intel Core i7-13700H | |
| MSI Katana 17 B13VFK | |
| AIDA64 / FP32 Ray-Trace | |
| Asus ROG Strix G17 G713PI | |
| Average of class Gaming (10227 - 85542, n=105, last 2 years) | |
| Schenker XMG Focus 17 (E23) | |
| MSI Pulse 17 B13VGK | |
| Acer Nitro 17 AN17-51-71ER | |
| MSI Pulse GL76 12UGK | |
| Average Intel Core i7-13700H (4986 - 18908, n=29) | |
| MSI Katana 17 B13VFK | |
| AIDA64 / FPU Julia | |
| Asus ROG Strix G17 G713PI | |
| Average of class Gaming (51376 - 238426, n=105, last 2 years) | |
| Schenker XMG Focus 17 (E23) | |
| MSI Pulse 17 B13VGK | |
| Acer Nitro 17 AN17-51-71ER | |
| MSI Pulse GL76 12UGK | |
| Average Intel Core i7-13700H (25360 - 92359, n=29) | |
| MSI Katana 17 B13VFK | |
| AIDA64 / CPU SHA3 | |
| Asus ROG Strix G17 G713PI | |
| Average of class Gaming (2180 - 10115, n=105, last 2 years) | |
| Schenker XMG Focus 17 (E23) | |
| Acer Nitro 17 AN17-51-71ER | |
| MSI Pulse 17 B13VGK | |
| MSI Pulse GL76 12UGK | |
| Average Intel Core i7-13700H (1339 - 4224, n=29) | |
| MSI Katana 17 B13VFK | |
| AIDA64 / CPU Queen | |
| Asus ROG Strix G17 G713PI | |
| Schenker XMG Focus 17 (E23) | |
| Average of class Gaming (49785 - 173351, n=90, last 2 years) | |
| MSI Pulse GL76 12UGK | |
| Acer Nitro 17 AN17-51-71ER | |
| MSI Pulse 17 B13VGK | |
| Average Intel Core i7-13700H (59324 - 107159, n=29) | |
| MSI Katana 17 B13VFK | |
| AIDA64 / FPU SinJulia | |
| Asus ROG Strix G17 G713PI | |
| Average of class Gaming (4424 - 33636, n=105, last 2 years) | |
| Schenker XMG Focus 17 (E23) | |
| MSI Pulse 17 B13VGK | |
| Acer Nitro 17 AN17-51-71ER | |
| MSI Pulse GL76 12UGK | |
| Average Intel Core i7-13700H (4800 - 11050, n=29) | |
| MSI Katana 17 B13VFK | |
| AIDA64 / FPU Mandel | |
| Asus ROG Strix G17 G713PI | |
| Average of class Gaming (25115 - 128721, n=105, last 2 years) | |
| Schenker XMG Focus 17 (E23) | |
| MSI Pulse 17 B13VGK | |
| Acer Nitro 17 AN17-51-71ER | |
| MSI Pulse GL76 12UGK | |
| Average Intel Core i7-13700H (12321 - 45118, n=29) | |
| MSI Katana 17 B13VFK | |
| AIDA64 / CPU AES | |
| Asus ROG Strix G17 G713PI | |
| Acer Nitro 17 AN17-51-71ER | |
| MSI Pulse GL76 12UGK | |
| Average of class Gaming (39258 - 247074, n=105, last 2 years) | |
| Schenker XMG Focus 17 (E23) | |
| MSI Pulse 17 B13VGK | |
| Average Intel Core i7-13700H (28769 - 151254, n=29) | |
| MSI Katana 17 B13VFK | |
| AIDA64 / CPU ZLib | |
| Asus ROG Strix G17 G713PI | |
| Schenker XMG Focus 17 (E23) | |
| Average of class Gaming (574 - 2531, n=105, last 2 years) | |
| Acer Nitro 17 AN17-51-71ER | |
| MSI Pulse 17 B13VGK | |
| MSI Pulse GL76 12UGK | |
| Average Intel Core i7-13700H (389 - 1215, n=29) | |
| MSI Katana 17 B13VFK | |
| AIDA64 / FP64 Ray-Trace | |
| Asus ROG Strix G17 G713PI | |
| Average of class Gaming (5509 - 45446, n=105, last 2 years) | |
| Schenker XMG Focus 17 (E23) | |
| MSI Pulse 17 B13VGK | |
| Acer Nitro 17 AN17-51-71ER | |
| MSI Pulse GL76 12UGK | |
| Average Intel Core i7-13700H (2540 - 10135, n=29) | |
| MSI Katana 17 B13VFK | |
| AIDA64 / CPU PhotoWorxx | |
| Schenker XMG Focus 17 (E23) | |
| Average of class Gaming (12271 - 89891, n=105, last 2 years) | |
| Average Intel Core i7-13700H (12872 - 52727, n=29) | |
| MSI Pulse 17 B13VGK | |
| Acer Nitro 17 AN17-51-71ER | |
| MSI Katana 17 B13VFK | |
| Asus ROG Strix G17 G713PI | |
| MSI Pulse GL76 12UGK | |
System Performance
We ran the PCMark 10 benchmark of the system performance twice, since in the first run, the MSI Pulse remained far behind the powerful results the processor was able to show in its benchmarks before. With only 6844 points, it would only have reached last place among our comparison devices. However, several updates later using Windows Update, the picture changes drastically.
The gaming laptop now places just barely ahead of the comparison devices. The only clear outlier occurs in the Essentials section of the benchmark. We suspect that the fault lies with the relatively slow SSD in our test unit, since the Essentials section places particular emphasis on the access times of data and programs.
The CPU-heavy CrossMark paints a similar picture with the comparison devices with Core i9 and Ryzen 9 being able to place significantly ahead.
CrossMark: Overall | Productivity | Creativity | Responsiveness
| PCMark 10 / Score | |
| Average of class Gaming (5828 - 12414, n=93, last 2 years) | |
| MSI Pulse 17 B13VGK | |
| MSI Pulse GL76 12UGK | |
| Asus ROG Strix G17 G713PI | |
| Average Intel Core i7-13700H, NVIDIA GeForce RTX 4070 Laptop GPU (7158 - 7956, n=8) | |
| MSI Katana 17 B13VFK | |
| Acer Nitro 17 AN17-51-71ER | |
| Schenker XMG Focus 17 (E23) | |
| PCMark 10 / Essentials | |
| Asus ROG Strix G17 G713PI | |
| MSI Pulse GL76 12UGK | |
| MSI Katana 17 B13VFK | |
| Average Intel Core i7-13700H, NVIDIA GeForce RTX 4070 Laptop GPU (10252 - 11449, n=8) | |
| Average of class Gaming (8810 - 11935, n=97, last 2 years) | |
| MSI Pulse 17 B13VGK | |
| Acer Nitro 17 AN17-51-71ER | |
| Schenker XMG Focus 17 (E23) | |
| PCMark 10 / Productivity | |
| Average of class Gaming (6845 - 25323, n=95, last 2 years) | |
| Asus ROG Strix G17 G713PI | |
| MSI Pulse 17 B13VGK | |
| MSI Pulse GL76 12UGK | |
| Schenker XMG Focus 17 (E23) | |
| Average Intel Core i7-13700H, NVIDIA GeForce RTX 4070 Laptop GPU (8501 - 10769, n=8) | |
| MSI Katana 17 B13VFK | |
| Acer Nitro 17 AN17-51-71ER | |
| PCMark 10 / Digital Content Creation | |
| Average of class Gaming (7602 - 19954, n=95, last 2 years) | |
| Acer Nitro 17 AN17-51-71ER | |
| MSI Pulse 17 B13VGK | |
| MSI Pulse GL76 12UGK | |
| Average Intel Core i7-13700H, NVIDIA GeForce RTX 4070 Laptop GPU (10358 - 12908, n=8) | |
| MSI Katana 17 B13VFK | |
| Schenker XMG Focus 17 (E23) | |
| Asus ROG Strix G17 G713PI | |
| CrossMark / Overall | |
| Asus ROG Strix G17 G713PI | |
| Schenker XMG Focus 17 (E23) | |
| Average of class Gaming (1366 - 2409, n=94, last 2 years) | |
| MSI Pulse 17 B13VGK | |
| Average Intel Core i7-13700H, NVIDIA GeForce RTX 4070 Laptop GPU (1768 - 2073, n=6) | |
| MSI Katana 17 B13VFK | |
| MSI Pulse GL76 12UGK | |
| Acer Nitro 17 AN17-51-71ER | |
| CrossMark / Productivity | |
| Asus ROG Strix G17 G713PI | |
| Schenker XMG Focus 17 (E23) | |
| Average of class Gaming (1386 - 2254, n=94, last 2 years) | |
| MSI Pulse 17 B13VGK | |
| Average Intel Core i7-13700H, NVIDIA GeForce RTX 4070 Laptop GPU (1645 - 2006, n=6) | |
| MSI Pulse GL76 12UGK | |
| MSI Katana 17 B13VFK | |
| Acer Nitro 17 AN17-51-71ER | |
| CrossMark / Creativity | |
| Asus ROG Strix G17 G713PI | |
| Schenker XMG Focus 17 (E23) | |
| Average of class Gaming (1343 - 2786, n=94, last 2 years) | |
| MSI Pulse 17 B13VGK | |
| Average Intel Core i7-13700H, NVIDIA GeForce RTX 4070 Laptop GPU (1936 - 2137, n=6) | |
| MSI Katana 17 B13VFK | |
| MSI Pulse GL76 12UGK | |
| Acer Nitro 17 AN17-51-71ER | |
| CrossMark / Responsiveness | |
| MSI Pulse GL76 12UGK | |
| MSI Pulse 17 B13VGK | |
| Schenker XMG Focus 17 (E23) | |
| Average Intel Core i7-13700H, NVIDIA GeForce RTX 4070 Laptop GPU (1451 - 2202, n=6) | |
| MSI Katana 17 B13VFK | |
| Average of class Gaming (1226 - 2334, n=94, last 2 years) | |
| Asus ROG Strix G17 G713PI | |
| Acer Nitro 17 AN17-51-71ER | |
| PCMark 10 Score | 7796 points | |
Help | ||
| AIDA64 / Memory Copy | |
| Schenker XMG Focus 17 (E23) | |
| Average of class Gaming (21750 - 129946, n=105, last 2 years) | |
| Average Intel Core i7-13700H (24334 - 78081, n=29) | |
| MSI Pulse 17 B13VGK | |
| Acer Nitro 17 AN17-51-71ER | |
| MSI Katana 17 B13VFK | |
| Asus ROG Strix G17 G713PI | |
| MSI Pulse GL76 12UGK | |
| AIDA64 / Memory Read | |
| Schenker XMG Focus 17 (E23) | |
| Average of class Gaming (22956 - 118858, n=105, last 2 years) | |
| MSI Pulse 17 B13VGK | |
| Acer Nitro 17 AN17-51-71ER | |
| Average Intel Core i7-13700H (23681 - 79656, n=29) | |
| MSI Katana 17 B13VFK | |
| Asus ROG Strix G17 G713PI | |
| MSI Pulse GL76 12UGK | |
| AIDA64 / Memory Write | |
| Average of class Gaming (22297 - 135096, n=105, last 2 years) | |
| Schenker XMG Focus 17 (E23) | |
| Average Intel Core i7-13700H (22986 - 99898, n=29) | |
| Acer Nitro 17 AN17-51-71ER | |
| MSI Pulse 17 B13VGK | |
| Asus ROG Strix G17 G713PI | |
| MSI Katana 17 B13VFK | |
| MSI Pulse GL76 12UGK | |
| AIDA64 / Memory Latency | |
| Acer Nitro 17 AN17-51-71ER | |
| Average of class Gaming (75.3 - 259, n=105, last 2 years) | |
| MSI Katana 17 B13VFK | |
| MSI Pulse 17 B13VGK | |
| Average Intel Core i7-13700H (82.4 - 136.8, n=29) | |
| MSI Pulse GL76 12UGK | |
| Schenker XMG Focus 17 (E23) | |
| Asus ROG Strix G17 G713PI | |
* ... smaller is better
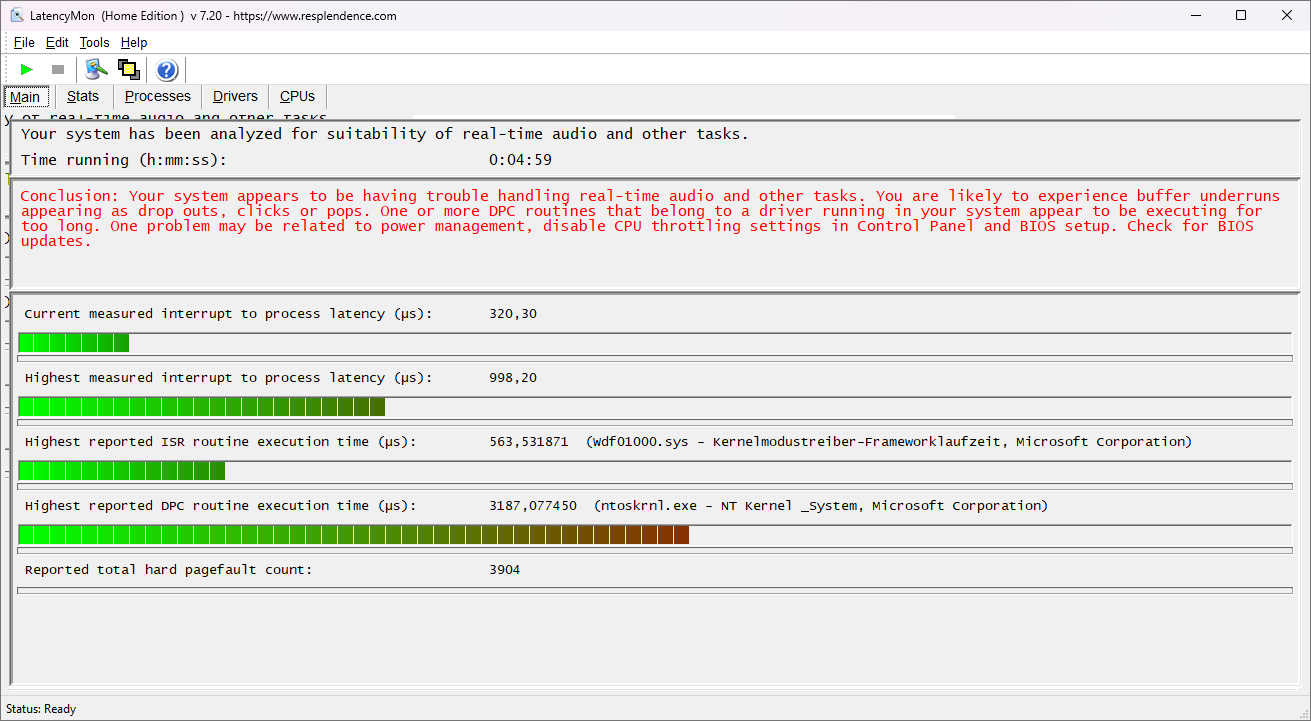
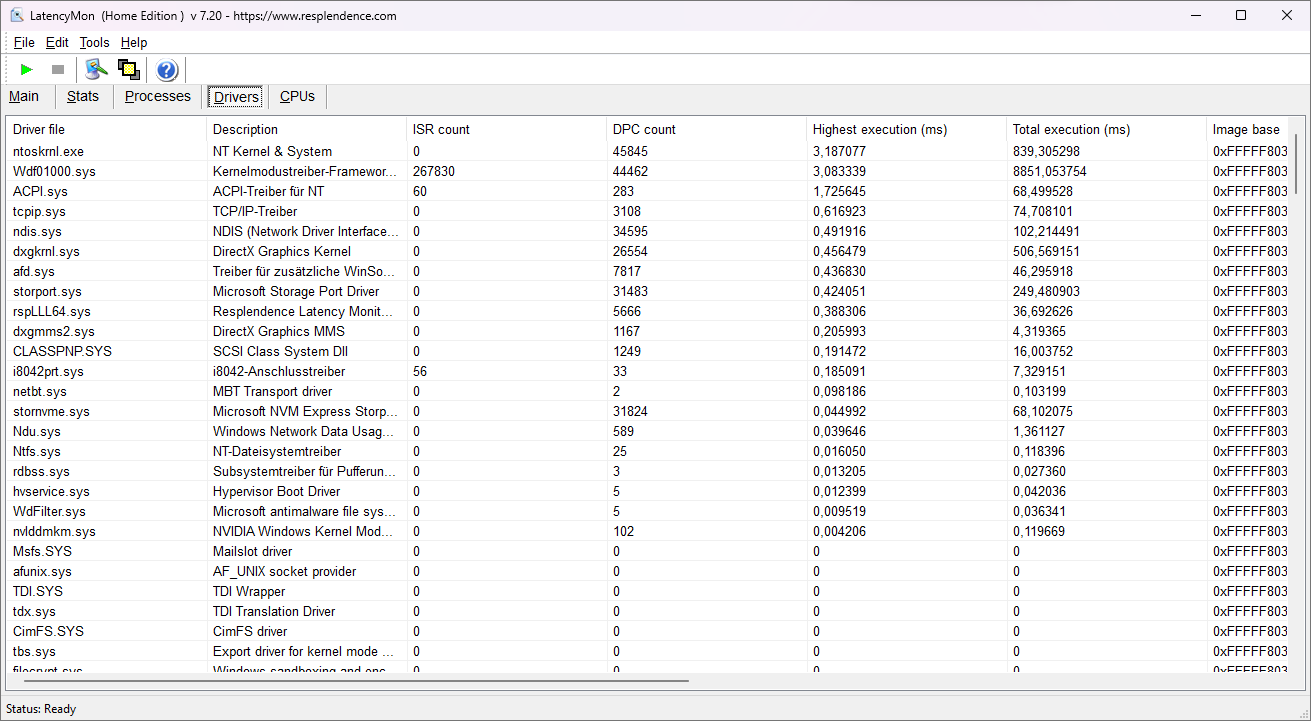
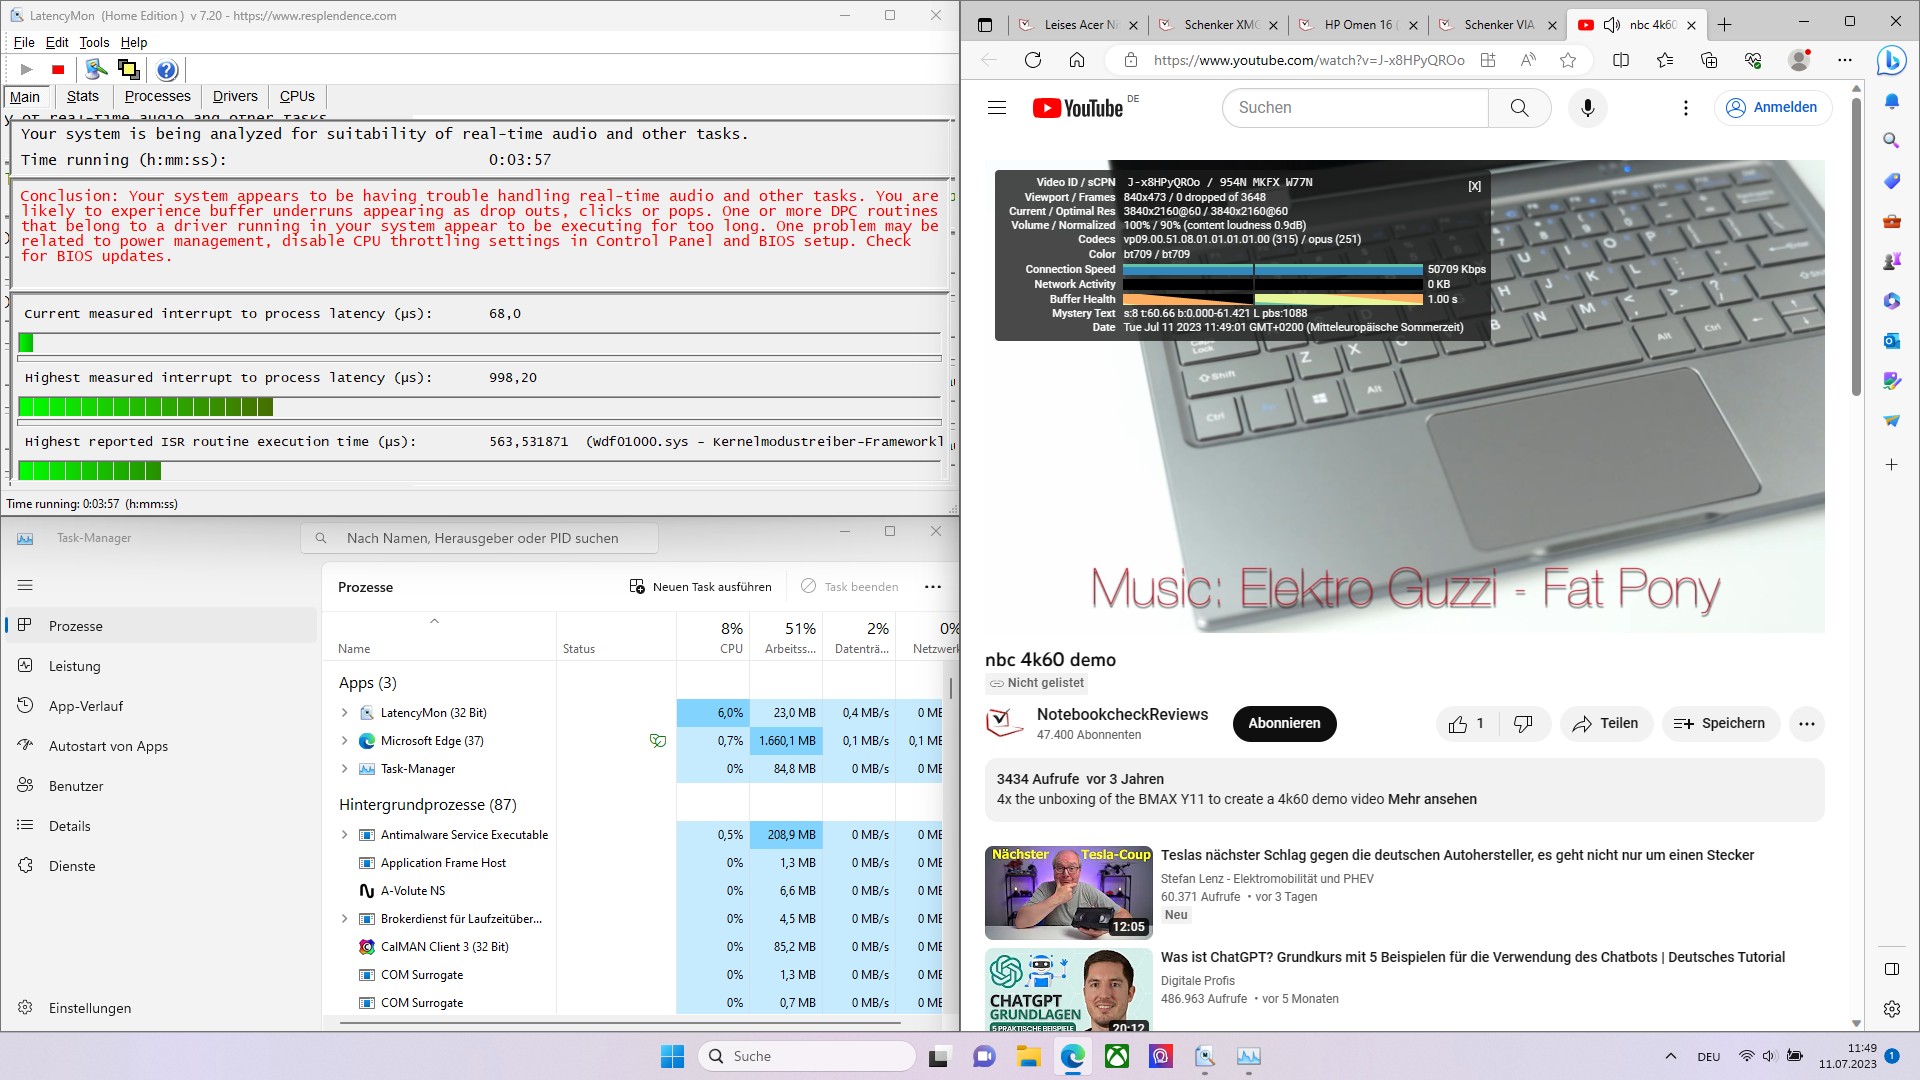
DPC Latencies
In the DPC latencies, LatencyMon determines that the gaming laptop with the available updates at the time of the test is not suited for real-time processing of audio. The problem apparently lies in the Windows Kernel here.
| DPC Latencies / LatencyMon - interrupt to process latency (max), Web, Youtube, Prime95 | |
| MSI Katana 17 B13VFK | |
| Asus ROG Strix G17 G713PI | |
| Acer Nitro 17 AN17-51-71ER | |
| MSI Pulse 17 B13VGK | |
| Schenker XMG Focus 17 (E23) | |
| MSI Pulse GL76 12UGK | |
* ... smaller is better
Storage Solution
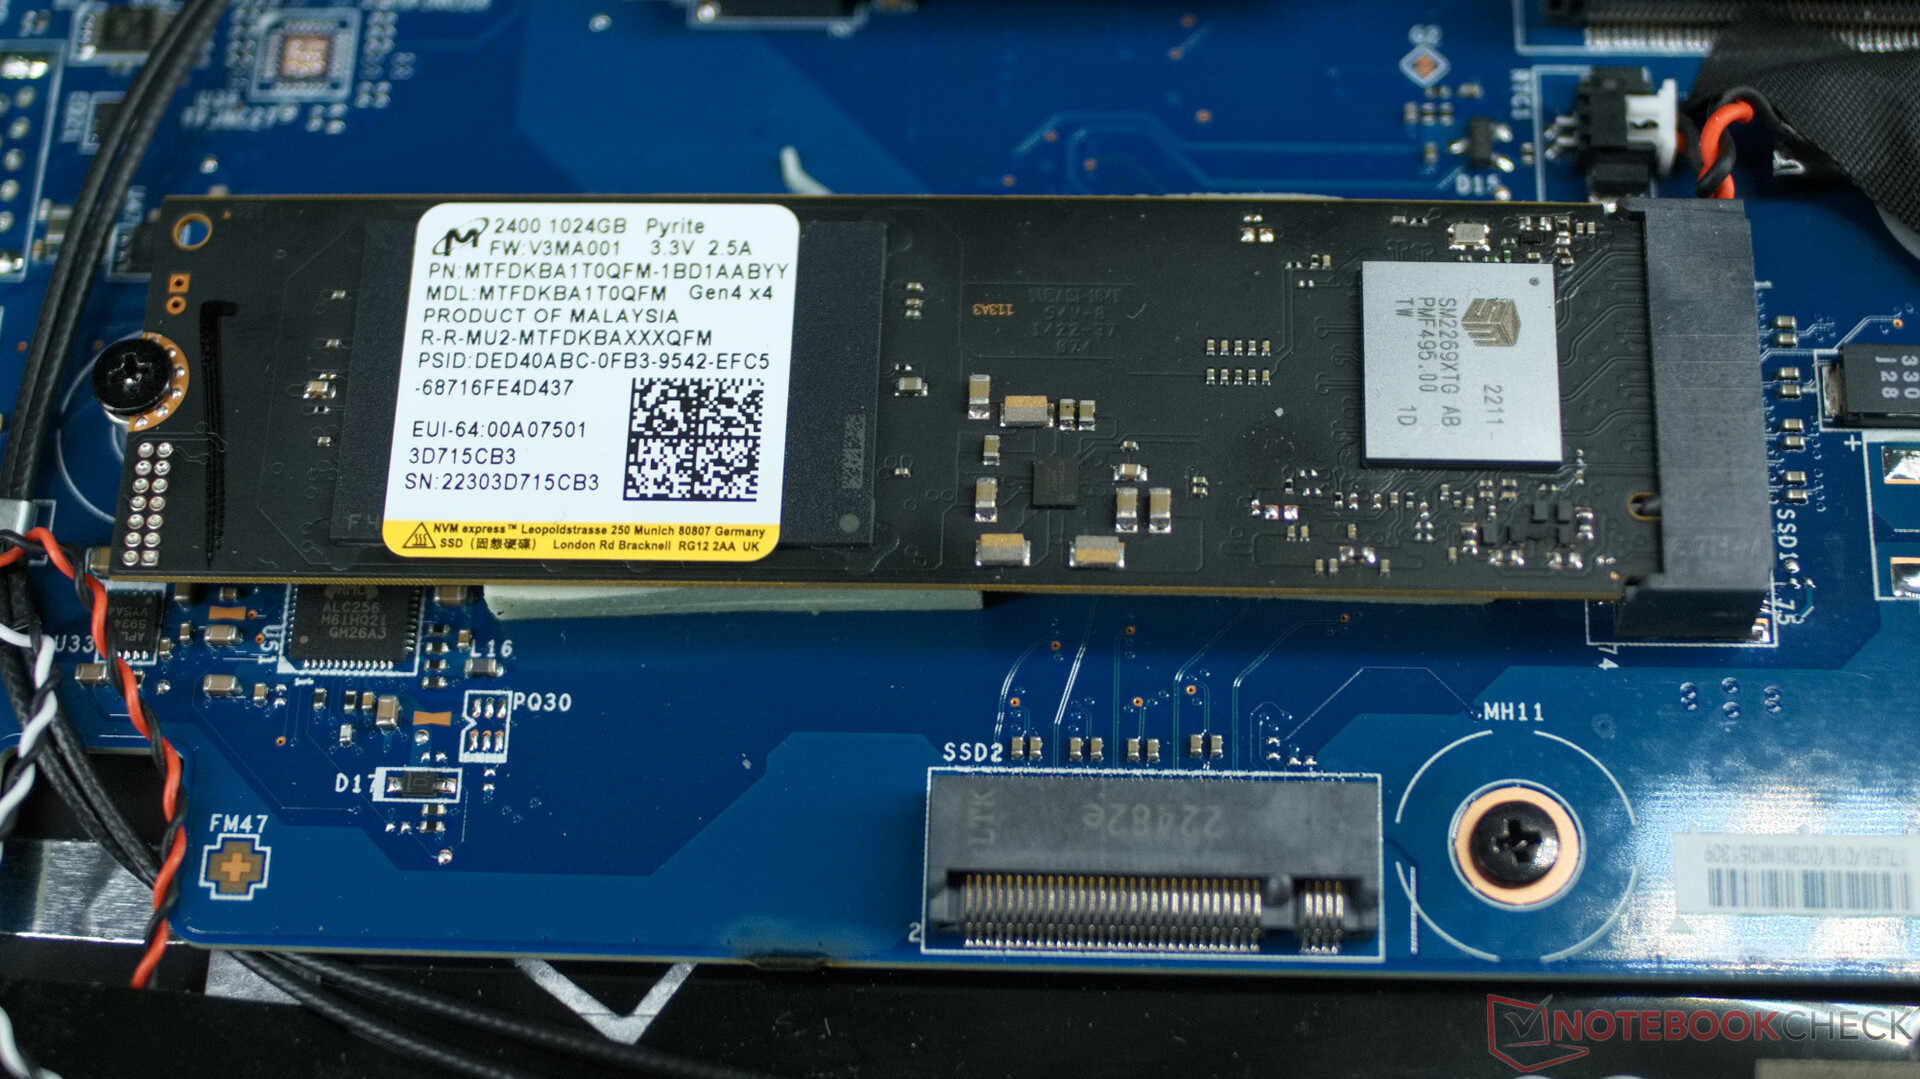
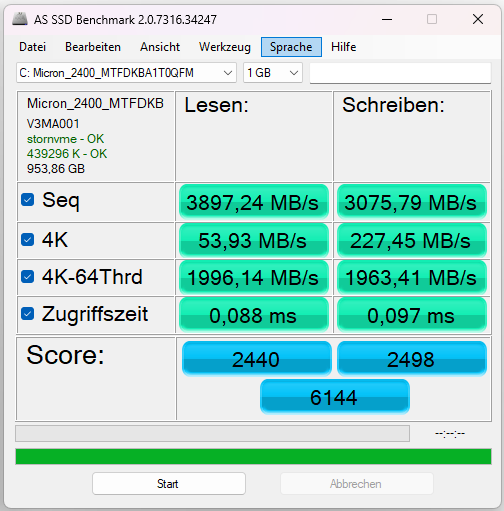
The Micron 2400 NVMe SSD in our test unit offers a capacity of 1 Terabyte. Its speed is average among the gaming laptops and can also be maintained constantly in the MSI Pulse 17 for longer time periods without any problems.

* ... smaller is better
Constant Read Performance: DiskSpd Read Loop, Queue Depth 8
Graphics Card
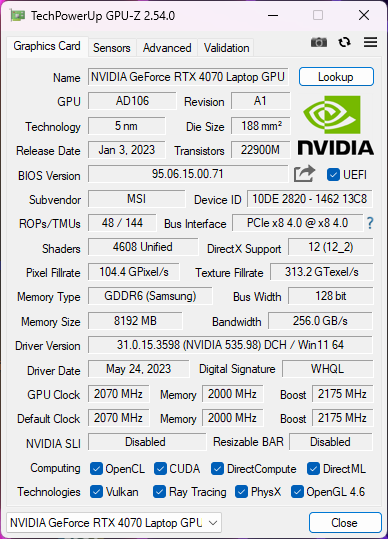
The Nvidia RTX 4070 is able to run constantly at a powerful 100 to 140 watts in the MSI Pulse 17 without the temperatures in the chip becoming too hot here. With this, the graphics chip delivers a comparatively high performance in the 3DMark benchmarks. This means that Full HD gaming and some slight raytracing shouldn't pose any problems for the graphics card, and the chip also speedily masters practical applications such as rendering of 3D graphics in programs such as Blender.
| 3DMark 11 Performance | 34584 points | |
| 3DMark Cloud Gate Standard Score | 70329 points | |
| 3DMark Fire Strike Score | 27138 points | |
| 3DMark Time Spy Score | 12235 points | |
Help | ||
| Geekbench 6.7 - GPU OpenCL | |
| Average of class Gaming (67235 - 253130, n=103, last 2 years) | |
| MSI Pulse 17 B13VGK | |
| Average NVIDIA GeForce RTX 4070 Laptop GPU (85488 - 129836, n=45) | |
* ... smaller is better
Gaming Performance
The Schenker XMG Focus 17 and Asus ROG Strix G17 have a slight advantage compared to the MSI Pulse 17 here. Both laptops simply offer a faster processor, which is clearly reflected in the frame rates of the CPU-heavy games such as Dota 2 Reborn. However, the Pulse 17 also shows that Full HD gaming and more at high quality settings and even raytracing is possible without going lower than 60 frames per second. At the same time, the laptop remains significantly quieter than the other competitors, and you can play games here without any drop in performance in Balanced mode at a noise level of only 42 dB(A) (measured from a distance of 15 cm, ~6 in).
| Performance rating - Percent | |
| Average of class Gaming | |
| Asus ROG Strix G17 G713PI | |
| Schenker XMG Focus 17 (E23) | |
| MSI Katana 17 B13VFK | |
| MSI Pulse 17 B13VGK | |
| Acer Nitro 17 AN17-51-71ER | |
| MSI Pulse GL76 12UGK | |
| The Witcher 3 - 1920x1080 Ultra Graphics & Postprocessing (HBAO+) | |
| Average of class Gaming (104.7 - 240, n=7, last 2 years) | |
| Asus ROG Strix G17 G713PI | |
| Schenker XMG Focus 17 (E23) | |
| MSI Pulse 17 B13VGK | |
| Acer Nitro 17 AN17-51-71ER | |
| MSI Katana 17 B13VFK | |
| MSI Pulse GL76 12UGK | |
| GTA V - 1920x1080 Highest AA:4xMSAA + FX AF:16x | |
| Average of class Gaming (48.3 - 186.9, n=94, last 2 years) | |
| Schenker XMG Focus 17 (E23) | |
| MSI Pulse 17 B13VGK | |
| Acer Nitro 17 AN17-51-71ER | |
| Asus ROG Strix G17 G713PI | |
| MSI Katana 17 B13VFK | |
| MSI Pulse GL76 12UGK | |
| Final Fantasy XV Benchmark - 1920x1080 High Quality | |
| Average of class Gaming (41 - 215, n=95, last 2 years) | |
| Schenker XMG Focus 17 (E23) | |
| Asus ROG Strix G17 G713PI | |
| MSI Pulse 17 B13VGK | |
| Acer Nitro 17 AN17-51-71ER | |
| MSI Katana 17 B13VFK | |
| MSI Pulse GL76 12UGK | |
| Strange Brigade - 1920x1080 ultra AA:ultra AF:16 | |
| Average of class Gaming (76.3 - 458, n=87, last 2 years) | |
| Schenker XMG Focus 17 (E23) | |
| Asus ROG Strix G17 G713PI | |
| MSI Pulse 17 B13VGK | |
| Acer Nitro 17 AN17-51-71ER | |
| MSI Katana 17 B13VFK | |
| MSI Pulse GL76 12UGK | |
| Dota 2 Reborn - 1920x1080 ultra (3/3) best looking | |
| Schenker XMG Focus 17 (E23) | |
| Asus ROG Strix G17 G713PI | |
| MSI Katana 17 B13VFK | |
| Average of class Gaming (84.8 - 248, n=107, last 2 years) | |
| MSI Pulse 17 B13VGK | |
| Acer Nitro 17 AN17-51-71ER | |
| MSI Pulse GL76 12UGK | |
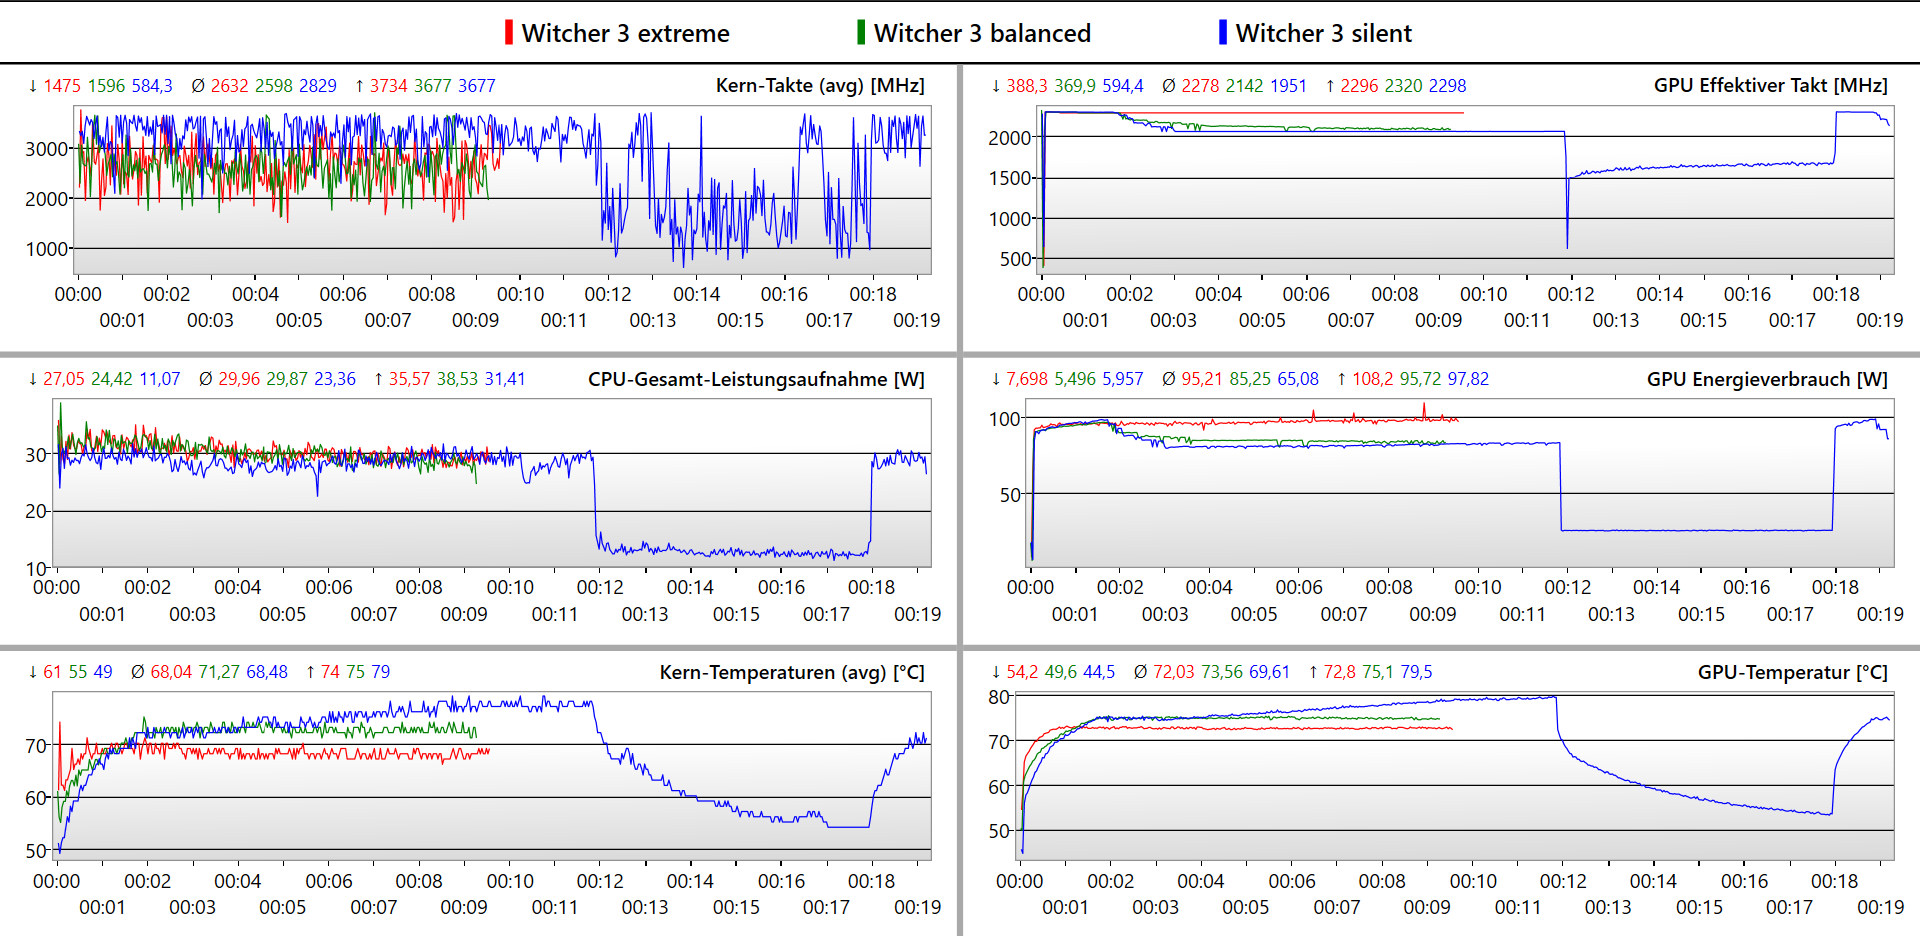
In the hour-long test with The Witcher 3, the typical FPS range in the day and night rhythm of the game is shown. We don't see any significant outliers here.
The Witcher 3 FPS Chart
| low | med. | high | ultra | QHD | 4K | |
|---|---|---|---|---|---|---|
| GTA V (2015) | 184.8 | 182.2 | 176.9 | 116.4 | ||
| The Witcher 3 (2015) | 106.9 | |||||
| Dota 2 Reborn (2015) | 174 | 158 | 146.3 | 138.5 | 132.4 | |
| Final Fantasy XV Benchmark (2018) | 150.5 | 111.9 | 86.2 | 47.5 | ||
| X-Plane 11.11 (2018) | 147.6 | 130.8 | 102 | 102.2 | ||
| Far Cry 5 (2018) | 163 | 154 | 145 | |||
| Strange Brigade (2018) | 468 | 295 | 233 | 202 | ||
| F1 22 (2022) | 239 | 228 | 186.7 | 71 | ||
| F1 23 (2023) | 248 | 251 | 199.2 | 100 |
Emissions - Quiet fans
Noise Emissions
The MSI Pulse 17 is extremely quiet for a gaming laptop. We measure a maximum noise level of only 46.5 dB(A) under load in the Performance mode, and in the Balanced mode it is even up to 4 dB(A) lower. The fans are also audible with a delay under load. For example, they only become active shortly before the end of the benchmark in our measurement under average loads with PCMark 06.
Noise level
| Idle |
| 24 / 24 / 24 dB(A) |
| Load |
| 32.49 / 46.51 dB(A) |
 | ||
30 dB silent 40 dB(A) audible 50 dB(A) loud |
||
min: | ||
| MSI Pulse 17 B13VGK GeForce RTX 4070 Laptop GPU, i7-13700H, Micron 2400 MTFDKBA1T0QFM | MSI Pulse GL76 12UGK GeForce RTX 3070 Laptop GPU, i7-12700H, Micron 3400 1TB MTFDKBA1T0TFH | MSI Katana 17 B13VFK GeForce RTX 4060 Laptop GPU, i7-13620H, Micron 2400 MTFDKBA1T0QFM | Acer Nitro 17 AN17-51-71ER GeForce RTX 4060 Laptop GPU, i7-13700H, Samsung PM9A1 MZVL21T0HCLR | Schenker XMG Focus 17 (E23) GeForce RTX 4070 Laptop GPU, i9-13900HX, Crucial P5 Plus 1TB CT1000P5PSSD8 | Asus ROG Strix G17 G713PI GeForce RTX 4070 Laptop GPU, R9 7945HX, WD PC SN560 SDDPNQE-1T00 | |
|---|---|---|---|---|---|---|
| Noise | -13% | -24% | -11% | -19% | -14% | |
| off / environment * (dB) | 24 | 24.1 -0% | 24.5 -2% | 24 -0% | 24 -0% | 25 -4% |
| Idle Minimum * (dB) | 24 | 26.9 -12% | 24.5 -2% | 24 -0% | 24 -0% | 26 -8% |
| Idle Average * (dB) | 24 | 26.9 -12% | 24.5 -2% | 24 -0% | 24 -0% | 29 -21% |
| Idle Maximum * (dB) | 24 | 27 -13% | 40 -67% | 32.32 -35% | 26.47 -10% | 30 -25% |
| Load Average * (dB) | 32.49 | 43.8 -35% | 48.3 -49% | 35.18 -8% | 55.72 -71% | 46 -42% |
| Witcher 3 ultra * (dB) | 46.51 | 44.7 4% | 56 -20% | 54.78 -18% | 57.94 -25% | 46 1% |
| Load Maximum * (dB) | 46.51 | 58.3 -25% | 59.1 -27% | 54.78 -18% | 57.94 -25% | 47 -1% |
* ... smaller is better
Temperatures
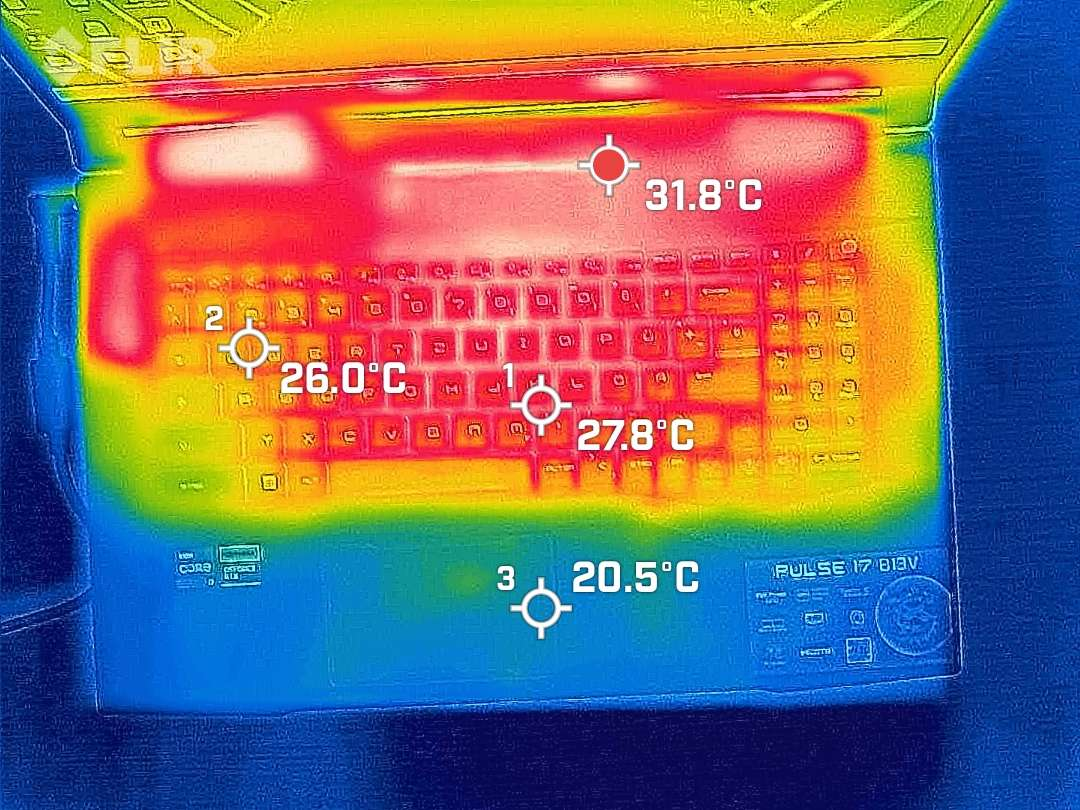
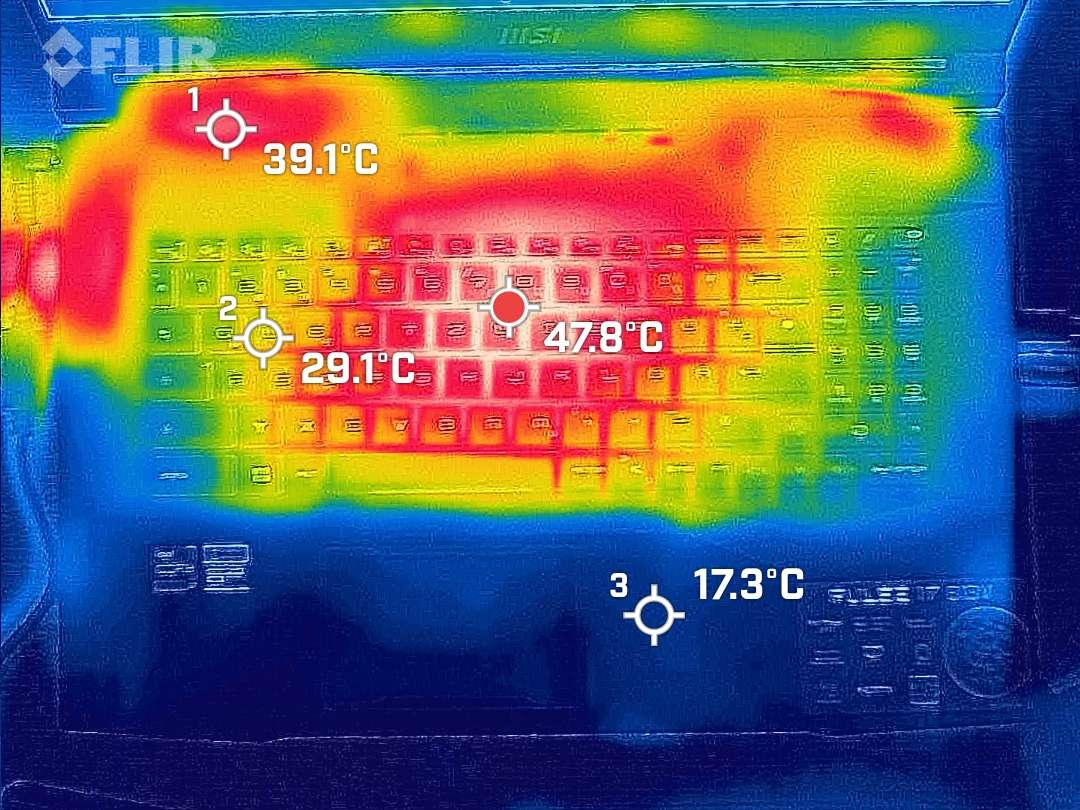
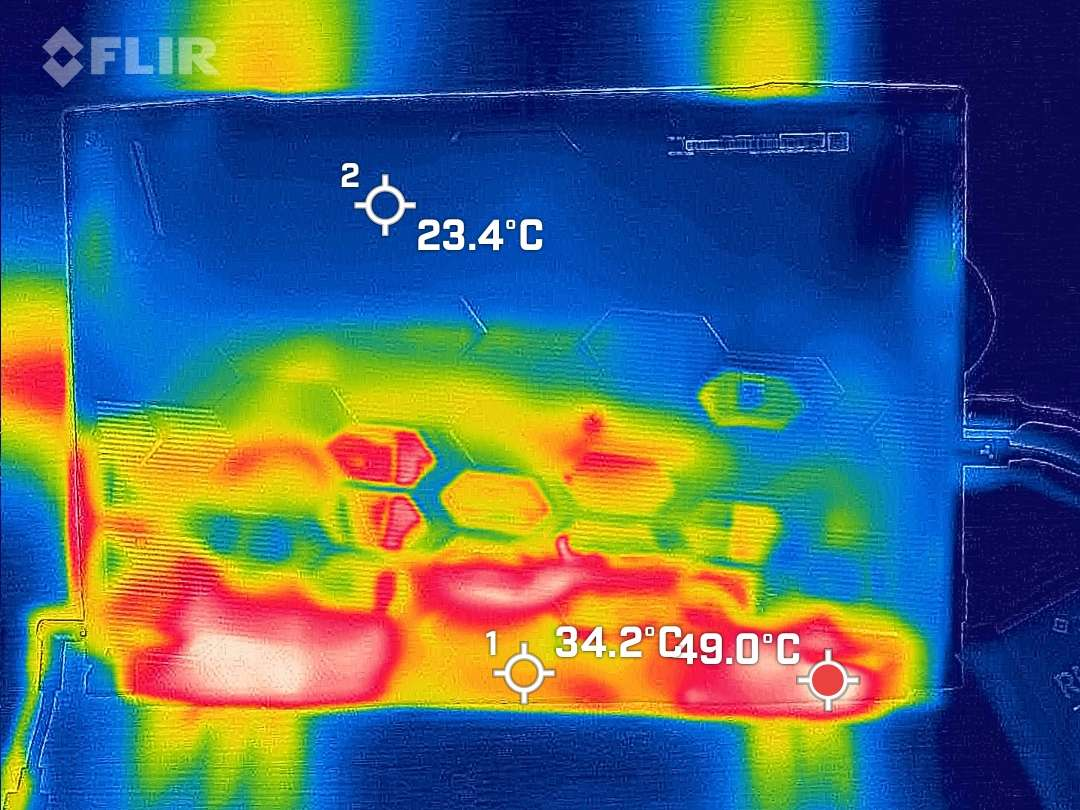
In our test unit, the surface temperatures of the palm rests remain consistently cool and only barely higher than room temperature. The maximum temperature of the device is 48 °C (118 °F) and that is spread over large areas at the back edge above and below the cooling system, as well as in the center of the keyboard. However, the temperatures remain within tolerable ranges in the areas important for gaming as well as at the bottom of the high performance gaming laptop.
(-) The maximum temperature on the upper side is 48 °C / 118 F, compared to the average of 40.4 °C / 105 F, ranging from 21.2 to 68.8 °C for the class Gaming.
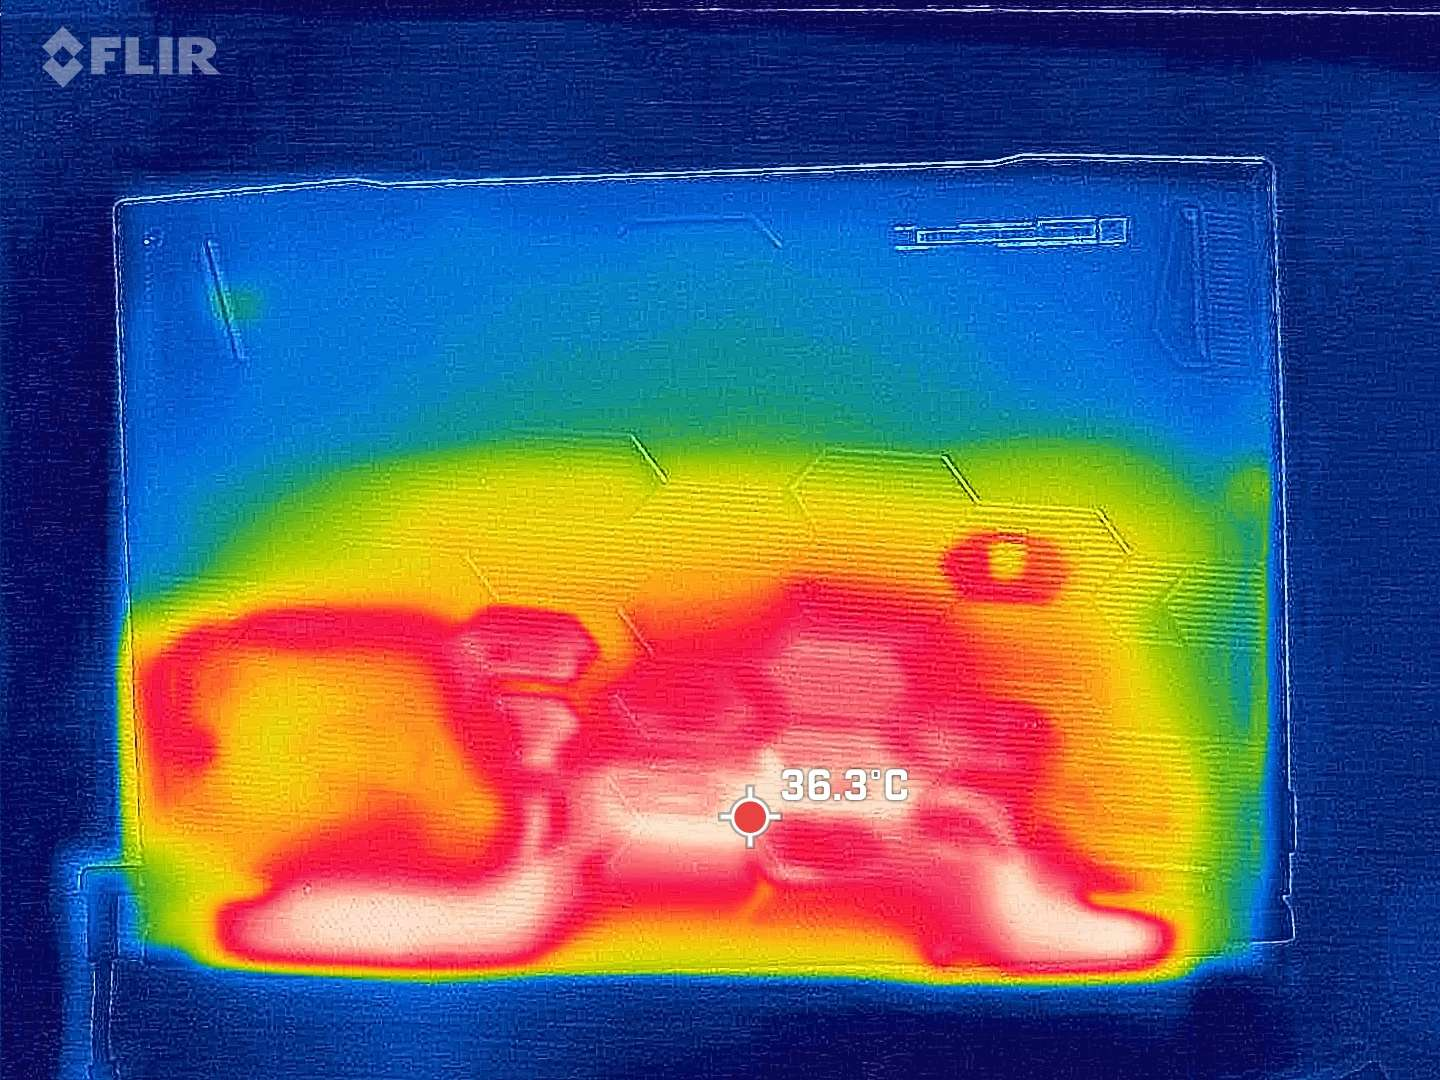
(-) The bottom heats up to a maximum of 50 °C / 122 F, compared to the average of 43.2 °C / 110 F
(+) In idle usage, the average temperature for the upper side is 27.8 °C / 82 F, compared to the device average of 33.9 °C / 93 F.
(±) Playing The Witcher 3, the average temperature for the upper side is 37 °C / 99 F, compared to the device average of 33.9 °C / 93 F.
(+) The palmrests and touchpad are cooler than skin temperature with a maximum of 24 °C / 75.2 F and are therefore cool to the touch.
(+) The average temperature of the palmrest area of similar devices was 28.8 °C / 83.8 F (+4.8 °C / 8.6 F).
| MSI Pulse 17 B13VGK Intel Core i7-13700H, NVIDIA GeForce RTX 4070 Laptop GPU | |
|---|---|
| Heat | |
| Maximum Upper Side * (°C) | 48 |
| Maximum Bottom * (°C) | 50 |
| Idle Upper Side * (°C) | 30 |
| Idle Bottom * (°C) | 33 |
* ... smaller is better
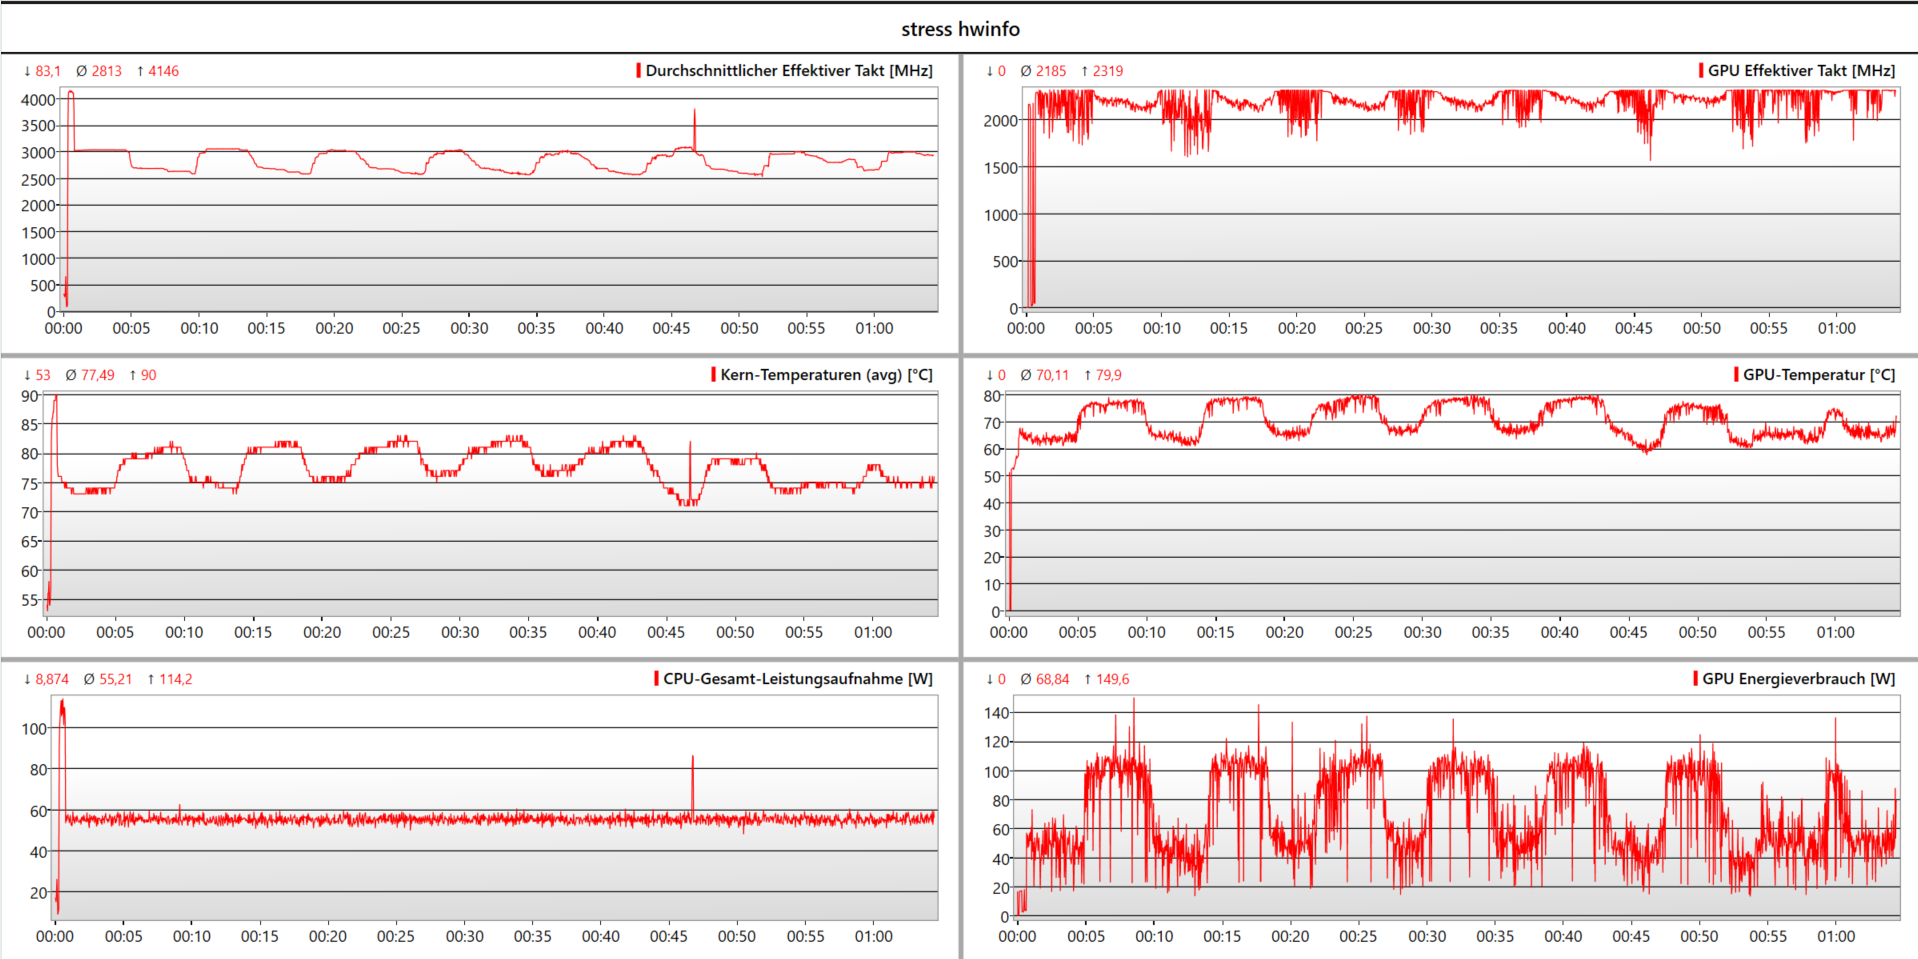
Stress Test
We run the stress test on the almost new MSI Pulse 17. Apparently, the target temperature of the GPU is around 80 °C (176 °F). As soon as this value is reached, the performance is throttled until the GPU has cooled down a bit. This causes some waves in our log of the stress test with Prime95 and Furmark. After its short boost phase, the Core i7 runs constantly at around 55 watts. The RTX 4070 repeatedly has to throttle from to 110 watts down to 50 watts. In the later parts of our test of the MSI Pulse 17, the power control of the laptop has stabilized significantly, so that we can assume some learning effect here.
Speakers
The overemphasized mids make the MSI Pulse 17 sound a bit tinny. However, at up to 85 dB(A), the small speakers are relatively loud and easily able to drown out the quiet fans in this gaming laptop. Those who don't like the speakers can connect external devices using Bluetooth or the 3.5 mm audio port.
MSI Pulse 17 B13VGK audio analysis
(+) | speakers can play relatively loud (85.01 dB)
Bass 100 - 315 Hz
(±) | reduced bass - on average 13.2% lower than median
(±) | linearity of bass is average (12.3% delta to prev. frequency)
Mids 400 - 2000 Hz
(±) | higher mids - on average 9.4% higher than median
(+) | mids are linear (5.7% delta to prev. frequency)
Highs 2 - 16 kHz
(+) | balanced highs - only 2.9% away from median
(+) | highs are linear (6.7% delta to prev. frequency)
Overall 100 - 16.000 Hz
(±) | linearity of overall sound is average (15.8% difference to median)
Compared to same class
» 37% of all tested devices in this class were better, 7% similar, 56% worse
» The best had a delta of 6%, average was 18%, worst was 132%
Compared to all devices tested
» 24% of all tested devices were better, 5% similar, 70% worse
» The best had a delta of 4%, average was 23%, worst was 134%
Apple MacBook Pro 16 2021 M1 Pro audio analysis
(+) | speakers can play relatively loud (84.7 dB)
Bass 100 - 315 Hz
(+) | good bass - only 3.8% away from median
(+) | bass is linear (5.2% delta to prev. frequency)
Mids 400 - 2000 Hz
(+) | balanced mids - only 1.3% away from median
(+) | mids are linear (2.1% delta to prev. frequency)
Highs 2 - 16 kHz
(+) | balanced highs - only 1.9% away from median
(+) | highs are linear (2.7% delta to prev. frequency)
Overall 100 - 16.000 Hz
(+) | overall sound is linear (4.6% difference to median)
Compared to same class
» 0% of all tested devices in this class were better, 0% similar, 100% worse
» The best had a delta of 5%, average was 17%, worst was 45%
Compared to all devices tested
» 0% of all tested devices were better, 0% similar, 100% worse
» The best had a delta of 4%, average was 23%, worst was 134%
Power Management - 90 Wh battery ensures a long battery life
Power Consumption
While the maximum power consumption of the Pulse 17 under load is fairly typical for the laptop class, during idle operation and even under moderate loads, our test unit is unusually efficient for a gaming laptop.
| Off / Standby | |
| Idle | |
| Load |
|
Key:
min: | |
| MSI Pulse 17 B13VGK i7-13700H, GeForce RTX 4070 Laptop GPU, Micron 2400 MTFDKBA1T0QFM, IPS, 1920x1080, 17.3" | MSI Pulse GL76 12UGK i7-12700H, GeForce RTX 3070 Laptop GPU, Micron 3400 1TB MTFDKBA1T0TFH, IPS, 1920x1080, 17.3" | MSI Katana 17 B13VFK i7-13620H, GeForce RTX 4060 Laptop GPU, Micron 2400 MTFDKBA1T0QFM, IPS LED, 1920x1080, 17.3" | Acer Nitro 17 AN17-51-71ER i7-13700H, GeForce RTX 4060 Laptop GPU, Samsung PM9A1 MZVL21T0HCLR, , 2560x1440, 17.3" | Schenker XMG Focus 17 (E23) i9-13900HX, GeForce RTX 4070 Laptop GPU, Crucial P5 Plus 1TB CT1000P5PSSD8, IPS, 2560x1440, 17.3" | Asus ROG Strix G17 G713PI R9 7945HX, GeForce RTX 4070 Laptop GPU, WD PC SN560 SDDPNQE-1T00, IPS, 2560x1440, 17.3" | Average NVIDIA GeForce RTX 4070 Laptop GPU | Average of class Gaming | |
|---|---|---|---|---|---|---|---|---|
| Power Consumption | -45% | -26% | -18% | -97% | -75% | -58% | -66% | |
| Idle Minimum * (Watt) | 9 | 12.4 -38% | 12.2 -36% | 8.3 8% | 17 -89% | 15 -67% | 13.2 ? -47% | 13 ? -44% |
| Idle Average * (Watt) | 10.2 | 13.1 -28% | 14.9 -46% | 13.5 -32% | 18 -76% | 20 -96% | 18.2 ? -78% | 19 ? -86% |
| Idle Maximum * (Watt) | 10.8 | 25.3 -134% | 15.8 -46% | 14.8 -37% | 25.8 -139% | 29 -169% | 24.6 ? -128% | 24.6 ? -128% |
| Load Average * (Watt) | 72 | 105.4 -46% | 85.22 -18% | 77 -7% | 178 -147% | 121 -68% | 97 ? -35% | 110.7 ? -54% |
| Witcher 3 ultra * (Watt) | 130 | 150 -15% | 151.1 -16% | 154 -18% | 265 -104% | 179.8 -38% | ||
| Load Maximum * (Watt) | 221 | 240.5 -9% | 212.8 4% | 263 -19% | 275 -24% | 246 -11% | 221 ? -0% | 259 ? -17% |
* ... smaller is better
Power Consumption The Witcher 3 / Stress Test
Power Consumption With External Monitor
Battery Life
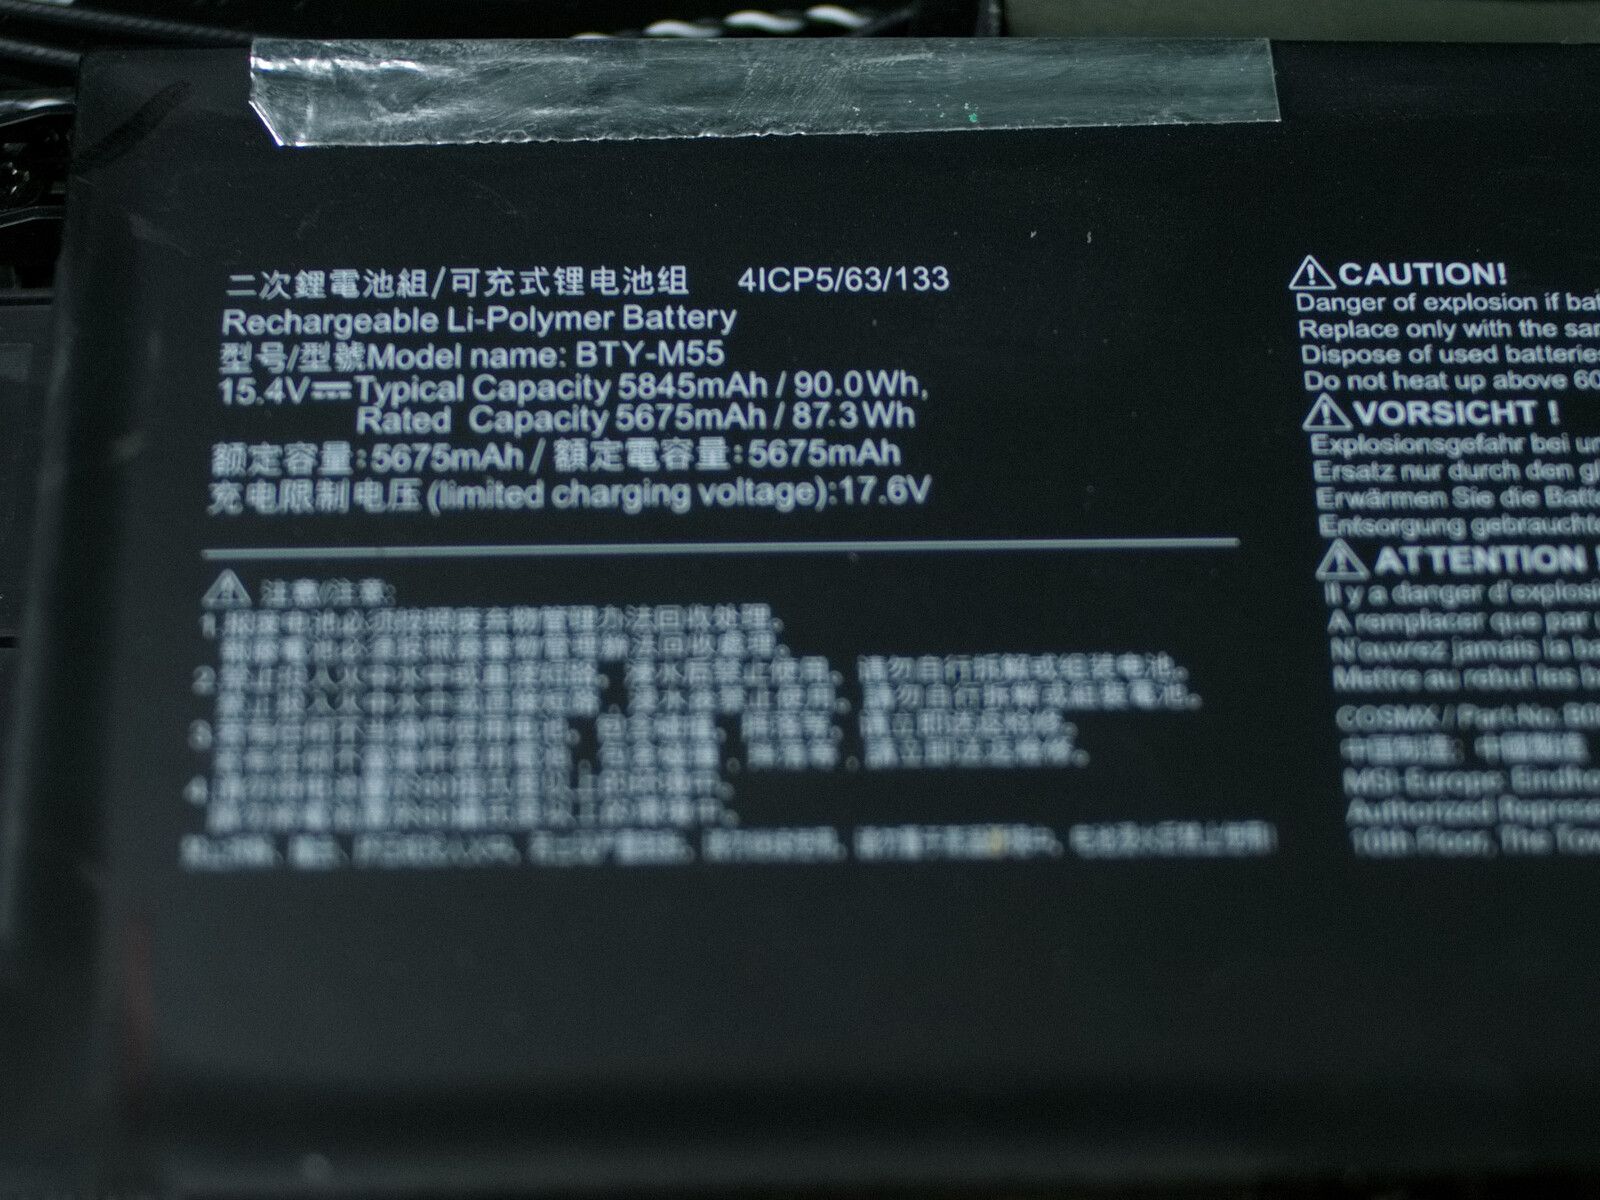
Corresponding to our measurements of the power consumption, it is also not surprising that the gaming laptop lasts for a long time with its 90-Wh battery in our WiFi web surfing test, reaching almost 9 hours here. Even under load, the battery lasts for a good 2 hours.
| MSI Pulse 17 B13VGK i7-13700H, GeForce RTX 4070 Laptop GPU, 90 Wh | MSI Pulse GL76 12UGK i7-12700H, GeForce RTX 3070 Laptop GPU, 90 Wh | MSI Katana 17 B13VFK i7-13620H, GeForce RTX 4060 Laptop GPU, 53.5 Wh | Acer Nitro 17 AN17-51-71ER i7-13700H, GeForce RTX 4060 Laptop GPU, 90 Wh | Schenker XMG Focus 17 (E23) i9-13900HX, GeForce RTX 4070 Laptop GPU, 73 Wh | Asus ROG Strix G17 G713PI R9 7945HX, GeForce RTX 4070 Laptop GPU, 90 Wh | Average of class Gaming | |
|---|---|---|---|---|---|---|---|
| Battery runtime | -20% | -62% | -9% | -57% | -54% | -27% | |
| WiFi v1.3 (h) | 9 | 5.9 -34% | 2.9 -68% | 8.2 -9% | 3.9 -57% | 4.3 -52% | 7.11 ? -21% |
| Load (h) | 2.2 | 2.1 -5% | 1 -55% | 1 -55% | 1.502 ? -32% | ||
| Reader / Idle (h) | 7.3 | 8.27 ? | |||||
| H.264 (h) | 6.9 | 3.1 | 2.8 | 8.32 ? | |||
| Witcher 3 ultra (h) | 2.5 | 1 | 1.1 |
Pros
Cons
Verdict - More steam punk than sci-fi
On the positive side of the MSI Pulse 17, there are several strong points that speak for the laptop, with an optimal performance of the Core i7 and Nvidia GeForce RTX 4070 foremost. To achieve this, the Pulse doesn't even need pulsating fans, and the laptop is particularly quiet for its performance class. Other positive points for the gaming laptop include a decent keyboard and good positioning of the external connections. The battery live is also excellent for a gaming laptop.
The Pulse 17 is a gaming laptop that is able to offer a powerful performance at a low noise level. On the other hand, the device hasn't quite arrived in the year 2023 in many other aspects.
Unfortunately, the laptop also comes with some hefty disadvantages. Aside from the MSI Katana 17, no other gaming laptop in our comparison has such a bad display. The connection equipment with slow USB 2.0 and USB 3.2 Gen 1 ports and 1 GBit/s LAN as well as the lack of 6 GHz Wi-Fi also don't present the gaming laptop as a high-end device. But what is really annoying is the blocked M.2 NVMe port, since the manufacturer could have avoided this in two ways. First, the mainboard and case would have left sufficient space to move the module slightly to the left to give some room for the battery. And second, the unnecessarily wasted PCIe lanes could also have been invested in a Thunderbolt port.
Although compared to the predecessor, the current model now offers G-Sync, MUX, and Advanced Optimus support, it still lacks Thunderbolt. In addition, the display of the predecessor was significantly better according to our measurements.
At street prices starting from 2,150 Euros (~$2,415) at the time of our test, there are many (in parts also significantly more affordable) laptops as alternatives to our test unit. The price you pay the manufacturer for the Asus ROG Stix G17 is at the same level as that of the MSI device from many vendors. Although you have to make some heavy compromises in the battery life with the laptop from Asus, otherwise the Pulse 17 and the ROG Strix G17 are fairly similar in all areas of performance. On the other hand, the display and connection equipment of the ROG Strix are significantly better.
Price and Availability
The MSI Pulse 17 B13VGK is only available from few vendors in the US such as Newegg for ~$1963, with more vendors offering it in the UK, Australia, or Canada, for example.
MSI Pulse 17 B13VGK
- 07/16/2023 v7 (old)
Marc Herter
Transparency
The selection of devices to be reviewed is made by our editorial team. The test sample was provided to the author as a loan by the manufacturer or retailer for the purpose of this review. The lender had no influence on this review, nor did the manufacturer receive a copy of this review before publication. There was no obligation to publish this review. As an independent media company, Notebookcheck is not subjected to the authority of manufacturers, retailers or publishers.
This is how Notebookcheck is testing
Every year, Notebookcheck independently reviews hundreds of laptops and smartphones using standardized procedures to ensure that all results are comparable. We have continuously developed our test methods for around 20 years and set industry standards in the process. In our test labs, high-quality measuring equipment is utilized by experienced technicians and editors. These tests involve a multi-stage validation process. Our complex rating system is based on hundreds of well-founded measurements and benchmarks, which maintains objectivity. Further information on our test methods can be found here.
Price comparison

