Schenker XMG Focus 17 (E23) in review: Gaming laptop with RTX 4070 doesn't skimp on performance
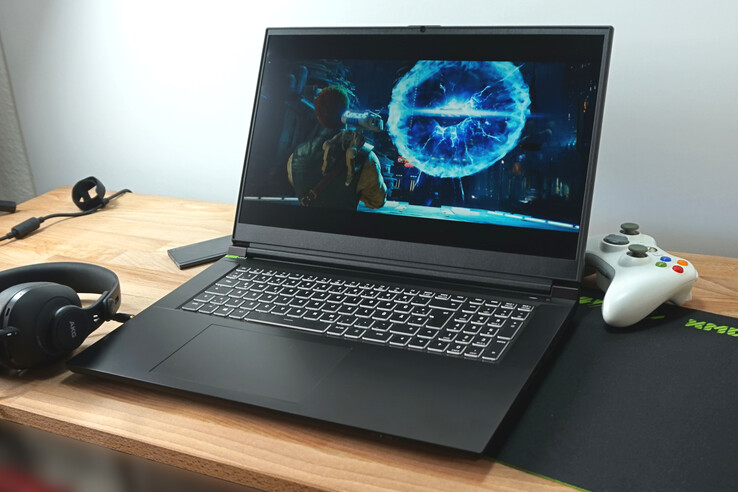
The Schenker XMG Focus 17 E23 gaming notebook (barebone: NP70SNE-G) focuses on the essentials. With the outstanding i9 processor and optionally an RTX 4050, 4060, or 4070 there is enough performance for gaming. The display also offers 240 Hz and a sufficient amount of pixels.
However, there are no extraordinary extras, special features, or the best design. The case has changed compared to our last review of the XMG Focus 17 (Clevo NP70HK) from 2021, so that more detailed information about the case, build, and equipment can be found in this article. Apart from the gaming performance, the laptop is also rather modest. In return, it stays well below 2,000 Euros (depending on the configuration) and is not much more expensive in the top configuration we tested.
The rivals like the Medion Erazer Major X20 or a Lenovo Legion Pro 5 take similar paths and use comparable hardware. However, they do not save as consistently as Schenker's laptop, as our detailed test update shows.
Possible competitors in comparison
Rating | Date | Model | Weight | Height | Size | Resolution | Price |
|---|---|---|---|---|---|---|---|
| 85.9 % v7 (old) | 06 / 2023 | Schenker XMG Focus 17 (E23) i9-13900HX, GeForce RTX 4070 Laptop GPU | 2.9 kg | 29.3 mm | 17.30" | 2560x1440 | |
| 88.4 % v7 (old) | 05 / 2023 | Lenovo Legion Pro 5 16ARX8 R7 7745HX, GeForce RTX 4070 Laptop GPU | 2.5 kg | 26.8 mm | 16.00" | 2560x1600 | |
| 89 % v7 (old) | 04 / 2023 | Medion Erazer Major X20 i9-13900HX, GeForce RTX 4070 Laptop GPU | 2.4 kg | 29 mm | 16.00" | 2560x1600 | |
| 87.6 % v7 (old) | 08 / 2022 | Schenker XMG Neo 17 M22 R9 6900HX, GeForce RTX 3080 Ti Laptop GPU | 2.8 kg | 27 mm | 17.00" | 2560x1600 | |
| 85.4 % v7 (old) | 03 / 2023 | HP Omen 17-ck2097ng i9-13900HX, GeForce RTX 4080 Laptop GPU | 2.8 kg | 27 mm | 17.30" | 2560x1440 | |
| 84.6 % v7 (old) | 05 / 2023 | Medion Erazer Defender P40 i7-13700HX, GeForce RTX 4060 Laptop GPU | 2.9 kg | 33 mm | 17.30" | 2560x1440 |
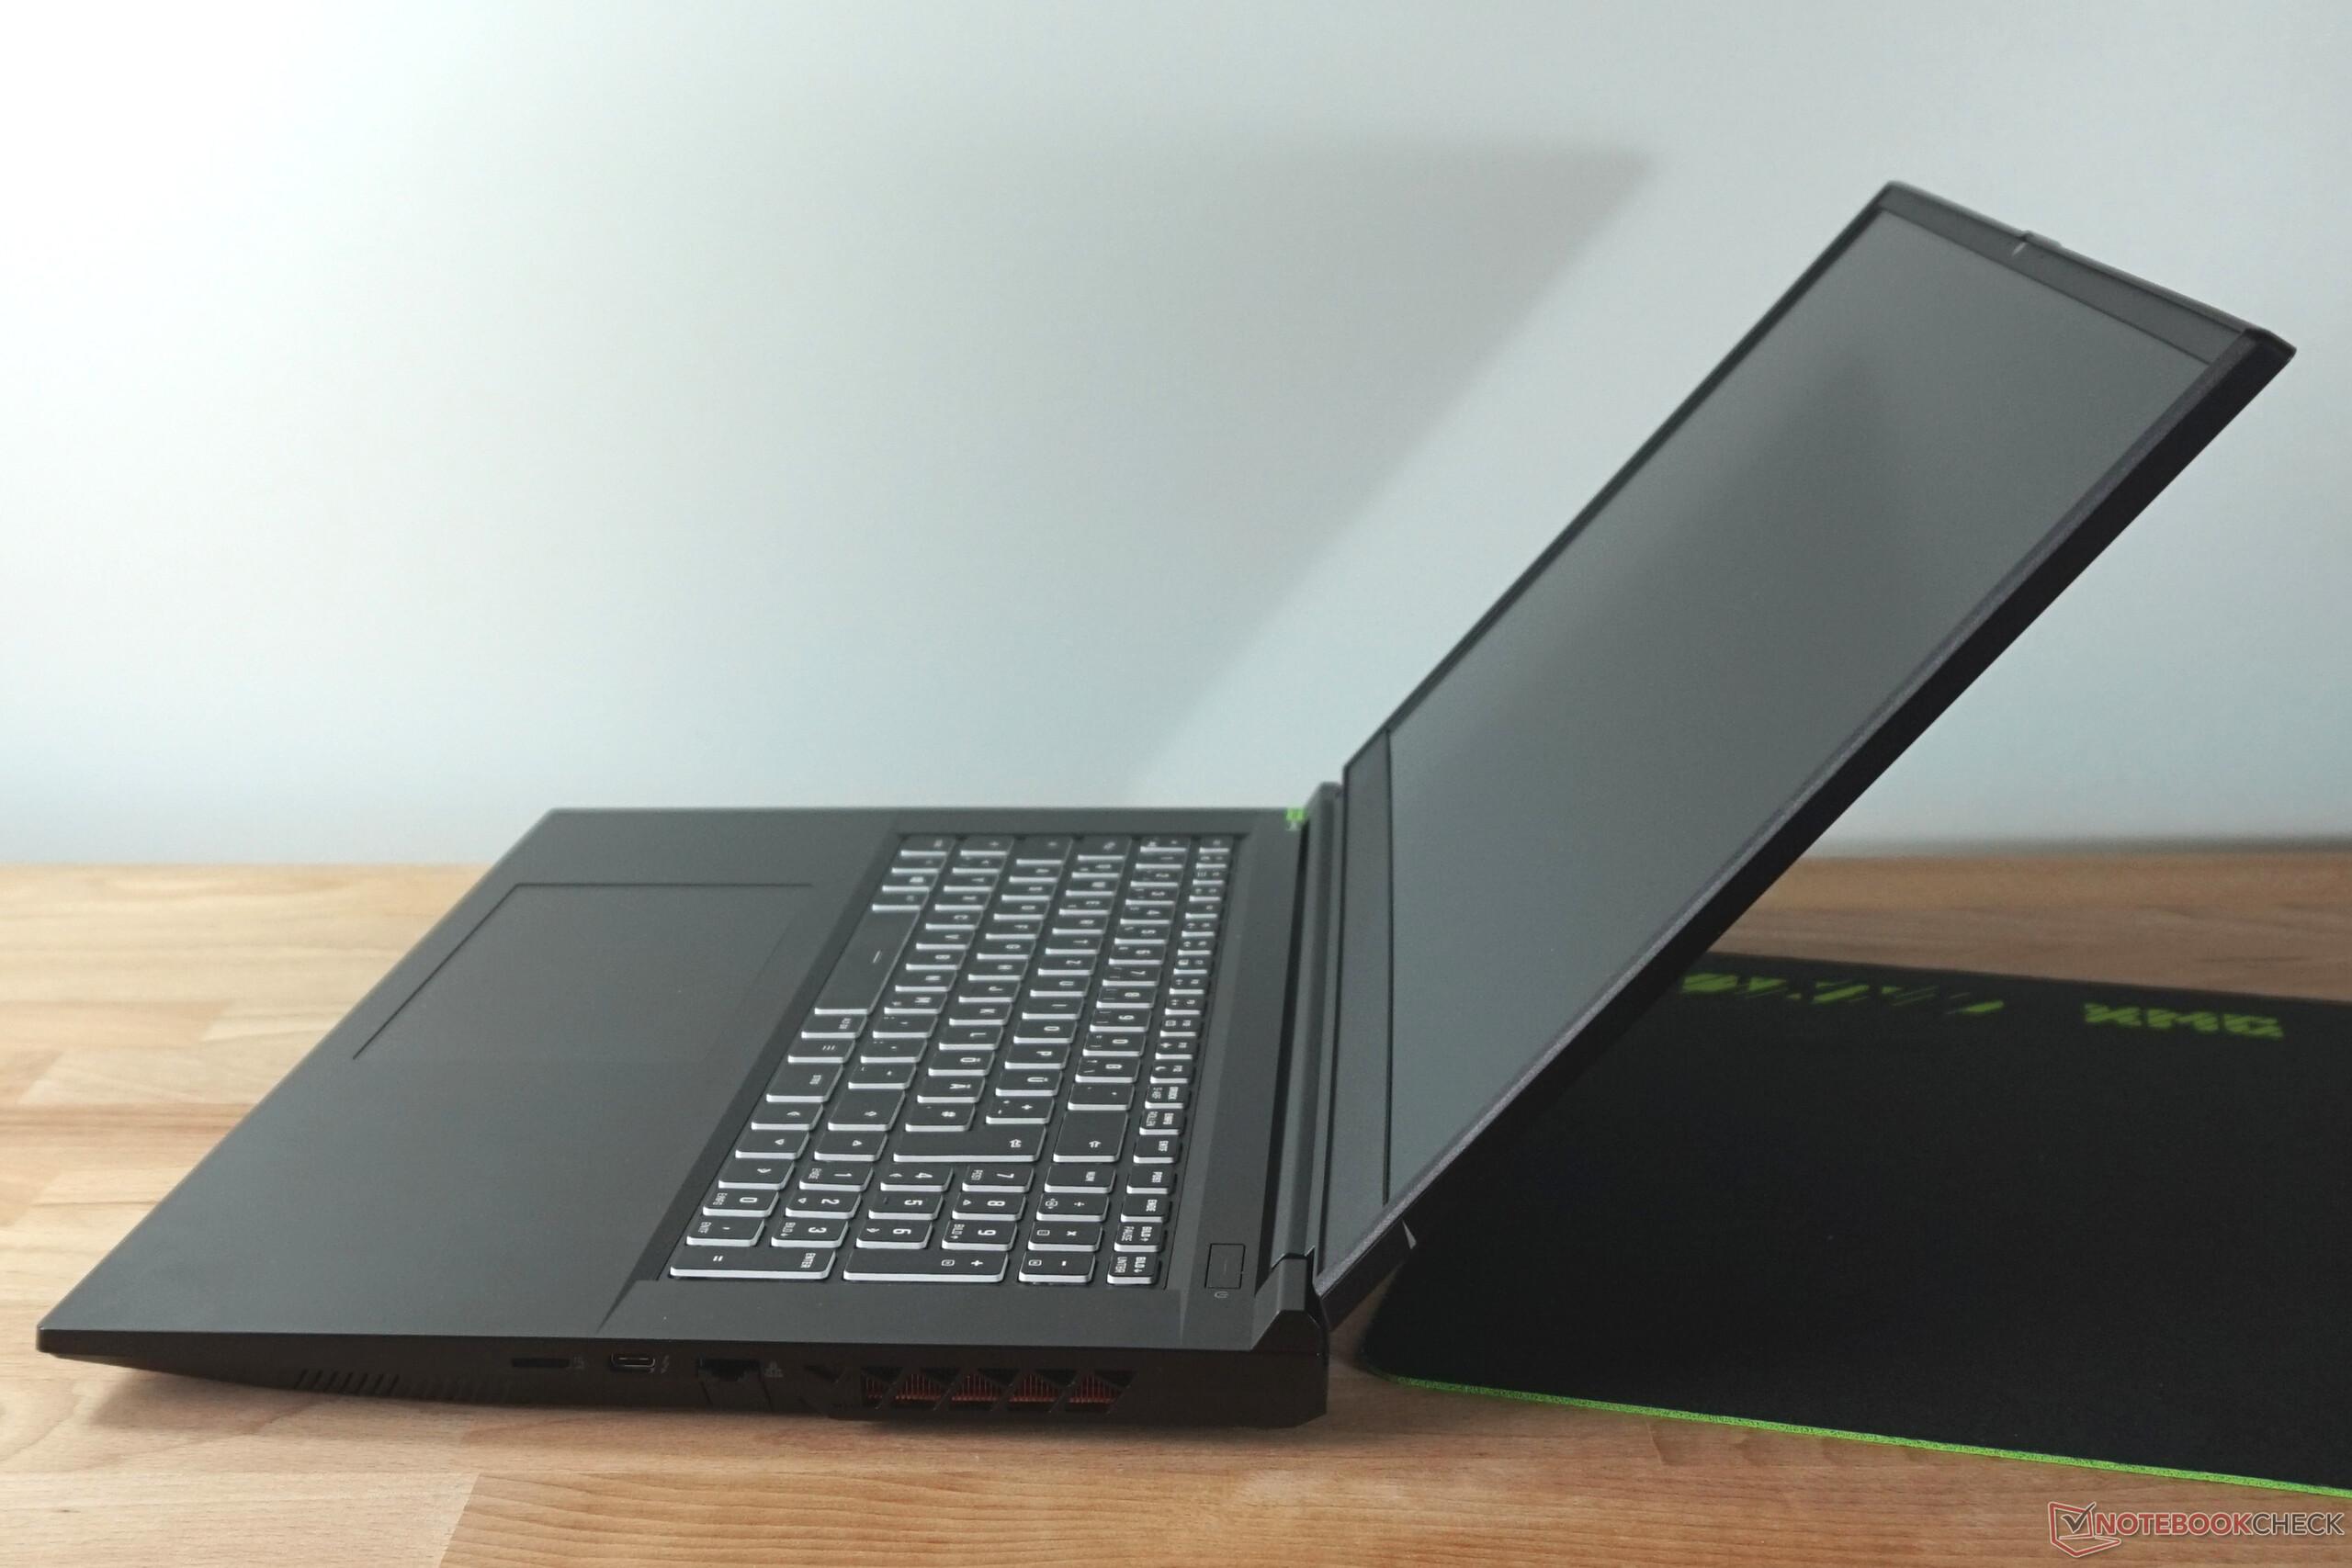
Equipment - Everything from TB4 to USB 2.0
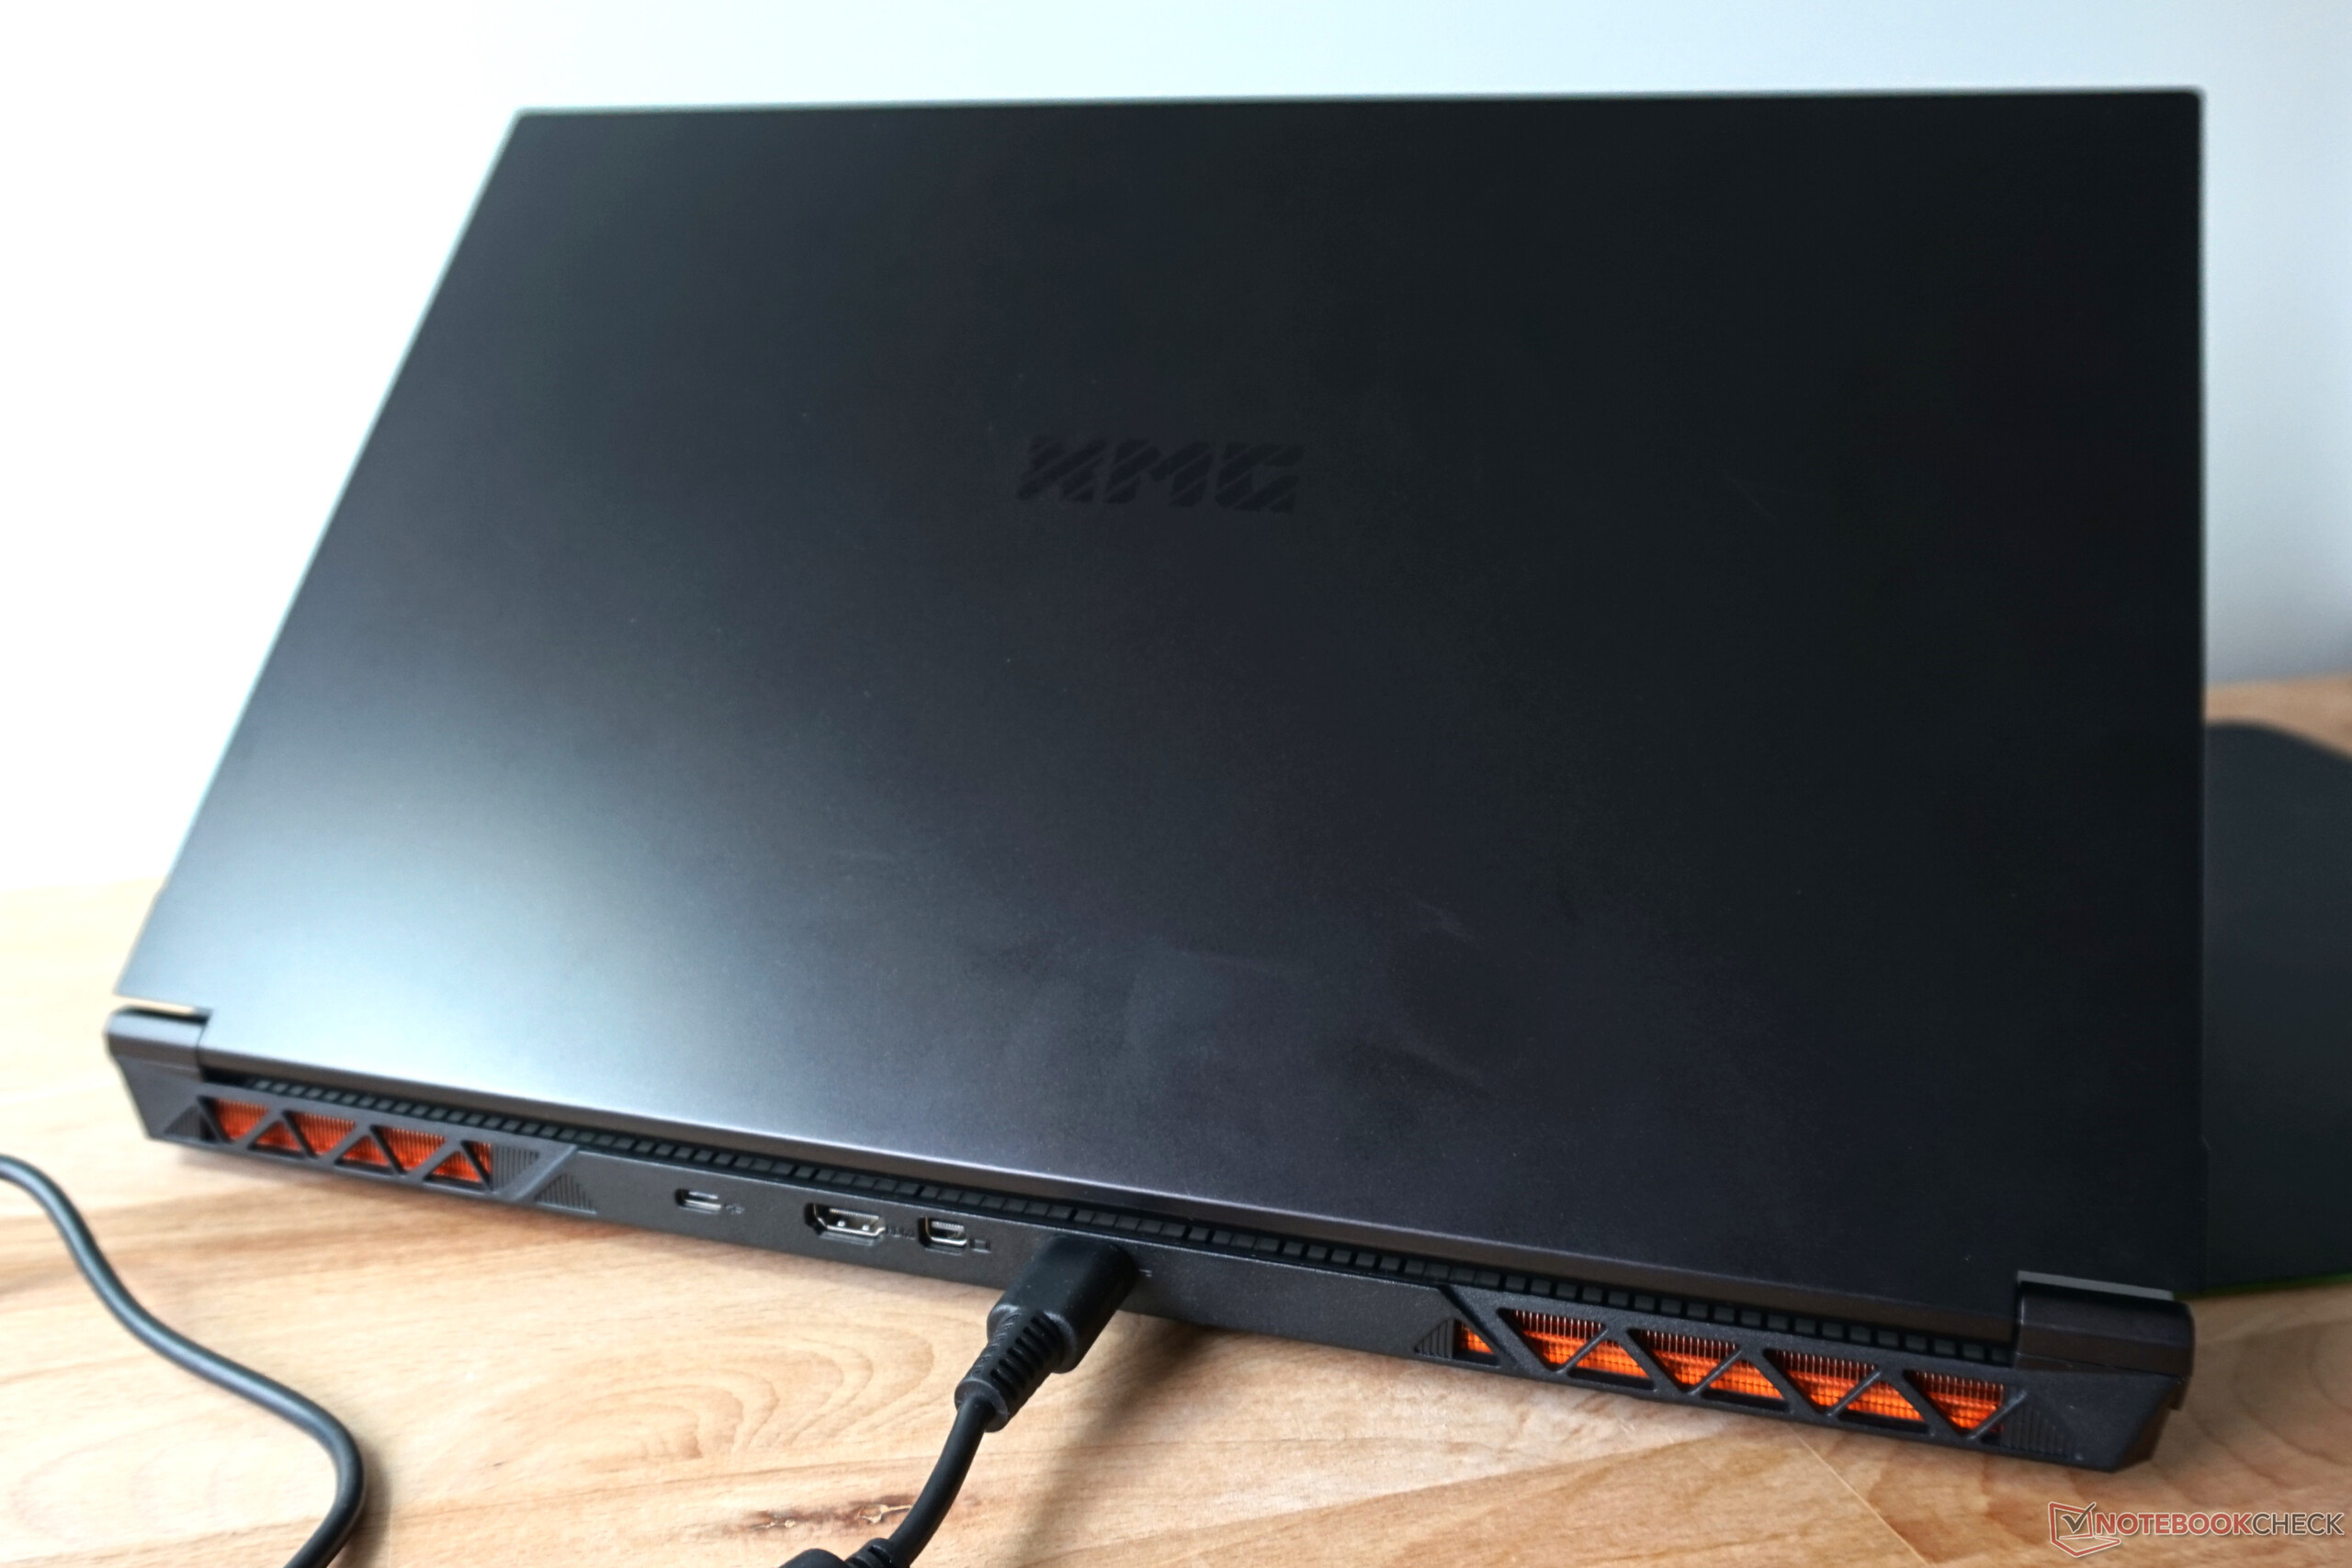
Compared to the predecessor, there are many similarities in the ports, but fortunately a few refreshes. There is still a USB 2.0 port, which should still be enough for a mouse or printer. Mini-DP has also been retained.
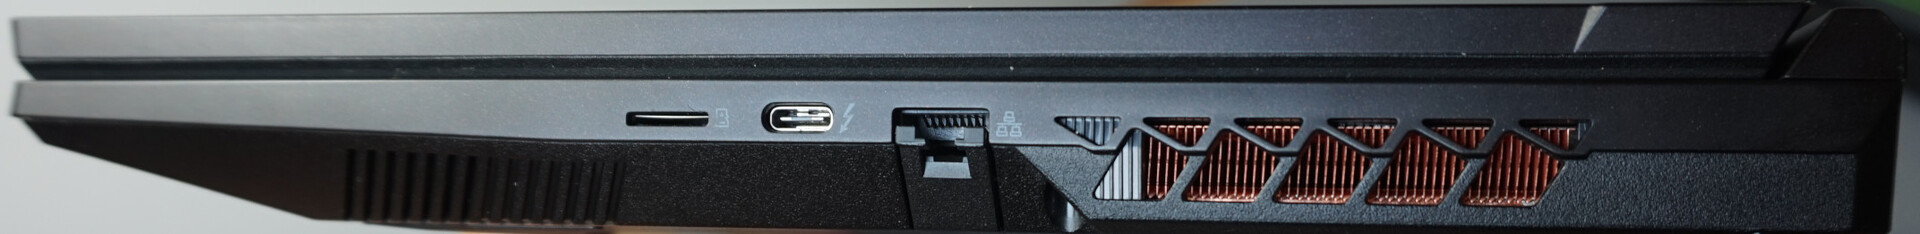
The simple USB-C connector has been moved to the back and delivers rates up to 10 Gbit/s, but neither PD nor DP is supported. Thunderbolt 4 is on the right, but unfortunately, there is no USB-A port anymore. In addition, the card slot has shrunk to microSD in the current version, which limits the versatility considerably.


SD Card Reader
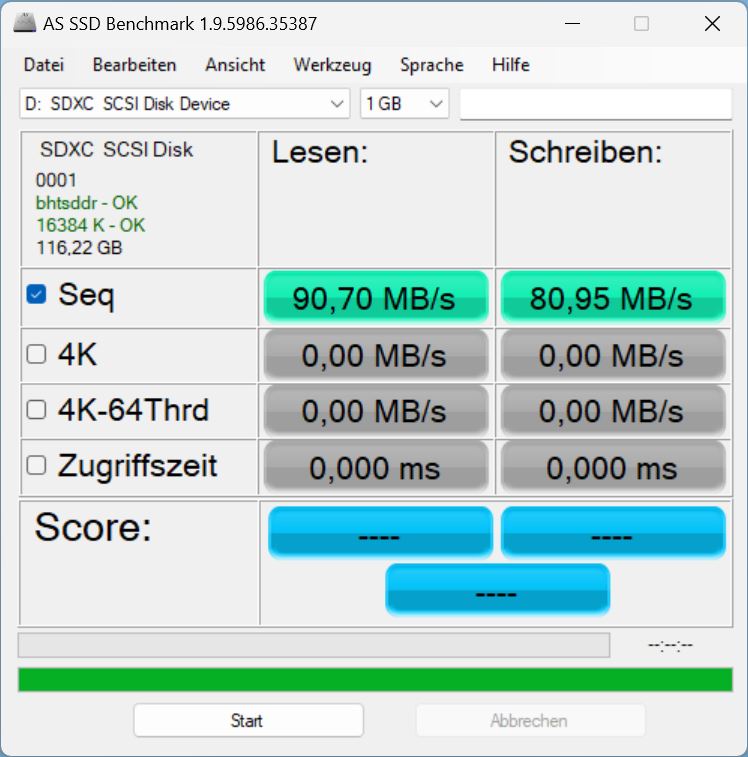
Our measurements with the reference AV PRO V60 microSD 128 GB card are not quite average but partly a bit better than the competition. That is enough to copy a few thousand pictures in a few minutes.
| SD Card Reader | |
| average JPG Copy Test (av. of 3 runs) | |
| Average of class Gaming (20.9 - 210, n=55, last 2 years) | |
| Medion Erazer Defender P40 (AV PRO microSD 128 GB V60) | |
| Schenker XMG Focus 17 (E23) | |
| Medion Erazer Major X20 (AV PRO microSD 128 GB V60) | |
| HP Omen 17-ck2097ng (AV PRO microSD 128 GB V60) | |
| Schenker XMG Neo 17 M22 (AV PRO microSD 128 GB V60) | |
| maximum AS SSD Seq Read Test (1GB) | |
| Average of class Gaming (25.5 - 261, n=52, last 2 years) | |
| Medion Erazer Defender P40 (AV PRO microSD 128 GB V60) | |
| Schenker XMG Focus 17 (E23) | |
| Medion Erazer Major X20 (AV PRO microSD 128 GB V60) | |
| HP Omen 17-ck2097ng (AV PRO microSD 128 GB V60) | |
Communication
The WLAN module Intel AX211 fulfills the expectations. However, the typical average rates are only achieved in a 6 GHz network in our measurements and even slightly exceeded. The slight weakness at 5 GHz is most likely explained by interfering influences of neighboring wireless networks, which we naturally could not deactivate in the test.

 GeForce RTX 4070 Laptop GPU, i9-13900HX, Crucial P5 Plus 1TB CT1000P5PSSD8")
 GeForce RTX 4070 Laptop GPU, i9-13900HX, Crucial P5 Plus 1TB CT1000P5PSSD8")
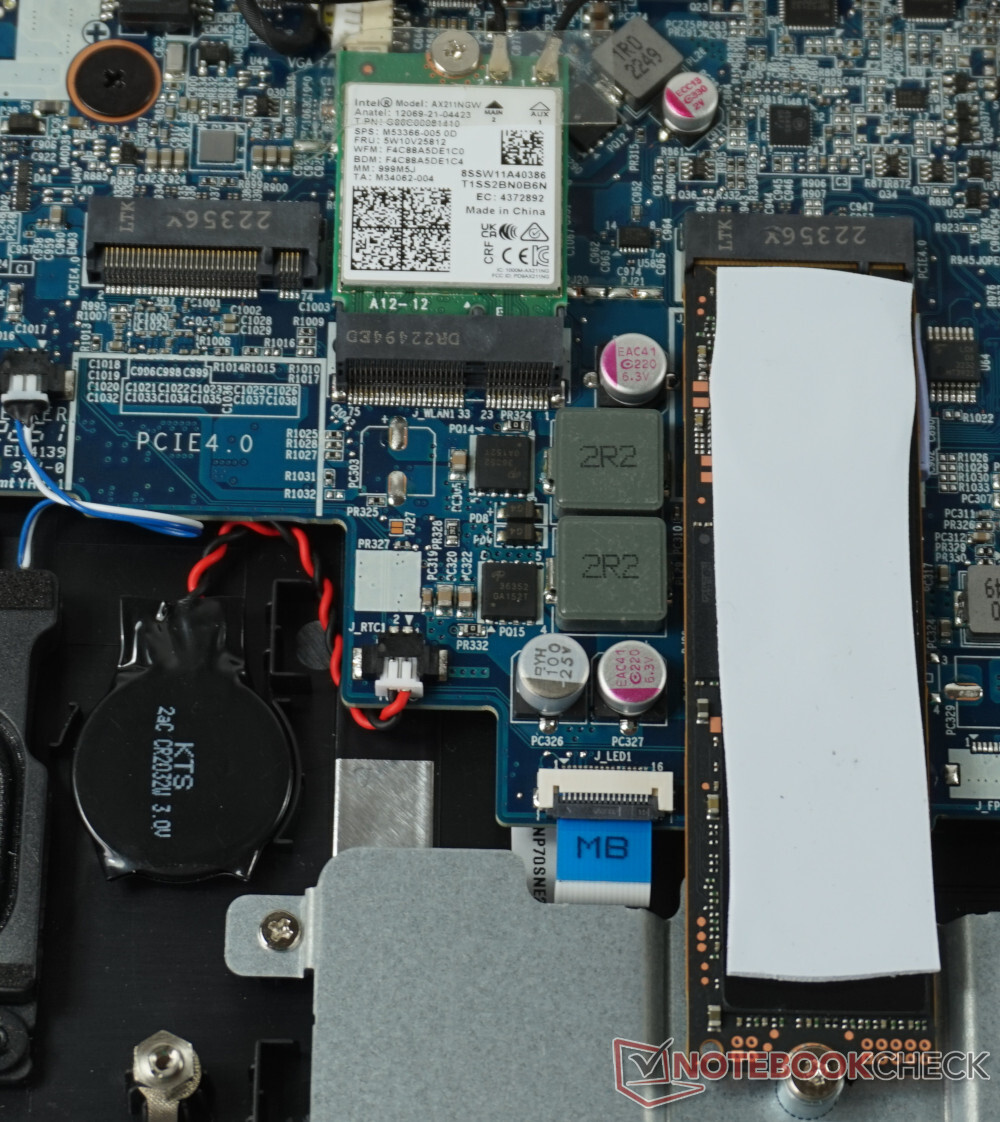
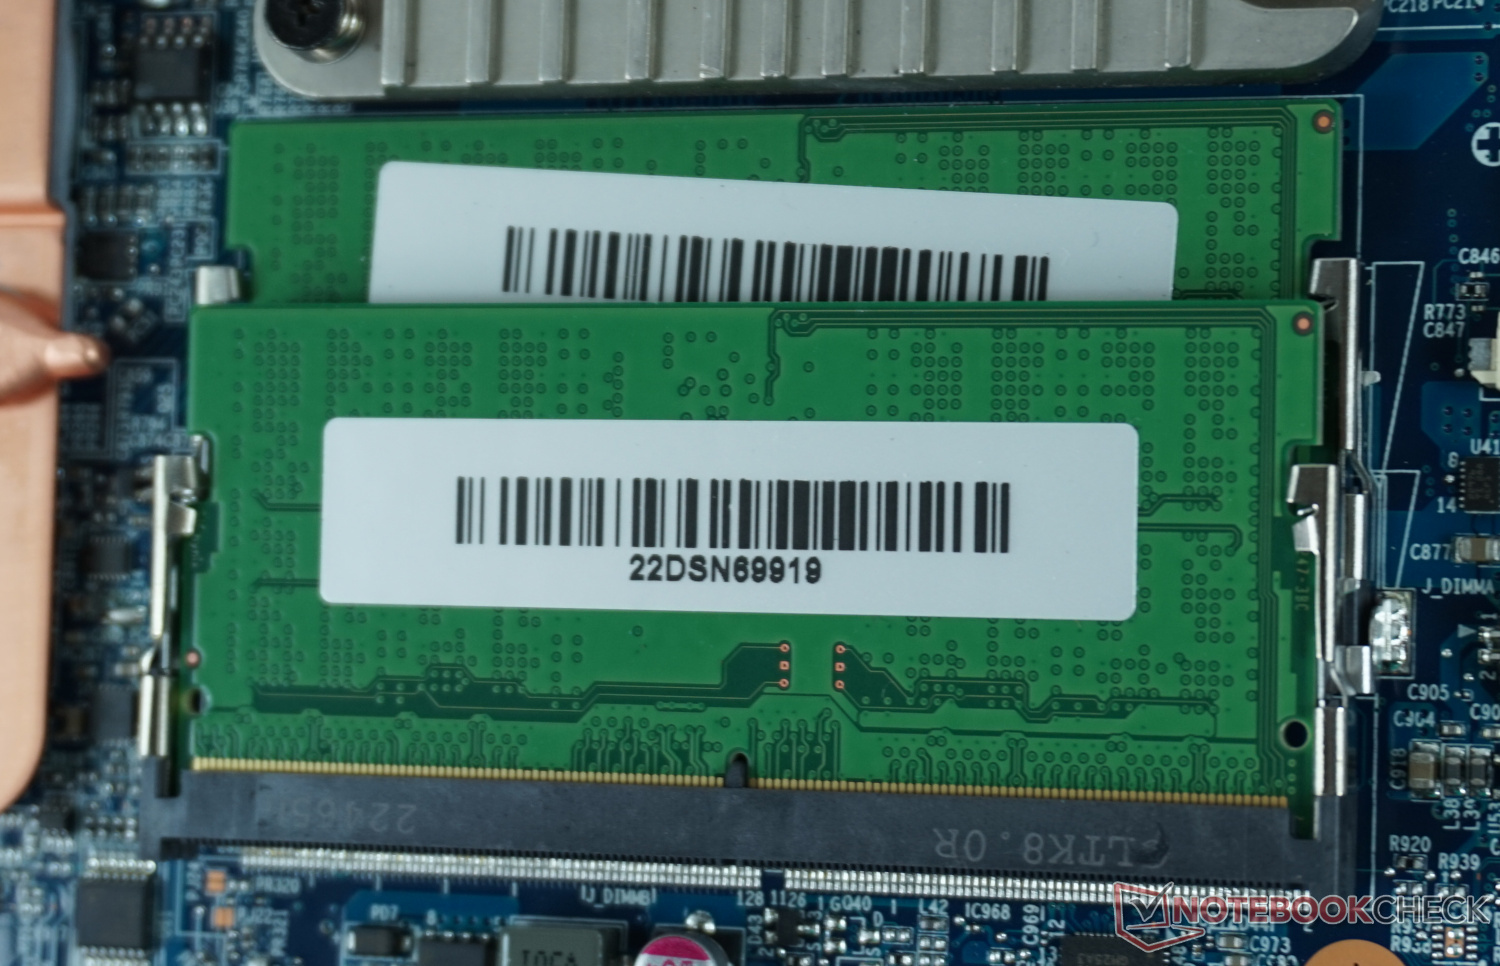
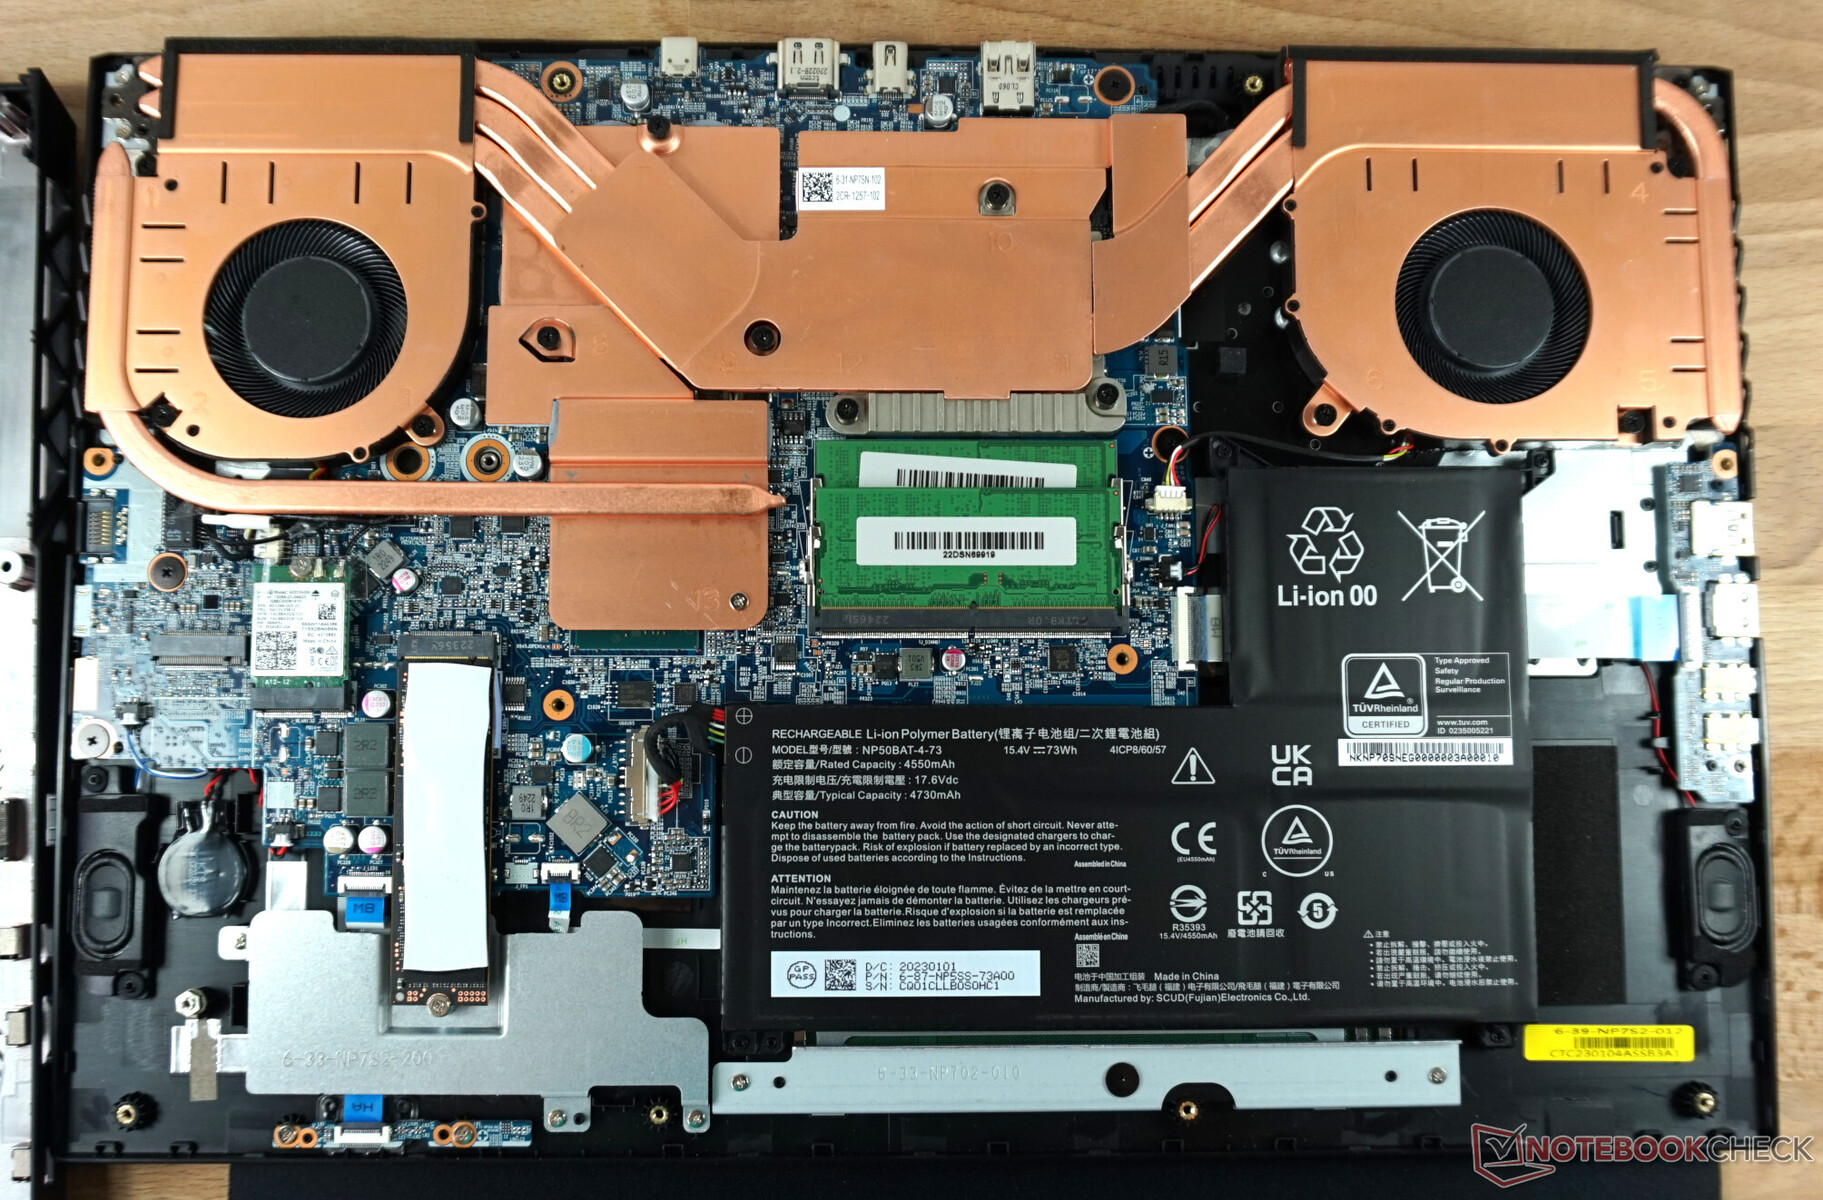
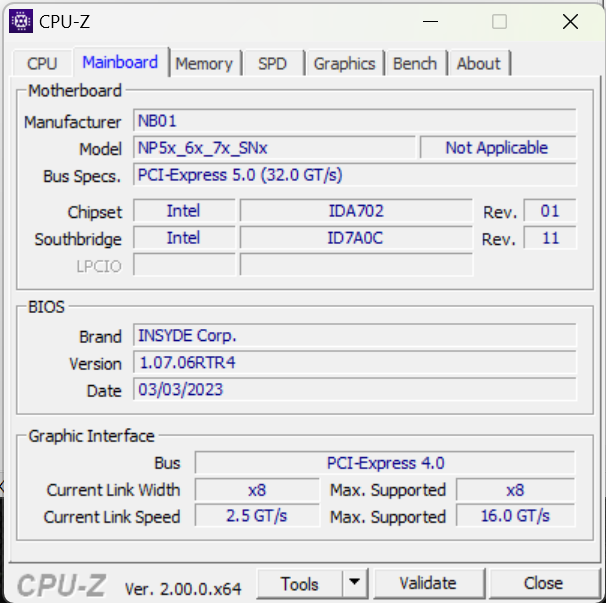
Maintenance
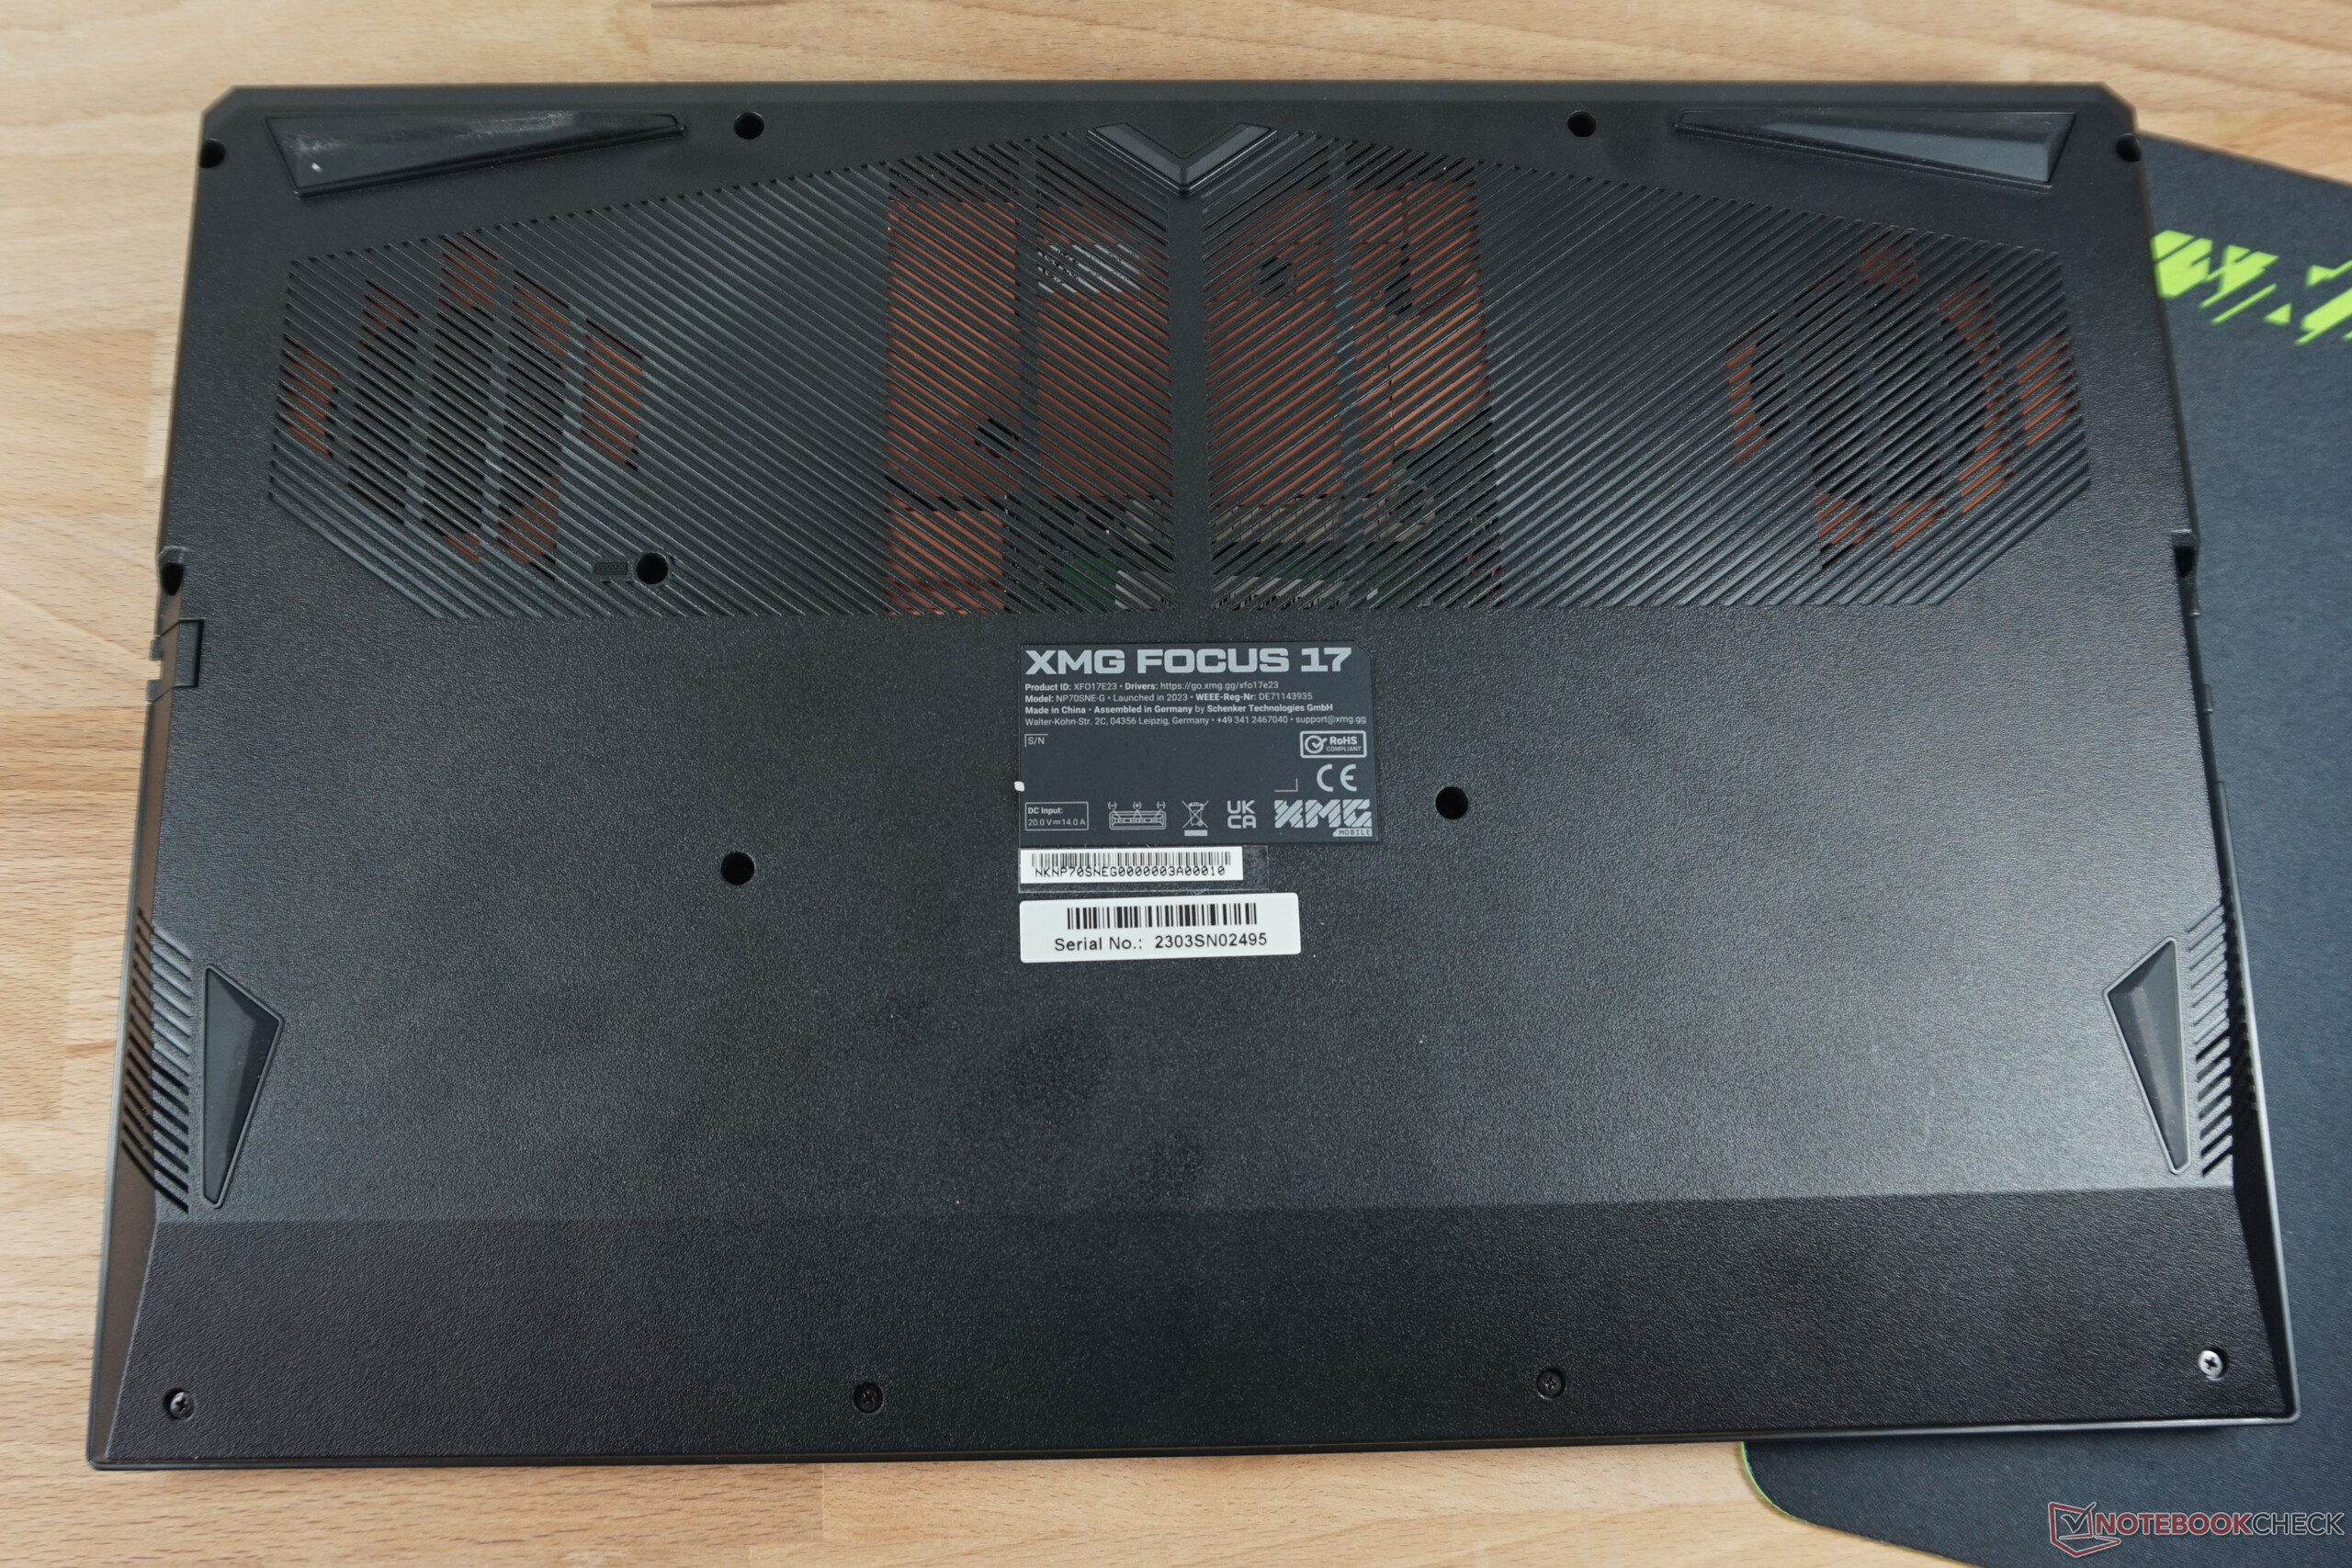
Considerable changes with a view to the XMG Focus 17 from 2021 have been made to the interior. All cooling elements are now made of copper and air can escape to both sides. The outdated SATA port for a 2.5-inch SSD has disappeared. Instead, there is a second slot for an M.2 NVMe SSD.
As expected from Schenker, access to the components is easy. After loosening twelve identical screws, the bottom can be pulled off with little effort starting from the rear cooling. RAM, SSD, WLAN module, and battery are then easily accessible and replaceable.
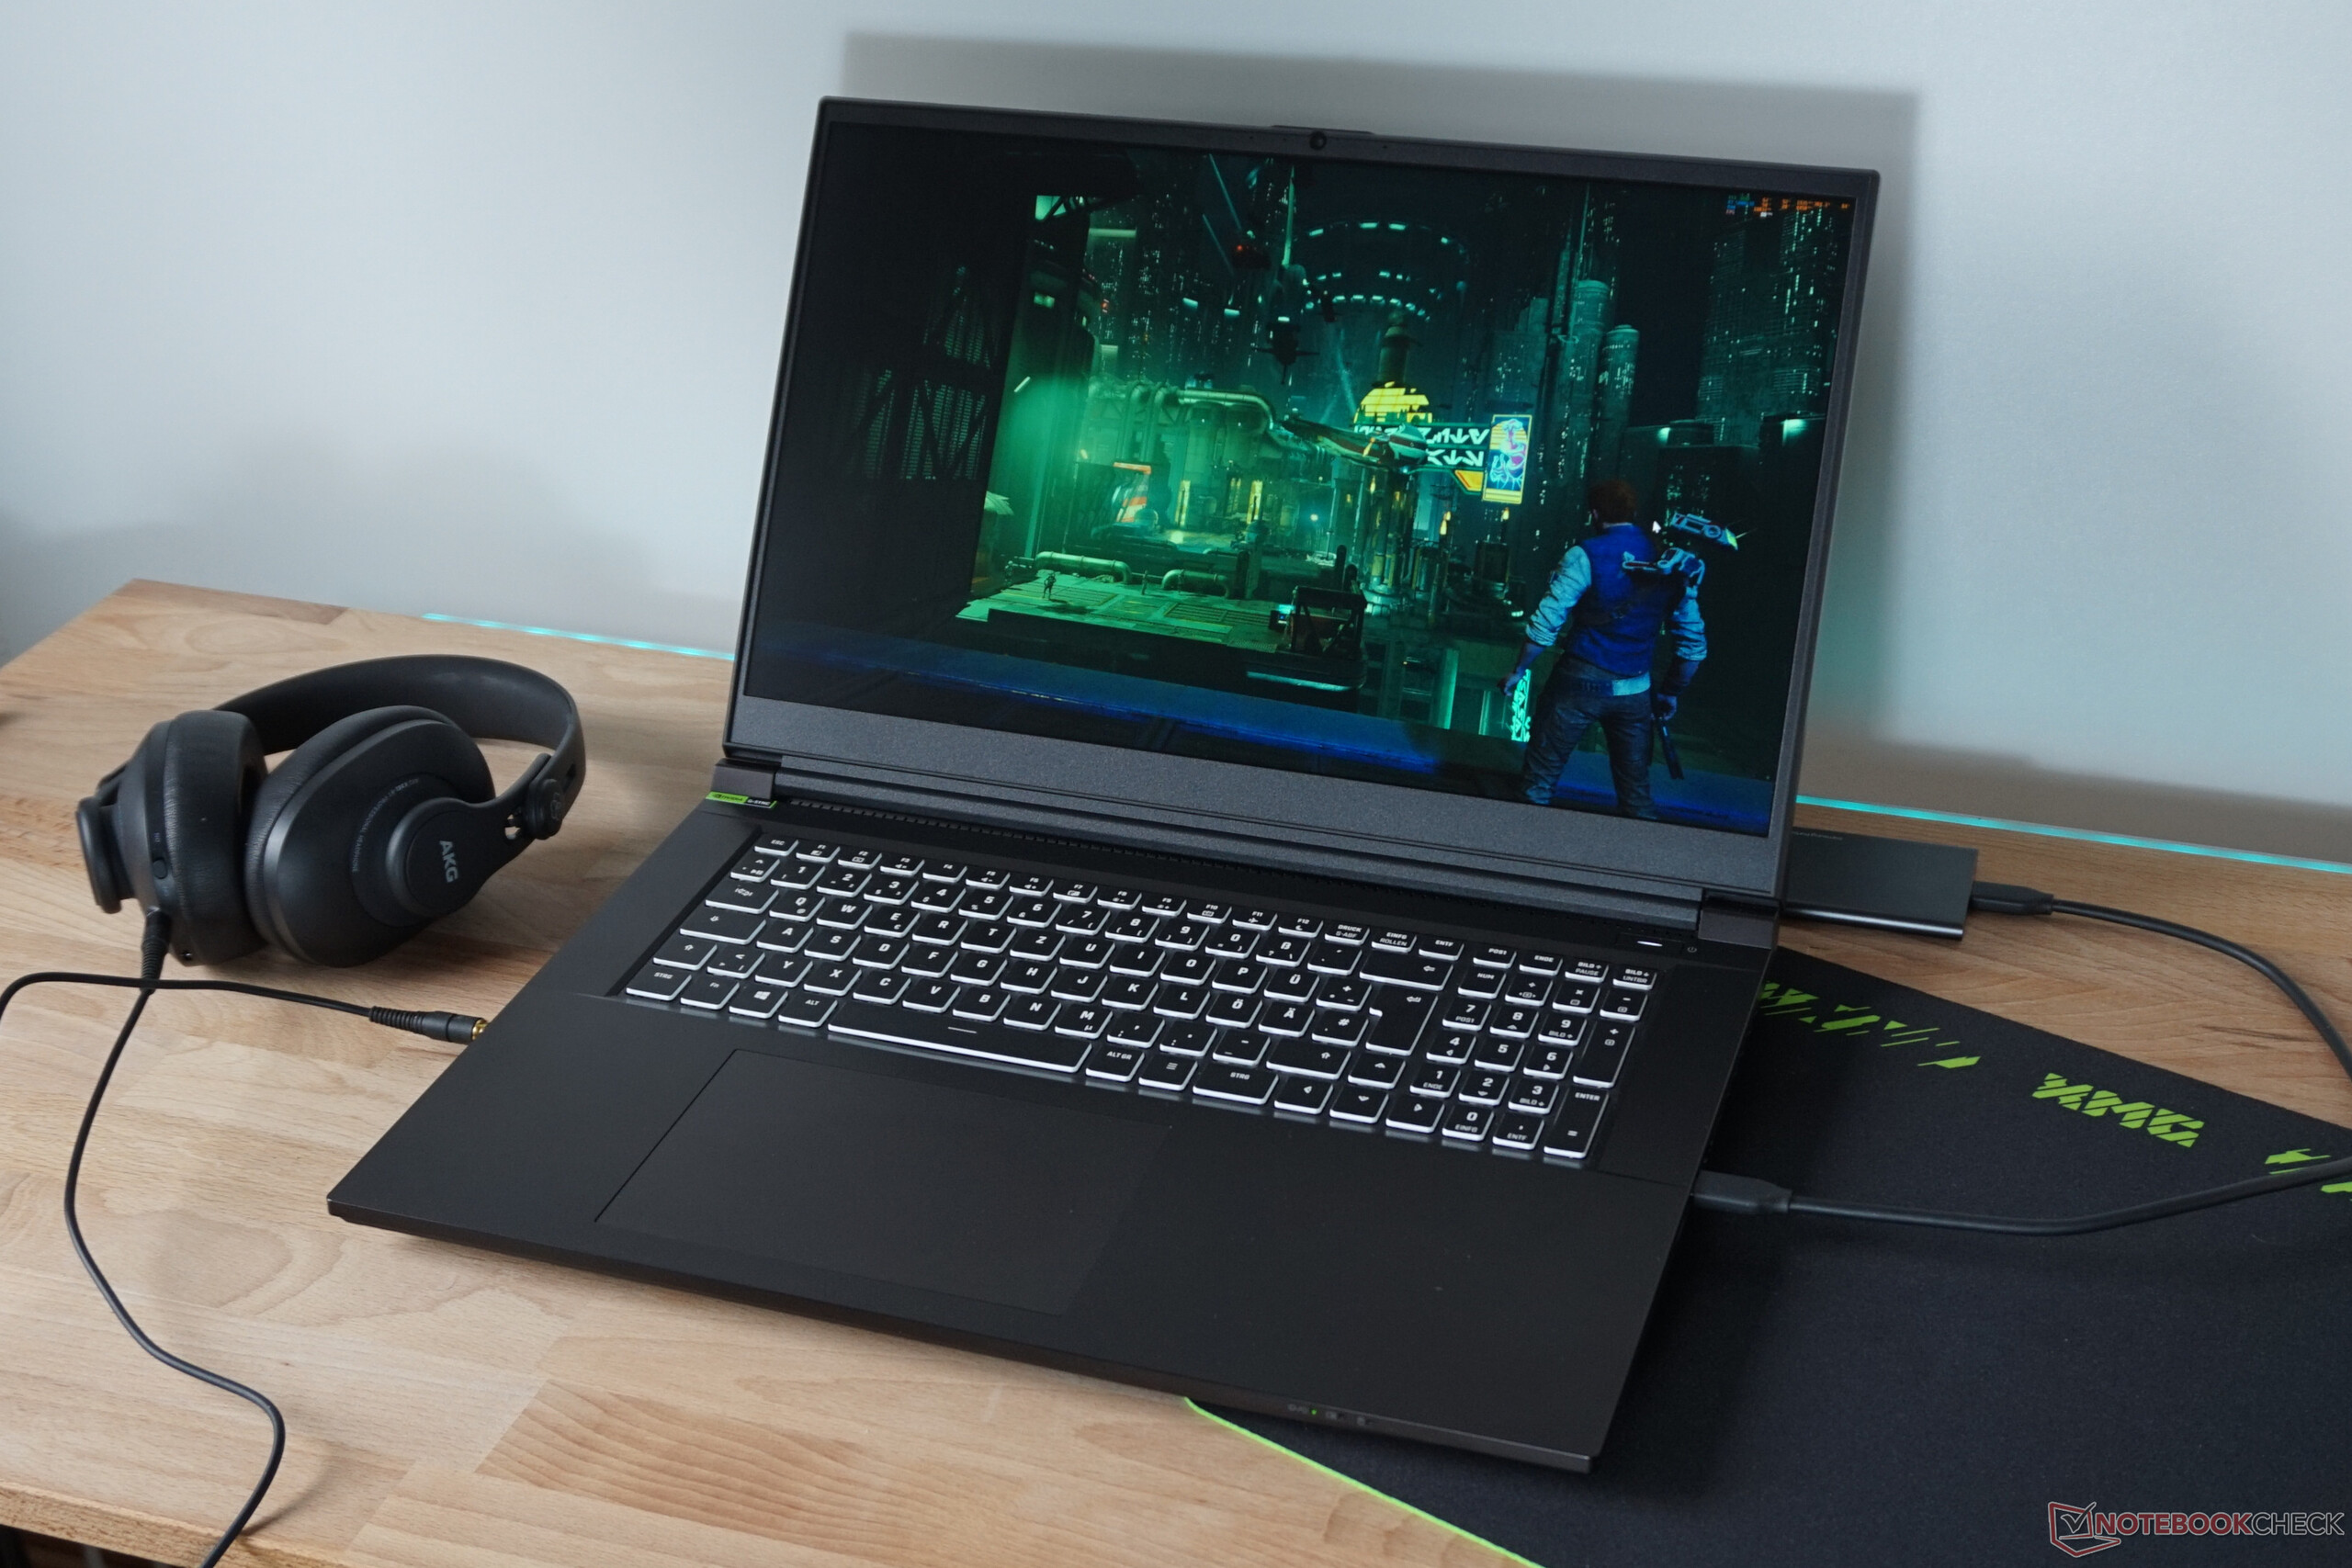
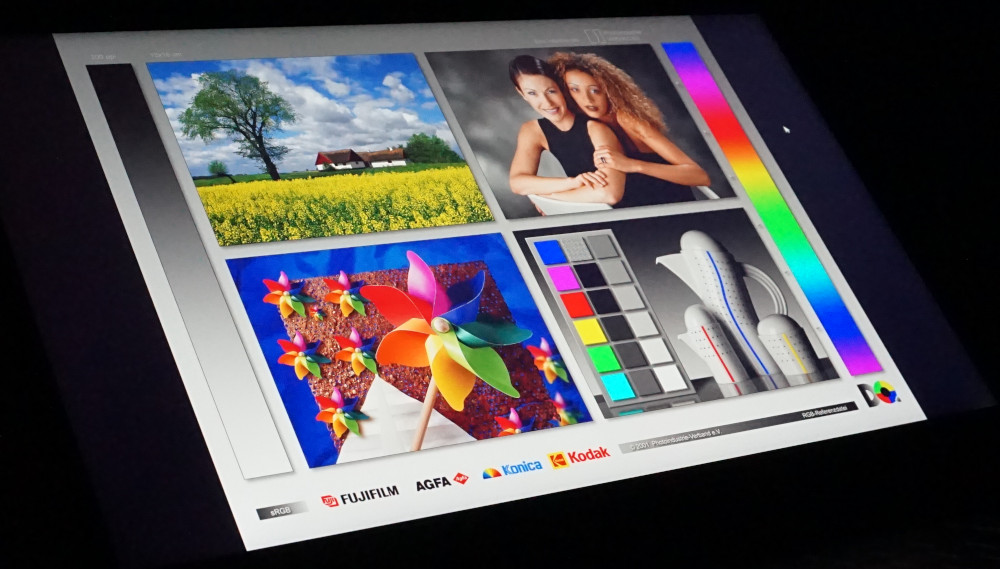
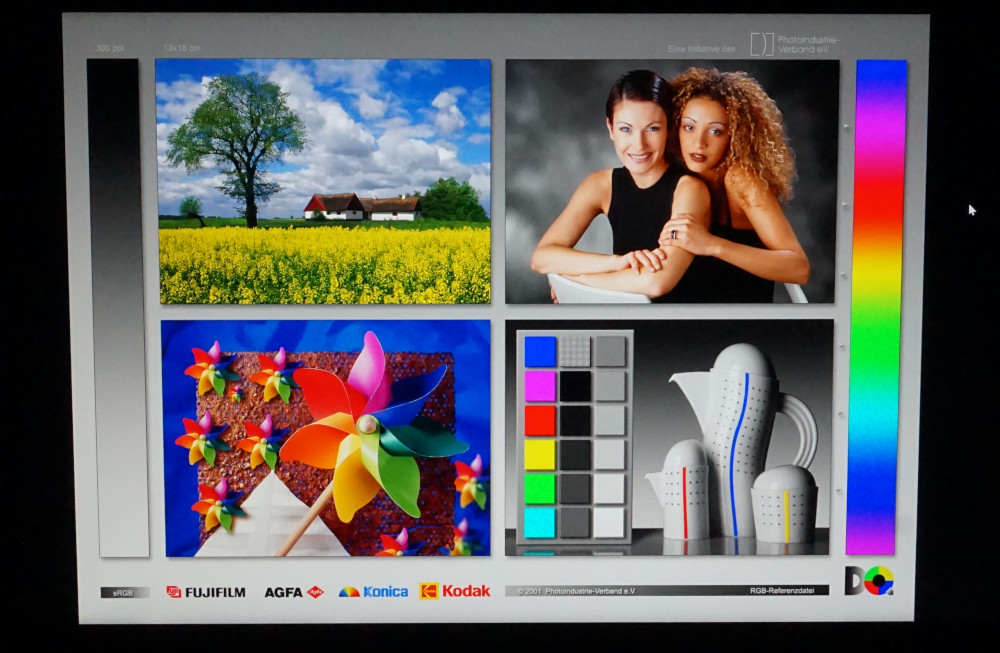
Display - Strong colors, meager contrasts on the XMG gaming notebook

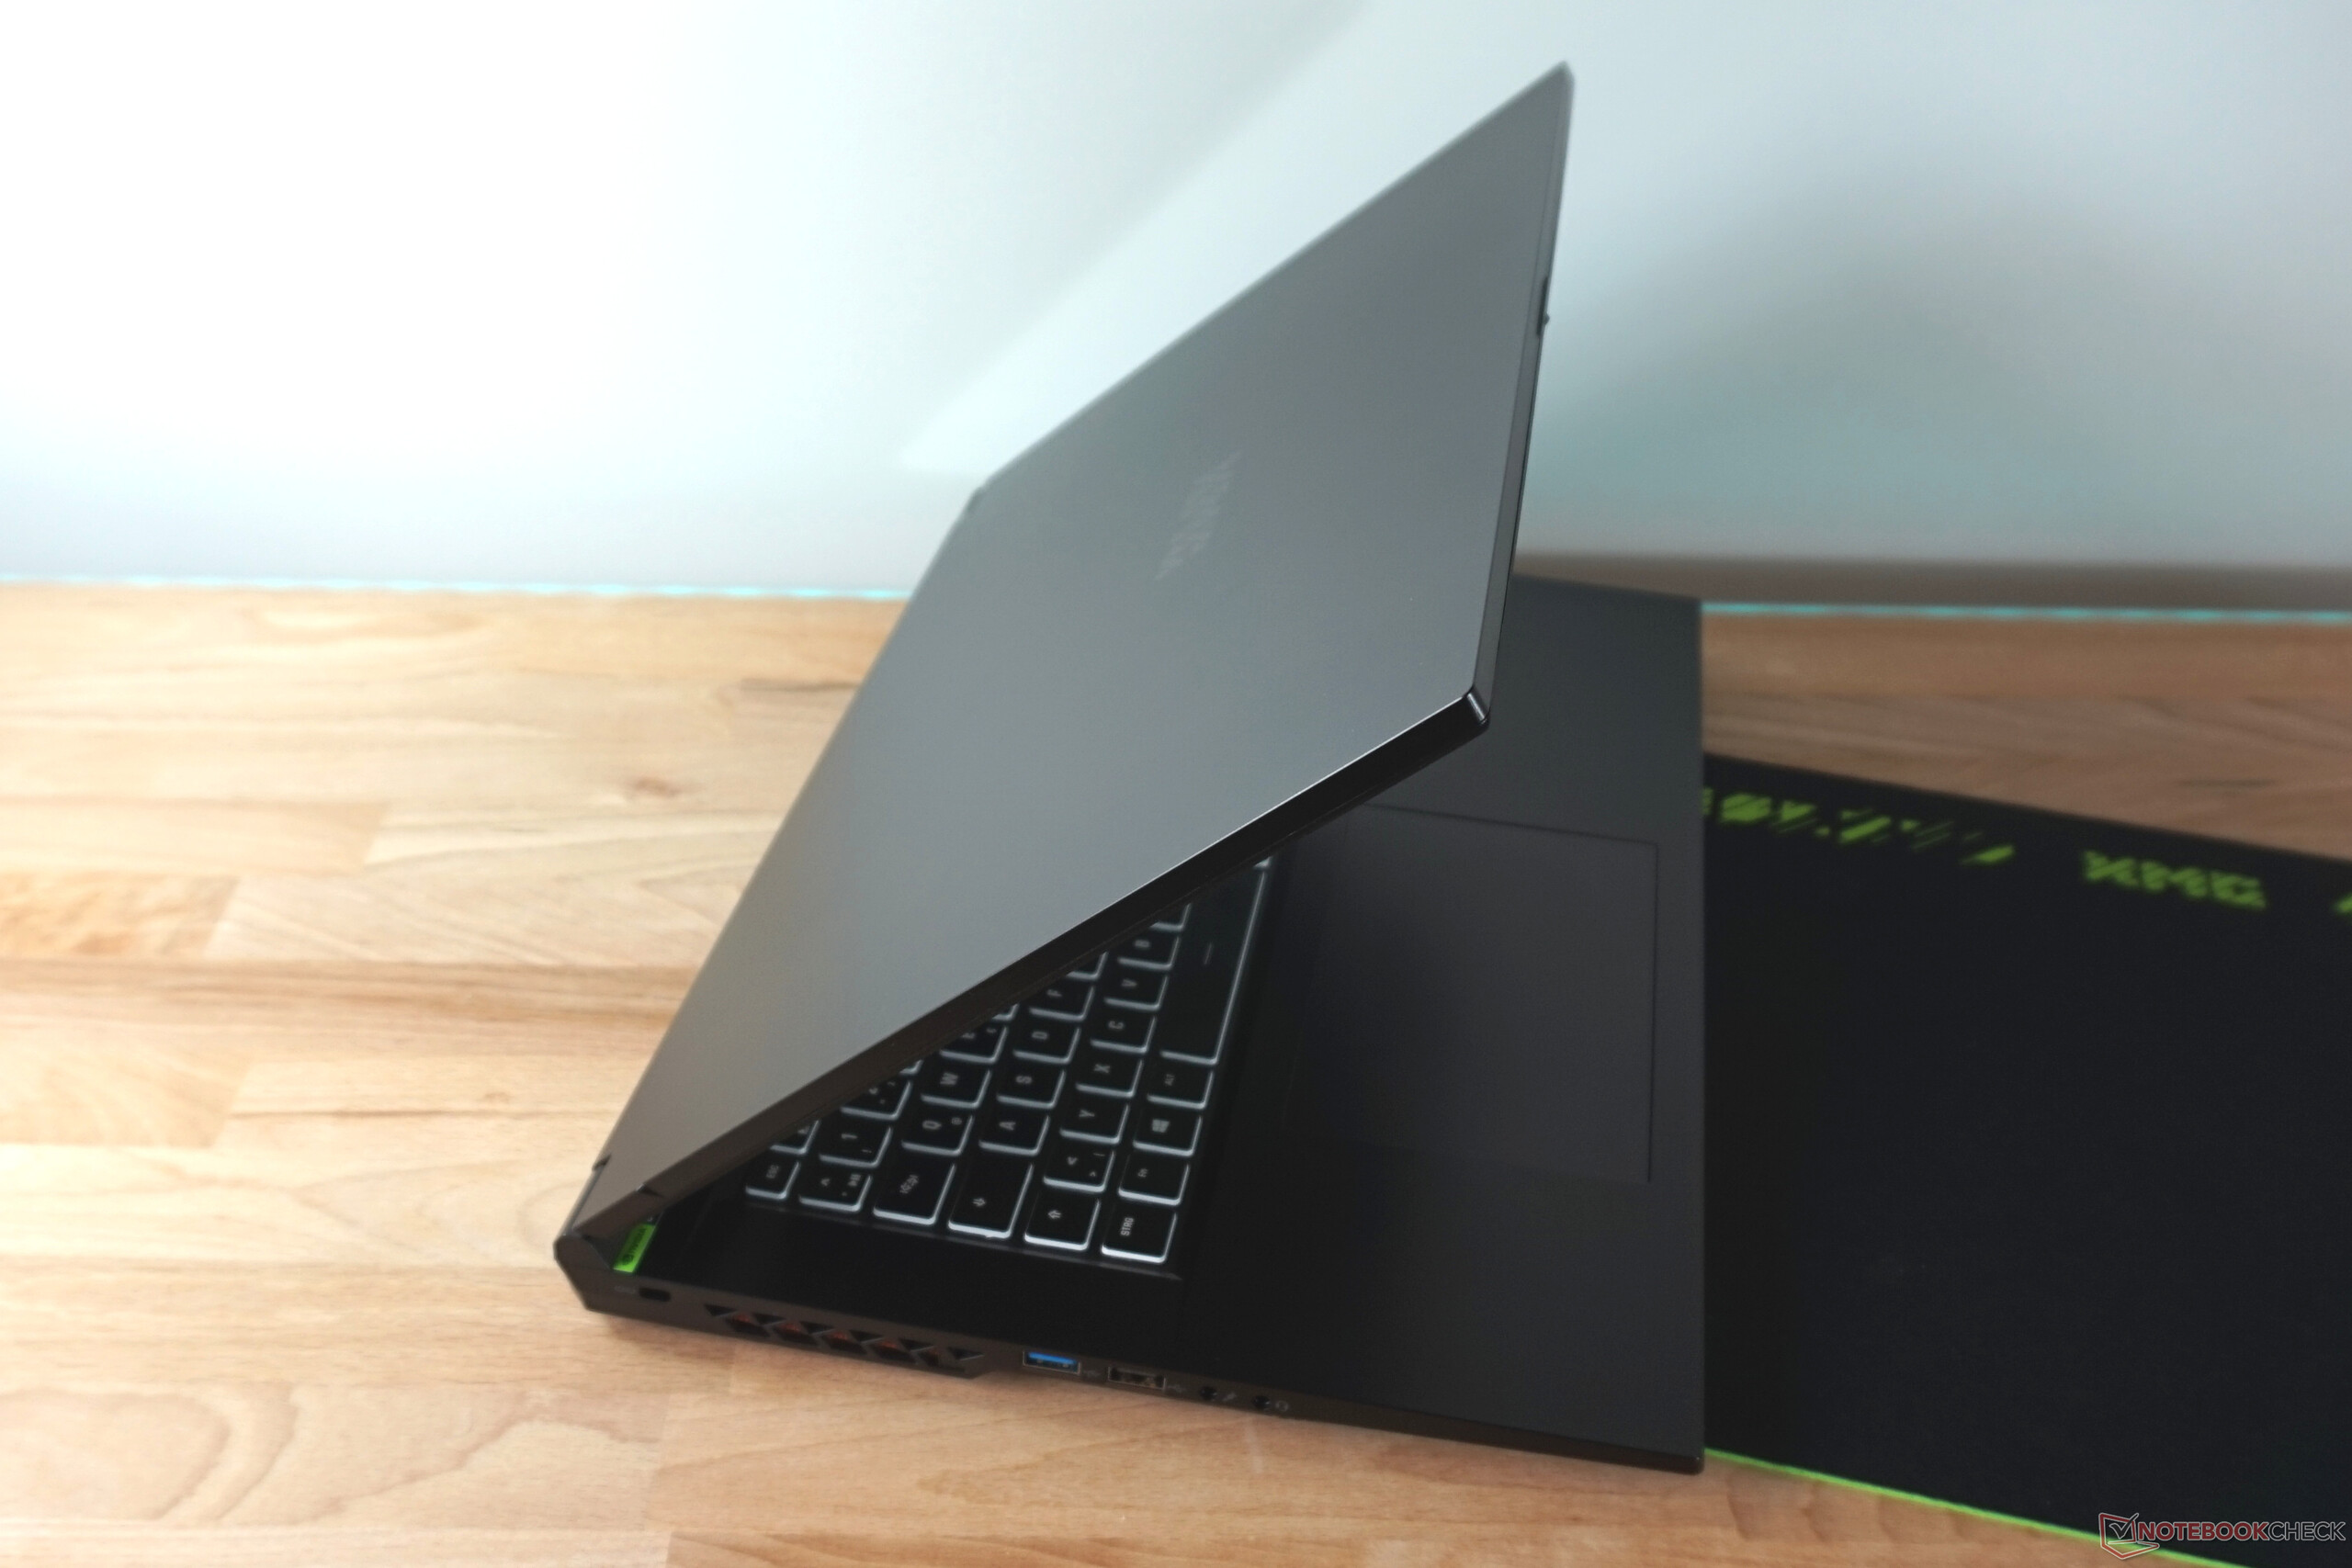
The matte IPS panel of the XMG Focus 17 meets the expectations of a solid but not outstanding gaming notebook. The QHD resolution comes into its own on the large diagonal of 17,3 inches/In addition, the refresh rate of 240 Hz ensures low latencies even when the frame rate is not reached in games.
Not quite convincing are the response times, which are not optimal at over 10 ms, but acceptable. The poor black level prevents a better contrast. A gray haze is visible in very dark scenes with minimal lighting in the room. With a ratio of 623:1 measured by us, the contrast here is only just under half of the value of the Medion Erazer Defender P40 or HP Omen 17-ck. Screen bleeding is also clearly visible.
The illumination could be a bit more even, and the brightness of 320 cd/m² a bit higher. Thus, the display rates are below average compared to many similarly priced models.
| |||||||||||||||||||||||||
Brightness Distribution: 82 %
Center on Battery: 349 cd/m²
Contrast: 623:1 (Black: 0.56 cd/m²)
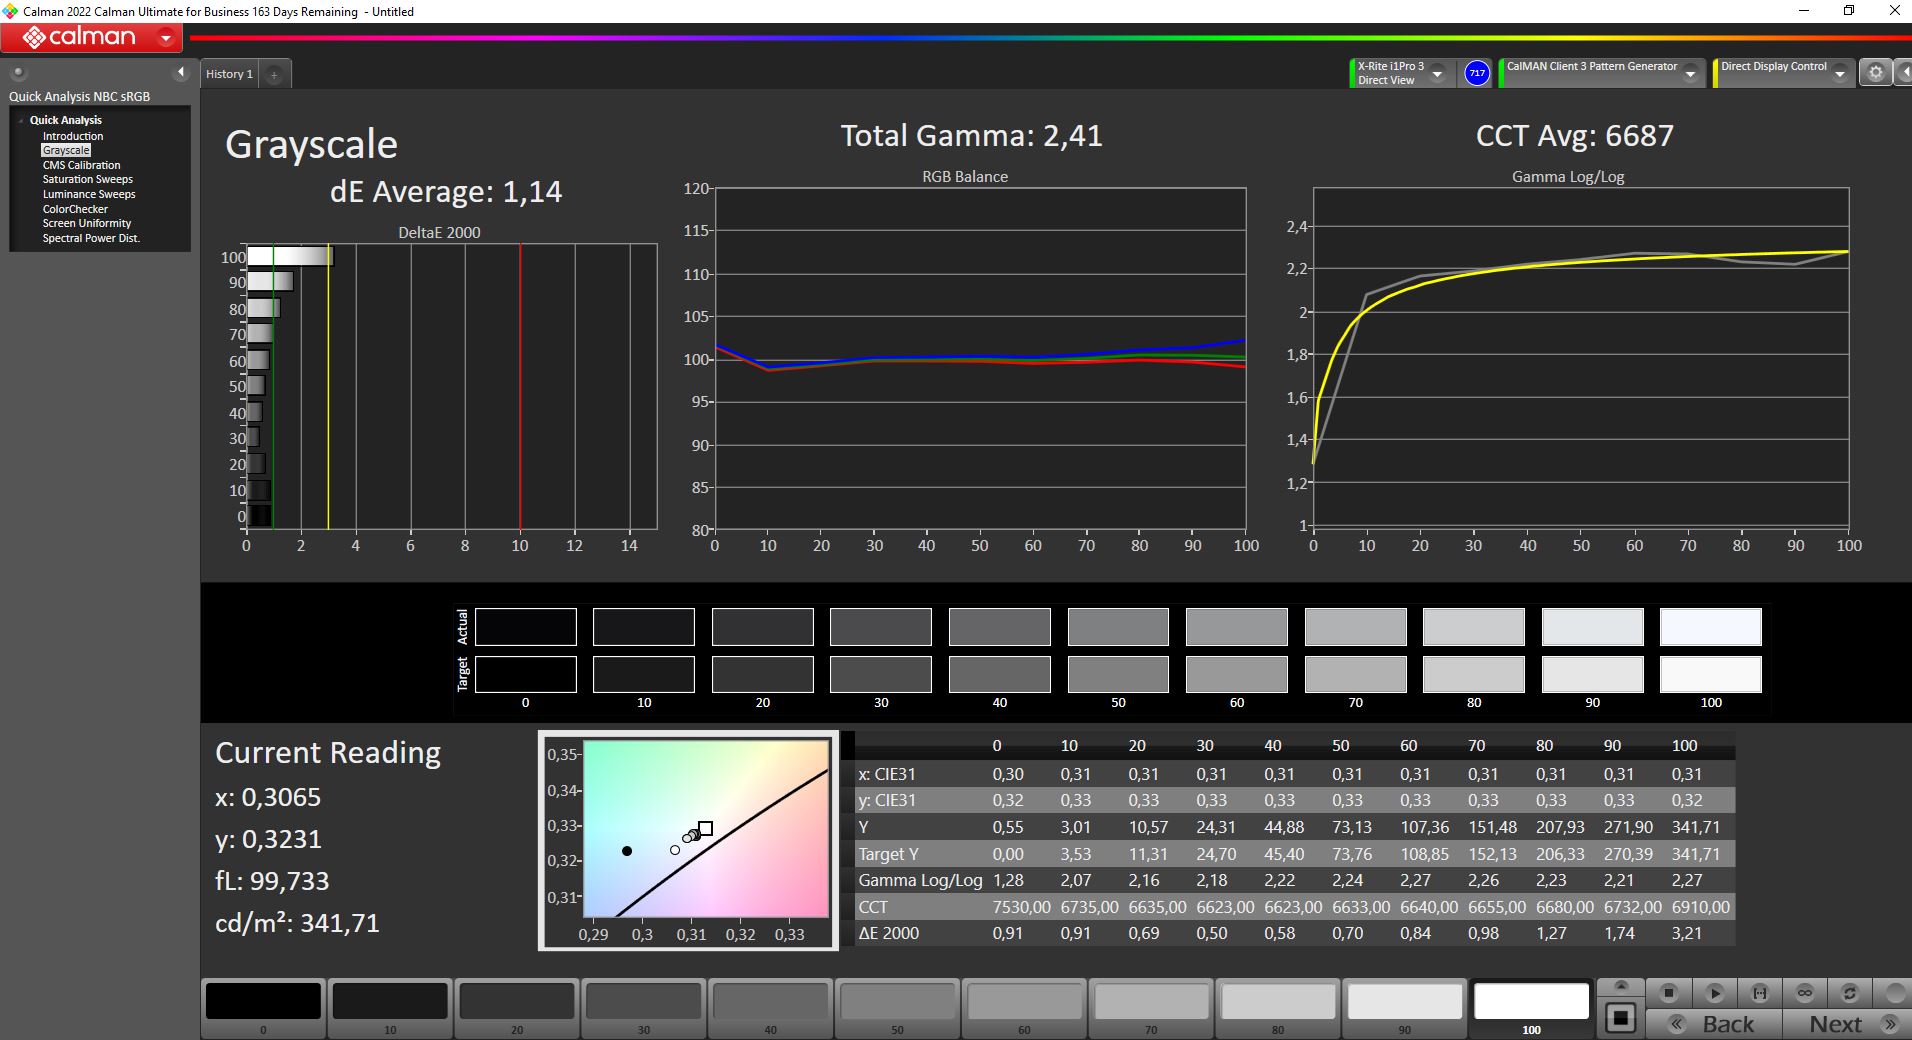
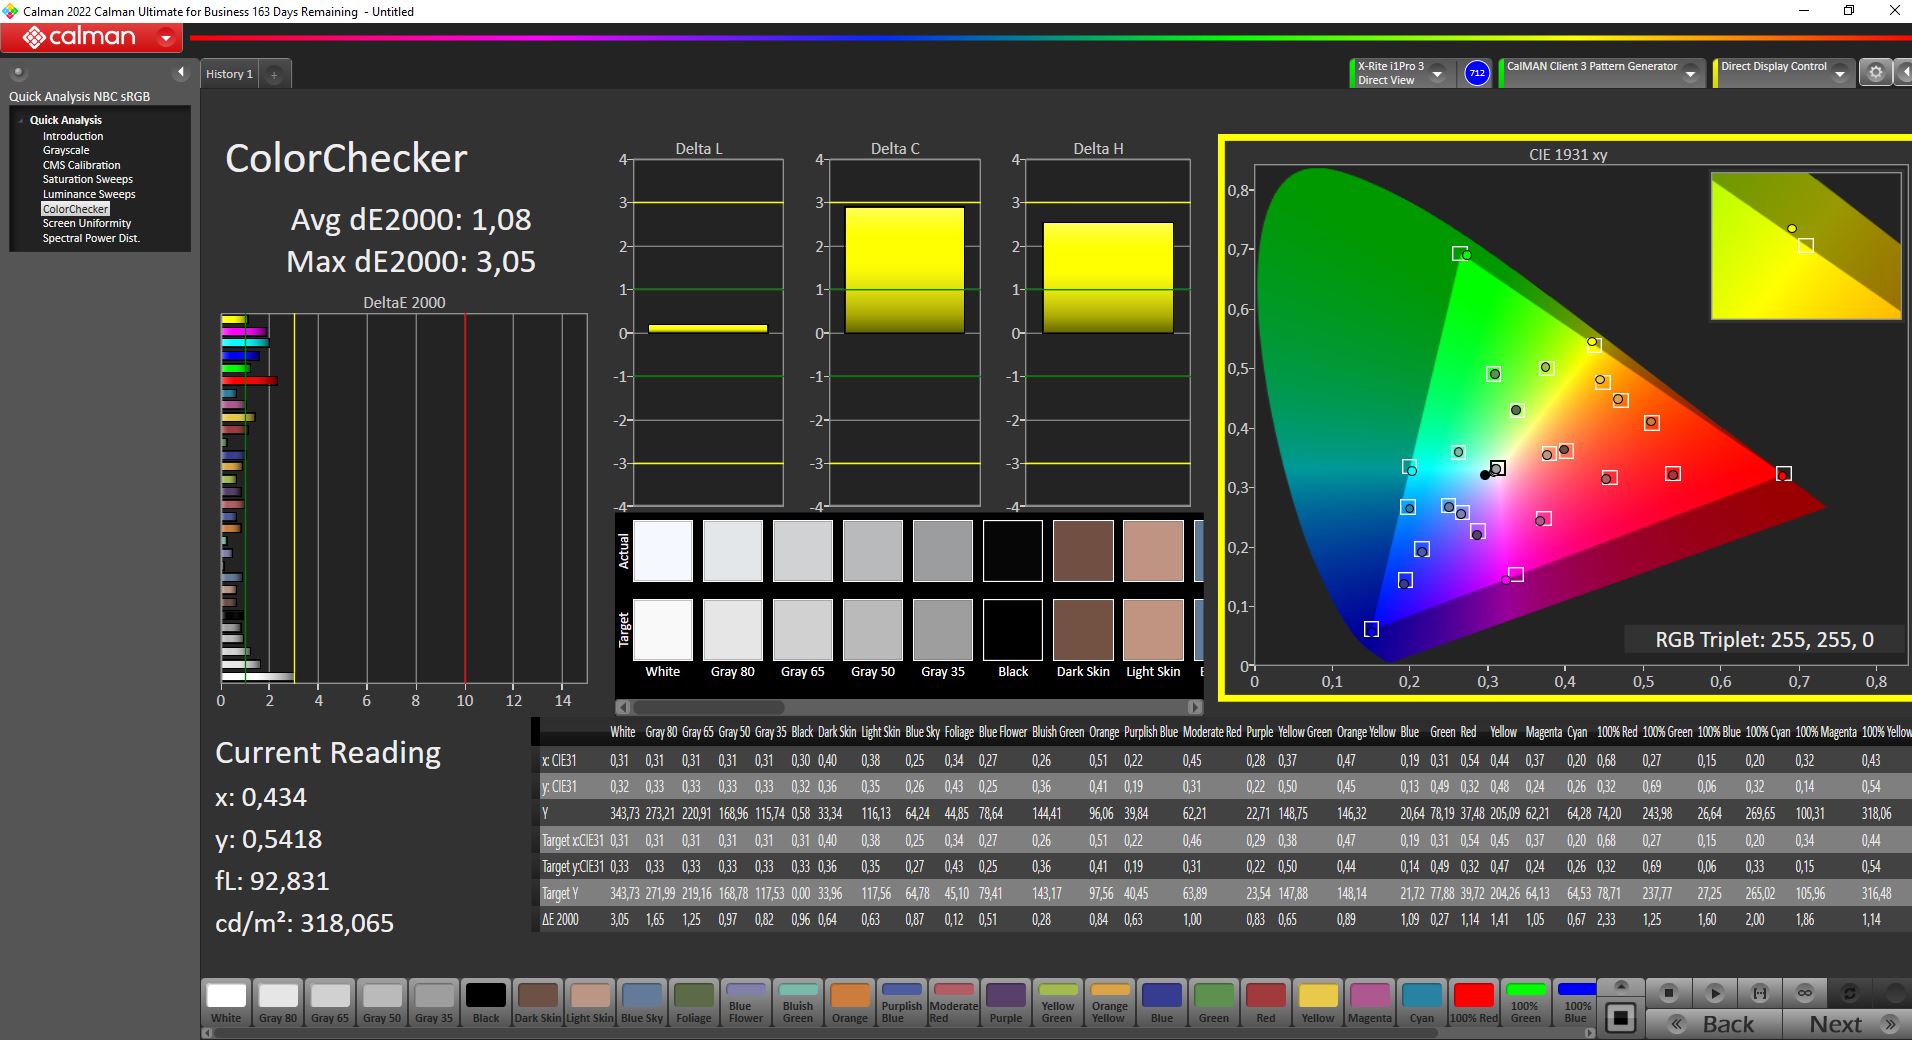
ΔE ColorChecker Calman: 1.08 | ∀{0.5-29.43 Ø4.73}
calibrated: 1.08
ΔE Greyscale Calman: 1.14 | ∀{0.09-98 Ø4.97}
84.5% AdobeRGB 1998 (Argyll 3D)
99.9% sRGB (Argyll 3D)
96.6% Display P3 (Argyll 3D)
Gamma: 2.41
CCT: 6687 K
| Schenker XMG Focus 17 (E23) BOE09F9 NE173QHM-NZ1, IPS, 2560x1440, 17.3" | Lenovo Legion Pro 5 16ARX8 CSOT T3 MNG007DA1-Q, IPS, 2560x1600, 16" | Medion Erazer Major X20 BOE CQ NE160QDM-NZ1, IPS, 2560x1600, 16" | Schenker XMG Neo 17 M22 BOE0A99, IPS, 2560x1600, 17" | HP Omen 17-ck2097ng BOE BOE09BF, IPS, 2560x1440, 17.3" | Medion Erazer Defender P40 BOE CQ NE173QHM-NZ3, IPS, 2560x1440, 17.3" | |
|---|---|---|---|---|---|---|
| Display | -14% | -15% | -16% | -17% | -16% | |
| Display P3 Coverage (%) | 96.6 | 70.4 -27% | 69.4 -28% | 69 -29% | 67.4 -30% | 68.3 -29% |
| sRGB Coverage (%) | 99.9 | 99.6 0% | 98 -2% | 99.8 0% | 97.6 -2% | 98.1 -2% |
| AdobeRGB 1998 Coverage (%) | 84.5 | 72.6 -14% | 70.9 -16% | 69.6 -18% | 69.6 -18% | 69.8 -17% |
| Response Times | 37% | 26% | 39% | 12% | 15% | |
| Response Time Grey 50% / Grey 80% * (ms) | 16.4 ? | 7 ? 57% | 13.1 ? 20% | 10.8 ? 34% | 15.6 ? 5% | 14.6 ? 11% |
| Response Time Black / White * (ms) | 10.8 ? | 9.1 ? 16% | 7.3 ? 32% | 6.1 ? 44% | 8.9 ? 18% | 8.7 ? 19% |
| PWM Frequency (Hz) | ||||||
| Screen | 21% | -23% | 9% | -7% | 11% | |
| Brightness middle (cd/m²) | 349 | 355.3 2% | 374 7% | 415 19% | 371 6% | 364 4% |
| Brightness (cd/m²) | 318 | 340 7% | 357 12% | 399 25% | 350 10% | 343 8% |
| Brightness Distribution (%) | 82 | 91 11% | 92 12% | 90 10% | 90 10% | 86 5% |
| Black Level * (cd/m²) | 0.56 | 0.32 43% | 0.33 41% | 0.43 23% | 0.32 43% | 0.28 50% |
| Contrast (:1) | 623 | 1110 78% | 1133 82% | 965 55% | 1159 86% | 1300 109% |
| Colorchecker dE 2000 * | 1.08 | 1.13 -5% | 2.43 -125% | 1.44 -33% | 1.74 -61% | 1.67 -55% |
| Colorchecker dE 2000 max. * | 3.05 | 2.78 9% | 3.97 -30% | 2.33 24% | 3.59 -18% | 2.78 9% |
| Colorchecker dE 2000 calibrated * | 1.08 | 0.32 70% | 1.4 -30% | 0.89 18% | 1.01 6% | 1.14 -6% |
| Greyscale dE 2000 * | 1.14 | 1.4 -23% | 3.1 -172% | 1.8 -58% | 2.8 -146% | 1.4 -23% |
| Gamma | 2.41 91% | 2.24 98% | 2.191 100% | 2.132 103% | 2.19 100% | 2.091 105% |
| CCT | 6687 97% | 6372 102% | 6194 105% | 6327 103% | 6474 100% | 6568 99% |
| Total Average (Program / Settings) | 15% /
16% | -4% /
-14% | 11% /
8% | -4% /
-7% | 3% /
6% |
* ... smaller is better
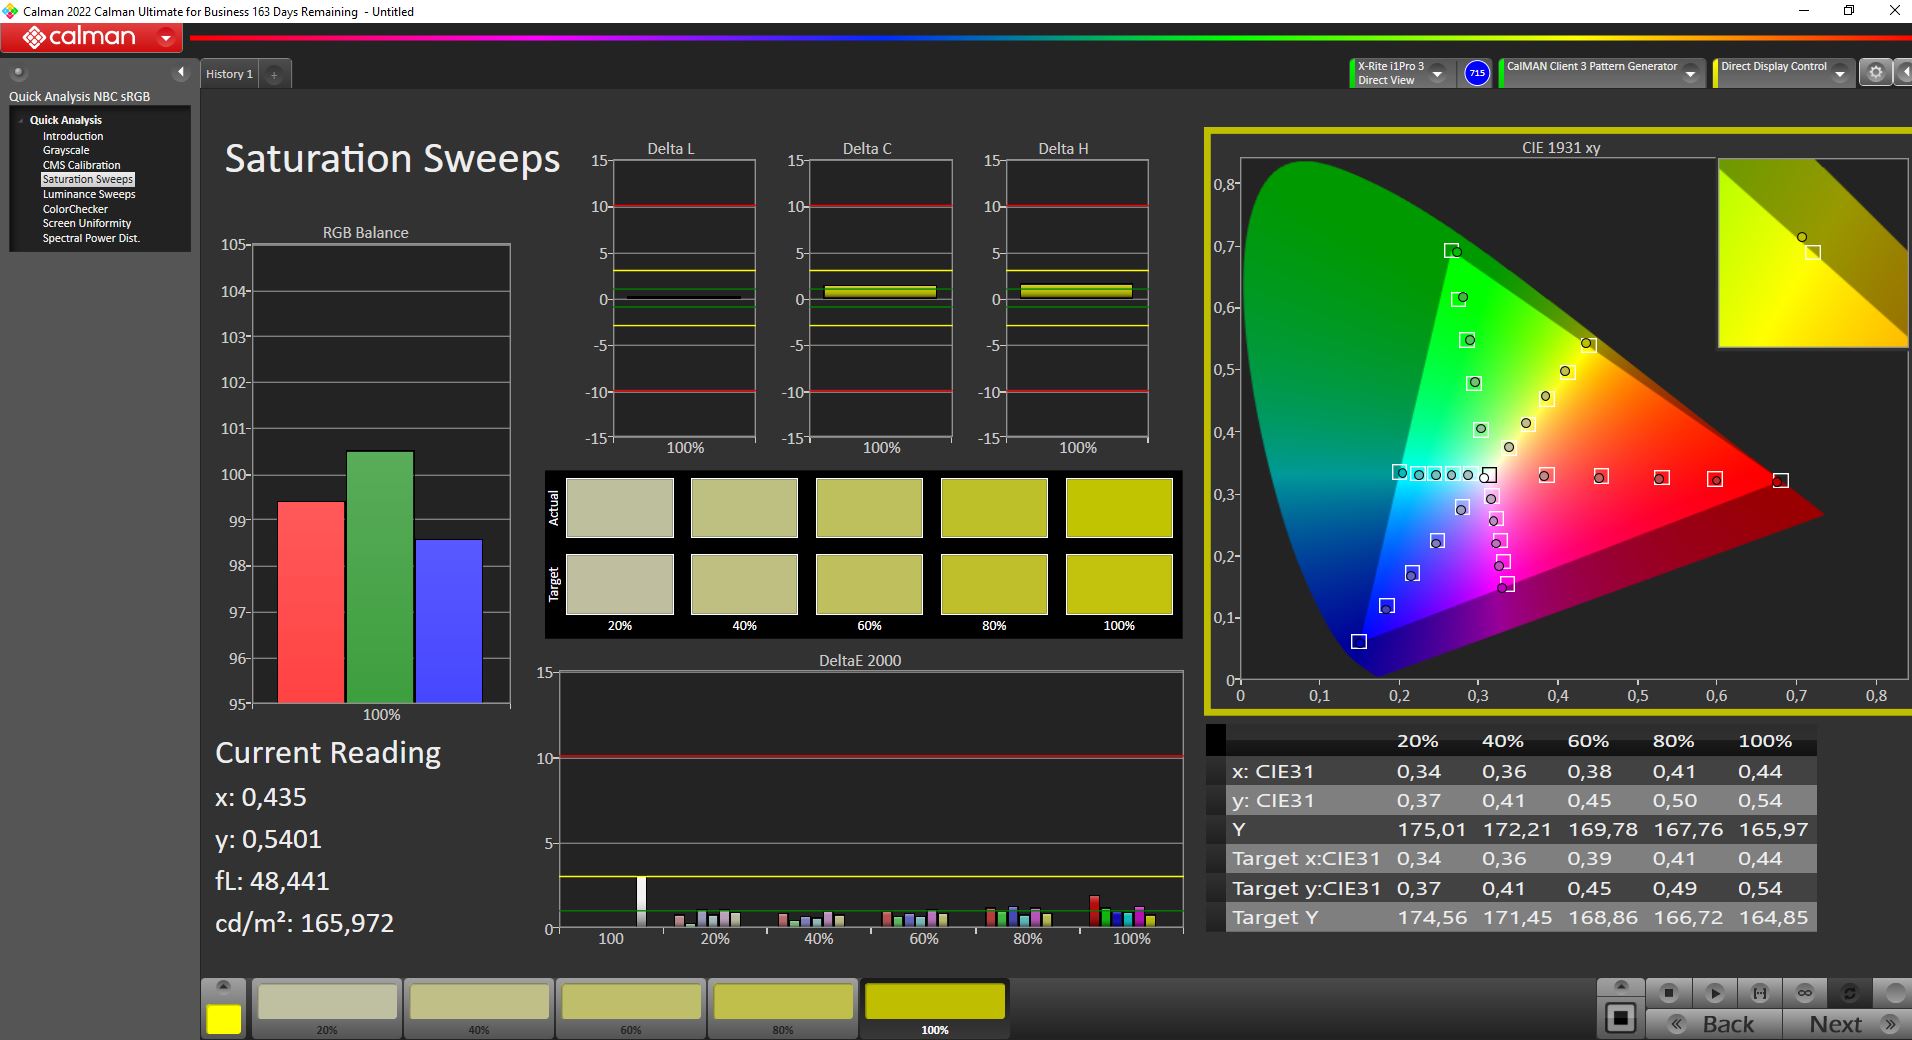
The color reproduction is very good. The sRGB color space used for games and most non-professional applications is basically completely covered. Even DCI-P3 can be represented to a large extent. Thus, the color reproduction is above average.
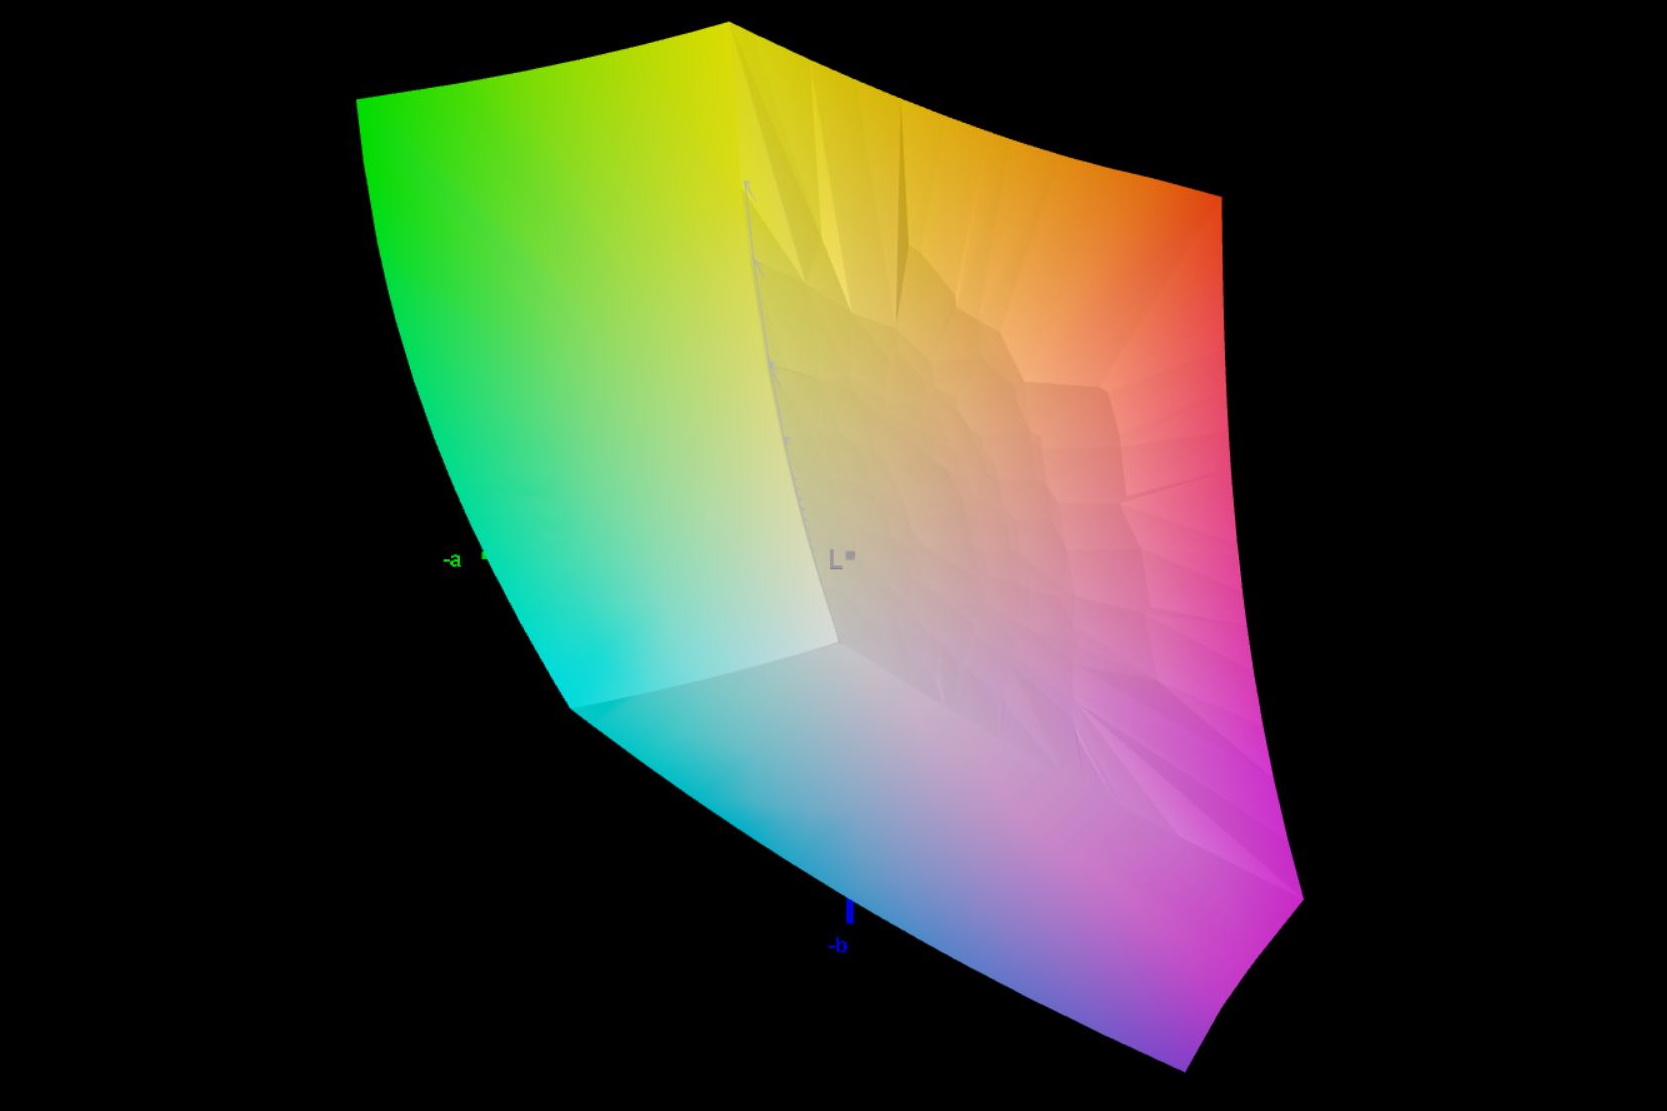
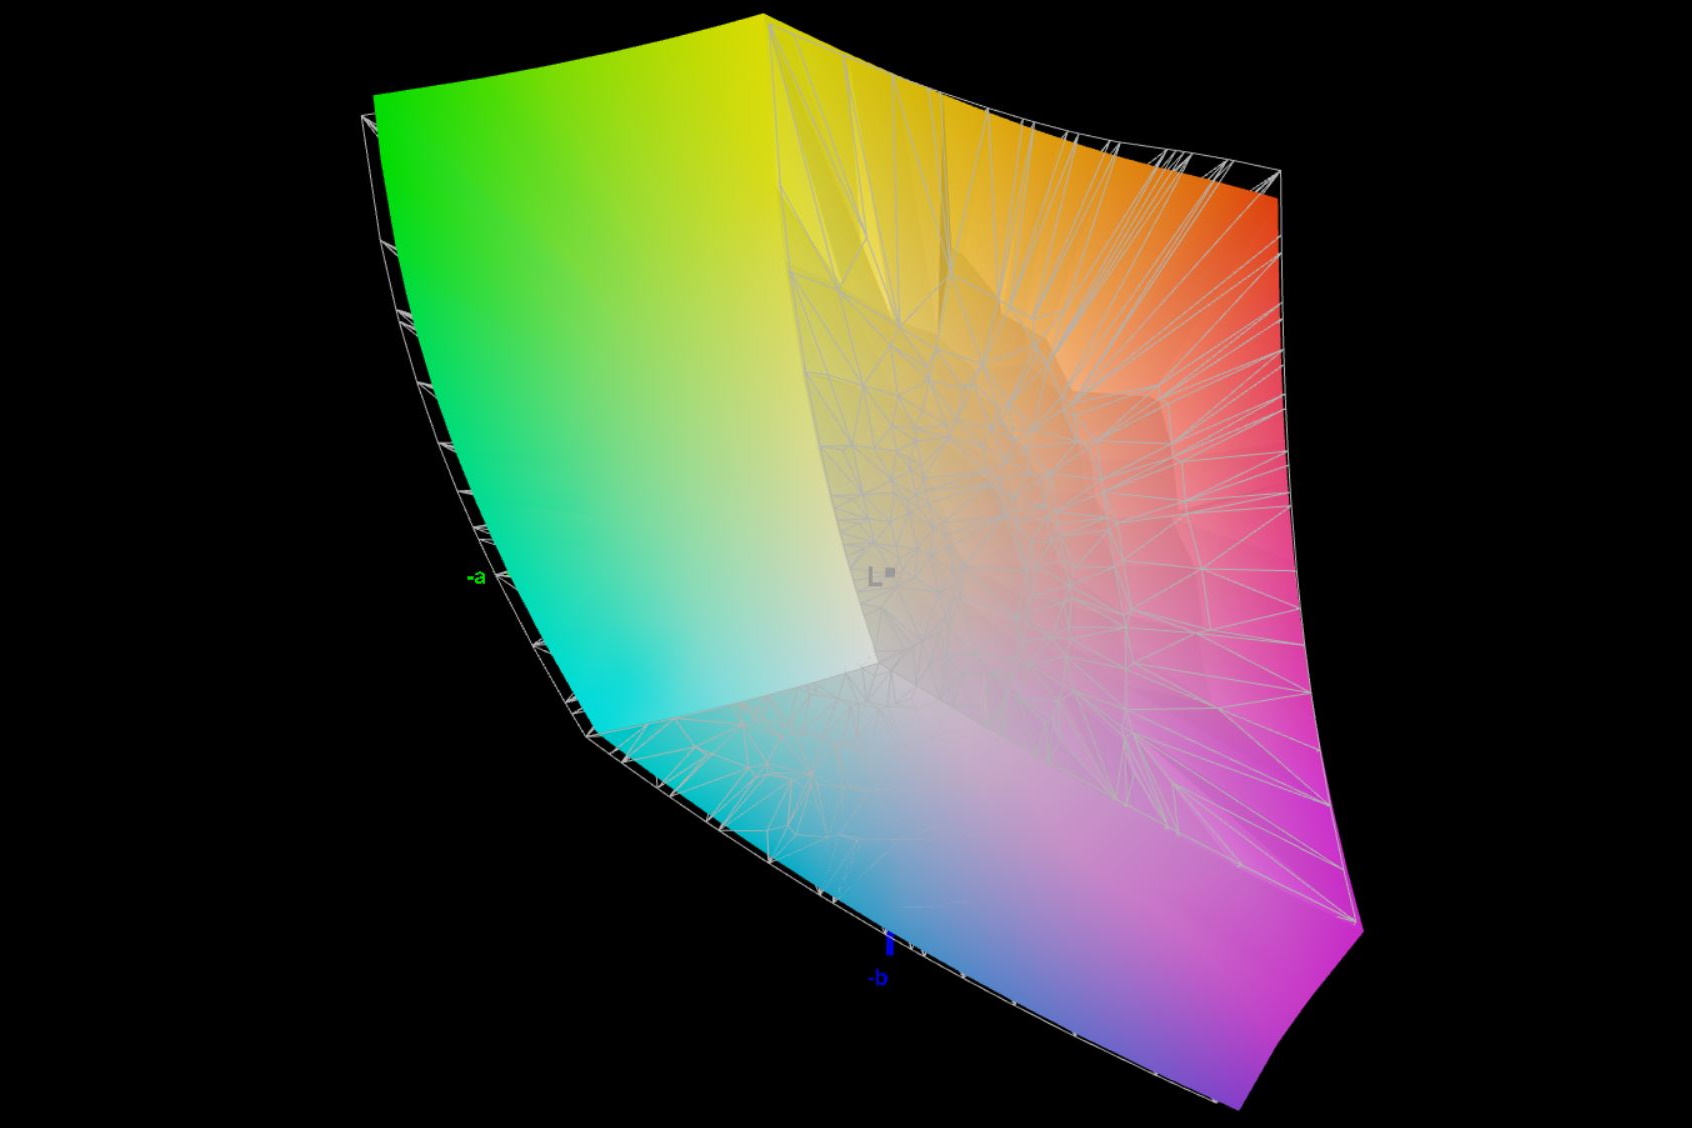
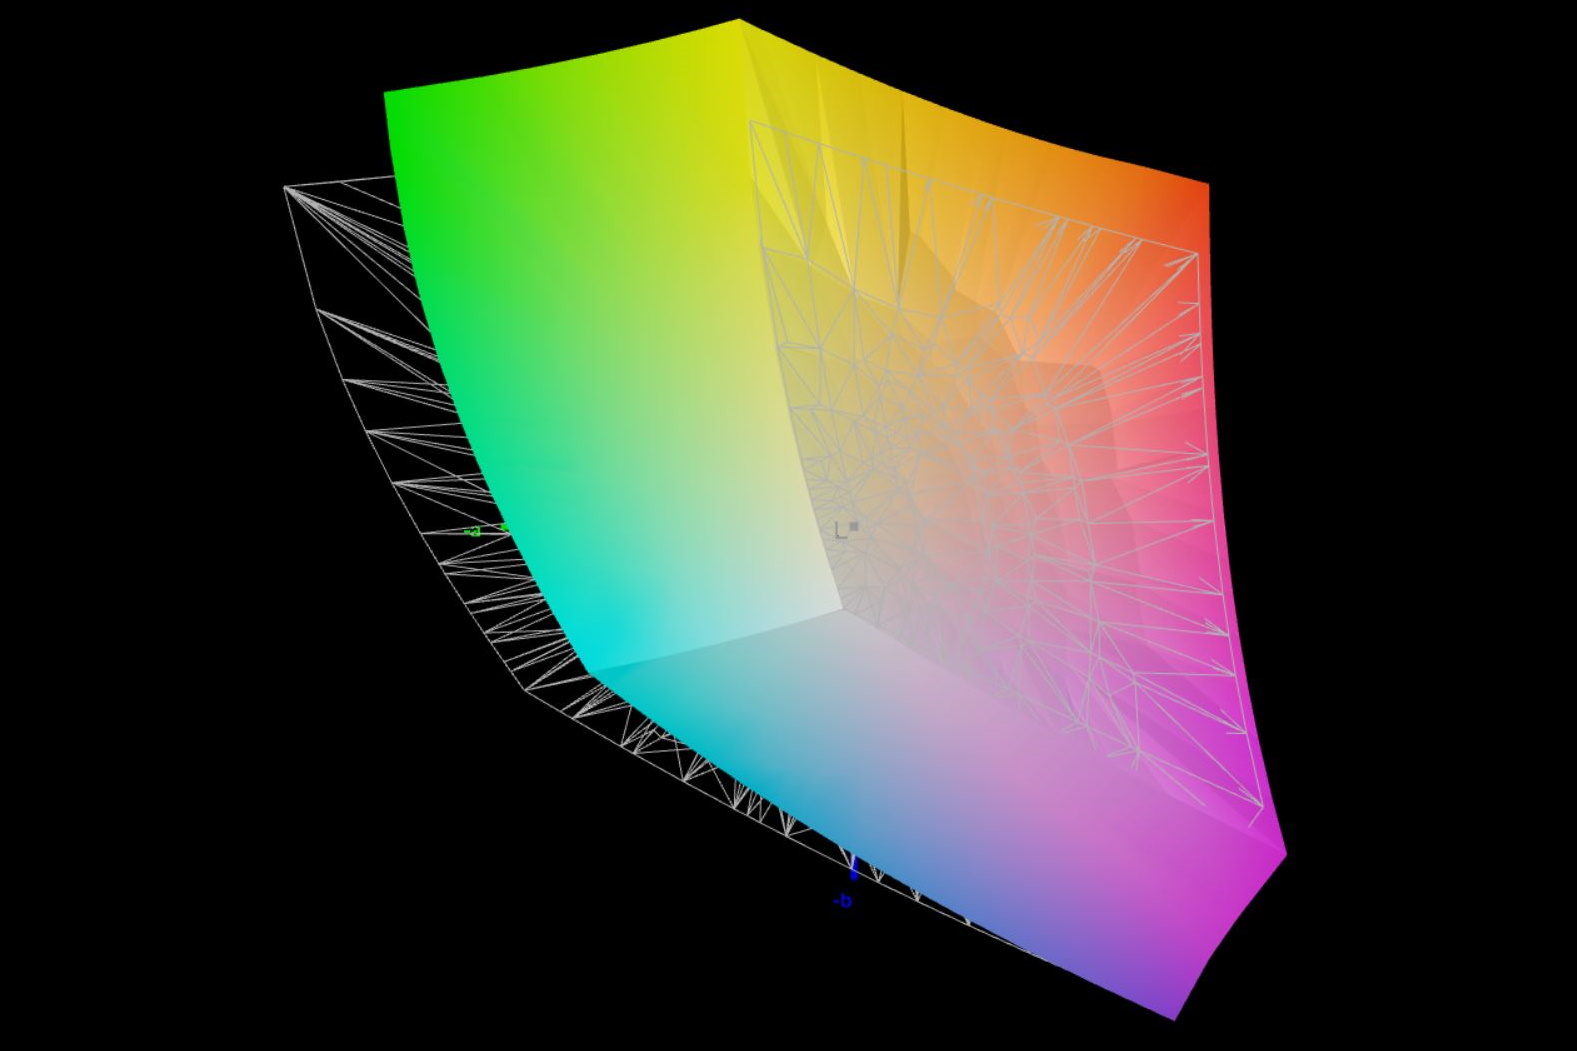
The low color deviations measured without prior calibration are remarkable. Even the maximum determined DeltaE of just under 3 means that no differences can be detected with the naked eye. Thus, the display does not have to be adjusted afterwards for an optimal display.
Display Response Times
| ↔ Response Time Black to White | ||
|---|---|---|
| 10.8 ms ... rise ↗ and fall ↘ combined | ↗ 4.6 ms rise | 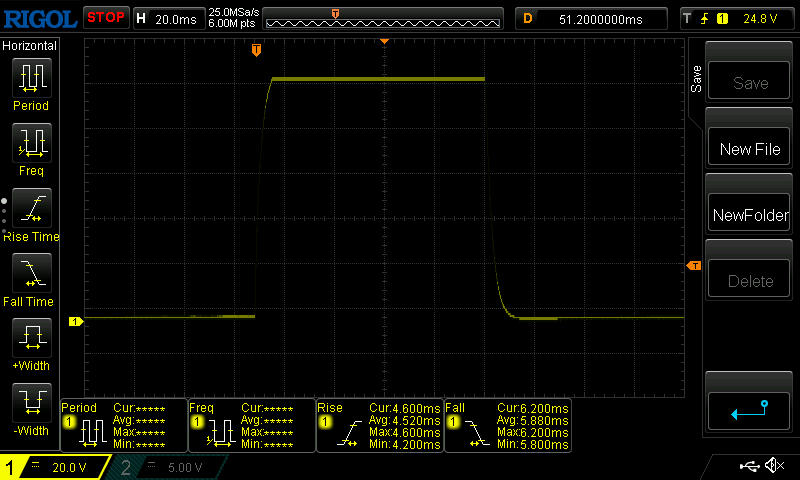 |
| ↘ 6.2 ms fall | ||
| The screen shows good response rates in our tests, but may be too slow for competitive gamers. In comparison, all tested devices range from 0.1 (minimum) to 240 (maximum) ms. » 29 % of all devices are better. This means that the measured response time is better than the average of all tested devices (19.9 ms). | ||
| ↔ Response Time 50% Grey to 80% Grey | ||
| 16.4 ms ... rise ↗ and fall ↘ combined | ↗ 7.4 ms rise | 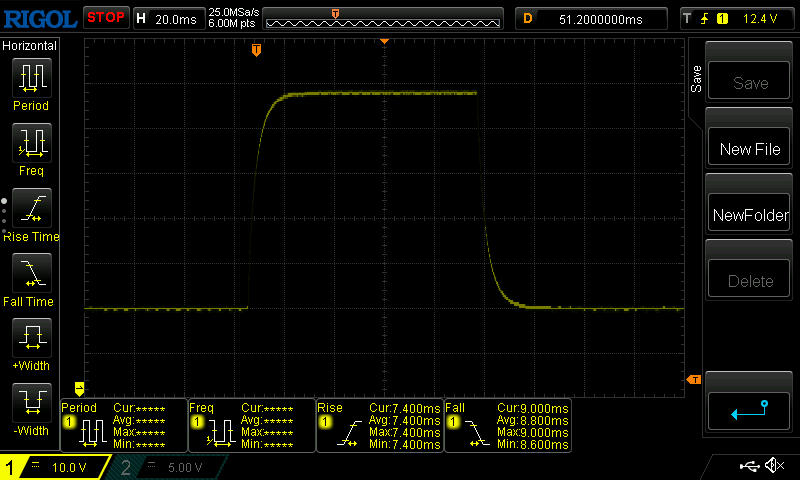 |
| ↘ 9 ms fall | ||
| The screen shows good response rates in our tests, but may be too slow for competitive gamers. In comparison, all tested devices range from 0.165 (minimum) to 636 (maximum) ms. » 30 % of all devices are better. This means that the measured response time is better than the average of all tested devices (31.1 ms). | ||
Screen Flickering / PWM (Pulse-Width Modulation)
| Screen flickering / PWM not detected | 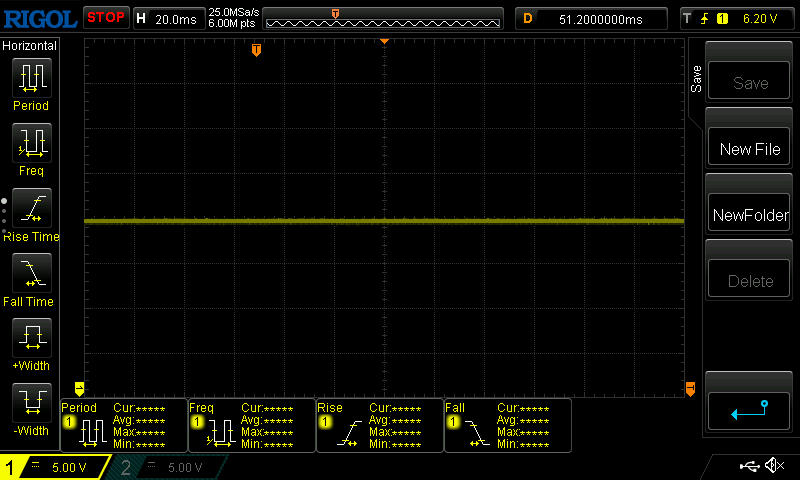 | ||
In comparison: 52 % of all tested devices do not use PWM to dim the display. If PWM was detected, an average of 7798 (minimum: 5 - maximum: 343500) Hz was measured. | |||
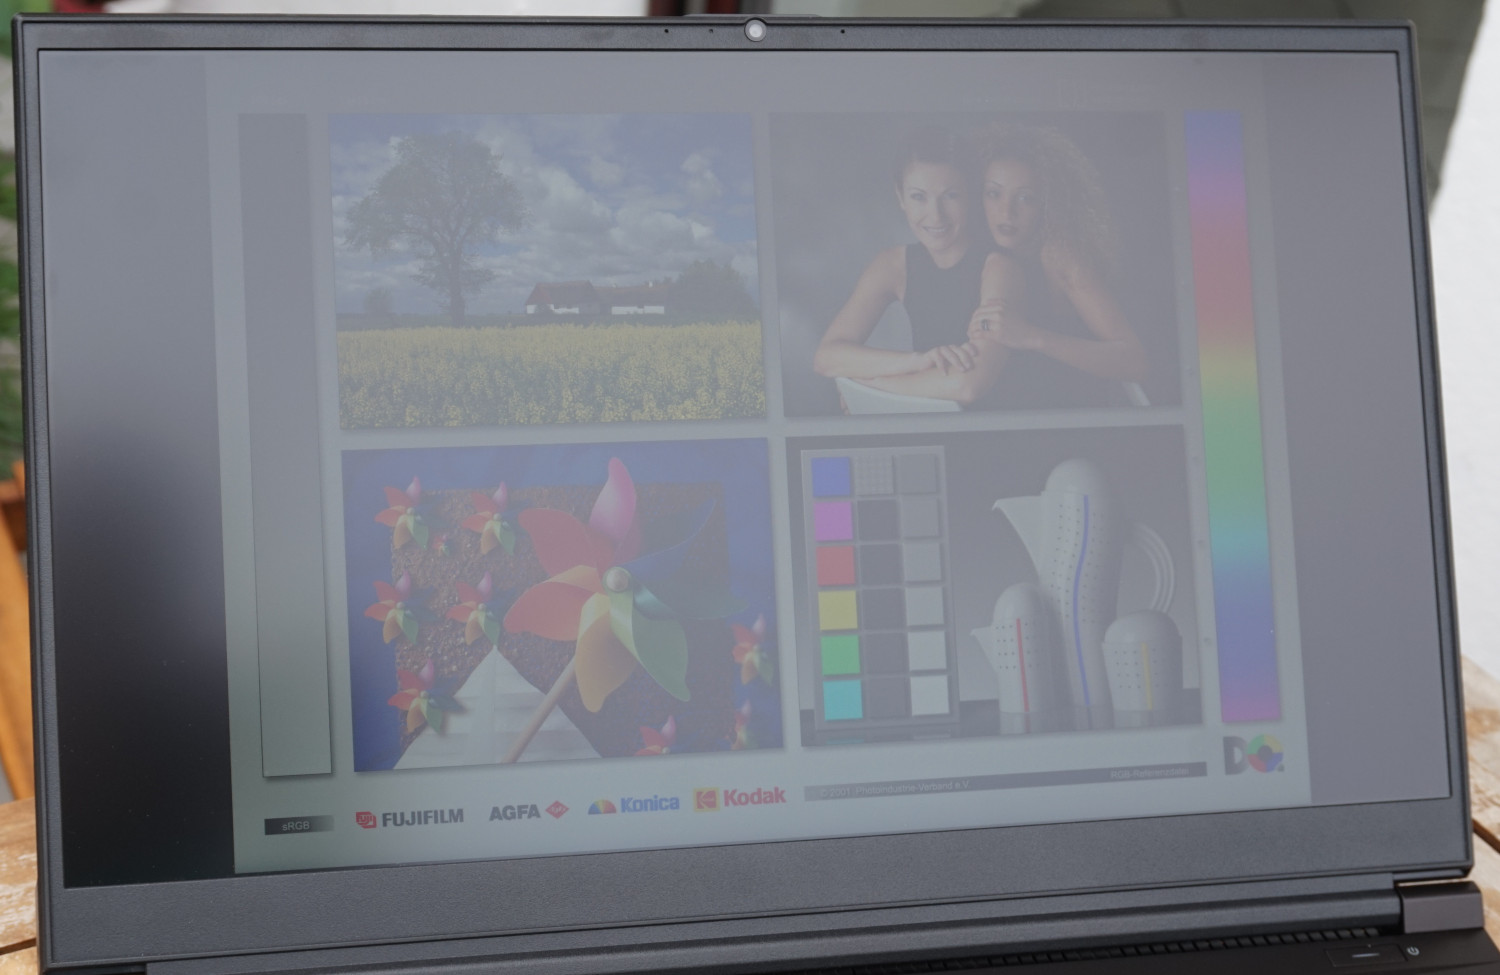
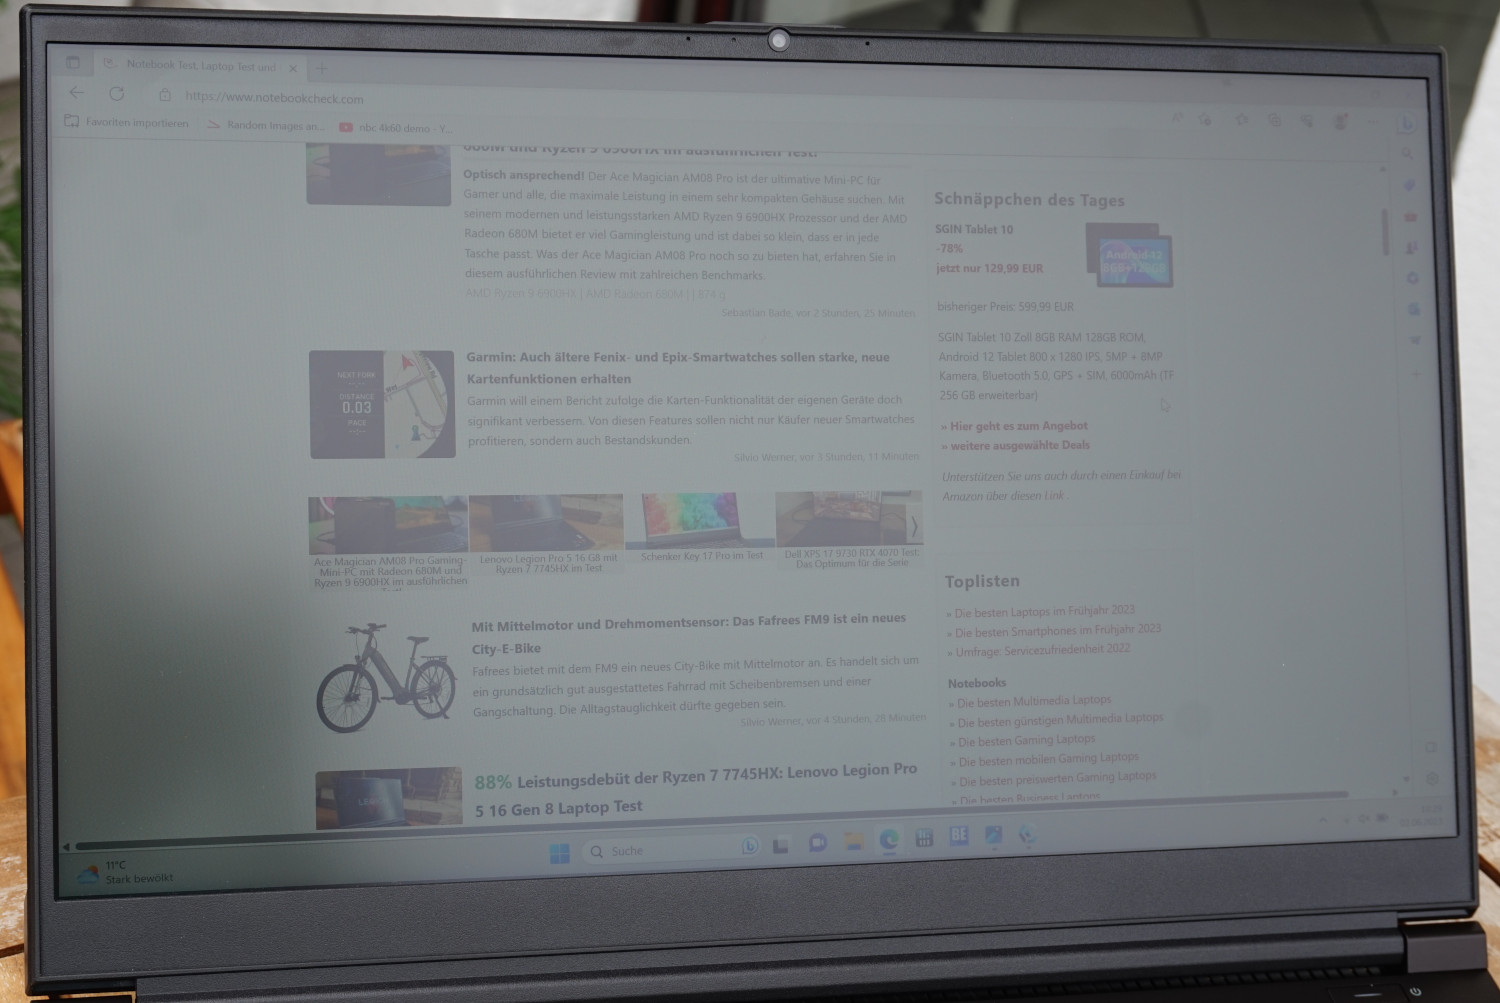
With only 350 cd/m², outdoor visibility suffers significantly. Colors can still be recognized well in a shady place. However, if a bit more light falls on the screen, texts can at most still be recognized sufficiently well. This is also true on a cloudy day.
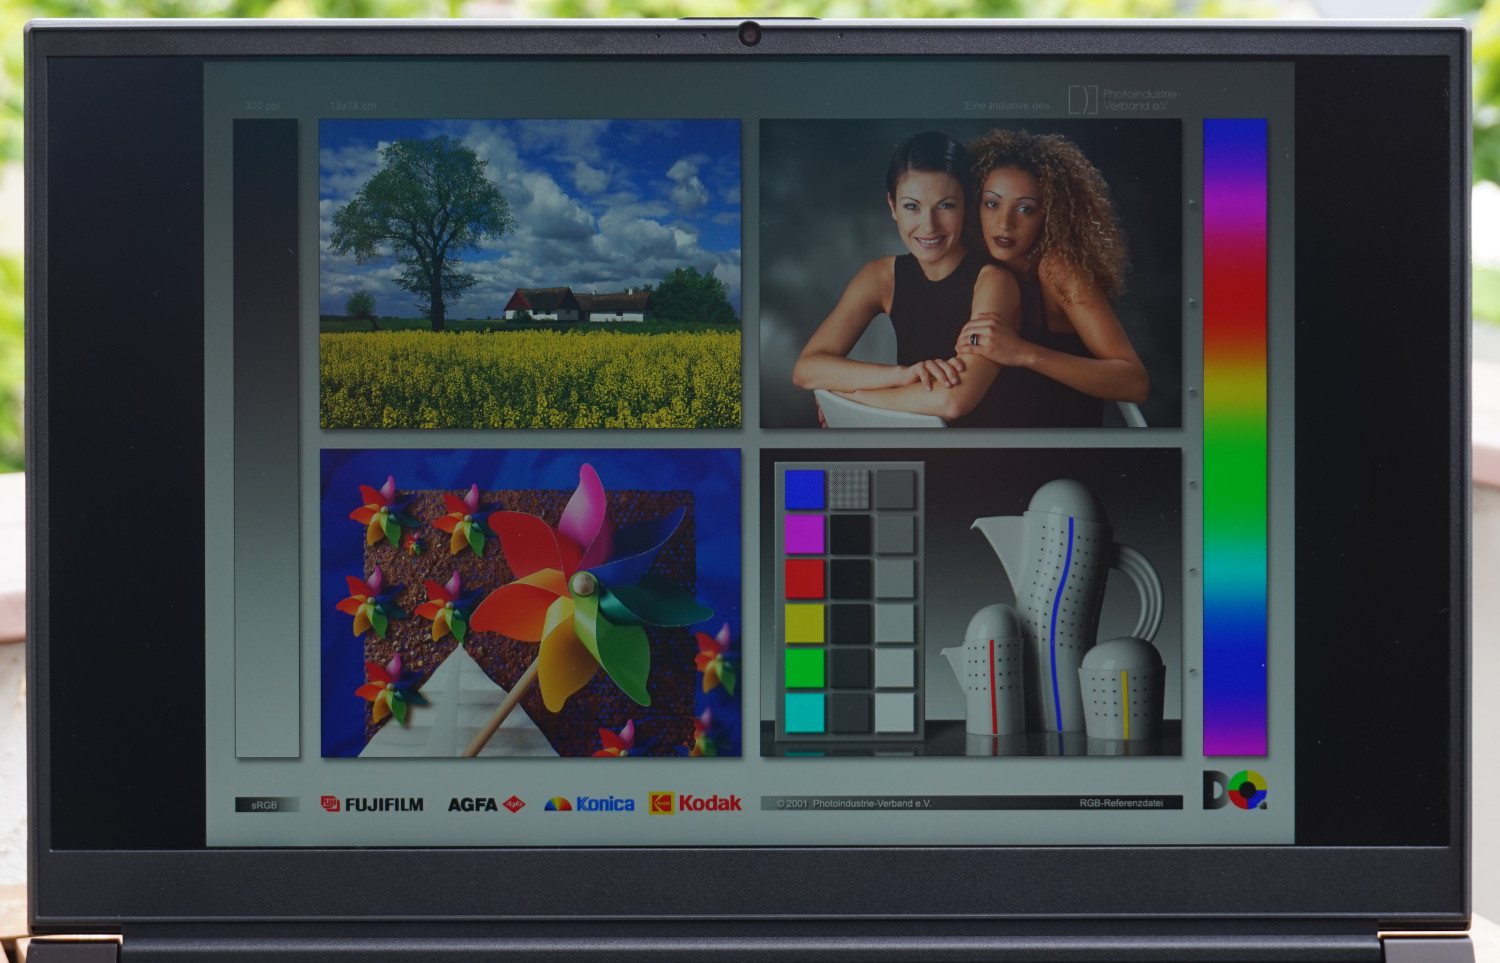
The color reproduction from different viewing directions is expectedly good. The IPS panel does not reveal any color changes and the brightness also remains almost constant, even from a sharp angle.

Performance - Solid gaming with the Focus 17
Especially the strong Nvidia Geforce RTX 4070 determines the application possibilities of the Focus 17 E23. The GPU offers a lot of performance paired with enough VRAM for current titles that can mostly be played at the native QHD resolution and almost all details. This should also apply to upcoming games in the near future.
At the same time, a good working speed is guaranteed thanks to the Intel Core i9-13900HX. Complex applications can be processed quickly. Multitasking does not pose a problem even to a high degree. However, the CPU performance is secondary at best in a gaming notebook.
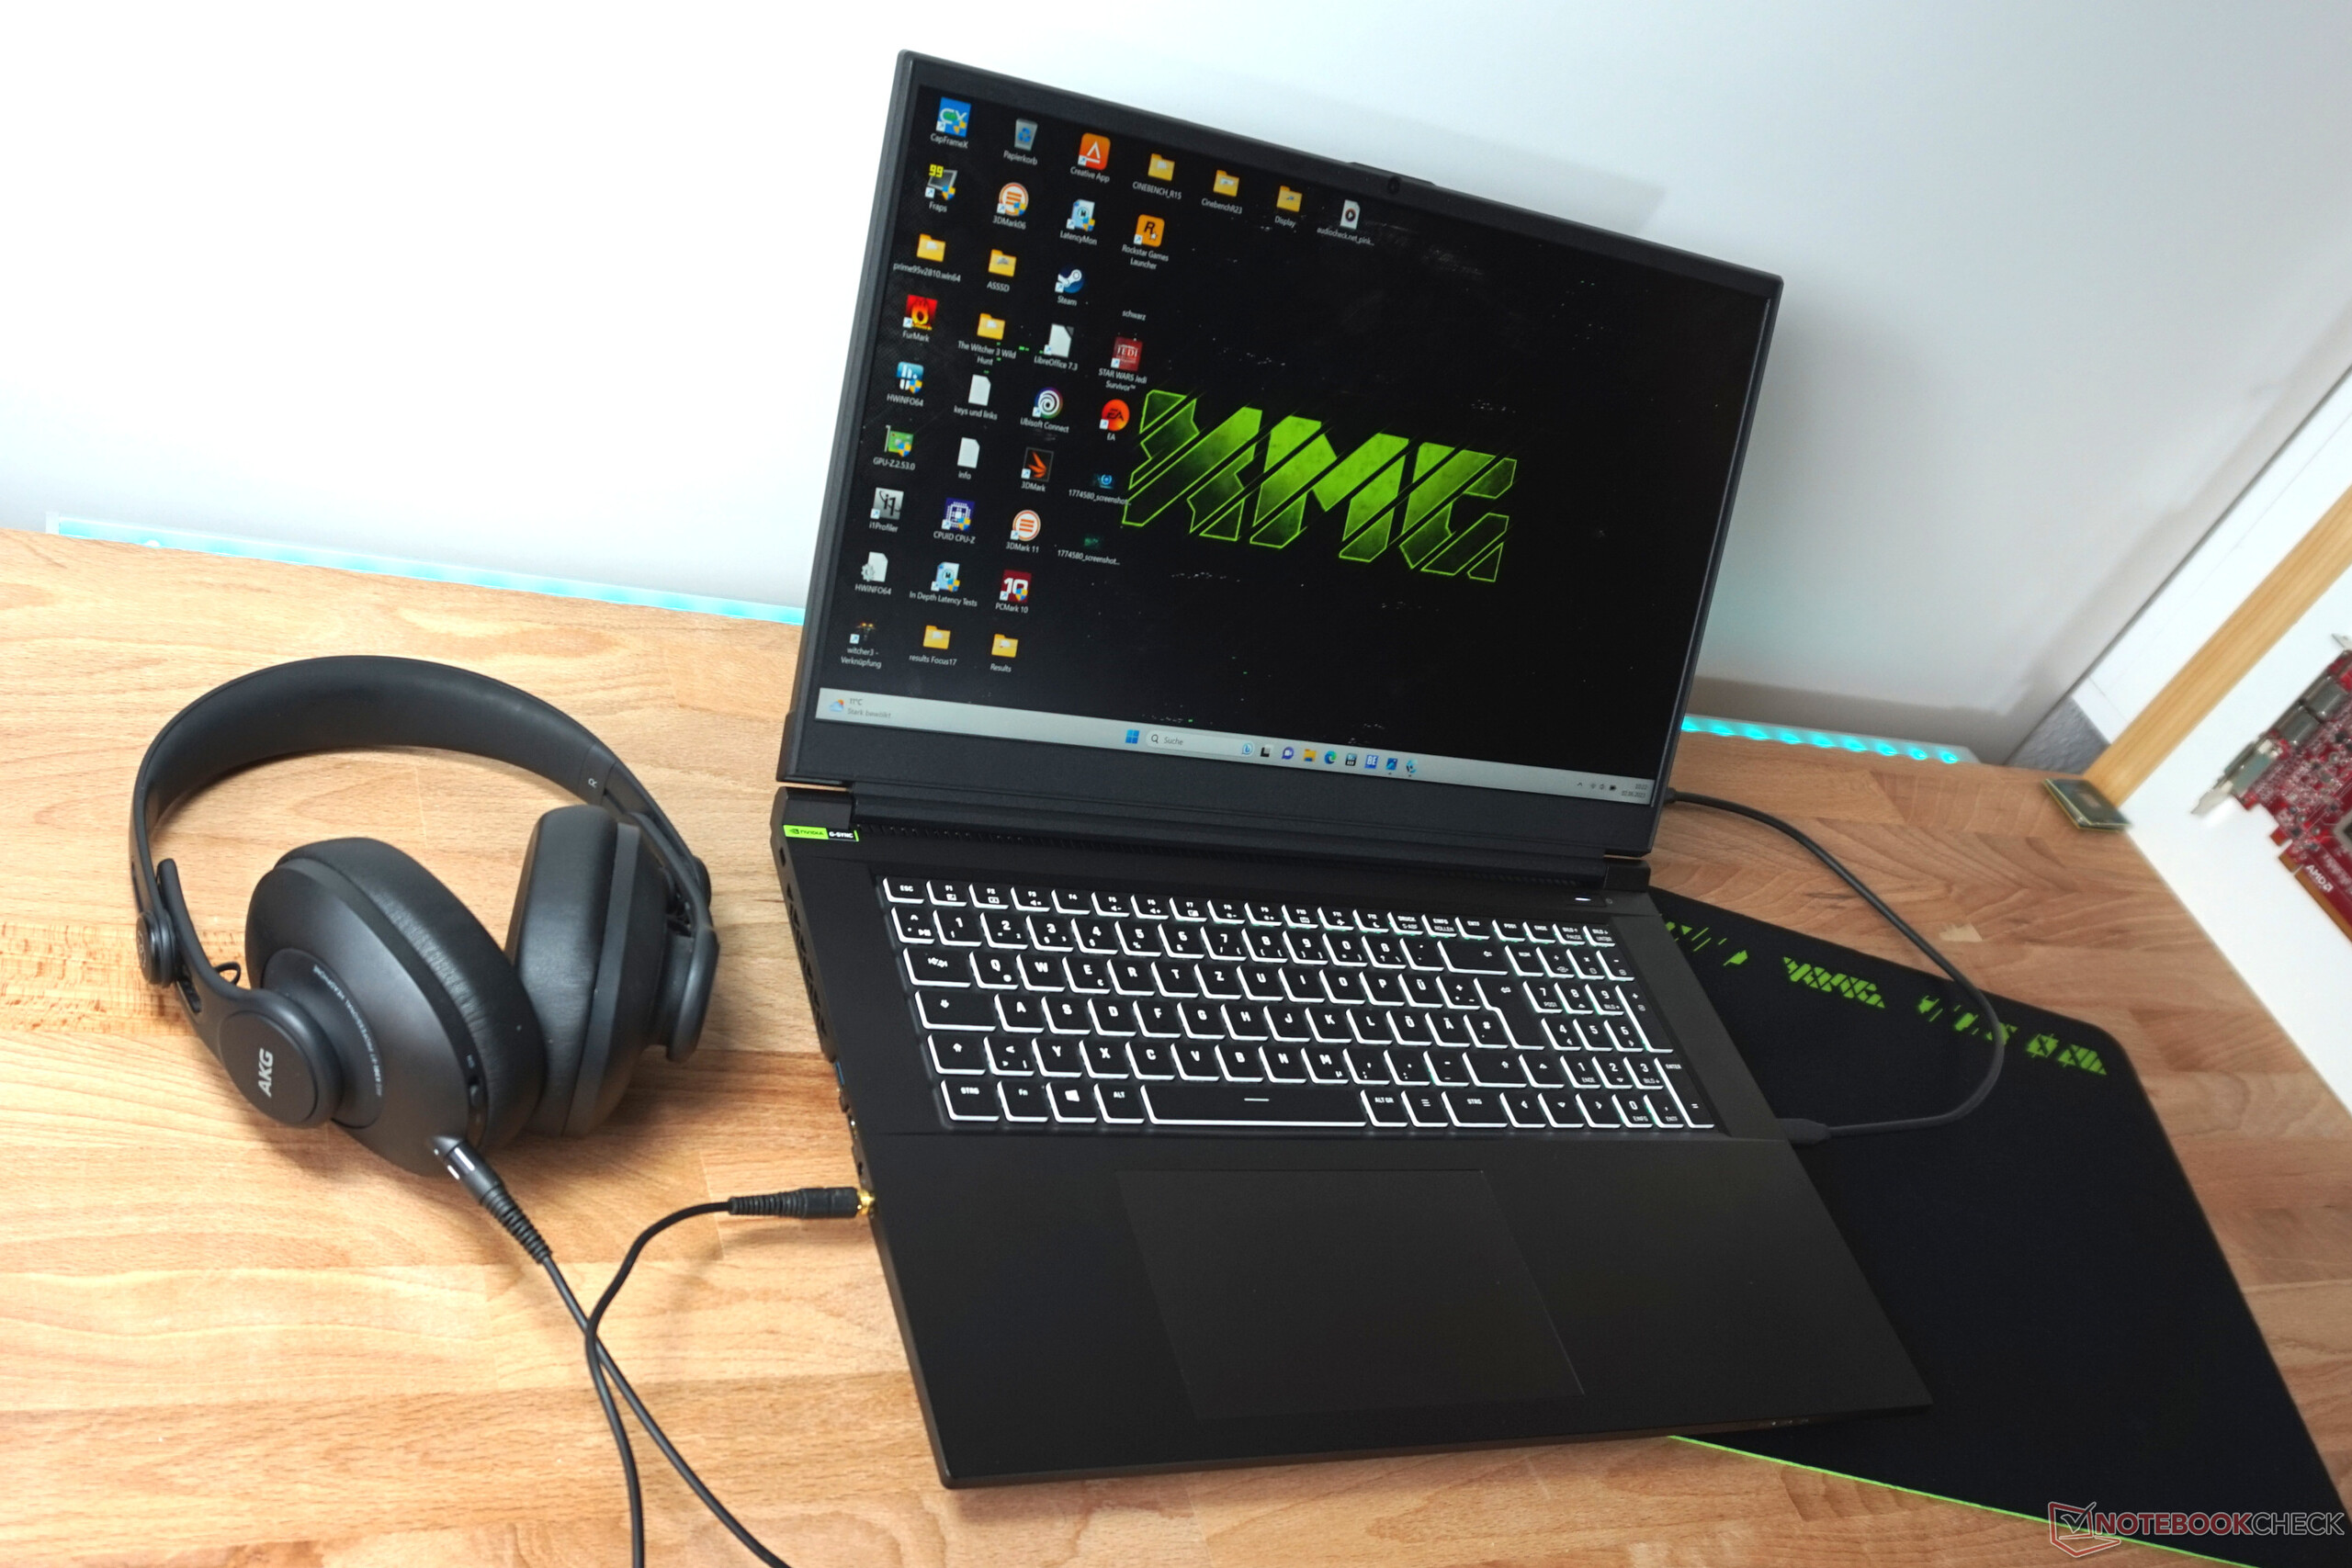
Test conditions
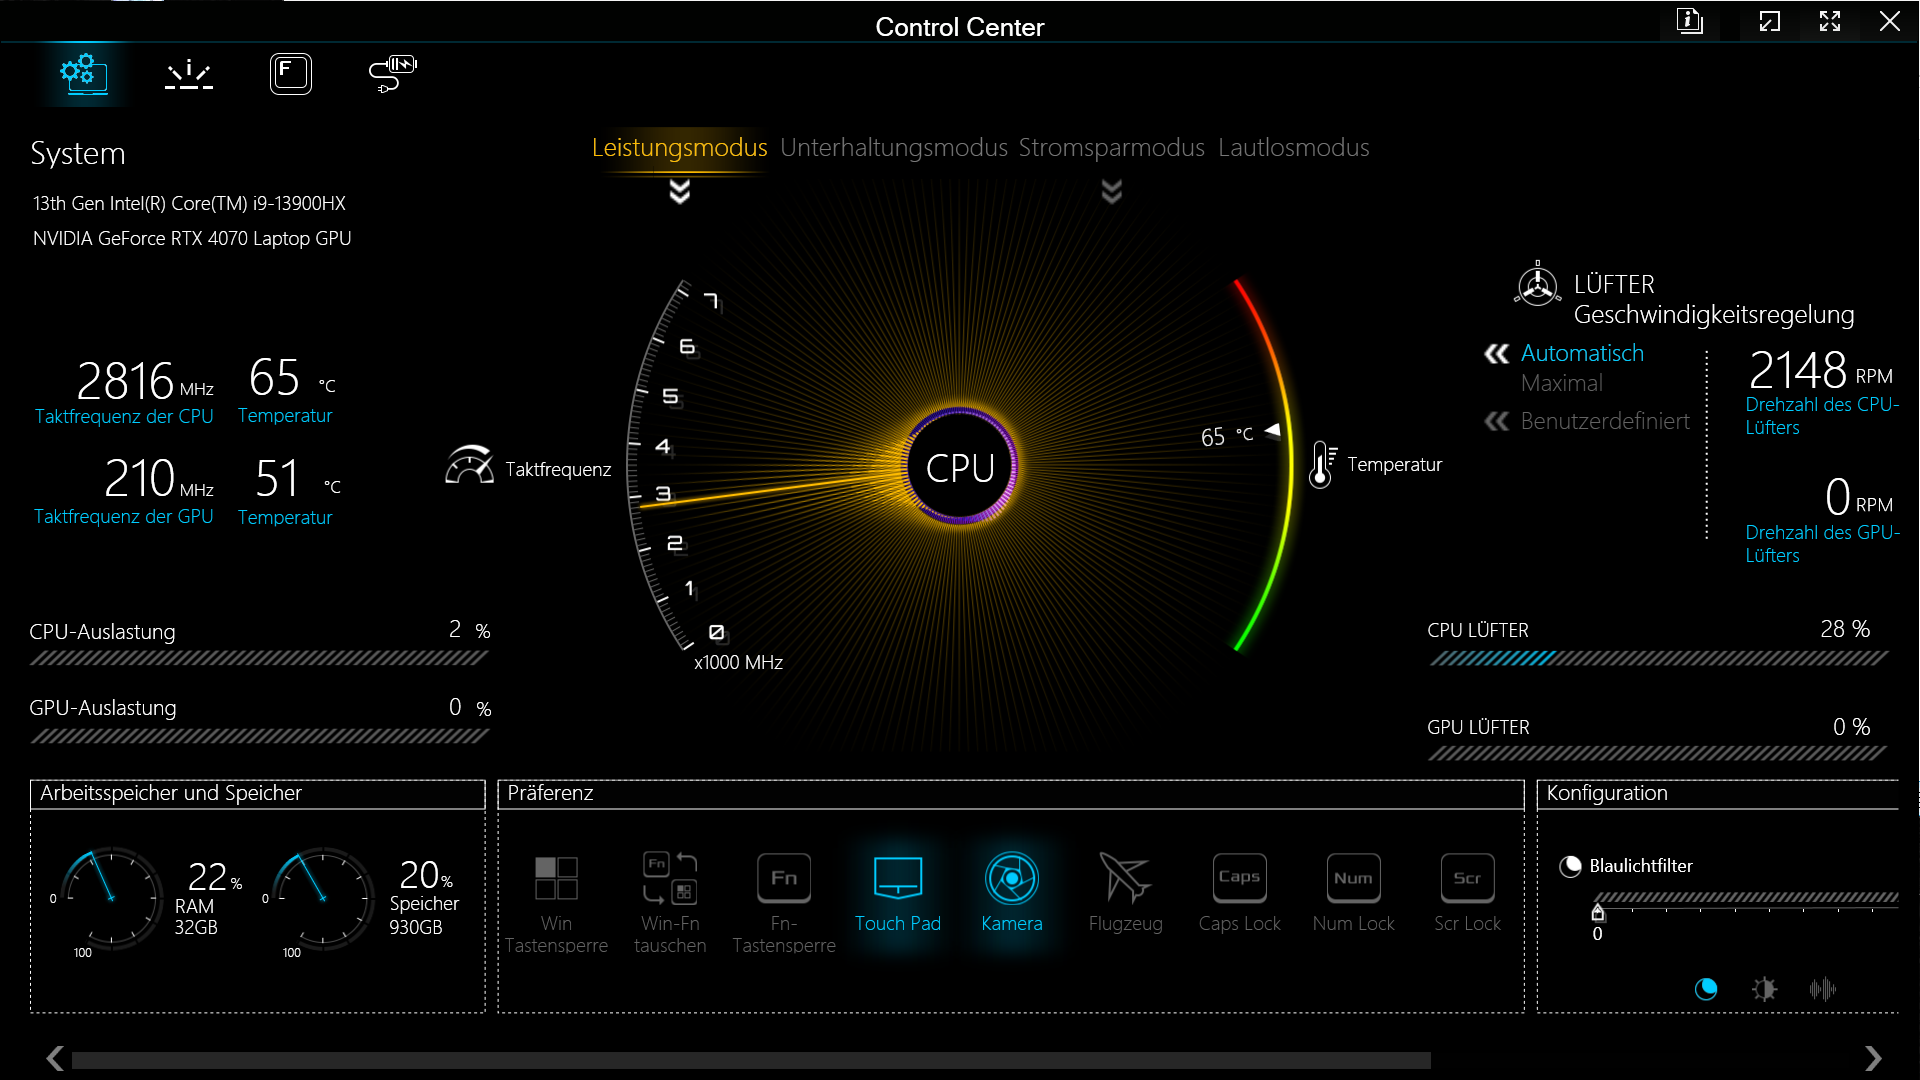
Four predefined performance modes can be selected in the preinstalled ControlCenter. We always used the "Performance Mode" for our tests and benchmarks, which ensures the highest fan speeds and maximum power supply to the GPU and CPU.
The values are minimally weaker in "Entertainment Mode". Only the CPU's performance is slightly reduced here, so noticeable effects on gaming are hardly to be expected. "Silent mode", on the other hand, restricts the system performance considerably, but the noise development fades into the background, even if it does not disappear completely. Less demanding games remain playable even in this mode. Among others, Witcher 3 reaches more than 60 fps on the highest settings and in Full HD.
The "Power-saving mode" completely disables the dedicated graphics chip and is, according to the current state of affairs, mandatory to achieve halfway acceptable battery runtimes, at least on the system we tested.
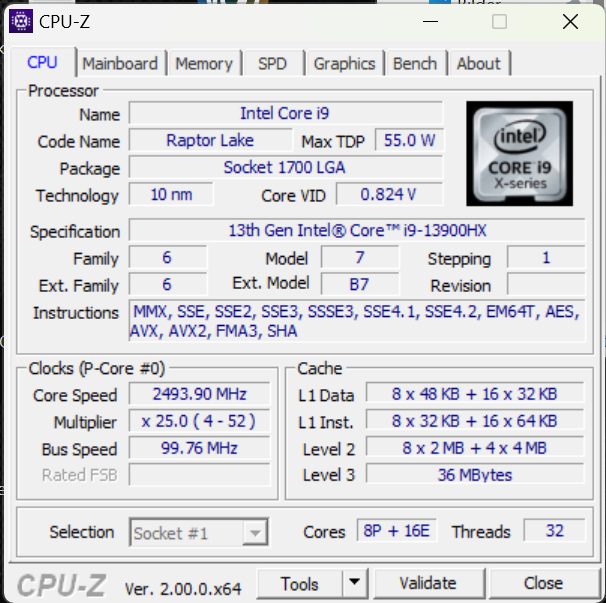
Processor
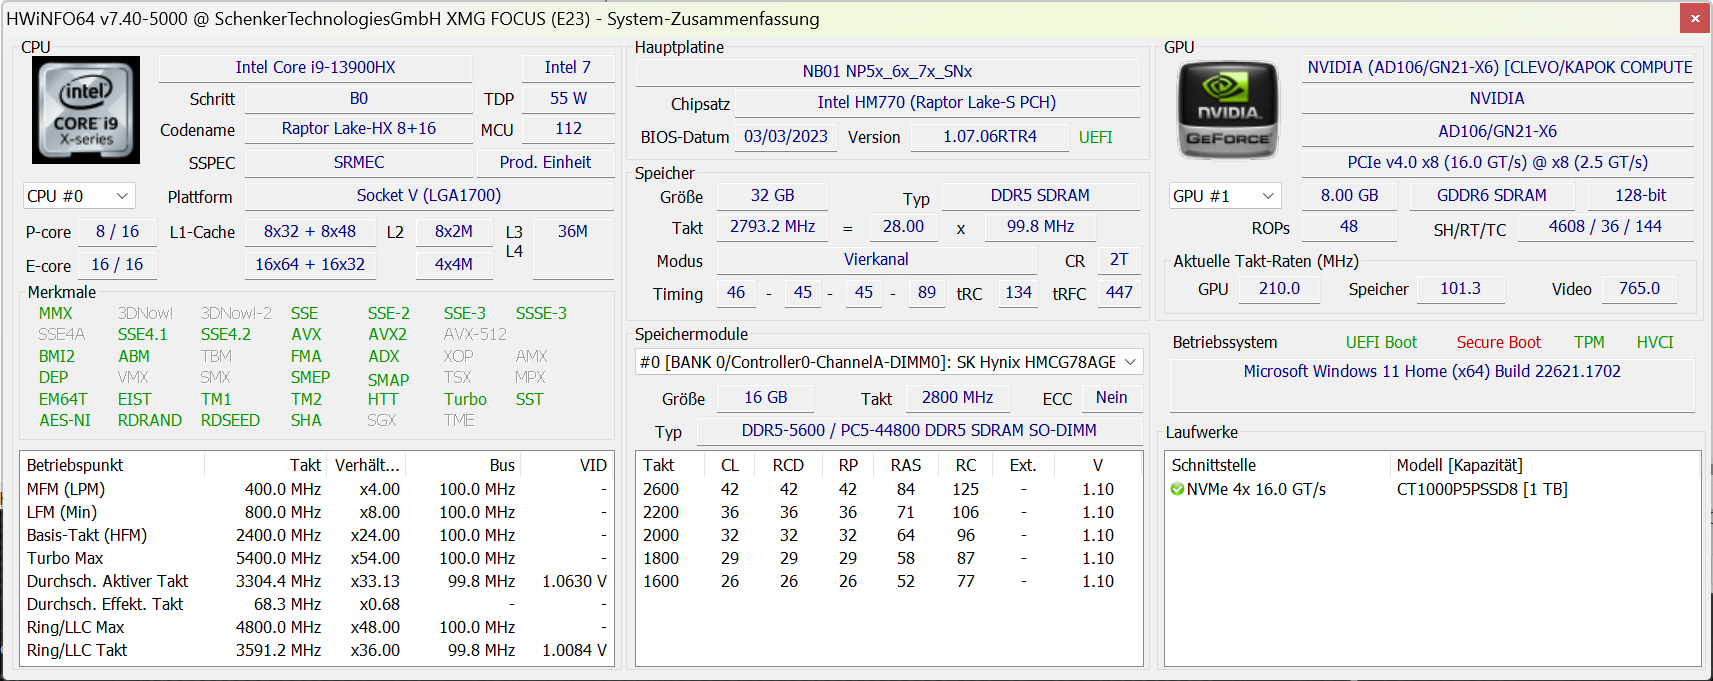
A total of 32 threads and 36 MB Level 3 cache as well as the maximum clock rate of 5.4 GHz indicate it: The Intel Core i9-13900HX is currently one of the best mobile CPUs. It is optimally used for multitasking and computationally intensive applications and leaves the predecessor Intel Core i9-12900HX or an AMD Ryzen 7 7745HX behind.
In the XMG Focus 17, the CPU receives up to 162 W for fractions of a second. At least 135 W can be fed for half a minute. Unfortunately, the cooling cannot quite cope with the high heat development. In the Medion Erazer Major X20, the identical processor remains stable at maximum performance. In Focus 17, the performance drops by over 20% in the Cinebench R15 test. However, the i9 in HP's Omen 17-ck2097ng even loses 30%, so the overall behavior seems acceptable.
The fact that the processor is somewhat overdimensioned becomes apparent when we look at the "Entertainment Mode". The fan remains loud here as well, although the power supply is lowered from 135 W to 55 W. At the same time, we do not measure any serious performance reduction, especially in games. This is because the CPU can only be operated sufficiently stably with this power consumption in the long run. Accordingly, the power mode only has an effect during short-term loads.
Only 15 W are granted in the quiet and energy-saving modes and 30 W for short periods.
More measurements, comparison data, and information can be found in our CPU benchmark list.
Cinebench R15 Multi loop
Cinebench R23: Multi Core | Single Core
Cinebench R20: CPU (Multi Core) | CPU (Single Core)
Cinebench R15: CPU Multi 64Bit | CPU Single 64Bit
Blender: v2.79 BMW27 CPU
7-Zip 18.03: 7z b 4 | 7z b 4 -mmt1
Geekbench 5.5: Multi-Core | Single-Core
HWBOT x265 Benchmark v2.2: 4k Preset
LibreOffice : 20 Documents To PDF
R Benchmark 2.5: Overall mean
| CPU Performance rating | |
| Average Intel Core i9-13900HX | |
| Medion Erazer Major X20 | |
| HP Omen 17-ck2097ng | |
| Schenker XMG Focus 17 (E23) | |
| Average of class Gaming | |
| MSI Titan GT77 12UHS | |
| Lenovo Legion Pro 5 16ARX8 | |
| Medion Erazer Defender P40 | |
| Schenker XMG Neo 17 M22 | |
| Cinebench R23 / Multi Core | |
| Average Intel Core i9-13900HX (24270 - 32623, n=23) | |
| Medion Erazer Major X20 | |
| Schenker XMG Focus 17 (E23) | |
| HP Omen 17-ck2097ng | |
| Average of class Gaming (10488 - 40970, n=113, last 2 years) | |
| MSI Titan GT77 12UHS | |
| Medion Erazer Defender P40 | |
| Lenovo Legion Pro 5 16ARX8 | |
| Schenker XMG Neo 17 M22 | |
| Cinebench R23 / Single Core | |
| HP Omen 17-ck2097ng | |
| Average Intel Core i9-13900HX (1867 - 2105, n=20) | |
| Medion Erazer Major X20 | |
| Schenker XMG Focus 17 (E23) | |
| Average of class Gaming (1166 - 2356, n=113, last 2 years) | |
| MSI Titan GT77 12UHS | |
| Lenovo Legion Pro 5 16ARX8 | |
| Medion Erazer Defender P40 | |
| Schenker XMG Neo 17 M22 | |
| Cinebench R20 / CPU (Multi Core) | |
| Average Intel Core i9-13900HX (9152 - 12541, n=21) | |
| Medion Erazer Major X20 | |
| Schenker XMG Focus 17 (E23) | |
| HP Omen 17-ck2097ng | |
| Average of class Gaming (4029 - 16108, n=112, last 2 years) | |
| MSI Titan GT77 12UHS | |
| Medion Erazer Defender P40 | |
| Lenovo Legion Pro 5 16ARX8 | |
| Schenker XMG Neo 17 M22 | |
| Cinebench R20 / CPU (Single Core) | |
| HP Omen 17-ck2097ng | |
| Average Intel Core i9-13900HX (722 - 810, n=21) | |
| Medion Erazer Major X20 | |
| Average of class Gaming (442 - 895, n=112, last 2 years) | |
| Schenker XMG Focus 17 (E23) | |
| MSI Titan GT77 12UHS | |
| Lenovo Legion Pro 5 16ARX8 | |
| Medion Erazer Defender P40 | |
| Schenker XMG Neo 17 M22 | |
| Cinebench R15 / CPU Multi 64Bit | |
| Average Intel Core i9-13900HX (3913 - 4970, n=22) | |
| Schenker XMG Focus 17 (E23) | |
| Medion Erazer Major X20 | |
| HP Omen 17-ck2097ng | |
| Average of class Gaming (1578 - 6271, n=113, last 2 years) | |
| MSI Titan GT77 12UHS | |
| Medion Erazer Defender P40 | |
| Lenovo Legion Pro 5 16ARX8 | |
| Schenker XMG Neo 17 M22 | |
| Cinebench R15 / CPU Single 64Bit | |
| HP Omen 17-ck2097ng | |
| Medion Erazer Major X20 | |
| Average of class Gaming (188.8 - 343, n=112, last 2 years) | |
| Lenovo Legion Pro 5 16ARX8 | |
| Average Intel Core i9-13900HX (247 - 304, n=22) | |
| Schenker XMG Focus 17 (E23) | |
| MSI Titan GT77 12UHS | |
| Schenker XMG Neo 17 M22 | |
| Medion Erazer Defender P40 | |
| Blender / v2.79 BMW27 CPU | |
| Schenker XMG Neo 17 M22 | |
| Medion Erazer Defender P40 | |
| Lenovo Legion Pro 5 16ARX8 | |
| Average of class Gaming (80 - 330, n=110, last 2 years) | |
| HP Omen 17-ck2097ng | |
| MSI Titan GT77 12UHS | |
| Schenker XMG Focus 17 (E23) | |
| Average Intel Core i9-13900HX (101 - 153, n=22) | |
| Medion Erazer Major X20 | |
| 7-Zip 18.03 / 7z b 4 | |
| Medion Erazer Major X20 | |
| Average Intel Core i9-13900HX (90675 - 127283, n=21) | |
| Schenker XMG Focus 17 (E23) | |
| HP Omen 17-ck2097ng | |
| Average of class Gaming (33491 - 148086, n=111, last 2 years) | |
| MSI Titan GT77 12UHS | |
| Lenovo Legion Pro 5 16ARX8 | |
| Medion Erazer Defender P40 | |
| Schenker XMG Neo 17 M22 | |
| 7-Zip 18.03 / 7z b 4 -mmt1 | |
| Lenovo Legion Pro 5 16ARX8 | |
| HP Omen 17-ck2097ng | |
| Medion Erazer Major X20 | |
| Average Intel Core i9-13900HX (6340 - 7177, n=21) | |
| Schenker XMG Focus 17 (E23) | |
| Average of class Gaming (4199 - 7436, n=111, last 2 years) | |
| MSI Titan GT77 12UHS | |
| Schenker XMG Neo 17 M22 | |
| Medion Erazer Defender P40 | |
| Geekbench 5.5 / Multi-Core | |
| HP Omen 17-ck2097ng | |
| Average Intel Core i9-13900HX (17614 - 21075, n=22) | |
| Medion Erazer Major X20 | |
| Schenker XMG Focus 17 (E23) | |
| Average of class Gaming (6460 - 27010, n=111, last 2 years) | |
| MSI Titan GT77 12UHS | |
| Medion Erazer Defender P40 | |
| Lenovo Legion Pro 5 16ARX8 | |
| Schenker XMG Neo 17 M22 | |
| Geekbench 5.5 / Single-Core | |
| HP Omen 17-ck2097ng | |
| Average of class Gaming (986 - 2474, n=111, last 2 years) | |
| Lenovo Legion Pro 5 16ARX8 | |
| Medion Erazer Major X20 | |
| Average Intel Core i9-13900HX (1345 - 2093, n=22) | |
| Schenker XMG Focus 17 (E23) | |
| MSI Titan GT77 12UHS | |
| Medion Erazer Defender P40 | |
| Schenker XMG Neo 17 M22 | |
| HWBOT x265 Benchmark v2.2 / 4k Preset | |
| Average Intel Core i9-13900HX (23.5 - 34.4, n=22) | |
| Medion Erazer Major X20 | |
| Average of class Gaming (11.5 - 44.3, n=111, last 2 years) | |
| Schenker XMG Focus 17 (E23) | |
| MSI Titan GT77 12UHS | |
| HP Omen 17-ck2097ng | |
| Lenovo Legion Pro 5 16ARX8 | |
| Medion Erazer Defender P40 | |
| Schenker XMG Neo 17 M22 | |
| LibreOffice / 20 Documents To PDF | |
| Schenker XMG Neo 17 M22 | |
| Schenker XMG Focus 17 (E23) | |
| Medion Erazer Defender P40 | |
| Average of class Gaming (19 - 88.8, n=111, last 2 years) | |
| HP Omen 17-ck2097ng | |
| Average Intel Core i9-13900HX (32.8 - 51.1, n=21) | |
| Medion Erazer Major X20 | |
| MSI Titan GT77 12UHS | |
| Lenovo Legion Pro 5 16ARX8 | |
| R Benchmark 2.5 / Overall mean | |
| Medion Erazer Defender P40 | |
| Schenker XMG Neo 17 M22 | |
| Average of class Gaming (0.3439 - 0.759, n=112, last 2 years) | |
| Schenker XMG Focus 17 (E23) | |
| Lenovo Legion Pro 5 16ARX8 | |
| MSI Titan GT77 12UHS | |
| Average Intel Core i9-13900HX (0.375 - 0.4564, n=22) | |
| Medion Erazer Major X20 | |
| HP Omen 17-ck2097ng | |
* ... smaller is better
AIDA64: FP32 Ray-Trace | FPU Julia | CPU SHA3 | CPU Queen | FPU SinJulia | FPU Mandel | CPU AES | CPU ZLib | FP64 Ray-Trace | CPU PhotoWorxx
| Performance rating | |
| Average of class Gaming | |
| Average Intel Core i9-13900HX | |
| Medion Erazer Major X20 | |
| Schenker XMG Focus 17 (E23) | |
| Lenovo Legion Pro 5 16ARX8 | |
| HP Omen 17-ck2097ng | |
| Schenker XMG Neo 17 M22 | |
| Medion Erazer Defender P40 | |
| AIDA64 / FP32 Ray-Trace | |
| Average of class Gaming (10227 - 85542, n=110, last 2 years) | |
| Lenovo Legion Pro 5 16ARX8 | |
| Medion Erazer Major X20 | |
| Average Intel Core i9-13900HX (17589 - 27615, n=22) | |
| Schenker XMG Focus 17 (E23) | |
| HP Omen 17-ck2097ng | |
| Schenker XMG Neo 17 M22 | |
| Medion Erazer Defender P40 | |
| AIDA64 / FPU Julia | |
| Average of class Gaming (51376 - 238426, n=110, last 2 years) | |
| Medion Erazer Major X20 | |
| Average Intel Core i9-13900HX (88686 - 137015, n=22) | |
| Lenovo Legion Pro 5 16ARX8 | |
| Schenker XMG Focus 17 (E23) | |
| Schenker XMG Neo 17 M22 | |
| HP Omen 17-ck2097ng | |
| Medion Erazer Defender P40 | |
| AIDA64 / CPU SHA3 | |
| Medion Erazer Major X20 | |
| Average of class Gaming (2180 - 9817, n=110, last 2 years) | |
| Average Intel Core i9-13900HX (4362 - 7029, n=22) | |
| Schenker XMG Focus 17 (E23) | |
| Lenovo Legion Pro 5 16ARX8 | |
| HP Omen 17-ck2097ng | |
| Schenker XMG Neo 17 M22 | |
| Medion Erazer Defender P40 | |
| AIDA64 / CPU Queen | |
| Schenker XMG Focus 17 (E23) | |
| HP Omen 17-ck2097ng | |
| Medion Erazer Major X20 | |
| Average Intel Core i9-13900HX (125644 - 141385, n=22) | |
| Lenovo Legion Pro 5 16ARX8 | |
| Average of class Gaming (49785 - 173351, n=101, last 2 years) | |
| Medion Erazer Defender P40 | |
| Schenker XMG Neo 17 M22 | |
| AIDA64 / FPU SinJulia | |
| Lenovo Legion Pro 5 16ARX8 | |
| Medion Erazer Major X20 | |
| Average Intel Core i9-13900HX (12334 - 17179, n=22) | |
| Average of class Gaming (4424 - 33636, n=110, last 2 years) | |
| Schenker XMG Focus 17 (E23) | |
| Schenker XMG Neo 17 M22 | |
| HP Omen 17-ck2097ng | |
| Medion Erazer Defender P40 | |
| AIDA64 / FPU Mandel | |
| Average of class Gaming (25115 - 128721, n=110, last 2 years) | |
| Lenovo Legion Pro 5 16ARX8 | |
| Medion Erazer Major X20 | |
| Average Intel Core i9-13900HX (43850 - 69202, n=22) | |
| Schenker XMG Neo 17 M22 | |
| Schenker XMG Focus 17 (E23) | |
| HP Omen 17-ck2097ng | |
| Medion Erazer Defender P40 | |
| AIDA64 / CPU AES | |
| Average Intel Core i9-13900HX (89413 - 237881, n=22) | |
| Schenker XMG Neo 17 M22 | |
| Medion Erazer Major X20 | |
| Average of class Gaming (39258 - 247074, n=110, last 2 years) | |
| Schenker XMG Focus 17 (E23) | |
| HP Omen 17-ck2097ng | |
| Medion Erazer Defender P40 | |
| Lenovo Legion Pro 5 16ARX8 | |
| AIDA64 / CPU ZLib | |
| Medion Erazer Major X20 | |
| Average Intel Core i9-13900HX (1284 - 1958, n=22) | |
| Schenker XMG Focus 17 (E23) | |
| Average of class Gaming (574 - 2531, n=110, last 2 years) | |
| HP Omen 17-ck2097ng | |
| Lenovo Legion Pro 5 16ARX8 | |
| Medion Erazer Defender P40 | |
| Schenker XMG Neo 17 M22 | |
| AIDA64 / FP64 Ray-Trace | |
| Average of class Gaming (5509 - 45446, n=110, last 2 years) | |
| Lenovo Legion Pro 5 16ARX8 | |
| Medion Erazer Major X20 | |
| Average Intel Core i9-13900HX (9481 - 15279, n=22) | |
| Schenker XMG Focus 17 (E23) | |
| HP Omen 17-ck2097ng | |
| Schenker XMG Neo 17 M22 | |
| Medion Erazer Defender P40 | |
| AIDA64 / CPU PhotoWorxx | |
| HP Omen 17-ck2097ng | |
| Schenker XMG Focus 17 (E23) | |
| Average Intel Core i9-13900HX (42994 - 51994, n=22) | |
| Average of class Gaming (12271 - 89891, n=110, last 2 years) | |
| Medion Erazer Major X20 | |
| Medion Erazer Defender P40 | |
| Schenker XMG Neo 17 M22 | |
| Lenovo Legion Pro 5 16ARX8 | |
System performance
Many processor cores, a lot of RAM with fast access, and a fast SSD drive the system in every situation. Even a game paused in the background only slows down a little. From extensive multitasking with open video editing software to countless browser tabs, hardly anything causes Focus 17 serious problems.
Although it is relatively far behind in the field of rivals with similar hardware, it nevertheless achieves a more than the solid rating that promises more than enough performance for demanding tasks.
CrossMark: Overall | Productivity | Creativity | Responsiveness
| PCMark 10 / Score | |
| Average of class Gaming (5828 - 11574, n=96, last 2 years) | |
| Lenovo Legion Pro 5 16ARX8 | |
| HP Omen 17-ck2097ng | |
| Medion Erazer Major X20 | |
| Average Intel Core i9-13900HX, NVIDIA GeForce RTX 4070 Laptop GPU (6956 - 8153, n=3) | |
| Schenker XMG Neo 17 M22 | |
| Schenker XMG Focus 17 (E23) | |
| Medion Erazer Defender P40 | |
| PCMark 10 / Essentials | |
| HP Omen 17-ck2097ng | |
| Medion Erazer Major X20 | |
| Lenovo Legion Pro 5 16ARX8 | |
| Average Intel Core i9-13900HX, NVIDIA GeForce RTX 4070 Laptop GPU (9865 - 11653, n=3) | |
| Average of class Gaming (8810 - 12600, n=100, last 2 years) | |
| Schenker XMG Focus 17 (E23) | |
| Medion Erazer Defender P40 | |
| Schenker XMG Neo 17 M22 | |
| PCMark 10 / Productivity | |
| Average of class Gaming (6845 - 18766, n=98, last 2 years) | |
| Lenovo Legion Pro 5 16ARX8 | |
| HP Omen 17-ck2097ng | |
| Medion Erazer Major X20 | |
| Medion Erazer Defender P40 | |
| Average Intel Core i9-13900HX, NVIDIA GeForce RTX 4070 Laptop GPU (9470 - 9850, n=3) | |
| Schenker XMG Neo 17 M22 | |
| Schenker XMG Focus 17 (E23) | |
| PCMark 10 / Digital Content Creation | |
| Average of class Gaming (7602 - 19657, n=98, last 2 years) | |
| Lenovo Legion Pro 5 16ARX8 | |
| Average Intel Core i9-13900HX, NVIDIA GeForce RTX 4070 Laptop GPU (9776 - 13370, n=3) | |
| Medion Erazer Major X20 | |
| HP Omen 17-ck2097ng | |
| Schenker XMG Neo 17 M22 | |
| Schenker XMG Focus 17 (E23) | |
| Medion Erazer Defender P40 | |
| CrossMark / Overall | |
| Schenker XMG Focus 17 (E23) | |
| Lenovo Legion Pro 5 16ARX8 | |
| HP Omen 17-ck2097ng | |
| Average of class Gaming (1366 - 2409, n=98, last 2 years) | |
| Average Intel Core i9-13900HX, NVIDIA GeForce RTX 4070 Laptop GPU (1842 - 2029, n=3) | |
| Medion Erazer Major X20 | |
| Medion Erazer Defender P40 | |
| Schenker XMG Neo 17 M22 | |
| CrossMark / Productivity | |
| Lenovo Legion Pro 5 16ARX8 | |
| Schenker XMG Focus 17 (E23) | |
| Average of class Gaming (1386 - 2254, n=98, last 2 years) | |
| HP Omen 17-ck2097ng | |
| Average Intel Core i9-13900HX, NVIDIA GeForce RTX 4070 Laptop GPU (1700 - 1872, n=3) | |
| Medion Erazer Major X20 | |
| Schenker XMG Neo 17 M22 | |
| Medion Erazer Defender P40 | |
| CrossMark / Creativity | |
| Schenker XMG Focus 17 (E23) | |
| HP Omen 17-ck2097ng | |
| Average Intel Core i9-13900HX, NVIDIA GeForce RTX 4070 Laptop GPU (2088 - 2316, n=3) | |
| Average of class Gaming (1343 - 2729, n=98, last 2 years) | |
| Lenovo Legion Pro 5 16ARX8 | |
| Medion Erazer Major X20 | |
| Medion Erazer Defender P40 | |
| Schenker XMG Neo 17 M22 | |
| CrossMark / Responsiveness | |
| HP Omen 17-ck2097ng | |
| Lenovo Legion Pro 5 16ARX8 | |
| Schenker XMG Focus 17 (E23) | |
| Average of class Gaming (1226 - 2334, n=98, last 2 years) | |
| Average Intel Core i9-13900HX, NVIDIA GeForce RTX 4070 Laptop GPU (1557 - 1752, n=3) | |
| Medion Erazer Major X20 | |
| Medion Erazer Defender P40 | |
| Schenker XMG Neo 17 M22 | |
| PCMark 10 Score | 6956 points | |
Help | ||
| AIDA64 / Memory Copy | |
| HP Omen 17-ck2097ng | |
| Schenker XMG Focus 17 (E23) | |
| Average Intel Core i9-13900HX (67716 - 79193, n=22) | |
| Average of class Gaming (21750 - 129946, n=110, last 2 years) | |
| Medion Erazer Major X20 | |
| Medion Erazer Defender P40 | |
| Schenker XMG Neo 17 M22 | |
| Lenovo Legion Pro 5 16ARX8 | |
| AIDA64 / Memory Read | |
| HP Omen 17-ck2097ng | |
| Schenker XMG Focus 17 (E23) | |
| Average Intel Core i9-13900HX (73998 - 88462, n=22) | |
| Medion Erazer Major X20 | |
| Average of class Gaming (22956 - 118858, n=110, last 2 years) | |
| Medion Erazer Defender P40 | |
| Schenker XMG Neo 17 M22 | |
| Lenovo Legion Pro 5 16ARX8 | |
| AIDA64 / Memory Write | |
| HP Omen 17-ck2097ng | |
| Average of class Gaming (22297 - 135096, n=110, last 2 years) | |
| Schenker XMG Focus 17 (E23) | |
| Average Intel Core i9-13900HX (65472 - 77045, n=22) | |
| Medion Erazer Major X20 | |
| Medion Erazer Defender P40 | |
| Schenker XMG Neo 17 M22 | |
| Lenovo Legion Pro 5 16ARX8 | |
| AIDA64 / Memory Latency | |
| Average of class Gaming (75.3 - 259, n=110, last 2 years) | |
| Medion Erazer Defender P40 | |
| Schenker XMG Focus 17 (E23) | |
| Schenker XMG Neo 17 M22 | |
| Medion Erazer Major X20 | |
| Lenovo Legion Pro 5 16ARX8 | |
| Average Intel Core i9-13900HX (75.3 - 91.1, n=22) | |
| HP Omen 17-ck2097ng | |
* ... smaller is better
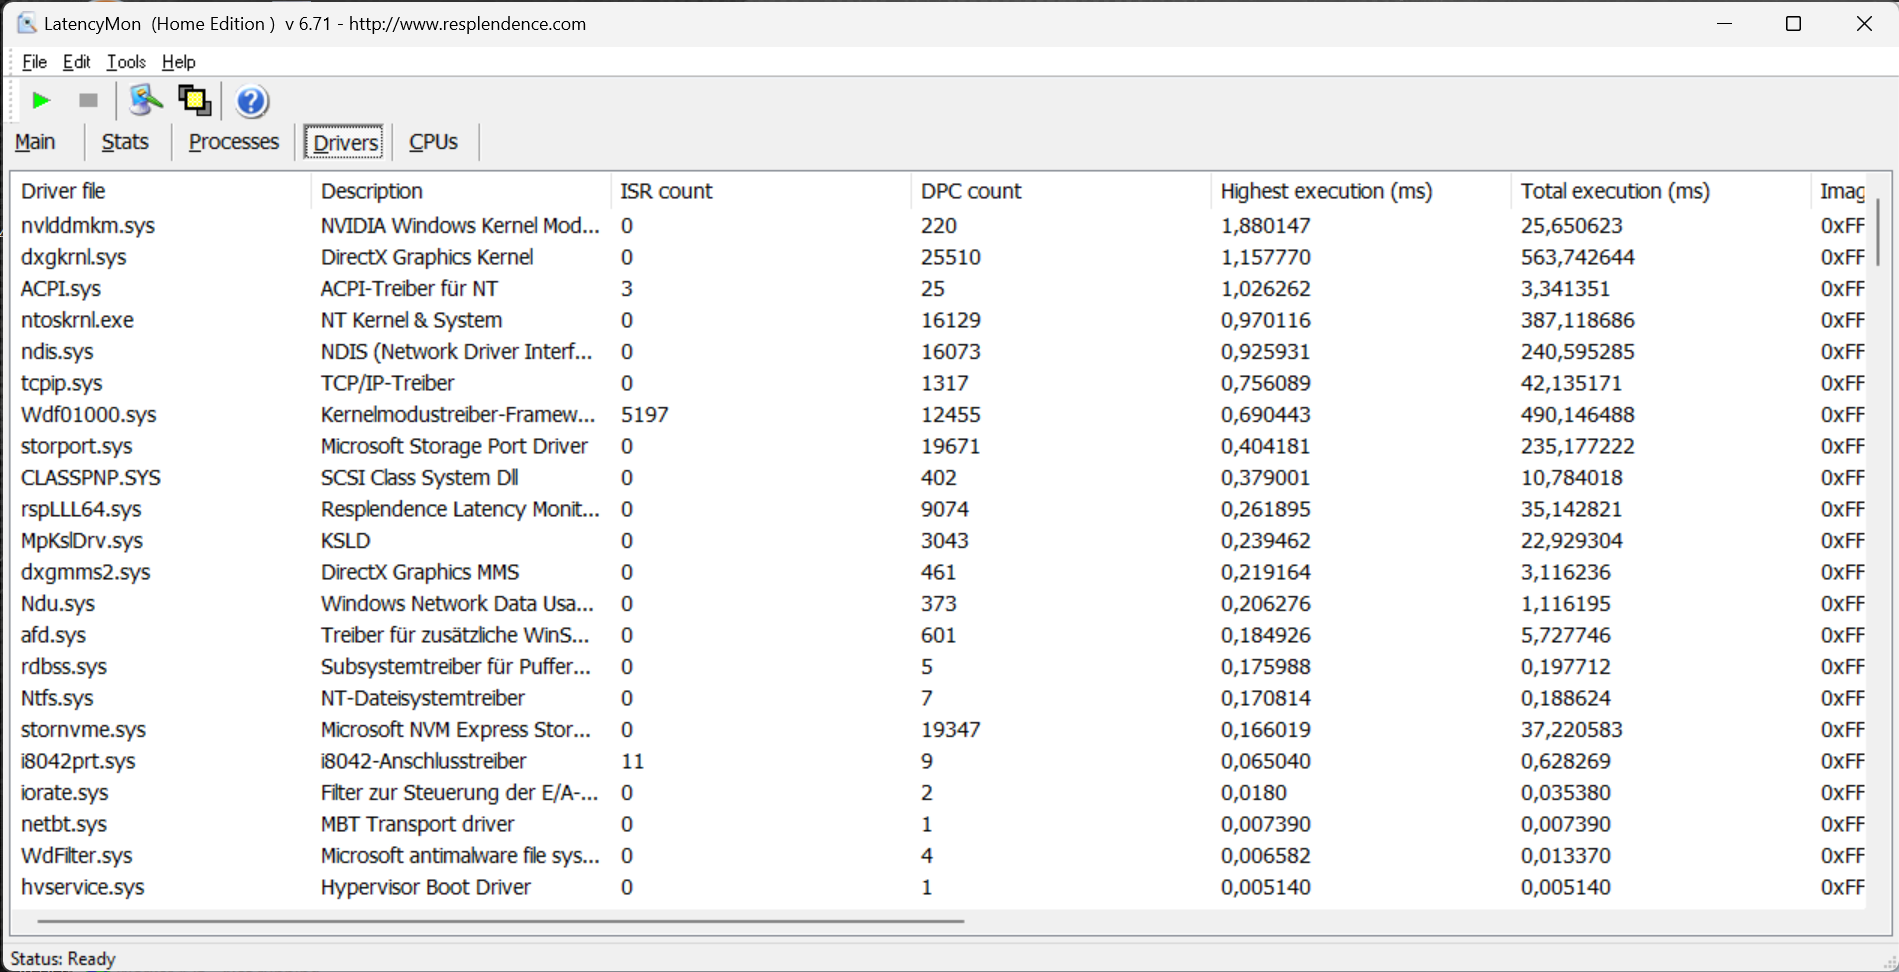
DPC latencies
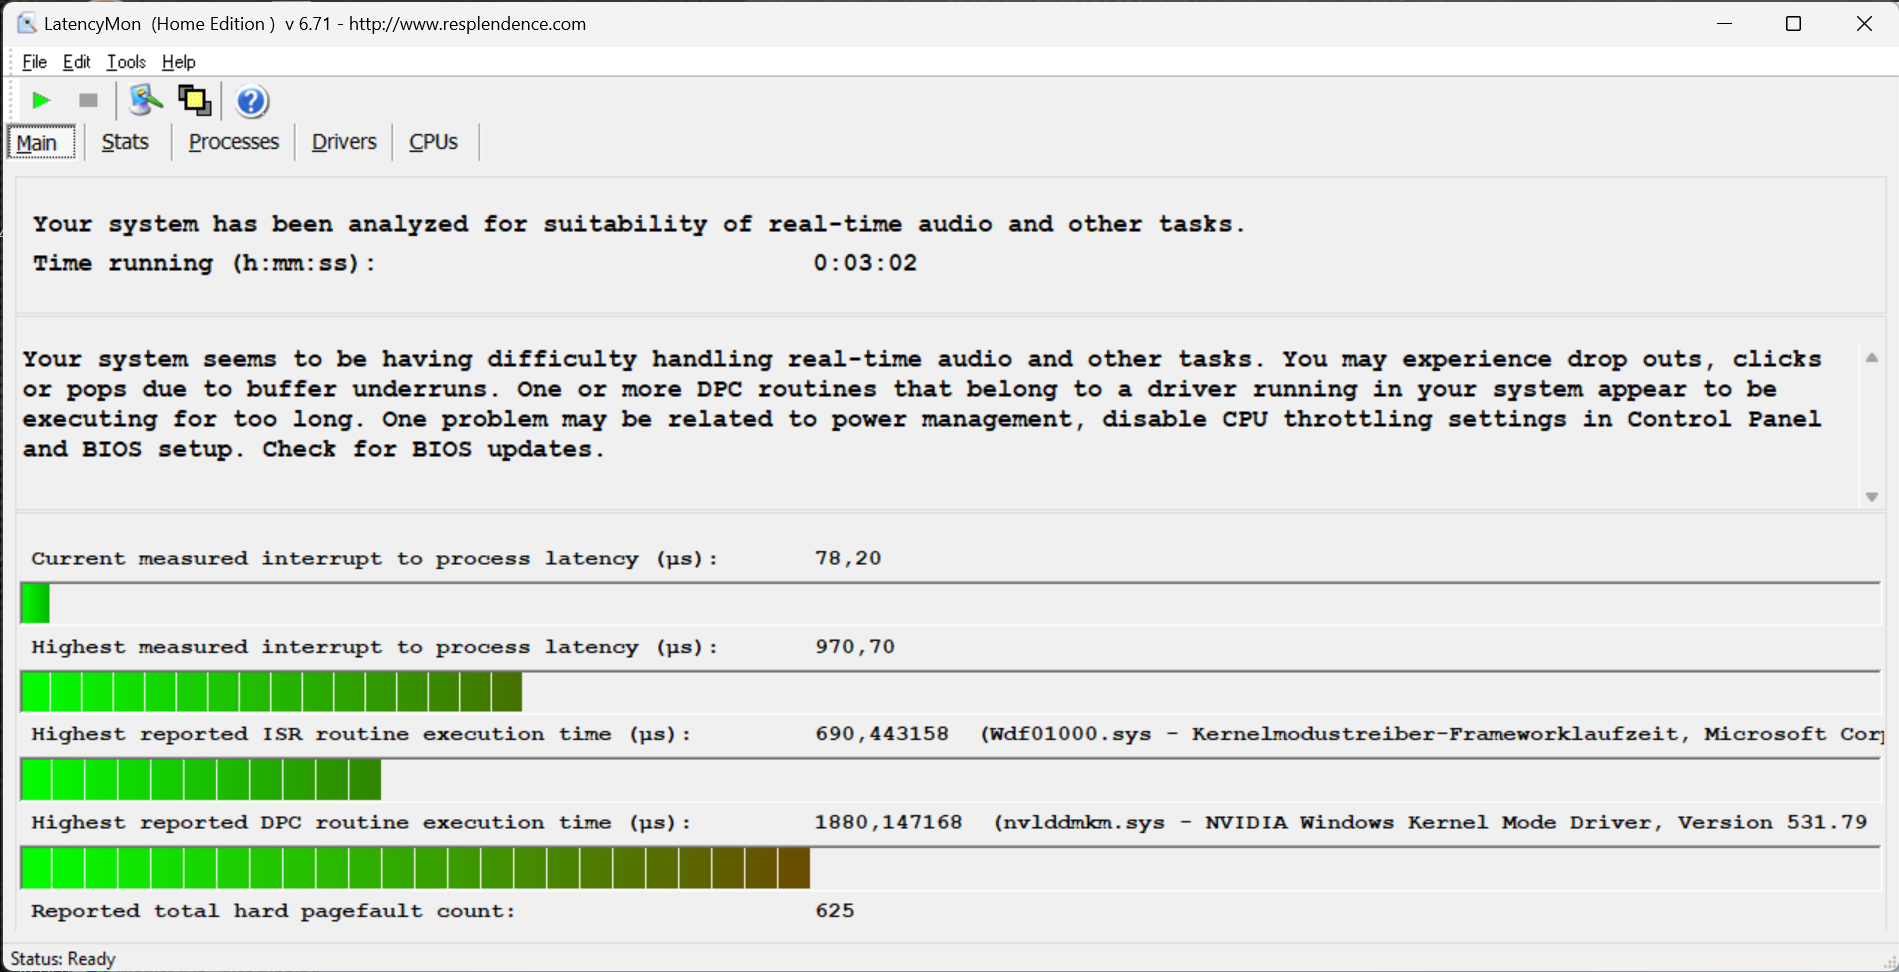
Other gaming notebooks with the same CPU perform much worse than the XMG Focus 17. It does not achieve an optimal result but should work satisfactorily in most tasks where a smooth process is needed. It can do even better, but it should only be of secondary importance for most users.
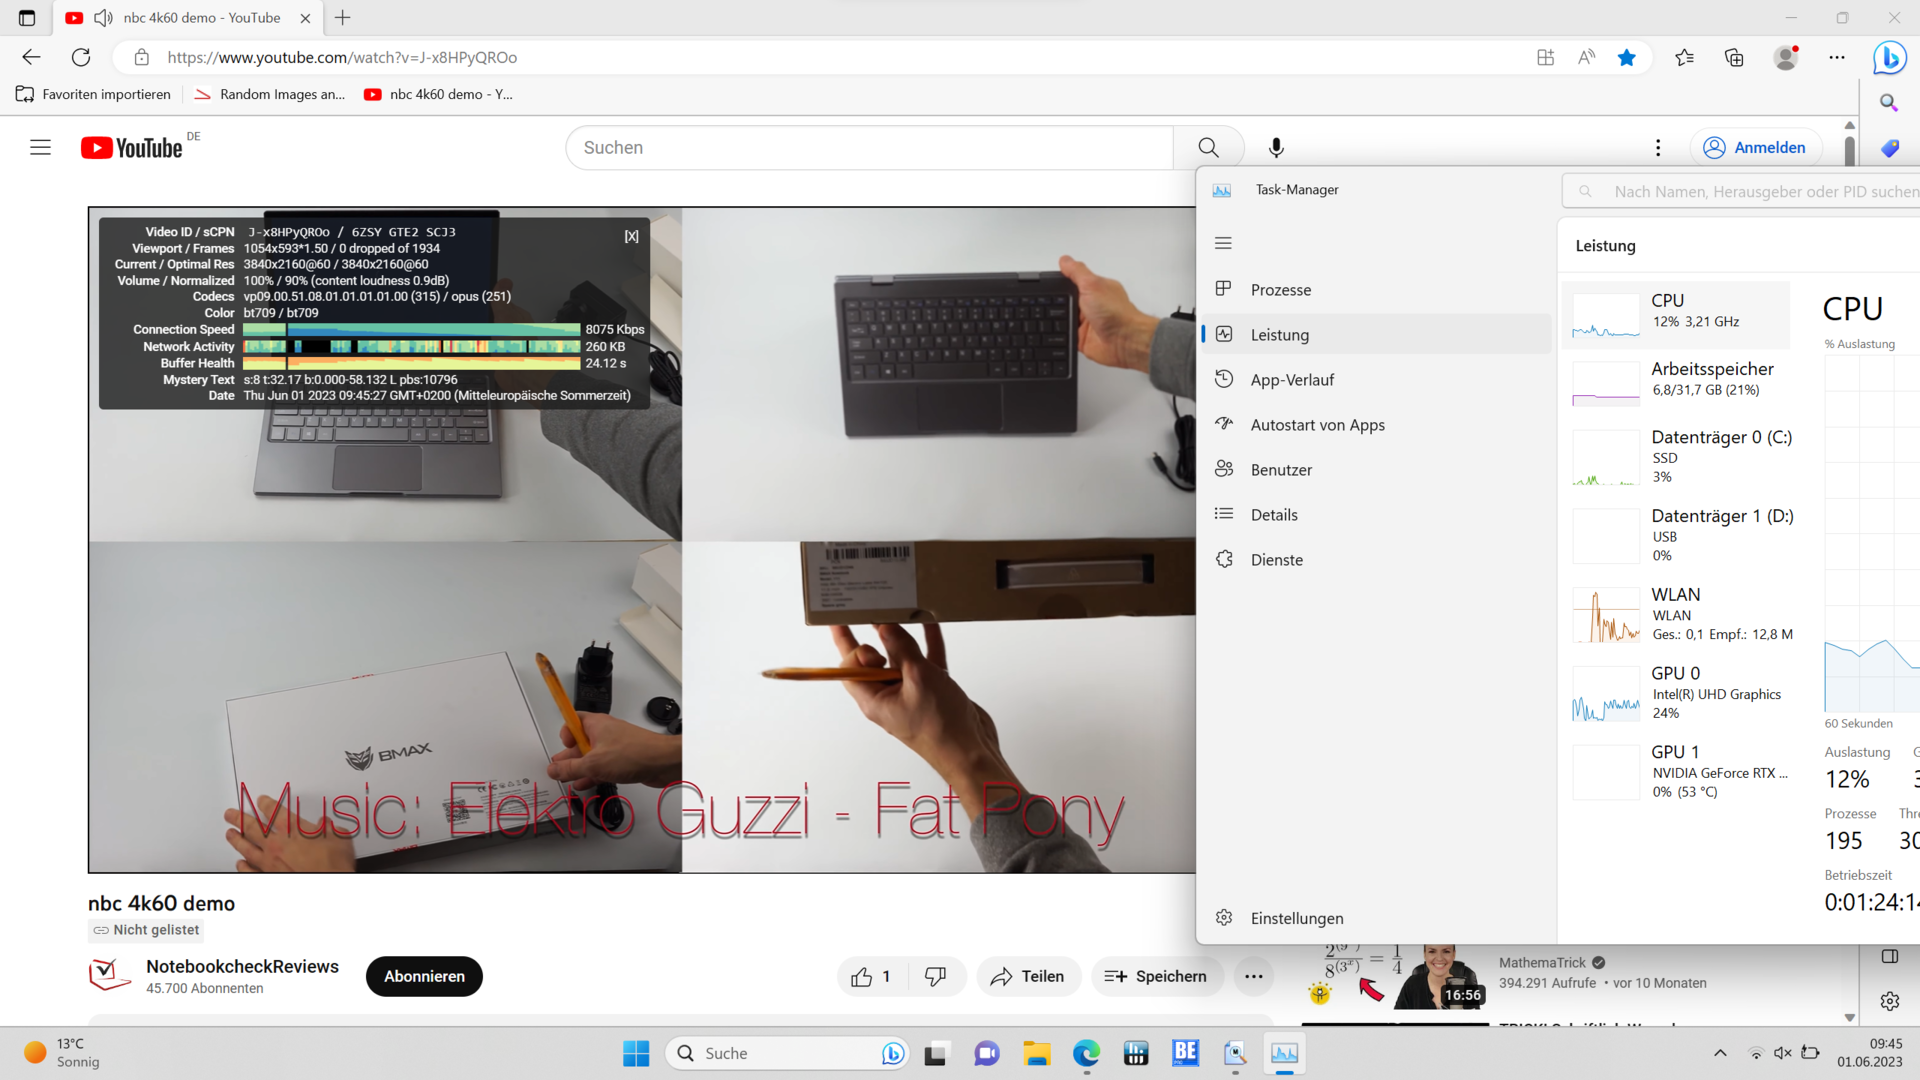
The biggest difficulties are caused by the graphics card driver from Nvidia, which will hopefully be improved via an update in the future. Also praiseworthy and by no means the norm is the smooth video playback in 4K without dropped frames. Thus, the present build and the driver equipment seem to harmonize.
| DPC Latencies / LatencyMon - interrupt to process latency (max), Web, Youtube, Prime95 | |
| Schenker XMG Neo 17 M22 | |
| Medion Erazer Defender P40 | |
| HP Omen 17-ck2097ng | |
| Medion Erazer Major X20 | |
| Schenker XMG Focus 17 (E23) | |
| Lenovo Legion Pro 5 16ARX8 | |
* ... smaller is better
Mass storage
The installed M.2 SSD Crucial P5 Plus is not a premium model. However, it achieves good transfer rates via PCIe 4.0 and remains very stable in the long-term test, which is due to the additional cooling in the gaming laptop's base plate.
Thus, no obstructions or delays during loading, program execution, etc. are to be expected from the mass storage.

* ... smaller is better
Continuous reading: DiskSpd Read Loop, Queue Depth 8
Graphics card
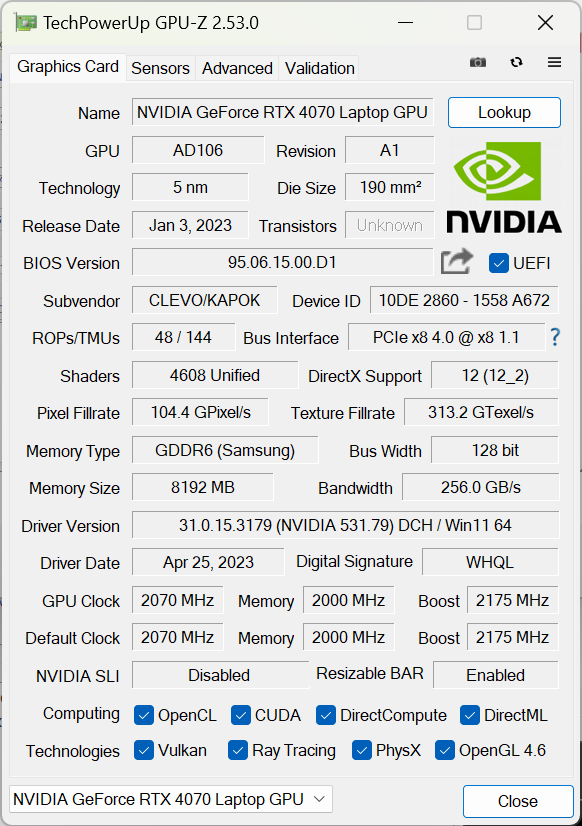
Only a few GPUs are faster than the Nvidia GeForce RTX 4070, which can rightfully classify itself in the upper mid-range. It offers 4,608 shaders, 144 tensor cores for Nvidia DLSS, and 36 ray tracing cores. That is enough for demanding tasks and complex games at the highest detail level. Only the VRAM is a bit tight with 8 GB. However, this should only cause problems when a 4K monitor is connected. In individual random tests in the screen's native QHD resolution, more than 7 GB were never occupied in current games.
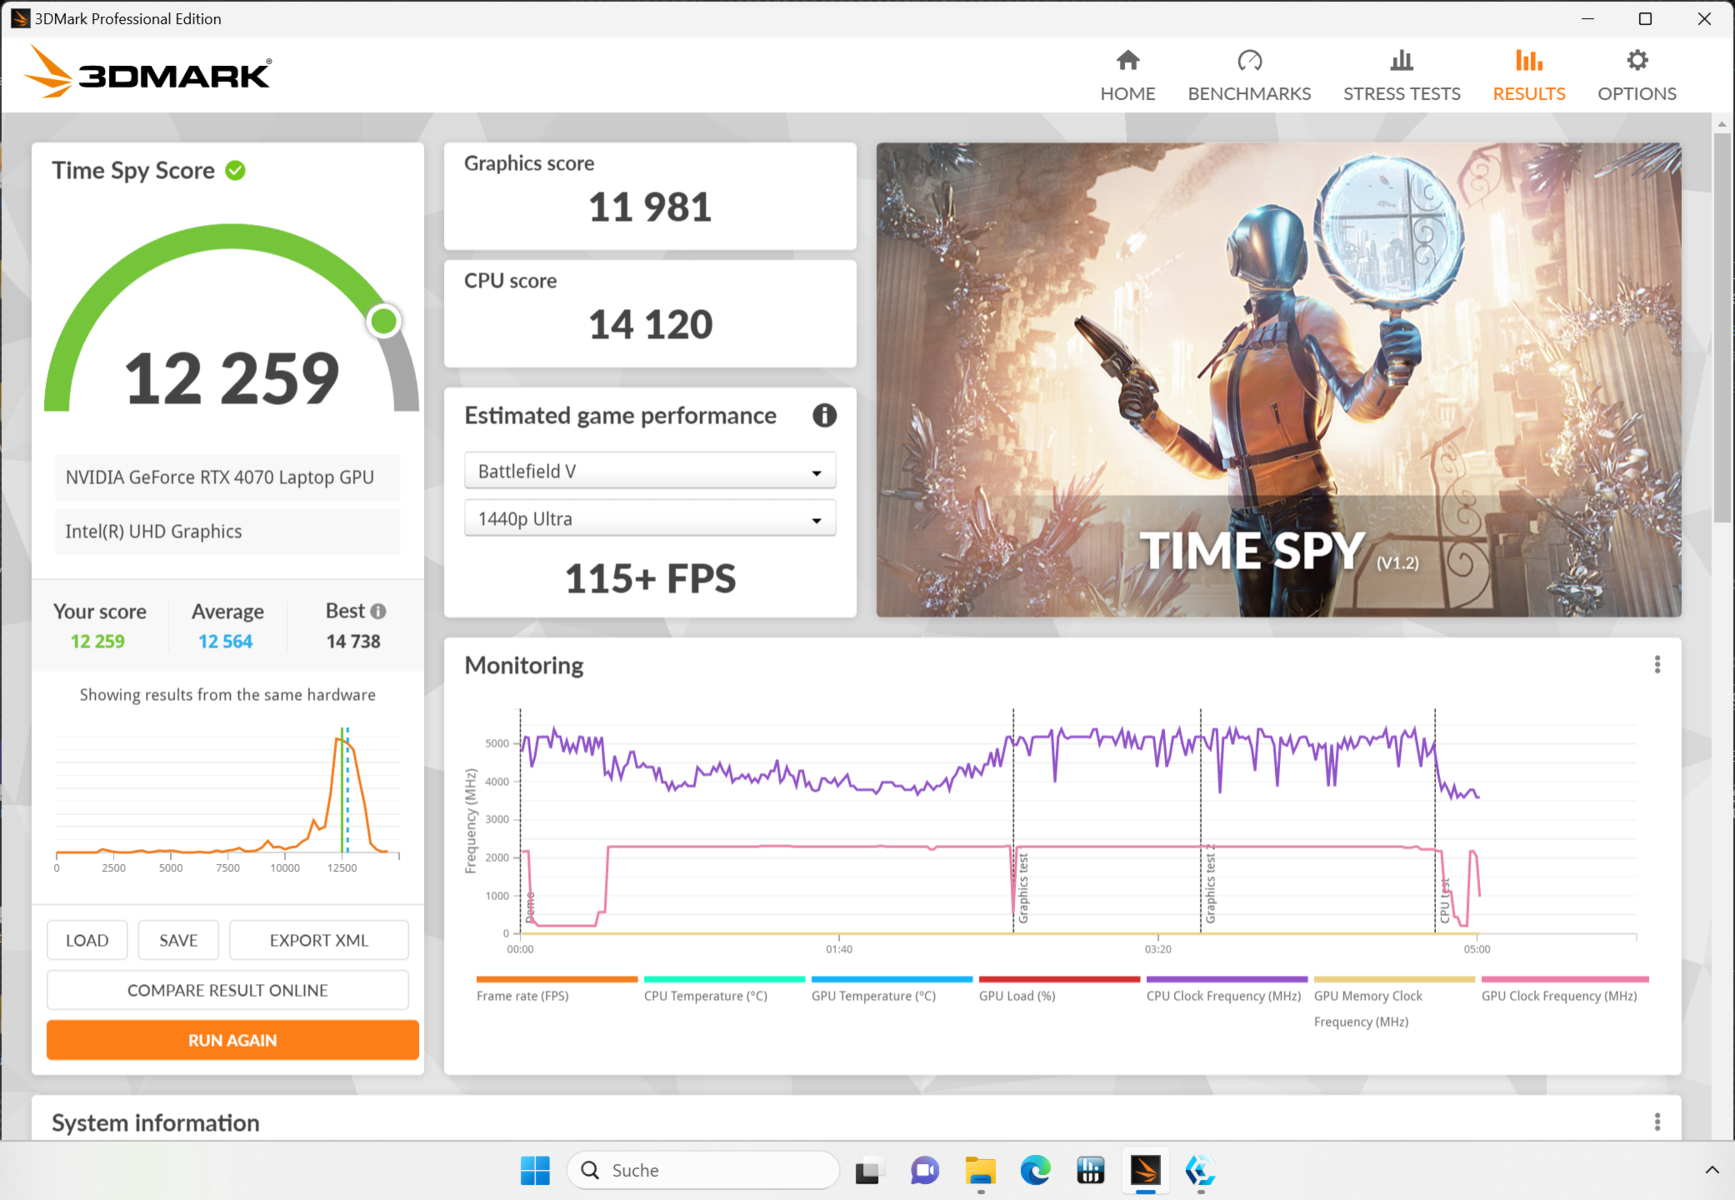
In the Focus 17 E23, the graphics chip is allowed to consume a maximum of 140 W, with 25 W being diverted from the processor as a dynamic boost. This corresponds to the typical settings of the RTX 4070 in a gaming laptop. However, the synthetic benchmarks we performed fall a bit short of expectations because the high power consumption cannot be maintained over time.
In the 3DMark scores as well as in games, the Focus 17 always lags behind an almost identically equipped Medion Erazer Major X20 or the Lenovo Legion Pro 5 with a different CPU. Apparently, the large i9-13900HX with corresponding cooling requirements also hinders rather than helps in graphics applications. Besides the Legion Pro, the Asus ROG Strix G18 with the RTX 4070 but the smaller i7-13650HX can be mentioned as an example, which achieves approximately the same performance rates.
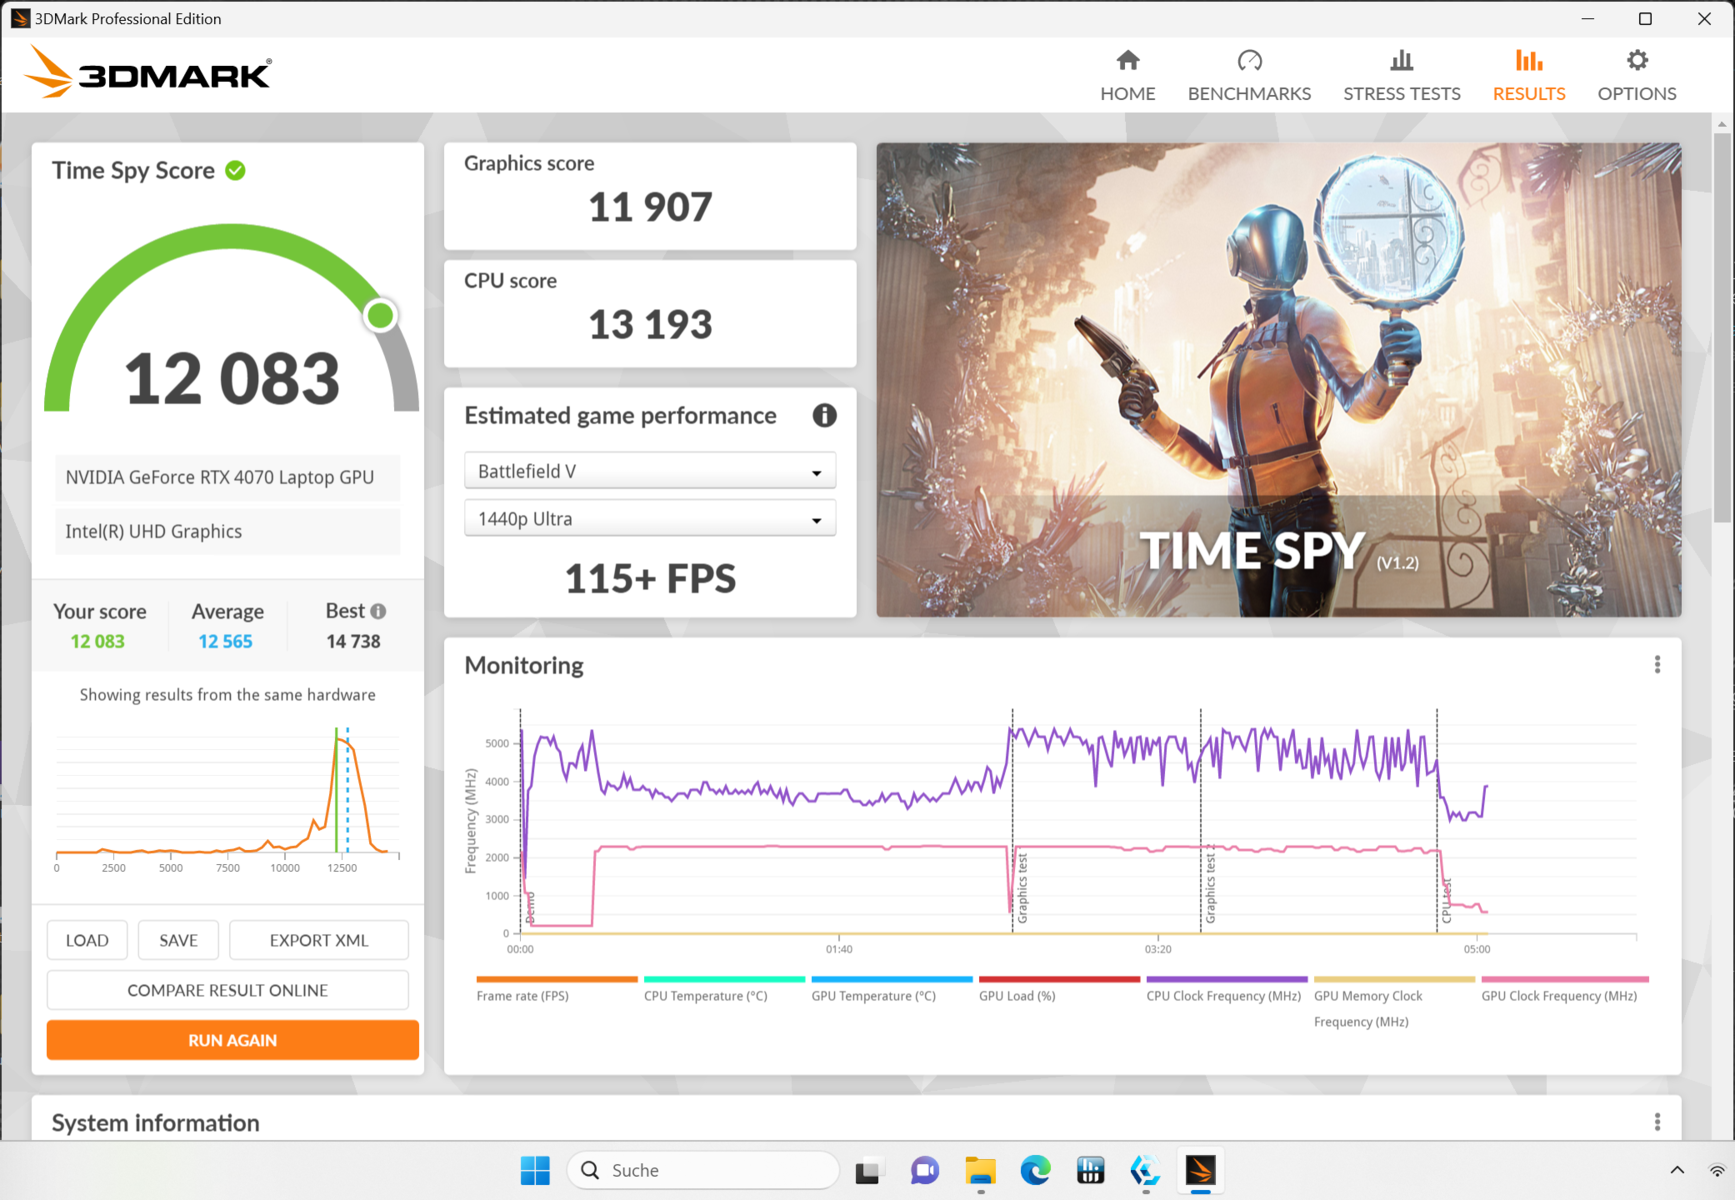
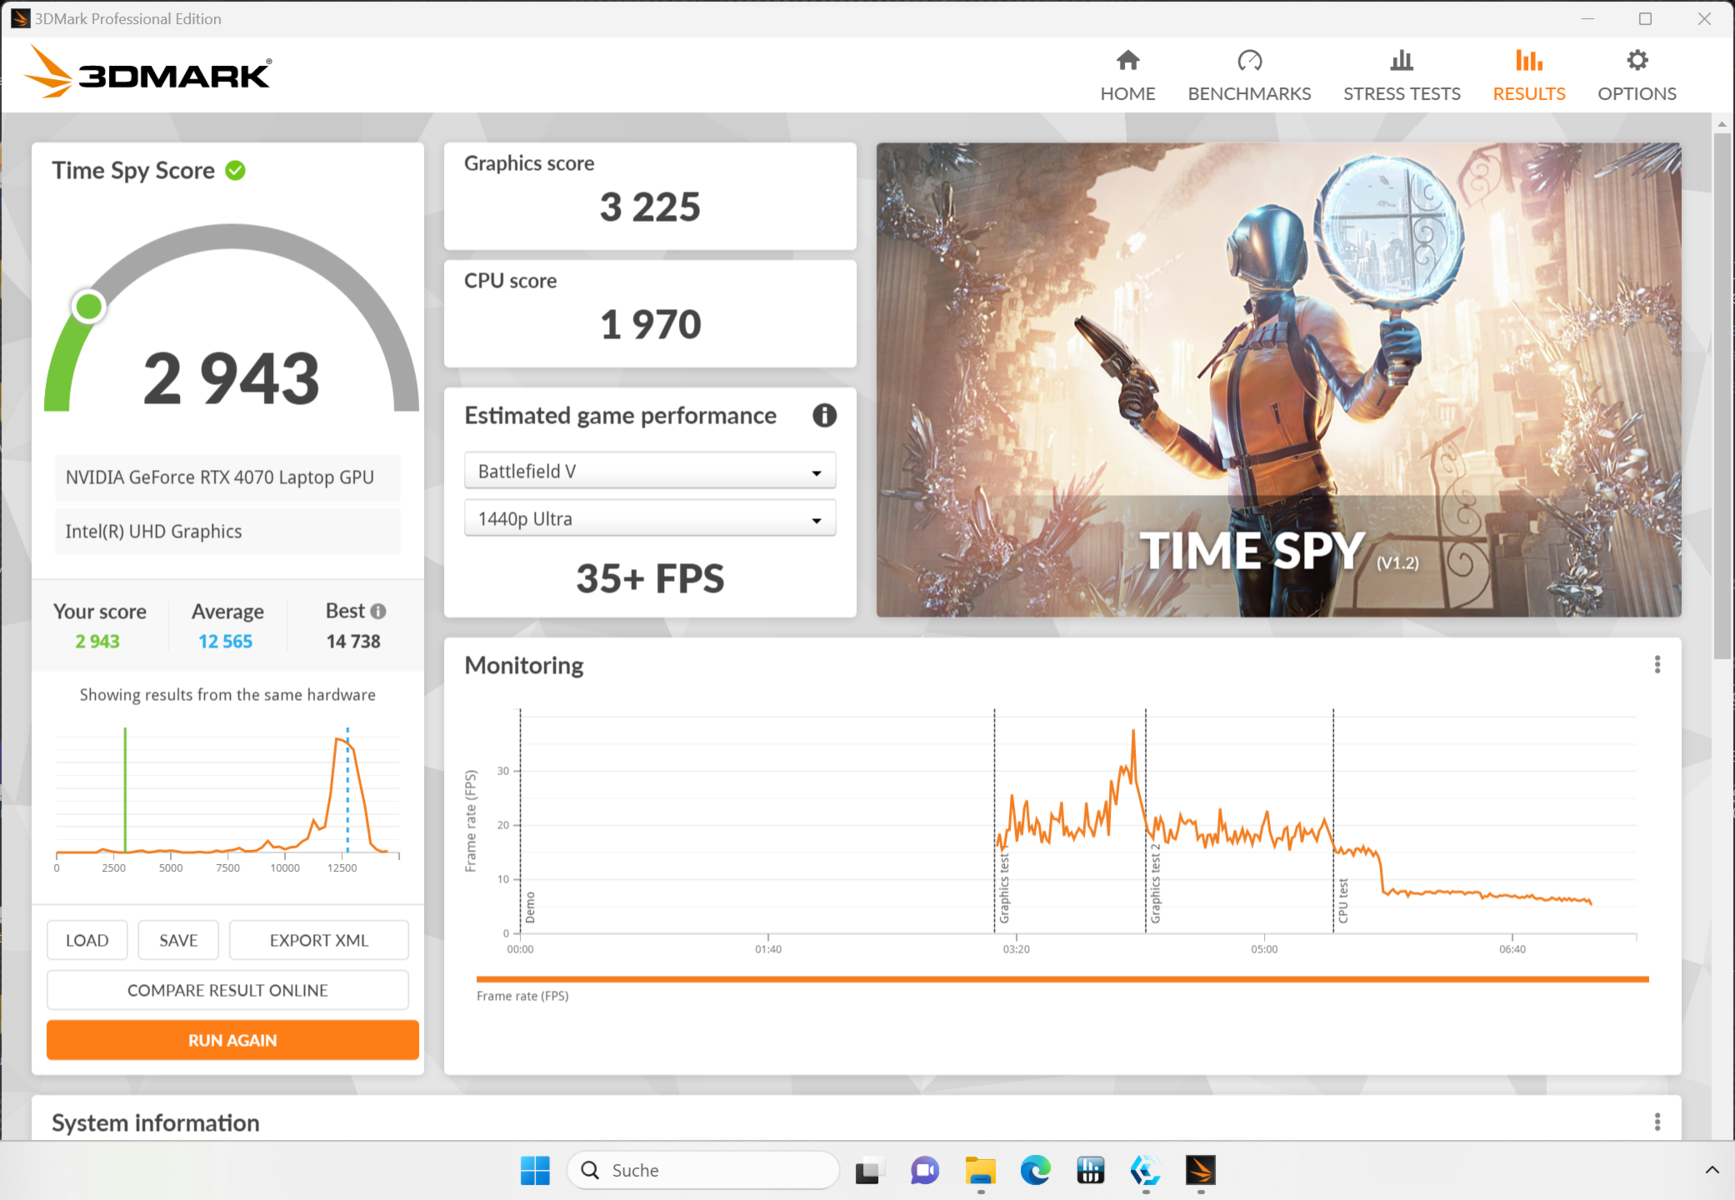
Furthermore, the performance modes do not seem mature yet. Comparing the results in the Time Spy benchmark, the performance and entertainment modes are almost on par. Even in individual games we tested, the gap in the measured FPS was only minimal. The silent mode, which at least works very quietly, on the other hand, drops too significantly. The achieved 2,943 points are also achieved by the AMD Radeon 780M, an integrated graphics chip.
More benchmarks and performance data can be found in our GPU benchmark list.
| 3DMark 11 Performance | 33424 points | |
| 3DMark Cloud Gate Standard Score | 58621 points | |
| 3DMark Fire Strike Score | 25541 points | |
| 3DMark Time Spy Score | 12339 points | |
Help | ||
* ... smaller is better
Gaming performance
All games we tested achieve at least satisfactory frame rates. The rates are only below 60 fps in current and quite demanding games at the highest detail level and QHD resolution. Thus, the hardware should be sufficient for future games for quite a while. Most games are playable with 100 fps or more when you forgo a few details and use the Full HD resolution.
The XMG Focus 17 ranks between our selected rivals with identical GPUs in the games for which comparison rates are available. It is also roughly on par with an MSI Titan GT77 with an RTX 3080 Ti, which was about twice as expensive when it was released last year. The gaming notebooks with the predecessor GPU RTX 3070 can be outperformed by more than 10% depending on the model.
Since the CPU is less stressed in games than in many other benchmarks, the somewhat weak cooling does not matter that much. Only the GPU has to dissipate a lot of heat, while the processor's performance can be throttled without significant frame rate losses. Thus, the XMG notebook does not show any weakness in gaming, even though a few percentage points more under full load seem realistic.
Among other things, the maximum possible 140 W that the GPU is allowed to consume is almost never reached. We were able to provoke a single measurement peak of 143 W in a special scenario of our stress test. Otherwise, the average power consumption in games is 100 W, which is once again well below the 115 W that the graphics chip should consume even without a dynamic boost.
Everything indicates that the cooling system does not manage to dissipate the waste heat fast enough. Schenker XMG has often shown that a notebook fan can also handle the maximum power consumption of the graphics chip on a permanent basis - see for example the XMG Neo 16 E23.
| Star Wars Jedi Survivor | |
| 1920x1080 Epic Preset | |
| Lenovo Legion Pro 5 16ARX8 | |
| Schenker XMG Focus 17 (E23) | |
| Average NVIDIA GeForce RTX 4070 Laptop GPU (61.5 - 80.1, n=8) | |
| Medion Erazer Defender P40 | |
| 2560x1440 Epic Preset | |
| Lenovo Legion Pro 5 16ARX8 | |
| Average NVIDIA GeForce RTX 4070 Laptop GPU (39.5 - 51.1, n=8) | |
| Schenker XMG Focus 17 (E23) | |
| Medion Erazer Defender P40 | |
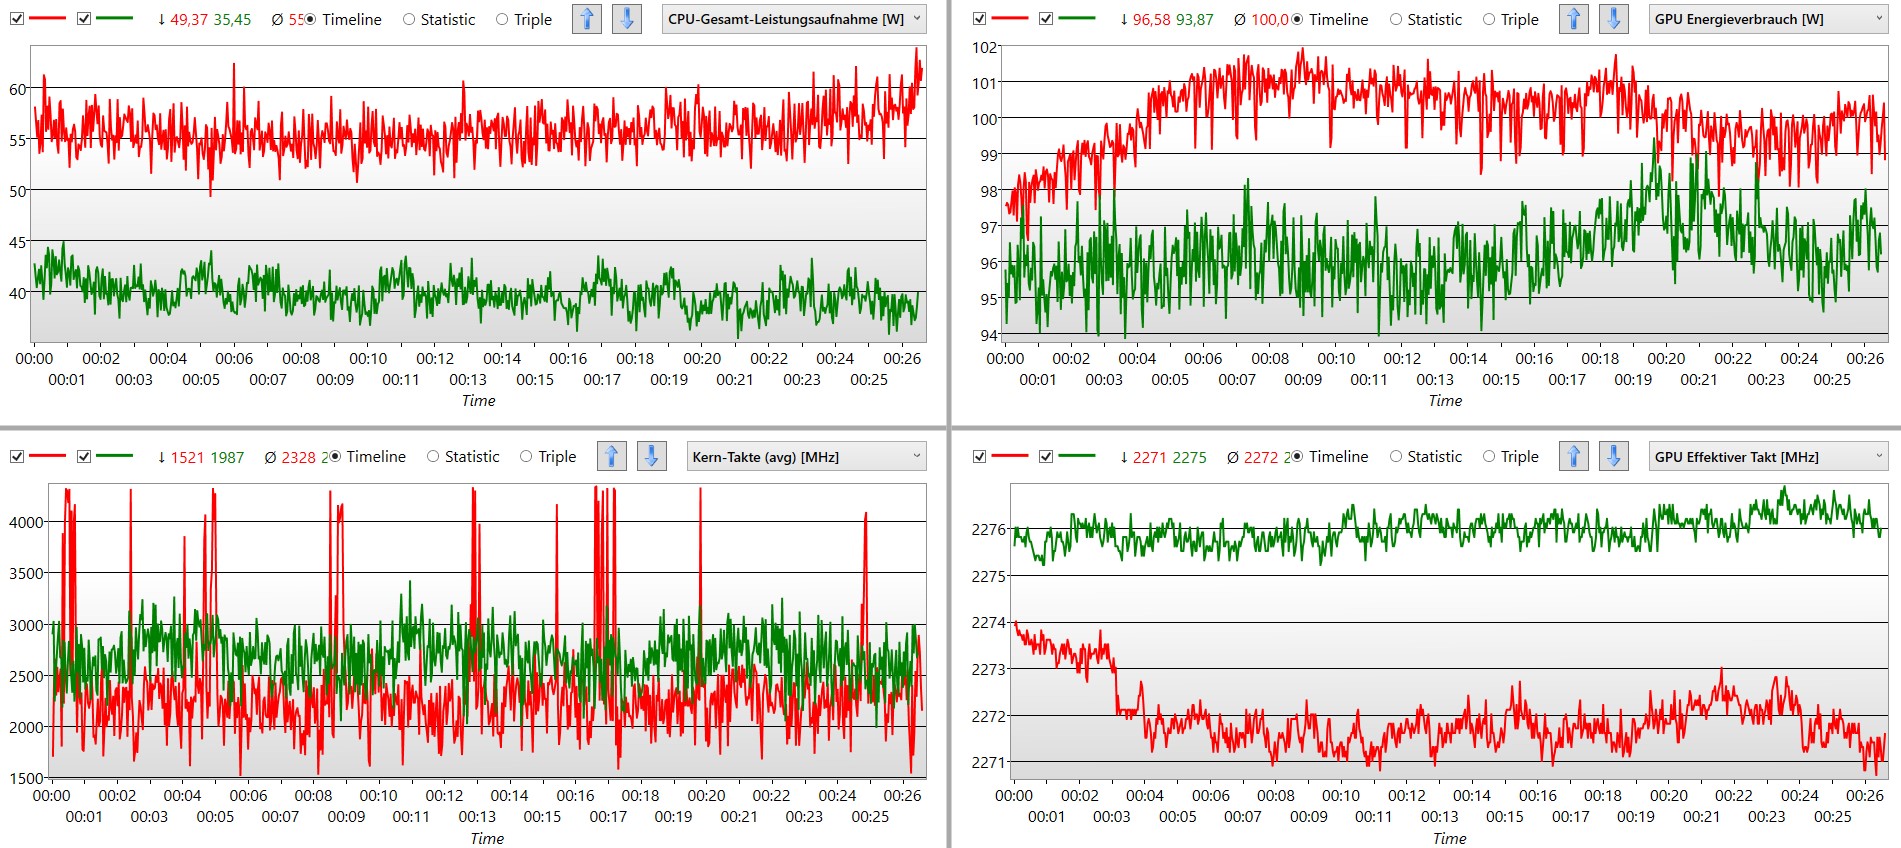
The endurance test with Witcher 3 does not hold any surprises. That is to be understood as completely positive. Performance drops or constant throttling cannot be observed. The typical fluctuations can be explained by the changing time of day in the game. Accordingly, no decreasing frame rates should be observed in other games over time.
In the endurance test of the game, we could once again check how the entertainment and performance modes behave. In entertainment mode, the system requires almost 20 W less, while the GPU has a higher clock rate than in performance mode. The CPU's behavior seems more regular and usually the clock rate (green) is also slightly higher compared to performance mode. With less power consumption and a slightly lower noise development, we also measure the identical frame rate.
Witcher 3 FPS chart
| low | med. | high | ultra | QHD | |
|---|---|---|---|---|---|
| GTA V (2015) | 180.8 | 117.4 | 88.5 | ||
| The Witcher 3 (2015) | 226 | 115 | |||
| Dota 2 Reborn (2015) | 177.3 | 164.5 | |||
| Final Fantasy XV Benchmark (2018) | 114.8 | 81.3 | |||
| X-Plane 11.11 (2018) | 123 | ||||
| Far Cry 5 (2018) | 145 | 136 | 112 | ||
| Strange Brigade (2018) | 247 | 211 | 135.2 | ||
| Cyberpunk 2077 1.6 (2022) | 100.7 | 102.3 | 63.9 | ||
| F1 22 (2022) | 211 | 77.8 | 49 | ||
| Hogwarts Legacy (2023) | 86 | 71 | 50 | ||
| Star Wars Jedi Survivor (2023) | 79 | 73 | 45 |
Emissions - Focus 17 can be quiet
Noise emissions
The Focus 17 is one of the louder representatives of its guild. It is clearly audible with about 58 dB, even through a closed door. However, the Medion Erazer Defender P40 demonstrates that it can get even louder. Despite the smaller graphics chip, it clearly reaches over 60 dB.
The fan's revving up during normal use of the laptop away from the permanent load is conspicuous. The cooling starts up for no apparent reason. A few seconds later, the speed is reduced again. On the other hand, the speed remains constant during gaming, so a permanent noise is audible, but without annoying speed changes.
We measured a few decibels less at Witcher 3 in entertainment mode, which is quite perceptible. By the way, the fps remain constant. In "silent mode", 15 dB less are measurable, which feels like a third of the original volume. The notebook is audible then, but hardly disturbing even in a quiet environment. We still measure just under half the frame rate at Witcher 3. The game is still playable at 60 fps on the highest detail settings, which is probably true for many not-too-demanding or slightly older titles that are then also playable as quiet as a whisper.
Noise level
| Idle |
| 24 / 24 / 26.47 dB(A) |
| Load |
| 55.72 / 57.94 dB(A) |
 | ||
30 dB silent 40 dB(A) audible 50 dB(A) loud |
||
min: | ||
| Schenker XMG Focus 17 (E23) GeForce RTX 4070 Laptop GPU, i9-13900HX, Crucial P5 Plus 1TB CT1000P5PSSD8 | Lenovo Legion Pro 5 16ARX8 GeForce RTX 4070 Laptop GPU, R7 7745HX, Samsung PM9A1 MZVL21T0HCLR | Medion Erazer Major X20 GeForce RTX 4070 Laptop GPU, i9-13900HX, Phison E18-1TB-PHISON-SSD-B47R | Schenker XMG Neo 17 M22 GeForce RTX 3080 Ti Laptop GPU, R9 6900HX, Samsung SSD 980 Pro 1TB MZ-V8P1T0BW | HP Omen 17-ck2097ng GeForce RTX 4080 Laptop GPU, i9-13900HX, SK hynix PC801 HFS001TEJ9X101N | Medion Erazer Defender P40 GeForce RTX 4060 Laptop GPU, i7-13700HX, Phison PS5021-E21 1TB | |
|---|---|---|---|---|---|---|
| Noise | 11% | -3% | -8% | -5% | -7% | |
| off / environment * (dB) | 24 | 23.2 3% | 24 -0% | 26 -8% | 24 -0% | 25 -4% |
| Idle Minimum * (dB) | 24 | 23.2 3% | 25 -4% | 26 -8% | 31 -29% | 26 -8% |
| Idle Average * (dB) | 24 | 23.2 3% | 29 -21% | 29 -21% | 32 -33% | 27 -13% |
| Idle Maximum * (dB) | 26.47 | 26.2 1% | 31 -17% | 40 -51% | 33 -25% | 32 -21% |
| Load Average * (dB) | 55.72 | 31.4 44% | 50 10% | 47 16% | 45 19% | 53 5% |
| Witcher 3 ultra * (dB) | 57.94 | 48.4 16% | 53 9% | 52 10% | 45 22% | 56 3% |
| Load Maximum * (dB) | 57.94 | 53.8 7% | 57 2% | 54 7% | 50 14% | 64 -10% |
* ... smaller is better
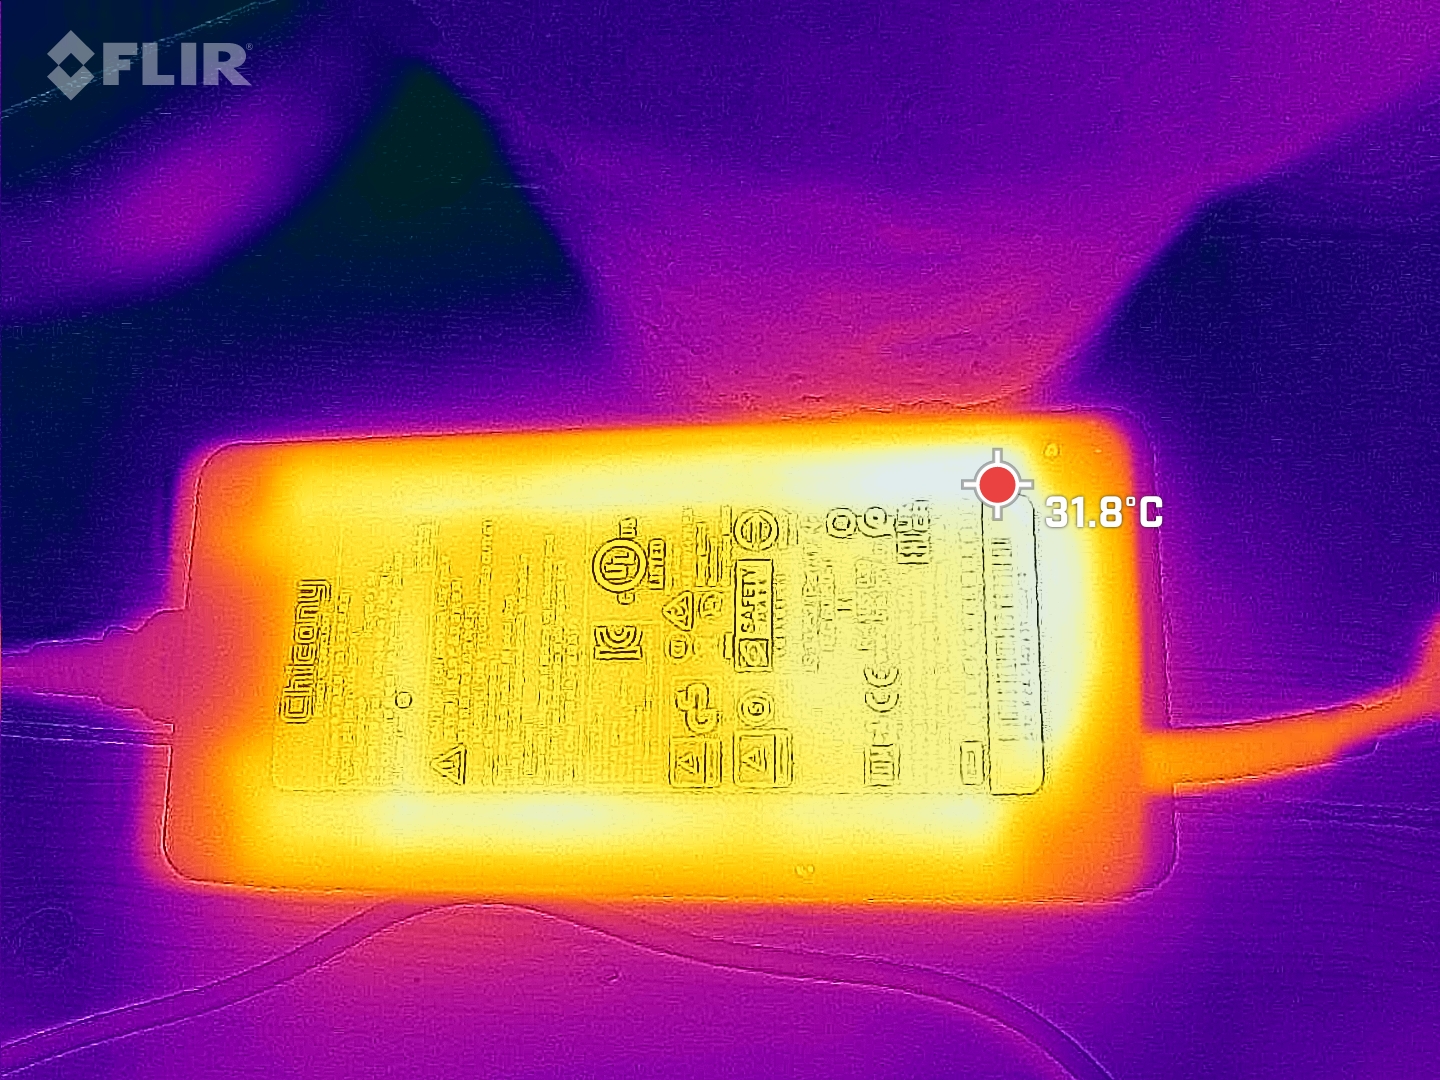
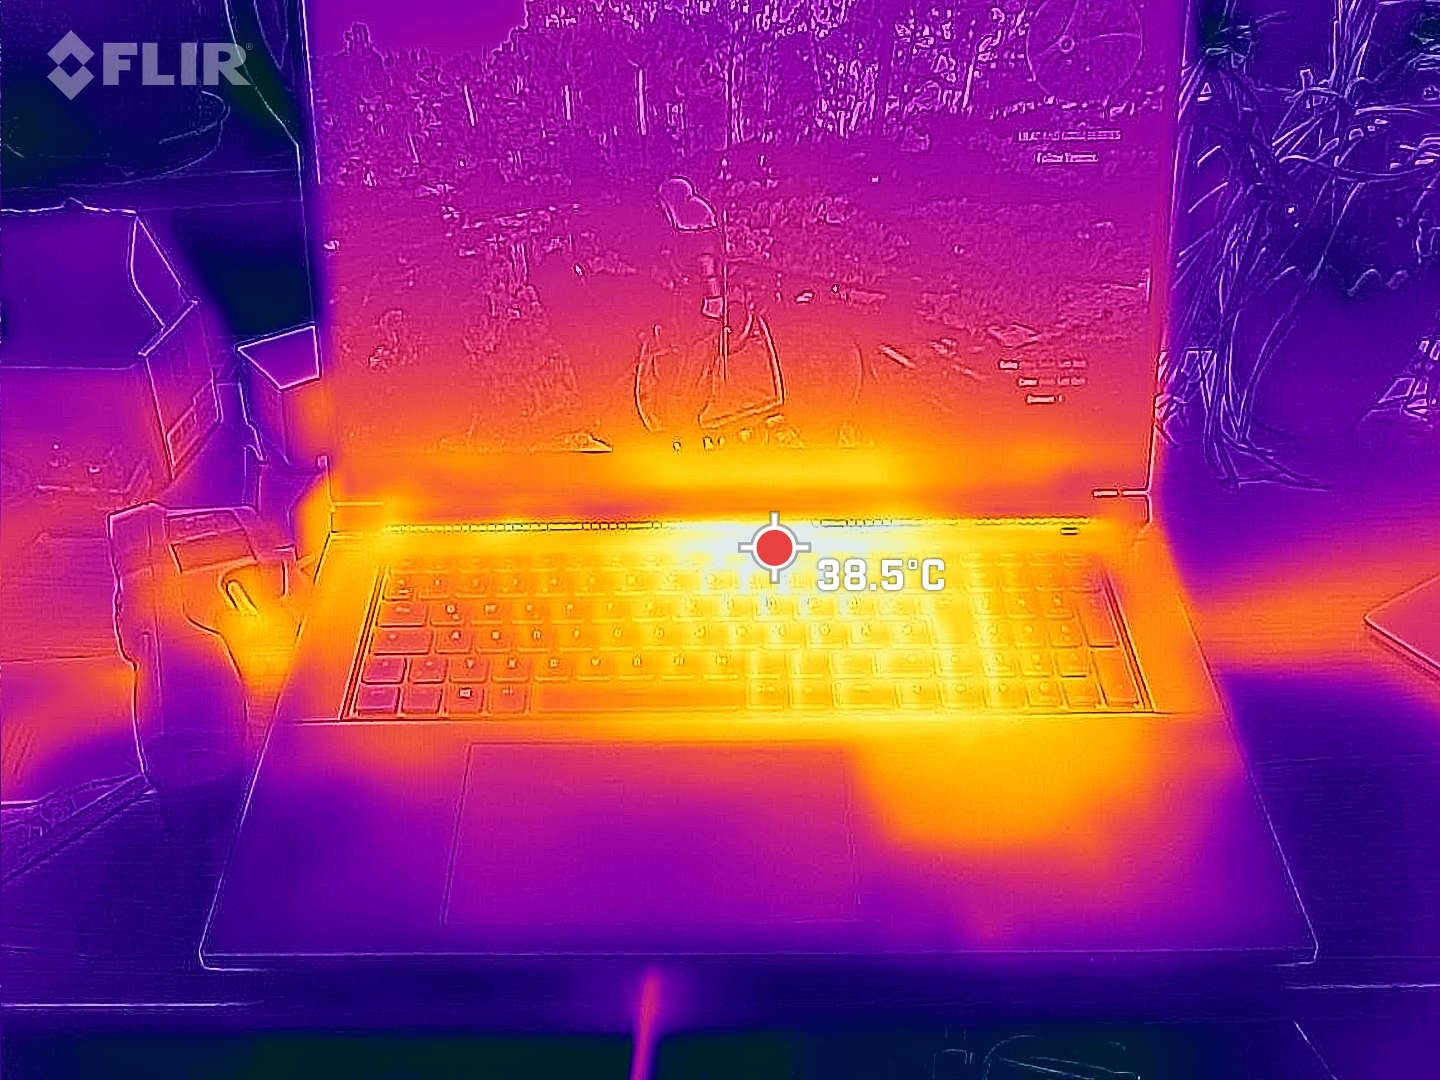
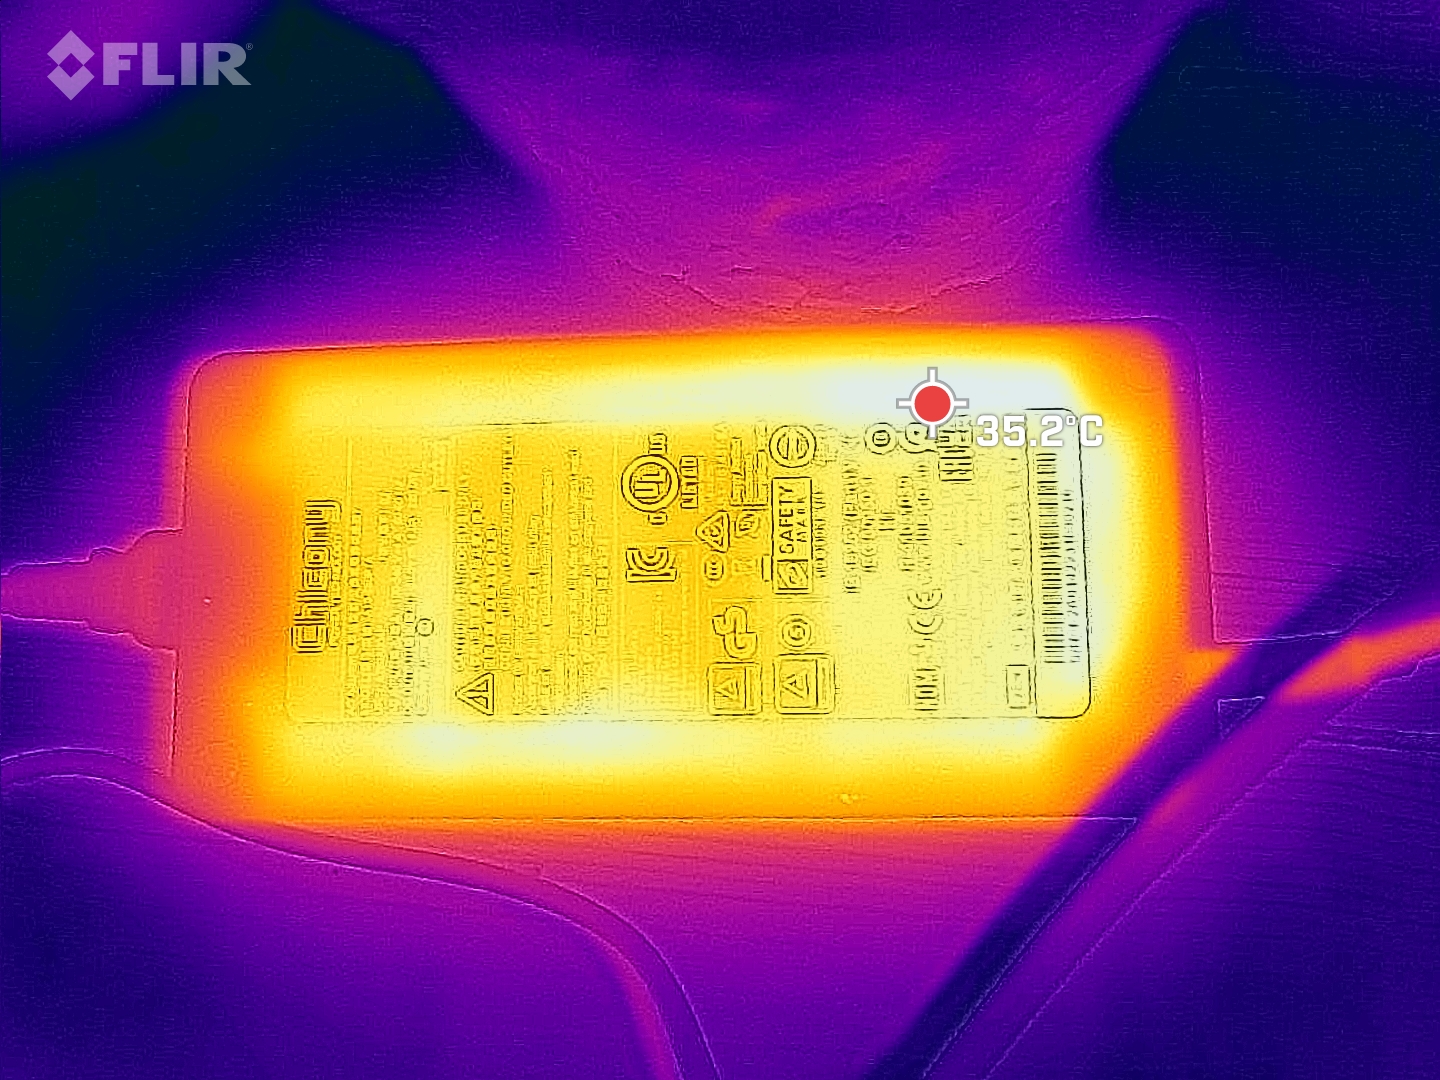
Temperature
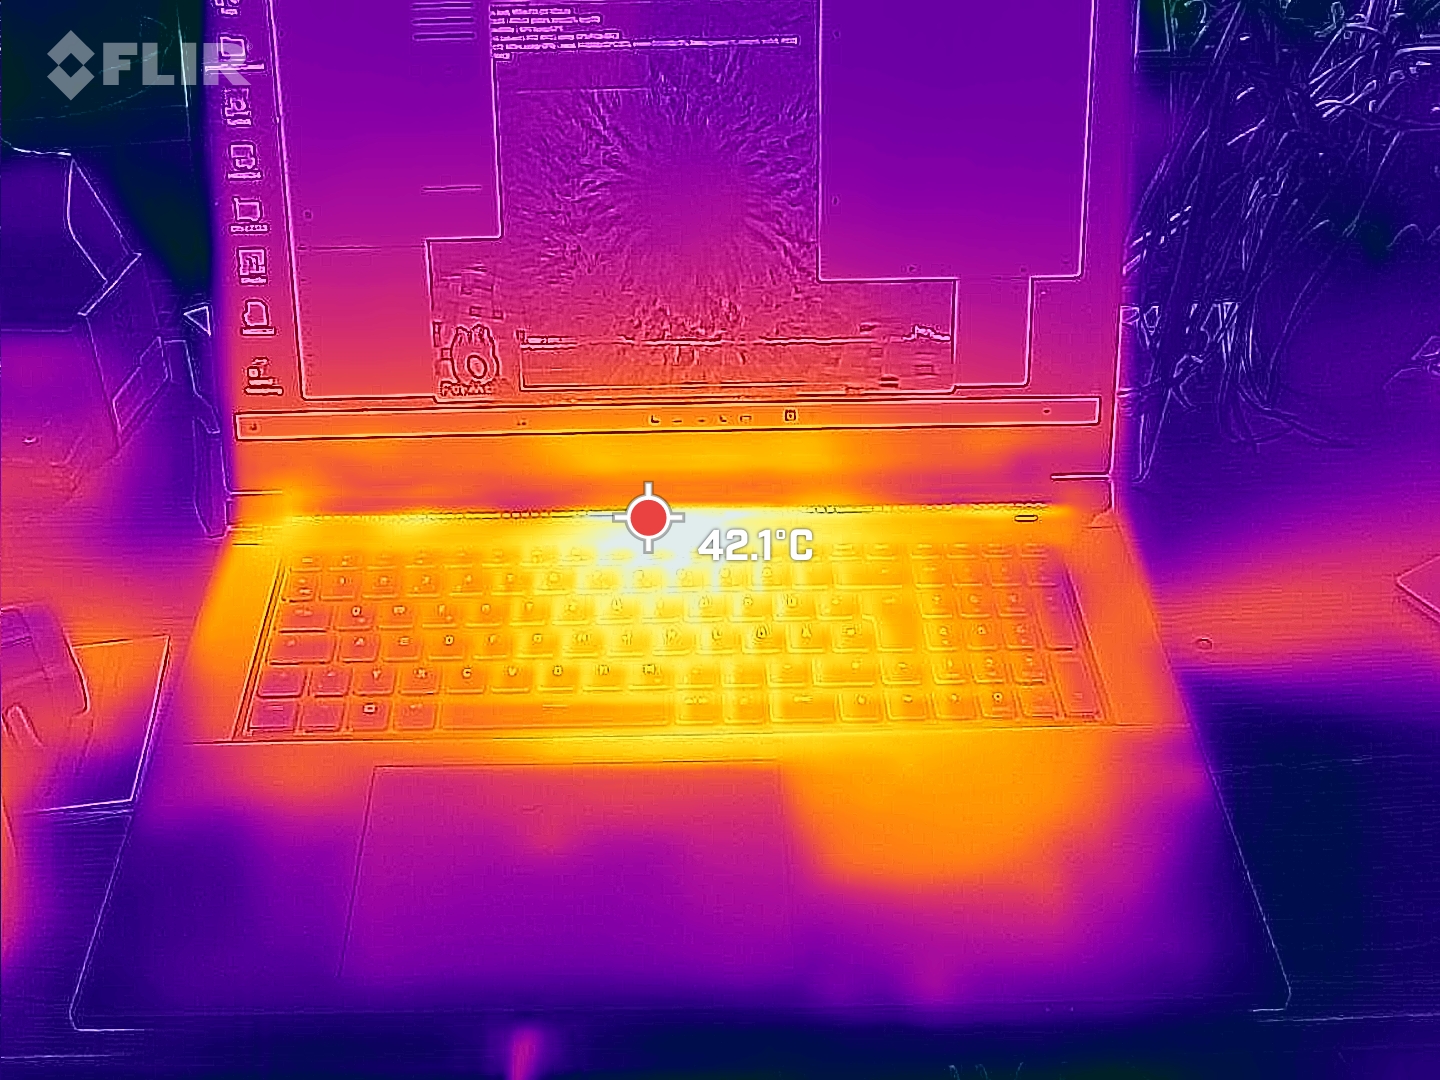
The palm rests are warm, but by no means hot (we measured a maximum of 36 °C). However, the temperature is already 42 °C in the key area, and it is still 40 °C on the right of the center. On the left, the gaming laptop stays a bit cooler. This can be annoying, especially on warm days when typing and gaming.
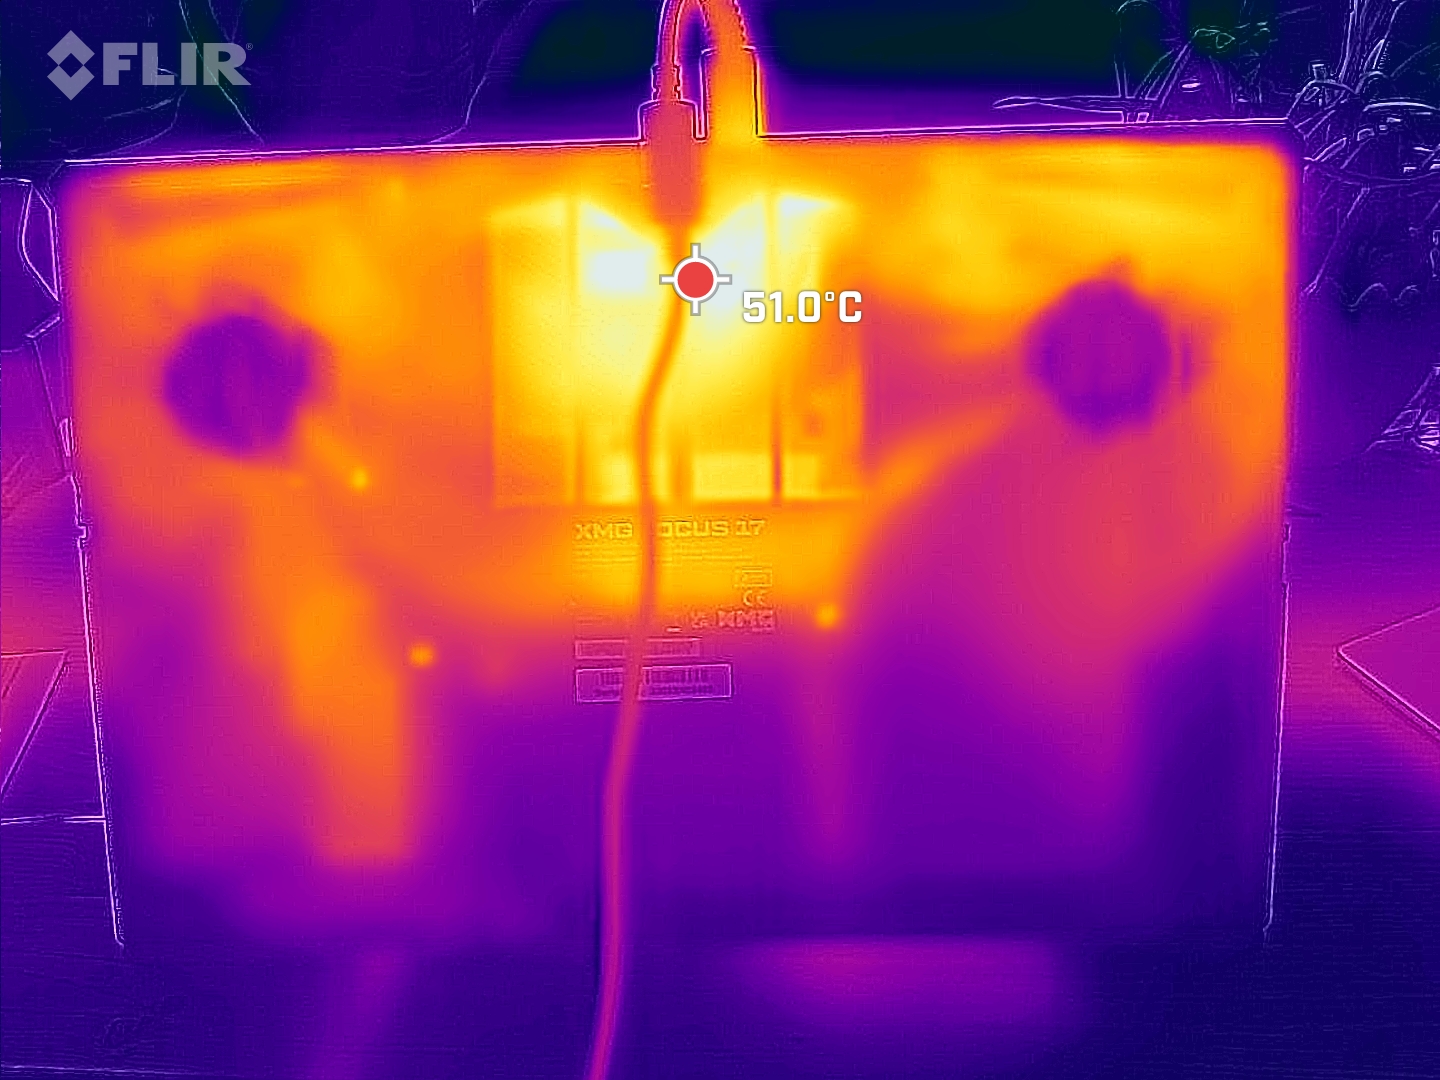
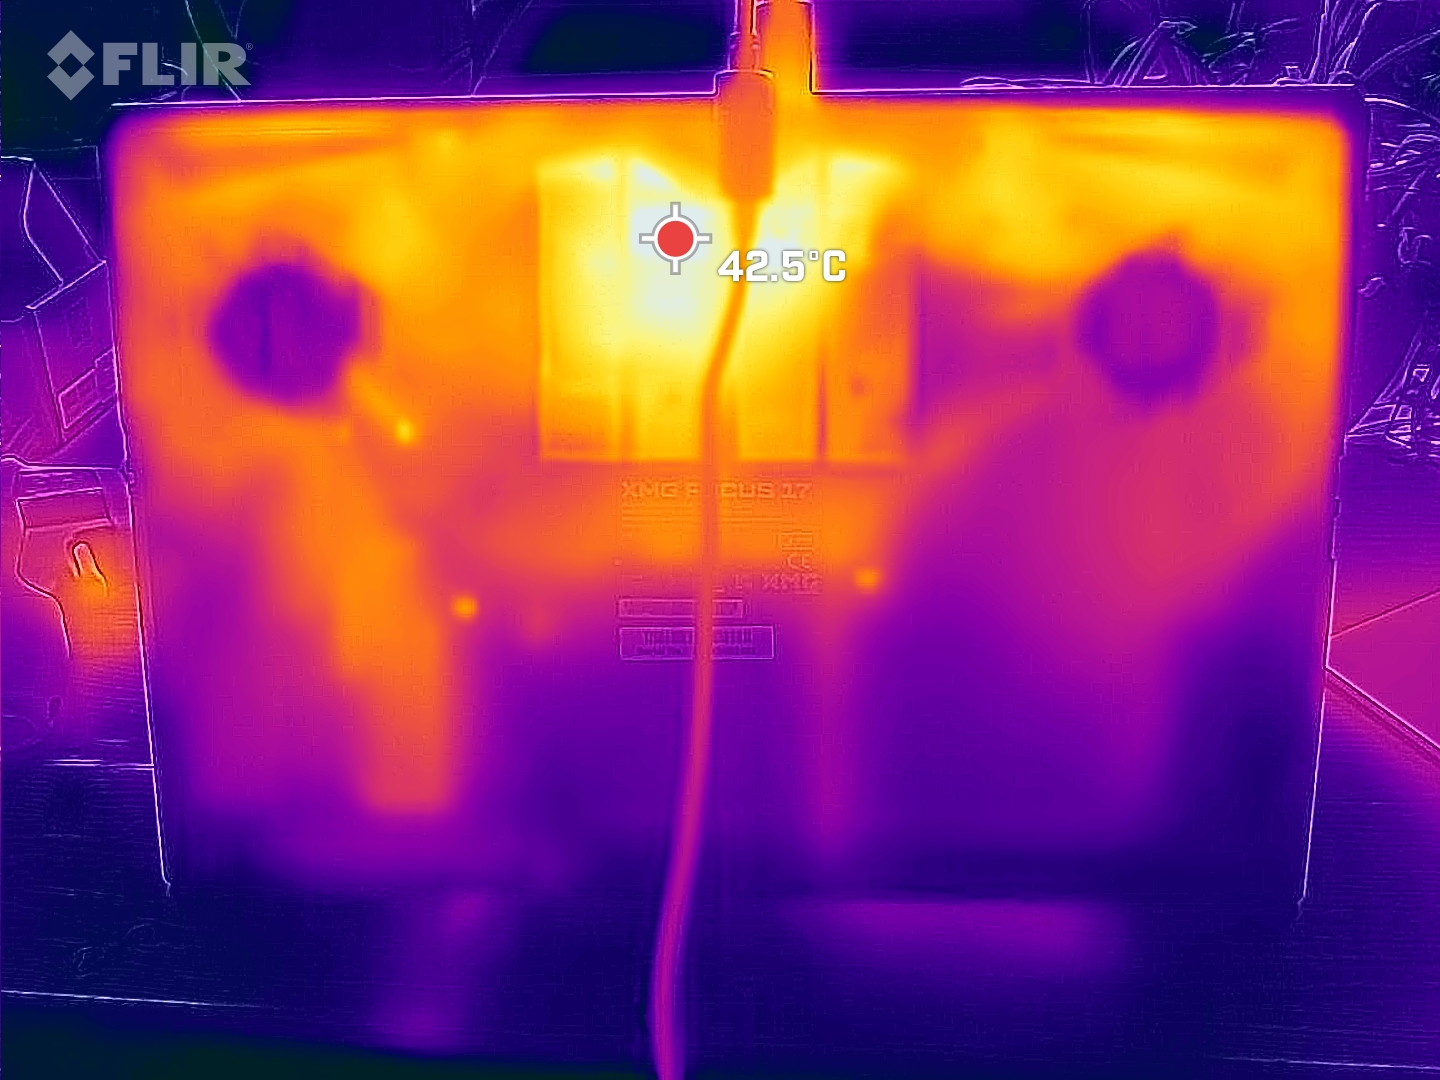
The underside gets warm even without significant load, so the XMG Focus 17 E23 should only be used on a flat, hard surface.
(-) The maximum temperature on the upper side is 50 °C / 122 F, compared to the average of 40.4 °C / 105 F, ranging from 21.2 to 68.8 °C for the class Gaming.
(-) The bottom heats up to a maximum of 56 °C / 133 F, compared to the average of 43.2 °C / 110 F
(+) In idle usage, the average temperature for the upper side is 30.9 °C / 88 F, compared to the device average of 33.9 °C / 93 F.
(±) Playing The Witcher 3, the average temperature for the upper side is 36.8 °C / 98 F, compared to the device average of 33.9 °C / 93 F.
(±) The palmrests and touchpad can get very hot to the touch with a maximum of 37 °C / 98.6 F.
(-) The average temperature of the palmrest area of similar devices was 28.8 °C / 83.8 F (-8.2 °C / -14.8 F).
| Schenker XMG Focus 17 (E23) Intel Core i9-13900HX, NVIDIA GeForce RTX 4070 Laptop GPU | Lenovo Legion Pro 5 16ARX8 AMD Ryzen 7 7745HX, NVIDIA GeForce RTX 4070 Laptop GPU | Medion Erazer Major X20 Intel Core i9-13900HX, NVIDIA GeForce RTX 4070 Laptop GPU | Schenker XMG Neo 17 M22 AMD Ryzen 9 6900HX, NVIDIA GeForce RTX 3080 Ti Laptop GPU | HP Omen 17-ck2097ng Intel Core i9-13900HX, NVIDIA GeForce RTX 4080 Laptop GPU | Medion Erazer Defender P40 Intel Core i7-13700HX, NVIDIA GeForce RTX 4060 Laptop GPU | |
|---|---|---|---|---|---|---|
| Heat | 20% | 4% | 9% | 23% | 19% | |
| Maximum Upper Side * (°C) | 50 | 41.8 16% | 46 8% | 49 2% | 41 18% | 42 16% |
| Maximum Bottom * (°C) | 56 | 41.4 26% | 49 12% | 52 7% | 51 9% | 45 20% |
| Idle Upper Side * (°C) | 37 | 29 22% | 37 -0% | 30 19% | 24 35% | 28 24% |
| Idle Bottom * (°C) | 36 | 30.4 16% | 38 -6% | 33 8% | 25 31% | 30 17% |
* ... smaller is better
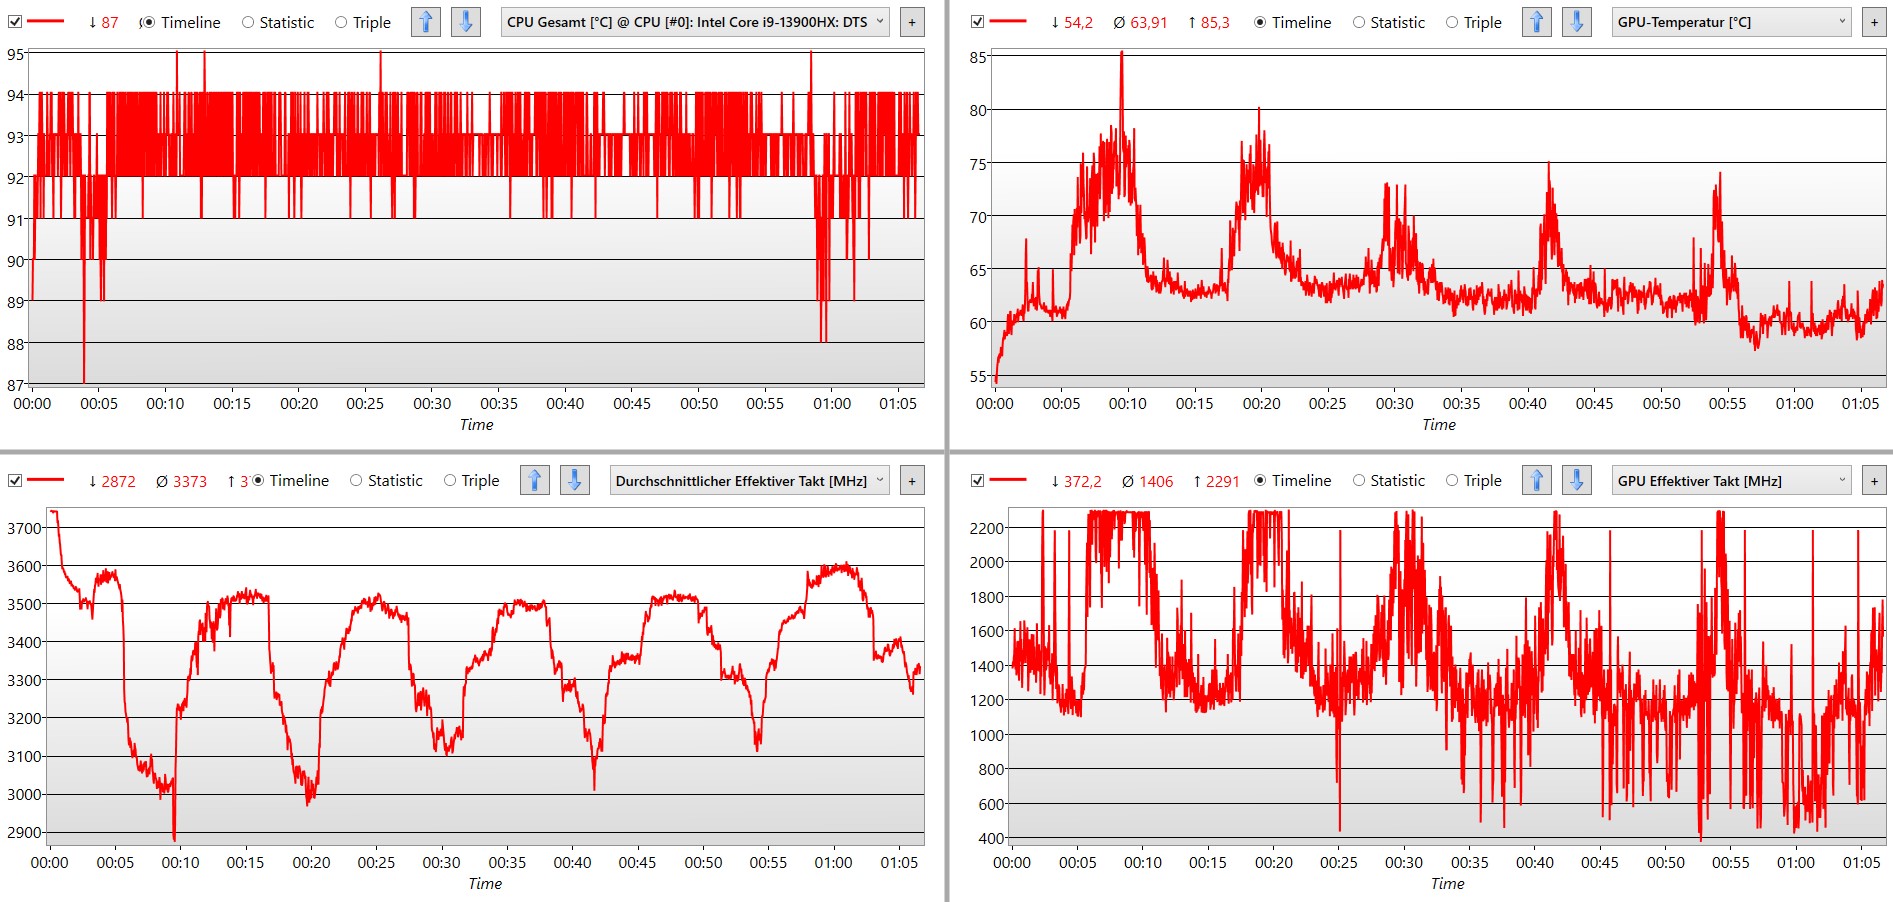
Stress test
In our stress test with Prime95 and Furmark, the CPU reaches temperatures beyond 95 °C. The GPU on the other hand is not fully utilized and hovers between 60 and 75 °C. The power supply is limited in this extreme situation and is around 200 W for the GPU and CPU together, while 240 W would theoretically be possible. Moreover, this only ever lasts for a few seconds before the power supply and clock rate are significantly reduced.
The cooling cannot permanently maintain the maximum performance, as it is for example the case in the XMG Neo 16 E23 is the case.
Speaker
The sound reproduction is sufficiently powerful for a notebook. There is nothing to complain about, especially in the low frequencies and the trebles. Speech and the typical effects in action-heavy games are reproduced well.
In music or even in movies, the lack of sound quality and the lack of lower mids and upper basses, which is clearly noticeable in our measurements, can be heard as well. For these tasks, there is hardly any way around using external speakers or headphones.
Schenker XMG Focus 17 (E23) audio analysis
(±) | speaker loudness is average but good (78.08 dB)
Bass 100 - 315 Hz
(-) | nearly no bass - on average 33.5% lower than median
(+) | bass is linear (6.1% delta to prev. frequency)
Mids 400 - 2000 Hz
(±) | reduced mids - on average 7.2% lower than median
(±) | linearity of mids is average (9.5% delta to prev. frequency)
Highs 2 - 16 kHz
(+) | balanced highs - only 4.4% away from median
(+) | highs are linear (5.2% delta to prev. frequency)
Overall 100 - 16.000 Hz
(±) | linearity of overall sound is average (26.9% difference to median)
Compared to same class
» 93% of all tested devices in this class were better, 2% similar, 6% worse
» The best had a delta of 6%, average was 18%, worst was 132%
Compared to all devices tested
» 82% of all tested devices were better, 4% similar, 14% worse
» The best had a delta of 4%, average was 24%, worst was 134%
Apple MacBook Pro 16 2021 M1 Pro audio analysis
(+) | speakers can play relatively loud (84.7 dB)
Bass 100 - 315 Hz
(+) | good bass - only 3.8% away from median
(+) | bass is linear (5.2% delta to prev. frequency)
Mids 400 - 2000 Hz
(+) | balanced mids - only 1.3% away from median
(+) | mids are linear (2.1% delta to prev. frequency)
Highs 2 - 16 kHz
(+) | balanced highs - only 1.9% away from median
(+) | highs are linear (2.7% delta to prev. frequency)
Overall 100 - 16.000 Hz
(+) | overall sound is linear (4.6% difference to median)
Compared to same class
» 0% of all tested devices in this class were better, 0% similar, 100% worse
» The best had a delta of 5%, average was 17%, worst was 45%
Compared to all devices tested
» 0% of all tested devices were better, 0% similar, 100% worse
» The best had a delta of 4%, average was 24%, worst was 134%
Power management - Strong CPU in gaming notebook is very hungry
Power consumption
The power consumption is clearly too high when no processes are running. Especially the rivals with AMD processors, like the XMG Neo 17 M22 then manage with less than half the power.
The Focus 17 is also not frugal under load. It needs a third more power for the identical frame rate in Witcher 3 than the Lenovo Legion Pro 5. This is not efficient and explains to a large extent why the Legion is only half as loud.
The 280-watt power supply is at least sufficiently large, never overloaded, and should always provide enough power to charge the battery.
| Off / Standby | |
| Idle | |
| Load |
|
Key:
min: | |
| Schenker XMG Focus 17 (E23) i9-13900HX, GeForce RTX 4070 Laptop GPU, Crucial P5 Plus 1TB CT1000P5PSSD8, IPS, 2560x1440, 17.3" | Lenovo Legion Pro 5 16ARX8 R7 7745HX, GeForce RTX 4070 Laptop GPU, Samsung PM9A1 MZVL21T0HCLR, IPS, 2560x1600, 16" | Schenker XMG Neo 17 M22 R9 6900HX, GeForce RTX 3080 Ti Laptop GPU, Samsung SSD 980 Pro 1TB MZ-V8P1T0BW, IPS, 2560x1600, 17" | HP Omen 17-ck2097ng i9-13900HX, GeForce RTX 4080 Laptop GPU, SK hynix PC801 HFS001TEJ9X101N, IPS, 2560x1440, 17.3" | Medion Erazer Defender P40 i7-13700HX, GeForce RTX 4060 Laptop GPU, Phison PS5021-E21 1TB, IPS, 2560x1440, 17.3" | MSI Titan GT77 12UHS i9-12900HX, GeForce RTX 3080 Ti Laptop GPU, Samsung PM9A1 MZVL21T0HCLR, IPS-Level, 1920x1080, 17.3" | Average NVIDIA GeForce RTX 4070 Laptop GPU | Average of class Gaming | |
|---|---|---|---|---|---|---|---|---|
| Power Consumption | 17% | 31% | 5% | 31% | -29% | 18% | 14% | |
| Idle Minimum * (Watt) | 17 | 8.1 52% | 7 59% | 16 6% | 8 53% | 30.21 -78% | 13.2 ? 22% | 13.3 ? 22% |
| Idle Average * (Watt) | 18 | 15.9 12% | 11 39% | 20 -11% | 12 33% | 32.42 -80% | 18.2 ? -1% | 19 ? -6% |
| Idle Maximum * (Watt) | 25.8 | 37.2 -44% | 17 34% | 26 -1% | 18 30% | 33.7 -31% | 24.6 ? 5% | 24.5 ? 5% |
| Load Average * (Watt) | 178 | 90.9 49% | 92 48% | 135 24% | 101 43% | 125.09 30% | 97 ? 46% | 108.1 ? 39% |
| Witcher 3 ultra * (Watt) | 265 | 189.6 28% | 221 17% | 215 19% | 180.8 32% | 256 3% | ||
| Load Maximum * (Watt) | 275 | 263.5 4% | 306 -11% | 299 -9% | 284 -3% | 321.88 -17% | 221 ? 20% | 254 ? 8% |
* ... smaller is better
Power consumption Witcher 3 / Stress test
Power consumption external monitor
Battery life
The high power consumption without load is accompanied by weak battery runtimes. Even in energy-saving mode, 4 hours are not achievable. Another 20 min more are achieved in silent mode, which was not to be expected in view of the activated dGPU. If the plug is pulled in performance mode and Advanced Optimus is active, the runtime is not even 2 h in our WLAN test with alternating Internet calls.
XMG has reported in this regard that the energy-saving mode does not currently work as desired. We can confirm this in view of our test results. An update should definitely remedy the situation.
| Schenker XMG Focus 17 (E23) i9-13900HX, GeForce RTX 4070 Laptop GPU, 73 Wh | Lenovo Legion Pro 5 16ARX8 R7 7745HX, GeForce RTX 4070 Laptop GPU, 80 Wh | Medion Erazer Major X20 i9-13900HX, GeForce RTX 4070 Laptop GPU, 62.3 Wh | Schenker XMG Neo 17 M22 R9 6900HX, GeForce RTX 3080 Ti Laptop GPU, 99 Wh | HP Omen 17-ck2097ng i9-13900HX, GeForce RTX 4080 Laptop GPU, 83 Wh | Medion Erazer Defender P40 i7-13700HX, GeForce RTX 4060 Laptop GPU, 73 Wh | Average of class Gaming | |
|---|---|---|---|---|---|---|---|
| Battery runtime | 3% | 18% | 122% | 6% | 72% | 123% | |
| H.264 (h) | 3.1 | 4.2 35% | 6.6 113% | 3.7 19% | 5.7 84% | 8.26 ? 166% | |
| WiFi v1.3 (h) | 3.9 | 4 3% | 3.9 0% | 9 131% | 3.6 -8% | 6.2 59% | 7.01 ? 80% |
| Witcher 3 ultra (h) | 1 |
Pros
Cons
Verdict - Best for gaming, with a few drawbacks
There is no doubt about the system's performance. The Focus 17 ranks among the similarly strong competition. Only the not quite convincing cooling prevents a better score. It does not seem to be adjusted precisely for the Intel Core i9 in particular. Nevertheless, there is probably no current game that is too demanding for the QHD resolution of the color-accurate screen.
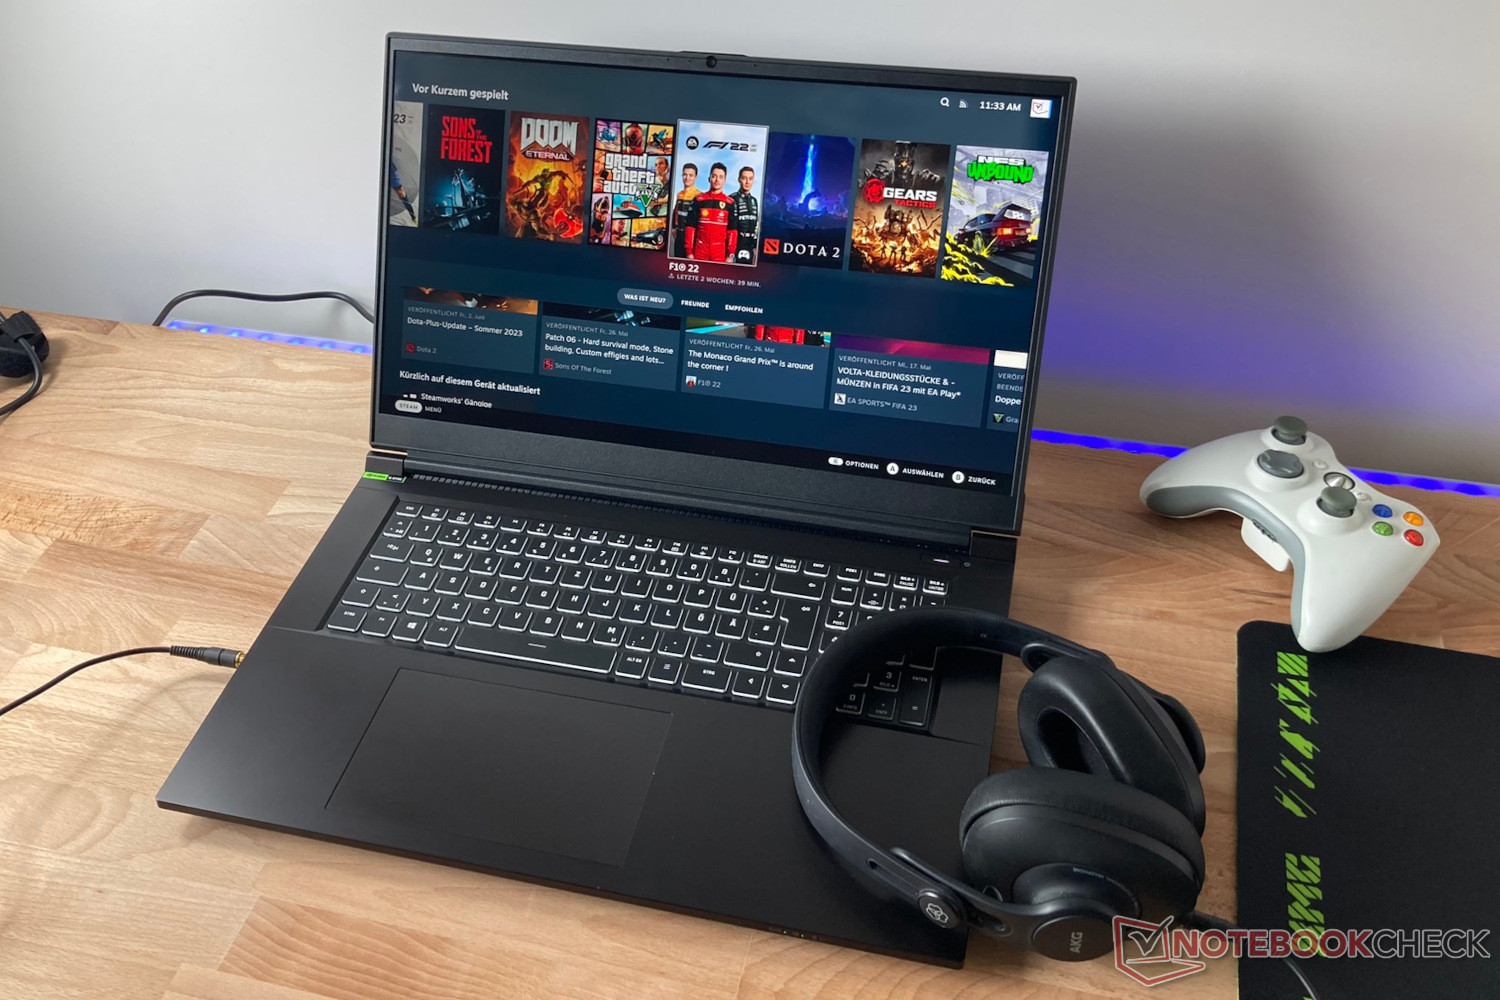
Focus on gaming performance: Strong hardware is found in the Focus 17 E23 with below-average equipment.
If the laptop does not have to be capable of more, the XMG Focus with focus on gaming performance, which is already predicted in the name. Otherwise, the rating turns out rather weak in comparison to the (almost universally more expensive) competition.
The keyboard only offers a few color settings, always for all keys. As in the predecessor, the touchpad cannot convince, but it will hardly be used for gaming anyway. The battery life is far too short and only halfway acceptable in strict energy-saving mode. The speakers sound mediocre. Furthermore, the ventilation is louder than average, while the components consume far too much power for the ascertained performance. In addition, USB 2.0 no longer seems up-to-date and Mini-DisplayPort can be found on VR headsets, for example, but USB-C with DP support would be more variable.
In return, the pricing is correspondingly attractive. The price-performance ratio is good. If Schenker also succeeds in adjusting the seemingly unfinished performance modes via a software update, some flaws like the short battery life or the poor fan behavior could be mitigated significantly.
More performance from comparable components is available, for example, with the XMG Neo 16 E23 (equipped with the RTX 4090). Approximately as fast and quieter than the XMG Focus 17 is the Lenovo Legion Pro 5 16 Gen8. However, both gaming laptops are also noticeably more expensive with their overall better equipment.
Price and availability
Schenker XMG Focus 17 (E23)
- 06/04/2023 v7 (old)
Mario Petzold
Transparency
The selection of devices to be reviewed is made by our editorial team. The test sample was provided to the author as a loan by the manufacturer or retailer for the purpose of this review. The lender had no influence on this review, nor did the manufacturer receive a copy of this review before publication. There was no obligation to publish this review. As an independent media company, Notebookcheck is not subjected to the authority of manufacturers, retailers or publishers.
This is how Notebookcheck is testing
Every year, Notebookcheck independently reviews hundreds of laptops and smartphones using standardized procedures to ensure that all results are comparable. We have continuously developed our test methods for around 20 years and set industry standards in the process. In our test labs, high-quality measuring equipment is utilized by experienced technicians and editors. These tests involve a multi-stage validation process. Our complex rating system is based on hundreds of well-founded measurements and benchmarks, which maintains objectivity. Further information on our test methods can be found here.
Price comparison

