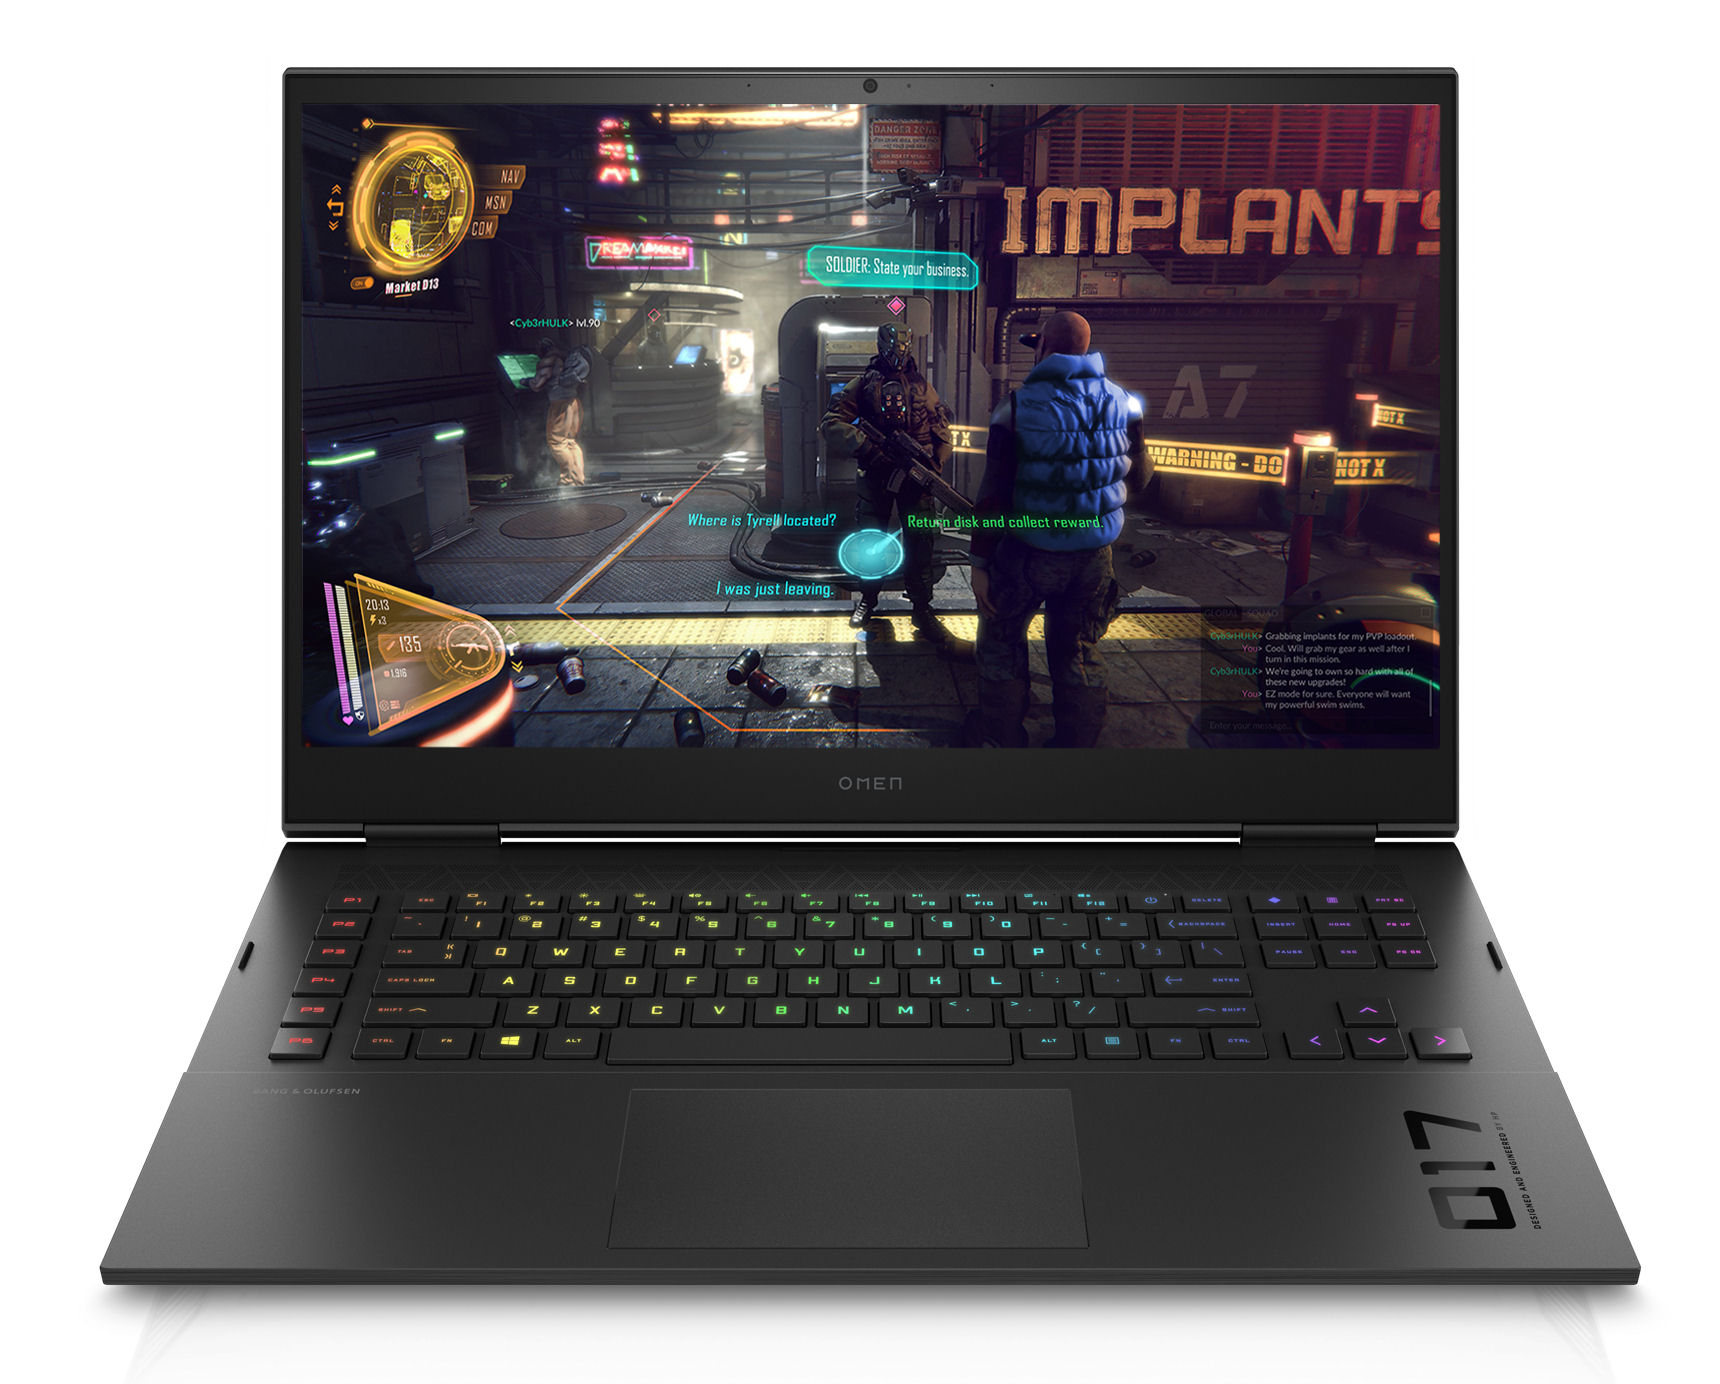
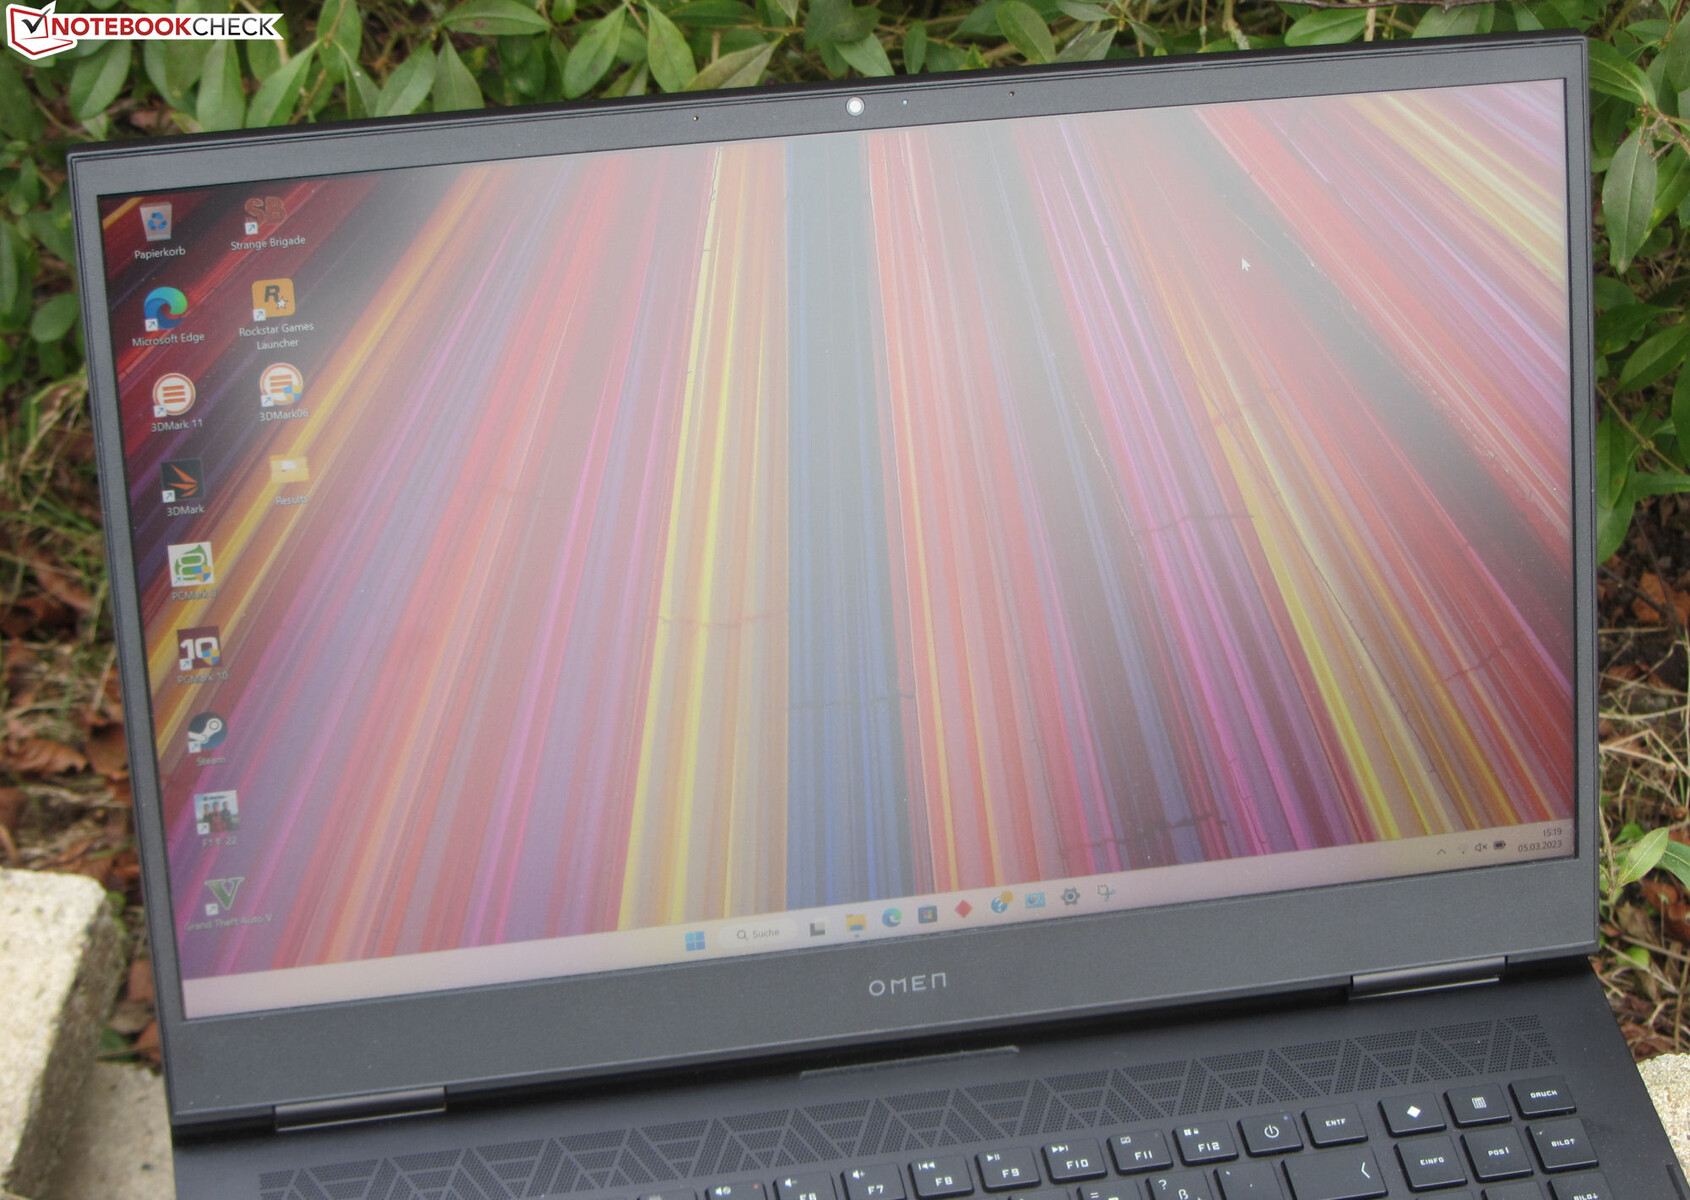
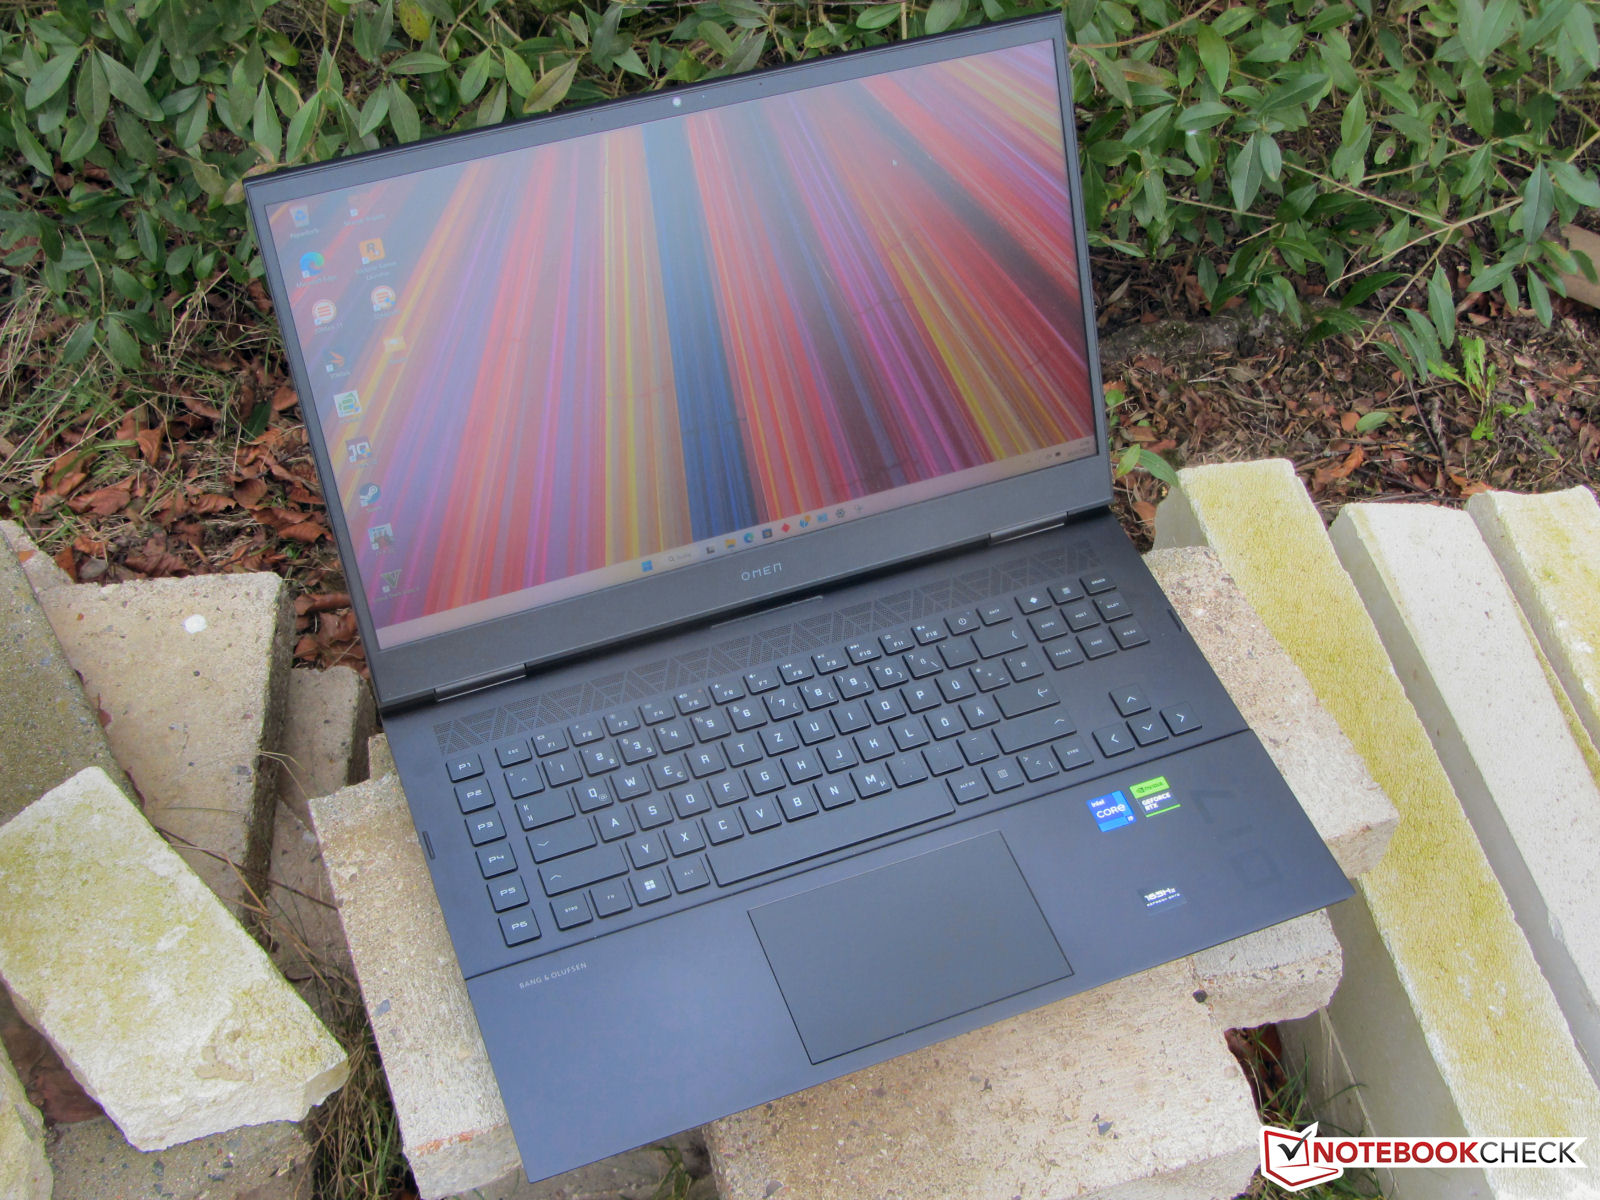
HP Omen 17 (2023) review: Gaming laptop uses RTX 4080

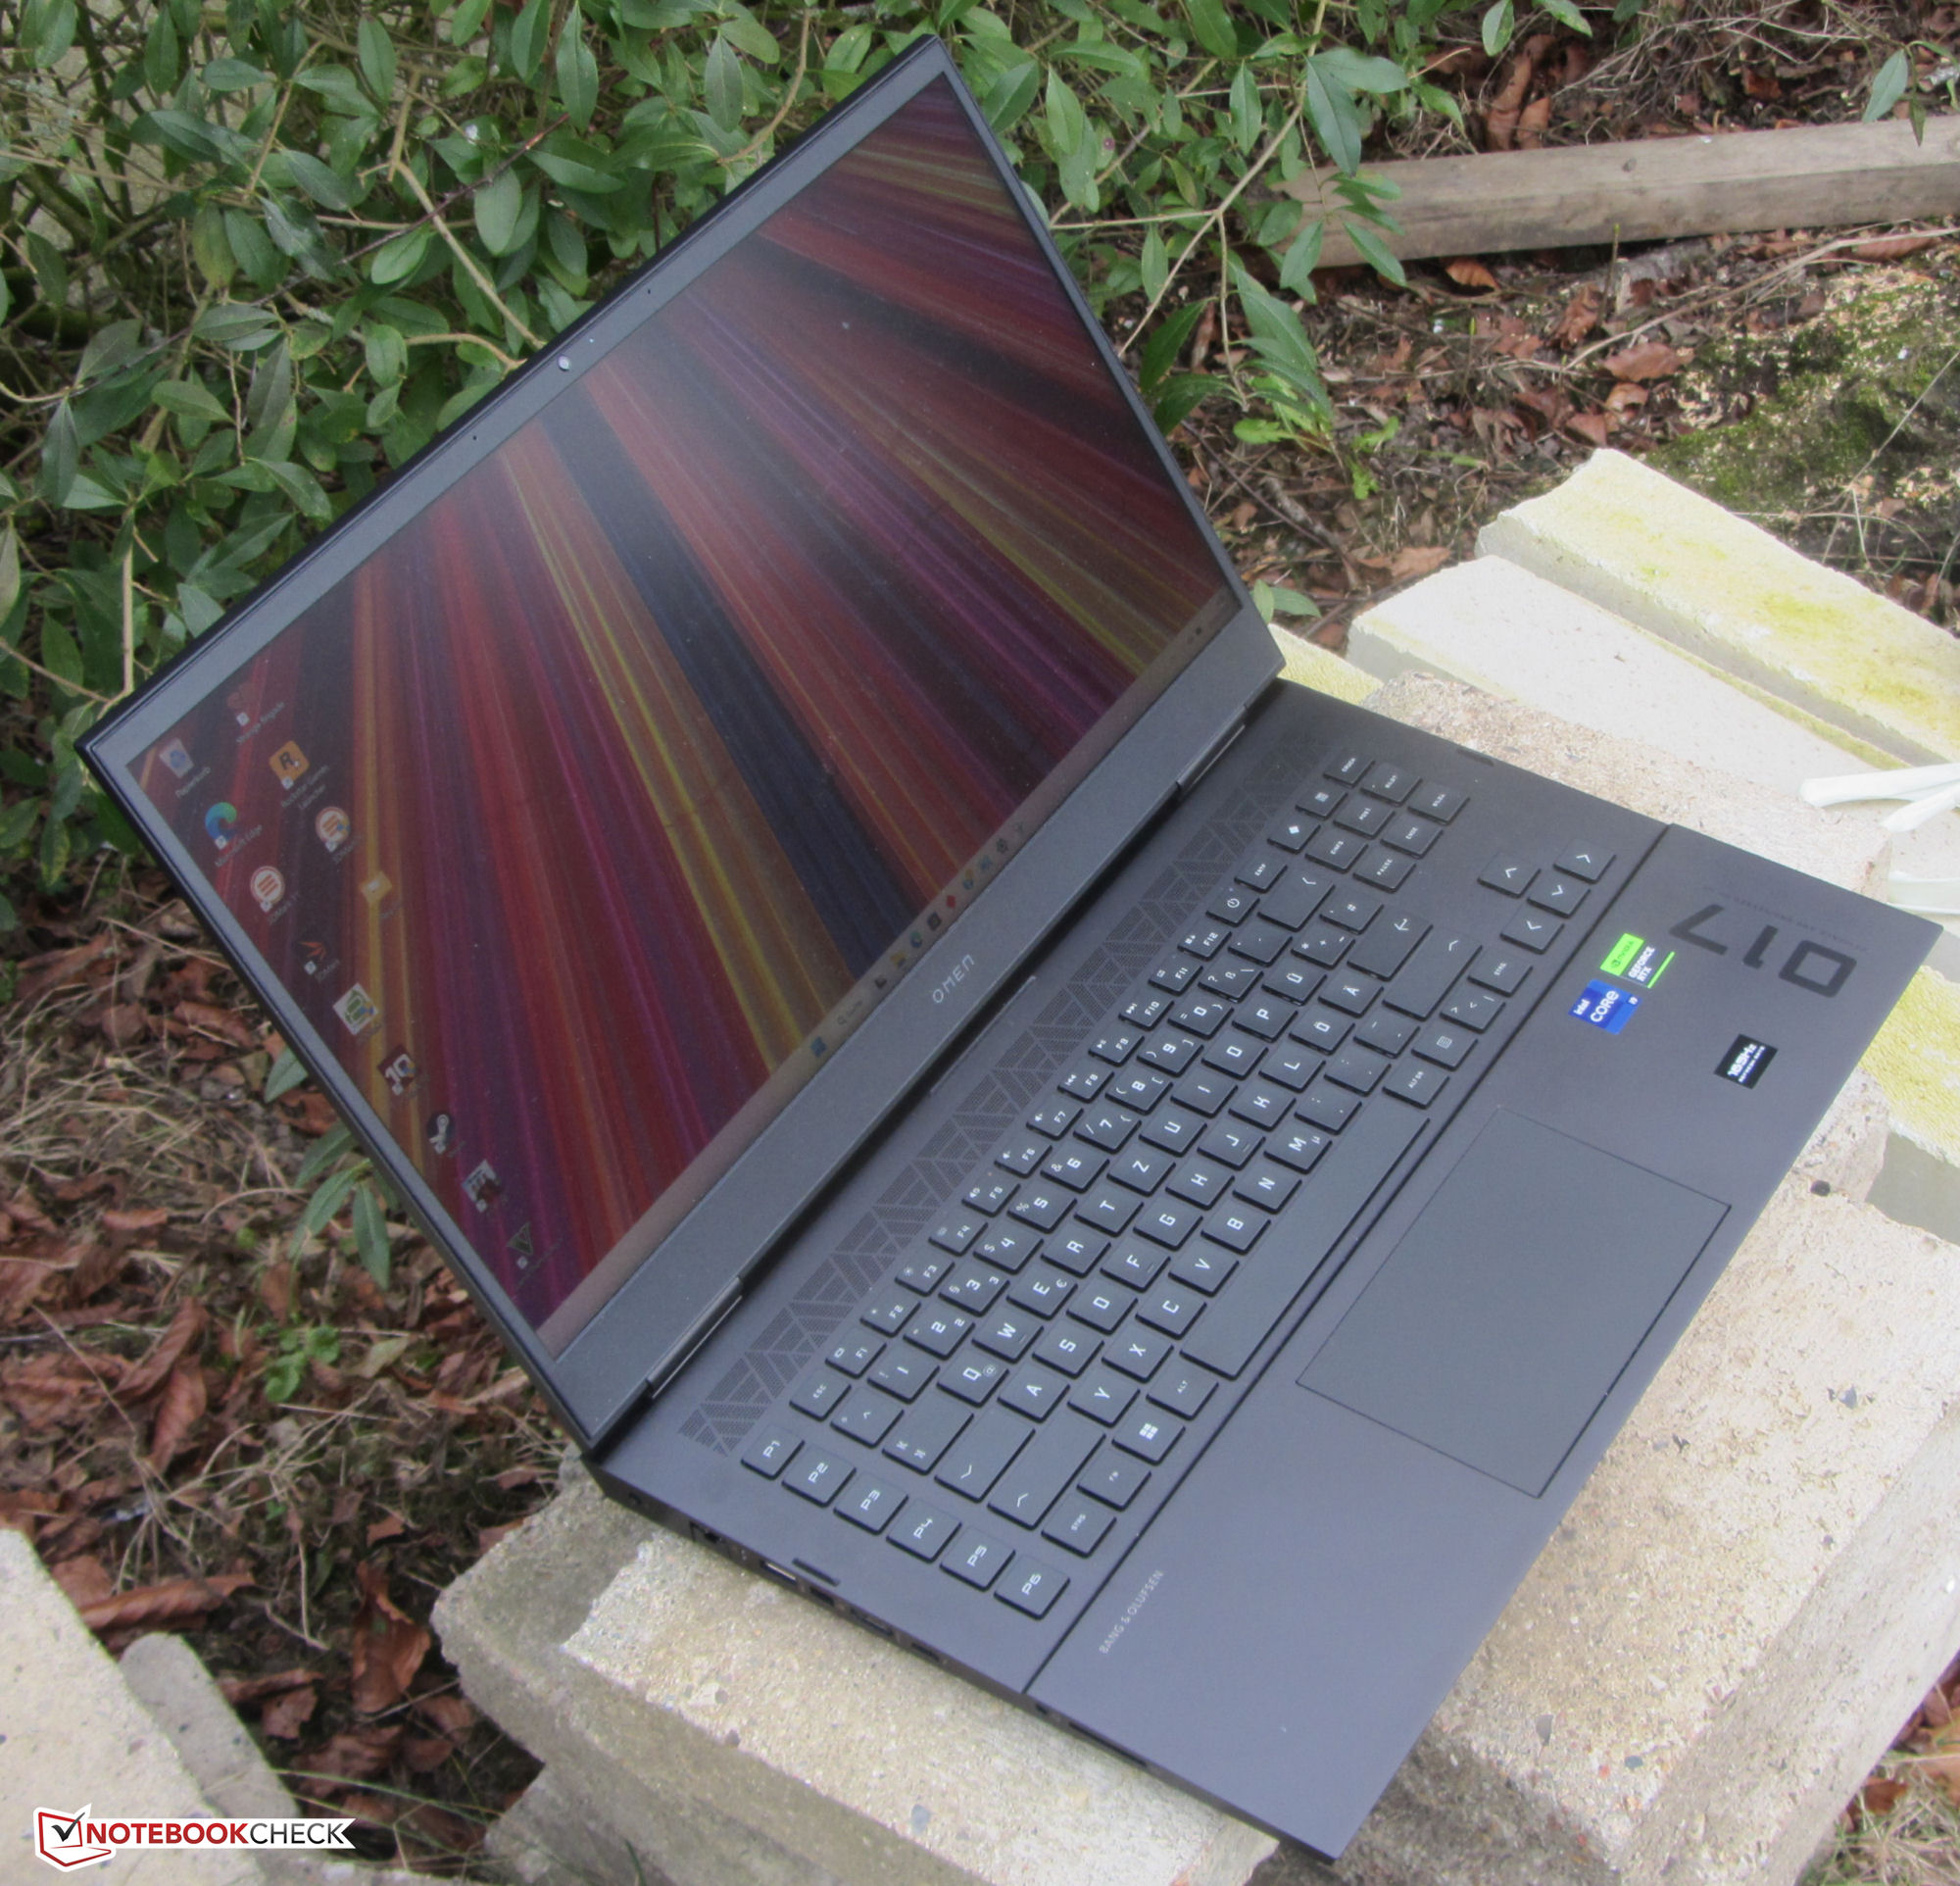
The 2023 model of the Omen 17, which is a high-end gaming laptop, uses the same case that we already know from the predecessor but includes current hardware: The laptop is run by Raptor Lake and Ada Lovelace chips. HP combines a Core i9 with an RTX 4080 GPU, asking for almost 3,300 Euros ($3,582) for the whole package. The competitors include laptops such as the Alienware m17 R5, the Razer Blade 16 (Early 2023), the Asus ROG Strix G16 G614JZ, and the Lenovo Legion Pro 7 16IRX8H.
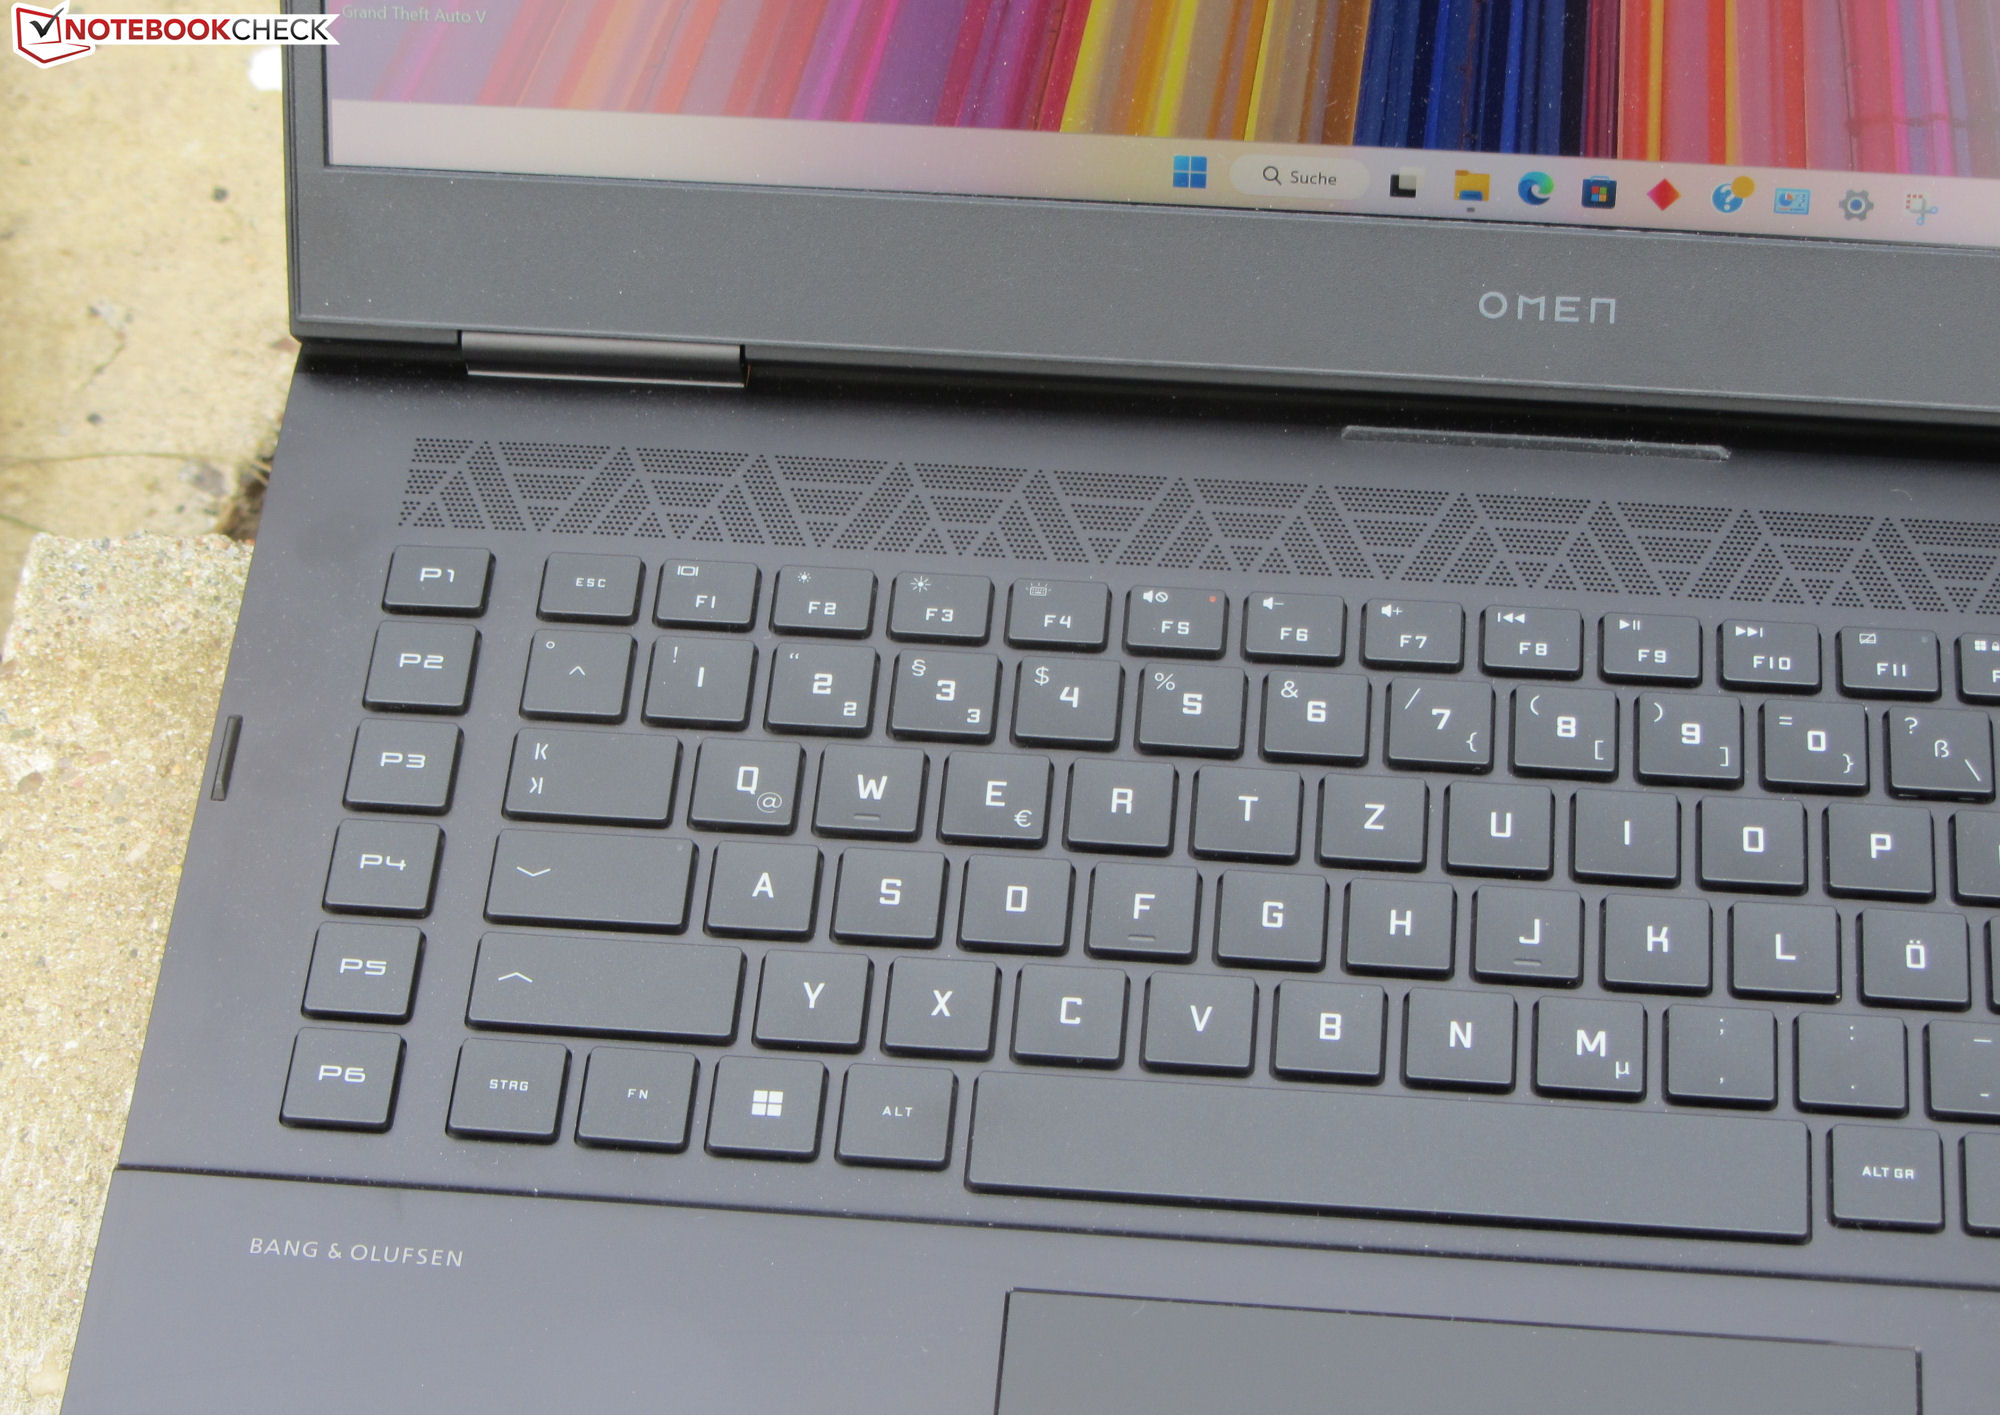
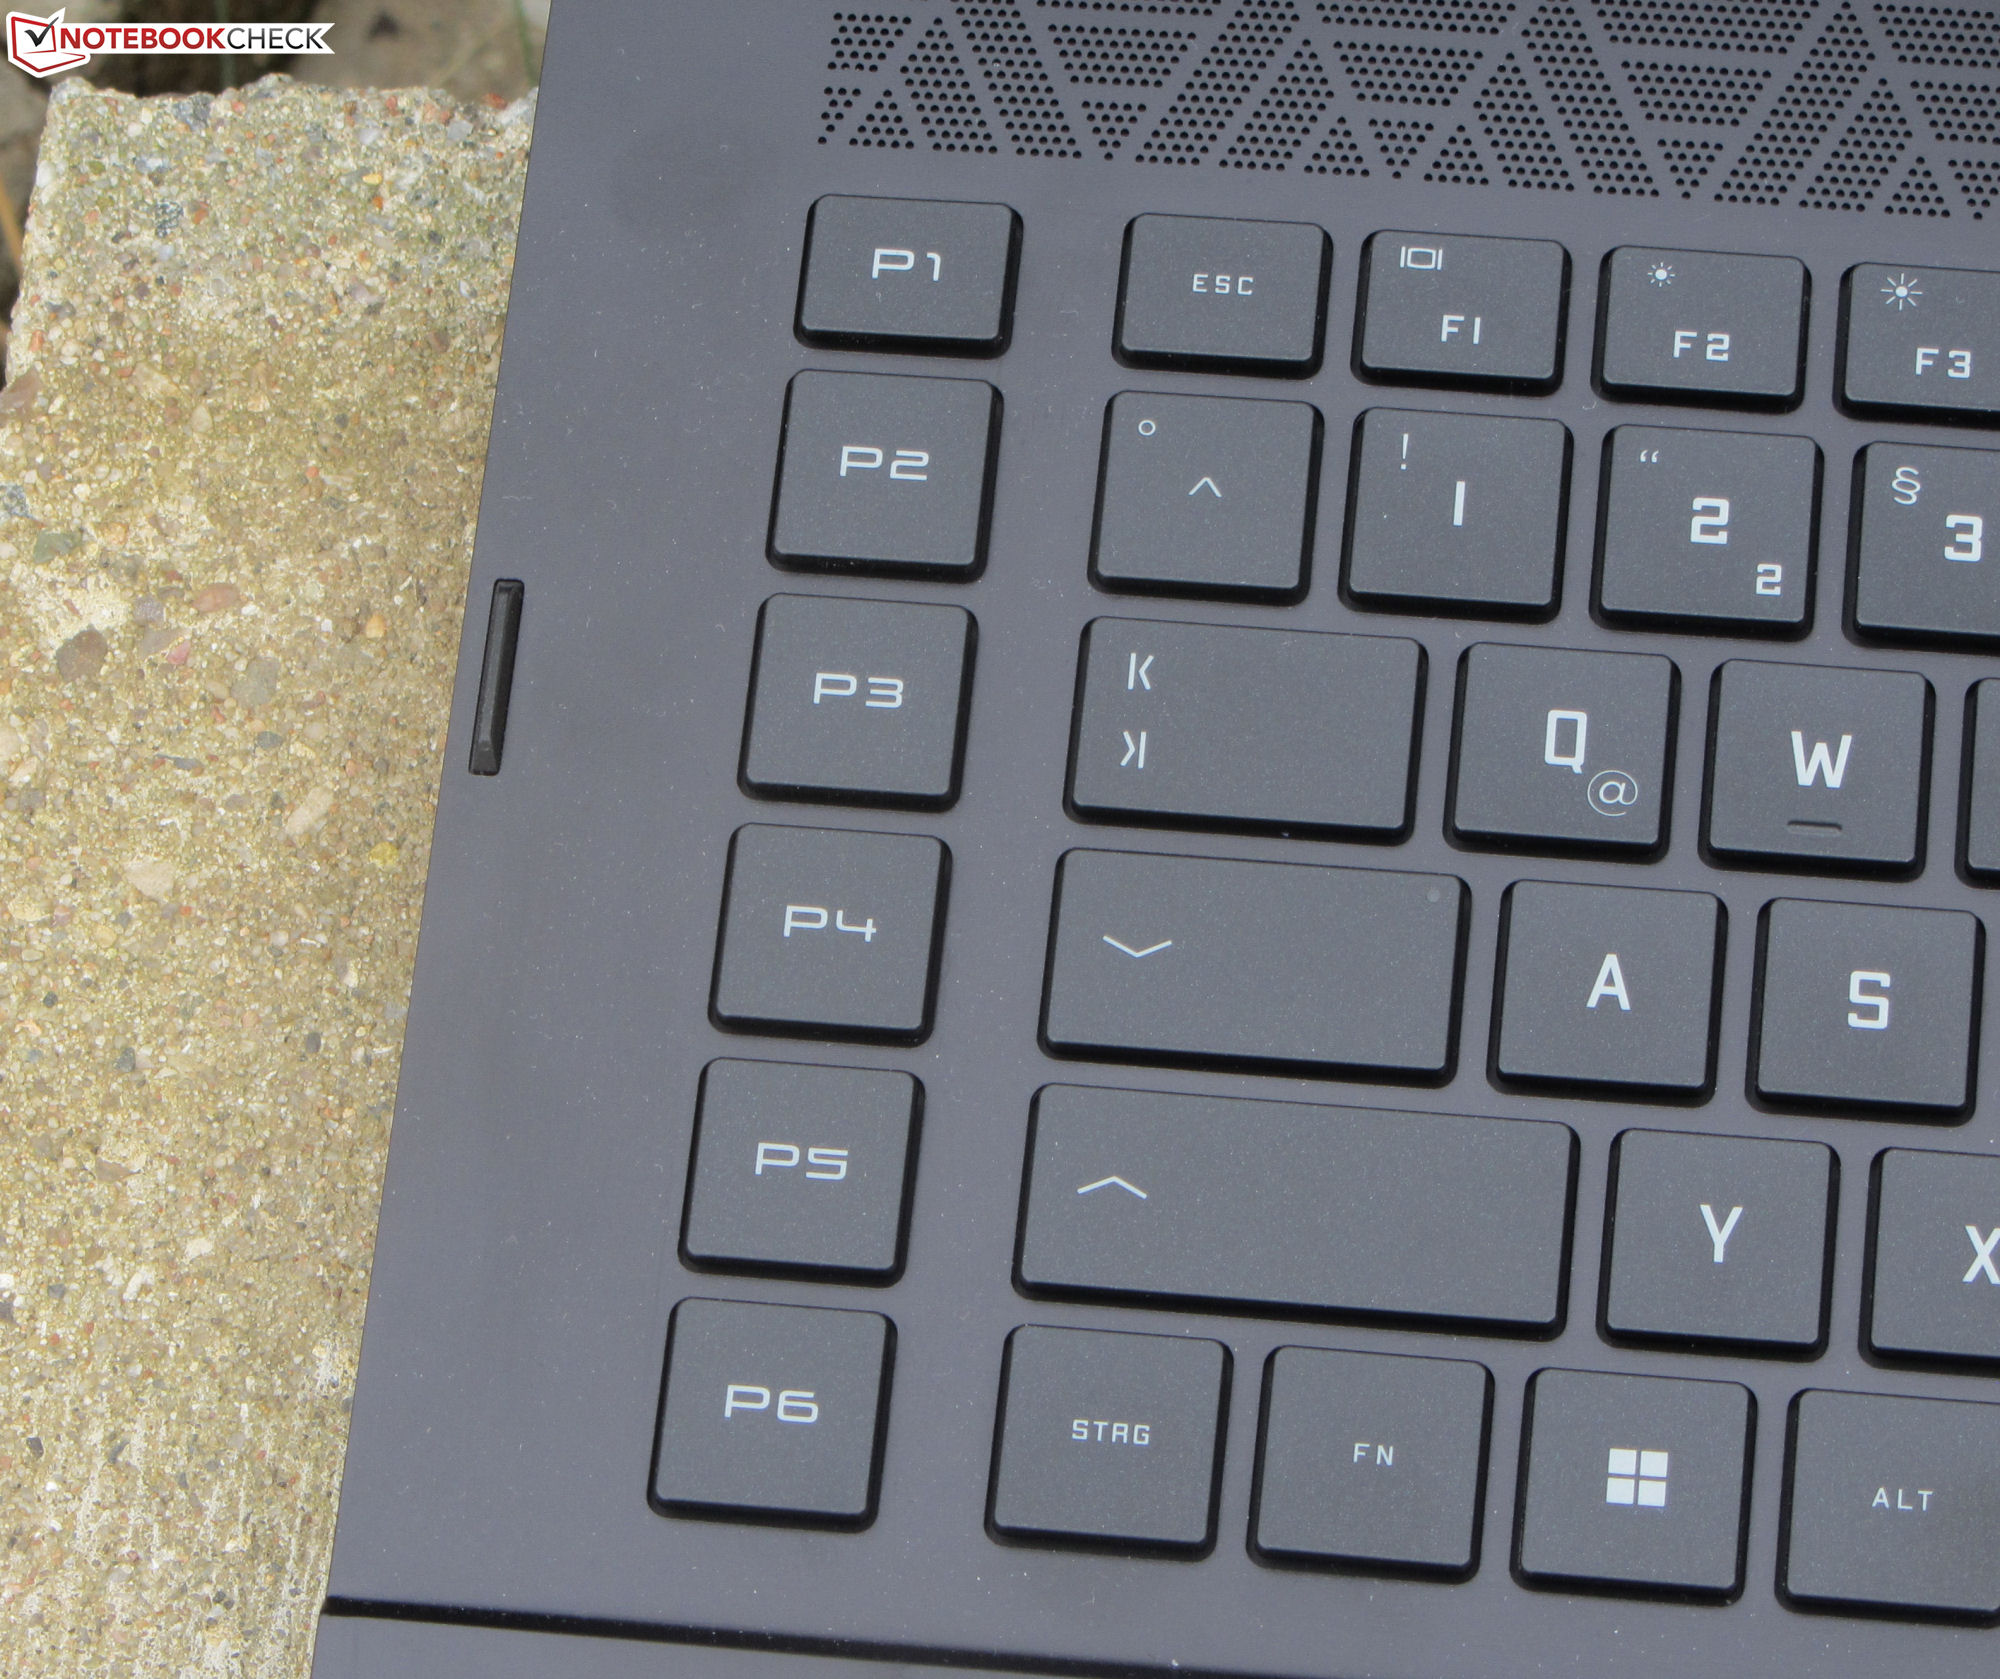
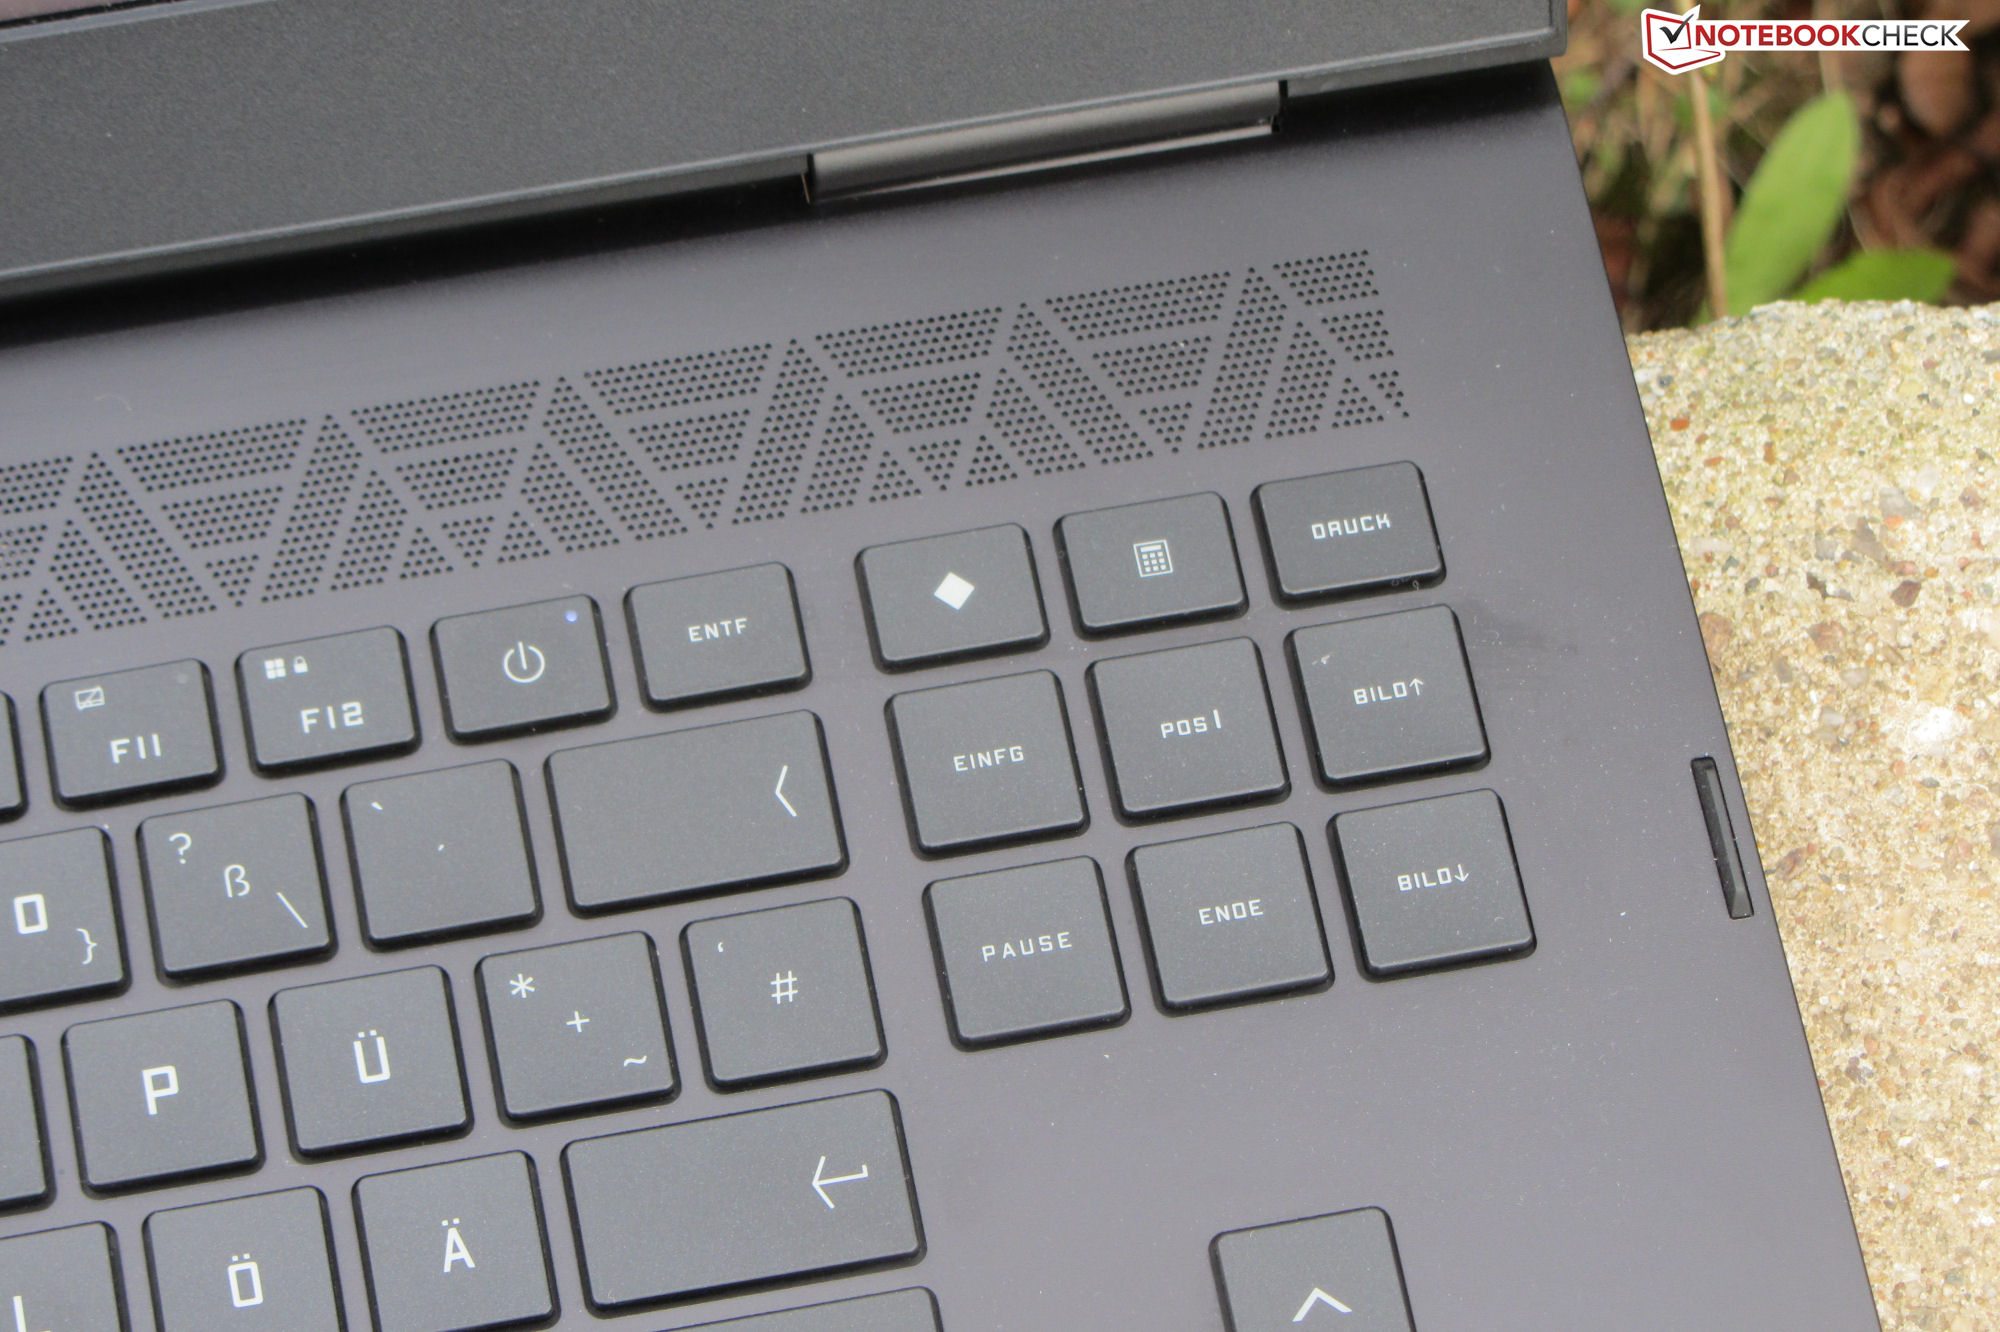
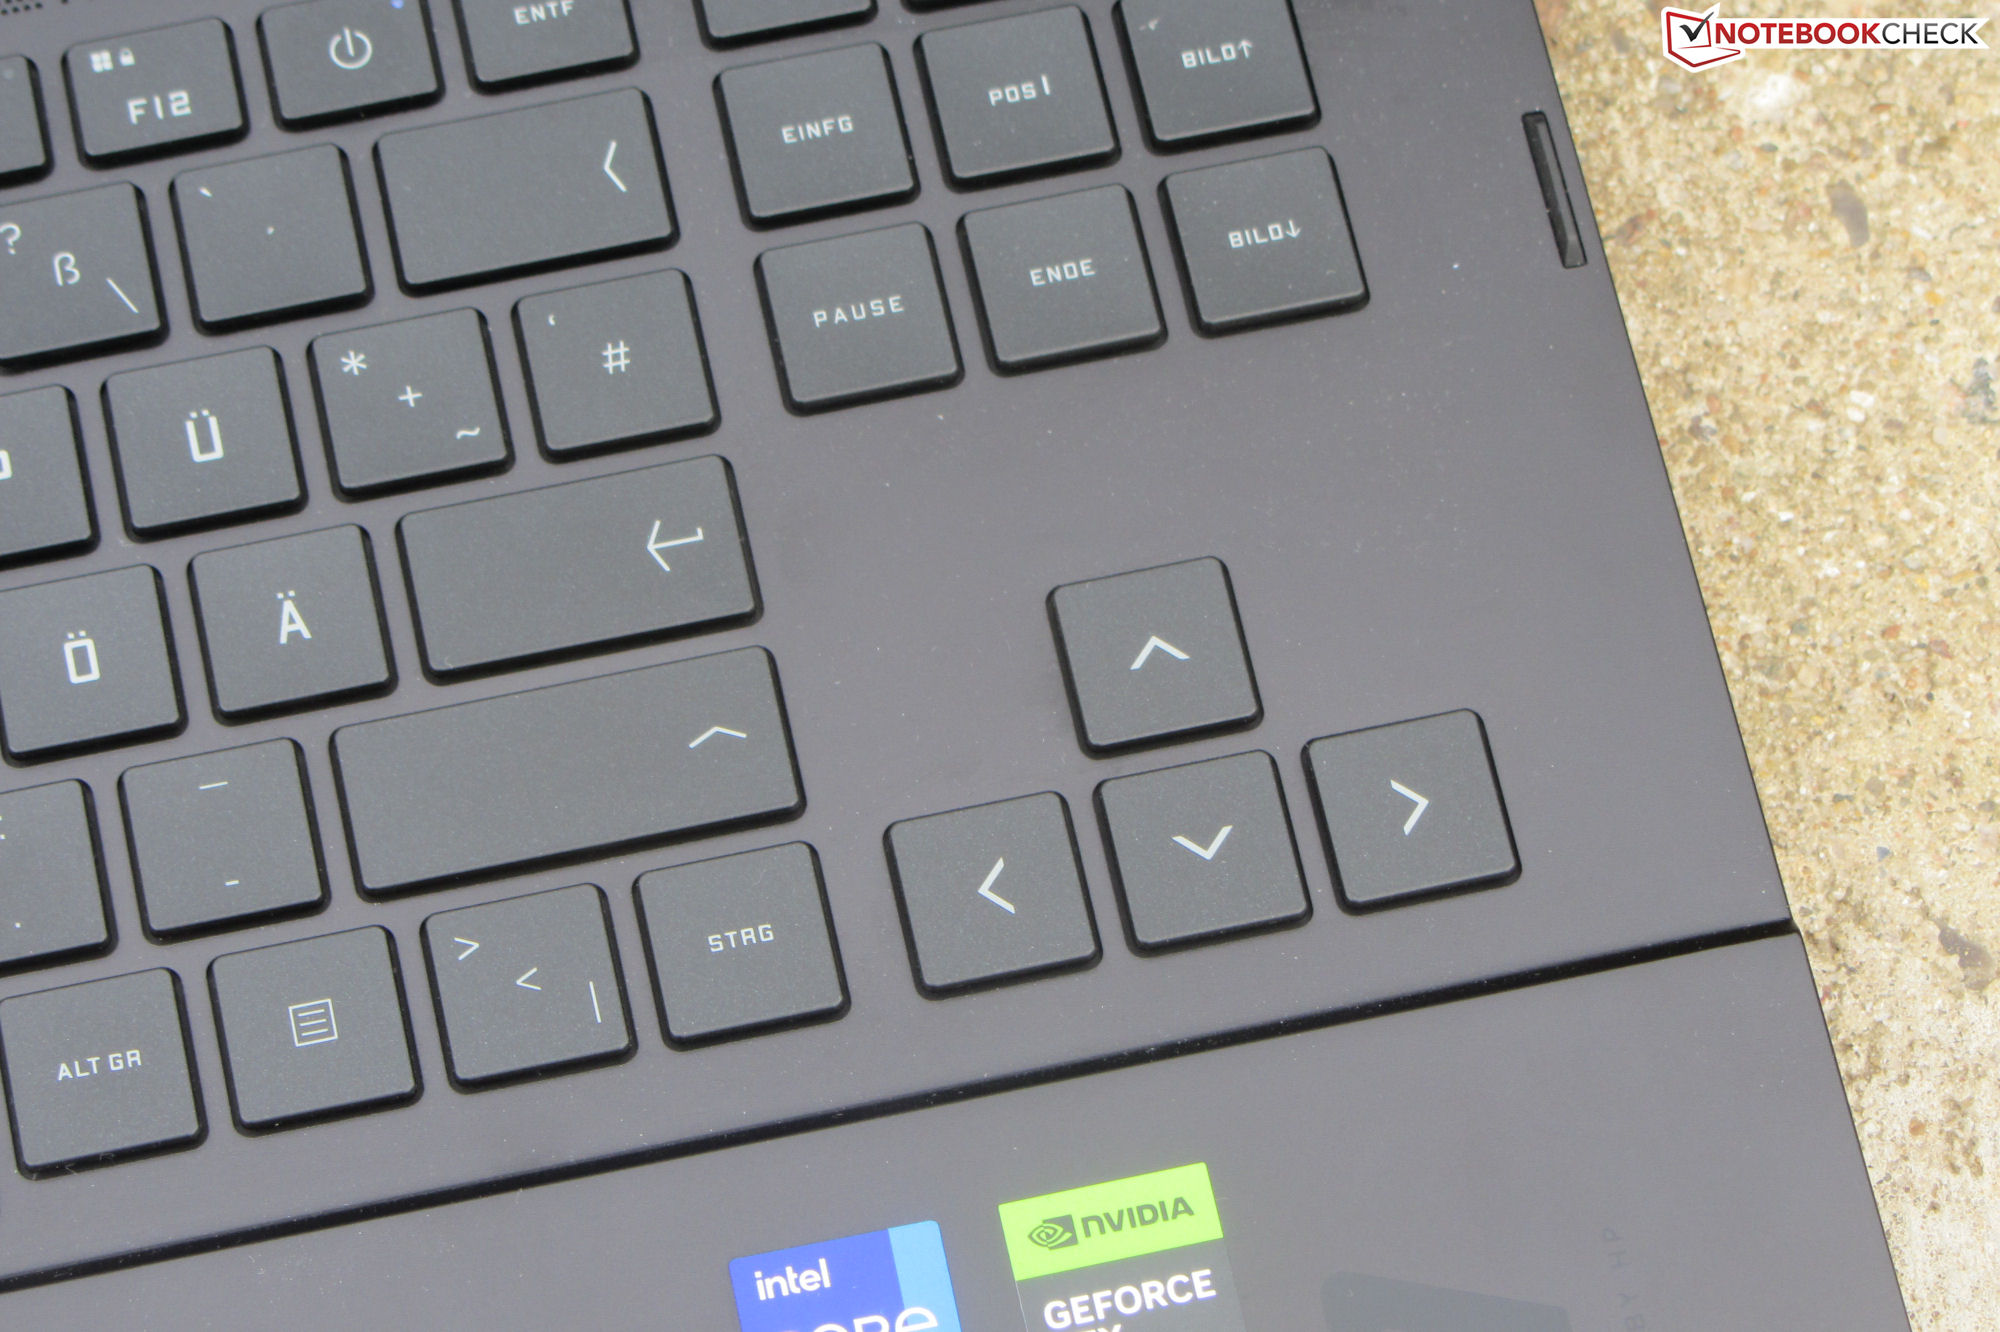
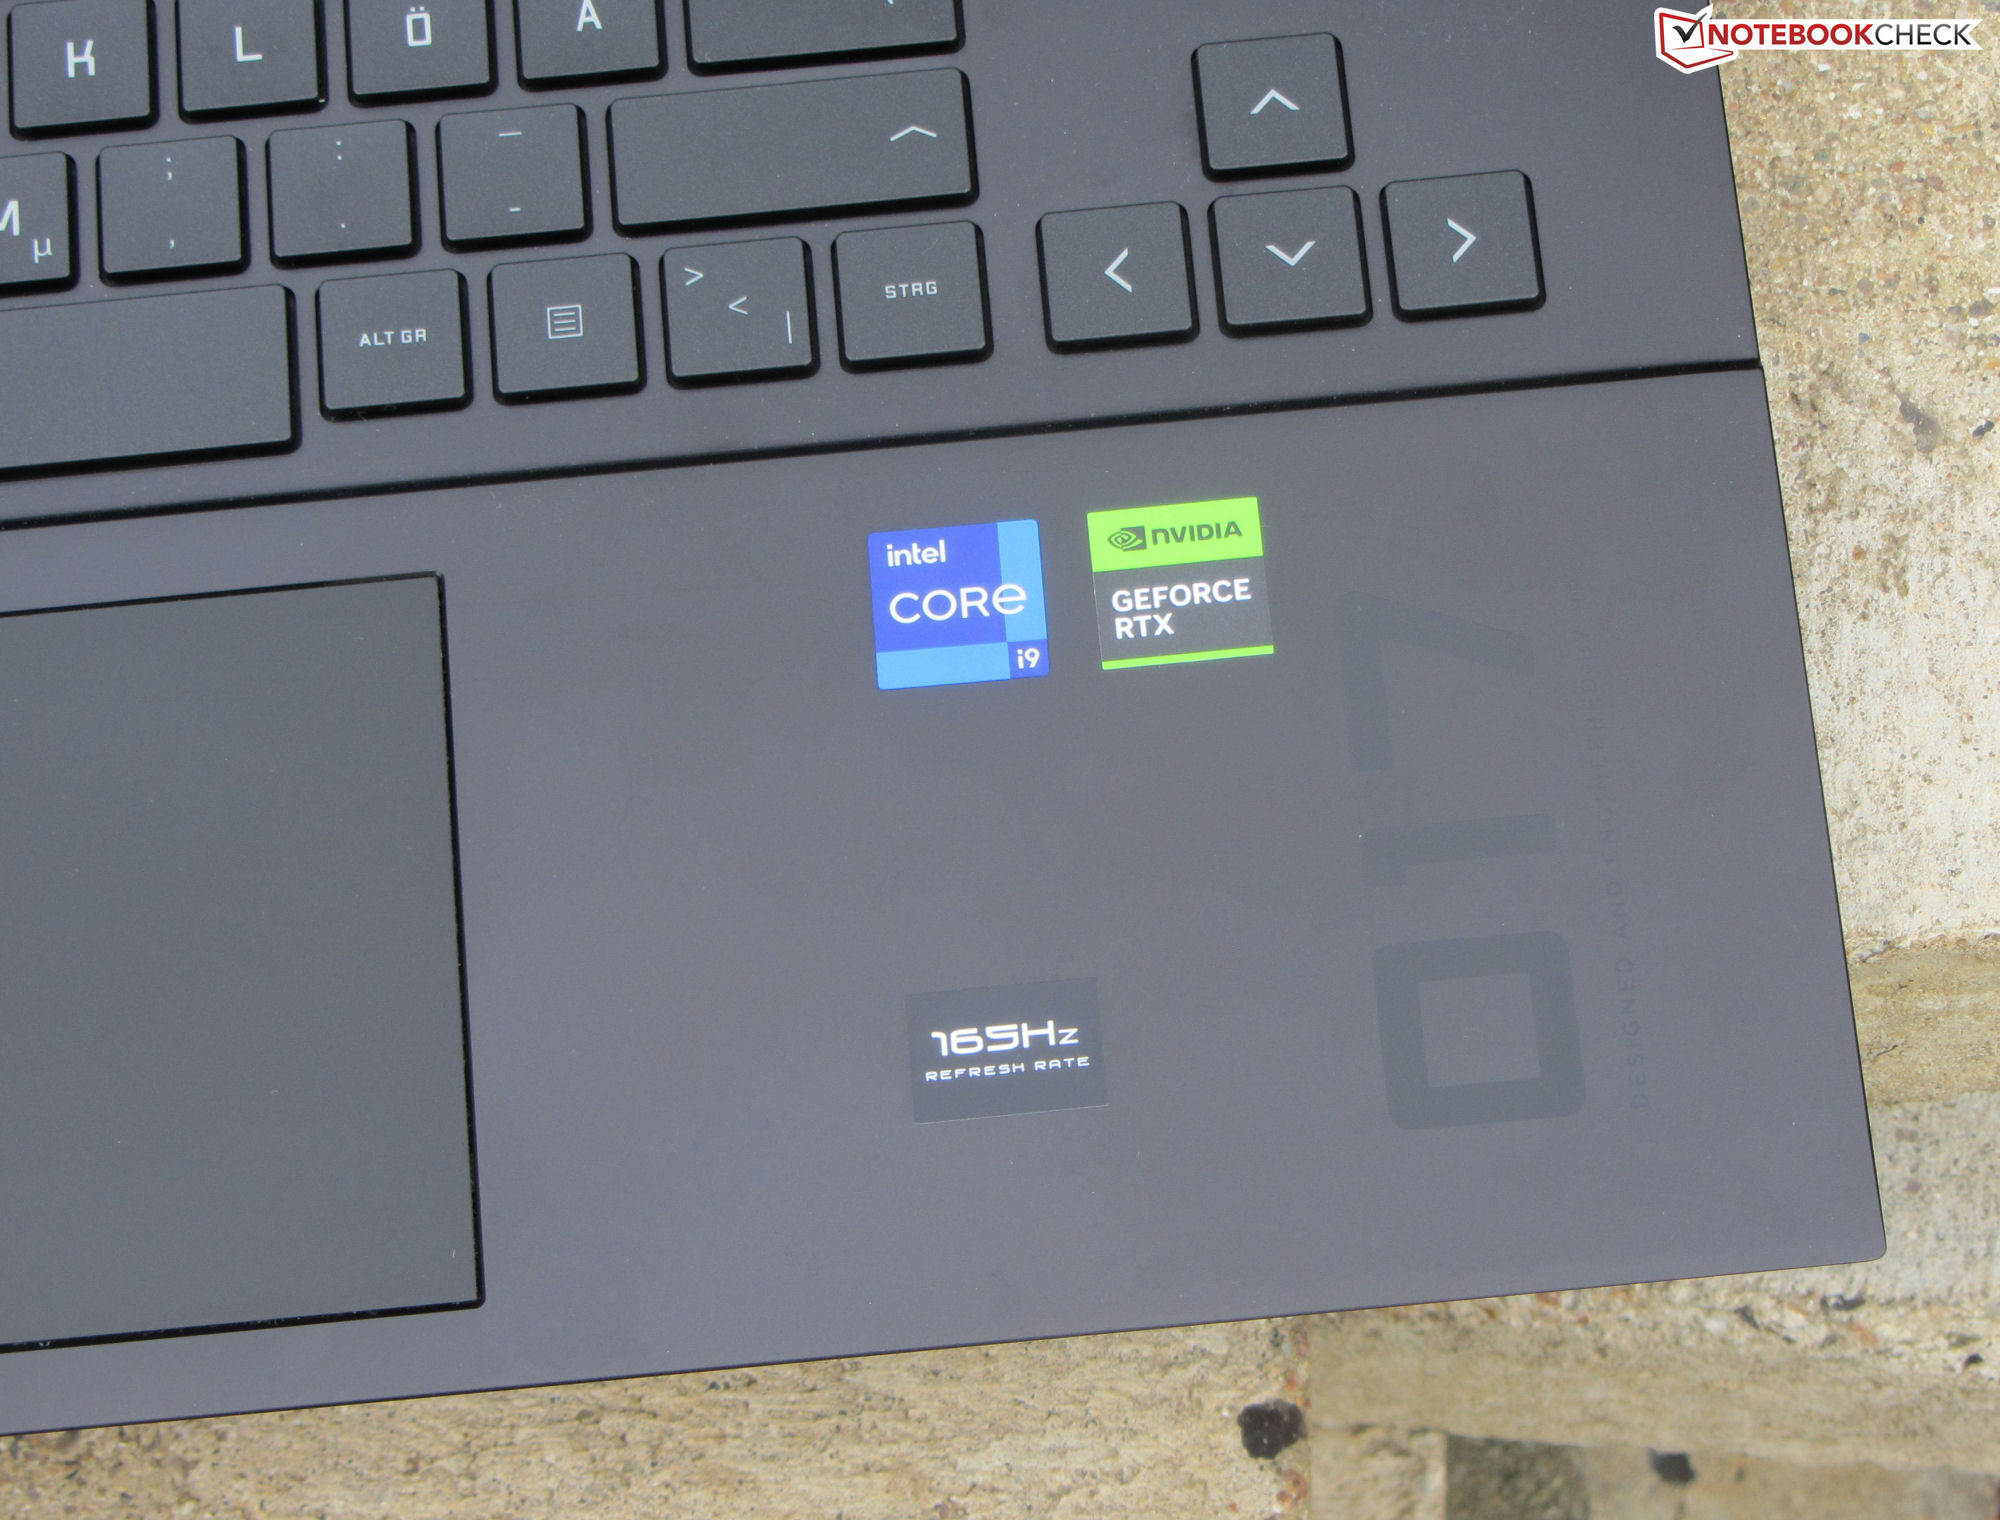
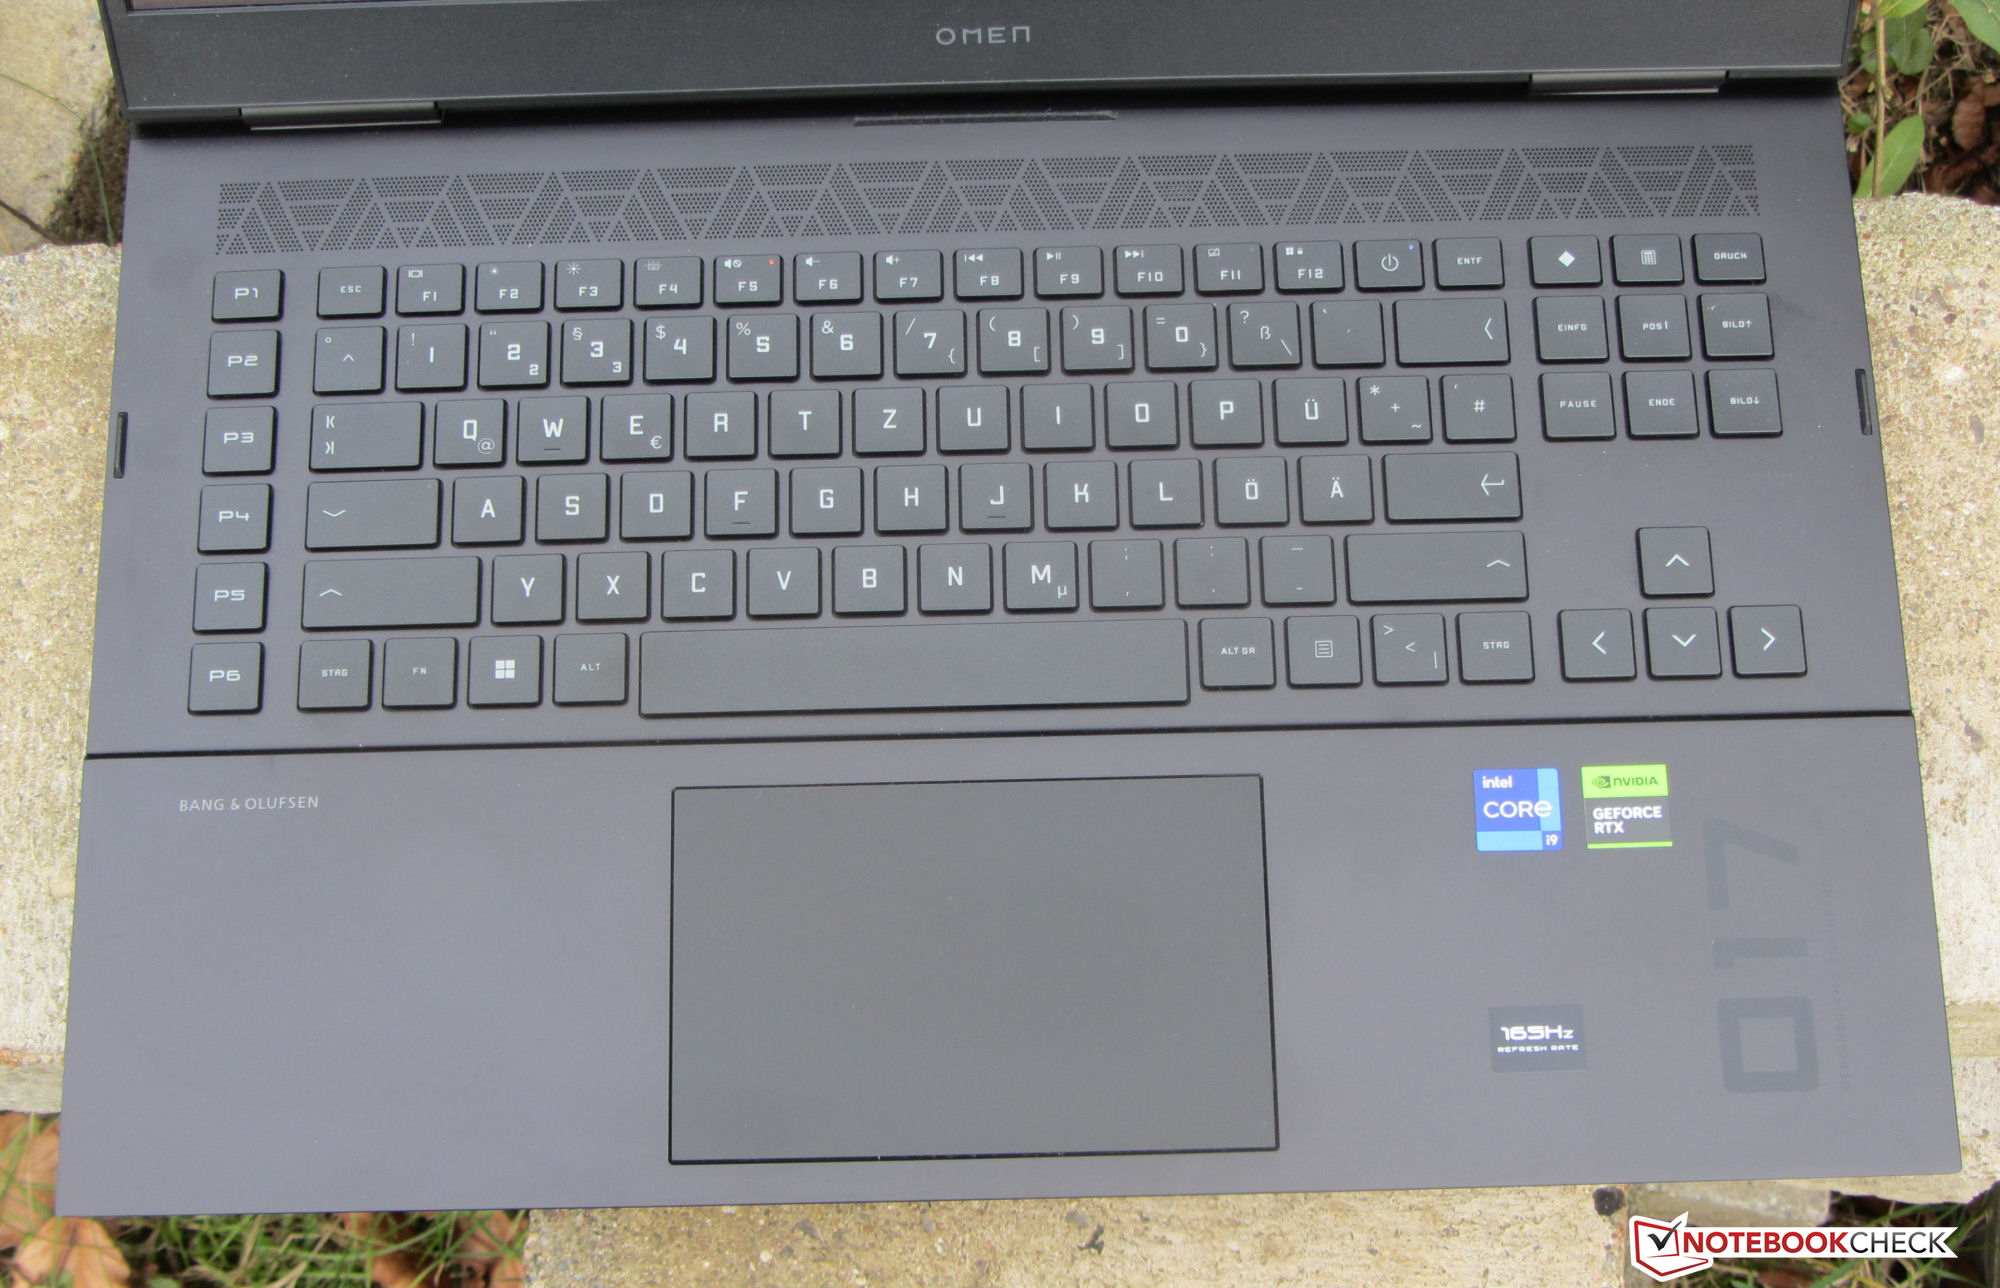
You can find information on the case, equipment, input devices, and speakers in our review of the predecessor model, which is identical in those regards.
Possible Competitors in Comparison
Rating | Date | Model | Weight | Height | Size | Resolution | Price |
|---|---|---|---|---|---|---|---|
| 85.4 % v7 (old) | 03 / 2023 | HP Omen 17-ck2097ng i9-13900HX, GeForce RTX 4080 Laptop GPU | 2.8 kg | 27 mm | 17.30" | 2560x1440 | |
| 86.1 % v7 (old) | 01 / 2023 | Alienware m17 R5 (R9 6900HX, RX 6850M XT) R9 6900HX, Radeon RX 6850M XT | 3.4 kg | 26.7 mm | 17.00" | 3840x2160 | |
| 91.2 % v7 (old) | 02 / 2023 | Razer Blade 16 Early 2023 i9-13950HX, GeForce RTX 4080 Laptop GPU | 2.4 kg | 21.99 mm | 16.00" | 2560x1600 | |
| 89.4 % v7 (old) | 02 / 2023 | Lenovo Legion Pro 7 16IRX8H i9-13900HX, GeForce RTX 4080 Laptop GPU | 2.7 kg | 26 mm | 16.00" | 2560x1600 | |
| 88.4 % v7 (old) | 03 / 2023 | Asus ROG Strix G16 G614JZ i9-13980HX, GeForce RTX 4080 Laptop GPU | 2.4 kg | 30.4 mm | 16.00" | 2560x1600 |


| SD Card Reader | |
| average JPG Copy Test (av. of 3 runs) | |
| Average of class Gaming (20.9 - 210, n=54, last 2 years) | |
| Razer Blade 16 Early 2023 (AV PRO microSD 128 GB V60) | |
| HP Omen 17-ck2097ng (AV PRO microSD 128 GB V60) | |
| maximum AS SSD Seq Read Test (1GB) | |
| Razer Blade 16 Early 2023 (AV PRO microSD 128 GB V60) | |
| Average of class Gaming (25.5 - 261, n=51, last 2 years) | |
| HP Omen 17-ck2097ng (AV PRO microSD 128 GB V60) | |


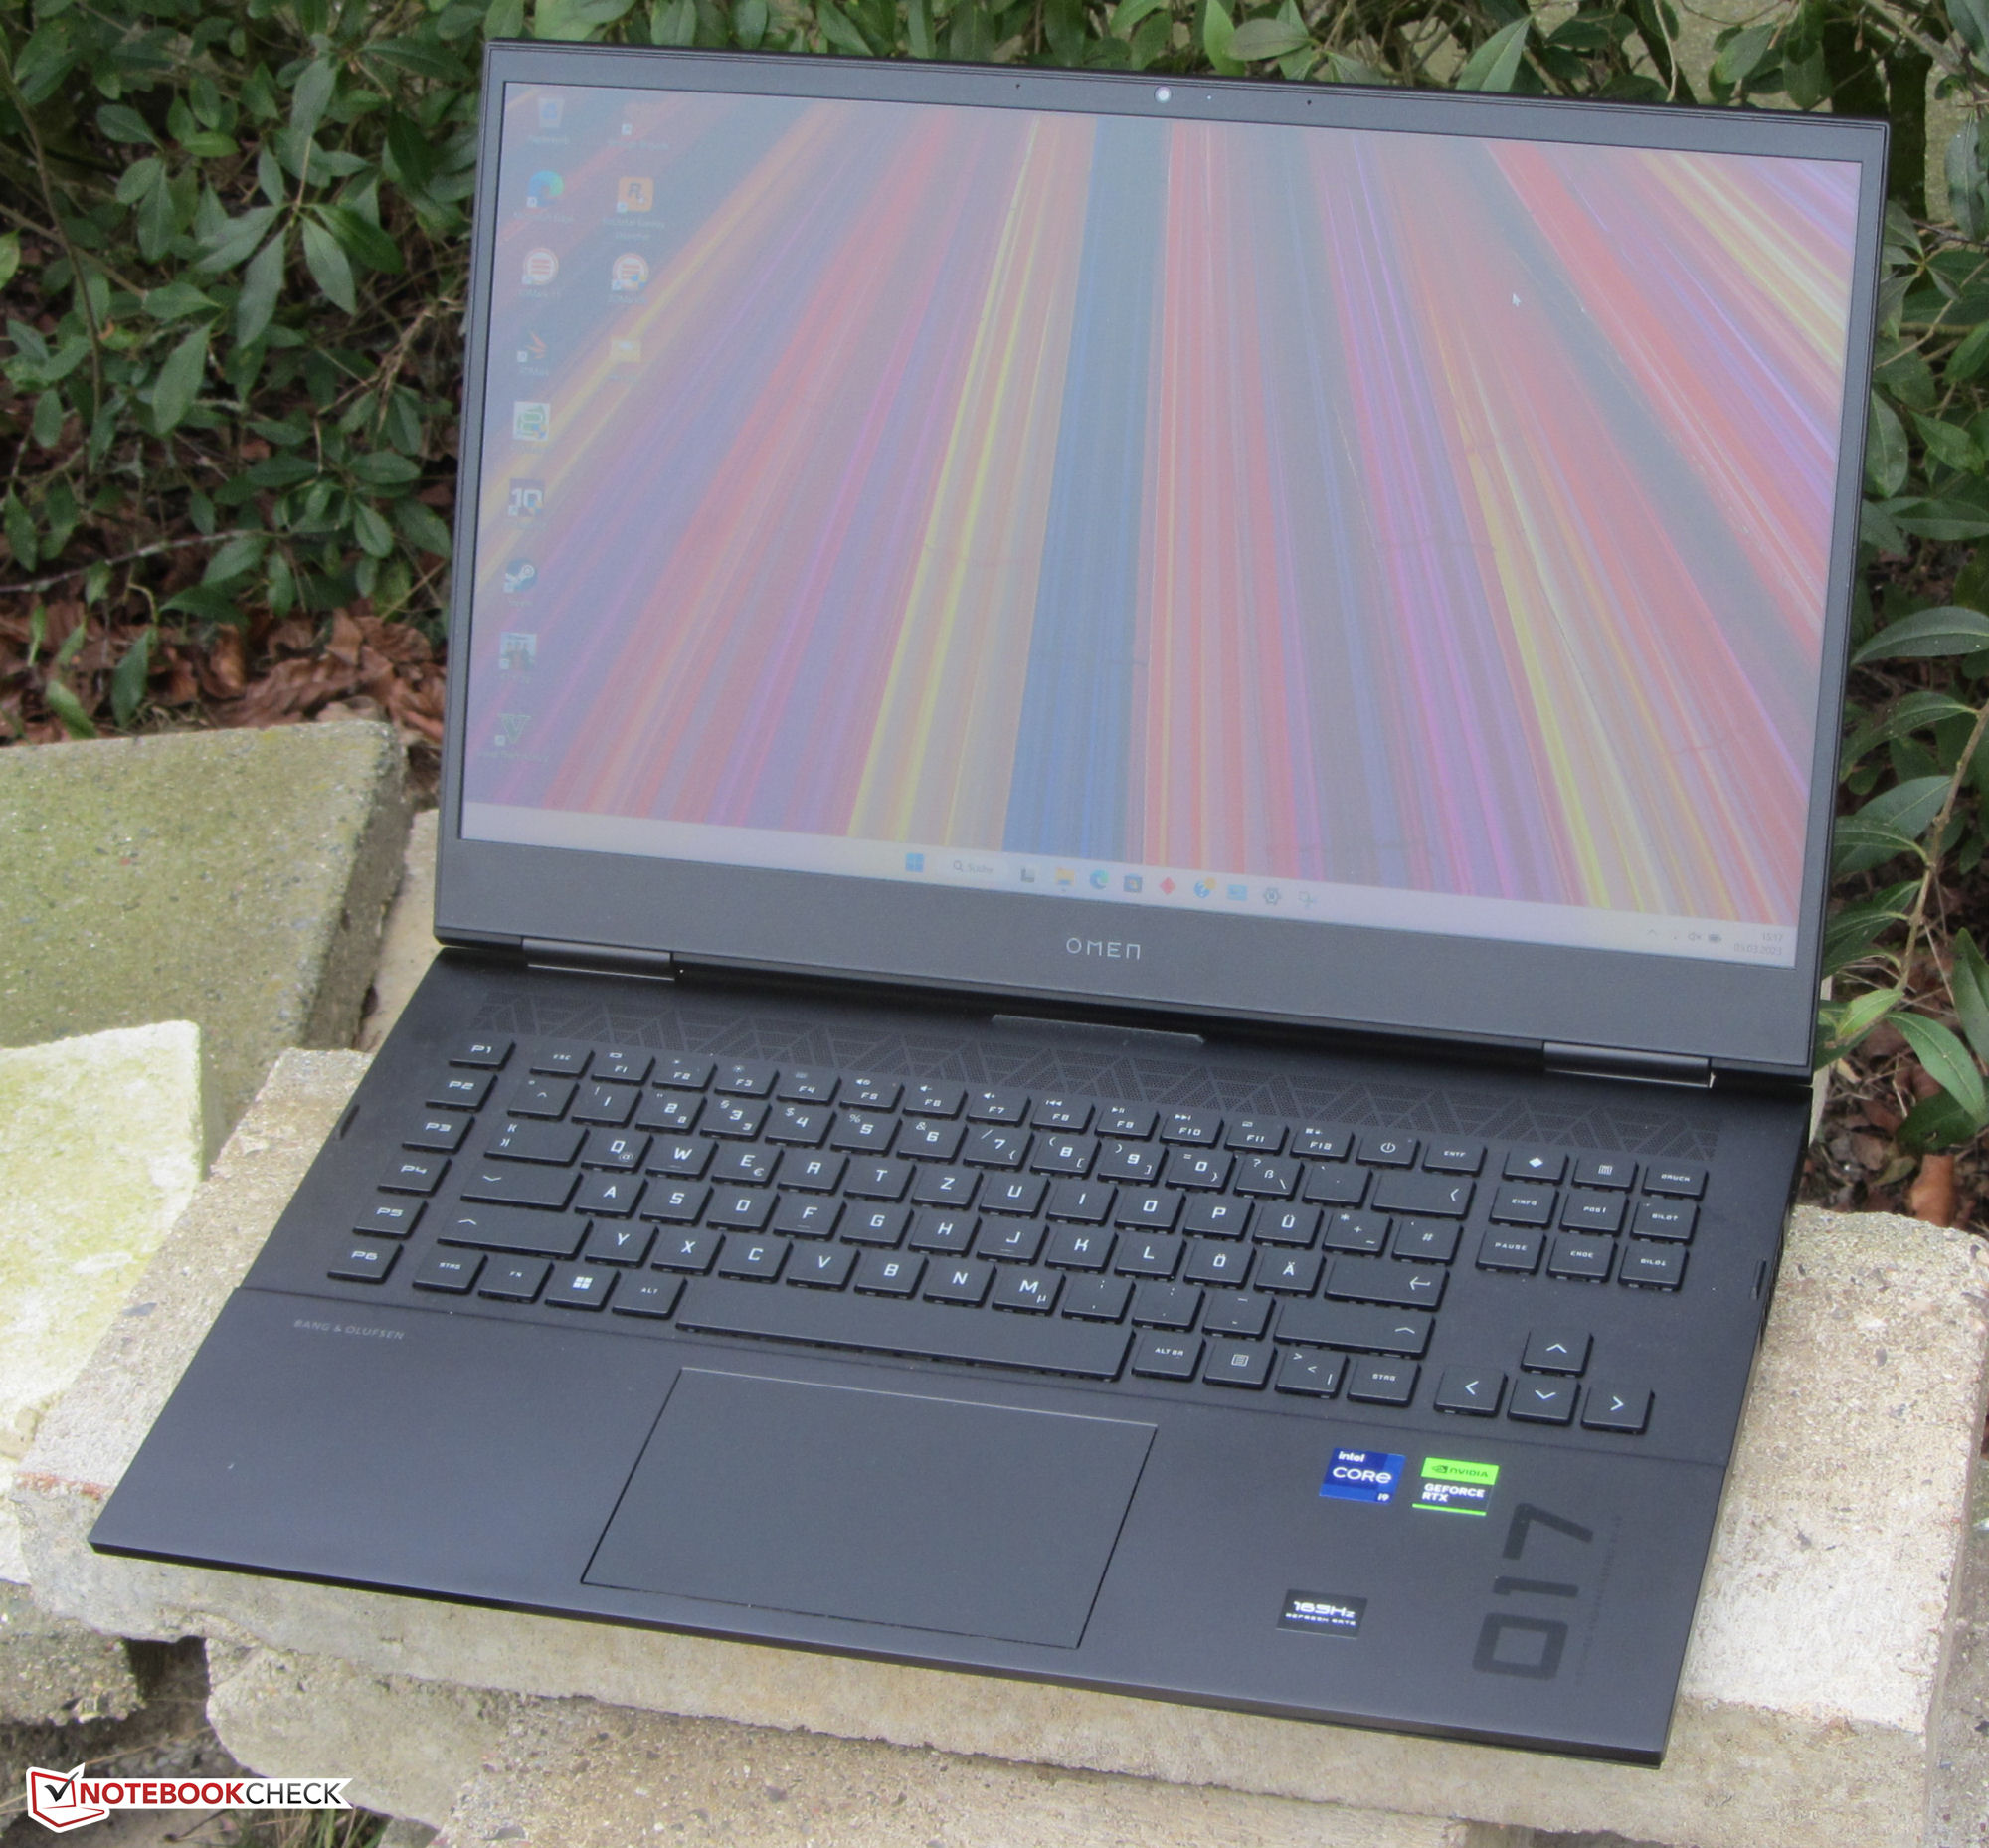
Display - QHD including sRGB coverage
While at this point many competitors prefer to use 16:10 displays, HP remains faithful to the 16:9 format in the Omen. A positive trait is that the responsive 165-Hz panel doesn't show any PWM flickering at any brightness level.
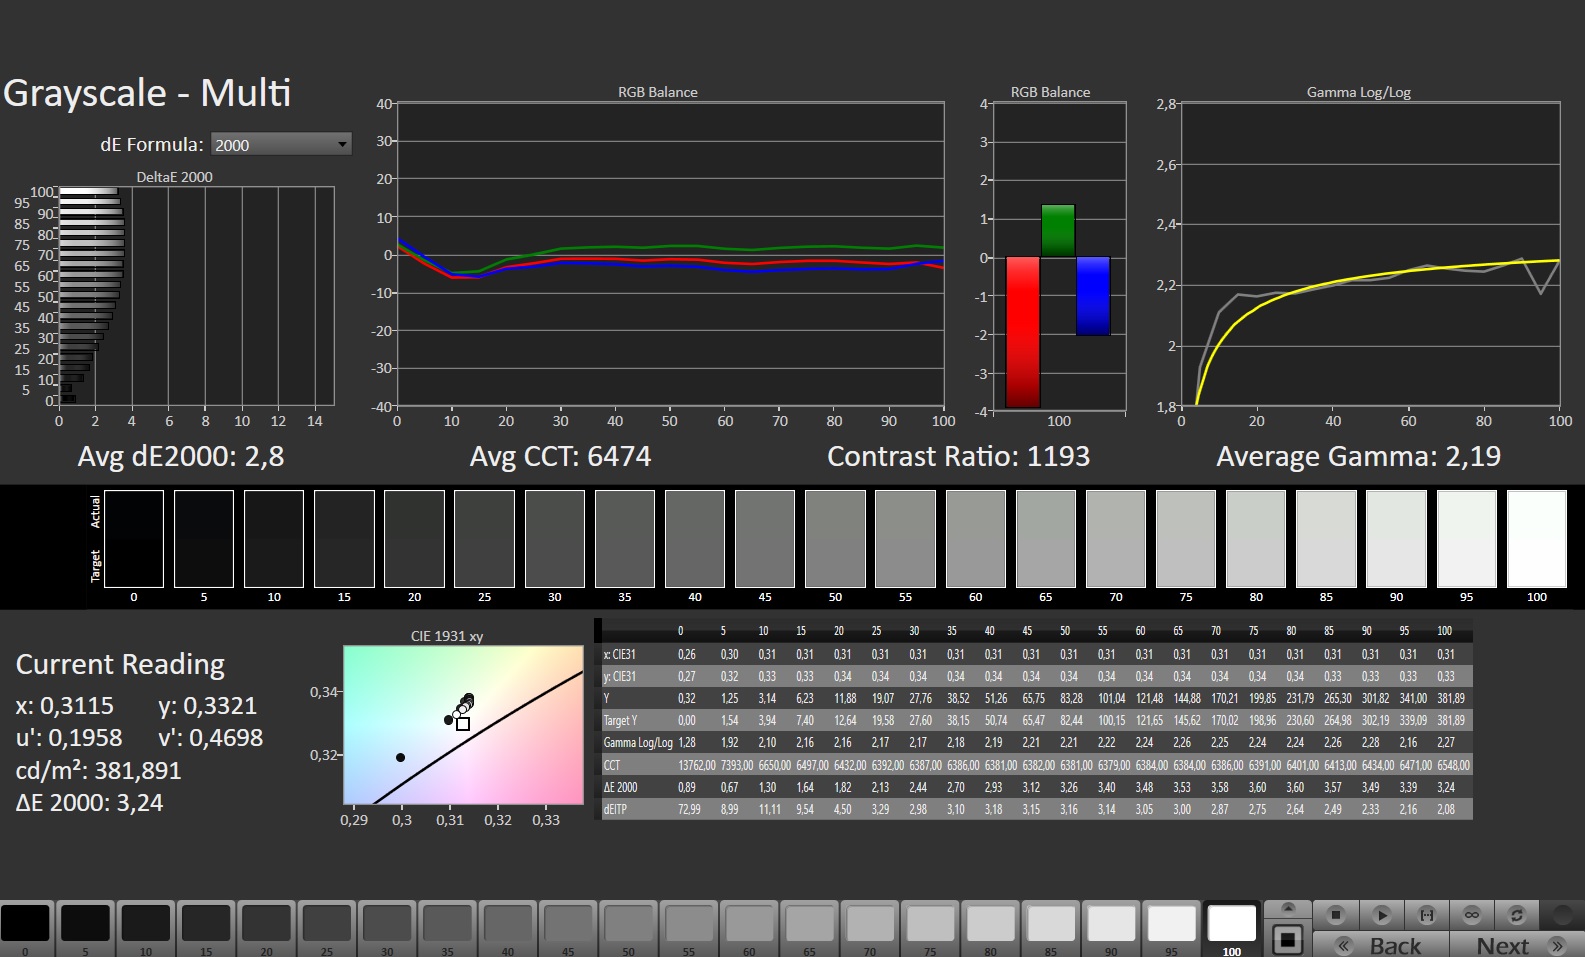
The brightness and contrast of the matte 17.3-inch display (2,560 x 1,440 pixels) fulfill the requirements (> 300 cd/m² and 1,000:1). However, the Omen display offers the lowest brightness among the displays from our competitors. The Legion 7 Pro has the brightest panel here.
| |||||||||||||||||||||||||
Brightness Distribution: 90 %
Center on Battery: 371 cd/m²
Contrast: 1159:1 (Black: 0.32 cd/m²)
ΔE ColorChecker Calman: 1.74 | ∀{0.5-29.43 Ø4.72}
calibrated: 1.01
ΔE Greyscale Calman: 2.8 | ∀{0.09-98 Ø4.97}
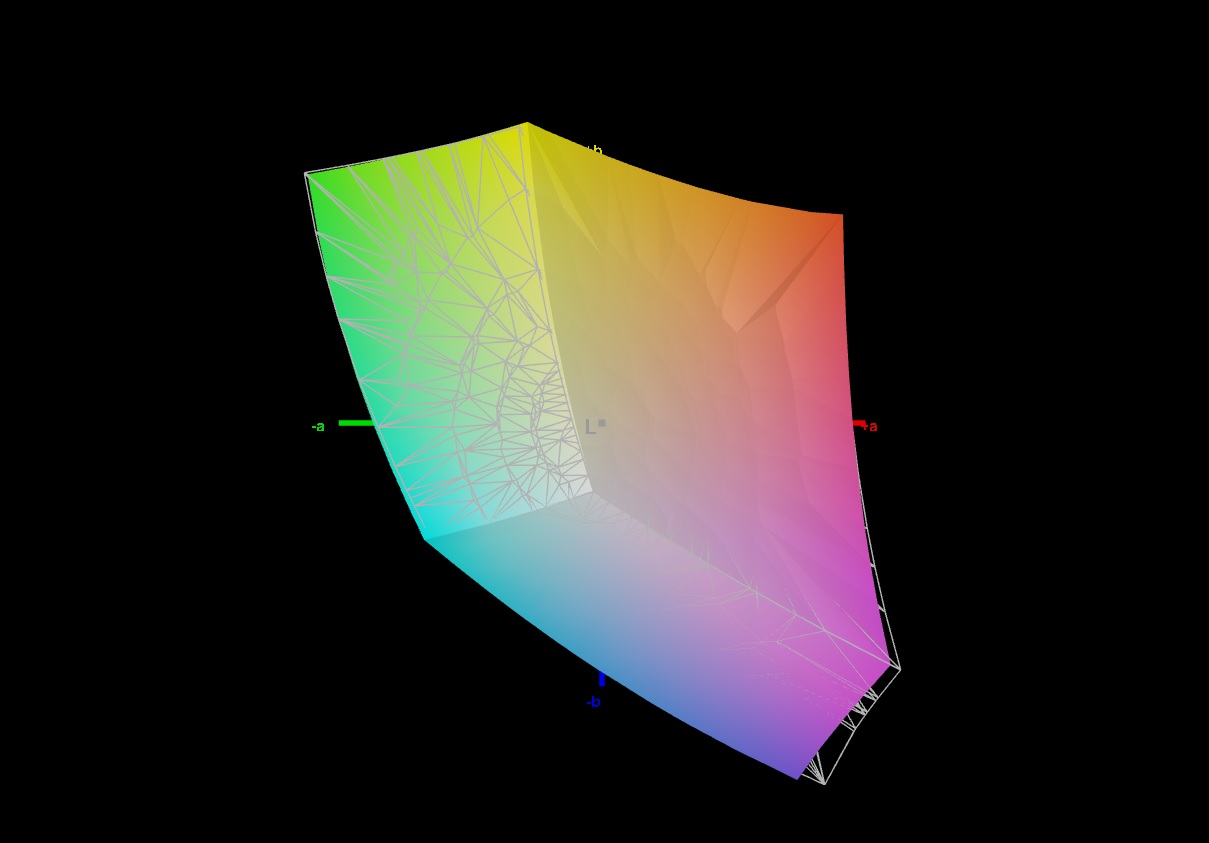
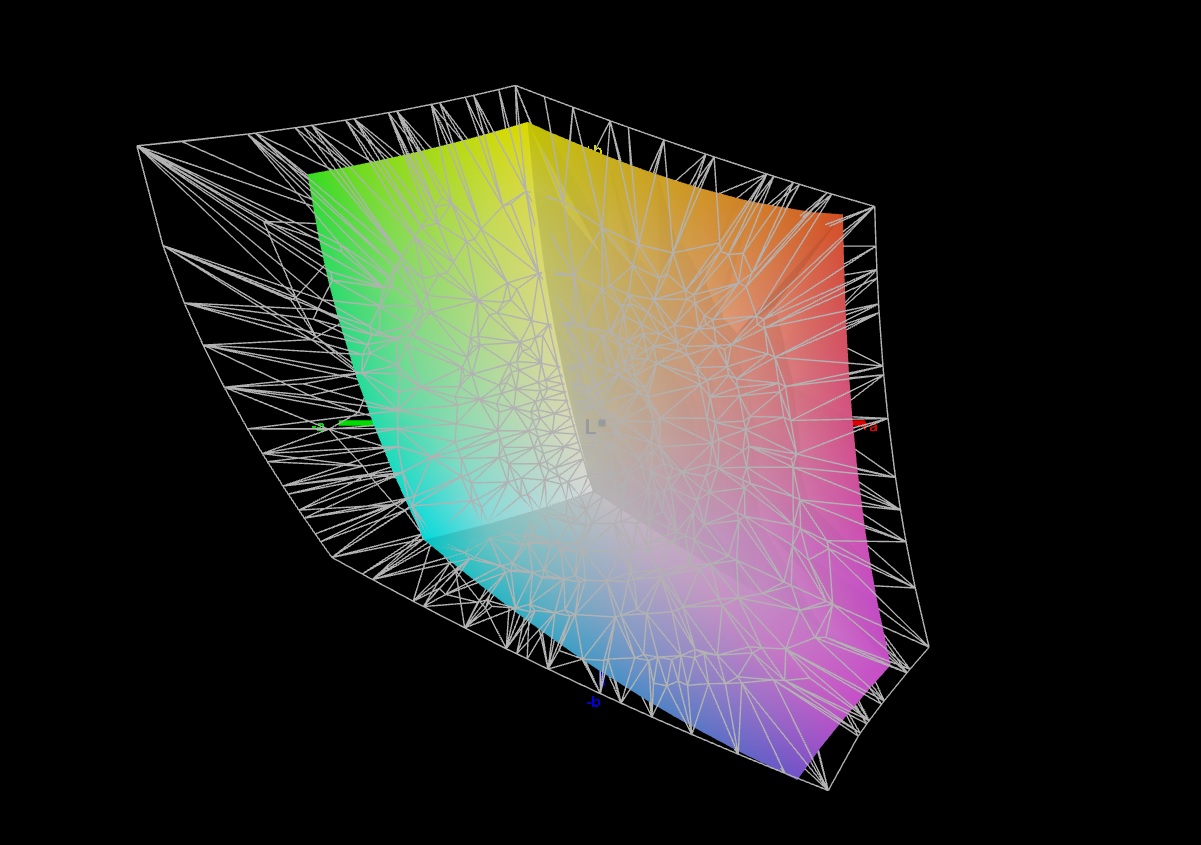
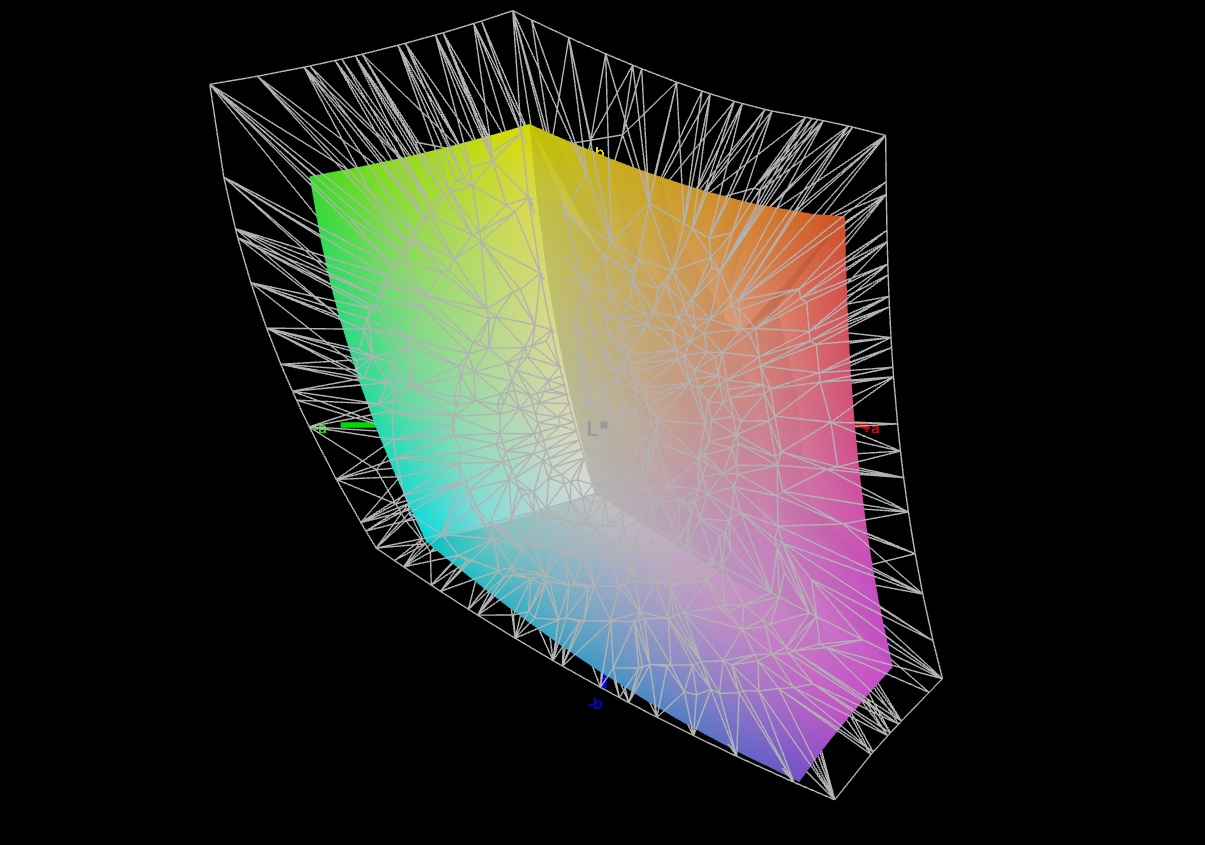
69.6% AdobeRGB 1998 (Argyll 3D)
97.6% sRGB (Argyll 3D)
67.4% Display P3 (Argyll 3D)
Gamma: 2.19
CCT: 6474 K
| HP Omen 17-ck2097ng BOE BOE09BF, IPS, 2560x1440, 17.3" | Alienware m17 R5 (R9 6900HX, RX 6850M XT) AU Optronics AUODBA3, IPS, 3840x2160, 17" | Razer Blade 16 Early 2023 CSOT T3 MNG007DA4-1, IPS, 2560x1600, 16" | Lenovo Legion Pro 7 16IRX8H MNG007DA2-3 (CSO1628), IPS, 2560x1600, 16" | Asus ROG Strix G16 G614JZ TL160ADMP03-0, IPS, 2560x1600, 16" | HP Omen 17-ck1075ng BOE09EE, IPS, 1920x1080, 17.3" | |
|---|---|---|---|---|---|---|
| Display | 24% | 26% | 2% | 23% | -11% | |
| Display P3 Coverage (%) | 67.4 | 97.2 44% | 98.5 46% | 69.1 3% | 97 44% | 59.03 -12% |
| sRGB Coverage (%) | 97.6 | 99.6 2% | 100 2% | 99.7 2% | 99.9 2% | 87.46 -10% |
| AdobeRGB 1998 Coverage (%) | 69.6 | 88.4 27% | 89.7 29% | 71.2 2% | 84.9 22% | 61.04 -12% |
| Response Times | -18% | 12% | 28% | 47% | -1% | |
| Response Time Grey 50% / Grey 80% * (ms) | 15.6 ? | 16.4 ? -5% | 6.6 ? 58% | 12.3 ? 21% | 5.1 ? 67% | 14 ? 10% |
| Response Time Black / White * (ms) | 8.9 ? | 11.6 ? -30% | 12 ? -35% | 5.9 ? 34% | 6.6 ? 26% | 10 ? -12% |
| PWM Frequency (Hz) | 100 ? | |||||
| Screen | -88% | -12% | 25% | 3% | -15% | |
| Brightness middle (cd/m²) | 371 | 484 30% | 456.8 23% | 511 38% | 470 27% | 321 -13% |
| Brightness (cd/m²) | 350 | 449 28% | 437 25% | 469 34% | 459 31% | 302 -14% |
| Brightness Distribution (%) | 90 | 87 -3% | 83 -8% | 86 -4% | 93 3% | 84 -7% |
| Black Level * (cd/m²) | 0.32 | 0.55 -72% | 0.35 -9% | 0.4 -25% | 0.42 -31% | 0.41 -28% |
| Contrast (:1) | 1159 | 880 -24% | 1305 13% | 1278 10% | 1119 -3% | 783 -32% |
| Colorchecker dE 2000 * | 1.74 | 4.8 -176% | 3.7 -113% | 0.95 45% | 1.86 -7% | 1.62 7% |
| Colorchecker dE 2000 max. * | 3.59 | 7.48 -108% | 6.42 -79% | 2.07 42% | 3.87 -8% | 4.08 -14% |
| Colorchecker dE 2000 calibrated * | 1.01 | 4.74 -369% | 0.66 35% | 0.91 10% | 0.93 8% | 1.93 -91% |
| Greyscale dE 2000 * | 2.8 | 5.5 -96% | 2.6 7% | 0.6 79% | 2.7 4% | 1.24 56% |
| Gamma | 2.19 100% | 2.42 91% | 2.3 96% | 2.176 101% | 2.246 98% | 2.41 91% |
| CCT | 6474 100% | 6148 106% | 6108 106% | 6545 99% | 6711 97% | 6261 104% |
| Total Average (Program / Settings) | -27% /
-54% | 9% /
-0% | 18% /
21% | 24% /
13% | -9% /
-12% |
* ... smaller is better
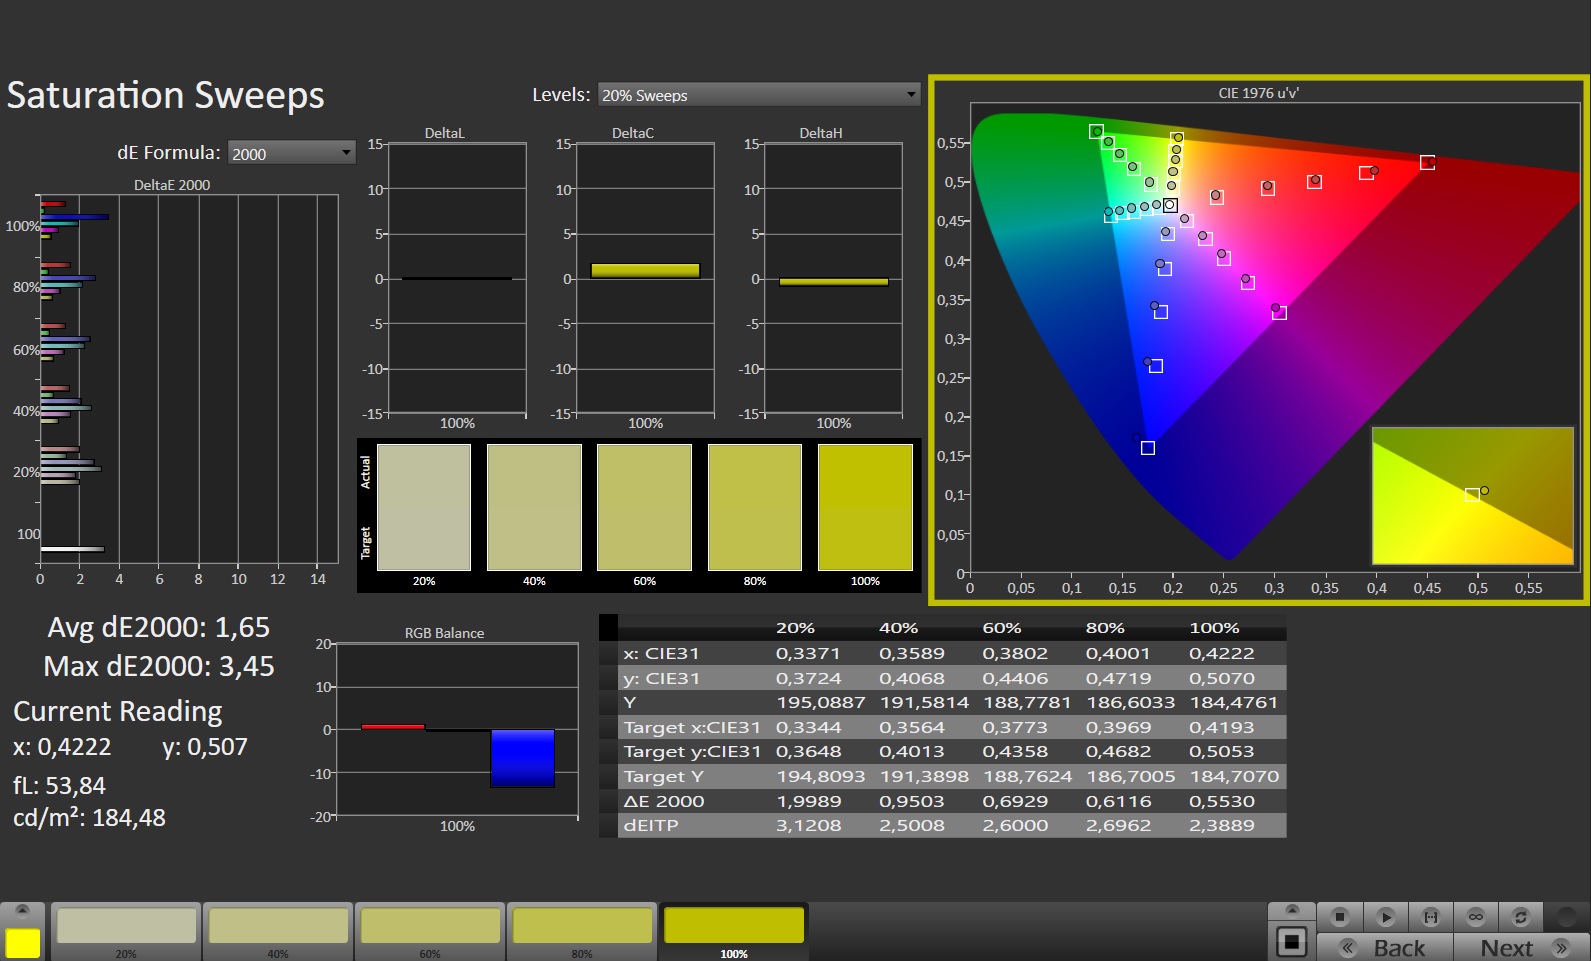
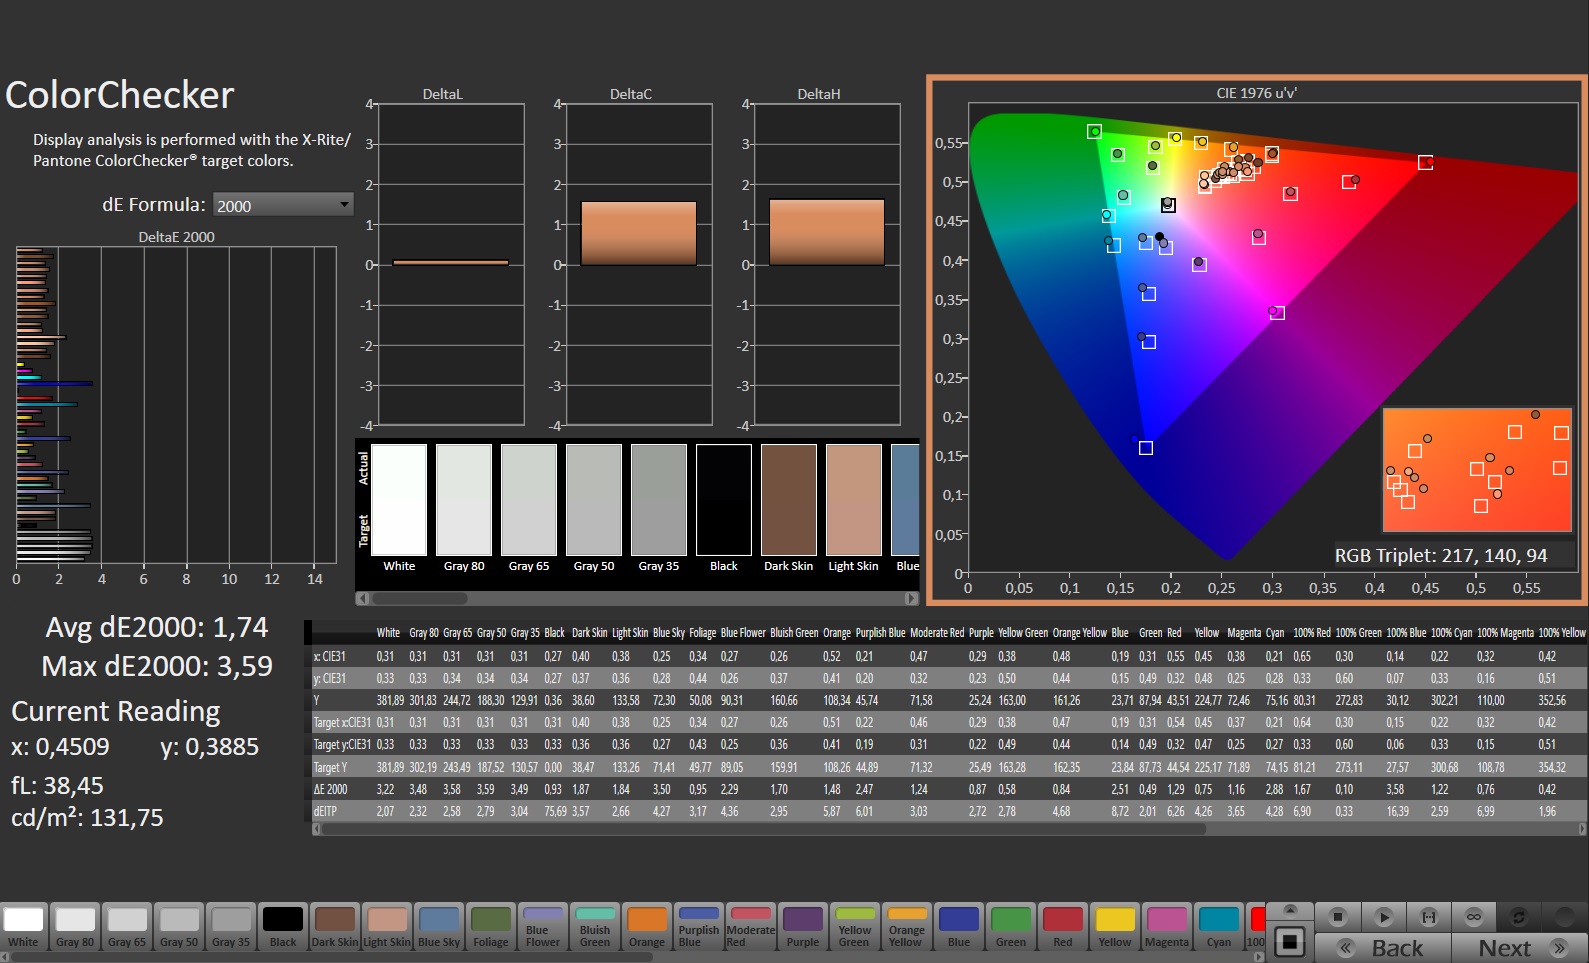
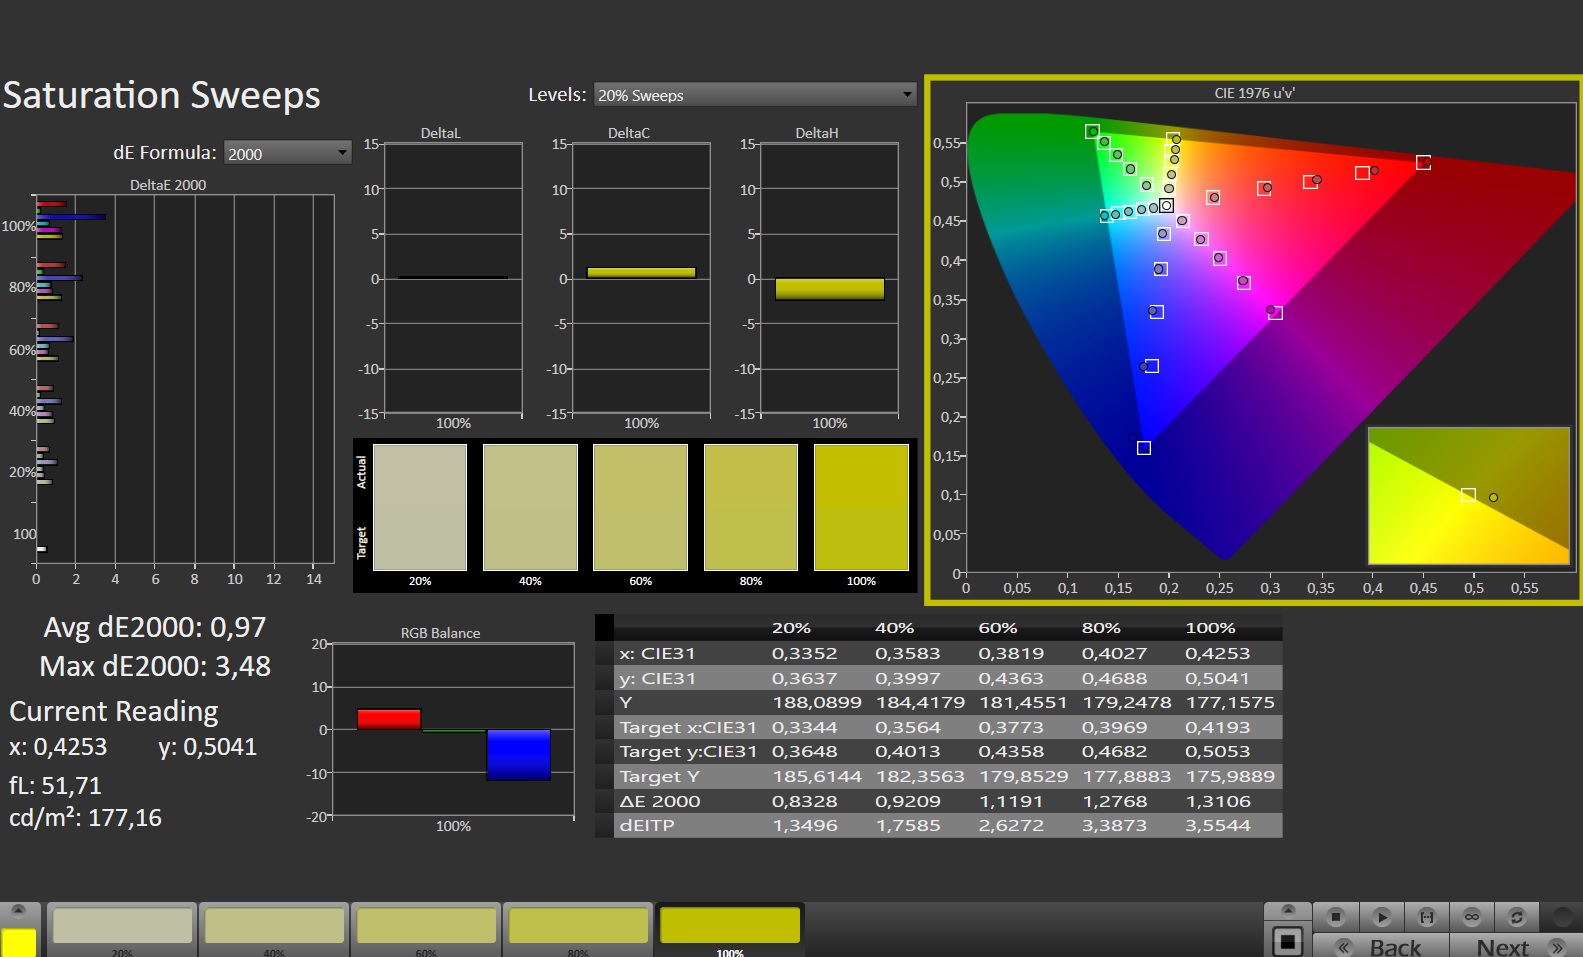
In the state of delivery, the color reproduction is already very good, and it can be further improved with a calibration, which causes the color deviation to drop from 1.74 to 1 (target value < 3). In addition, the grayscale is then also reproduced more evenly.
The display is able to cover the sRGB color space almost completely, but not the AdobeRGB and DCI-P3 color spaces. The displays of most competitors perform better here, with only the panel of the Legion ranging at the same level.


Display Response Times
| ↔ Response Time Black to White | ||
|---|---|---|
| 8.9 ms ... rise ↗ and fall ↘ combined | ↗ 3.7 ms rise | 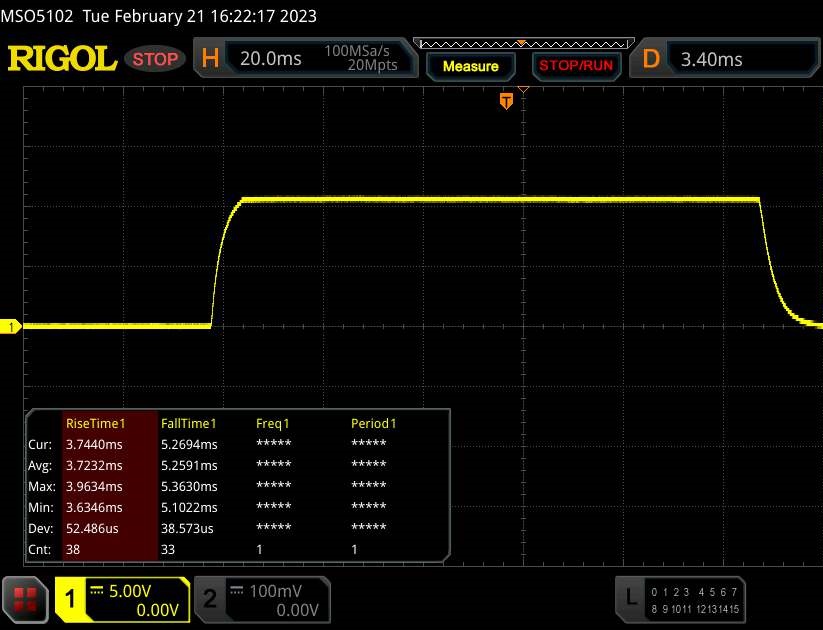 |
| ↘ 5.2 ms fall | ||
| The screen shows fast response rates in our tests and should be suited for gaming. In comparison, all tested devices range from 0.1 (minimum) to 240 (maximum) ms. » 25 % of all devices are better. This means that the measured response time is better than the average of all tested devices (19.8 ms). | ||
| ↔ Response Time 50% Grey to 80% Grey | ||
| 15.6 ms ... rise ↗ and fall ↘ combined | ↗ 7.3 ms rise | 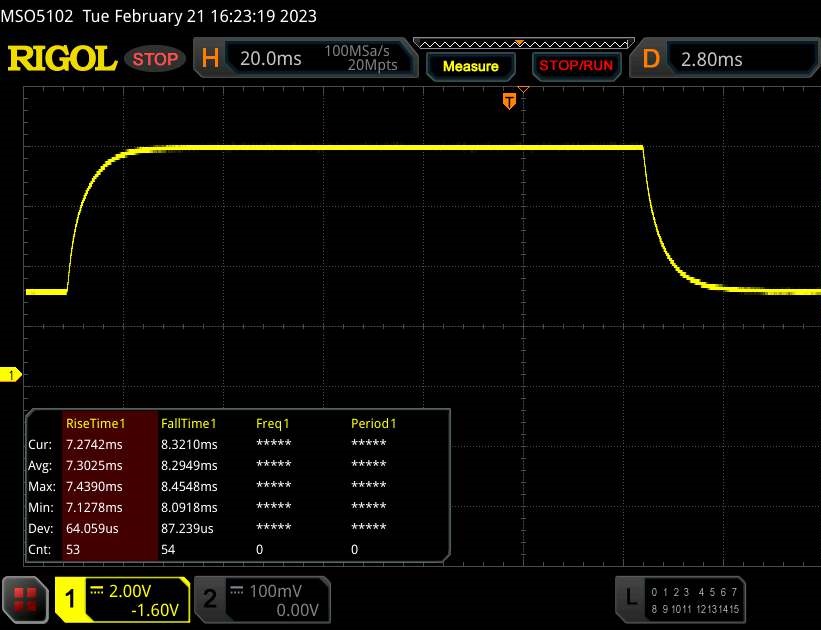 |
| ↘ 8.3 ms fall | ||
| The screen shows good response rates in our tests, but may be too slow for competitive gamers. In comparison, all tested devices range from 0.165 (minimum) to 636 (maximum) ms. » 30 % of all devices are better. This means that the measured response time is better than the average of all tested devices (31 ms). | ||
Screen Flickering / PWM (Pulse-Width Modulation)
| Screen flickering / PWM not detected |  | ||
In comparison: 52 % of all tested devices do not use PWM to dim the display. If PWM was detected, an average of 7769 (minimum: 5 - maximum: 343500) Hz was measured. | |||
The viewing angles of the IPS panel are stable, so it can be read from any viewing angle. The display can be read outdoors, as long as there is no direct sunlight.

Performance - The HP laptop offers powerful hardware
With the Omen 17, Hewlett Packard offers a 17.3-inch laptop that is targeted for QHD gaming but also strikes a good figure in other application areas that require a high performance. The necessary computing performance is provided by Raptor Lake and Ada Lovelace chips. Our test unit of the Omen is available for about 3,300 Euros (~$3,582).
Test Conditions
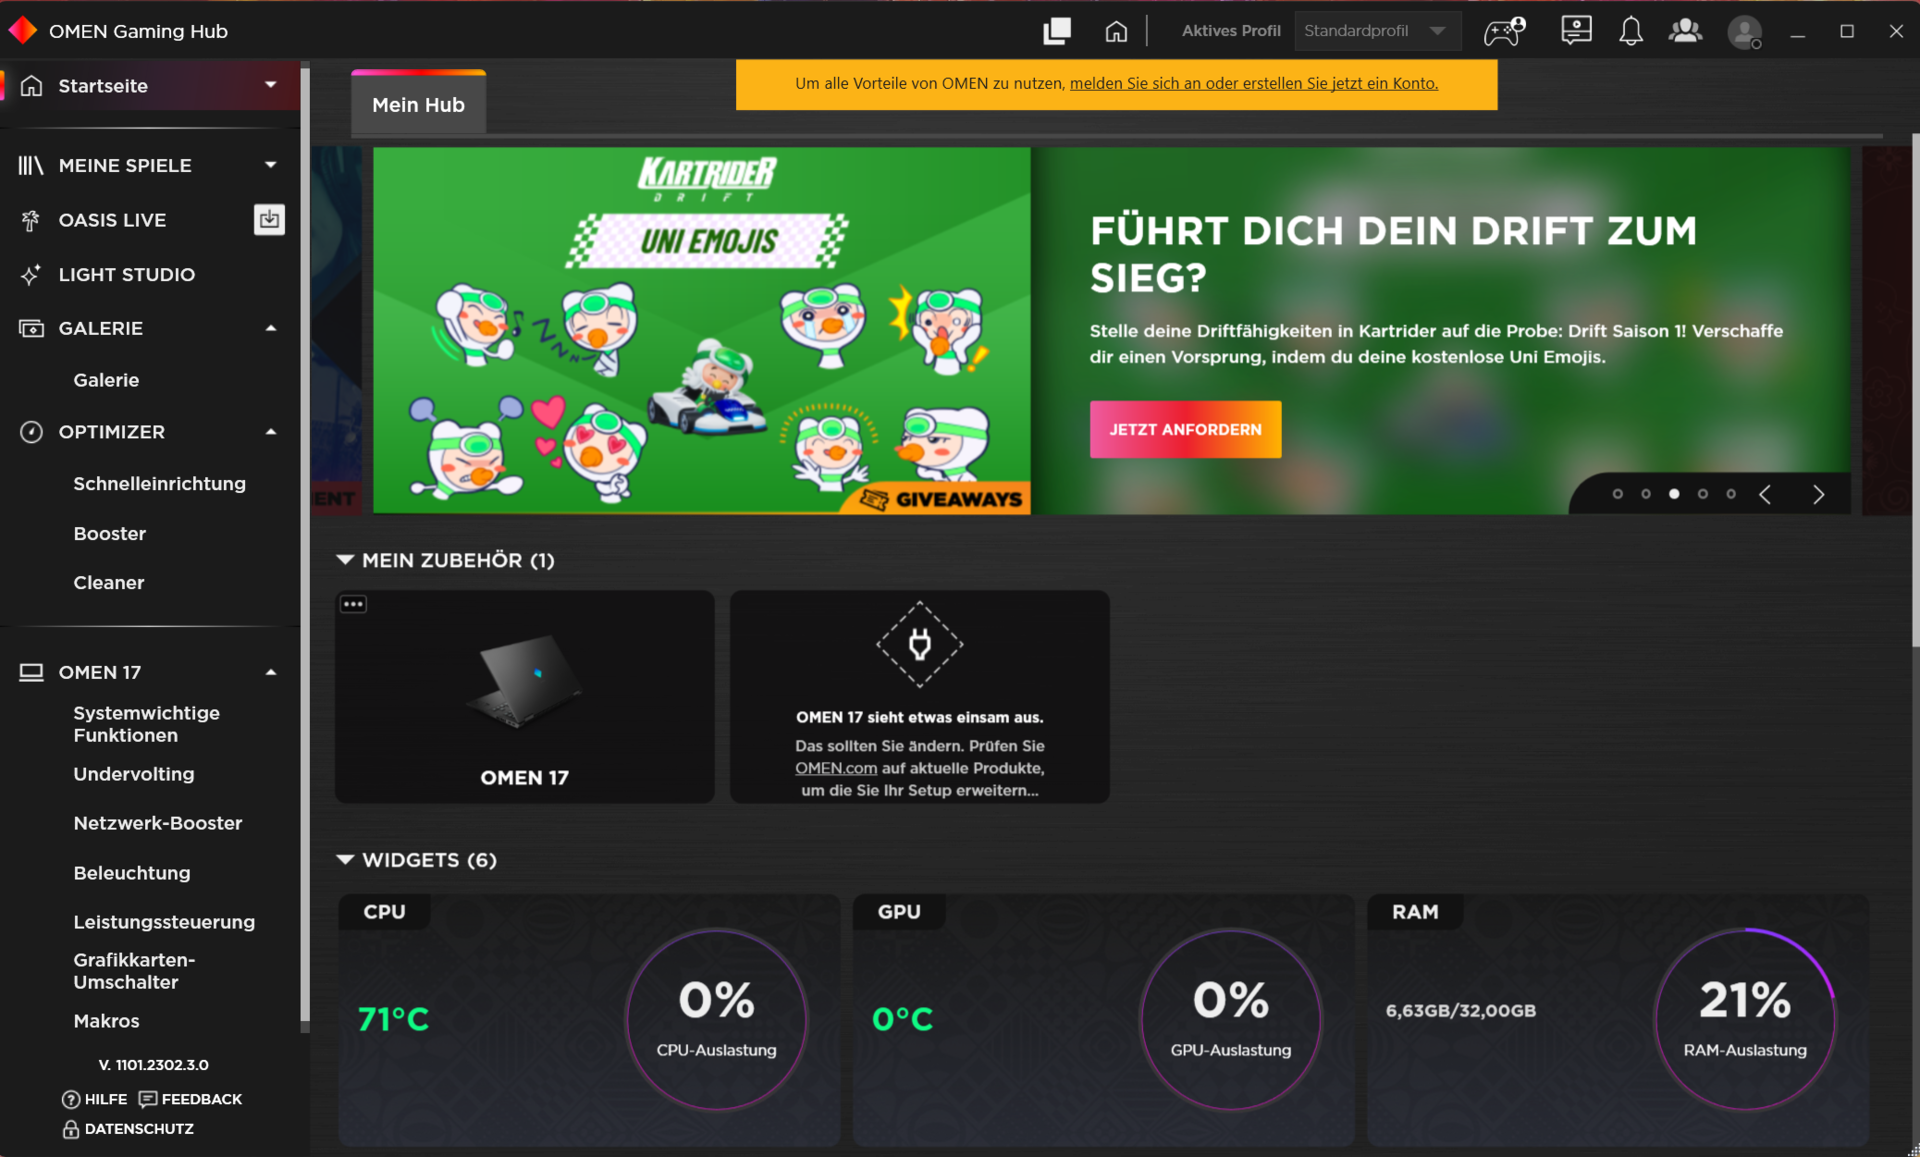
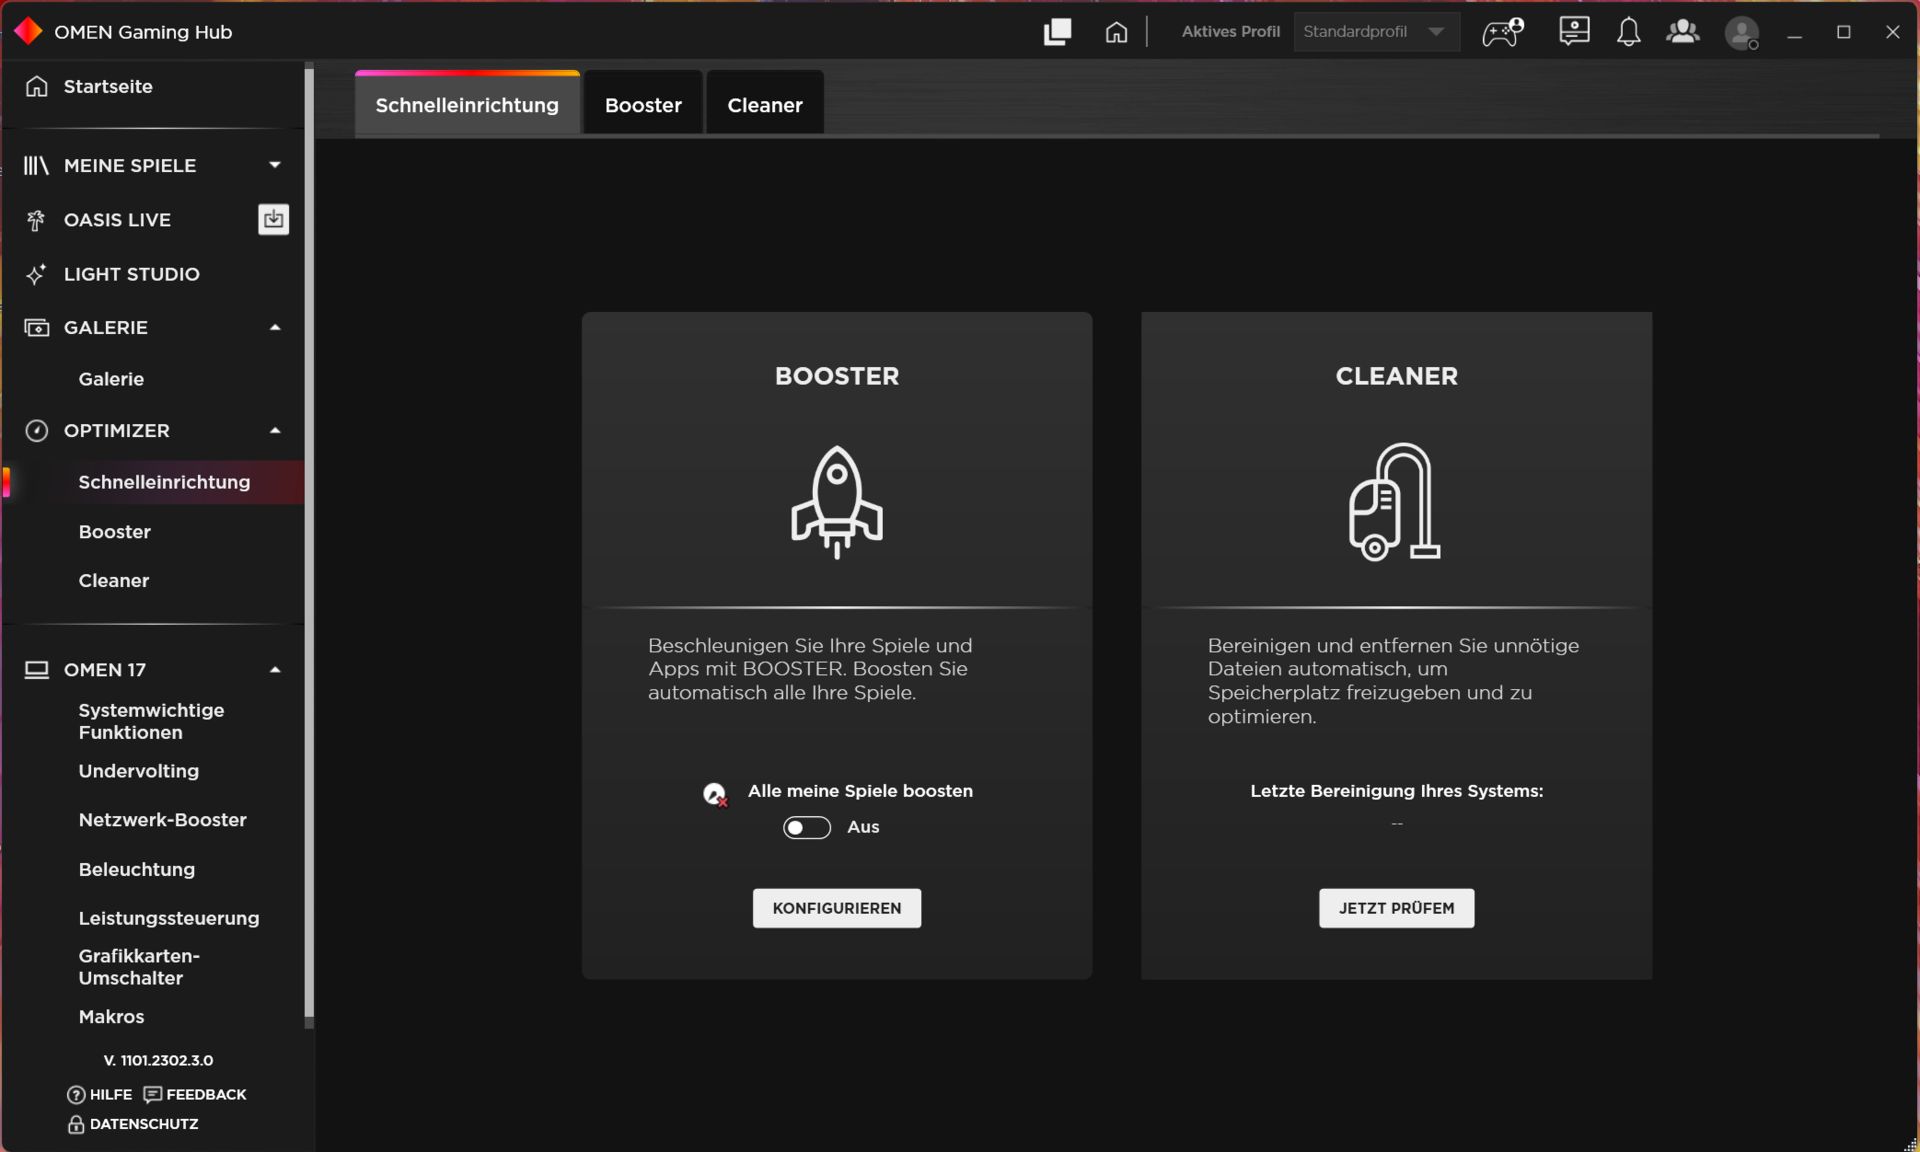
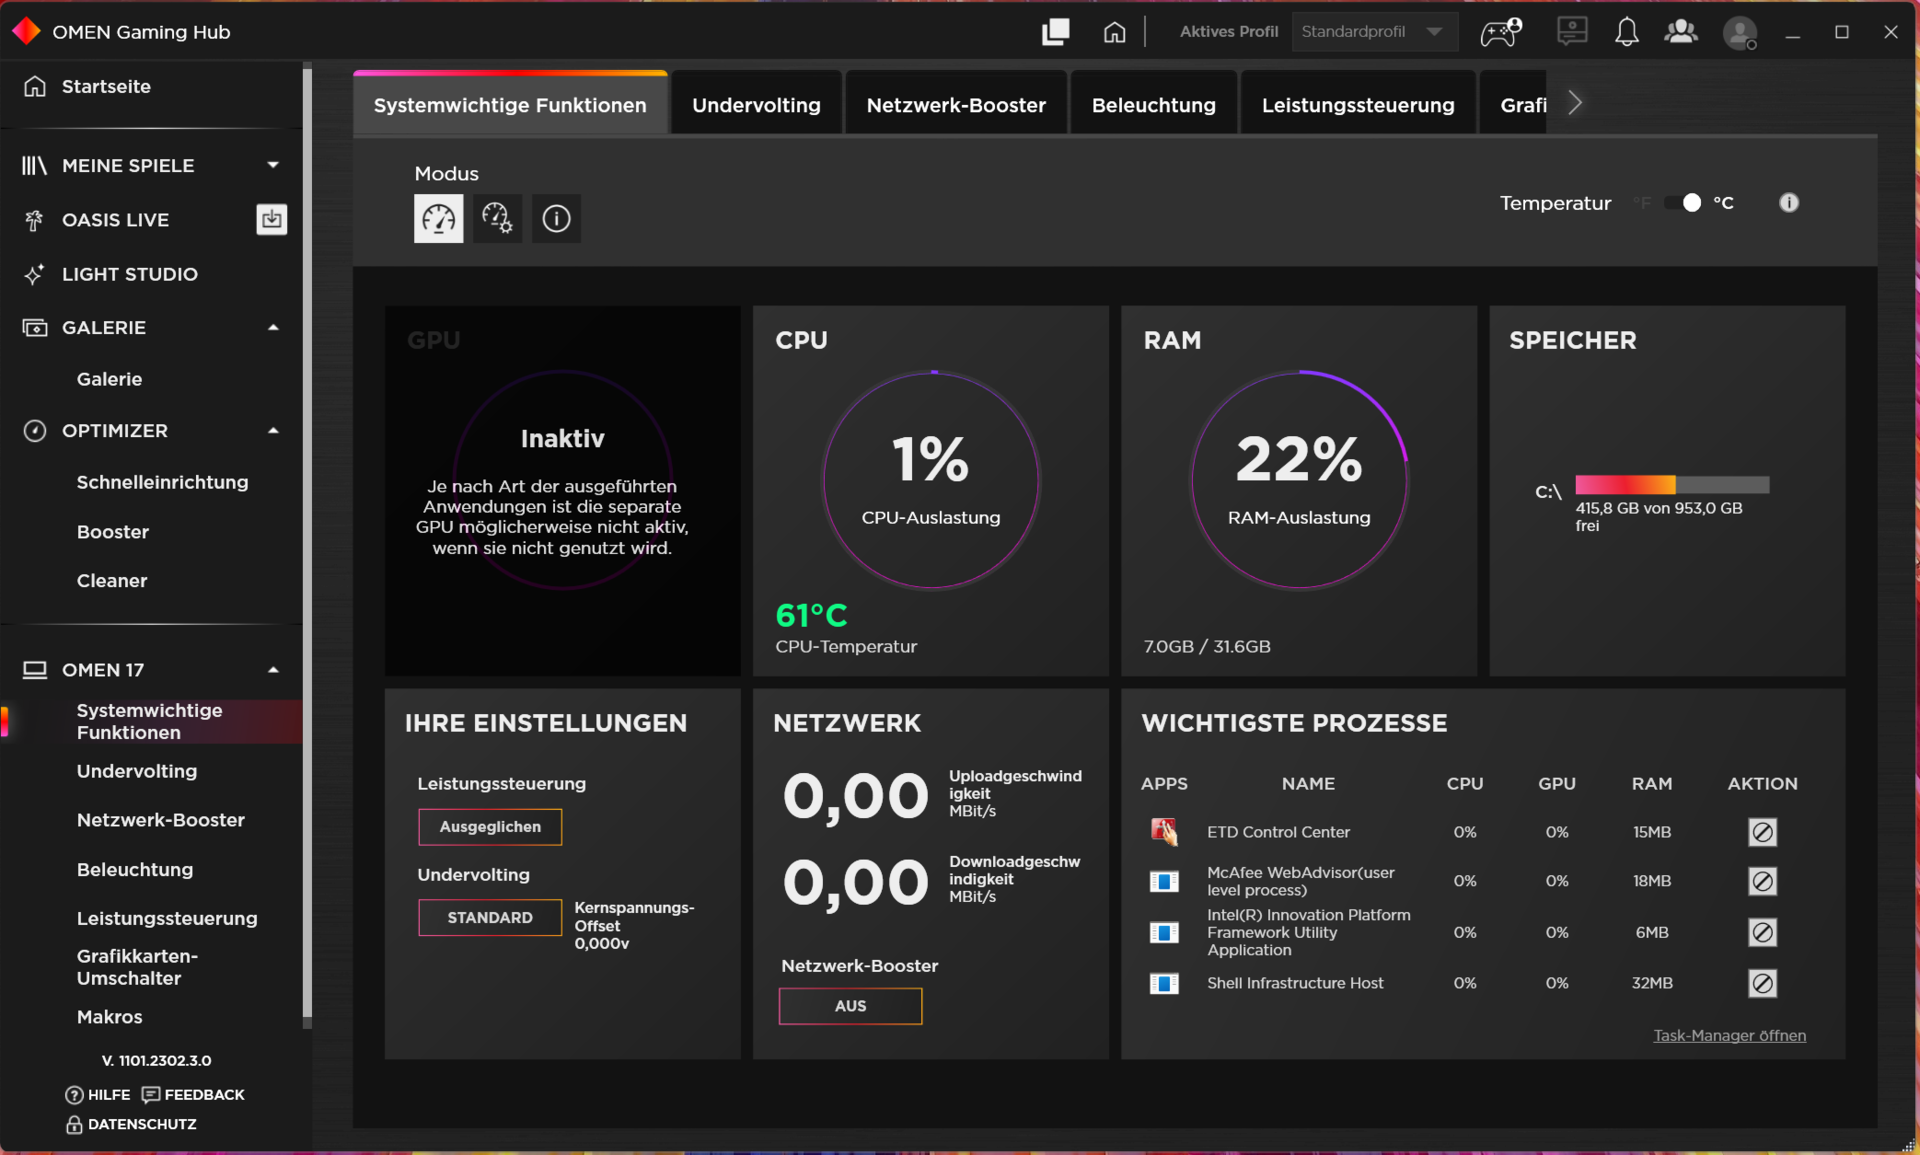
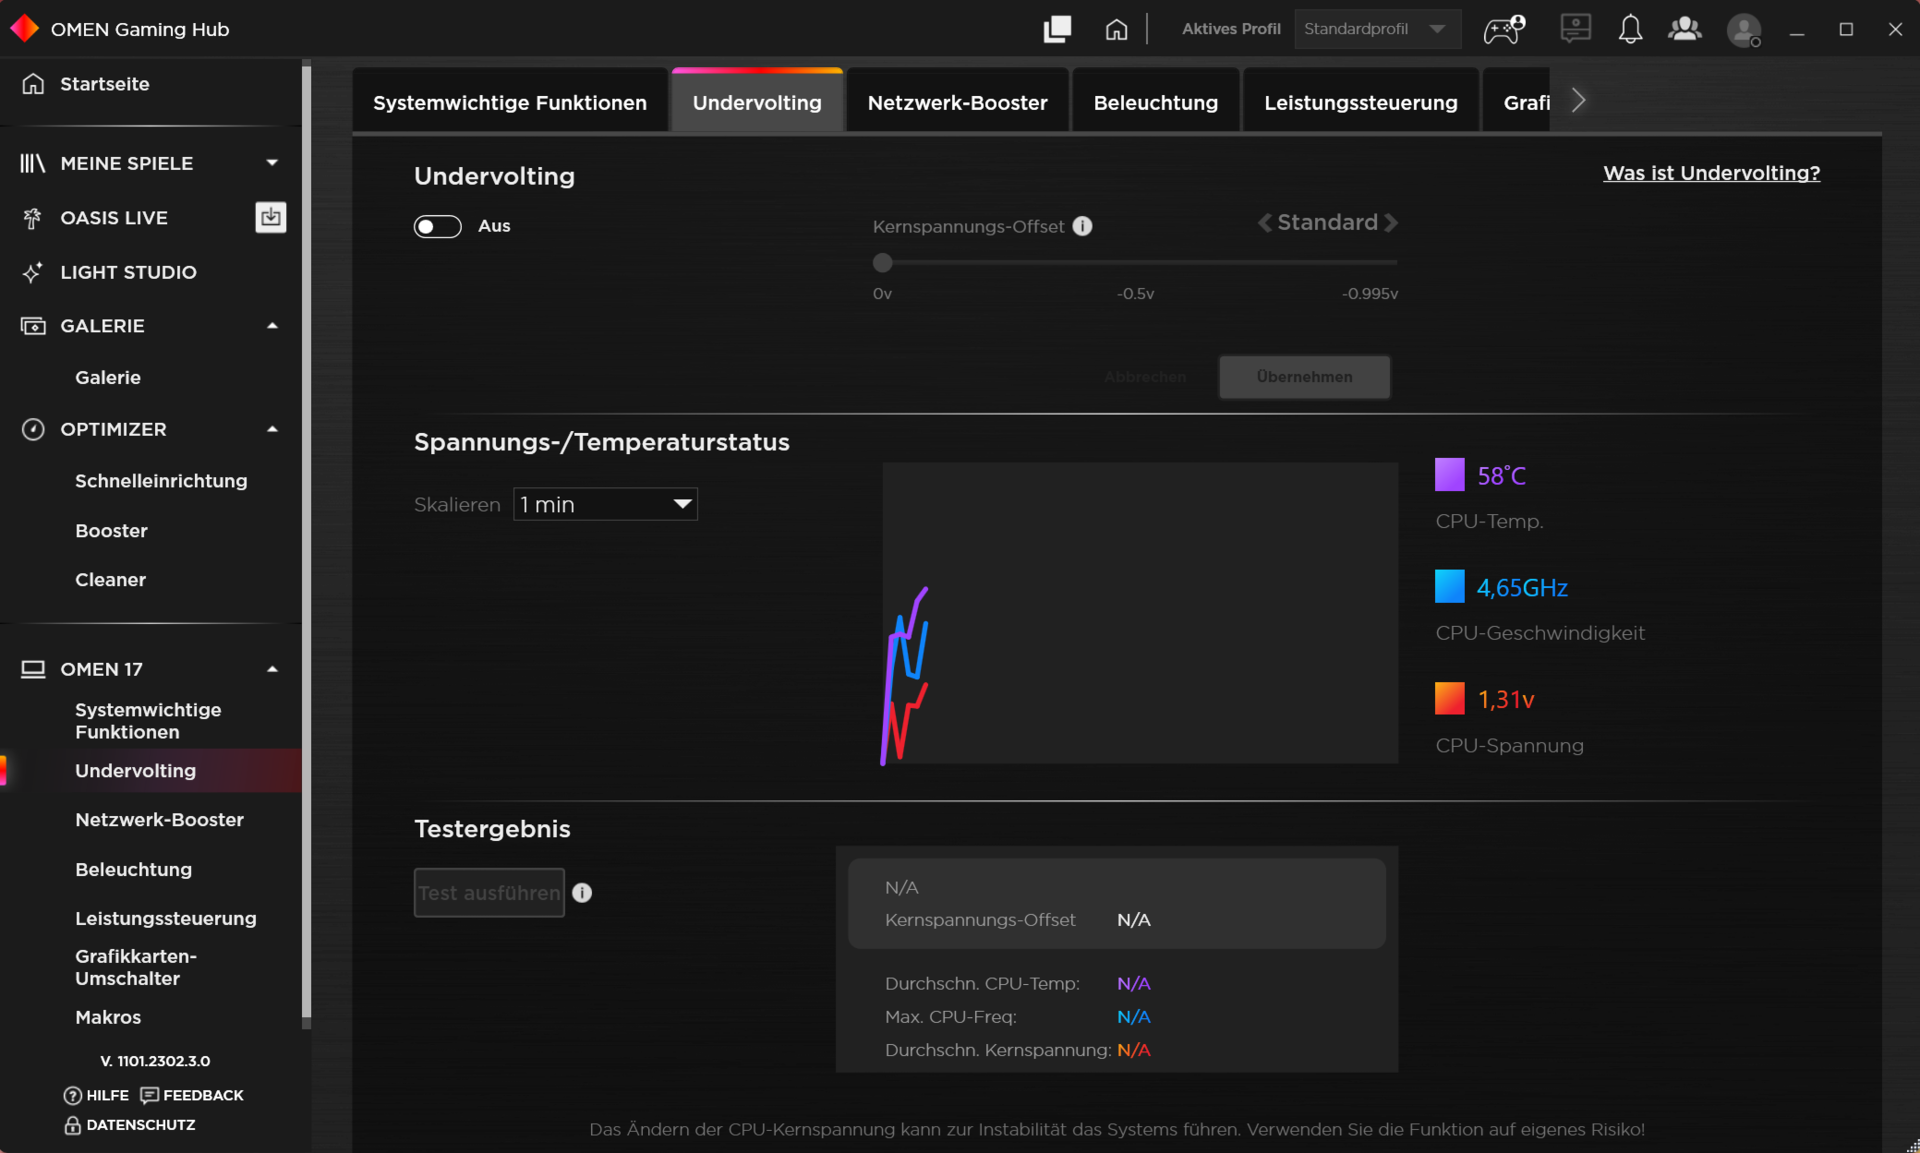
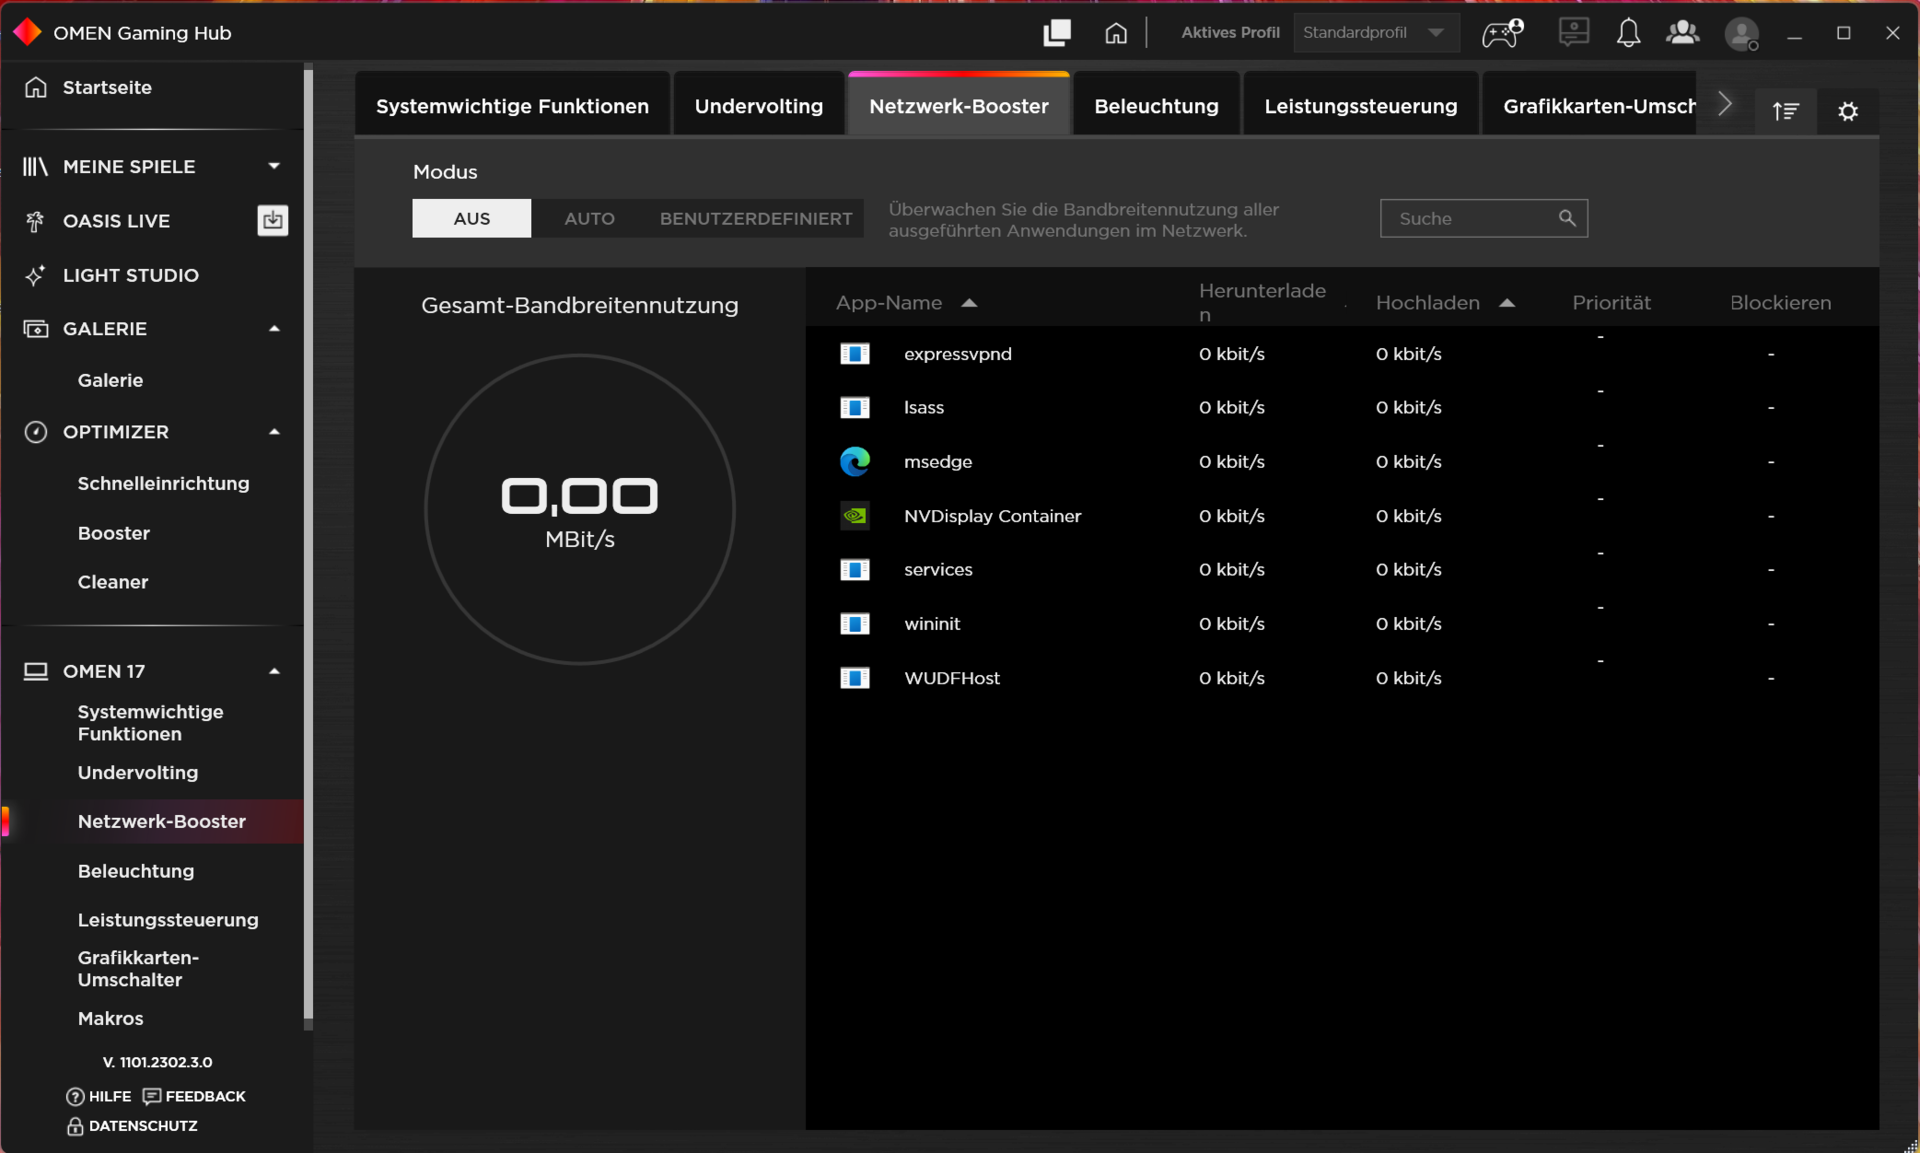
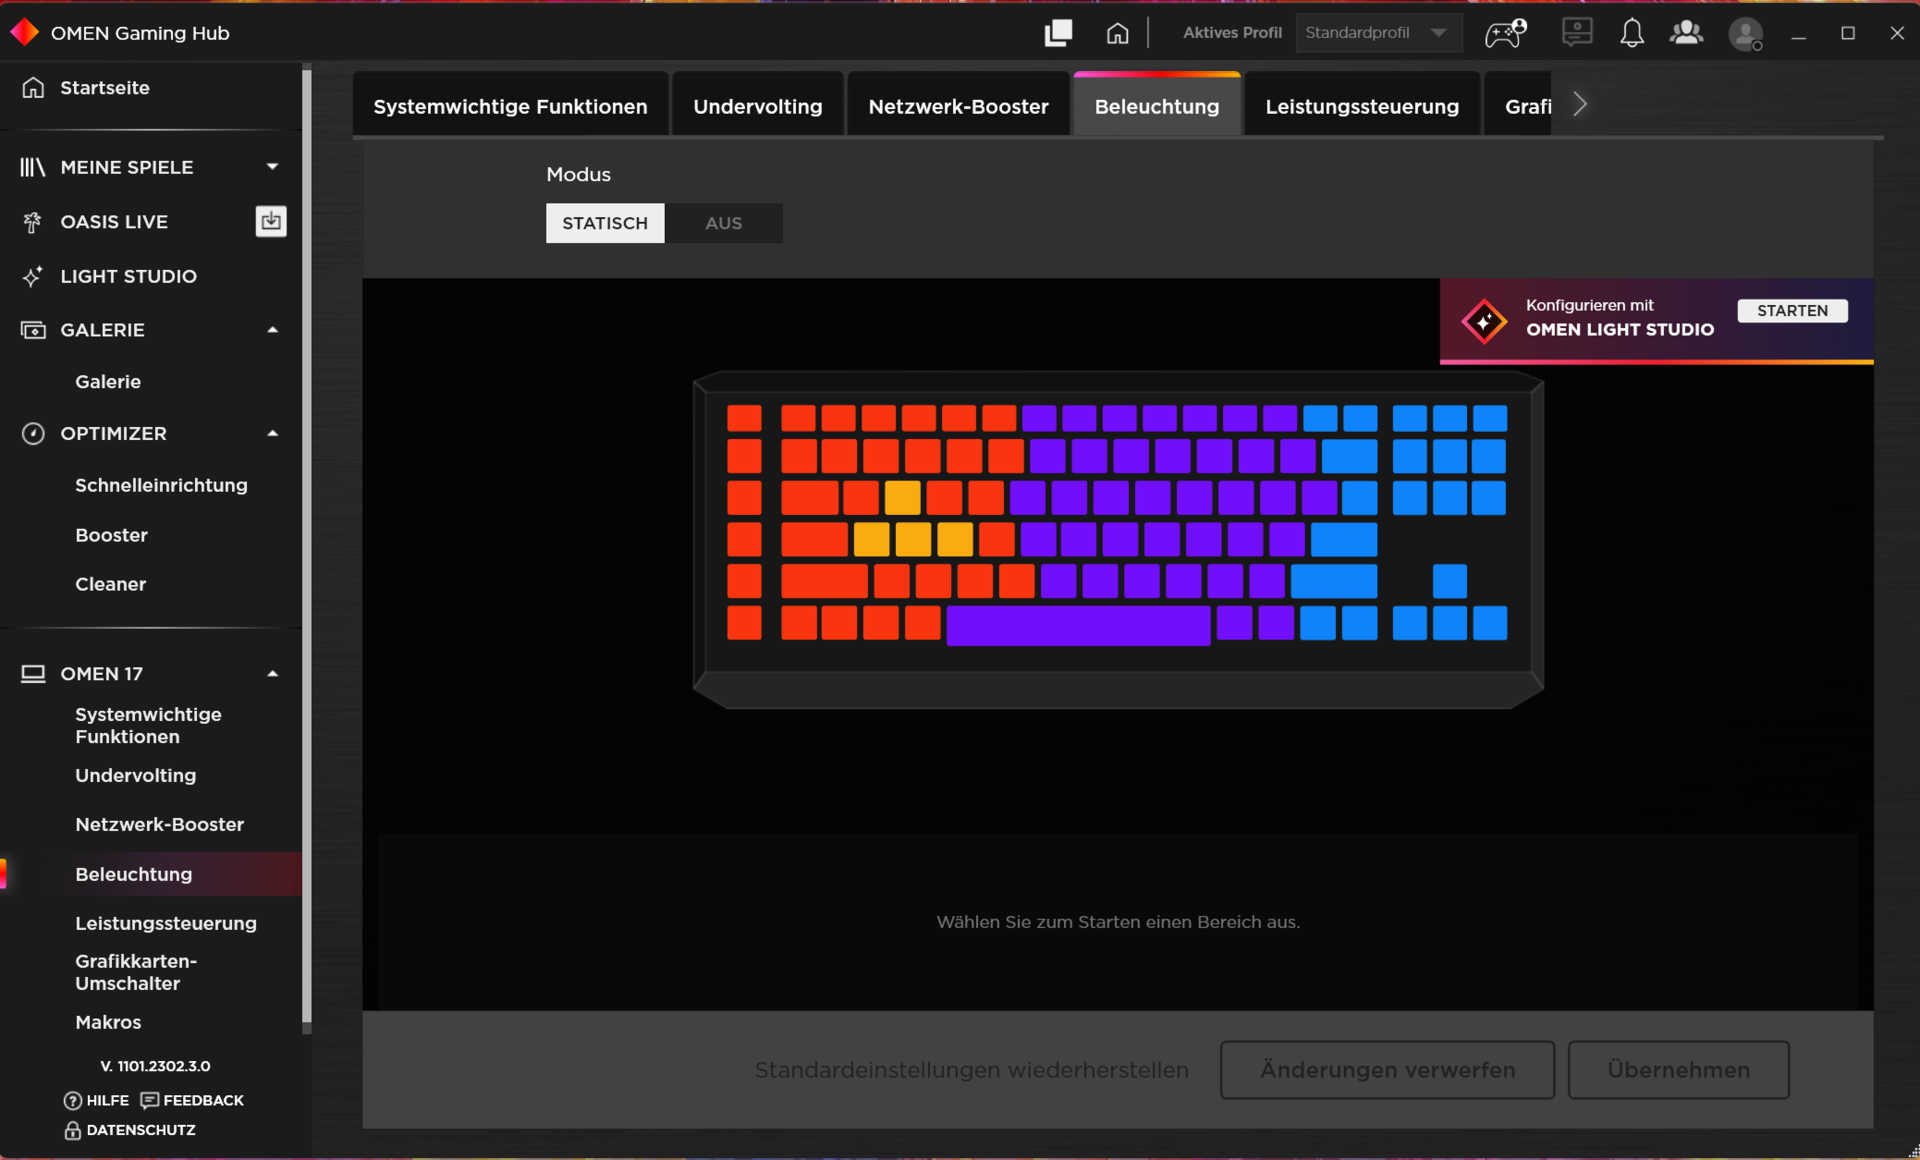
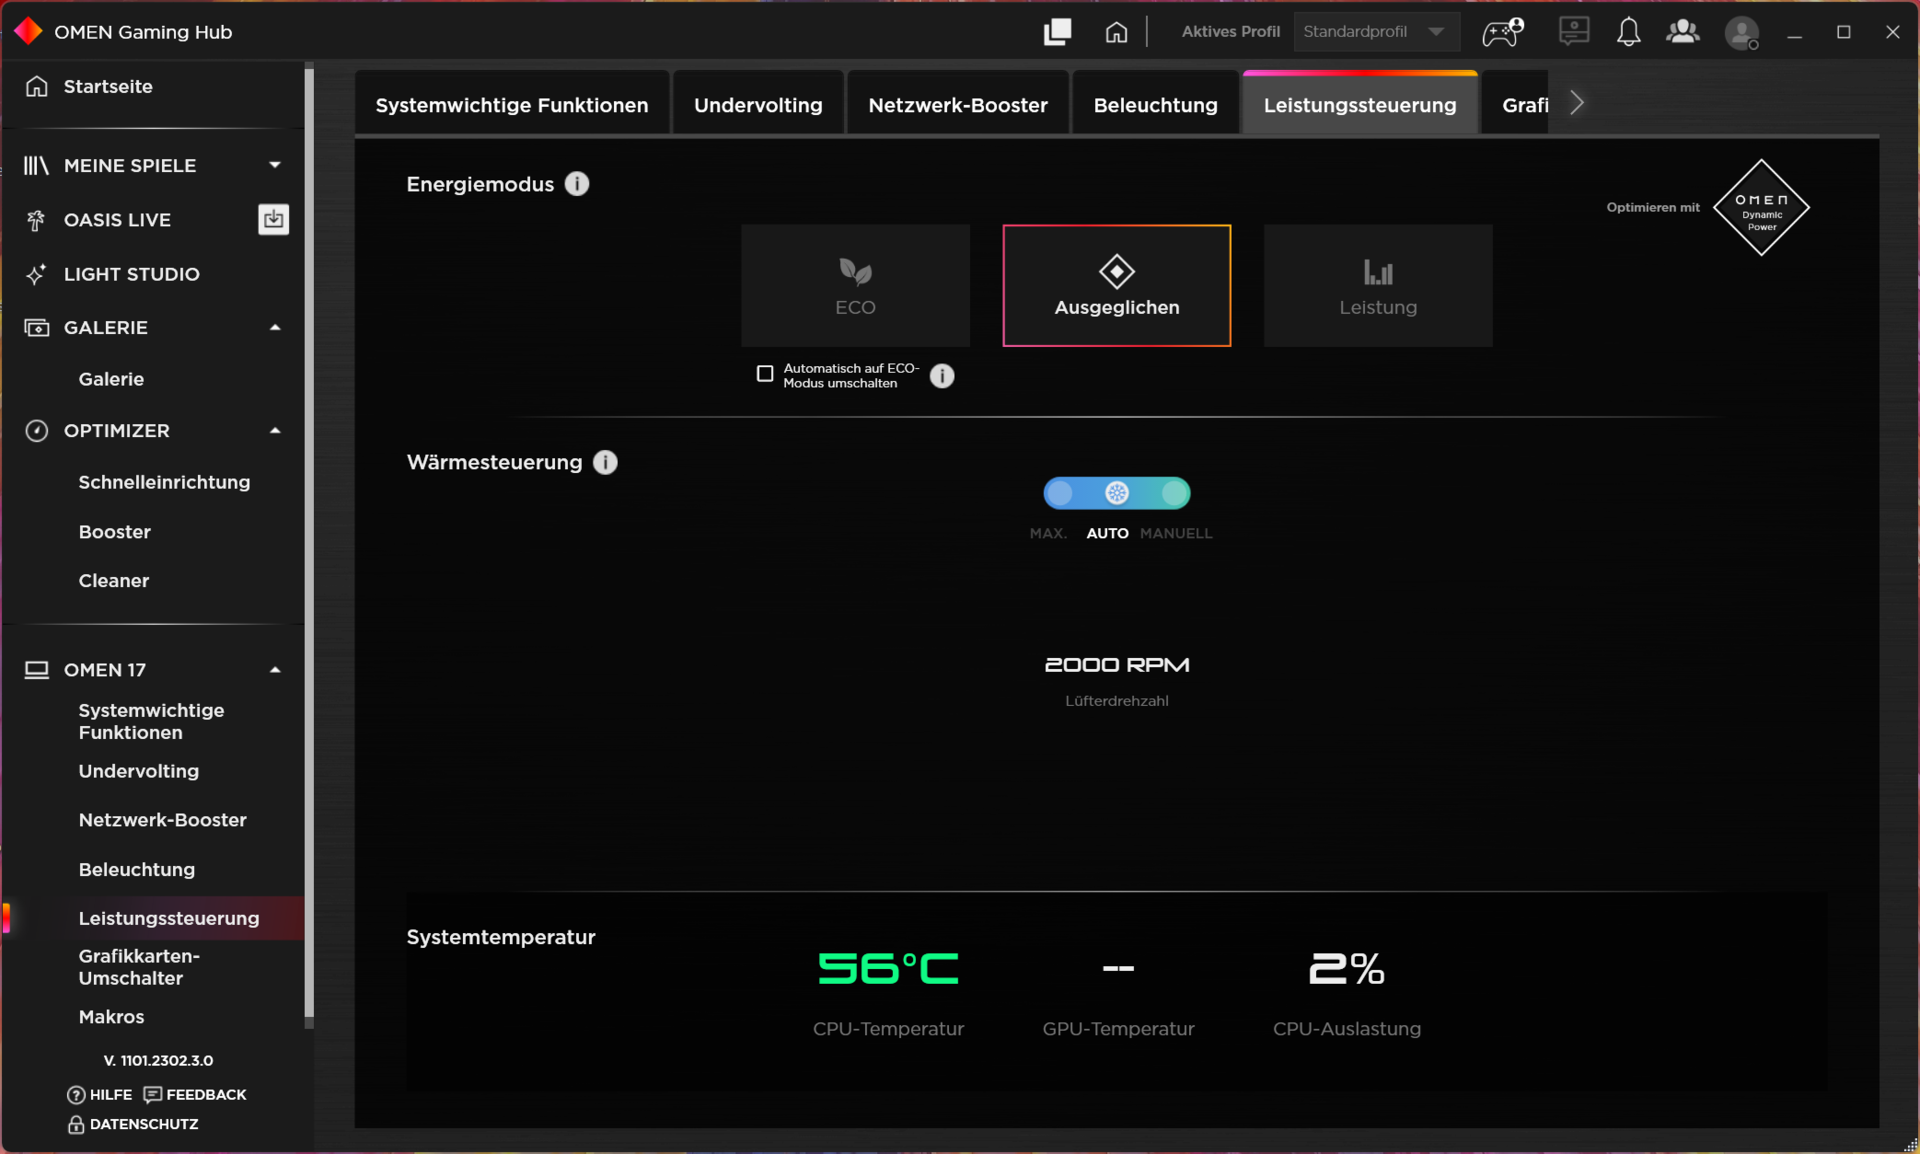
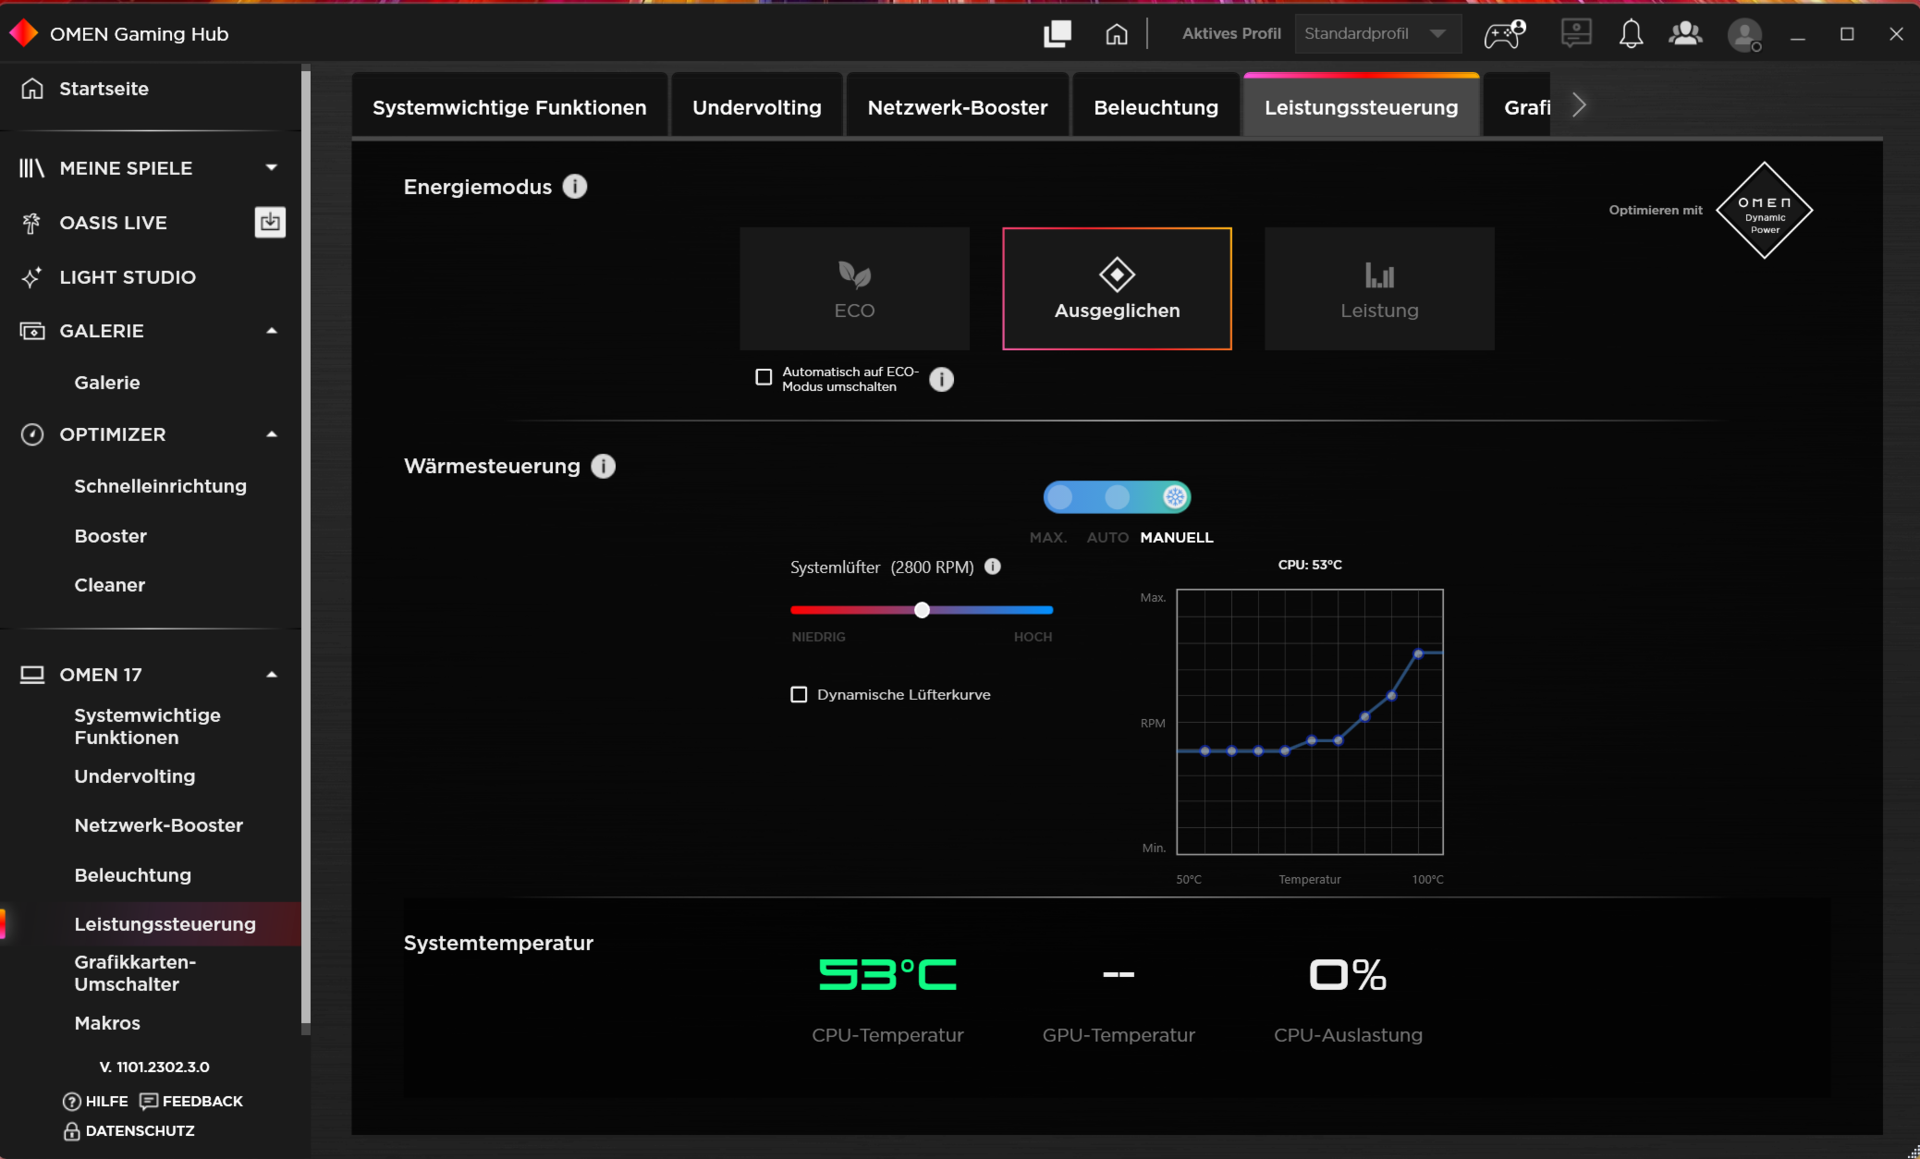
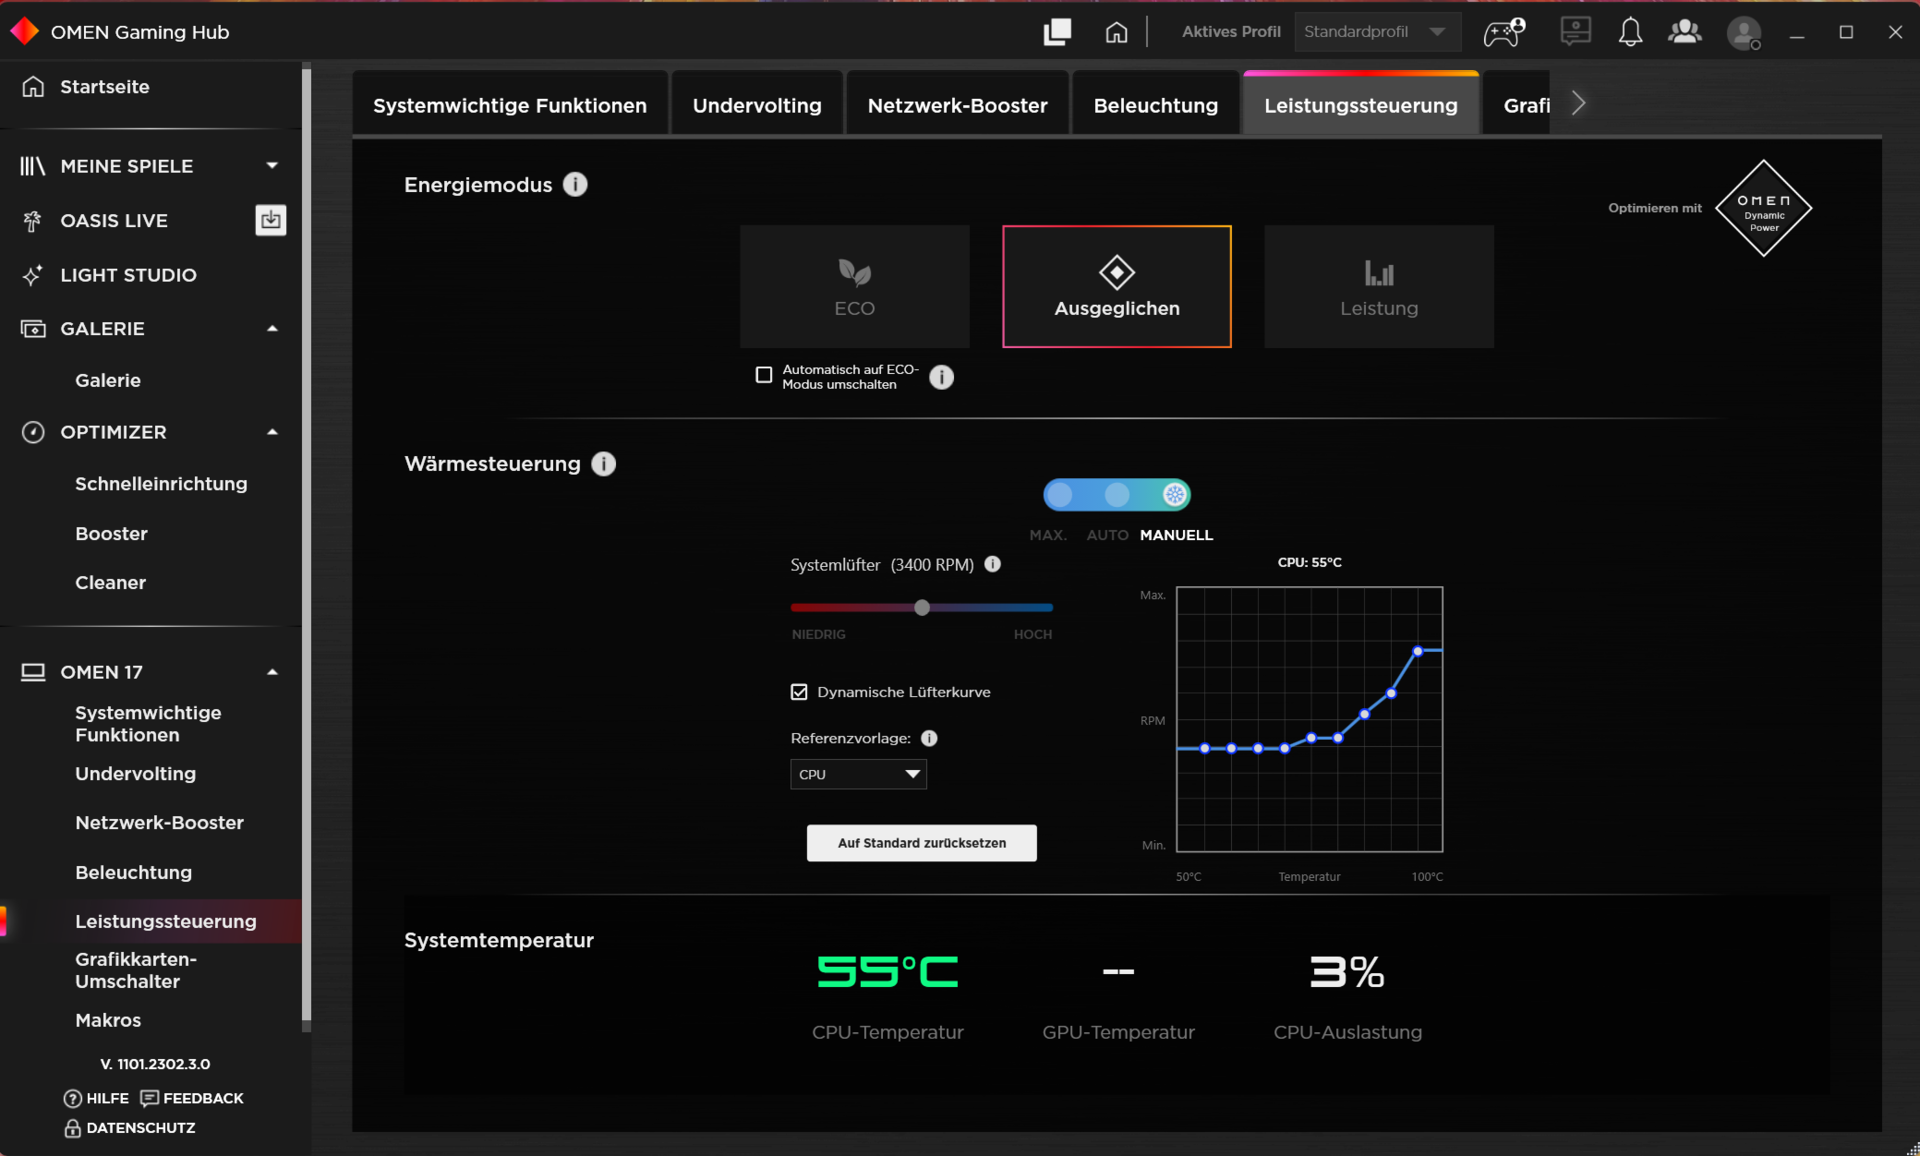
The preinstalled Omen Gaming Hub software represents the control center of the laptop. In addition to selecting a power mode (see table), it also allows you to undervolt the CPU and configure an individual fan curve. Since the "Performance" mode created some problems in our test unit (strange stutters and performance drops), we mainly used the "Balanced" power mode together with automatic fan control. Optimus was activated.
| Performance | Balanced | Eco | |
|---|---|---|---|
| Power Limit 1 | 100 Watt | 55 Watt | 55 Watt |
| Power Limit 2 | 130 Watt | 130 Watt | 130 Watt |
Processor
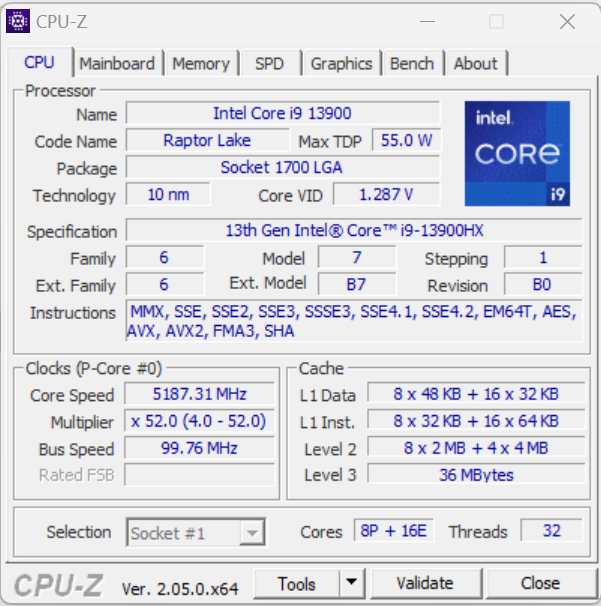
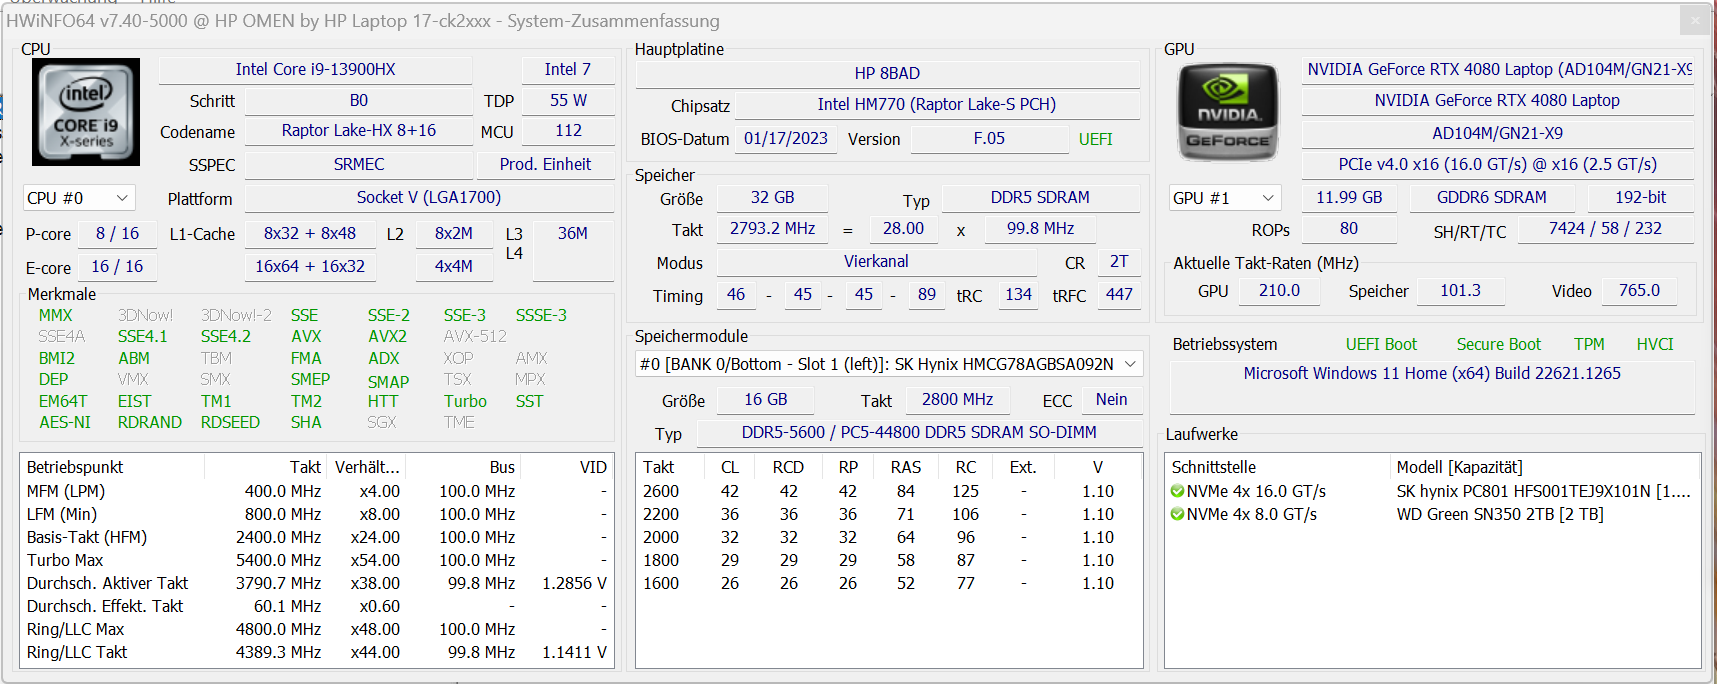
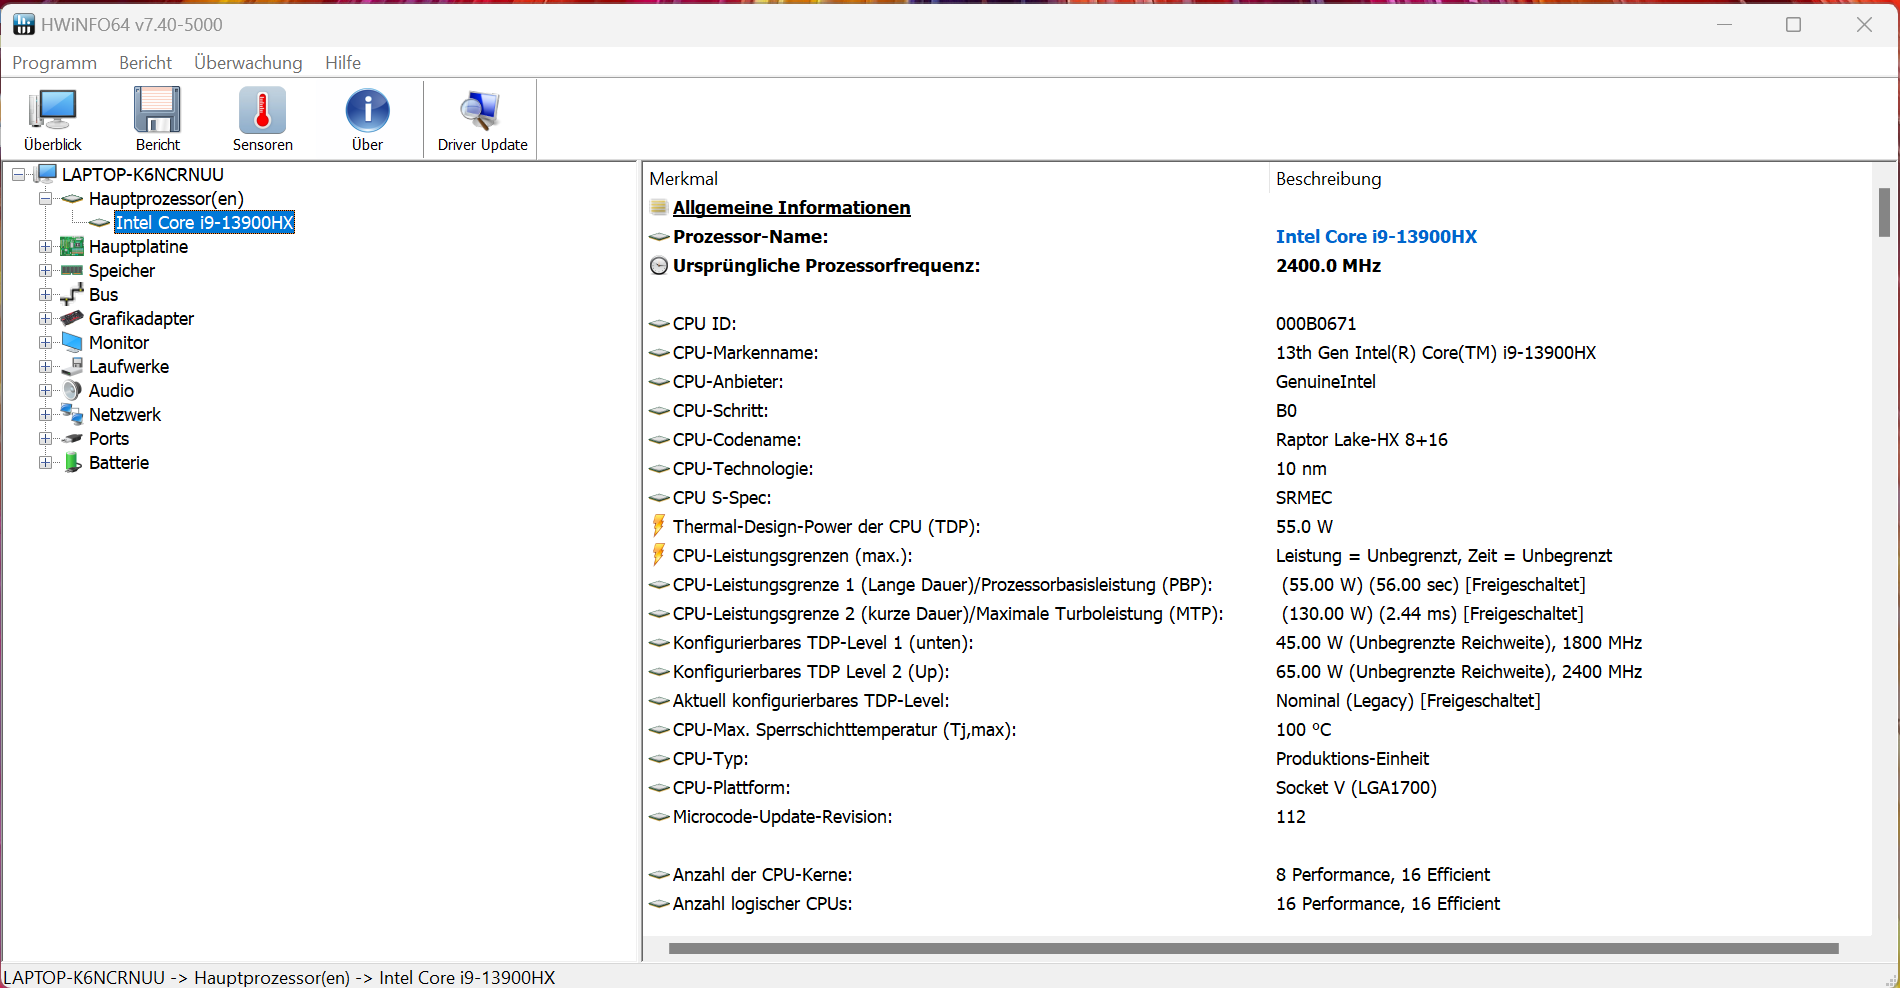
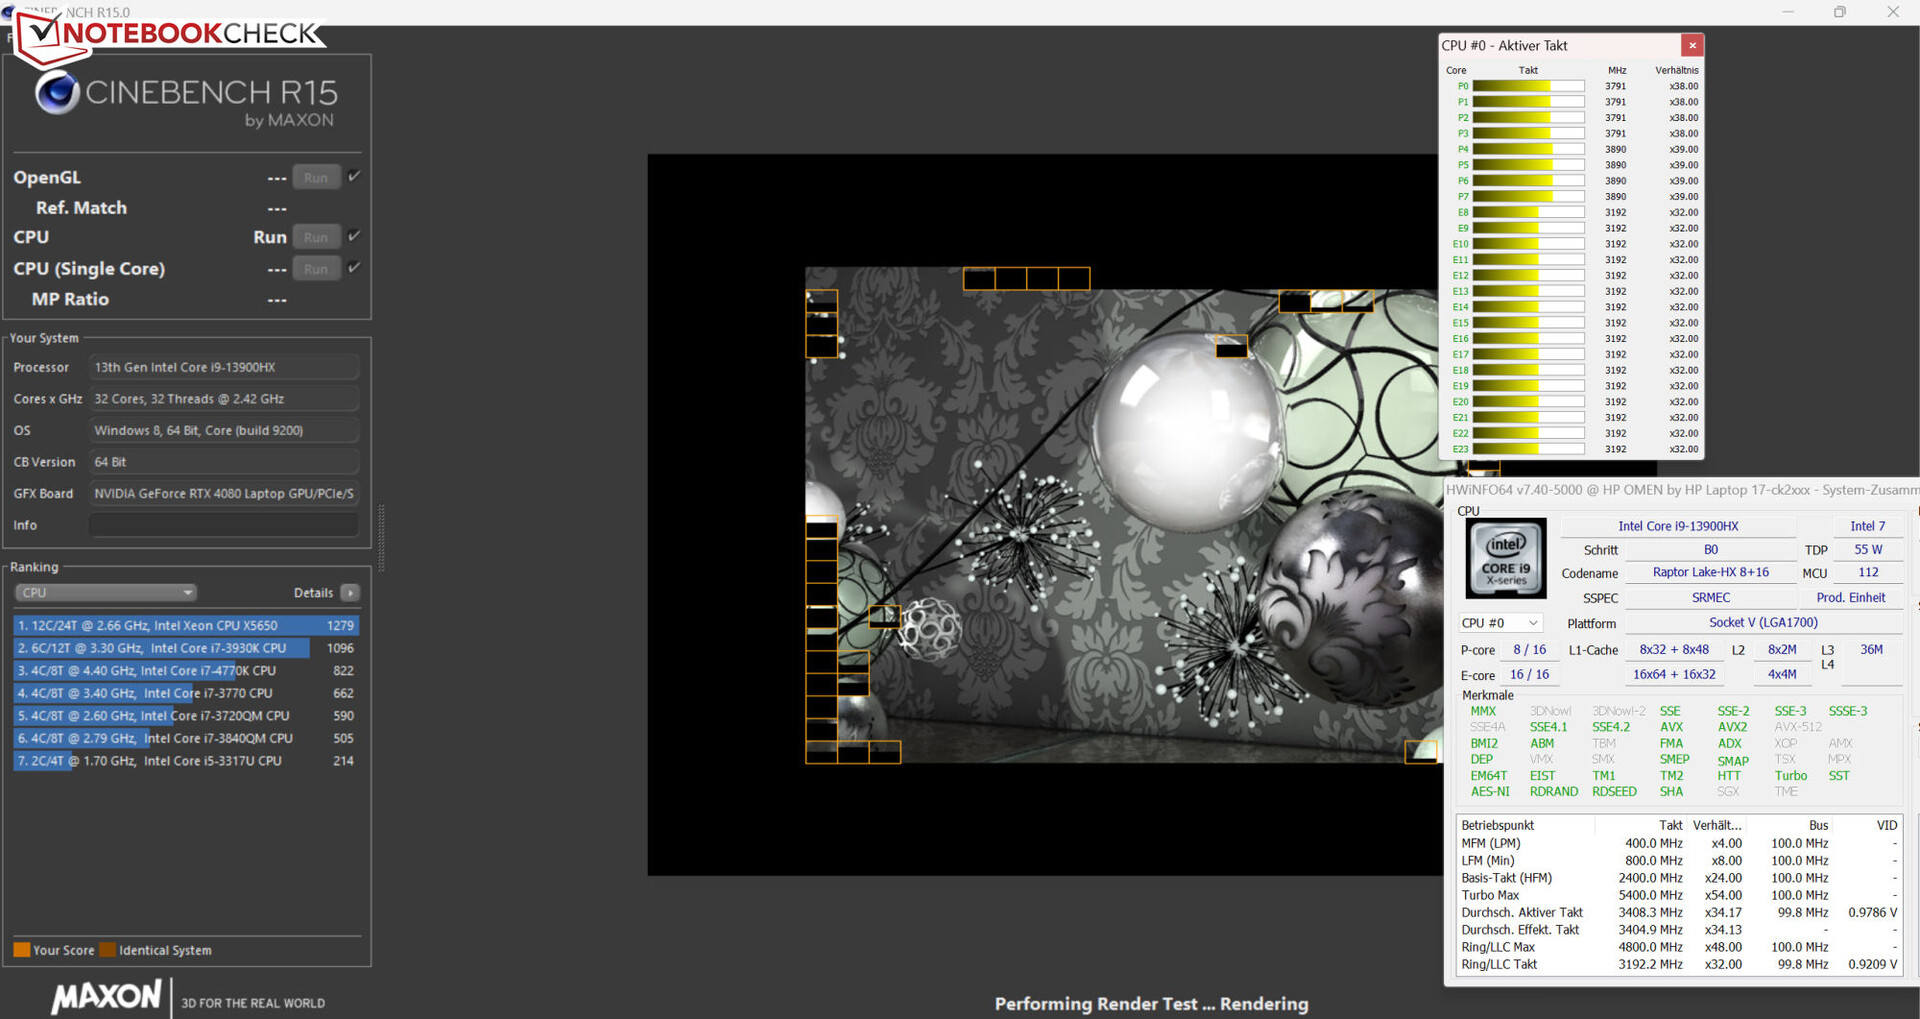
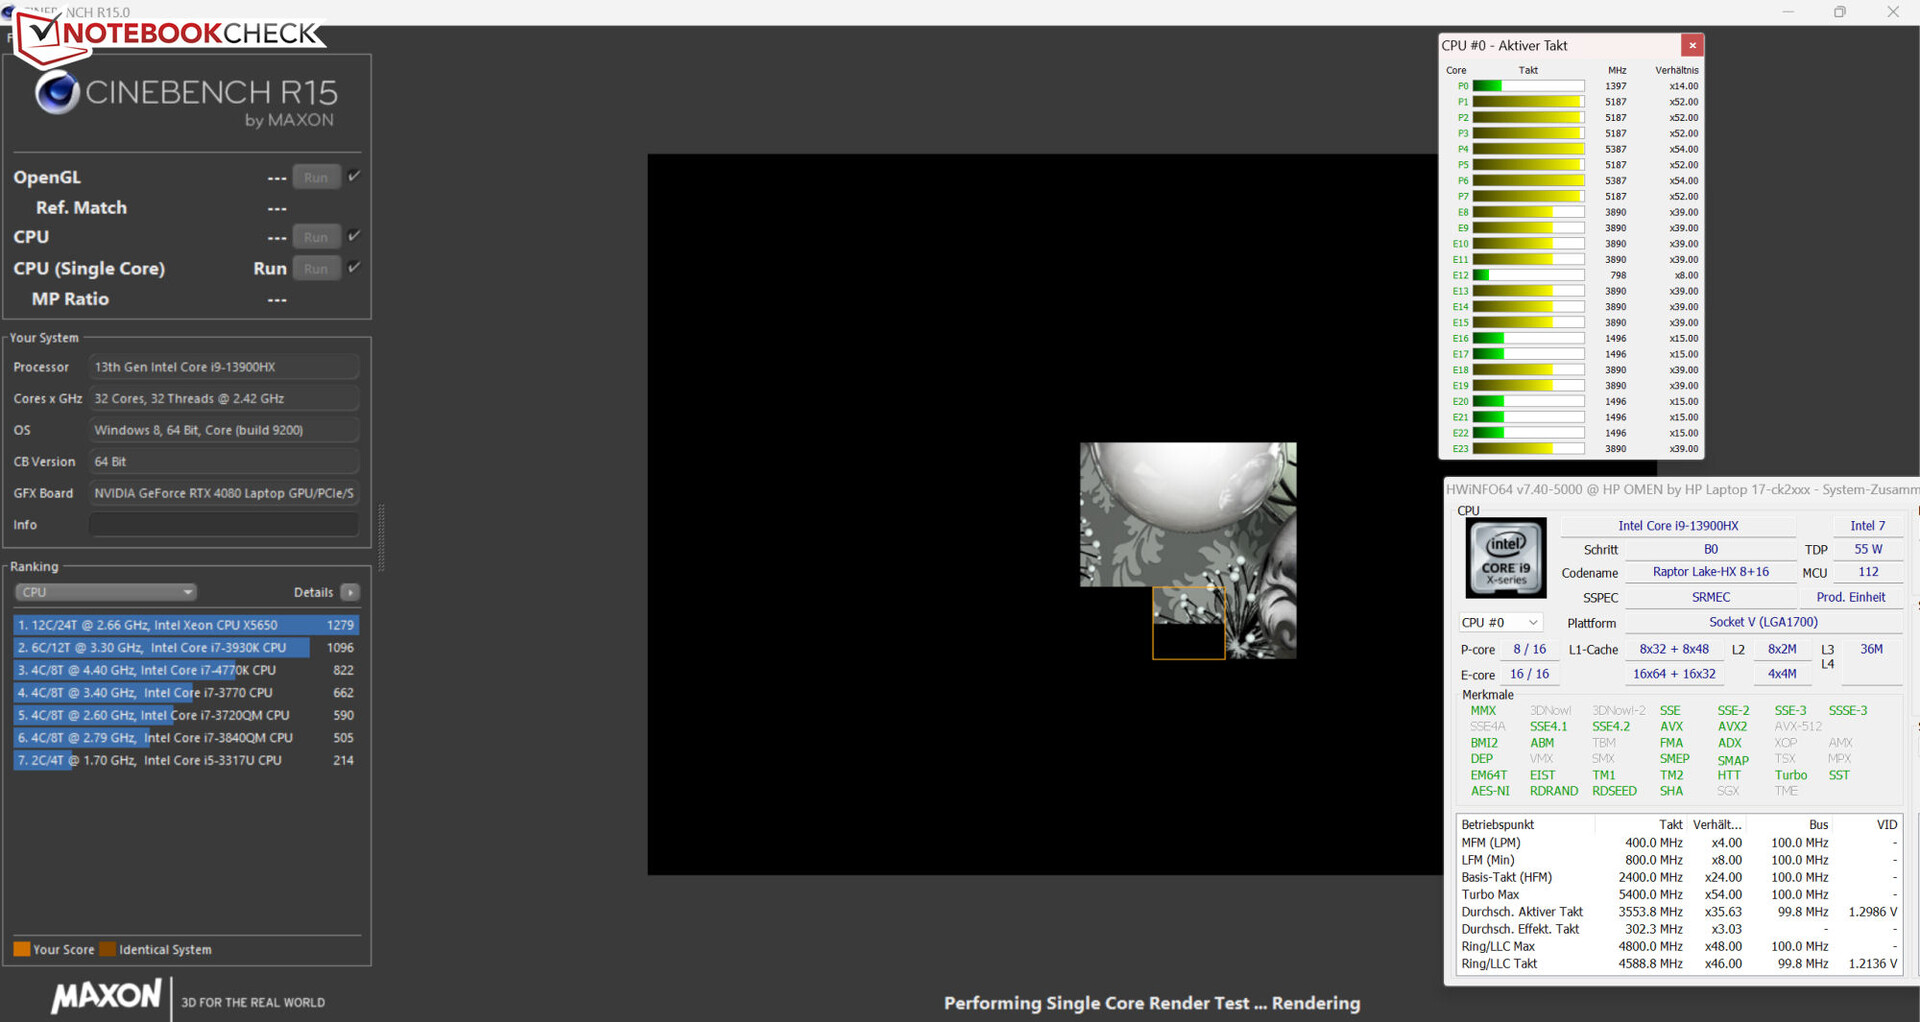
The Core i9-13900HX processor (Raptor Lake) consists of sixteen Efficiency cores (no hyperthreading, 1.6 to 3.9 GHz) and eight Performance cores (hyperthreading, 2.2 to 5.4 GHz), resulting in a total of 32 logical CPU cores.
In mains operation, the processor runs through the CPU tests of the Cinebench R15 benchmark with medium-high to high (multithread) and high to maximum (single-thread) clock speeds. While the single-thread performance (254 points) drops slightly in battery operation, the drop in the multithread performance is significant (1,303 points).
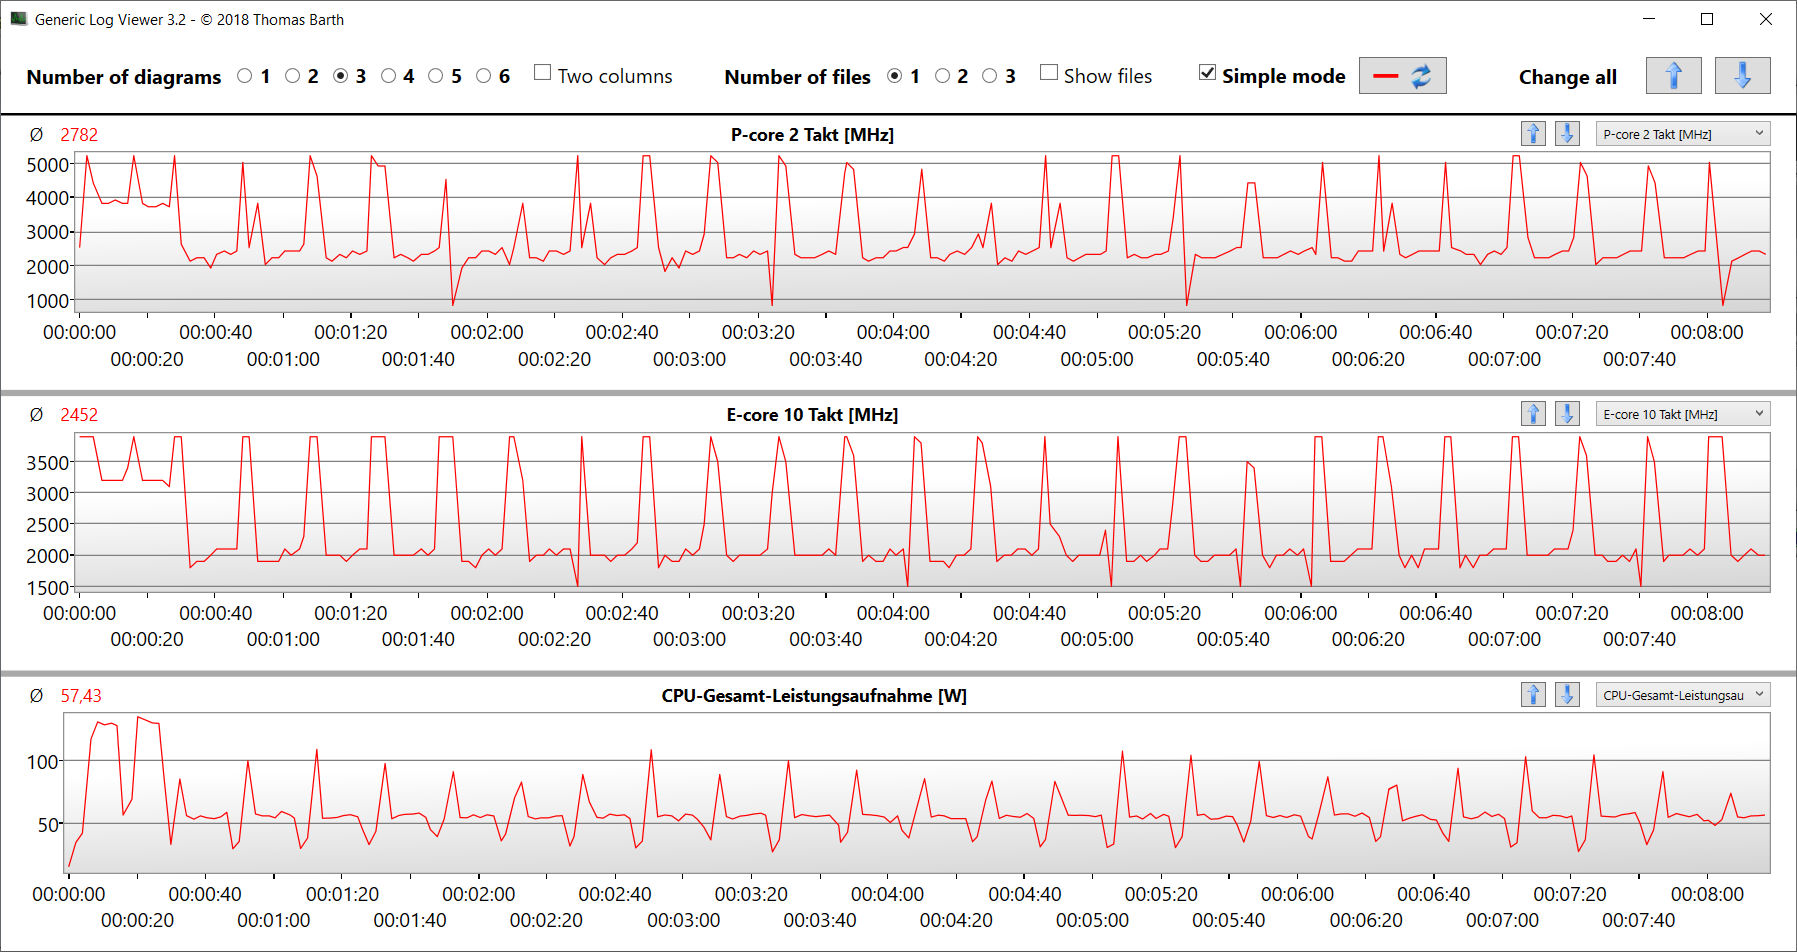
The benchmark results range at the level (single-thread) of the average for the CPU or below (multithread). Overall, the "Performance" mode only results in a slight performance advantage, with the AIDA benchmarks profiting the most. On the other hand, it will also cause the CPU speed to remain at a high level under constant multithread load, as the CB15 loop test shows.
Cinebench R15 Multi Constant Load Test
| CPU Performance rating - Percent | |
| Lenovo Legion Pro 7 16IRX8H | |
| Asus ROG Strix G16 G614JZ | |
| HP Omen 17-ck2097ng | |
| Average Intel Core i9-13900HX | |
| HP Omen 17-ck2097ng | |
| Razer Blade 16 Early 2023 | |
| Average of class Gaming | |
| Alienware m17 R5 (R9 6900HX, RX 6850M XT) | |
| Cinebench R20 | |
| CPU (Multi Core) | |
| Asus ROG Strix G16 G614JZ | |
| Lenovo Legion Pro 7 16IRX8H | |
| Average Intel Core i9-13900HX (9152 - 12541, n=21) | |
| HP Omen 17-ck2097ng (Leistung) | |
| HP Omen 17-ck2097ng | |
| Average of class Gaming (4029 - 16108, n=109, last 2 years) | |
| Razer Blade 16 Early 2023 | |
| Alienware m17 R5 (R9 6900HX, RX 6850M XT) | |
| CPU (Single Core) | |
| Asus ROG Strix G16 G614JZ | |
| HP Omen 17-ck2097ng | |
| HP Omen 17-ck2097ng (Leistung) | |
| Lenovo Legion Pro 7 16IRX8H | |
| Average Intel Core i9-13900HX (722 - 810, n=21) | |
| Average of class Gaming (442 - 895, n=109, last 2 years) | |
| Razer Blade 16 Early 2023 | |
| Alienware m17 R5 (R9 6900HX, RX 6850M XT) | |
| Cinebench R15 | |
| CPU Multi 64Bit | |
| Lenovo Legion Pro 7 16IRX8H | |
| Asus ROG Strix G16 G614JZ (turbo) | |
| Asus ROG Strix G16 G614JZ | |
| Razer Blade 16 Early 2023 | |
| Average Intel Core i9-13900HX (3913 - 4970, n=22) | |
| HP Omen 17-ck2097ng (Leistung) | |
| HP Omen 17-ck2097ng | |
| Average of class Gaming (1578 - 6271, n=108, last 2 years) | |
| Alienware m17 R5 (R9 6900HX, RX 6850M XT) | |
| CPU Single 64Bit | |
| Asus ROG Strix G16 G614JZ | |
| Asus ROG Strix G16 G614JZ (turbo) | |
| Lenovo Legion Pro 7 16IRX8H | |
| HP Omen 17-ck2097ng | |
| HP Omen 17-ck2097ng (Leistung) | |
| Average of class Gaming (188.8 - 343, n=109, last 2 years) | |
| Average Intel Core i9-13900HX (247 - 304, n=22) | |
| Razer Blade 16 Early 2023 | |
| Alienware m17 R5 (R9 6900HX, RX 6850M XT) | |
| Blender - v2.79 BMW27 CPU | |
| Alienware m17 R5 (R9 6900HX, RX 6850M XT) | |
| HP Omen 17-ck2097ng | |
| Average of class Gaming (80 - 330, n=107, last 2 years) | |
| Average Intel Core i9-13900HX (101 - 153, n=22) | |
| Razer Blade 16 Early 2023 | |
| HP Omen 17-ck2097ng (Leistung) | |
| Asus ROG Strix G16 G614JZ | |
| Lenovo Legion Pro 7 16IRX8H | |
| HWBOT x265 Benchmark v2.2 - 4k Preset | |
| Lenovo Legion Pro 7 16IRX8H | |
| HP Omen 17-ck2097ng (Leistung) | |
| Asus ROG Strix G16 G614JZ | |
| Average Intel Core i9-13900HX (23.5 - 34.4, n=22) | |
| Razer Blade 16 Early 2023 | |
| Average of class Gaming (11.5 - 44.3, n=108, last 2 years) | |
| HP Omen 17-ck2097ng | |
| Alienware m17 R5 (R9 6900HX, RX 6850M XT) | |
| LibreOffice - 20 Documents To PDF | |
| Alienware m17 R5 (R9 6900HX, RX 6850M XT) | |
| Average of class Gaming (19 - 88.8, n=108, last 2 years) | |
| Asus ROG Strix G16 G614JZ | |
| Razer Blade 16 Early 2023 | |
| HP Omen 17-ck2097ng | |
| Lenovo Legion Pro 7 16IRX8H | |
| Average Intel Core i9-13900HX (32.8 - 51.1, n=21) | |
| HP Omen 17-ck2097ng (Leistung) | |
| R Benchmark 2.5 - Overall mean | |
| Alienware m17 R5 (R9 6900HX, RX 6850M XT) | |
| Average of class Gaming (0.3439 - 0.759, n=109, last 2 years) | |
| Razer Blade 16 Early 2023 | |
| Average Intel Core i9-13900HX (0.375 - 0.4564, n=22) | |
| Lenovo Legion Pro 7 16IRX8H | |
| HP Omen 17-ck2097ng (Leistung) | |
| Asus ROG Strix G16 G614JZ | |
| HP Omen 17-ck2097ng | |
* ... smaller is better
AIDA64: FP32 Ray-Trace | FPU Julia | CPU SHA3 | CPU Queen | FPU SinJulia | FPU Mandel | CPU AES | CPU ZLib | FP64 Ray-Trace | CPU PhotoWorxx
| Performance rating | |
| Lenovo Legion Pro 7 16IRX8H | |
| Asus ROG Strix G16 G614JZ | |
| Average of class Gaming | |
| Average Intel Core i9-13900HX | |
| HP Omen 17-ck2097ng | |
| Razer Blade 16 Early 2023 | |
| HP Omen 17-ck2097ng | |
| Alienware m17 R5 (R9 6900HX, RX 6850M XT) | |
| AIDA64 / FP32 Ray-Trace | |
| Average of class Gaming (10227 - 85542, n=107, last 2 years) | |
| Asus ROG Strix G16 G614JZ (v6.75.6100) | |
| Lenovo Legion Pro 7 16IRX8H (v6.85.6300) | |
| Razer Blade 16 Early 2023 (v6.85.6300) | |
| Razer Blade 16 Early 2023 (v8.20.8100) | |
| Razer Blade 16 Early 2023 (v6.92.6600) | |
| Average Intel Core i9-13900HX (17589 - 27615, n=22) | |
| HP Omen 17-ck2097ng (v6.75.6100, Leistung) | |
| HP Omen 17-ck2097ng (v6.75.6100) | |
| Alienware m17 R5 (R9 6900HX, RX 6850M XT) (v6.75.6100) | |
| AIDA64 / FPU Julia | |
| Average of class Gaming (51376 - 238426, n=107, last 2 years) | |
| Lenovo Legion Pro 7 16IRX8H (v6.85.6300) | |
| Asus ROG Strix G16 G614JZ (v6.75.6100) | |
| Razer Blade 16 Early 2023 (v6.85.6300) | |
| Razer Blade 16 Early 2023 (v8.20.8100) | |
| Razer Blade 16 Early 2023 (v6.92.6600) | |
| Average Intel Core i9-13900HX (88686 - 137015, n=22) | |
| HP Omen 17-ck2097ng (v6.75.6100, Leistung) | |
| Alienware m17 R5 (R9 6900HX, RX 6850M XT) (v6.75.6100) | |
| HP Omen 17-ck2097ng (v6.75.6100) | |
| AIDA64 / CPU SHA3 | |
| Lenovo Legion Pro 7 16IRX8H (v6.85.6300) | |
| Asus ROG Strix G16 G614JZ (v6.75.6100) | |
| Razer Blade 16 Early 2023 (v6.85.6300) | |
| Razer Blade 16 Early 2023 (v6.92.6600) | |
| Razer Blade 16 Early 2023 (v8.20.8100) | |
| Average of class Gaming (2180 - 9817, n=107, last 2 years) | |
| Average Intel Core i9-13900HX (4362 - 7029, n=22) | |
| HP Omen 17-ck2097ng (v6.75.6100, Leistung) | |
| HP Omen 17-ck2097ng (v6.75.6100) | |
| Alienware m17 R5 (R9 6900HX, RX 6850M XT) (v6.75.6100) | |
| AIDA64 / CPU Queen | |
| Asus ROG Strix G16 G614JZ (v6.75.6100) | |
| Razer Blade 16 Early 2023 (v6.92.6600) | |
| Razer Blade 16 Early 2023 (v6.85.6300) | |
| HP Omen 17-ck2097ng | |
| Lenovo Legion Pro 7 16IRX8H (v6.85.6300) | |
| Average Intel Core i9-13900HX (125644 - 141385, n=22) | |
| HP Omen 17-ck2097ng (v6.75.6100, Leistung) | |
| Average of class Gaming (49785 - 173351, n=95, last 2 years) | |
| Alienware m17 R5 (R9 6900HX, RX 6850M XT) (v6.75.6100) | |
| AIDA64 / FPU SinJulia | |
| Asus ROG Strix G16 G614JZ (v6.75.6100) | |
| Razer Blade 16 Early 2023 (v6.85.6300) | |
| Razer Blade 16 Early 2023 (v8.20.8100) | |
| Razer Blade 16 Early 2023 (v6.92.6600) | |
| Lenovo Legion Pro 7 16IRX8H (v6.85.6300) | |
| HP Omen 17-ck2097ng (v6.75.6100, Leistung) | |
| Average Intel Core i9-13900HX (12334 - 17179, n=22) | |
| Average of class Gaming (4424 - 33636, n=107, last 2 years) | |
| Alienware m17 R5 (R9 6900HX, RX 6850M XT) (v6.75.6100) | |
| HP Omen 17-ck2097ng (v6.75.6100) | |
| AIDA64 / FPU Mandel | |
| Average of class Gaming (25115 - 128721, n=107, last 2 years) | |
| Lenovo Legion Pro 7 16IRX8H (v6.85.6300) | |
| Asus ROG Strix G16 G614JZ (v6.75.6100) | |
| Razer Blade 16 Early 2023 (v6.85.6300) | |
| Razer Blade 16 Early 2023 (v8.20.8100) | |
| Razer Blade 16 Early 2023 (v6.92.6600) | |
| Average Intel Core i9-13900HX (43850 - 69202, n=22) | |
| HP Omen 17-ck2097ng (v6.75.6100, Leistung) | |
| Alienware m17 R5 (R9 6900HX, RX 6850M XT) (v6.75.6100) | |
| HP Omen 17-ck2097ng (v6.75.6100) | |
| AIDA64 / CPU AES | |
| Razer Blade 16 Early 2023 (v6.92.6600) | |
| Razer Blade 16 Early 2023 (v8.20.8100) | |
| Razer Blade 16 Early 2023 (v6.85.6300) | |
| Average Intel Core i9-13900HX (89413 - 237881, n=22) | |
| Asus ROG Strix G16 G614JZ (v6.75.6100) | |
| Lenovo Legion Pro 7 16IRX8H (v6.85.6300) | |
| HP Omen 17-ck2097ng (v6.75.6100, Leistung) | |
| Average of class Gaming (39258 - 247074, n=107, last 2 years) | |
| HP Omen 17-ck2097ng (v6.75.6100) | |
| Alienware m17 R5 (R9 6900HX, RX 6850M XT) (v6.75.6100) | |
| AIDA64 / CPU ZLib | |
| Lenovo Legion Pro 7 16IRX8H (v6.85.6300) | |
| Asus ROG Strix G16 G614JZ (v6.75.6100) | |
| Razer Blade 16 Early 2023 (v6.85.6300) | |
| Razer Blade 16 Early 2023 (v6.92.6600) | |
| Razer Blade 16 Early 2023 (v8.20.8100) | |
| Average Intel Core i9-13900HX (1284 - 1958, n=22) | |
| HP Omen 17-ck2097ng (v6.75.6100, Leistung) | |
| Average of class Gaming (574 - 2531, n=107, last 2 years) | |
| HP Omen 17-ck2097ng (v6.75.6100) | |
| Alienware m17 R5 (R9 6900HX, RX 6850M XT) (v6.75.6100) | |
| AIDA64 / FP64 Ray-Trace | |
| Average of class Gaming (5509 - 45446, n=107, last 2 years) | |
| Lenovo Legion Pro 7 16IRX8H (v6.85.6300) | |
| Asus ROG Strix G16 G614JZ (v6.75.6100) | |
| Razer Blade 16 Early 2023 (v6.85.6300) | |
| Razer Blade 16 Early 2023 (v6.92.6600) | |
| Razer Blade 16 Early 2023 (v8.20.8100) | |
| Average Intel Core i9-13900HX (9481 - 15279, n=22) | |
| HP Omen 17-ck2097ng (v6.75.6100, Leistung) | |
| HP Omen 17-ck2097ng (v6.75.6100) | |
| Alienware m17 R5 (R9 6900HX, RX 6850M XT) (v6.75.6100) | |
| AIDA64 / CPU PhotoWorxx | |
| Razer Blade 16 Early 2023 (v6.85.6300) | |
| Razer Blade 16 Early 2023 (v6.92.6600) | |
| Razer Blade 16 Early 2023 (v8.20.8100) | |
| HP Omen 17-ck2097ng (v6.75.6100) | |
| HP Omen 17-ck2097ng (v6.75.6100, Leistung) | |
| Lenovo Legion Pro 7 16IRX8H (v6.85.6300) | |
| Average Intel Core i9-13900HX (42994 - 51994, n=22) | |
| Average of class Gaming (12271 - 89891, n=107, last 2 years) | |
| Asus ROG Strix G16 G614JZ (v6.75.6100) | |
| Alienware m17 R5 (R9 6900HX, RX 6850M XT) (v6.75.6100) | |
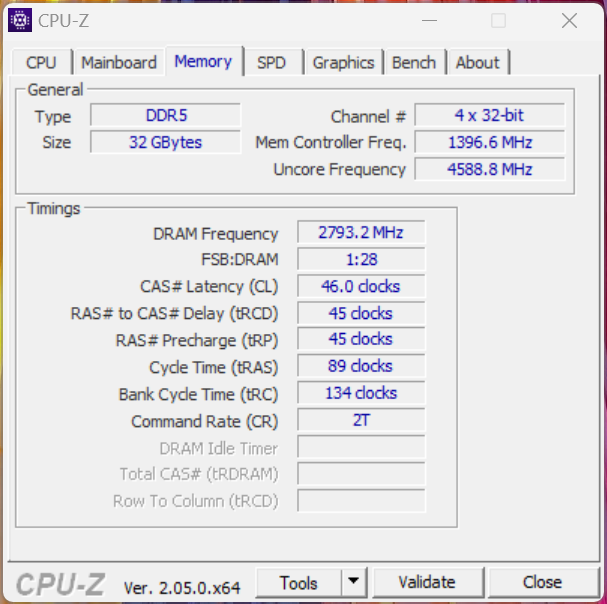
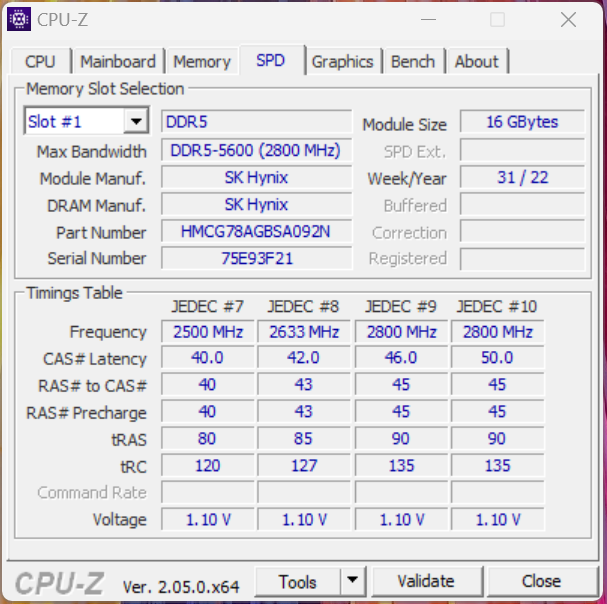
System Performance
The smoothly running system offers sufficient computing performance for power-hungry application areas such as rendering and gaming. The transfer rates of the working memory range at normal levels for DDR5-5600 storage. They are accompanied by good PC-Mark results.
CrossMark: Overall | Productivity | Creativity | Responsiveness
| PCMark 10 / Score | |
| Average of class Gaming (5828 - 11574, n=95, last 2 years) | |
| Average Intel Core i9-13900HX, NVIDIA GeForce RTX 4080 Laptop GPU (7609 - 8549, n=3) | |
| Razer Blade 16 Early 2023 | |
| Lenovo Legion Pro 7 16IRX8H | |
| HP Omen 17-ck2097ng | |
| Alienware m17 R5 (R9 6900HX, RX 6850M XT) | |
| Asus ROG Strix G16 G614JZ | |
| PCMark 10 / Essentials | |
| Asus ROG Strix G16 G614JZ | |
| HP Omen 17-ck2097ng | |
| Lenovo Legion Pro 7 16IRX8H | |
| Average Intel Core i9-13900HX, NVIDIA GeForce RTX 4080 Laptop GPU (10982 - 11824, n=3) | |
| Razer Blade 16 Early 2023 | |
| Average of class Gaming (8810 - 12600, n=99, last 2 years) | |
| Alienware m17 R5 (R9 6900HX, RX 6850M XT) | |
| PCMark 10 / Productivity | |
| Average of class Gaming (6845 - 21327, n=97, last 2 years) | |
| Lenovo Legion Pro 7 16IRX8H | |
| Average Intel Core i9-13900HX, NVIDIA GeForce RTX 4080 Laptop GPU (9976 - 10788, n=3) | |
| HP Omen 17-ck2097ng | |
| Alienware m17 R5 (R9 6900HX, RX 6850M XT) | |
| Razer Blade 16 Early 2023 | |
| Asus ROG Strix G16 G614JZ | |
| PCMark 10 / Digital Content Creation | |
| Razer Blade 16 Early 2023 | |
| Average of class Gaming (7602 - 19657, n=97, last 2 years) | |
| Average Intel Core i9-13900HX, NVIDIA GeForce RTX 4080 Laptop GPU (10135 - 14720, n=3) | |
| Alienware m17 R5 (R9 6900HX, RX 6850M XT) | |
| Asus ROG Strix G16 G614JZ | |
| Lenovo Legion Pro 7 16IRX8H | |
| HP Omen 17-ck2097ng | |
| CrossMark / Overall | |
| Asus ROG Strix G16 G614JZ | |
| Average Intel Core i9-13900HX, NVIDIA GeForce RTX 4080 Laptop GPU (1991 - 2194, n=2) | |
| HP Omen 17-ck2097ng | |
| Average of class Gaming (1366 - 2409, n=95, last 2 years) | |
| Alienware m17 R5 (R9 6900HX, RX 6850M XT) | |
| Razer Blade 16 Early 2023 | |
| CrossMark / Productivity | |
| Asus ROG Strix G16 G614JZ | |
| Average Intel Core i9-13900HX, NVIDIA GeForce RTX 4080 Laptop GPU (1828 - 2059, n=2) | |
| Average of class Gaming (1386 - 2254, n=95, last 2 years) | |
| HP Omen 17-ck2097ng | |
| Alienware m17 R5 (R9 6900HX, RX 6850M XT) | |
| Razer Blade 16 Early 2023 | |
| CrossMark / Creativity | |
| Asus ROG Strix G16 G614JZ | |
| Average Intel Core i9-13900HX, NVIDIA GeForce RTX 4080 Laptop GPU (2239 - 2411, n=2) | |
| Average of class Gaming (1343 - 2729, n=95, last 2 years) | |
| HP Omen 17-ck2097ng | |
| Razer Blade 16 Early 2023 | |
| Alienware m17 R5 (R9 6900HX, RX 6850M XT) | |
| CrossMark / Responsiveness | |
| Asus ROG Strix G16 G614JZ | |
| Average Intel Core i9-13900HX, NVIDIA GeForce RTX 4080 Laptop GPU (1808 - 1998, n=2) | |
| HP Omen 17-ck2097ng | |
| Average of class Gaming (1226 - 2334, n=95, last 2 years) | |
| Razer Blade 16 Early 2023 | |
| Alienware m17 R5 (R9 6900HX, RX 6850M XT) | |
| PCMark 8 Home Score Accelerated v2 | 5074 points | |
| PCMark 8 Work Score Accelerated v2 | 6244 points | |
| PCMark 10 Score | 7609 points | |
Help | ||
| AIDA64 / Memory Copy | |
| Razer Blade 16 Early 2023 | |
| Razer Blade 16 Early 2023 | |
| Razer Blade 16 Early 2023 | |
| HP Omen 17-ck2097ng | |
| Lenovo Legion Pro 7 16IRX8H | |
| Average Intel Core i9-13900HX (67716 - 79193, n=22) | |
| Average of class Gaming (21750 - 129946, n=107, last 2 years) | |
| Asus ROG Strix G16 G614JZ | |
| HP Omen 17-ck1075ng | |
| Alienware m17 R5 (R9 6900HX, RX 6850M XT) | |
| AIDA64 / Memory Read | |
| Razer Blade 16 Early 2023 | |
| Razer Blade 16 Early 2023 | |
| Razer Blade 16 Early 2023 | |
| HP Omen 17-ck2097ng | |
| Lenovo Legion Pro 7 16IRX8H | |
| Average Intel Core i9-13900HX (73998 - 88462, n=22) | |
| Average of class Gaming (22956 - 118858, n=107, last 2 years) | |
| Asus ROG Strix G16 G614JZ | |
| HP Omen 17-ck1075ng | |
| Alienware m17 R5 (R9 6900HX, RX 6850M XT) | |
| AIDA64 / Memory Write | |
| Razer Blade 16 Early 2023 | |
| Razer Blade 16 Early 2023 | |
| Razer Blade 16 Early 2023 | |
| HP Omen 17-ck2097ng | |
| Average of class Gaming (22297 - 135096, n=107, last 2 years) | |
| Average Intel Core i9-13900HX (65472 - 77045, n=22) | |
| Lenovo Legion Pro 7 16IRX8H | |
| Asus ROG Strix G16 G614JZ | |
| HP Omen 17-ck1075ng | |
| Alienware m17 R5 (R9 6900HX, RX 6850M XT) | |
| AIDA64 / Memory Latency | |
| Average of class Gaming (75.3 - 259, n=107, last 2 years) | |
| HP Omen 17-ck1075ng | |
| Razer Blade 16 Early 2023 | |
| Razer Blade 16 Early 2023 | |
| Razer Blade 16 Early 2023 | |
| Alienware m17 R5 (R9 6900HX, RX 6850M XT) | |
| Asus ROG Strix G16 G614JZ | |
| Average Intel Core i9-13900HX (75.3 - 91.1, n=22) | |
| HP Omen 17-ck2097ng | |
| Lenovo Legion Pro 7 16IRX8H | |
* ... smaller is better
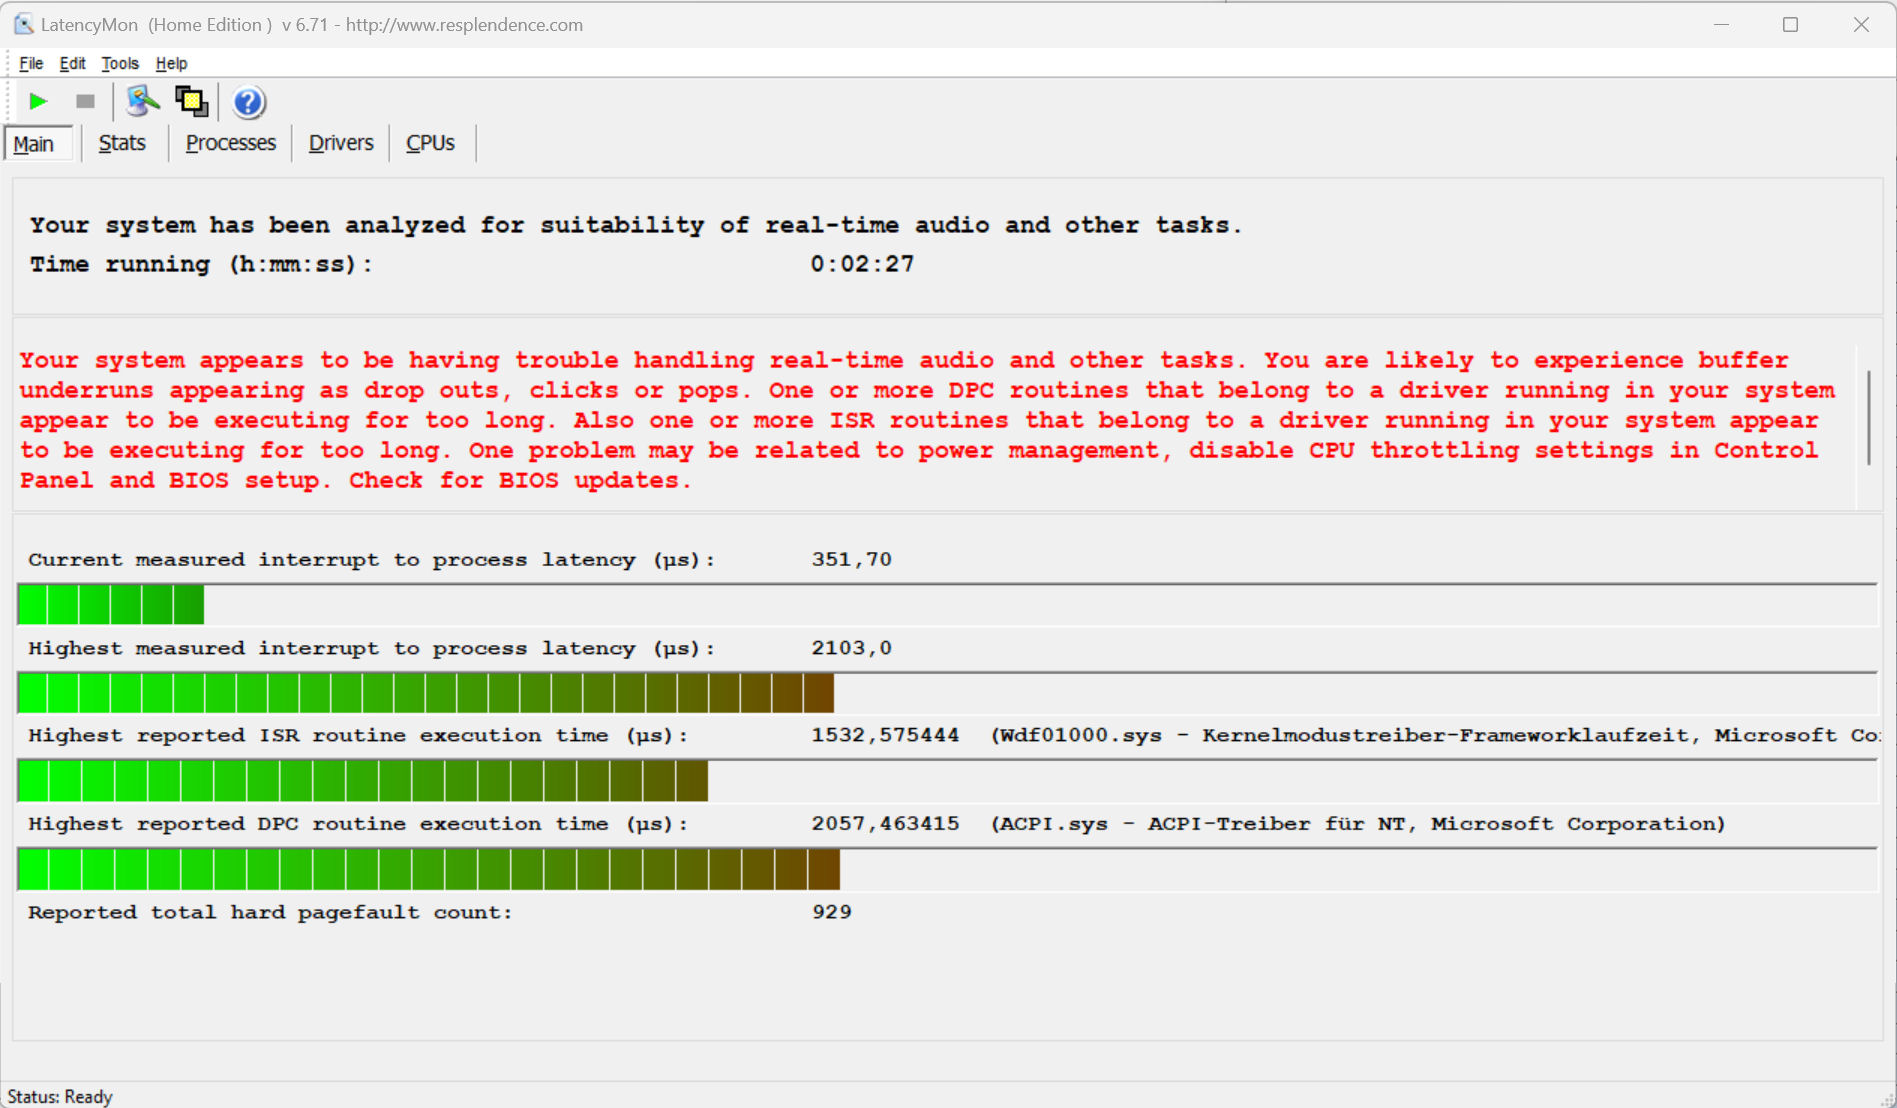
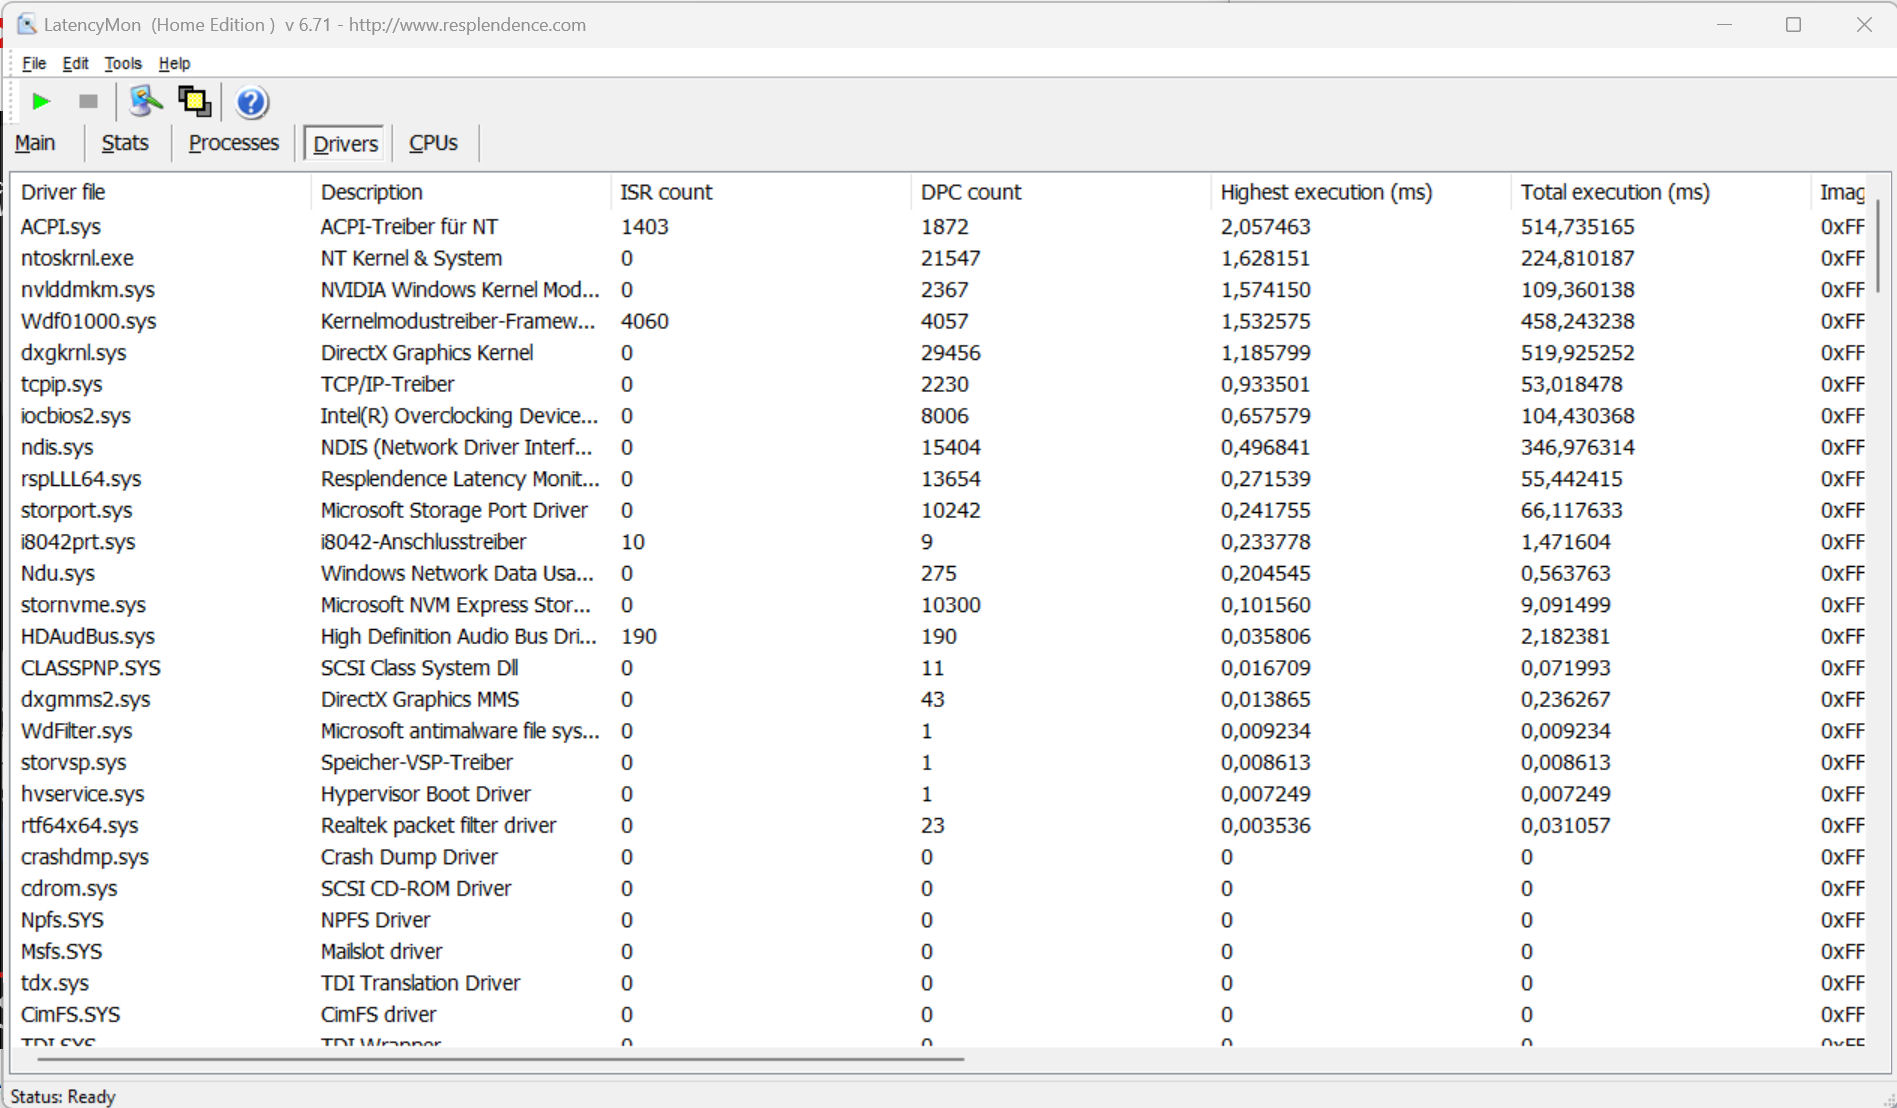
DPC Latencies
The standardized Latency Monitor test (web surfing, 4k video reproduction, Prime95 high load) reveals some conspicuous behavior. The system doesn't appear to be suited for video and audio processing in real-time. Future software updates may lead to some improvements or make things even worse.
| DPC Latencies / LatencyMon - interrupt to process latency (max), Web, Youtube, Prime95 | |
| Asus ROG Strix G16 G614JZ | |
| Razer Blade 16 Early 2023 | |
| HP Omen 17-ck2097ng | |
| Alienware m17 R5 (R9 6900HX, RX 6850M XT) | |
| Lenovo Legion Pro 7 16IRX8H | |
* ... smaller is better
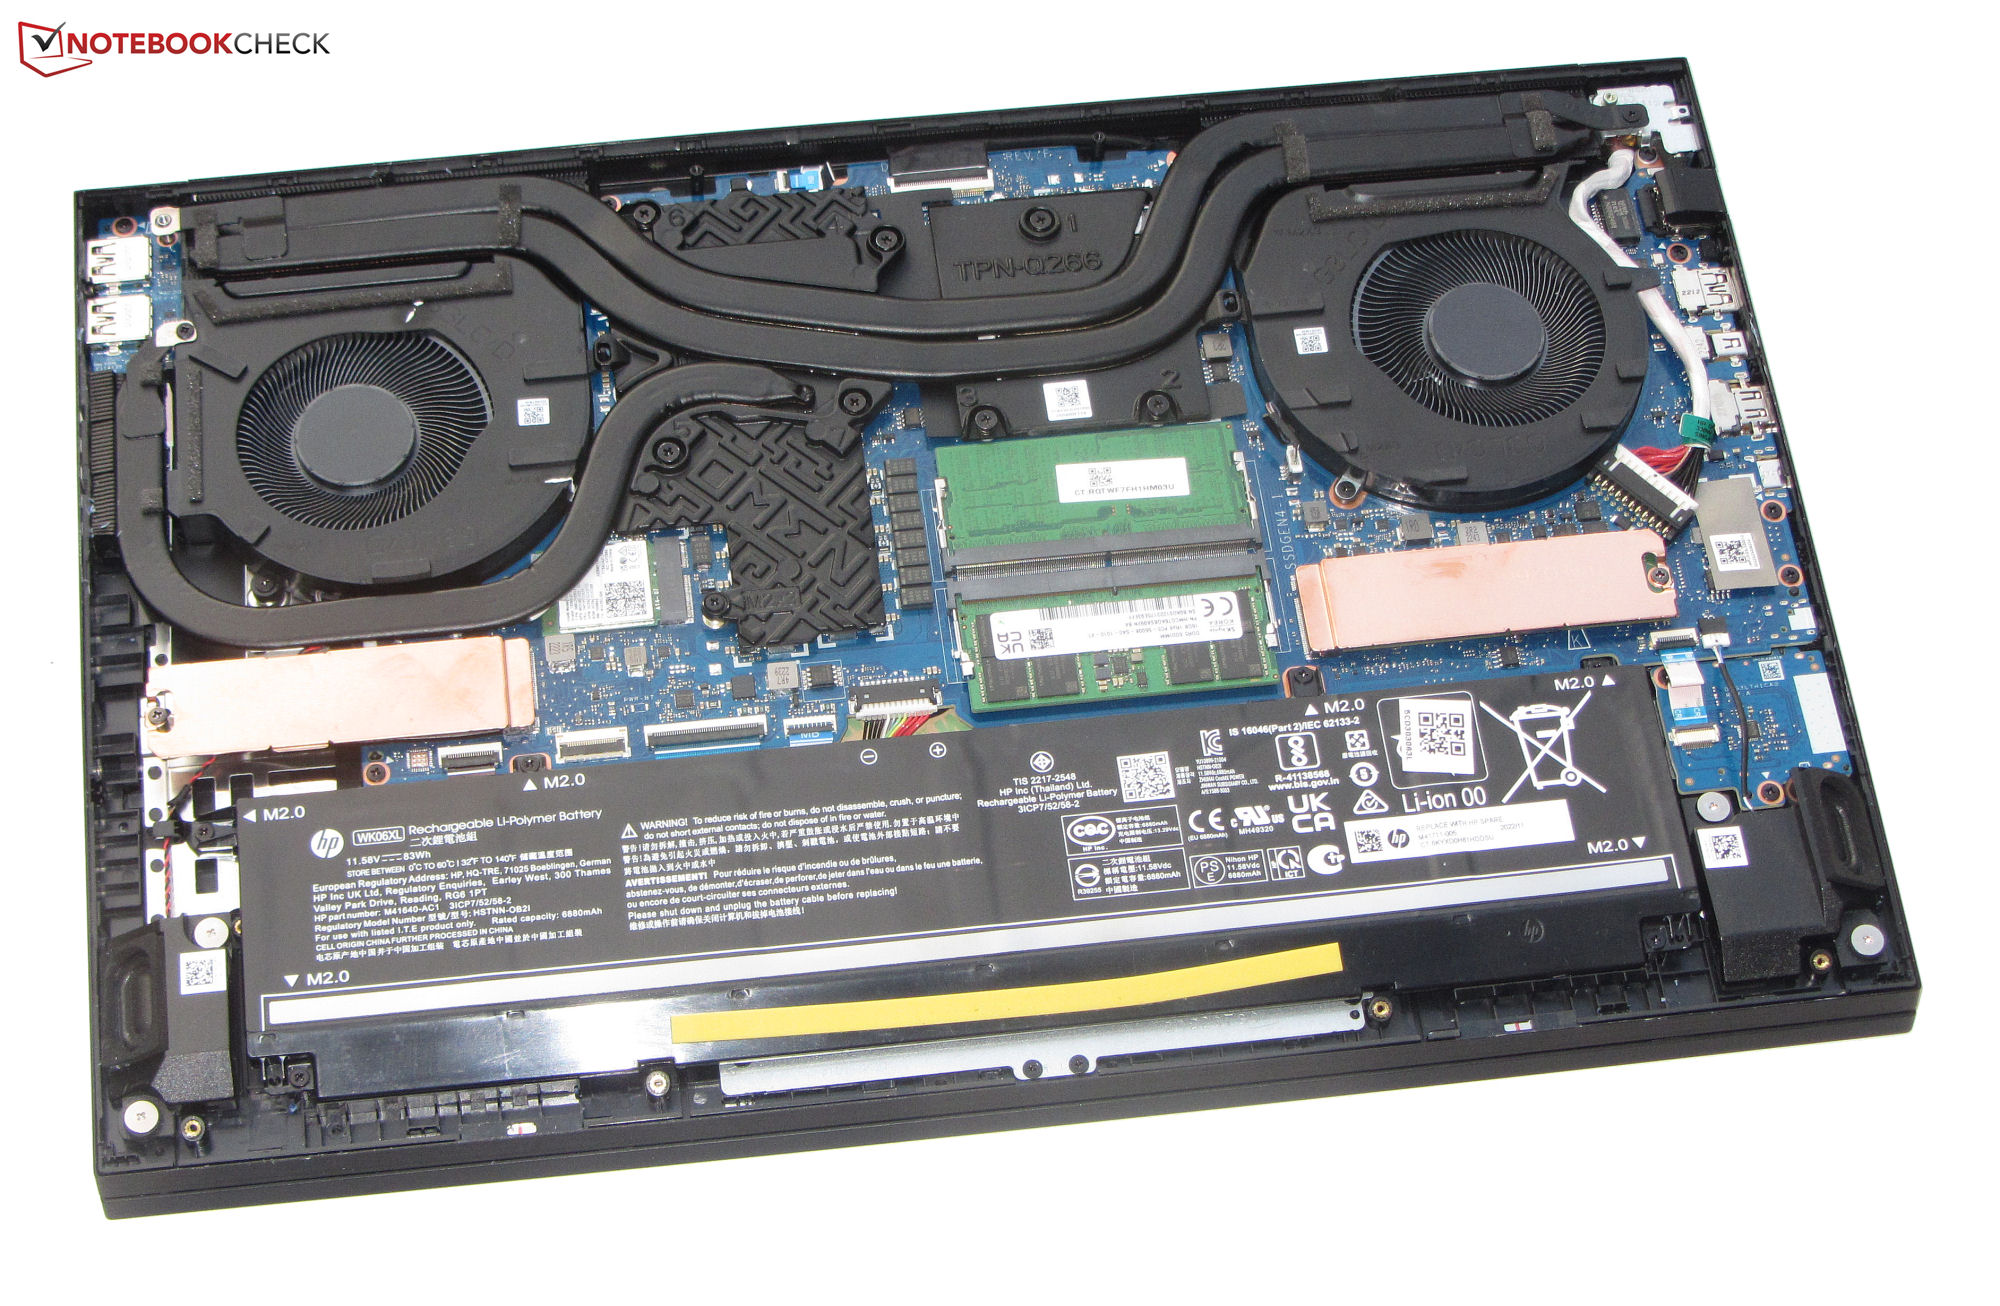
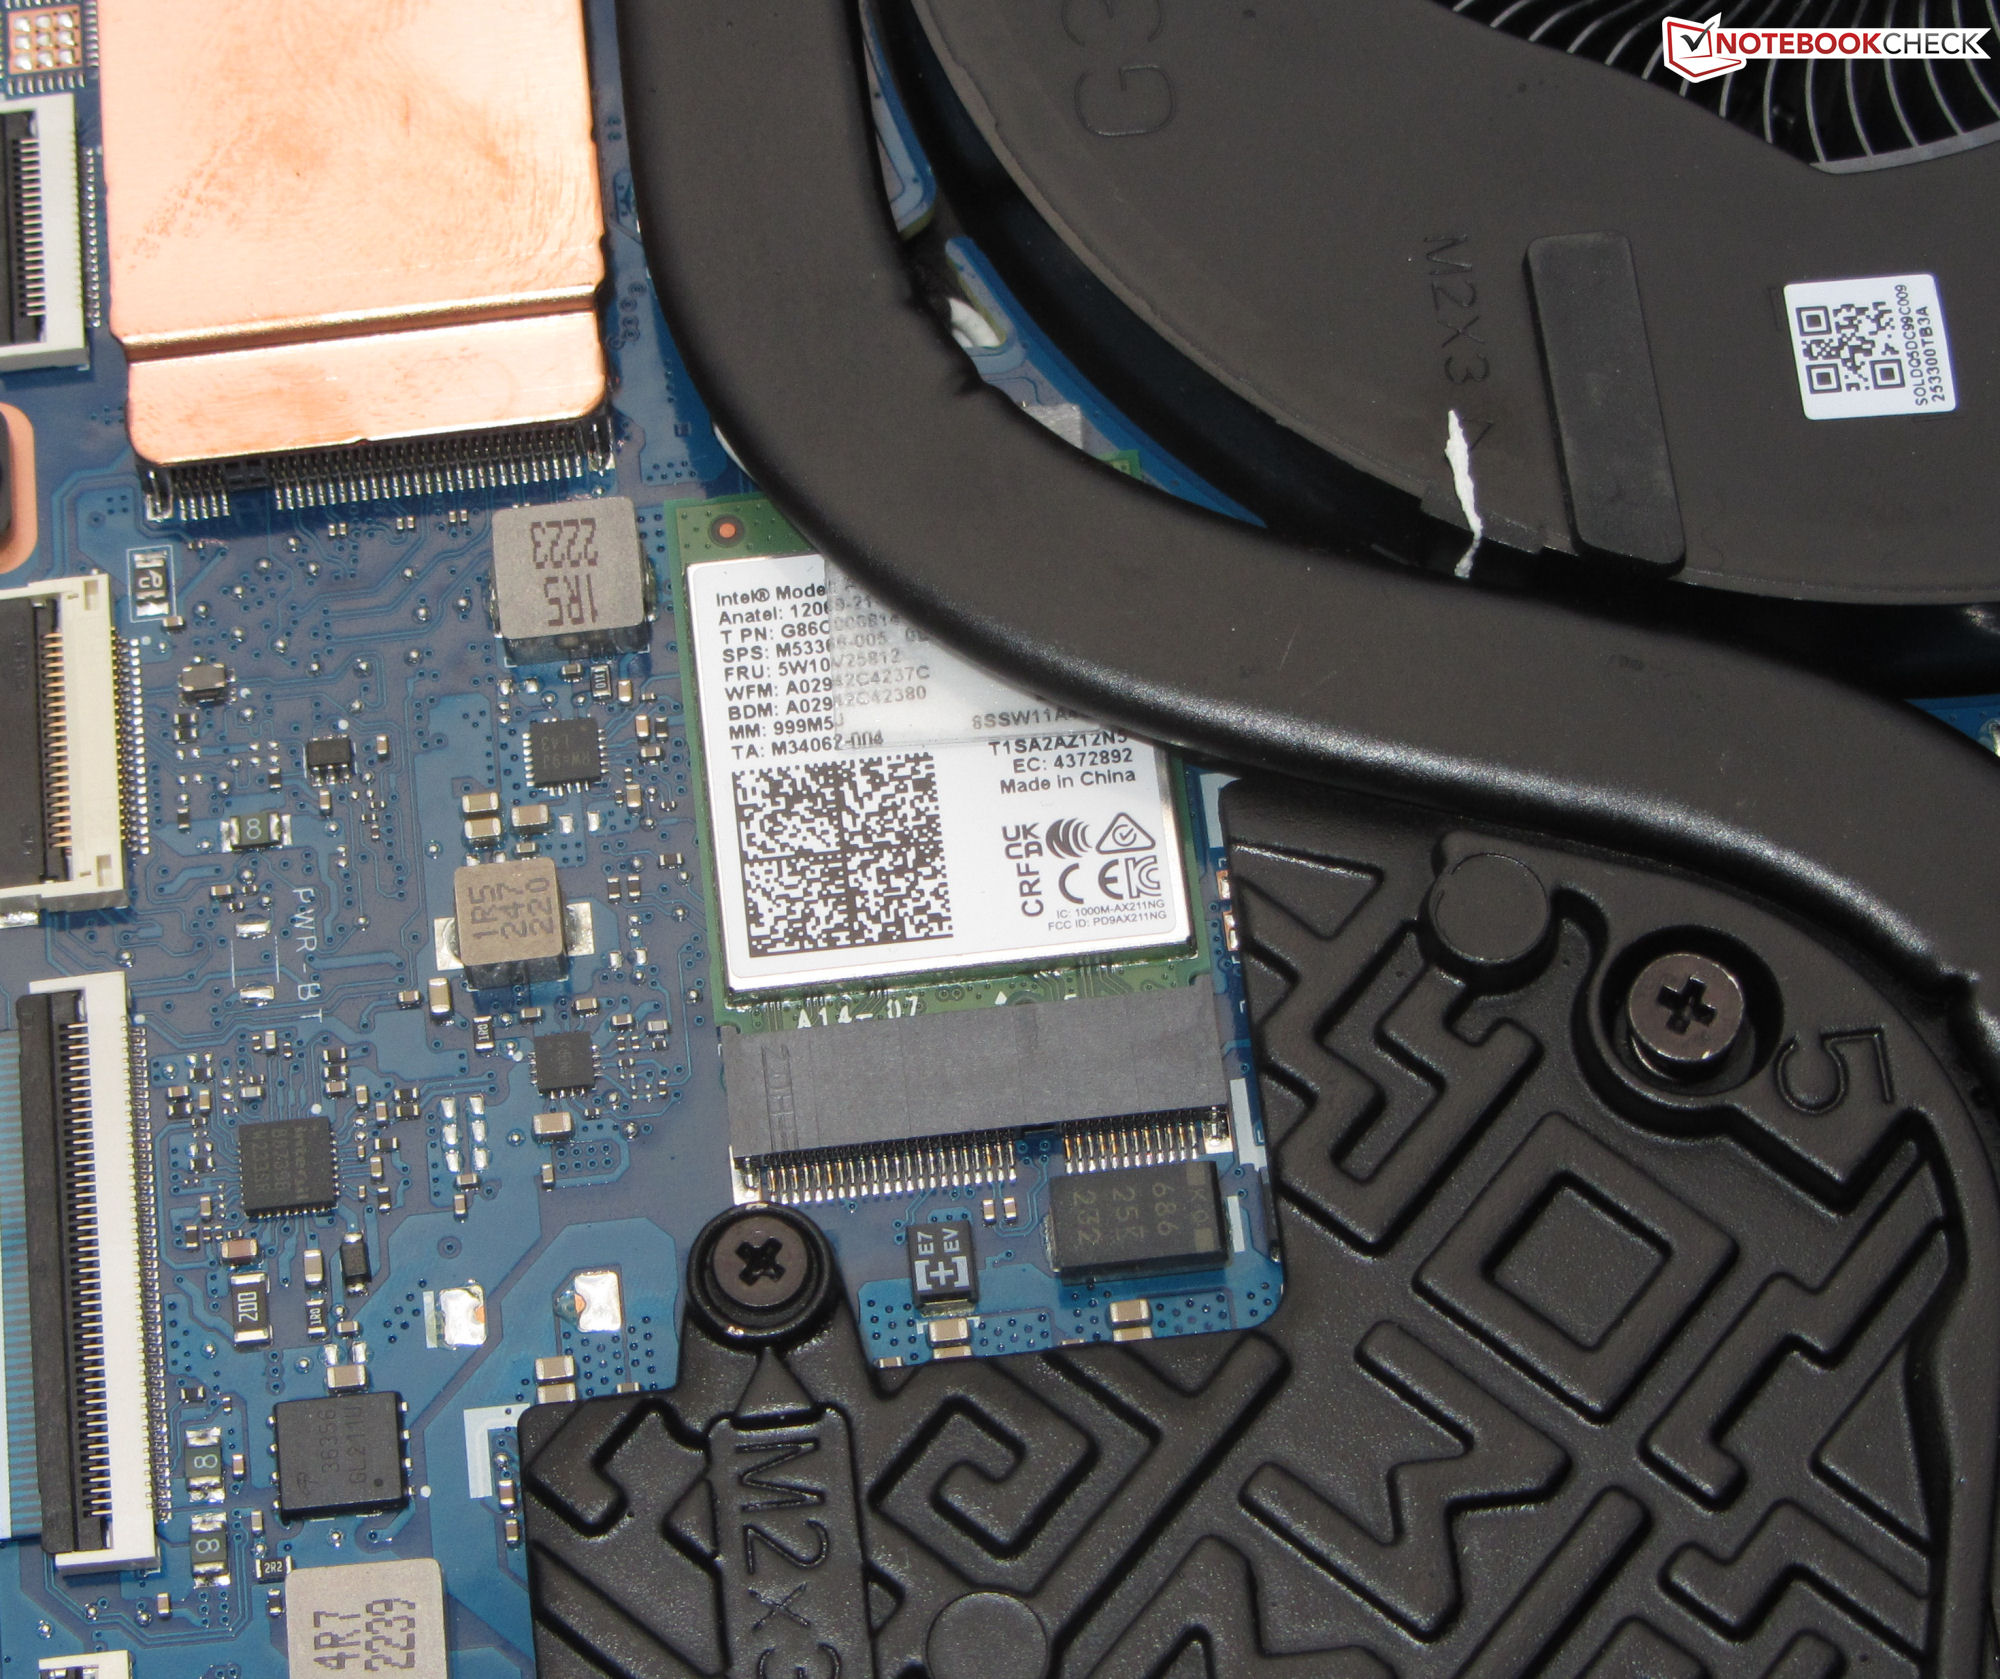
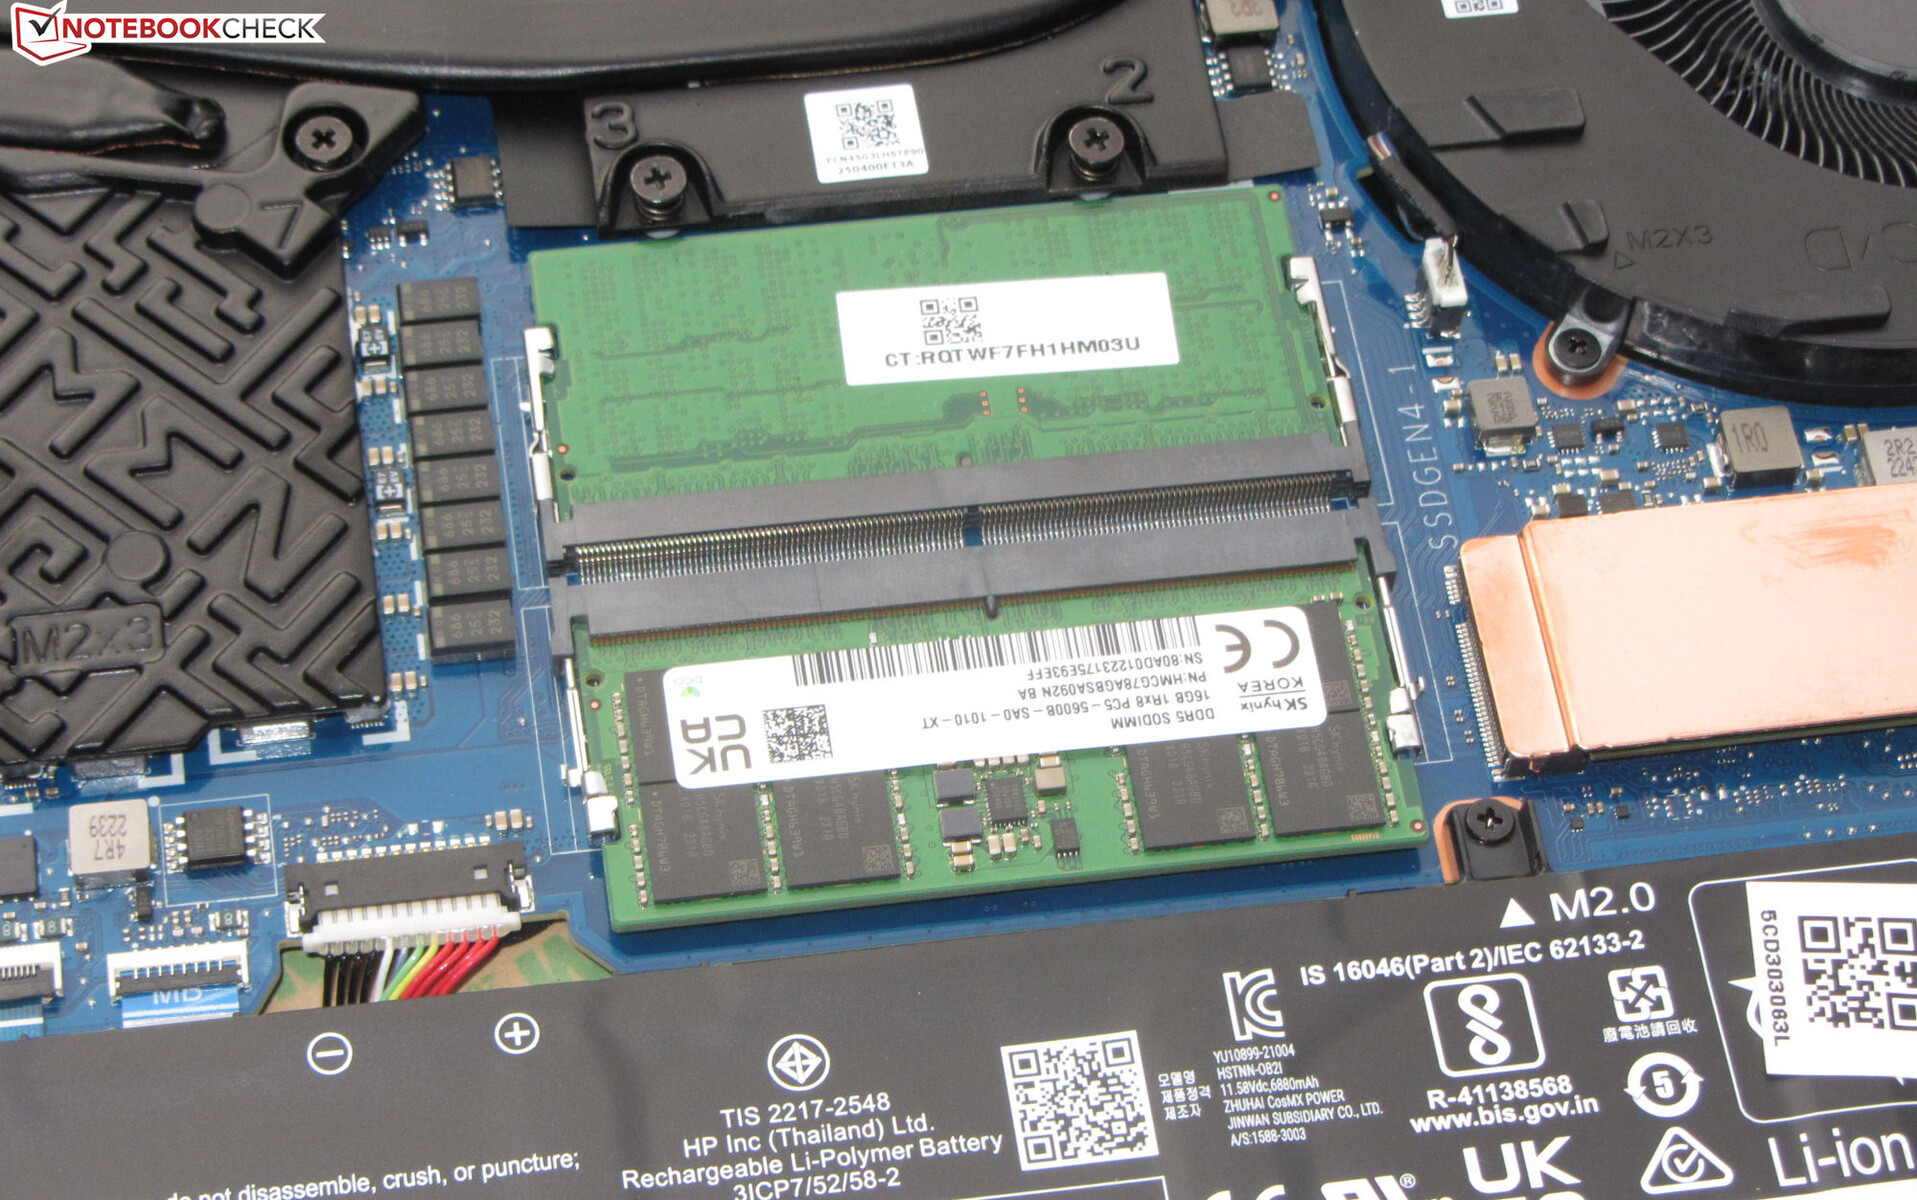
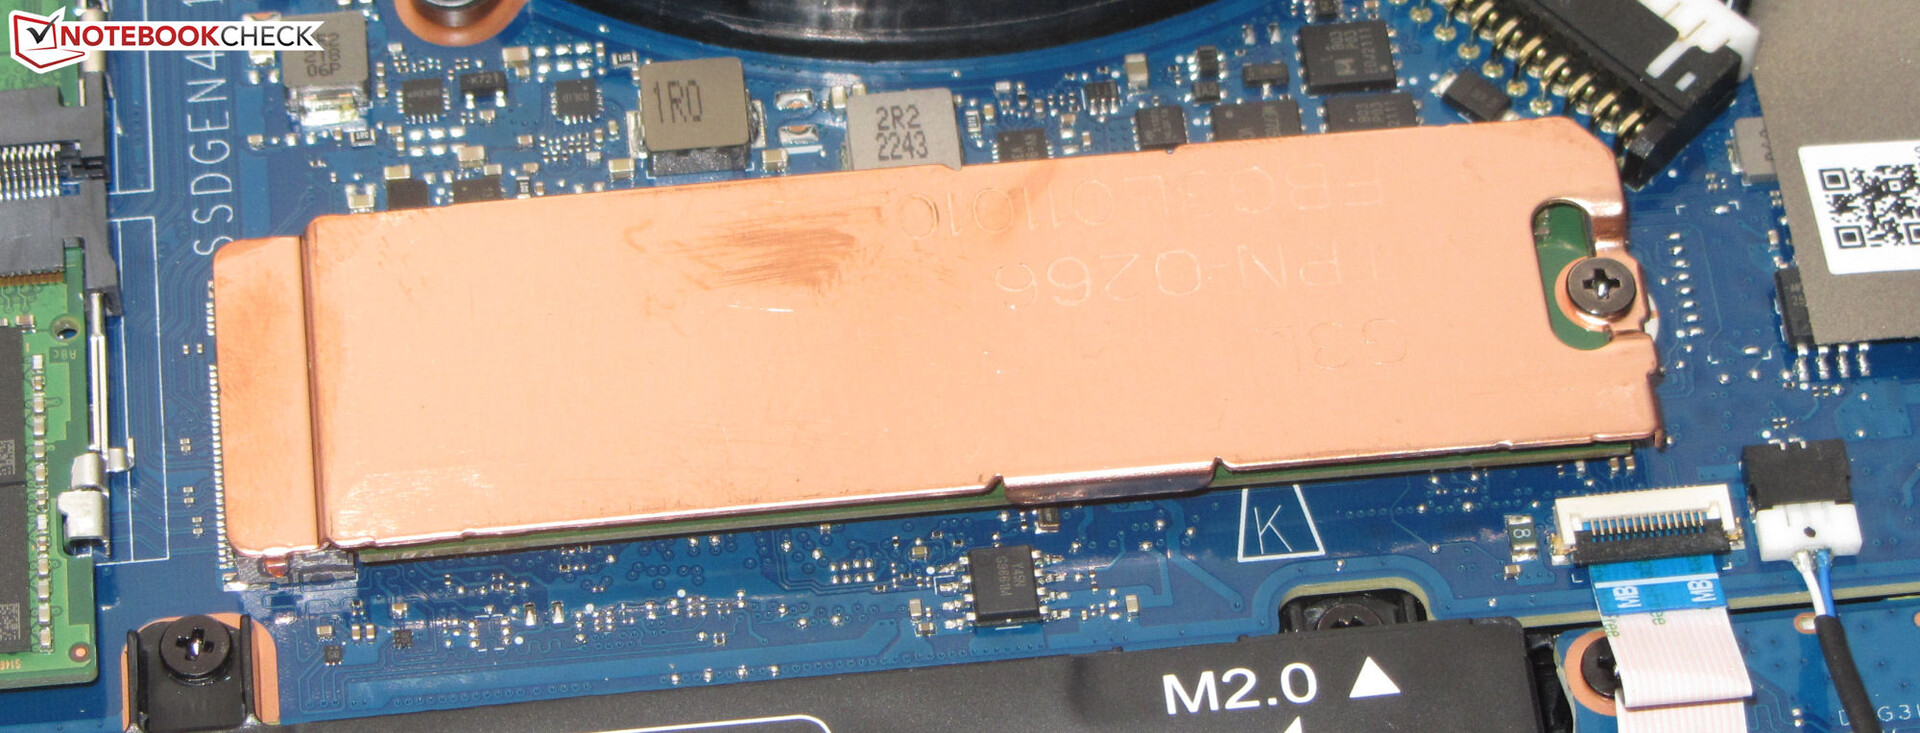
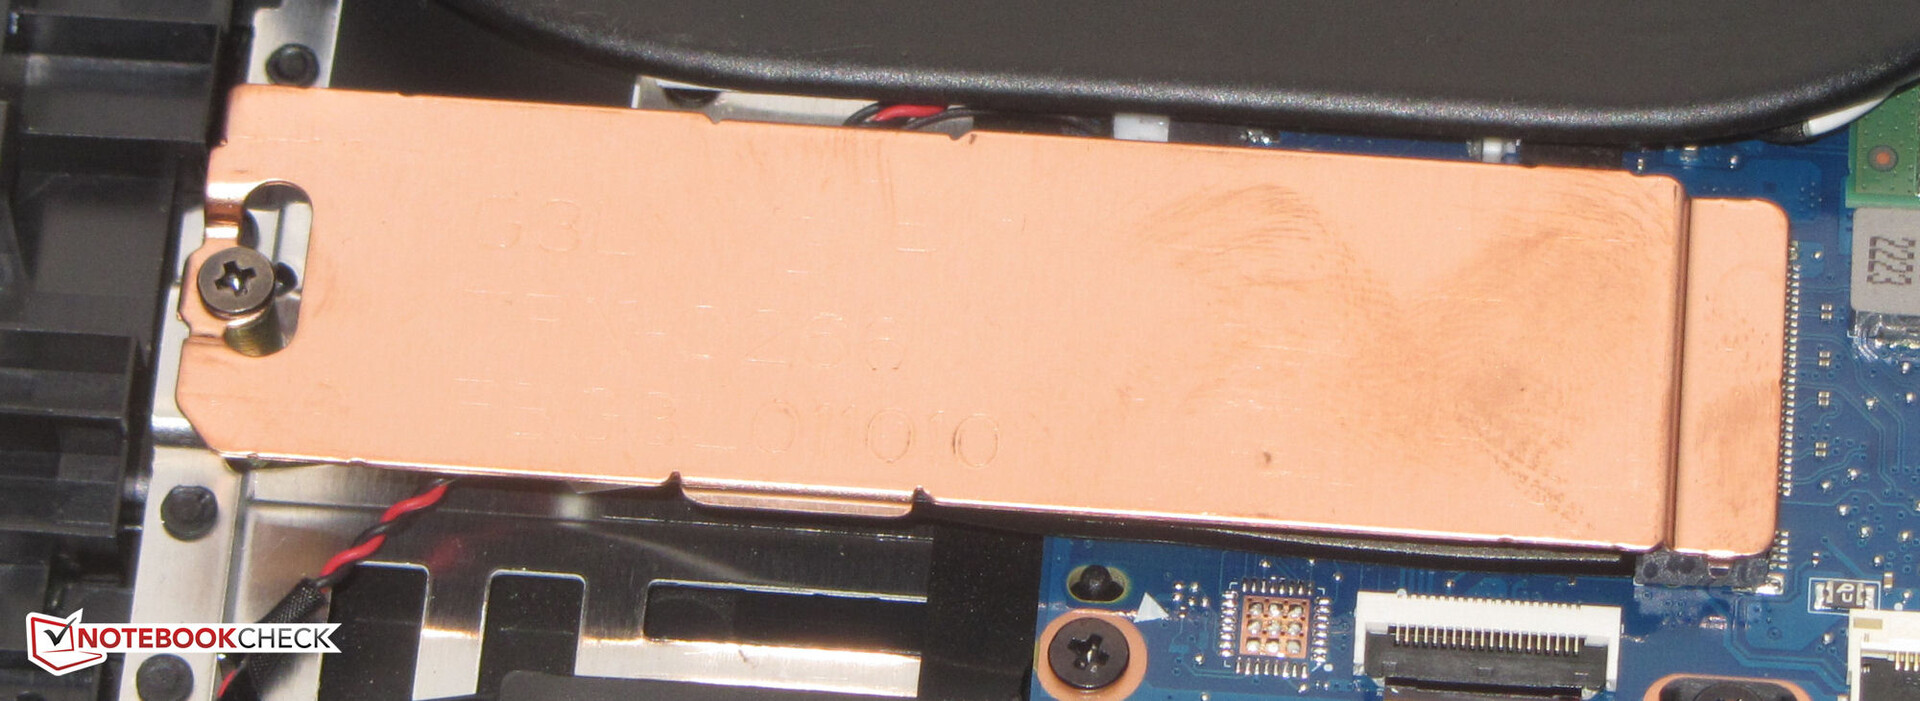
Storage Solution
The Omen offers space for two PCIe 4 SSDs in the M.2-2280 format. The PCIe 4 SSD (1 TB) from SK Hynix that is used here delivers very good transfer rates. However, in the later parts of the DiskSpd loop, we observe some occasional performance drops, probably due to thermal throttling.

* ... smaller is better
Disk Throttling: DiskSpd Read Loop, Queue Depth 8
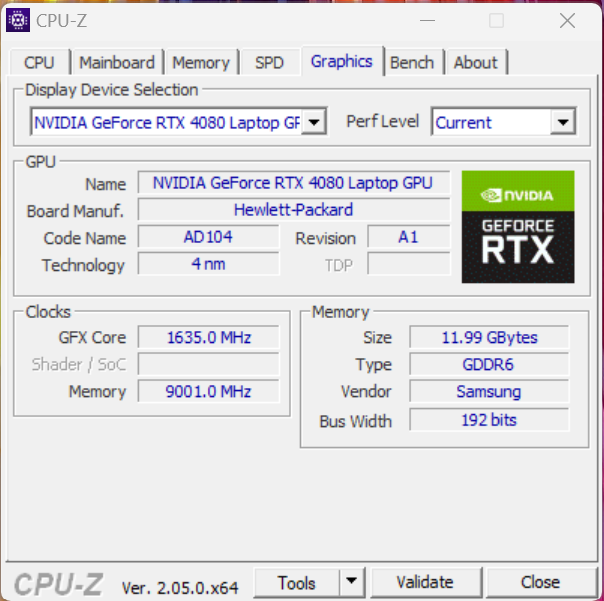
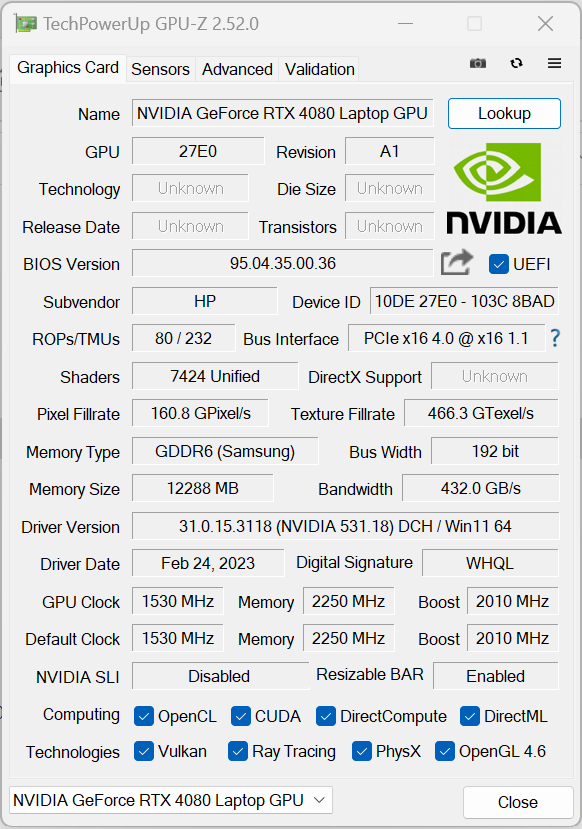
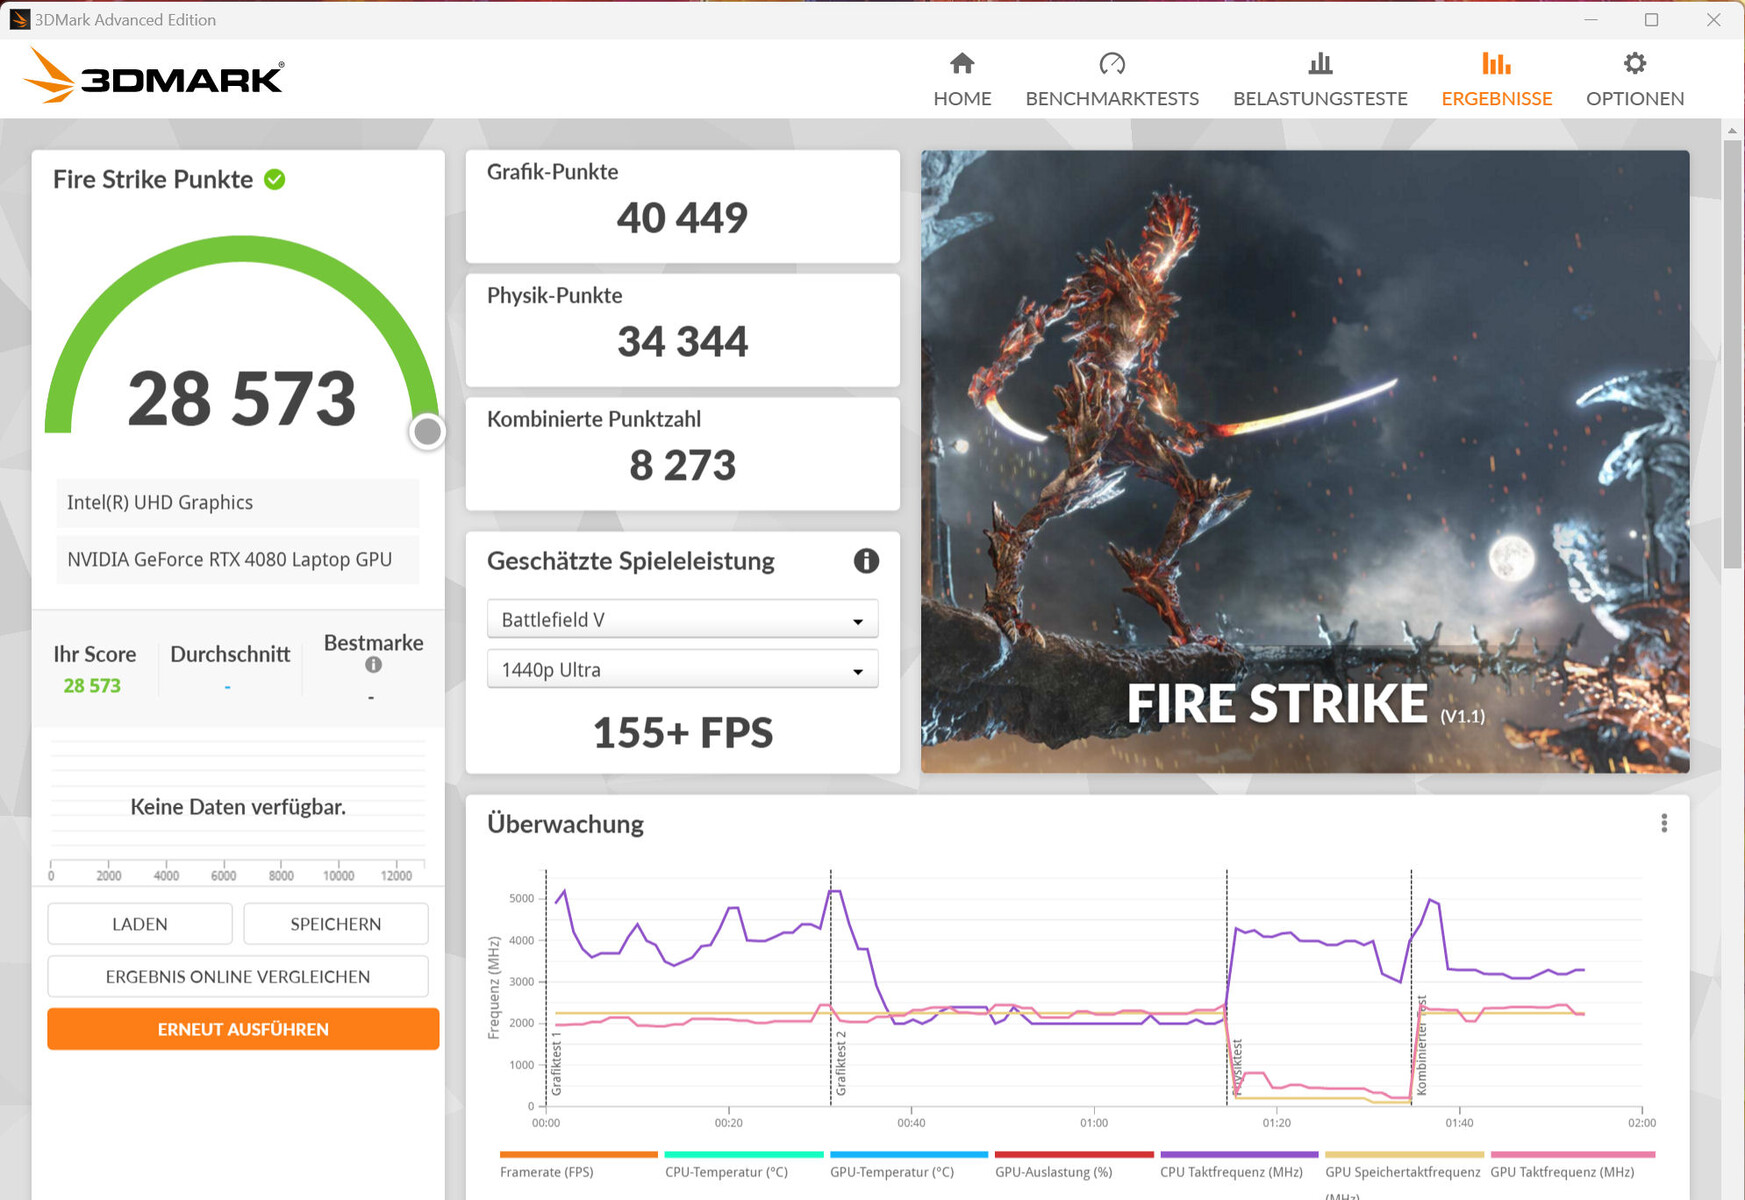
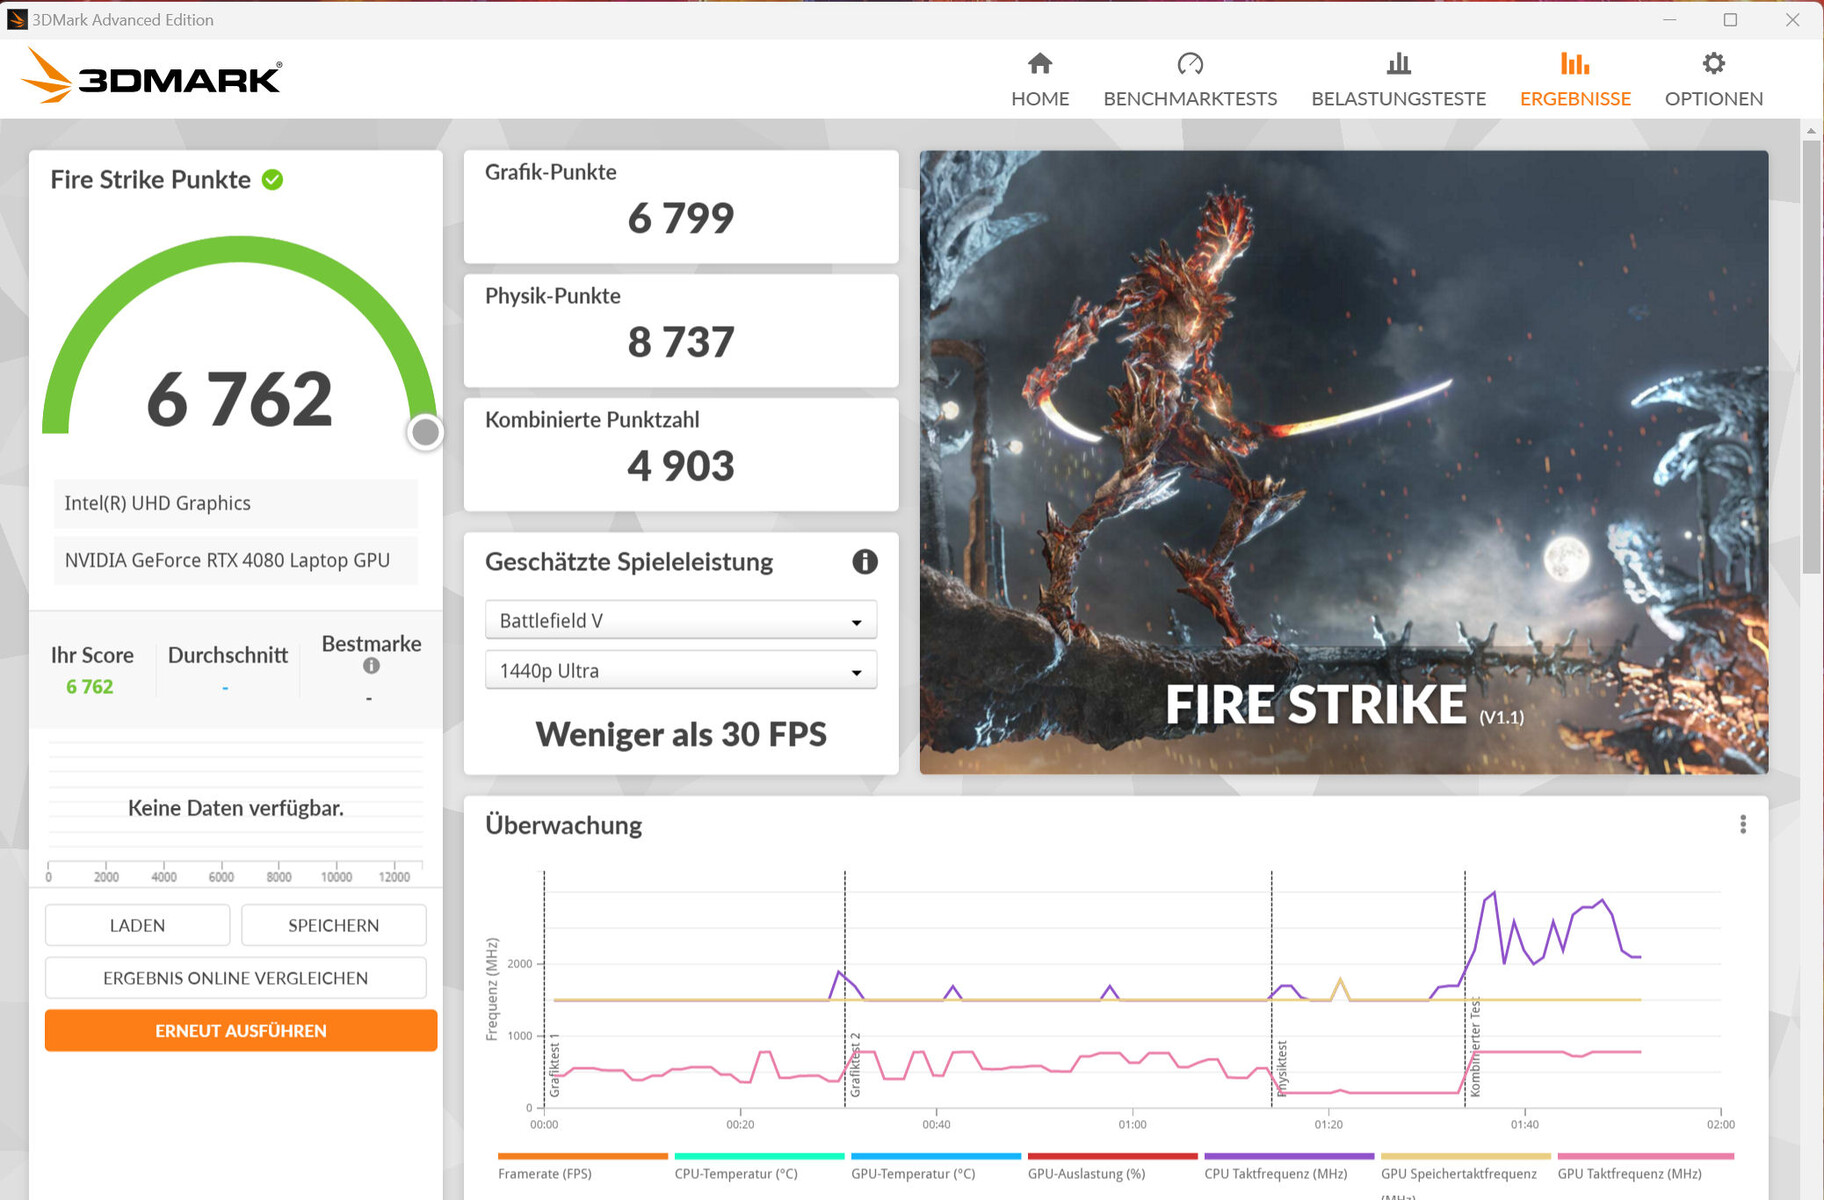
Graphics Card
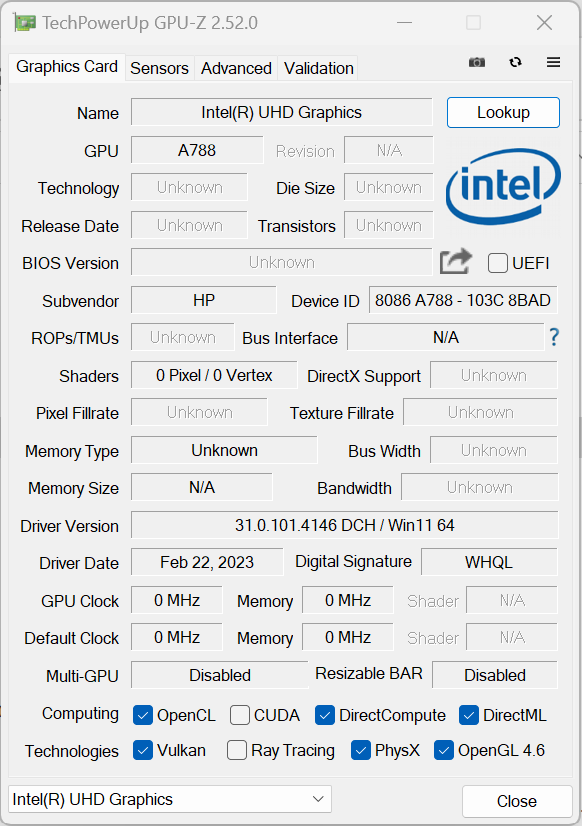
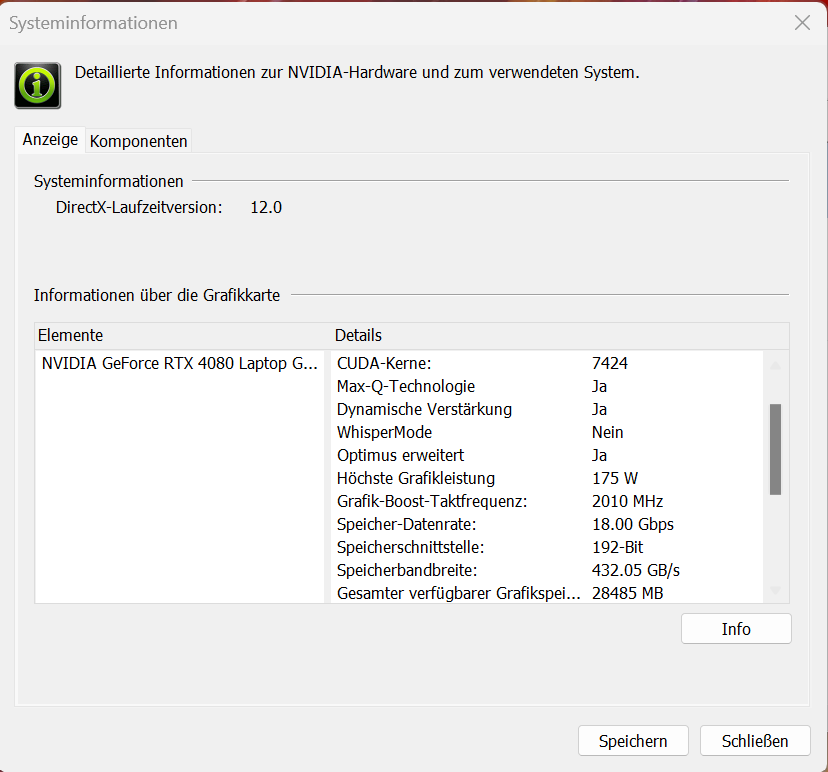
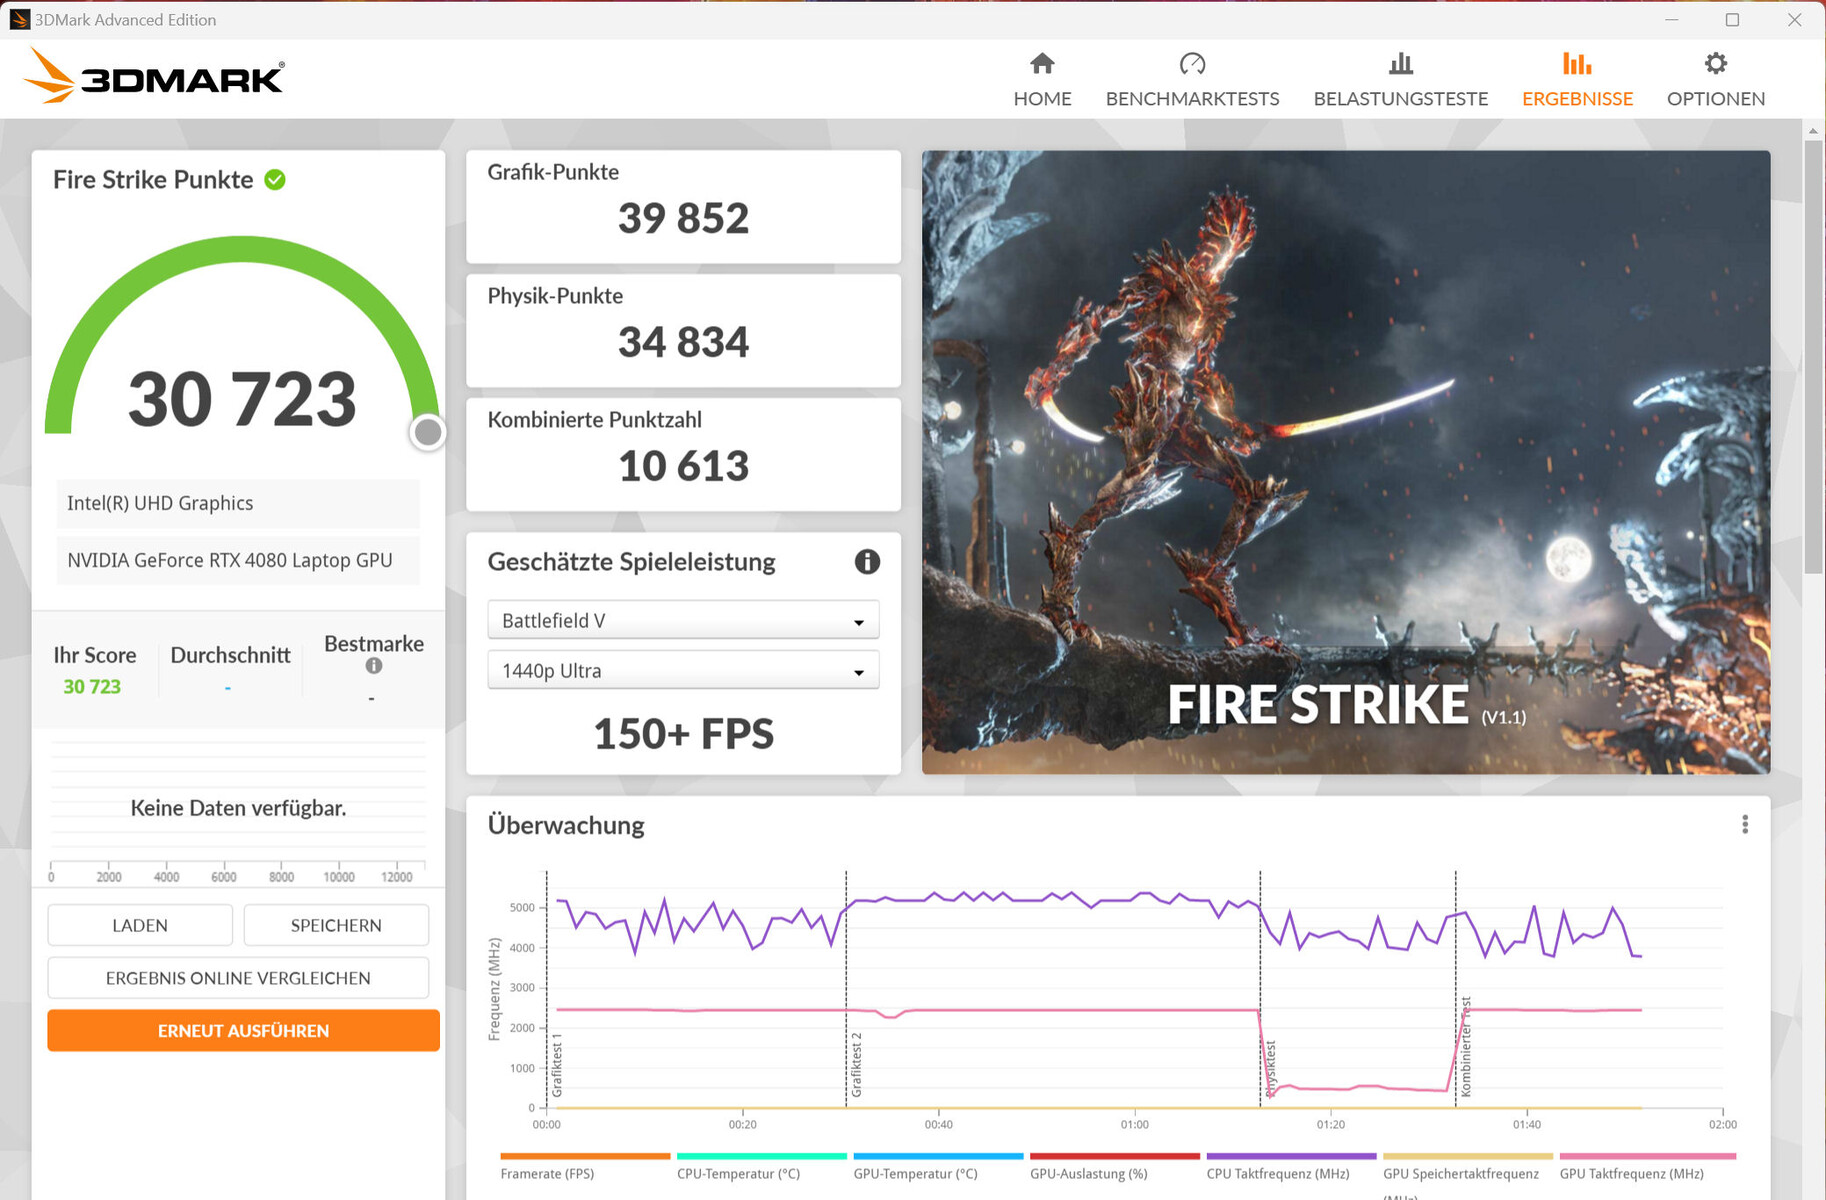
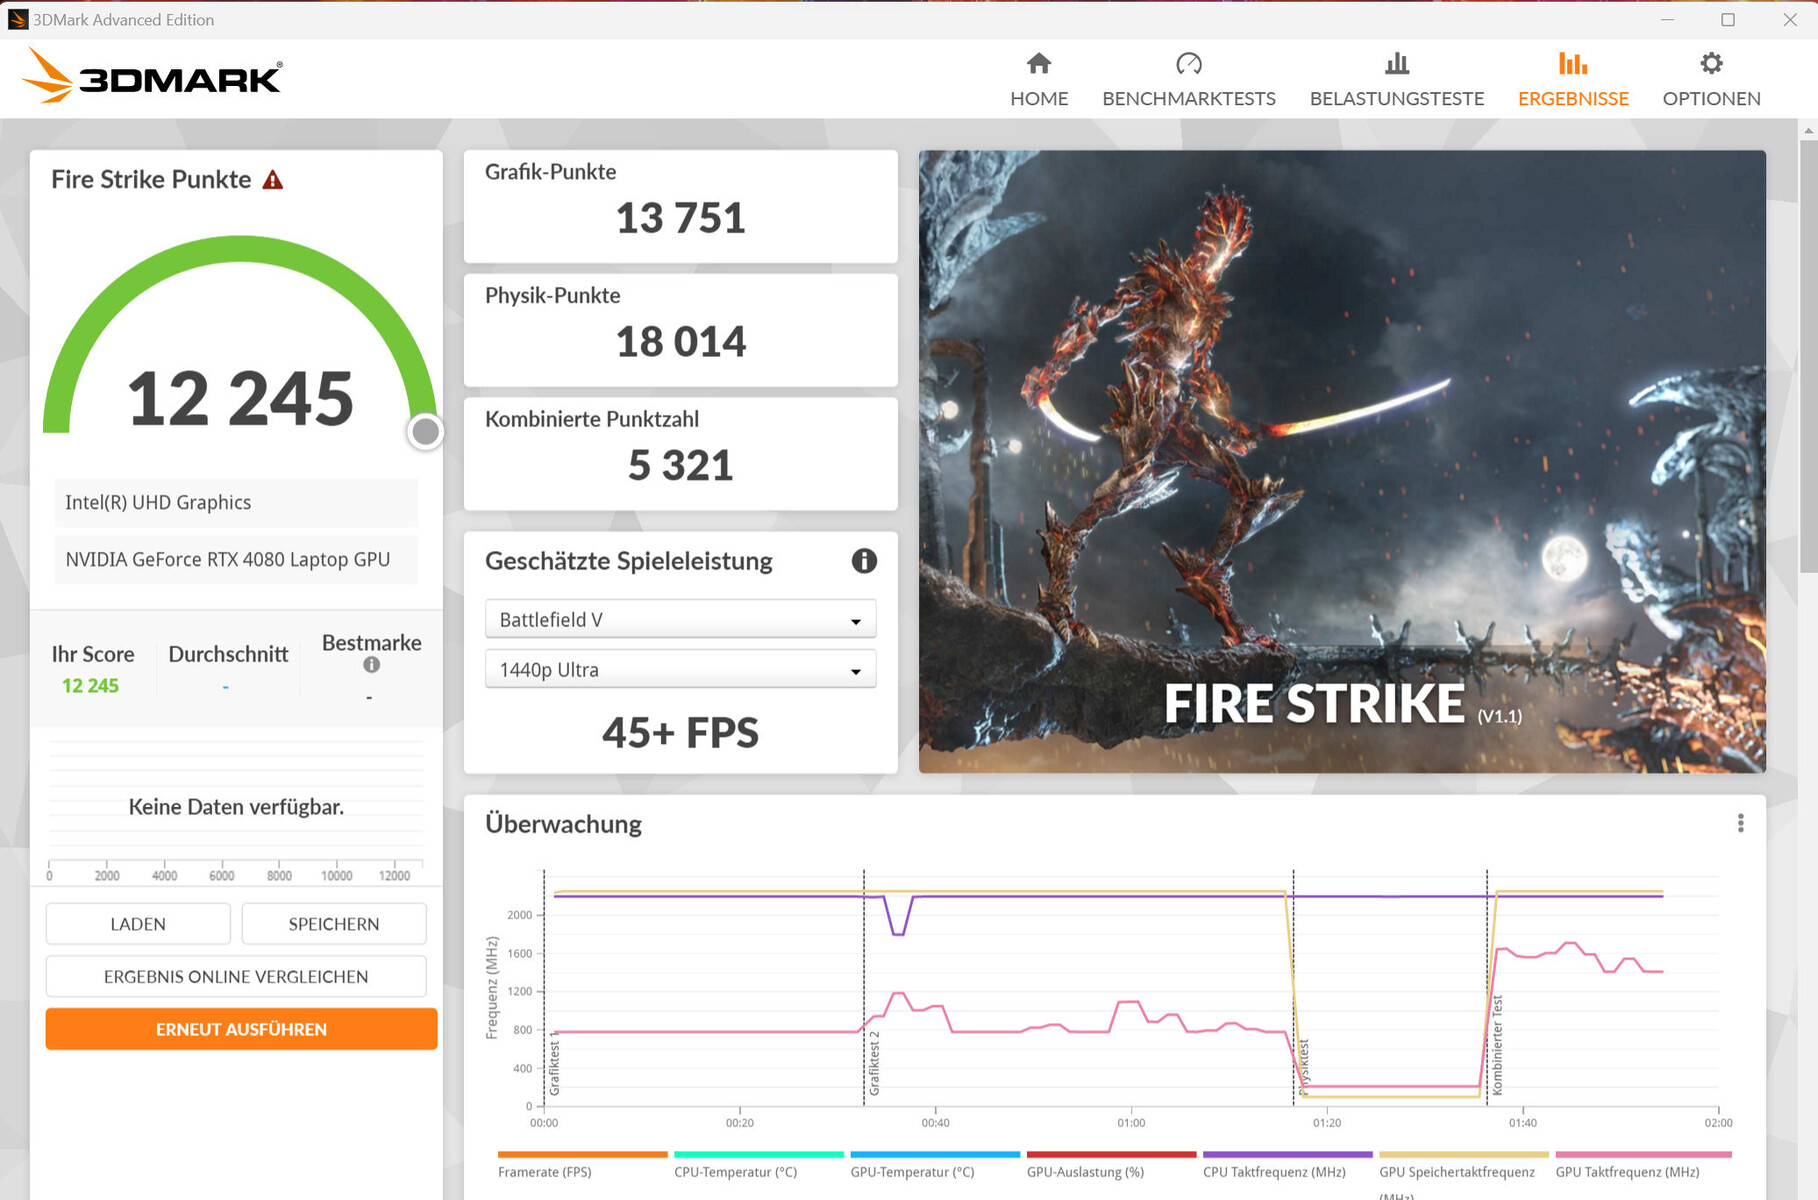
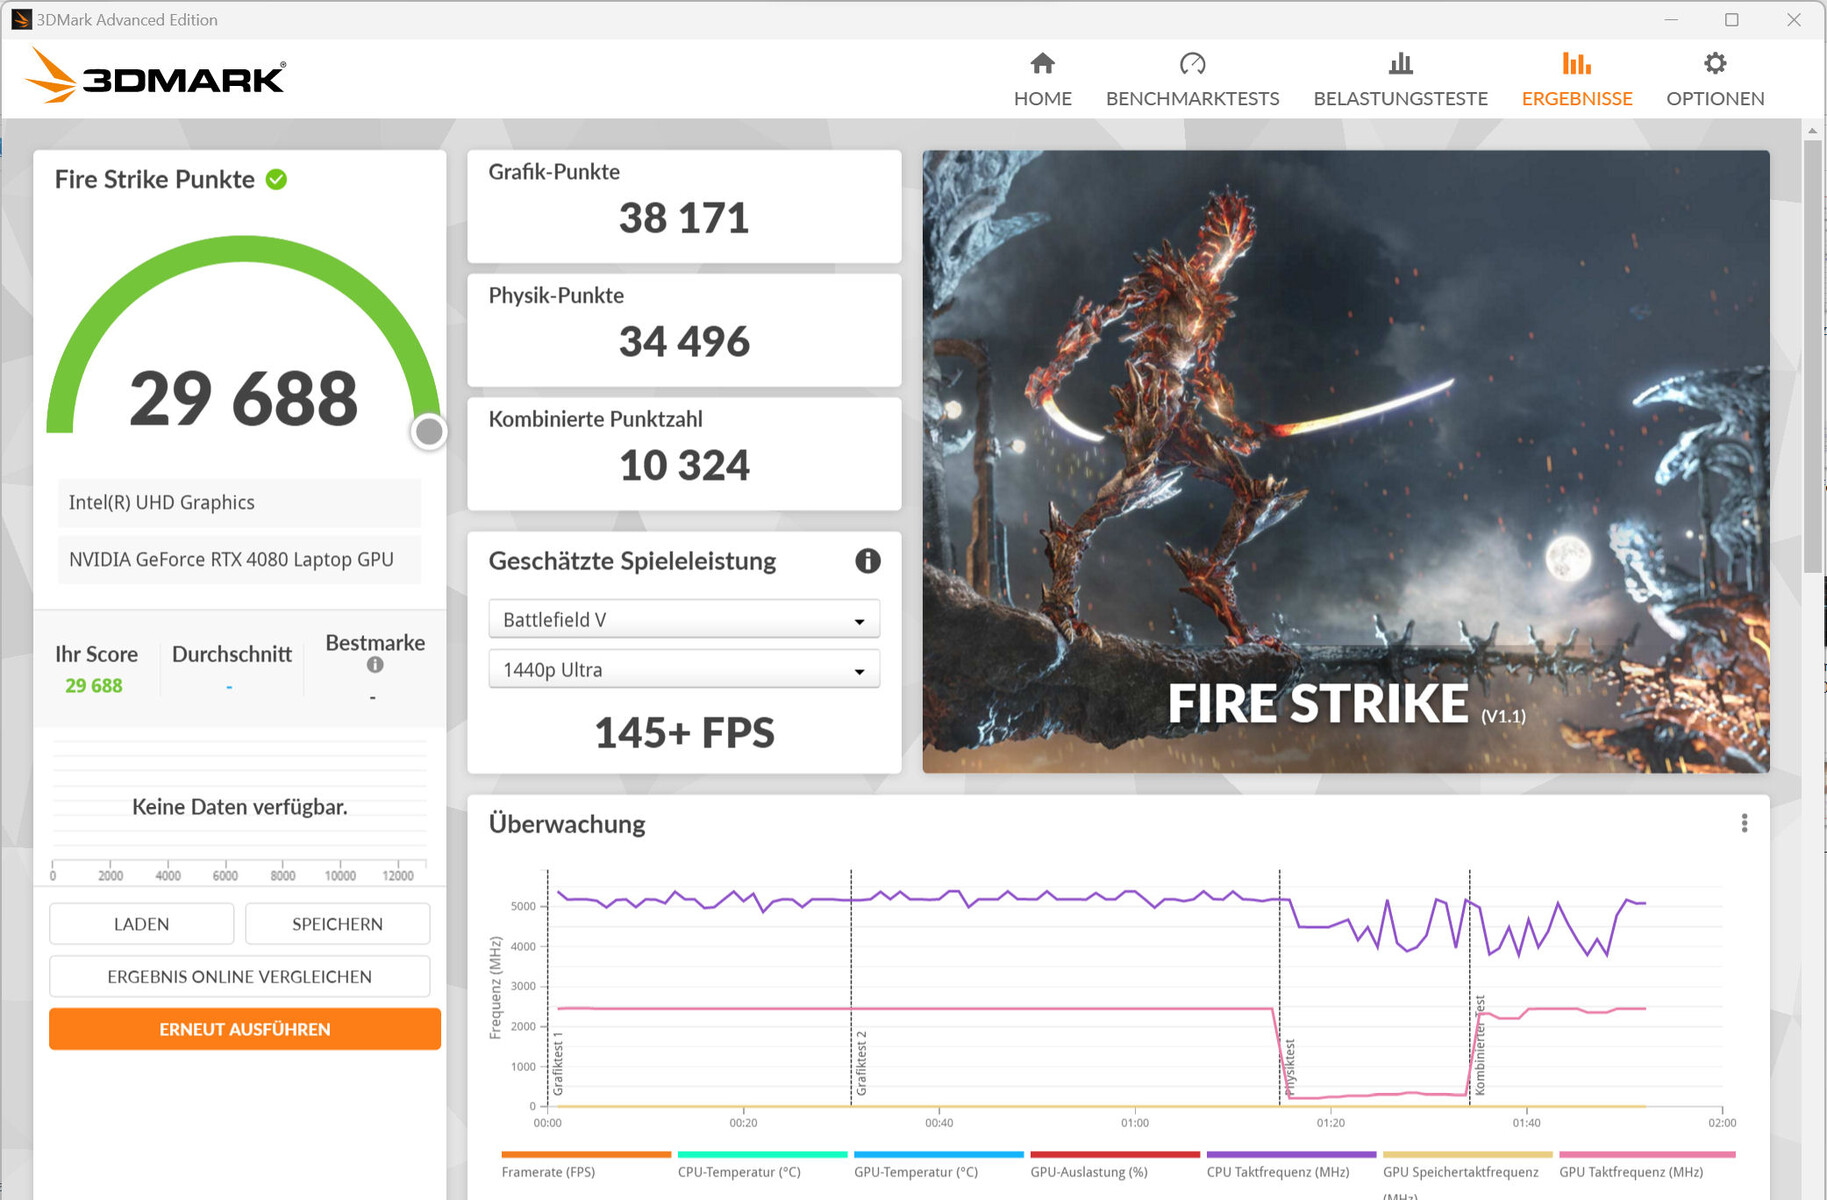
With the GeForce RTX 4080 Laptop GPU, HP uses the current number two in Nvidia's mobile GPU portfolio. It has 7,424 shaders, a 192-bit bus, and is able to use fast GDDR6 storage (12,288 MB). The RTX 4080 is configured with a TGP of 175 watts (150 W + 25 W Dynamic Boost), which is the maximum configurable according to Nvidia. According to our The Witcher 3 test, the TGP isn't fully used.
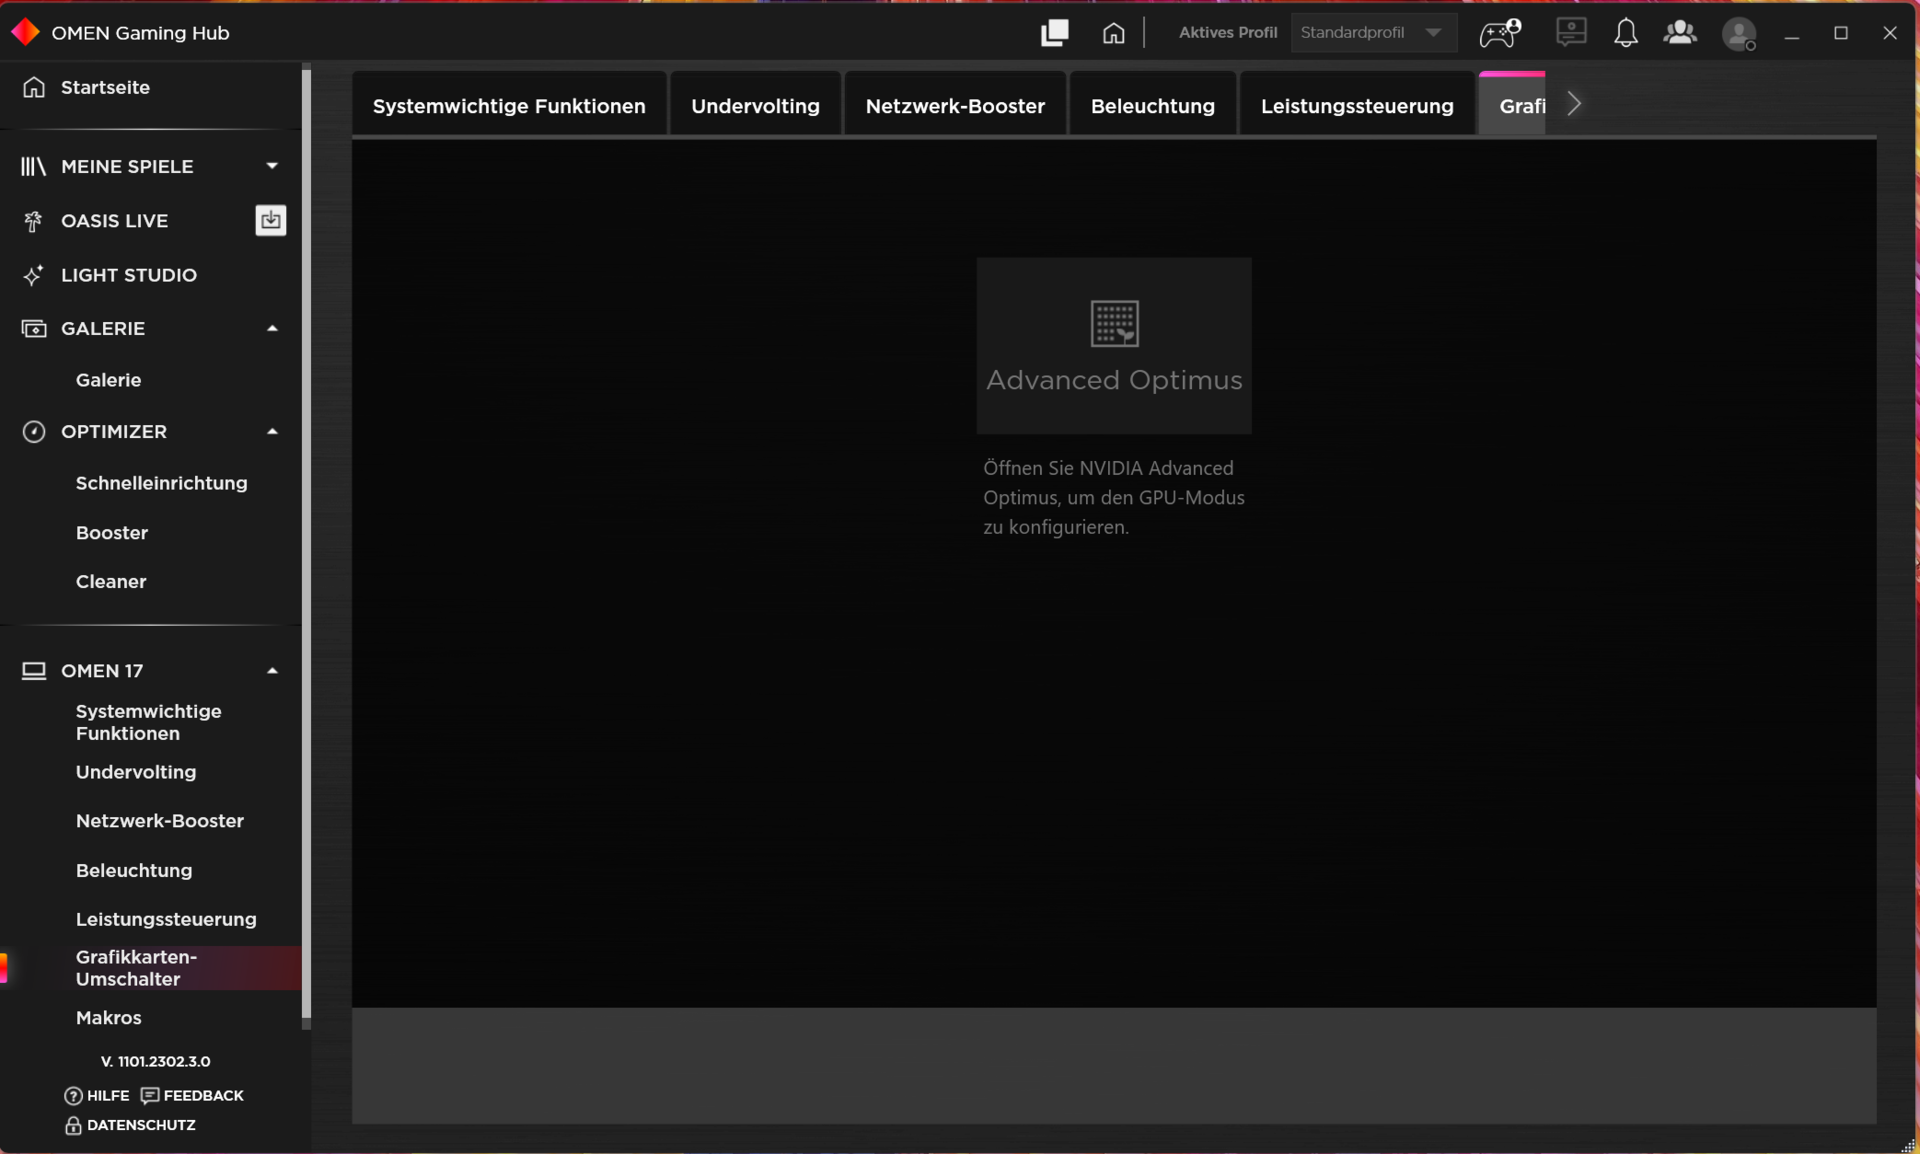
The benchmark results range below the average of the RTX 4080 GPUs we tested so far. The "Performance" profile will lead to some occasional small increases in the graphics performance. The dGPU mode will not lead to any further improvements. Switching between the dGPU and Optimus doesn't require a restart - Advanced Optimus is supported.
| 3DMark Performance rating - Percent | |
| Asus ROG Strix G16 G614JZ | |
| Lenovo Legion Pro 7 16IRX8H | |
| Razer Blade 16 Early 2023 -1! | |
| Average NVIDIA GeForce RTX 4080 Laptop GPU | |
| HP Omen 17-ck2097ng | |
| HP Omen 17-ck2097ng | |
| HP Omen 17-ck2097ng | |
| Average of class Gaming | |
| Alienware m17 R5 (R9 6900HX, RX 6850M XT) | |
| 3DMark 11 - 1280x720 Performance GPU | |
| Lenovo Legion Pro 7 16IRX8H | |
| HP Omen 17-ck2097ng (Leistung) | |
| Asus ROG Strix G16 G614JZ | |
| Average NVIDIA GeForce RTX 4080 Laptop GPU (45199 - 63128, n=24) | |
| Razer Blade 16 Early 2023 | |
| HP Omen 17-ck2097ng | |
| HP Omen 17-ck2097ng (Leistung, dGPU) | |
| Average of class Gaming (21841 - 80022, n=106, last 2 years) | |
| Alienware m17 R5 (R9 6900HX, RX 6850M XT) | |
| Blender | |
| v3.3 Classroom OPTIX/RTX | |
| Average of class Gaming (9 - 32, n=109, last 2 years) | |
| HP Omen 17-ck2097ng (3.3.3) | |
| Average NVIDIA GeForce RTX 4080 Laptop GPU (13 - 20, n=22) | |
| Razer Blade 16 Early 2023 (3.3.3) | |
| Lenovo Legion Pro 7 16IRX8H (3.3.3) | |
| Asus ROG Strix G16 G614JZ (3.3.3) | |
| HP Omen 17-ck2097ng (3.3.3, Leistung) | |
| v3.3 Classroom CUDA | |
| Average of class Gaming (15 - 233, n=110, last 2 years) | |
| Lenovo Legion Pro 7 16IRX8H (3.3.3) | |
| HP Omen 17-ck2097ng (3.3.3, Leistung) | |
| Average NVIDIA GeForce RTX 4080 Laptop GPU (21 - 28, n=23) | |
| Razer Blade 16 Early 2023 (3.3.3) | |
| HP Omen 17-ck2097ng (3.3.3) | |
| Asus ROG Strix G16 G614JZ (3.3.3) | |
| HP Omen 17-ck2097ng (3.3.3, dGPU, Leistung) | |
| V-Ray 5 Benchmark | |
| GPU RTX | |
| Average of class Gaming (1146 - 4363, n=34, last 2 years) | |
| HP Omen 17-ck2097ng (5.0.1) | |
| HP Omen 17-ck2097ng (5.0.1, dGPU, Leistung) | |
| Razer Blade 16 Early 2023 (5.0.1) | |
| HP Omen 17-ck2097ng (5.0.1, Leistung) | |
| Average NVIDIA GeForce RTX 4080 Laptop GPU (2128 - 2843, n=17) | |
| GPU CUDA | |
| Average of class Gaming (887 - 3288, n=34, last 2 years) | |
| HP Omen 17-ck2097ng (5.0.1, dGPU, Leistung) | |
| HP Omen 17-ck2097ng (5.0.1, Leistung) | |
| HP Omen 17-ck2097ng (5.0.1) | |
| Average NVIDIA GeForce RTX 4080 Laptop GPU (1647 - 2112, n=17) | |
| Razer Blade 16 Early 2023 (5.0.1) | |
| CPU | |
| HP Omen 17-ck2097ng (5.0.1, Leistung) | |
| Average of class Gaming (5864 - 30302, n=33, last 2 years) | |
| Razer Blade 16 Early 2023 (5.0.1) | |
| HP Omen 17-ck2097ng (5.0.1, dGPU, Leistung) | |
| Average NVIDIA GeForce RTX 4080 Laptop GPU (11906 - 21823, n=17) | |
| HP Omen 17-ck2097ng (5.0.1) | |
| V-Ray Benchmark Next 4.10 | |
| GPU | |
| HP Omen 17-ck2097ng (v4.10.07, Leistung) | |
| Asus ROG Strix G16 G614JZ (v4.10.07 ) | |
| Lenovo Legion Pro 7 16IRX8H (v4.10.07 ) | |
| HP Omen 17-ck2097ng (v4.10.07 ) | |
| Average NVIDIA GeForce RTX 4080 Laptop GPU (812 - 1036, n=16) | |
| HP Omen 17-ck2097ng (v4.10.07, dGPU, Leistung) | |
| Average of class Gaming (427 - 1627, n=103, last 2 years) | |
| Alienware m17 R5 (R9 6900HX, RX 6850M XT) (v4.10.07 ) | |
| CPU | |
| Lenovo Legion Pro 7 16IRX8H (v4.10.07 ) | |
| Asus ROG Strix G16 G614JZ (v4.10.07 ) | |
| HP Omen 17-ck2097ng (v4.10.07, Leistung) | |
| Average NVIDIA GeForce RTX 4080 Laptop GPU (19636 - 31653, n=16) | |
| Average of class Gaming (10048 - 45327, n=101, last 2 years) | |
| HP Omen 17-ck2097ng (v4.10.07, dGPU, Leistung) | |
| HP Omen 17-ck2097ng (v4.10.07 ) | |
| Alienware m17 R5 (R9 6900HX, RX 6850M XT) (v4.10.07 ) | |
| Geekbench 5.5 - OpenCL Score | |
| Asus ROG Strix G16 G614JZ | |
| HP Omen 17-ck2097ng (Leistung) | |
| HP Omen 17-ck2097ng (dGPU, Leistung) | |
| Razer Blade 16 Early 2023 | |
| HP Omen 17-ck2097ng | |
| Average NVIDIA GeForce RTX 4080 Laptop GPU (146413 - 189320, n=23) | |
| Average of class Gaming (80702 - 277970, n=105, last 2 years) | |
| Lenovo Legion Pro 7 16IRX8H | |
| Alienware m17 R5 (R9 6900HX, RX 6850M XT) | |
| Geekbench 6.0 - GPU OpenCL 6.0 | |
| HP Omen 17-ck2097ng | |
| Average NVIDIA GeForce RTX 4080 Laptop GPU (153564 - 175235, n=3) | |
| Average of class Gaming (111827 - 192027, n=3, last 2 years) | |
* ... smaller is better
Gaming Performance
The Omen, which is targeted for QHD gaming at high to maximum settings, also allows for higher resolutions when the corresponding monitor is connected. The frame rates of the games we tested range below the average of all the RTX 4080 GPUs we tested until now. The "Performance" profile leads to an increase in the frame rates that is slightly above average. In some games, the dGPU mode is able to provide an additional increase.
| Performance rating - Percent | |
| Asus ROG Strix G16 G614JZ | |
| Razer Blade 16 Early 2023 | |
| Lenovo Legion Pro 7 16IRX8H | |
| HP Omen 17-ck2097ng | |
| HP Omen 17-ck2097ng | |
| Average NVIDIA GeForce RTX 4080 Laptop GPU | |
| HP Omen 17-ck2097ng | |
| Average of class Gaming | |
| Alienware m17 R5 (R9 6900HX, RX 6850M XT) | |
| The Witcher 3 - 1920x1080 Ultra Graphics & Postprocessing (HBAO+) | |
| Lenovo Legion Pro 7 16IRX8H | |
| Razer Blade 16 Early 2023 | |
| Asus ROG Strix G16 G614JZ | |
| HP Omen 17-ck2097ng (dGPU) | |
| HP Omen 17-ck2097ng (Leistung) | |
| Average of class Gaming (95 - 240, n=8, last 2 years) | |
| Average NVIDIA GeForce RTX 4080 Laptop GPU (130.4 - 186.1, n=20) | |
| HP Omen 17-ck2097ng | |
| Alienware m17 R5 (R9 6900HX, RX 6850M XT) | |
| GTA V - 1920x1080 Highest AA:4xMSAA + FX AF:16x | |
| Asus ROG Strix G16 G614JZ | |
| Lenovo Legion Pro 7 16IRX8H | |
| Razer Blade 16 Early 2023 | |
| Average NVIDIA GeForce RTX 4080 Laptop GPU (102.9 - 152.7, n=21) | |
| Average of class Gaming (48.3 - 186.9, n=98, last 2 years) | |
| HP Omen 17-ck2097ng (Leistung) | |
| HP Omen 17-ck2097ng (dGPU, Leistung) | |
| HP Omen 17-ck2097ng | |
| Alienware m17 R5 (R9 6900HX, RX 6850M XT) | |
| Final Fantasy XV Benchmark - 1920x1080 High Quality | |
| Asus ROG Strix G16 G614JZ (1.3) | |
| HP Omen 17-ck2097ng (1.3, dGPU, Leistung) | |
| HP Omen 17-ck2097ng (1.3, Leistung) | |
| Lenovo Legion Pro 7 16IRX8H (1.3) | |
| Average NVIDIA GeForce RTX 4080 Laptop GPU (129 - 182.1, n=23) | |
| Razer Blade 16 Early 2023 (1.3) | |
| Average of class Gaming (41 - 215, n=99, last 2 years) | |
| HP Omen 17-ck2097ng (1.3) | |
| Alienware m17 R5 (R9 6900HX, RX 6850M XT) (1.3) | |
| Strange Brigade - 1920x1080 ultra AA:ultra AF:16 | |
| Asus ROG Strix G16 G614JZ (1.47.22.14 D3D12) | |
| HP Omen 17-ck2097ng (1.47.22.14 D3D12, dGPU, Leistung) | |
| Razer Blade 16 Early 2023 (1.47.22.14 D3D12) | |
| Lenovo Legion Pro 7 16IRX8H (1.47.22.14 D3D12) | |
| Average NVIDIA GeForce RTX 4080 Laptop GPU (239 - 357, n=22) | |
| HP Omen 17-ck2097ng (1.47.22.14 D3D12, Leistung) | |
| Average of class Gaming (76.3 - 456, n=89, last 2 years) | |
| HP Omen 17-ck2097ng (1.47.22.14 D3D12) | |
| Alienware m17 R5 (R9 6900HX, RX 6850M XT) (1.47.22.14 D3D12) | |
| Dota 2 Reborn - 1920x1080 ultra (3/3) best looking | |
| Razer Blade 16 Early 2023 | |
| Asus ROG Strix G16 G614JZ | |
| Lenovo Legion Pro 7 16IRX8H | |
| HP Omen 17-ck2097ng (Leistung) | |
| HP Omen 17-ck2097ng (dGPU, Leistung) | |
| Average NVIDIA GeForce RTX 4080 Laptop GPU (133 - 194.7, n=23) | |
| HP Omen 17-ck2097ng | |
| Average of class Gaming (84.8 - 248, n=110, last 2 years) | |
| Alienware m17 R5 (R9 6900HX, RX 6850M XT) | |
| X-Plane 11.11 - 1920x1080 high (fps_test=3) | |
| Asus ROG Strix G16 G614JZ | |
| Razer Blade 16 Early 2023 | |
| Lenovo Legion Pro 7 16IRX8H | |
| HP Omen 17-ck2097ng (dGPU, Leistung) | |
| Average NVIDIA GeForce RTX 4080 Laptop GPU (89.3 - 143.5, n=25) | |
| HP Omen 17-ck2097ng (Leistung) | |
| HP Omen 17-ck2097ng | |
| Average of class Gaming (52.1 - 143.5, n=113, last 2 years) | |
| Alienware m17 R5 (R9 6900HX, RX 6850M XT) | |
In order to evaluate whether the frame rates remain constant to a large extent over a longer time period, we run the game "The Witcher 3" for about 60 minutes in Full-HD resolution and maximum quality settings. The gaming character is not moved during this time. We do not notice any drop in the frame rates.
The Witcher 3 FPS Chart
| low | med. | high | ultra | QHD | |
|---|---|---|---|---|---|
| GTA V (2015) | 183.8 | 183.1 | 175.5 | 121.1 | 116 |
| The Witcher 3 (2015) | 459.7 | 400.5 | 287.8 | 164 | |
| Dota 2 Reborn (2015) | 206 | 180.5 | 167.2 | 155.3 | |
| Final Fantasy XV Benchmark (2018) | 192.4 | 173 | 145.4 | 117.5 | |
| X-Plane 11.11 (2018) | 169 | 146.9 | 119.4 | ||
| Far Cry 5 (2018) | 160 | 132 | 129 | 126 | 124 |
| Strange Brigade (2018) | 388 | 300 | 290 | 276 | 208 |
| F1 22 (2022) | 255 | 248 | 231 | 97.5 | 67.6 |
| The Callisto Protocol (2022) | 167.6 | 153.7 | 148.3 | 111.5 | 83.7 |
| Returnal (2023) | 150 | 147 | 137 | 121 | 92 |
| Atomic Heart (2023) | 170.8 | 142.3 | 121.1 | 100.3 | 79.2 |
| Company of Heroes 3 (2023) | 275 | 244.6 | 206.5 | 205.31 | 153.8 |
| Sons of the Forest (2023) | 78.1 | 75 | 74.6 | 69.7 | 66.8 |
Emissions - The HP laptop produces a lot of noise
Noise Levels
In everyday operation (Office, Internet) and during idle operation, the constantly running fans are clearly audible. Under heavy load (stress test, The Witcher 3), the noise level increases further and volumes of up to 50 dB (A) are possible. The "Performance" mode leads to a faster increase in the noise level up to the maximum with it staying at that level. The noise consists of some whirring accompanied by a subdued whistling.
The BIOS of the Omen contains HP's own "Fan always on" option, which is activated by default. Deactivating this option does not lead to any changes in our test unit.
Noise level
| Idle |
| 31 / 32 / 33 dB(A) |
| Load |
| 45 / 50 dB(A) |
 | ||
30 dB silent 40 dB(A) audible 50 dB(A) loud |
||
min: | ||
| HP Omen 17-ck2097ng i9-13900HX, GeForce RTX 4080 Laptop GPU | Alienware m17 R5 (R9 6900HX, RX 6850M XT) R9 6900HX, Radeon RX 6850M XT | Razer Blade 16 Early 2023 i9-13950HX, GeForce RTX 4080 Laptop GPU | Lenovo Legion Pro 7 16IRX8H i9-13900HX, GeForce RTX 4080 Laptop GPU | Asus ROG Strix G16 G614JZ i9-13980HX, GeForce RTX 4080 Laptop GPU | HP Omen 17-ck1075ng i7-12700H, GeForce RTX 3070 Ti Laptop GPU | |
|---|---|---|---|---|---|---|
| Noise | 11% | 12% | -2% | 2% | -2% | |
| off / environment * (dB) | 24 | 23 4% | 23 4% | 24 -0% | 25 -4% | 25.4 -6% |
| Idle Minimum * (dB) | 31 | 23 26% | 23 26% | 26 16% | 26 16% | 28 10% |
| Idle Average * (dB) | 32 | 28.11 12% | 23 28% | 28 12% | 28 12% | 28 12% |
| Idle Maximum * (dB) | 33 | 28.11 15% | 23.6 28% | 34 -3% | 30 9% | 31.2 5% |
| Load Average * (dB) | 45 | 30.62 32% | 39 13% | 47 -4% | 48 -7% | 52.2 -16% |
| Witcher 3 ultra * (dB) | 45 | 49.75 -11% | 51.6 -15% | 55 -22% | 49 -9% | 52.2 -16% |
| Load Maximum * (dB) | 50 | 50.17 -0% | 51.3 -3% | 56 -12% | 52 -4% | 52.2 -4% |
* ... smaller is better
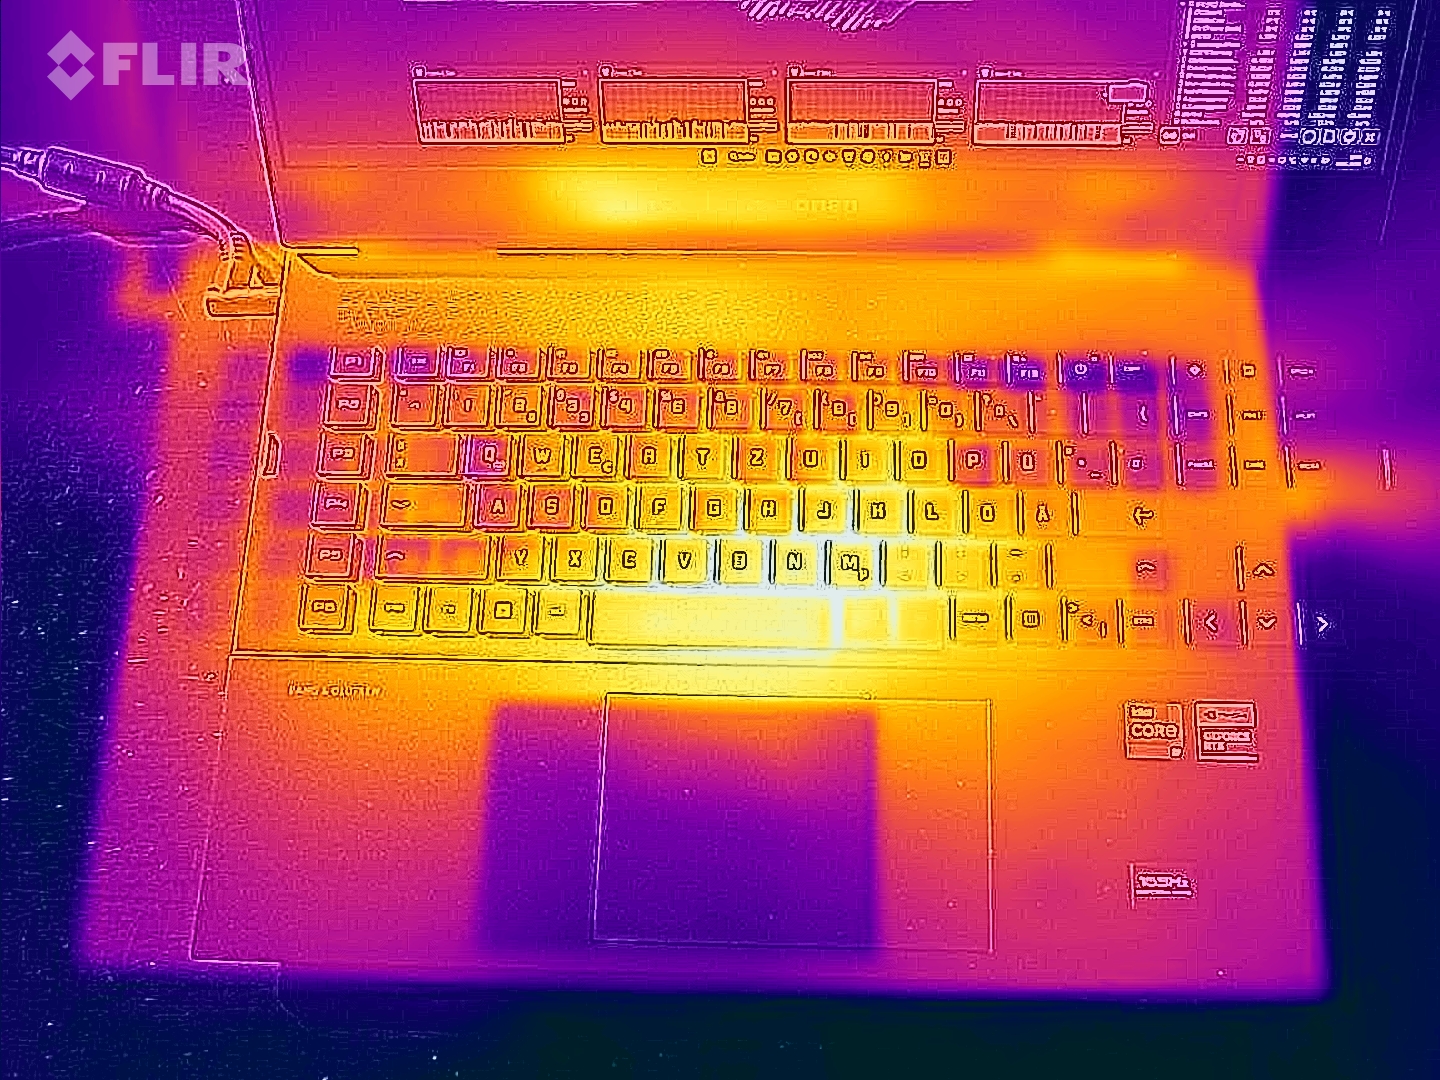
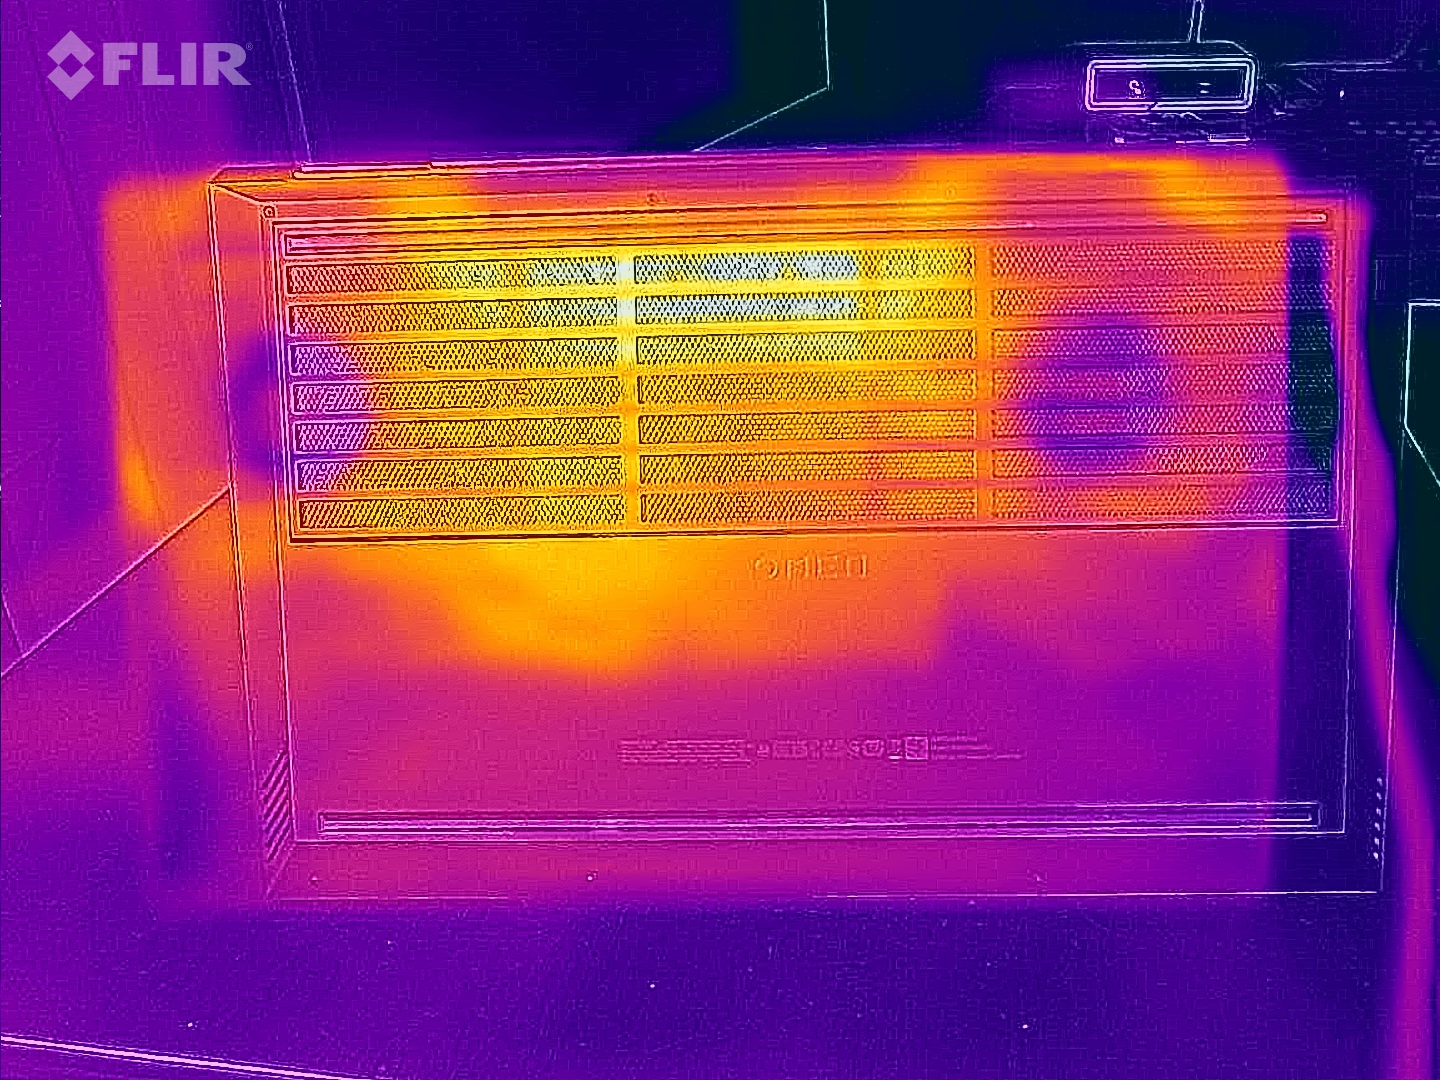
Temperatures
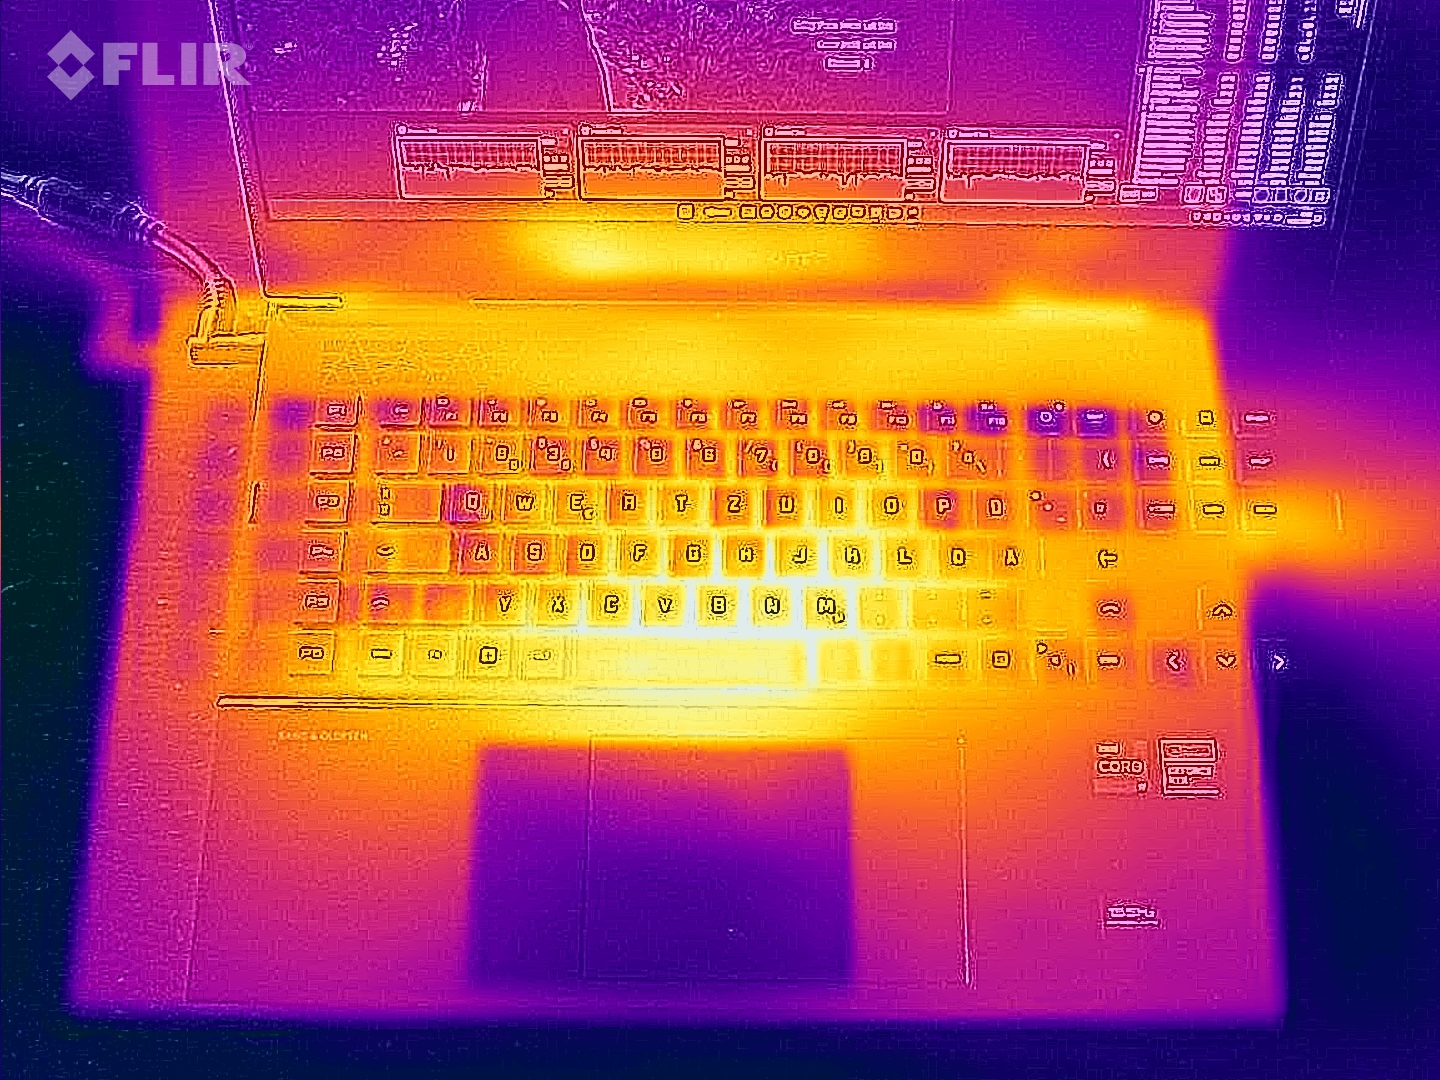
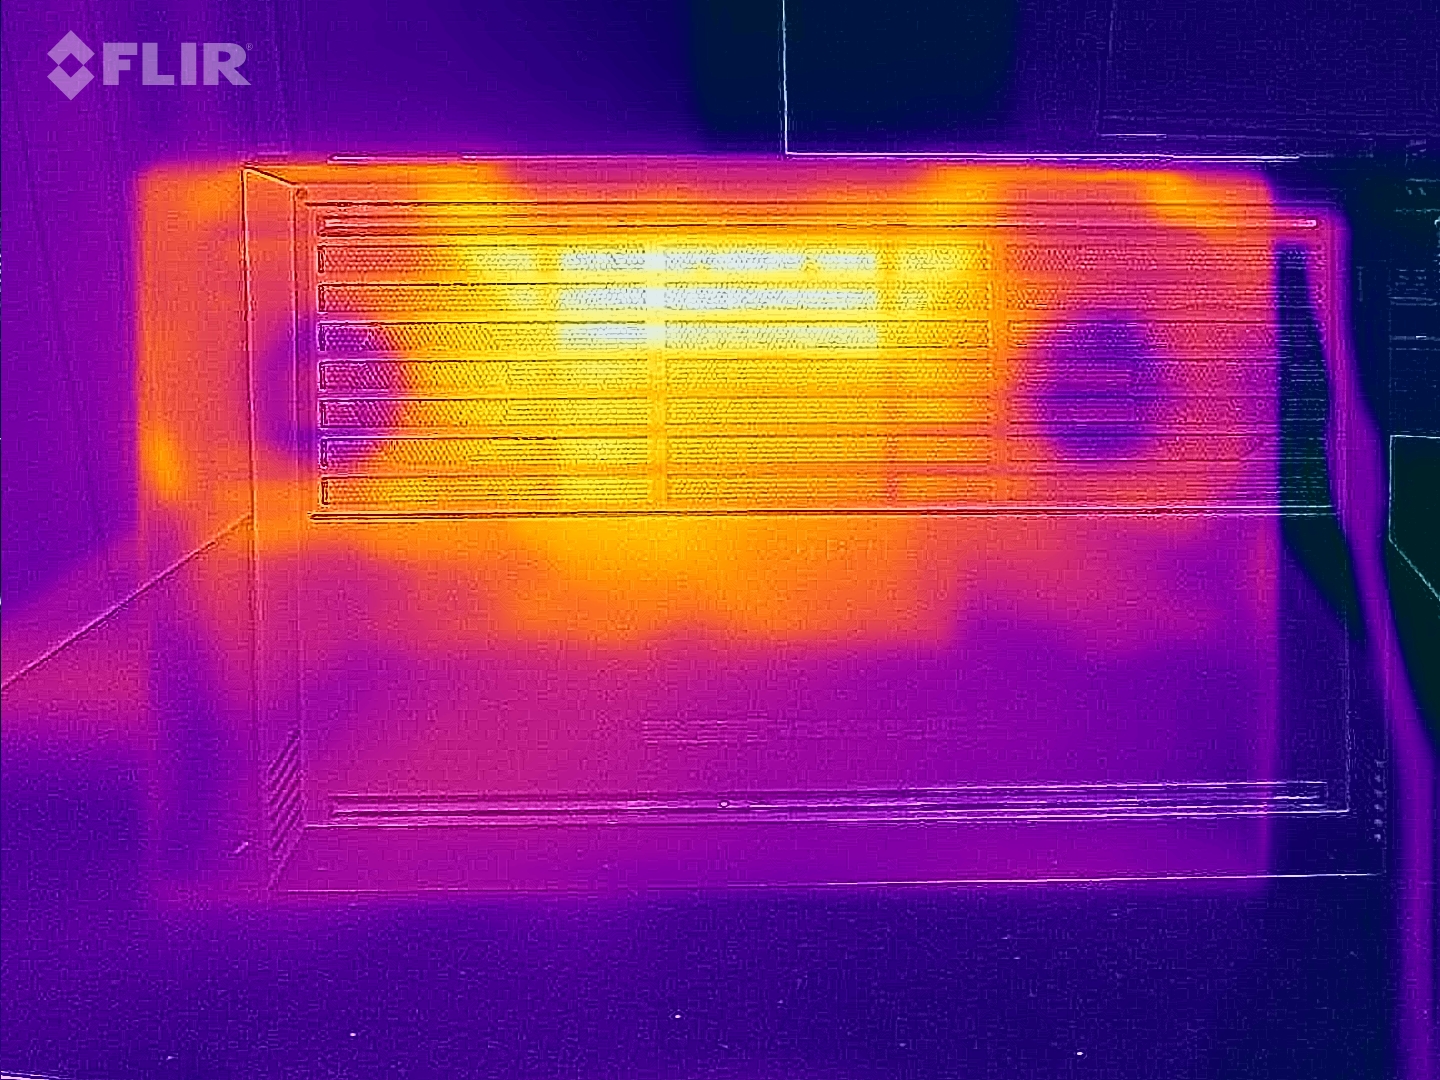
In everyday operation (Office, Internet), the case temperatures remain within the green range. Under load (stress test, The Witcher 3), the laptop heats up noticeably, but this remains within limits - at least at the top. The CPU temperatures give no reason for concerns.
(±) The maximum temperature on the upper side is 41 °C / 106 F, compared to the average of 40.4 °C / 105 F, ranging from 21.2 to 68.8 °C for the class Gaming.
(-) The bottom heats up to a maximum of 51 °C / 124 F, compared to the average of 43.2 °C / 110 F
(+) In idle usage, the average temperature for the upper side is 23.7 °C / 75 F, compared to the device average of 33.9 °C / 93 F.
(-) Playing The Witcher 3, the average temperature for the upper side is 38.2 °C / 101 F, compared to the device average of 33.9 °C / 93 F.
(+) The palmrests and touchpad are reaching skin temperature as a maximum (35 °C / 95 F) and are therefore not hot.
(-) The average temperature of the palmrest area of similar devices was 28.8 °C / 83.8 F (-6.2 °C / -11.2 F).
| HP Omen 17-ck2097ng Intel Core i9-13900HX, NVIDIA GeForce RTX 4080 Laptop GPU | Alienware m17 R5 (R9 6900HX, RX 6850M XT) AMD Ryzen 9 6900HX, AMD Radeon RX 6850M XT | Razer Blade 16 Early 2023 Intel Core i9-13950HX, NVIDIA GeForce RTX 4080 Laptop GPU | Lenovo Legion Pro 7 16IRX8H Intel Core i9-13900HX, NVIDIA GeForce RTX 4080 Laptop GPU | Asus ROG Strix G16 G614JZ Intel Core i9-13980HX, NVIDIA GeForce RTX 4080 Laptop GPU | HP Omen 17-ck1075ng Intel Core i7-12700H, NVIDIA GeForce RTX 3070 Ti Laptop GPU | |
|---|---|---|---|---|---|---|
| Heat | -20% | -8% | -28% | -23% | -16% | |
| Maximum Upper Side * (°C) | 41 | 53 -29% | 40 2% | 48 -17% | 54 -32% | 31.3 24% |
| Maximum Bottom * (°C) | 51 | 56 -10% | 37.6 26% | 49 4% | 55 -8% | 43.3 15% |
| Idle Upper Side * (°C) | 24 | 30 -25% | 32.4 -35% | 40 -67% | 29 -21% | 31.3 -30% |
| Idle Bottom * (°C) | 25 | 29 -16% | 31.4 -26% | 33 -32% | 33 -32% | 43.3 -73% |
* ... smaller is better
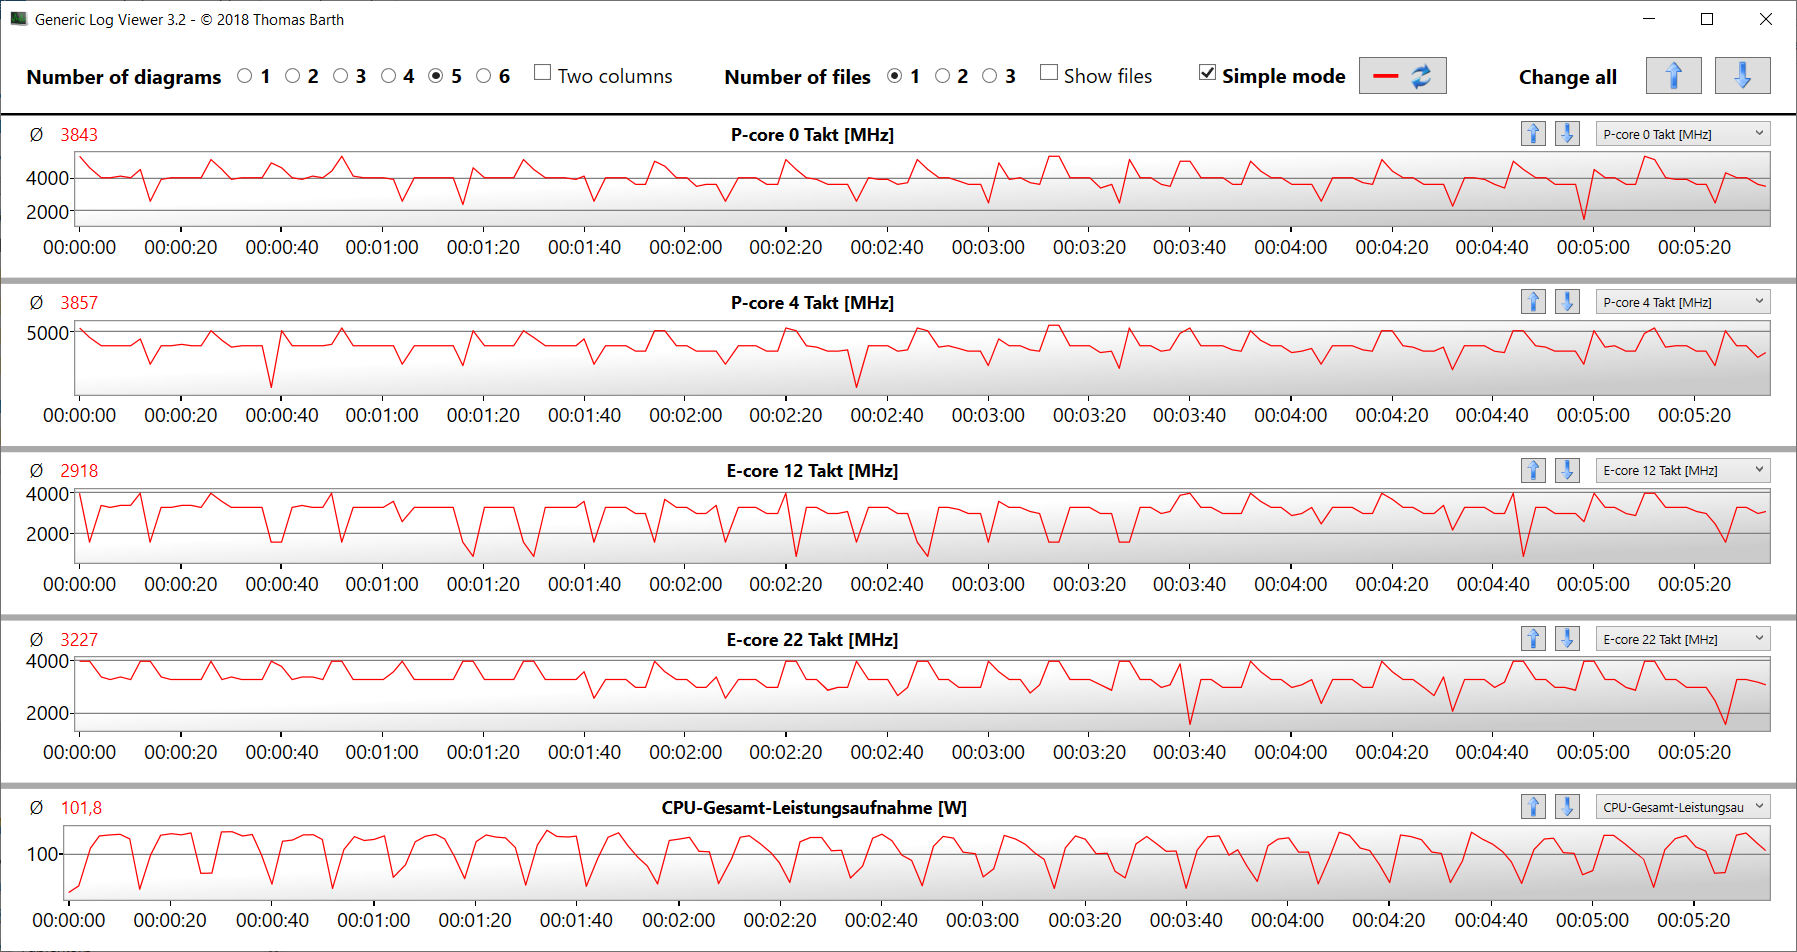
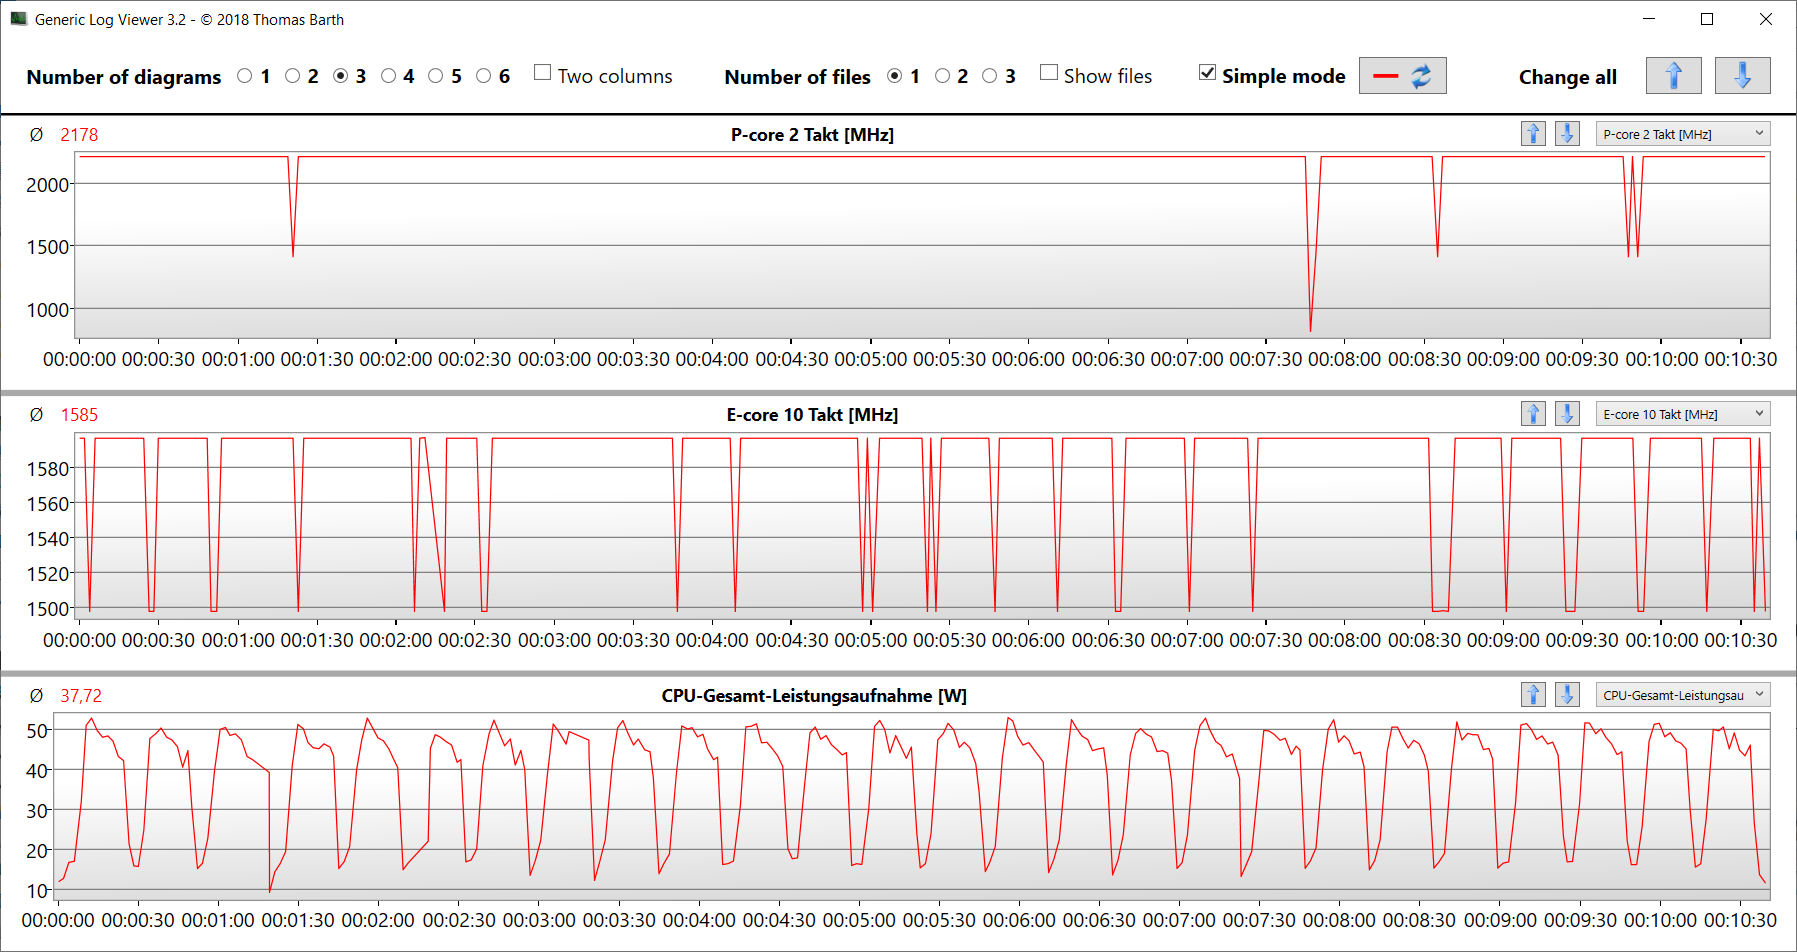
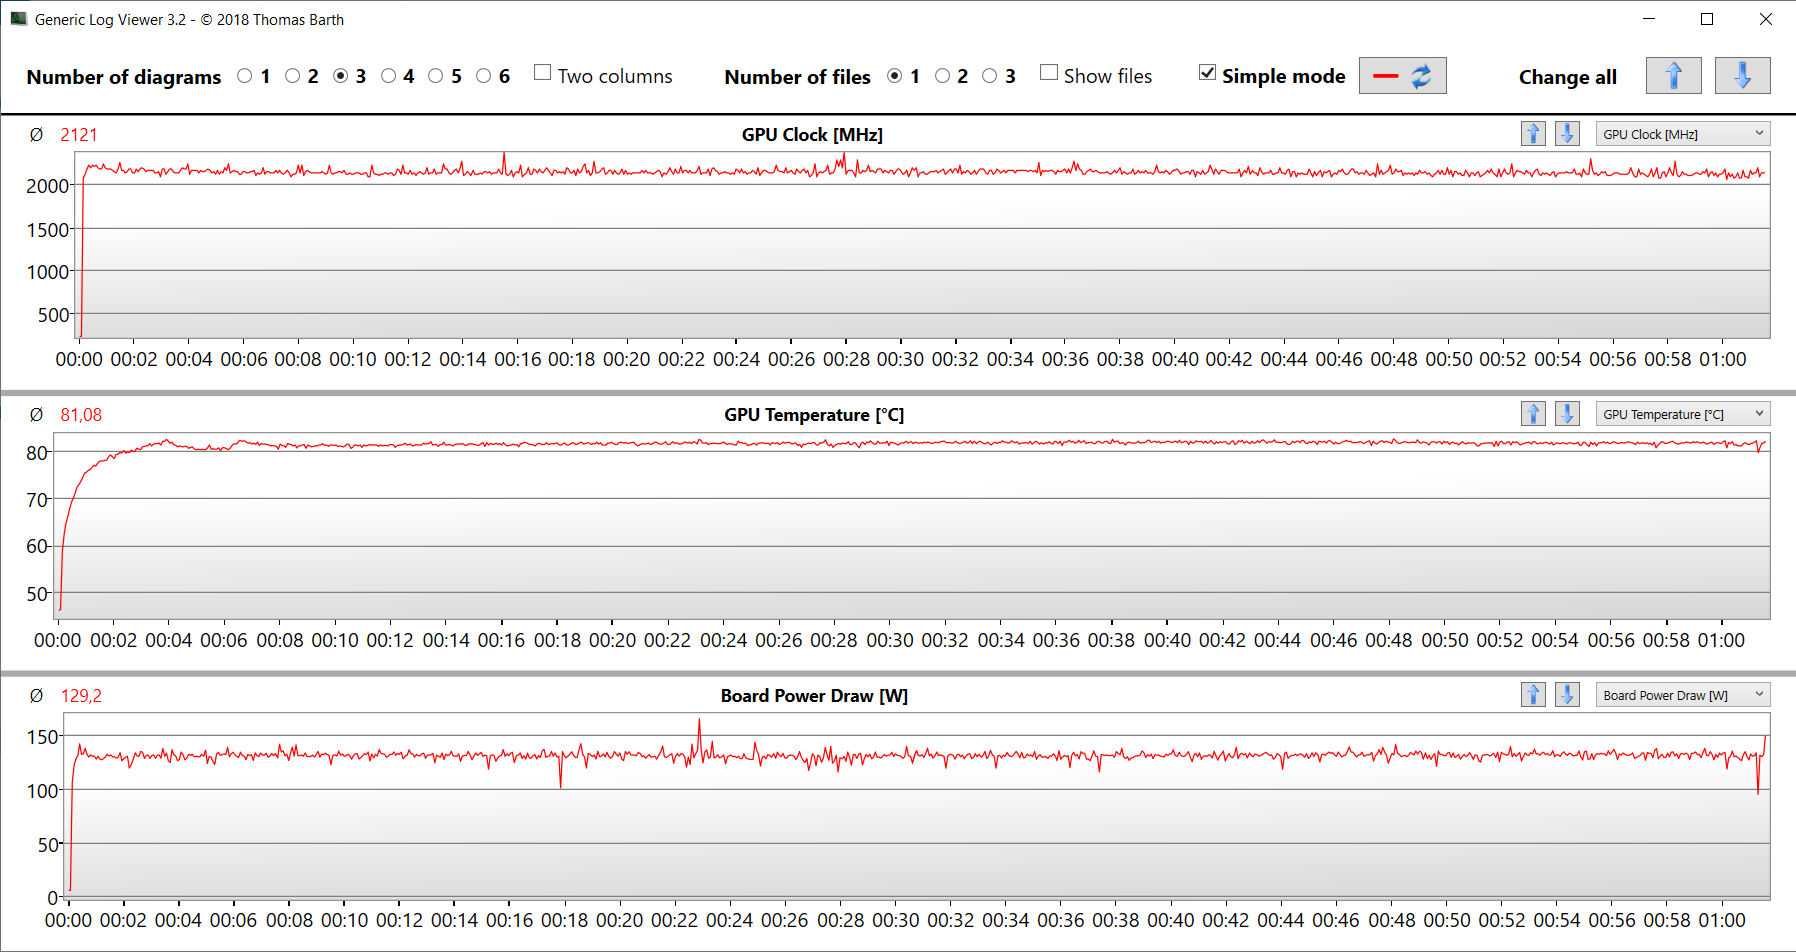
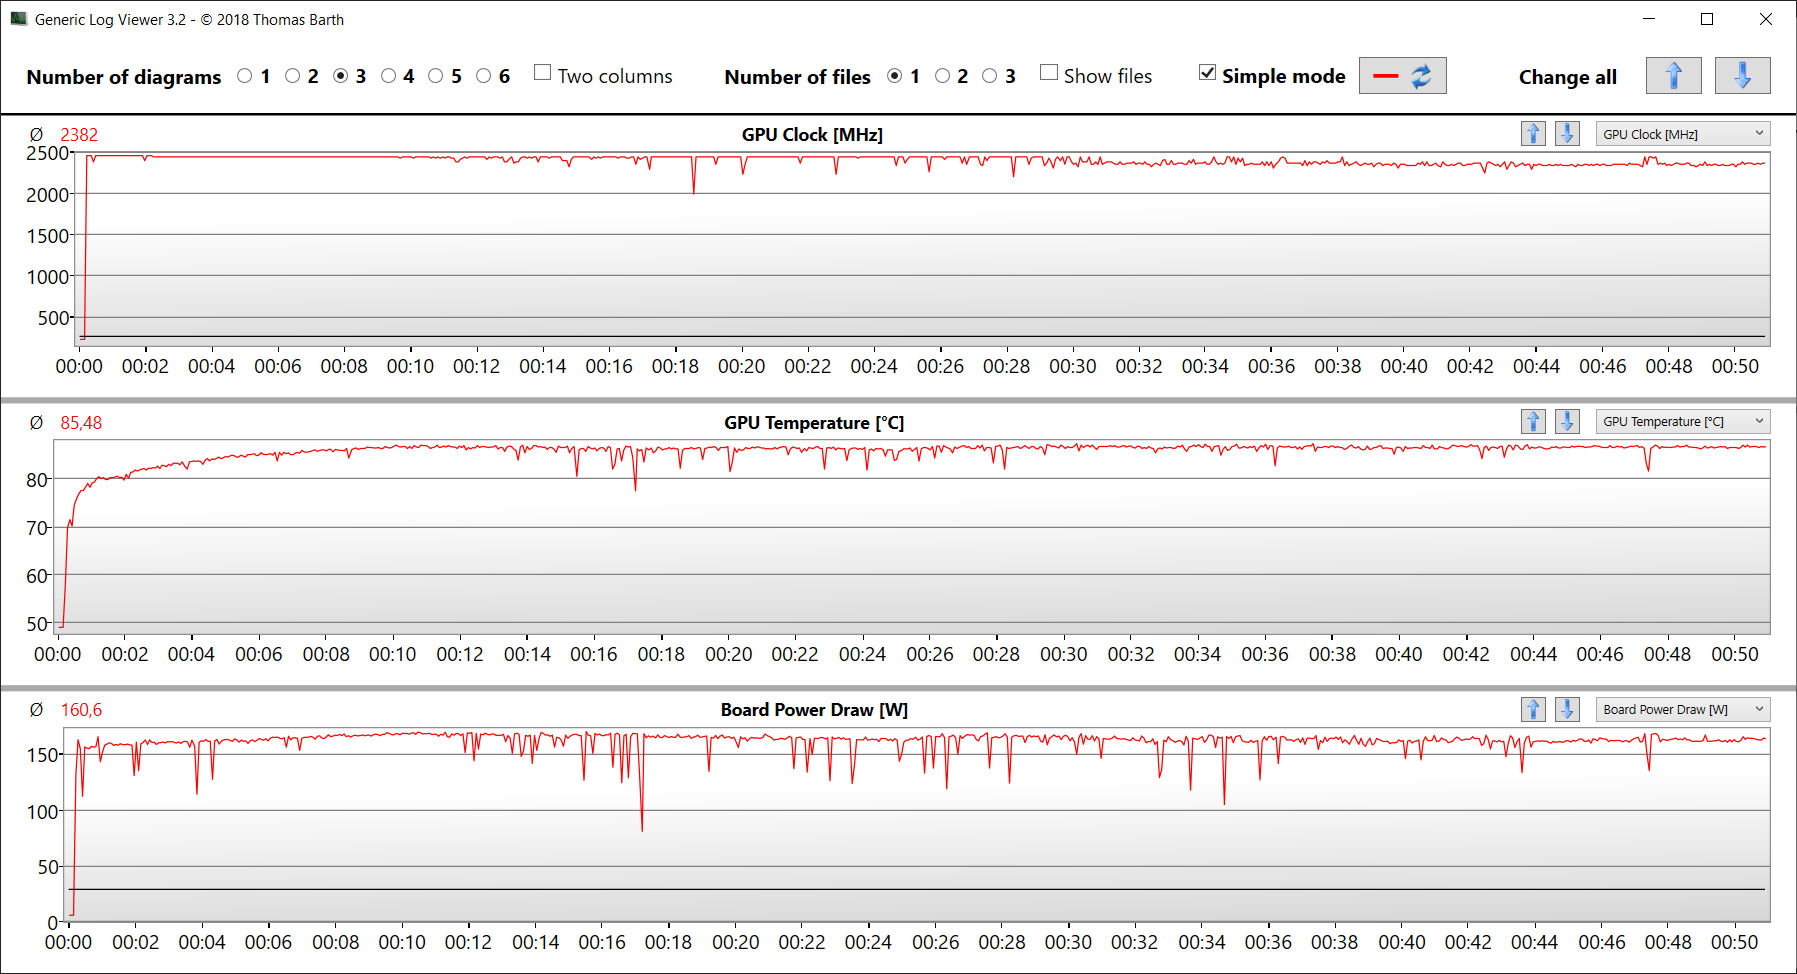
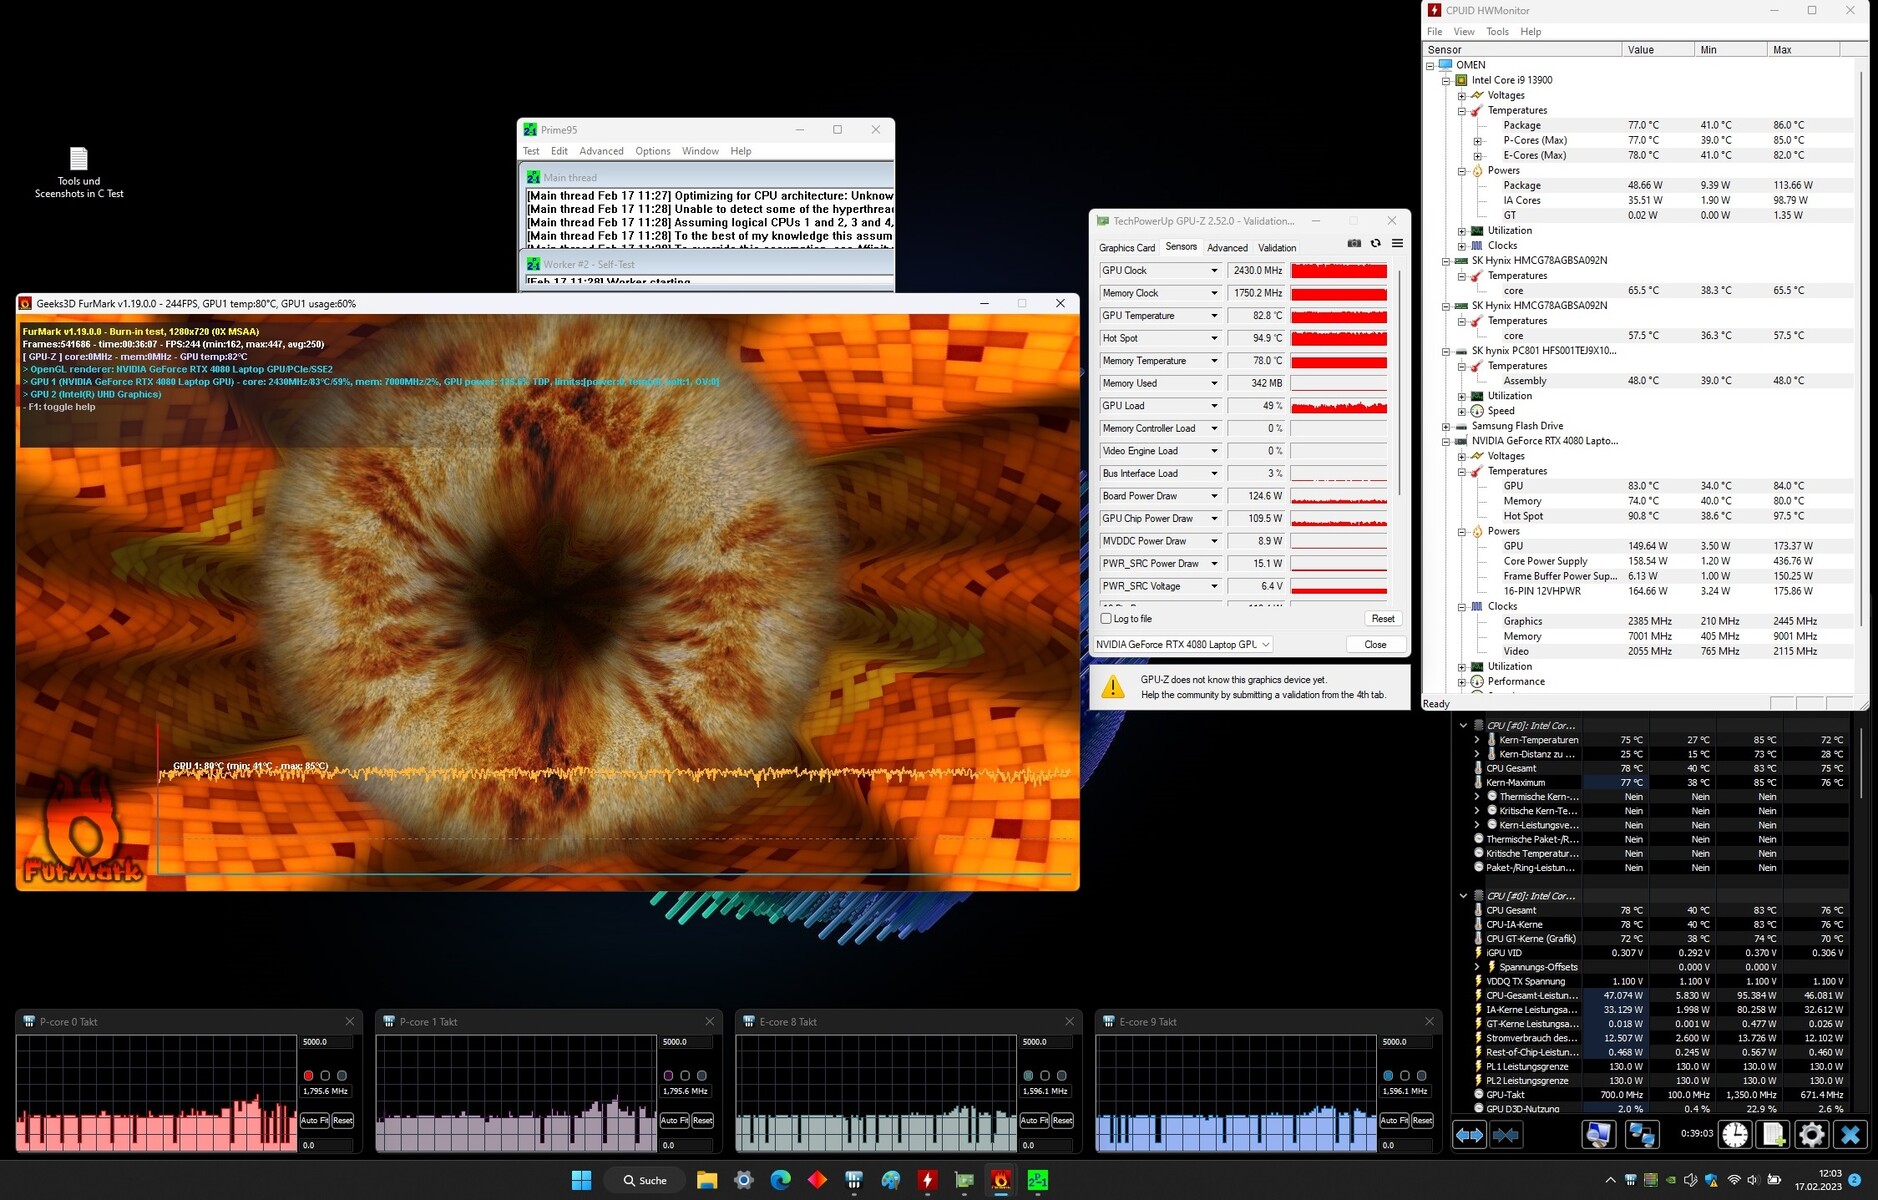
Stress Test
Our stress test with Prime95 and Furmark running constantly represents an extreme scenario that we use to evaluate the system stability under full load. The CPU (P: 3.8 GHz, E: 3.2 GHz) and GPU (2 to 2.1 GHz) start the test with high clock speeds. After a short time, the CPU speed drops to about 1.8 GHz (P cores) and 2 GHz (E cores), with the GPU speed increasing to 2.3 - 2.4 GHz at the same time.
Speakers
The stereo speakers produce a decent sound, but it hardly has any bass.
HP Omen 17-ck2097ng audio analysis
(±) | speaker loudness is average but good (81 dB)
Bass 100 - 315 Hz
(-) | nearly no bass - on average 21% lower than median
(±) | linearity of bass is average (14.6% delta to prev. frequency)
Mids 400 - 2000 Hz
(+) | balanced mids - only 1.4% away from median
(+) | mids are linear (2.9% delta to prev. frequency)
Highs 2 - 16 kHz
(+) | balanced highs - only 2.2% away from median
(+) | highs are linear (3.8% delta to prev. frequency)
Overall 100 - 16.000 Hz
(+) | overall sound is linear (13.8% difference to median)
Compared to same class
» 21% of all tested devices in this class were better, 7% similar, 72% worse
» The best had a delta of 6%, average was 18%, worst was 132%
Compared to all devices tested
» 15% of all tested devices were better, 4% similar, 81% worse
» The best had a delta of 4%, average was 24%, worst was 134%
Asus ROG Strix Scar 17 SE G733CX-LL014W audio analysis
(±) | speaker loudness is average but good (73.3 dB)
Bass 100 - 315 Hz
(±) | reduced bass - on average 6.2% lower than median
(±) | linearity of bass is average (7.5% delta to prev. frequency)
Mids 400 - 2000 Hz
(+) | balanced mids - only 2% away from median
(+) | mids are linear (3.9% delta to prev. frequency)
Highs 2 - 16 kHz
(+) | balanced highs - only 3.5% away from median
(±) | linearity of highs is average (9.3% delta to prev. frequency)
Overall 100 - 16.000 Hz
(+) | overall sound is linear (13.6% difference to median)
Compared to same class
» 20% of all tested devices in this class were better, 7% similar, 73% worse
» The best had a delta of 6%, average was 18%, worst was 132%
Compared to all devices tested
» 15% of all tested devices were better, 4% similar, 82% worse
» The best had a delta of 4%, average was 24%, worst was 134%
Power Management - Gaming laptop with a 330-Watt power supply
Power Consumption
The power consumption ranges at normal levels for the hardware used. During our The Witcher 3 test the power consumption remains constant, and during the stress test the consumption drops after a few minutes - the CPU is throttled. The included power supply (330 watts) is sufficiently sized.
| Off / Standby | |
| Idle | |
| Load |
|
Key:
min: | |
| HP Omen 17-ck2097ng i9-13900HX, GeForce RTX 4080 Laptop GPU | Alienware m17 R5 (R9 6900HX, RX 6850M XT) R9 6900HX, Radeon RX 6850M XT | Razer Blade 16 Early 2023 i9-13950HX, GeForce RTX 4080 Laptop GPU | Lenovo Legion Pro 7 16IRX8H i9-13900HX, GeForce RTX 4080 Laptop GPU | Asus ROG Strix G16 G614JZ i9-13980HX, GeForce RTX 4080 Laptop GPU | HP Omen 17-ck1075ng i7-12700H, GeForce RTX 3070 Ti Laptop GPU | Average NVIDIA GeForce RTX 4080 Laptop GPU | Average of class Gaming | |
|---|---|---|---|---|---|---|---|---|
| Power Consumption | 18% | -16% | -13% | 5% | 13% | -7% | 12% | |
| Idle Minimum * (Watt) | 16 | 13 19% | 15.2 5% | 18 -13% | 10 37% | 12.2 24% | 16.9 ? -6% | 13.2 ? 17% |
| Idle Average * (Watt) | 20 | 16.5 17% | 22.8 -14% | 24 -20% | 16 20% | 18 10% | 22 ? -10% | 18.9 ? 5% |
| Idle Maximum * (Watt) | 26 | 17 35% | 49.8 -92% | 32 -23% | 27 -4% | 19.4 25% | 34.1 ? -31% | 24.5 ? 6% |
| Load Average * (Watt) | 135 | 93 31% | 121.2 10% | 130 4% | 129 4% | 128 5% | 117.9 ? 13% | 108.8 ? 19% |
| Witcher 3 ultra * (Watt) | 215 | 239 -11% | 242 -13% | 260 -21% | 247 -15% | 209 3% | ||
| Load Maximum * (Watt) | 299 | 251 16% | 273.7 8% | 320 -7% | 342 -14% | 266 11% | 297 ? 1% | 254 ? 15% |
* ... smaller is better
Power Consumption The Witcher 3 / Stress Test
Power Consumption with External Monitor
Battery Life
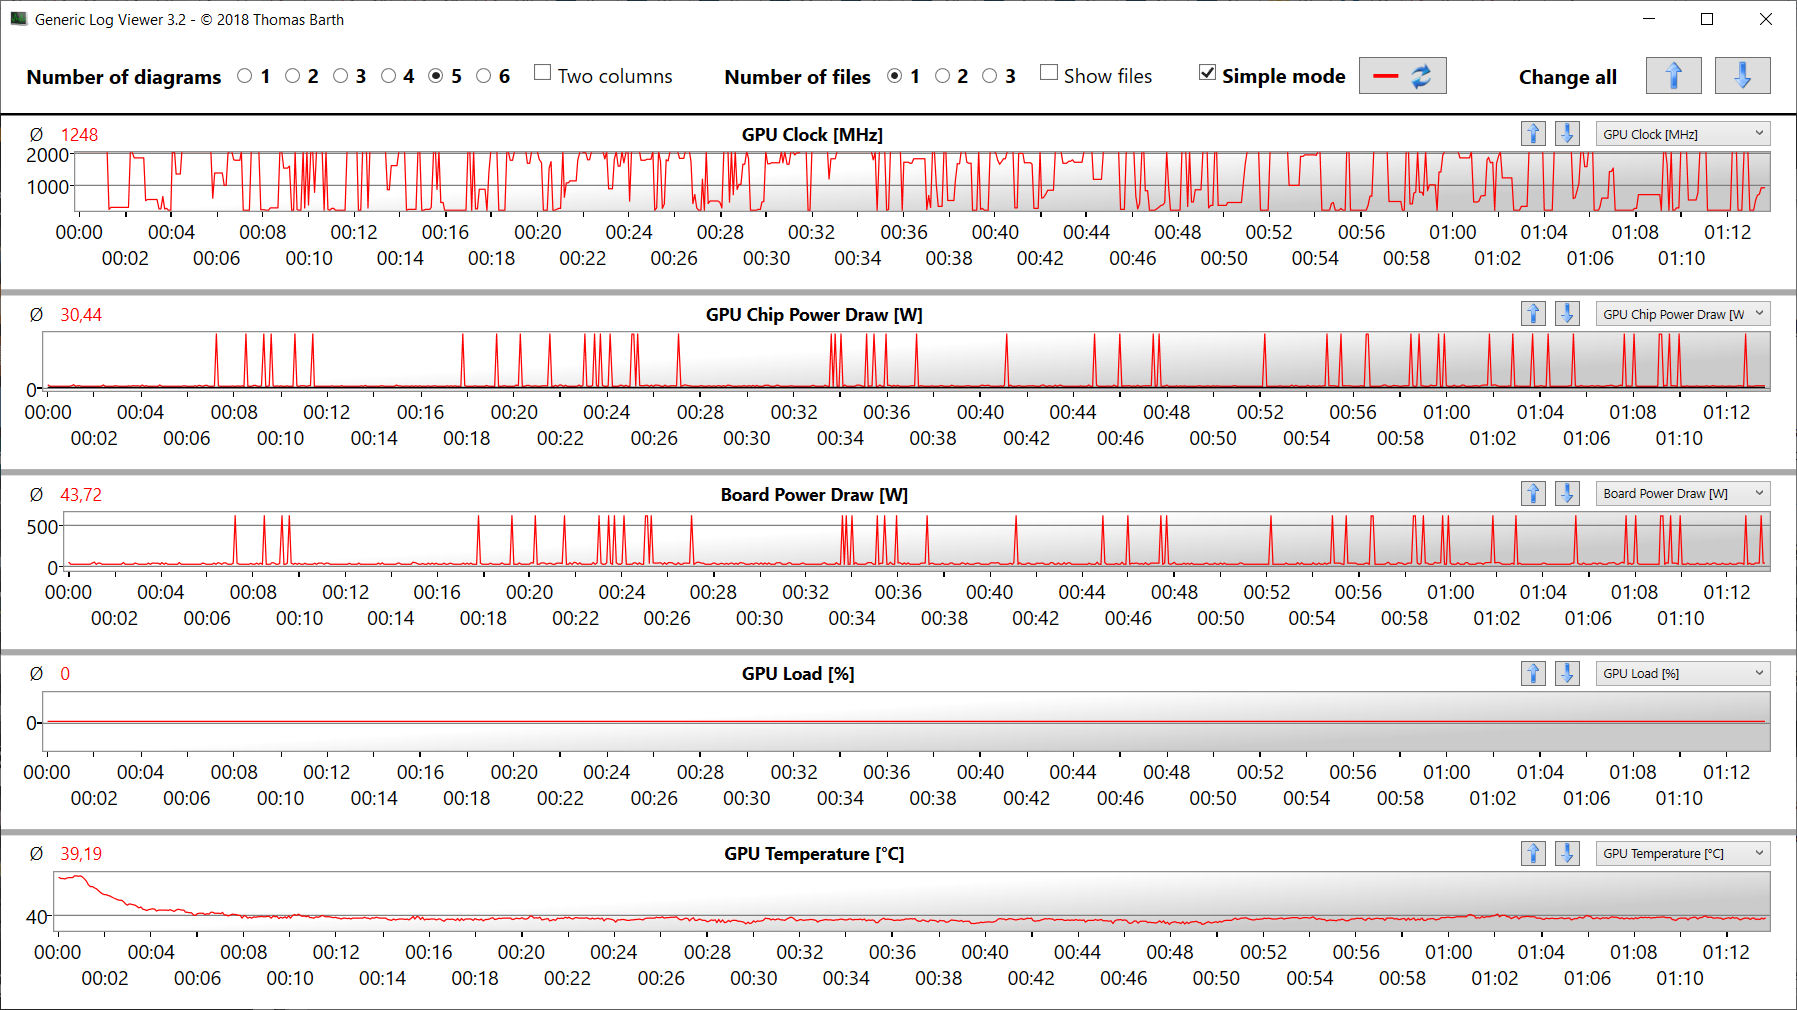
The battery life of the Omen is not satisfactory. Even a powerful gaming laptop has to be able to last longer in Optimus operation with a 83-Wh battery. We were unable to determine until now whether this is due to a hardware or software problem.
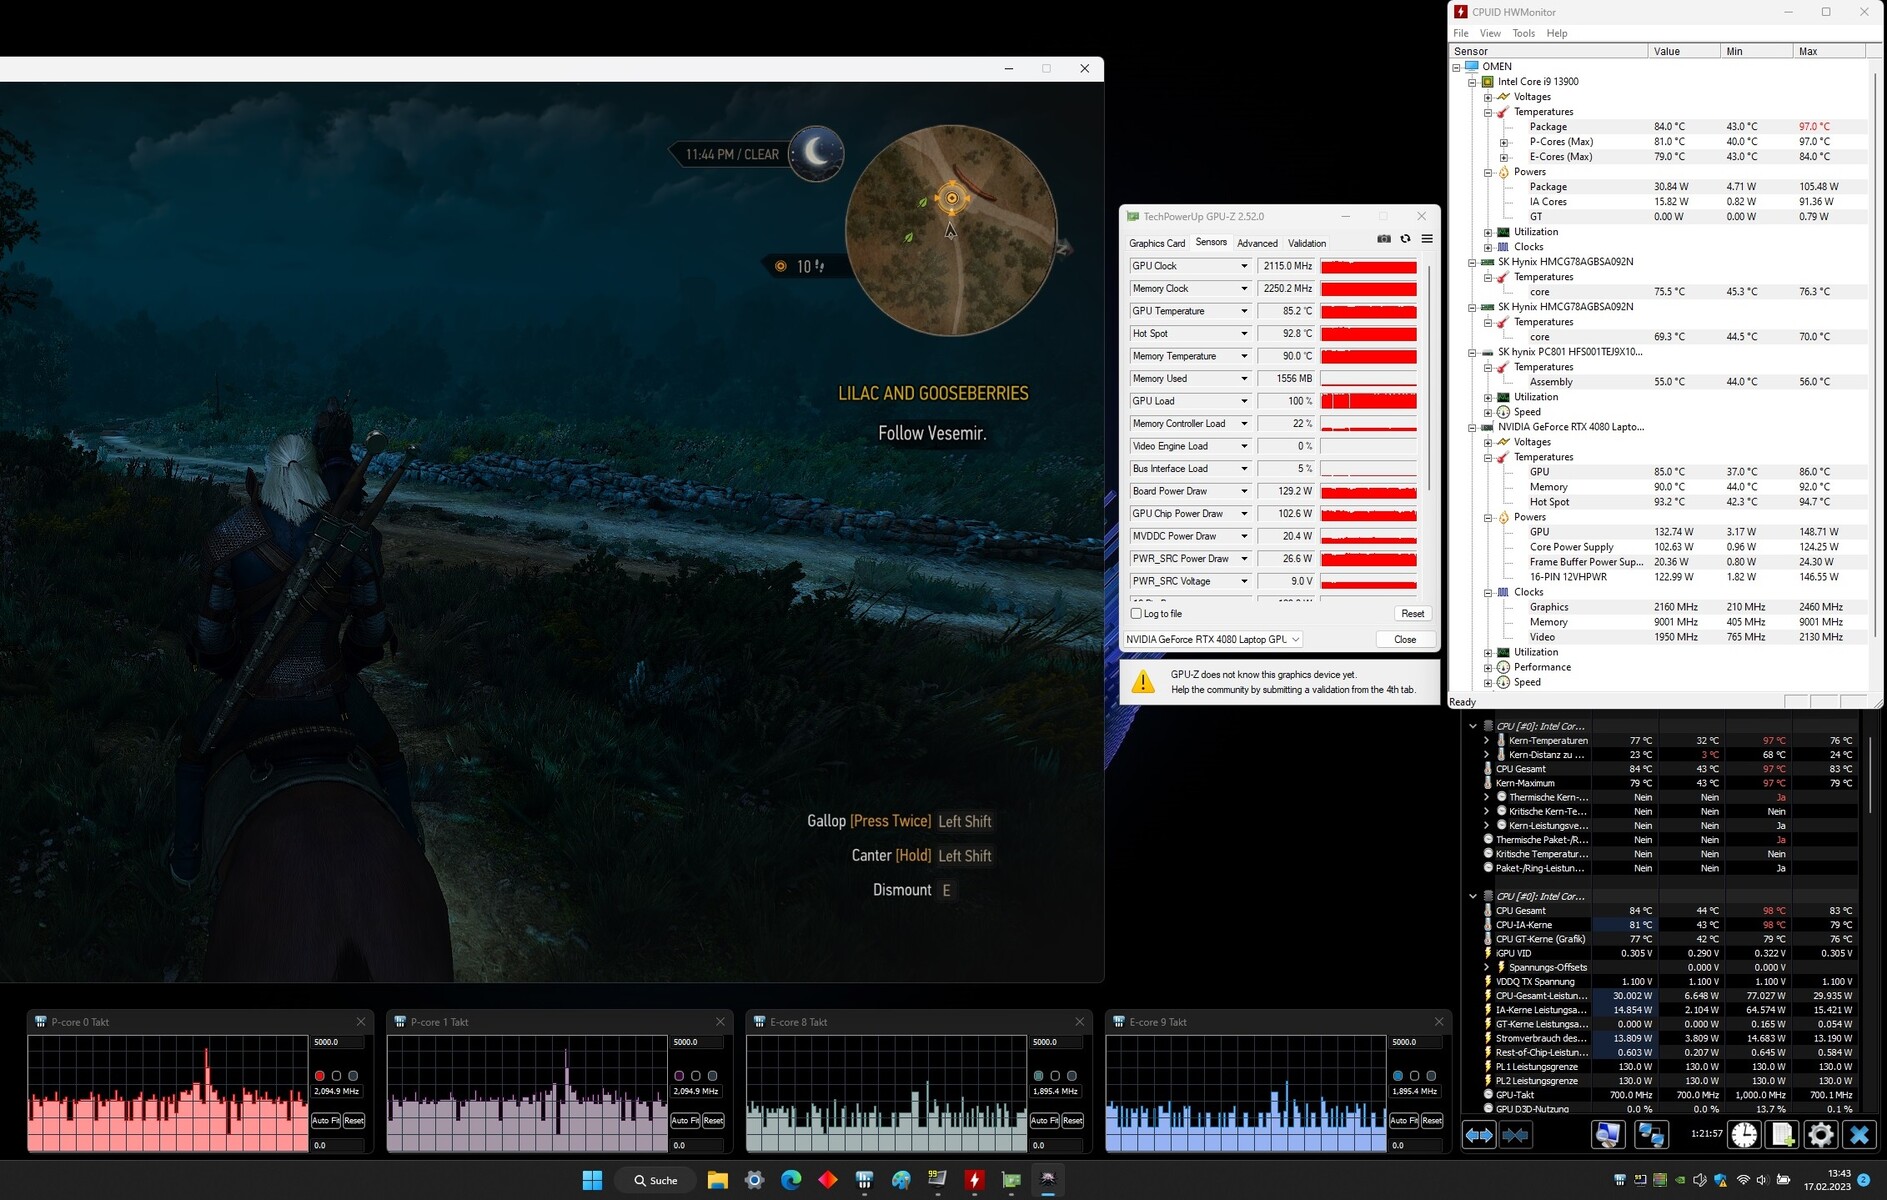
The log files give one indication of the problem: During the low-load runtime tests (WiFi, idle, video), the GeForce GPU should be inactive and leave all the work to the iGPU. However, the GeForce GPU often runs at maximum speed here - at a load of 0%. According to GPU-Z, this leads to a power consumption of up to 45 watts.
For this reason, we asked for a new test unit from HP to doublecheck this, but we did not receive one yet. As soon as we can obtain it, we will test this again.
| HP Omen 17-ck2097ng i9-13900HX, GeForce RTX 4080 Laptop GPU, 83 Wh | Alienware m17 R5 (R9 6900HX, RX 6850M XT) R9 6900HX, Radeon RX 6850M XT, 97 Wh | Razer Blade 16 Early 2023 i9-13950HX, GeForce RTX 4080 Laptop GPU, 95.2 Wh | Lenovo Legion Pro 7 16IRX8H i9-13900HX, GeForce RTX 4080 Laptop GPU, 99.9 Wh | Asus ROG Strix G16 G614JZ i9-13980HX, GeForce RTX 4080 Laptop GPU, 90 Wh | HP Omen 17-ck1075ng i7-12700H, GeForce RTX 3070 Ti Laptop GPU, 78 Wh | Average of class Gaming | |
|---|---|---|---|---|---|---|---|
| Battery runtime | 31% | 60% | 48% | 74% | 80% | 82% | |
| Reader / Idle (h) | 4.2 | 8.9 112% | 6.4 52% | 8.9 112% | 8.71 ? 107% | ||
| H.264 (h) | 3.7 | 4.9 32% | 8.28 ? 124% | ||||
| WiFi v1.3 (h) | 3.6 | 4.8 33% | 6.1 69% | 5.1 42% | 9.7 169% | 6.2 72% | 6.96 ? 93% |
| Load (h) | 1.4 | 1.8 29% | 1.4 0% | 2.1 50% | 1.1 -21% | 2.2 57% | 1.47 ? 5% |
| Gaming (h) | 1 |
Pros
Cons
Verdict - A solid high-end gaming laptop
With the Omen 17, HP delivers a powerful QHD gaming laptop of the high-end segment. With its Core i9-13900HX processor and GeForce RTX 4080 Laptop GPU, the laptop should also work well in other application areas such as video processing and rendering. A fast PCIe 4 SSD (1 TB) provides the necessary storage space and ensures short load times. There is also a space for a second SSD.
The HP Omen 17 (2023) represents a solid gaming laptop, but it doesn't make full use of its potential.
The processor and graphics core are able to run at constantly high clock speeds. The noise and heat development are at the high levels that are normal for this laptop class. However, the laptop produces too much noise in everyday operation.
The matte 17.3-inch display (QHD, IPS, 165 Hz, sRGB) leaves a solid impression. It performs slightly better overall than the FHD panel of the similarly constructed Omen predecessor but worse than most of the competitors. A Thunderbolt 4 connection offers some expansion options (docking solution, external GPU). In addition, it can also be used for charging the battery with a USB-C charger (min. 65 watts, 20 V), and Power Delivery is supported.
Due to a possible defect, we are unable to make a final judgement on the battery life at this point. We will remeasure the battery life as soon as we get a replacement unit from HP. Since the battery life hardly has any impact on the final evaluation of a gaming laptop, the evaluation will change at most only slightly.
As an alternative, you could take a look at the Lenovo Legion Pro 7 16IRX8H, which is able to get a higher performance from the same CPU/GPU combination. In addition, it scores with brighter display in the 16:10 format.
Price and Availability
The Omen 17 (2023) is available from HP starting from $1499.99. A model similar to our tested configuration except for having an i7-13700 would cost $2,429.99 in the US.
HP Omen 17-ck2097ng
- 03/28/2023 v7 (old)
Sascha Mölck
Transparency
The selection of devices to be reviewed is made by our editorial team. The test sample was provided to the author as a loan by the manufacturer or retailer for the purpose of this review. The lender had no influence on this review, nor did the manufacturer receive a copy of this review before publication. There was no obligation to publish this review. As an independent media company, Notebookcheck is not subjected to the authority of manufacturers, retailers or publishers.
This is how Notebookcheck is testing
Every year, Notebookcheck independently reviews hundreds of laptops and smartphones using standardized procedures to ensure that all results are comparable. We have continuously developed our test methods for around 20 years and set industry standards in the process. In our test labs, high-quality measuring equipment is utilized by experienced technicians and editors. These tests involve a multi-stage validation process. Our complex rating system is based on hundreds of well-founded measurements and benchmarks, which maintains objectivity. Further information on our test methods can be found here.
Price comparison

