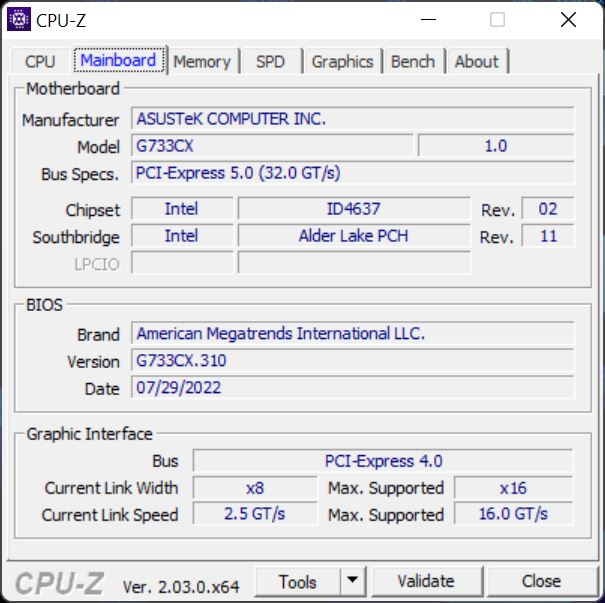
Asus ROG Strix Scar 17 SE review - Fully equipped gaming laptop with RTX 3080 Ti
The ROG Strix Scar SE is the gaming flagship from Asus, and in 2022 as well, it is again equipped with the fastest components that are currently available on the market. We test the G733CX top model with the Intel Core i9-12950HX, the Nvidia GeForce RTX 3080 Ti, two 2-TB SSDs from Samsung, and a fast QHD panel with a 240-Hz refresh rate. The price is high-end as well, since the MSRP of our test unit comes in at 3,999 Euros (~$4,129).
Possible Competitors in Comparison
Rating | Date | Model | Weight | Height | Size | Resolution | Price |
|---|---|---|---|---|---|---|---|
| 86.9 % v7 (old) | 11 / 2022 | Asus ROG Strix Scar 17 SE G733CX-LL014W i9-12950HX, GeForce RTX 3080 Ti Laptop GPU | 2.9 kg | 28.3 mm | 17.30" | 2560x1440 | |
| 88.9 % v7 (old) | 09 / 2022 | Lenovo Legion 7 16IAX7-82TD004SGE i9-12900HX, GeForce RTX 3080 Ti Laptop GPU | 2.6 kg | 20 mm | 16.00" | 2560x1600 | |
| 88.3 % v7 (old) | 08 / 2022 | MSI Titan GT77 12UHS i9-12900HX, GeForce RTX 3080 Ti Laptop GPU | 3.3 kg | 23 mm | 17.30" | 1920x1080 | |
| 87.6 % v7 (old) | 08 / 2022 | Schenker XMG Neo 17 M22 R9 6900HX, GeForce RTX 3080 Ti Laptop GPU | 2.8 kg | 27 mm | 17.00" | 2560x1600 | |
| 89.2 % v7 (old) | 05 / 2022 | Alienware x17 R2 P48E i9-12900HK, GeForce RTX 3080 Ti Laptop GPU | 3.1 kg | 20.9 mm | 17.30" | 1920x1080 |
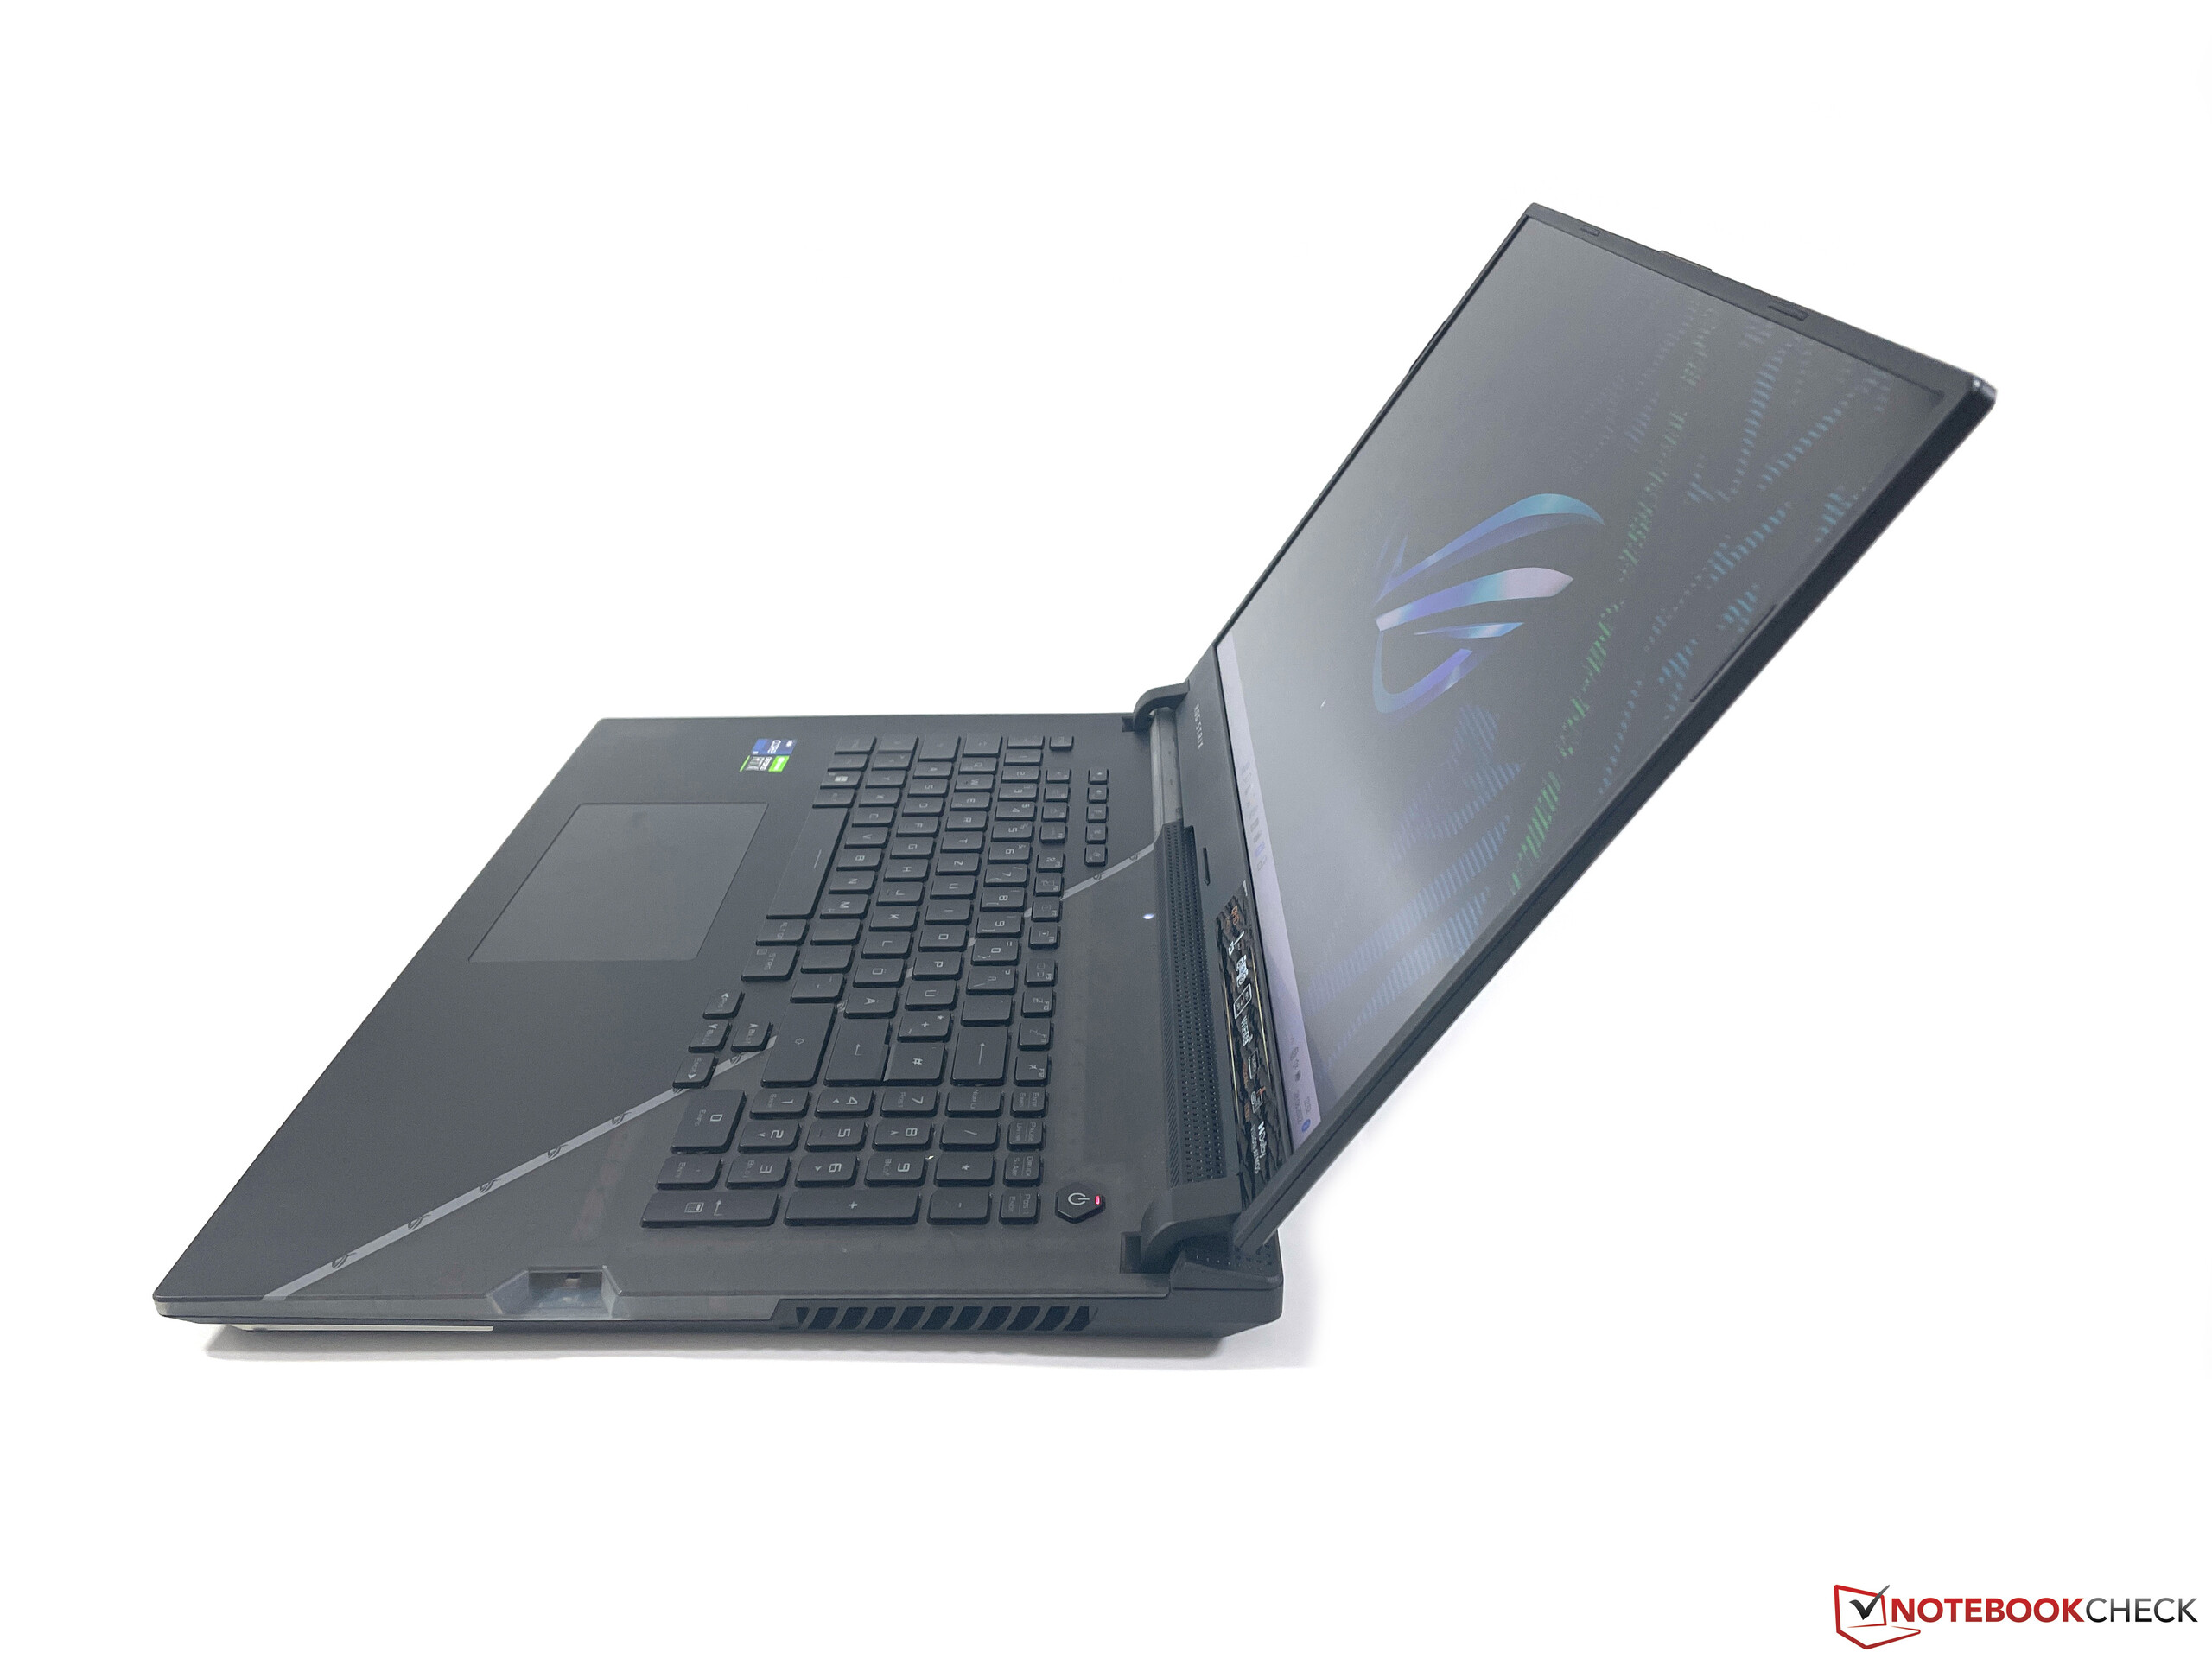
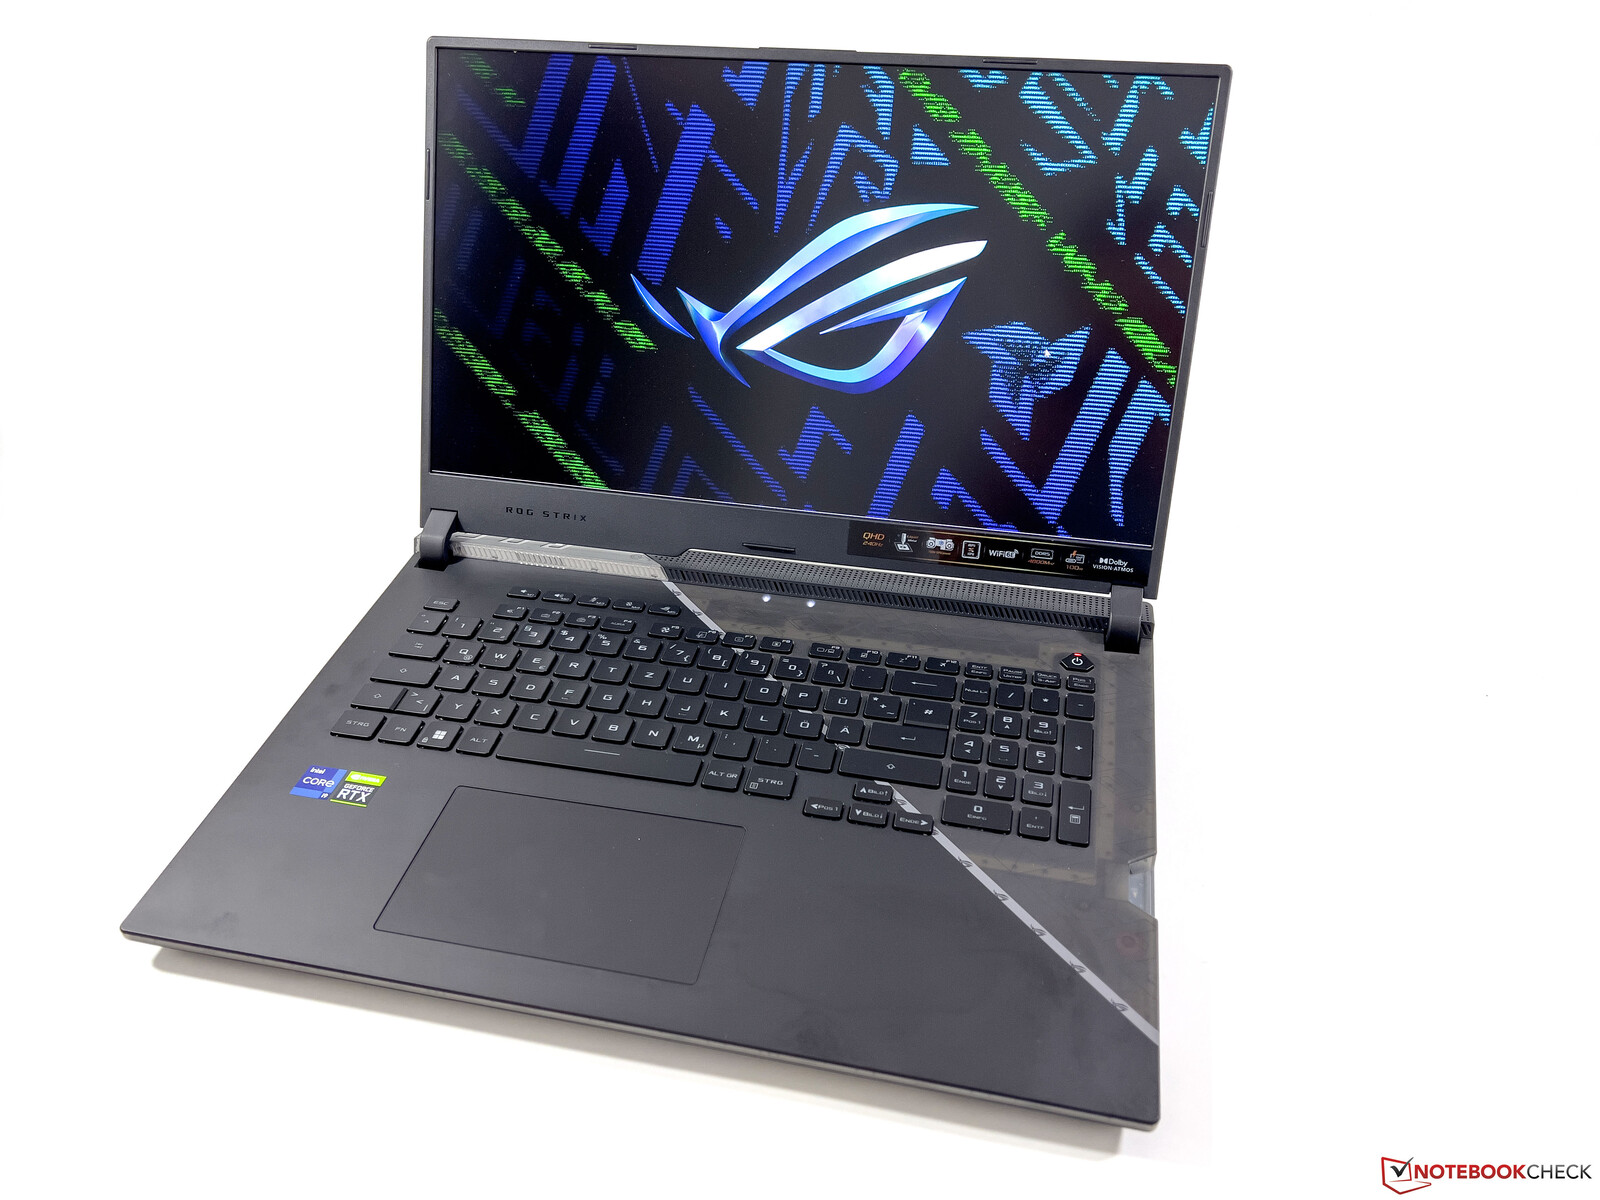
Case - Gaming laptop with a design that stands out and extensive illumination
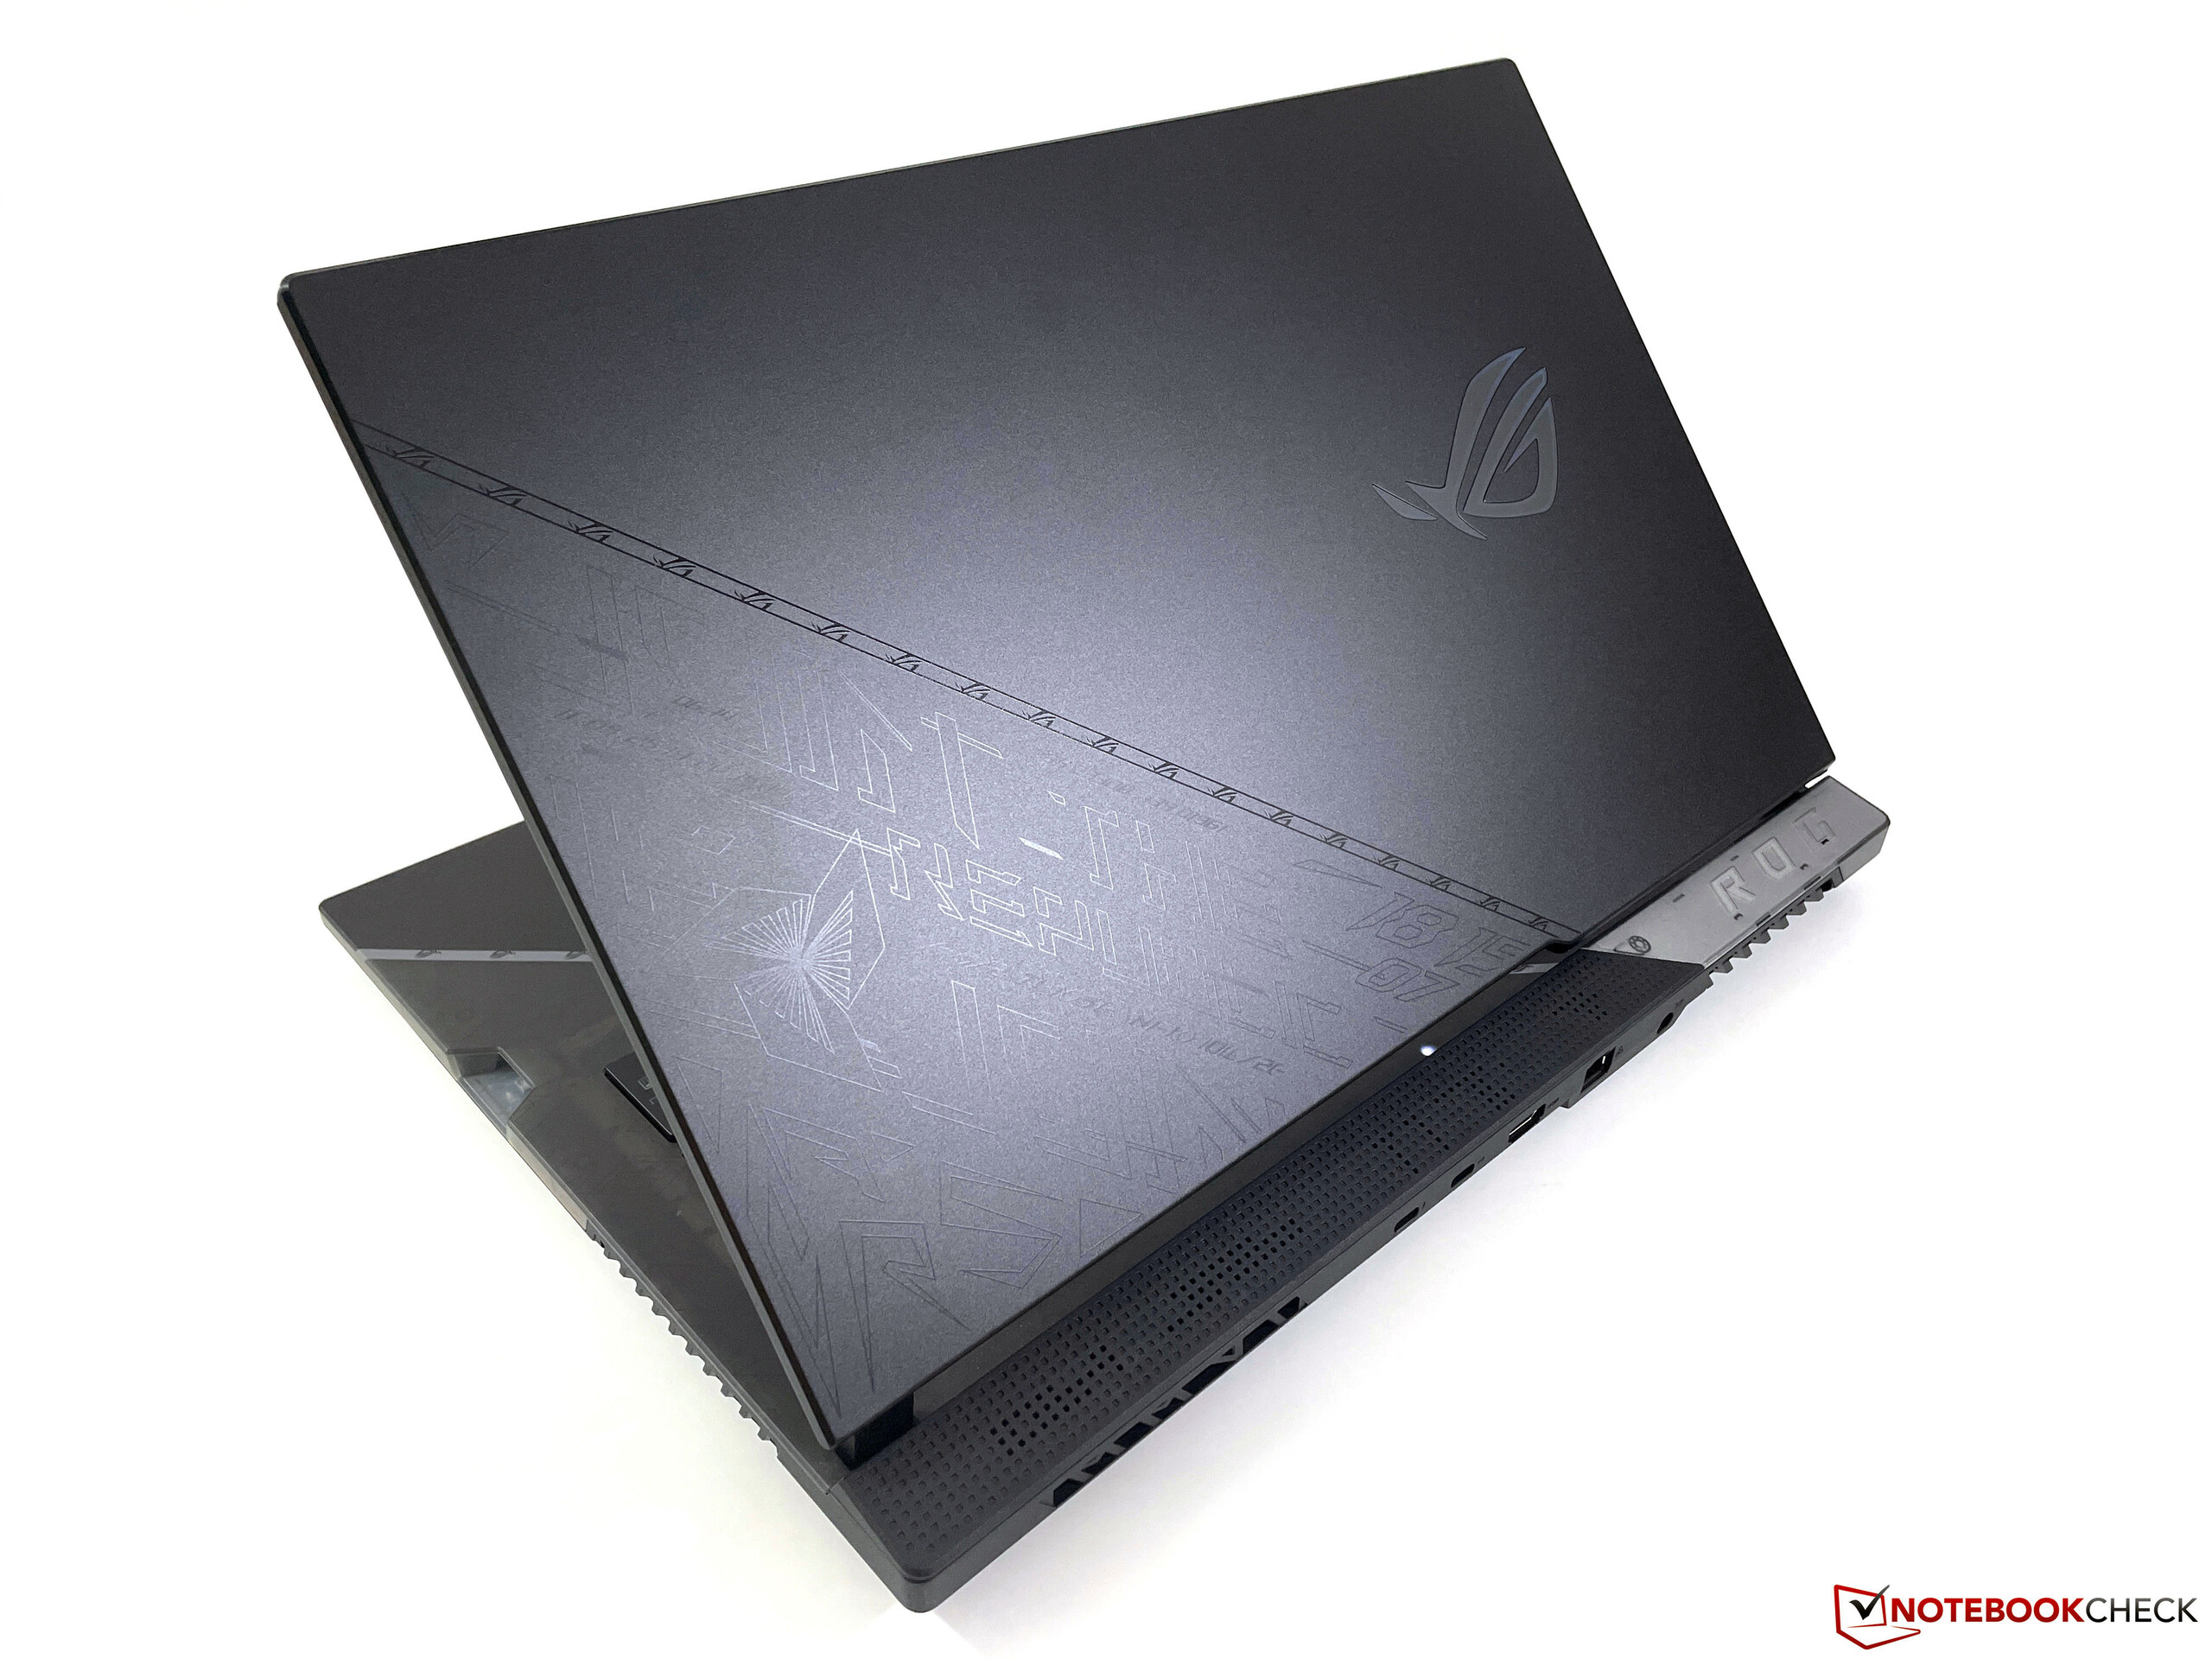
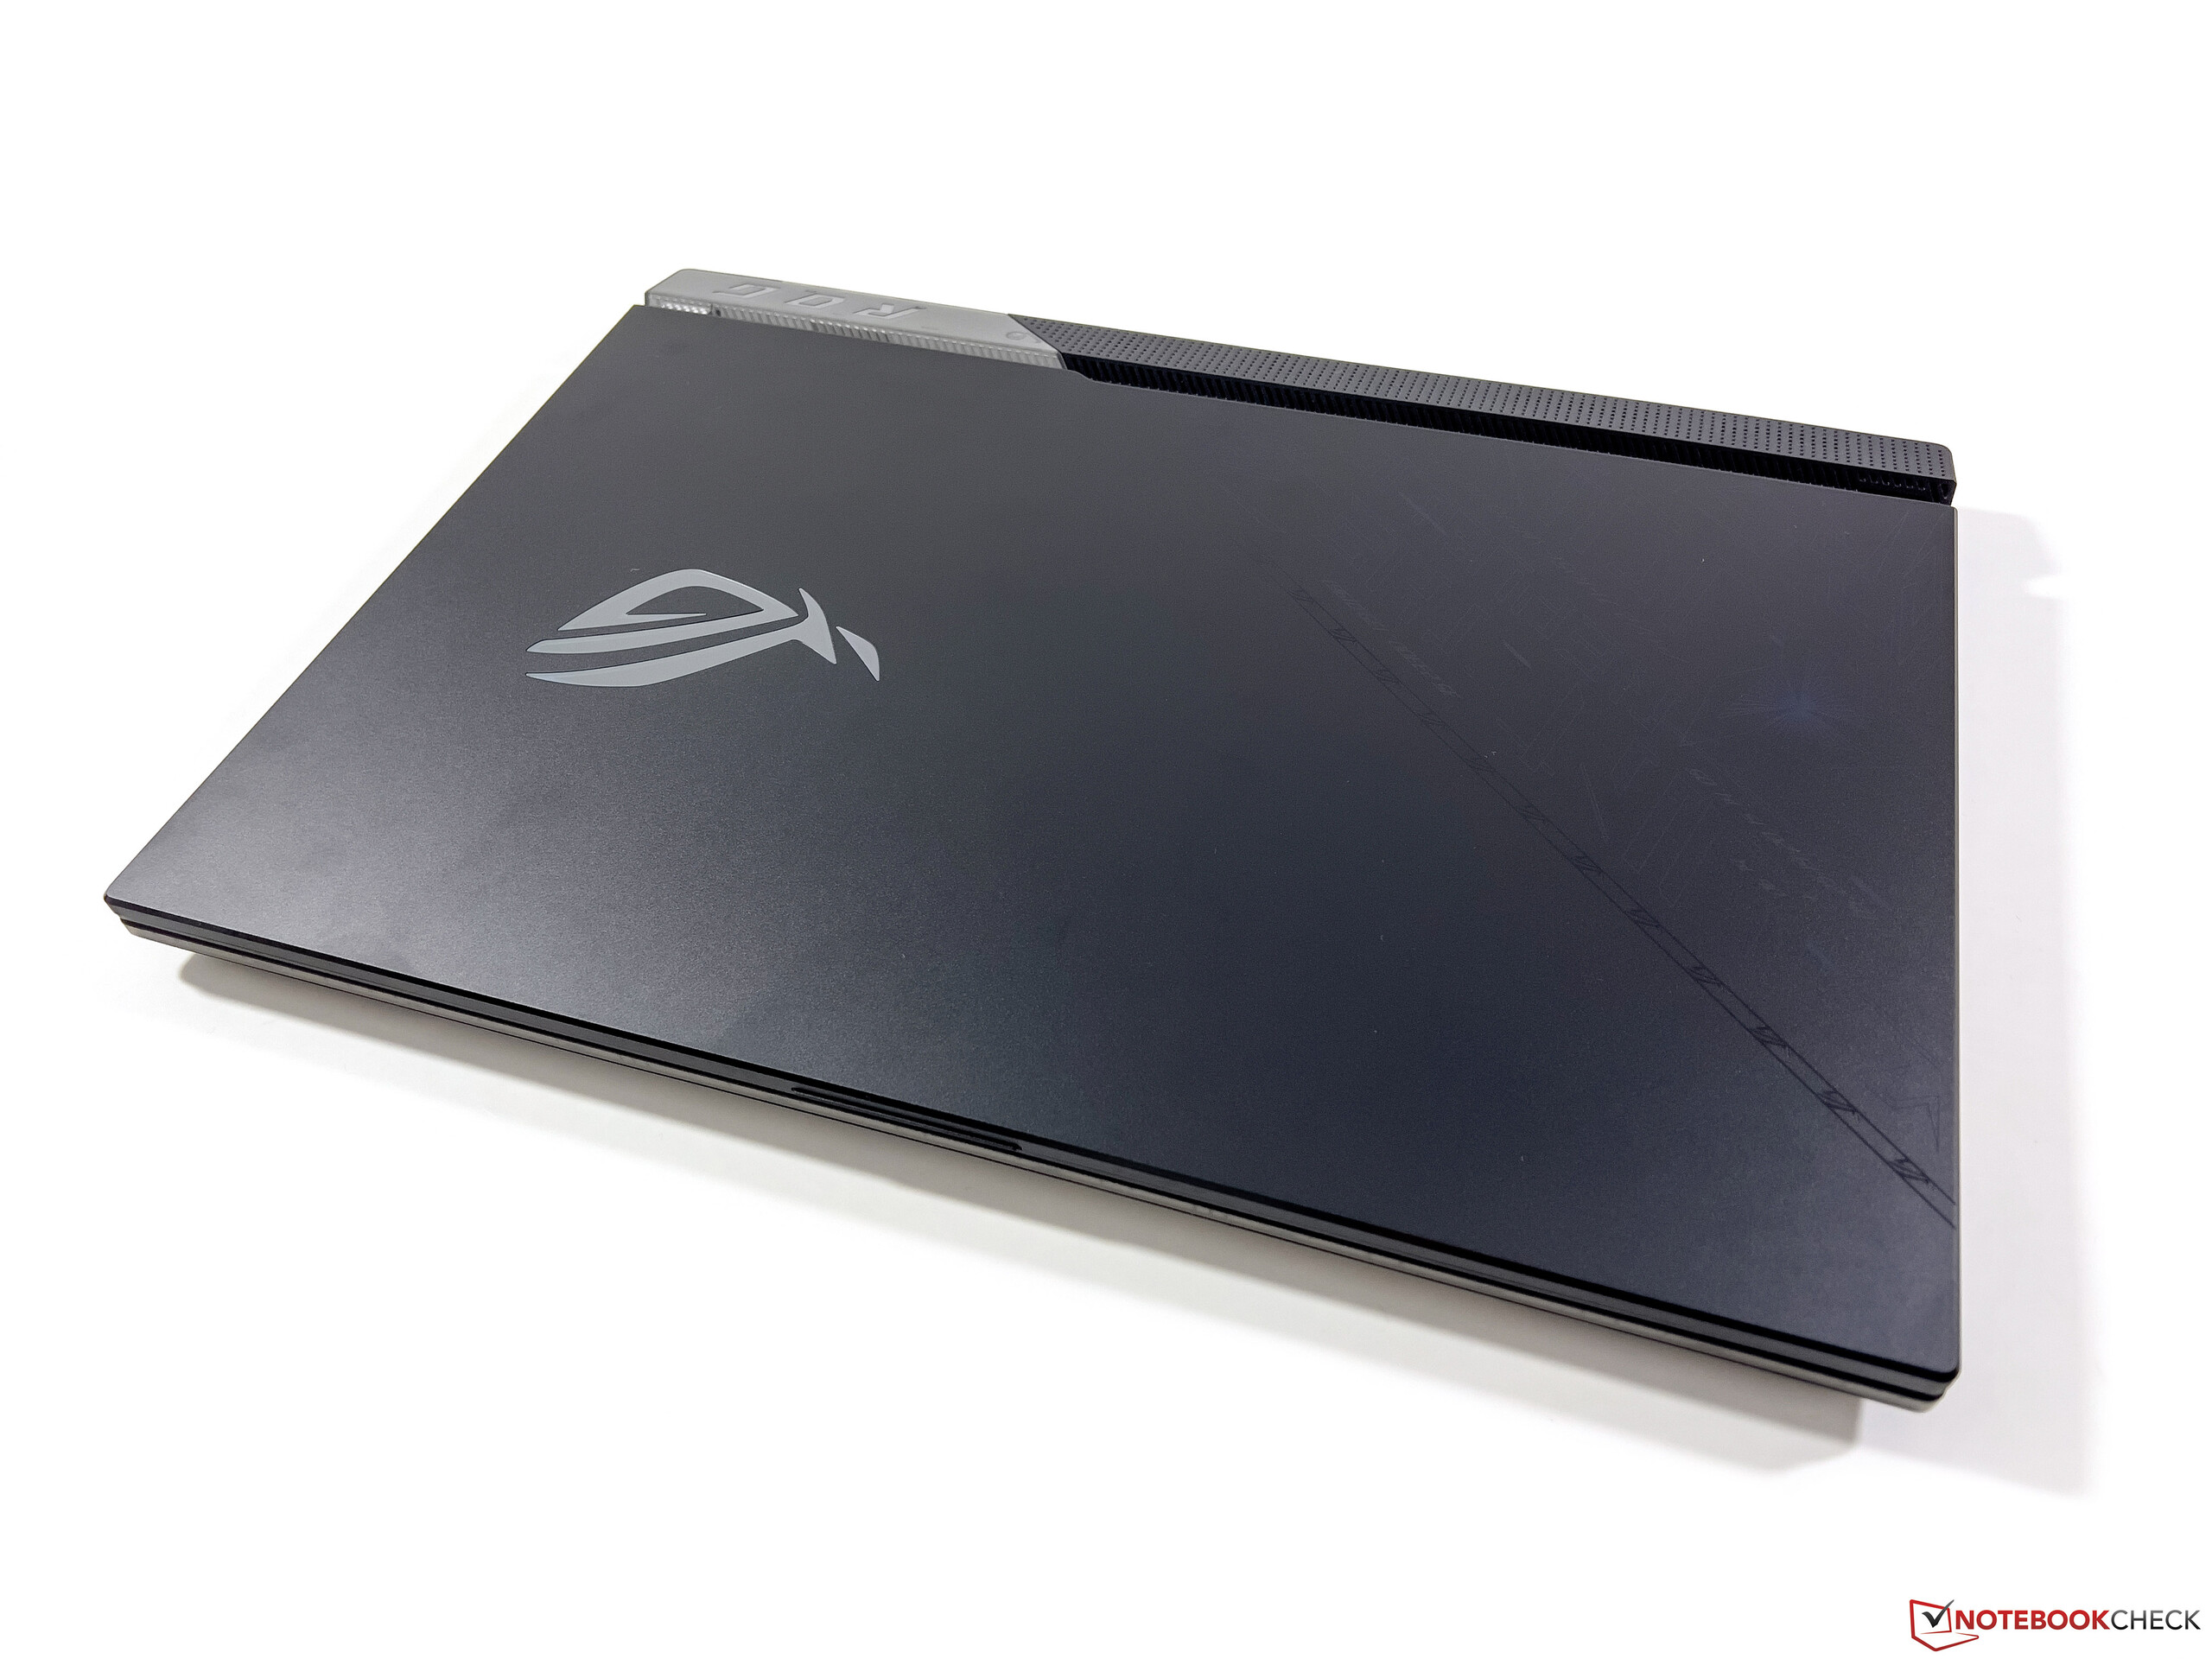
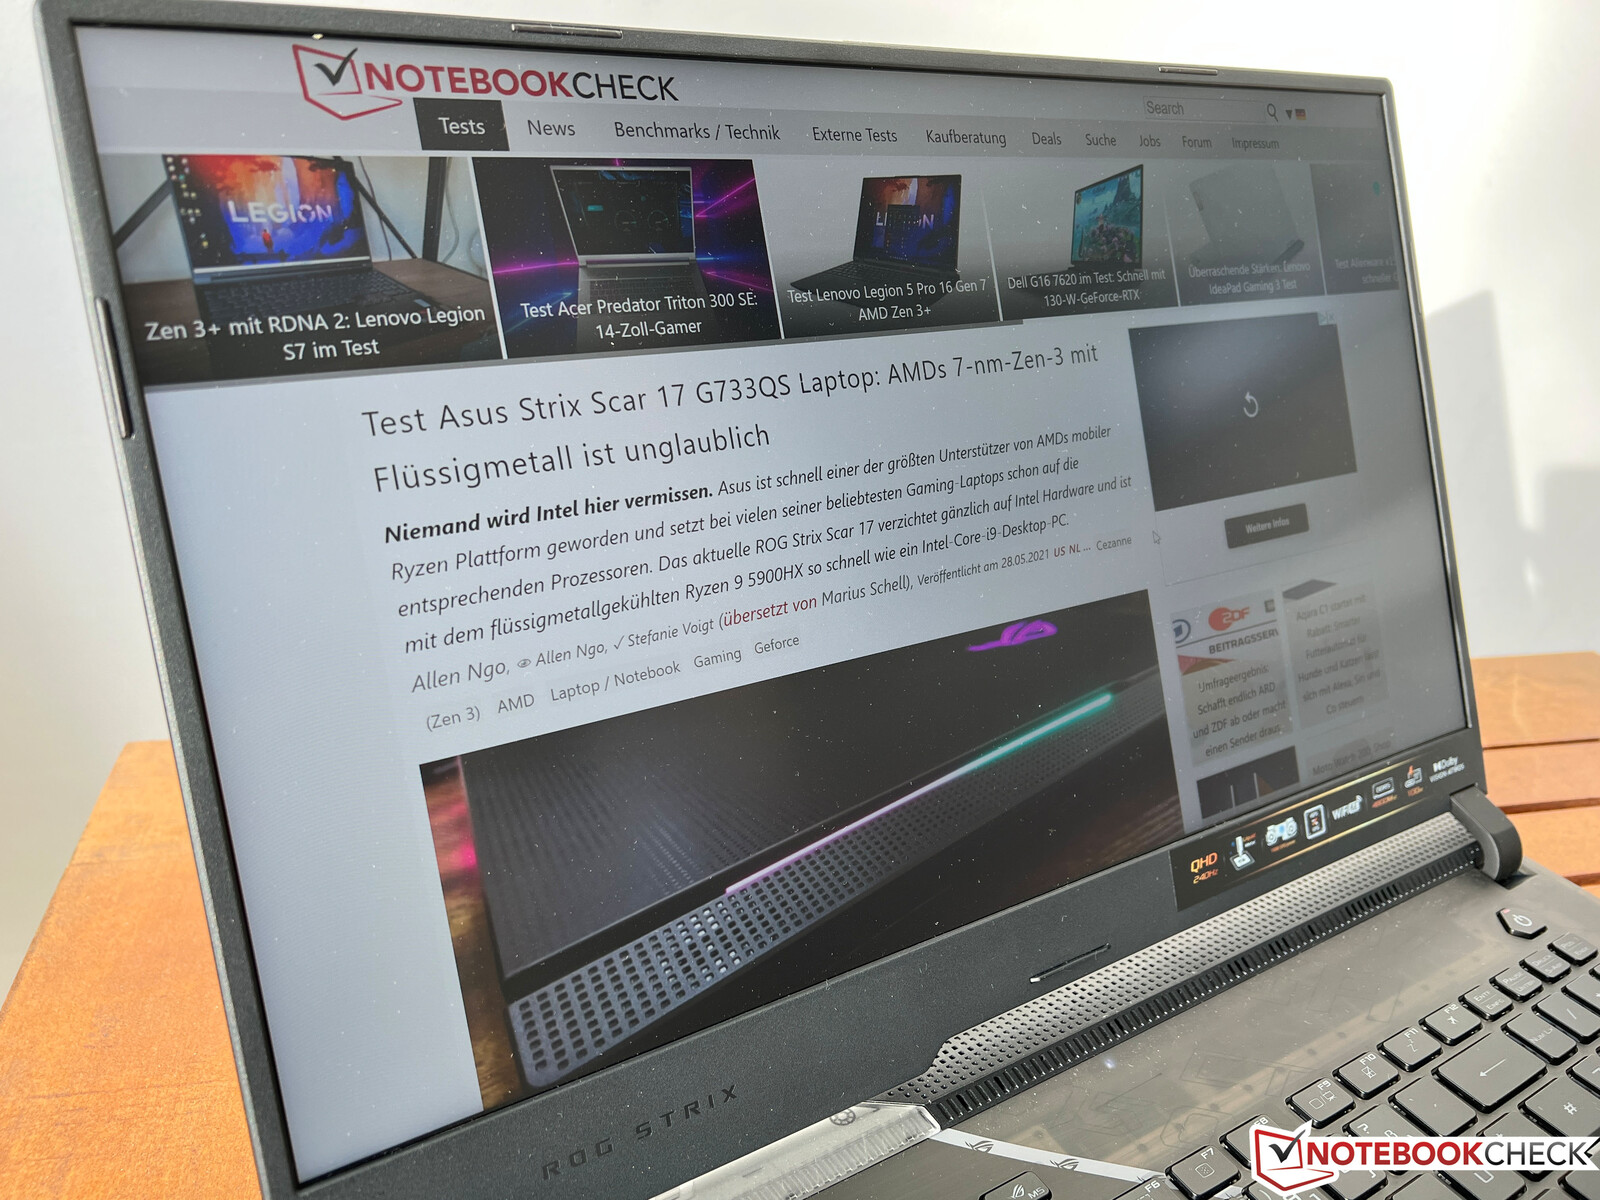
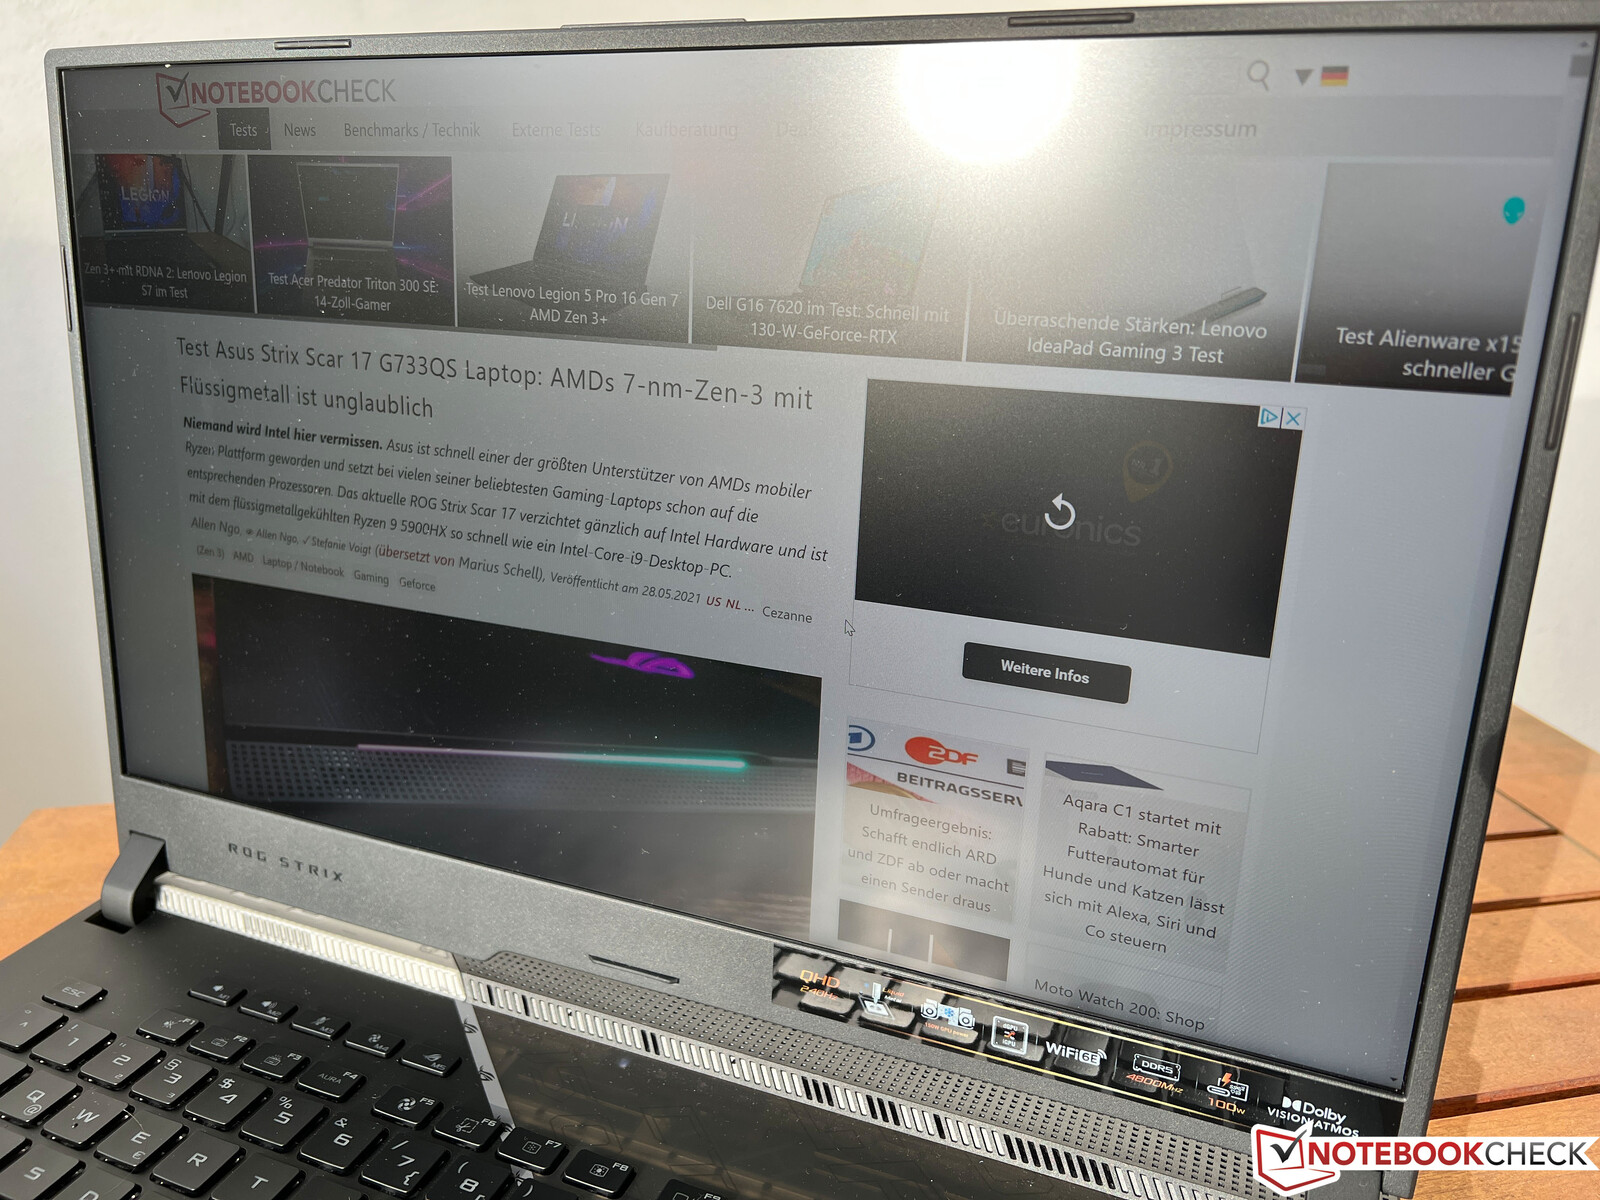
The ROG Strix Scar 17 is clearly a gaming laptop that doesn't hide its ambitions at all. The case is to a large extent identical to last year's G733QS, and one part of the base unit is transparent again. In addition, there are extensively illuminated elements and some additional design elements or gimmicks such as the special writing on the lid that only becomes visible when you shine a UV light on it.
The quality of the plastic case is good overall, even though the surfaces continue to be prone to fingerprints and you might hear the occasional slight creaking noise when opening the display, for example. The stability of the thick base unit is decent, but you can still press down the base unit minimally in the central area of the keyboard. While the relatively slim display lid does a good job, the hinge is still unable to prevent some slight wobbling after the laptop is moved, for example.
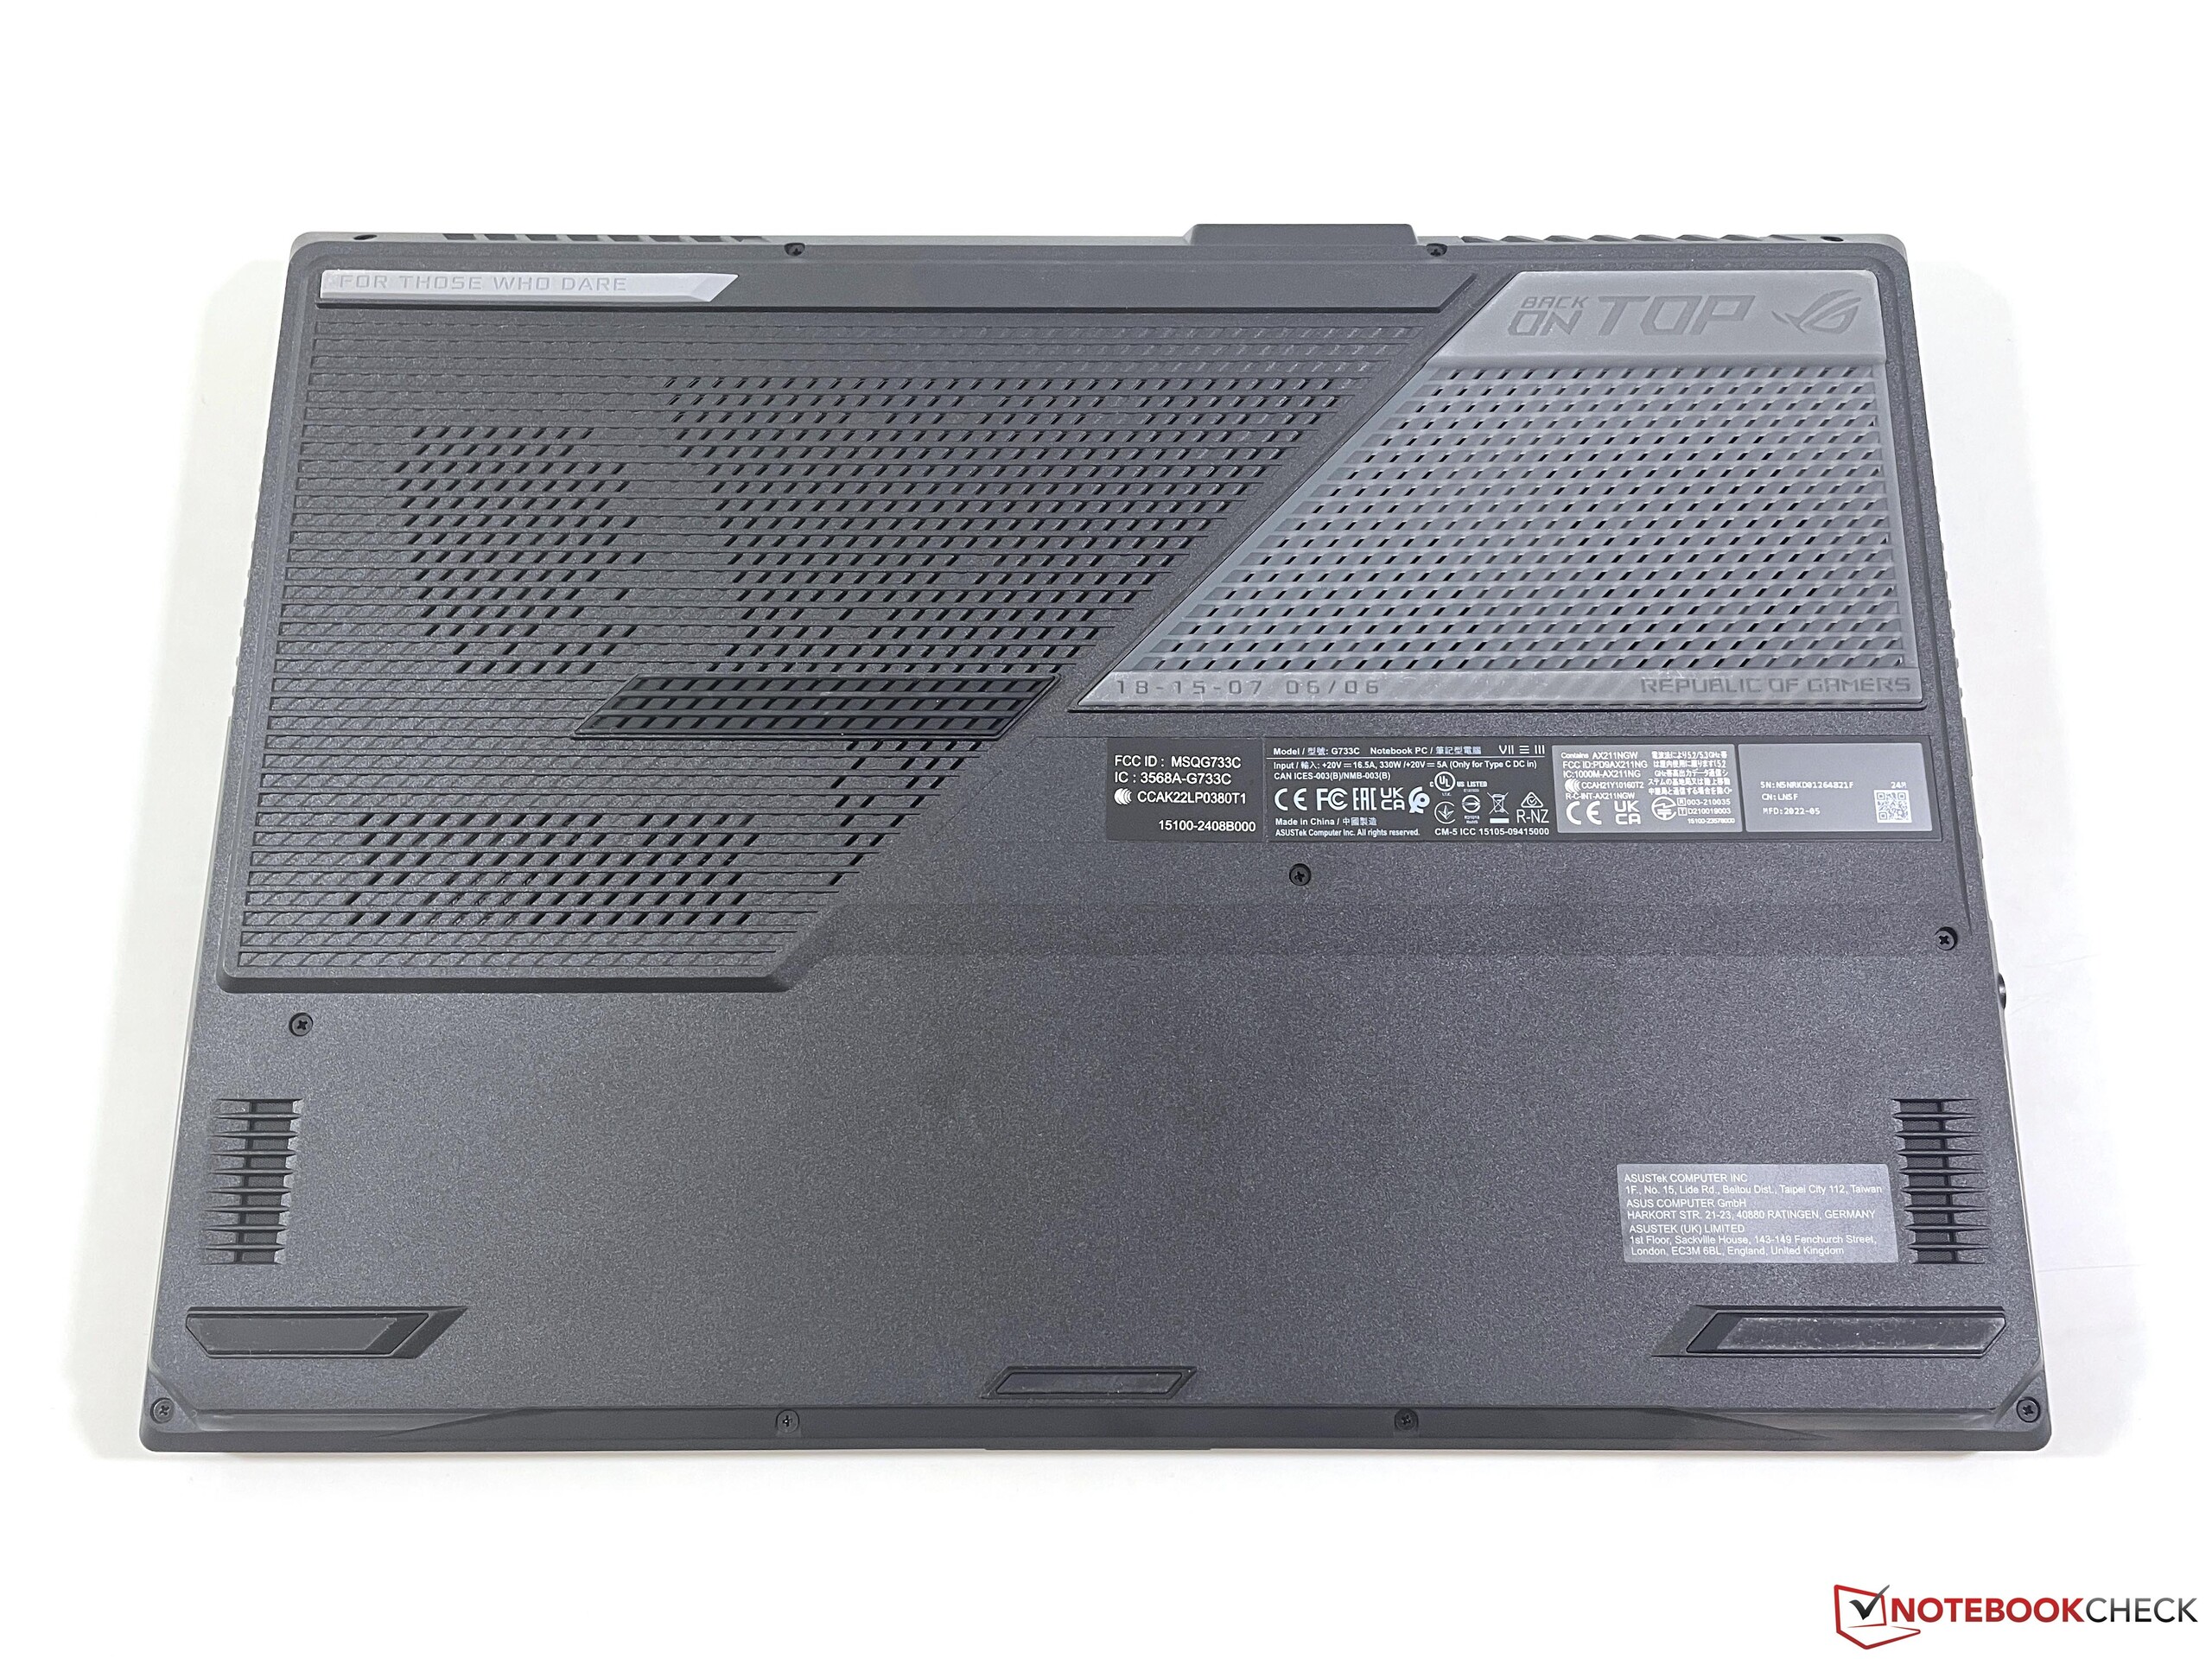
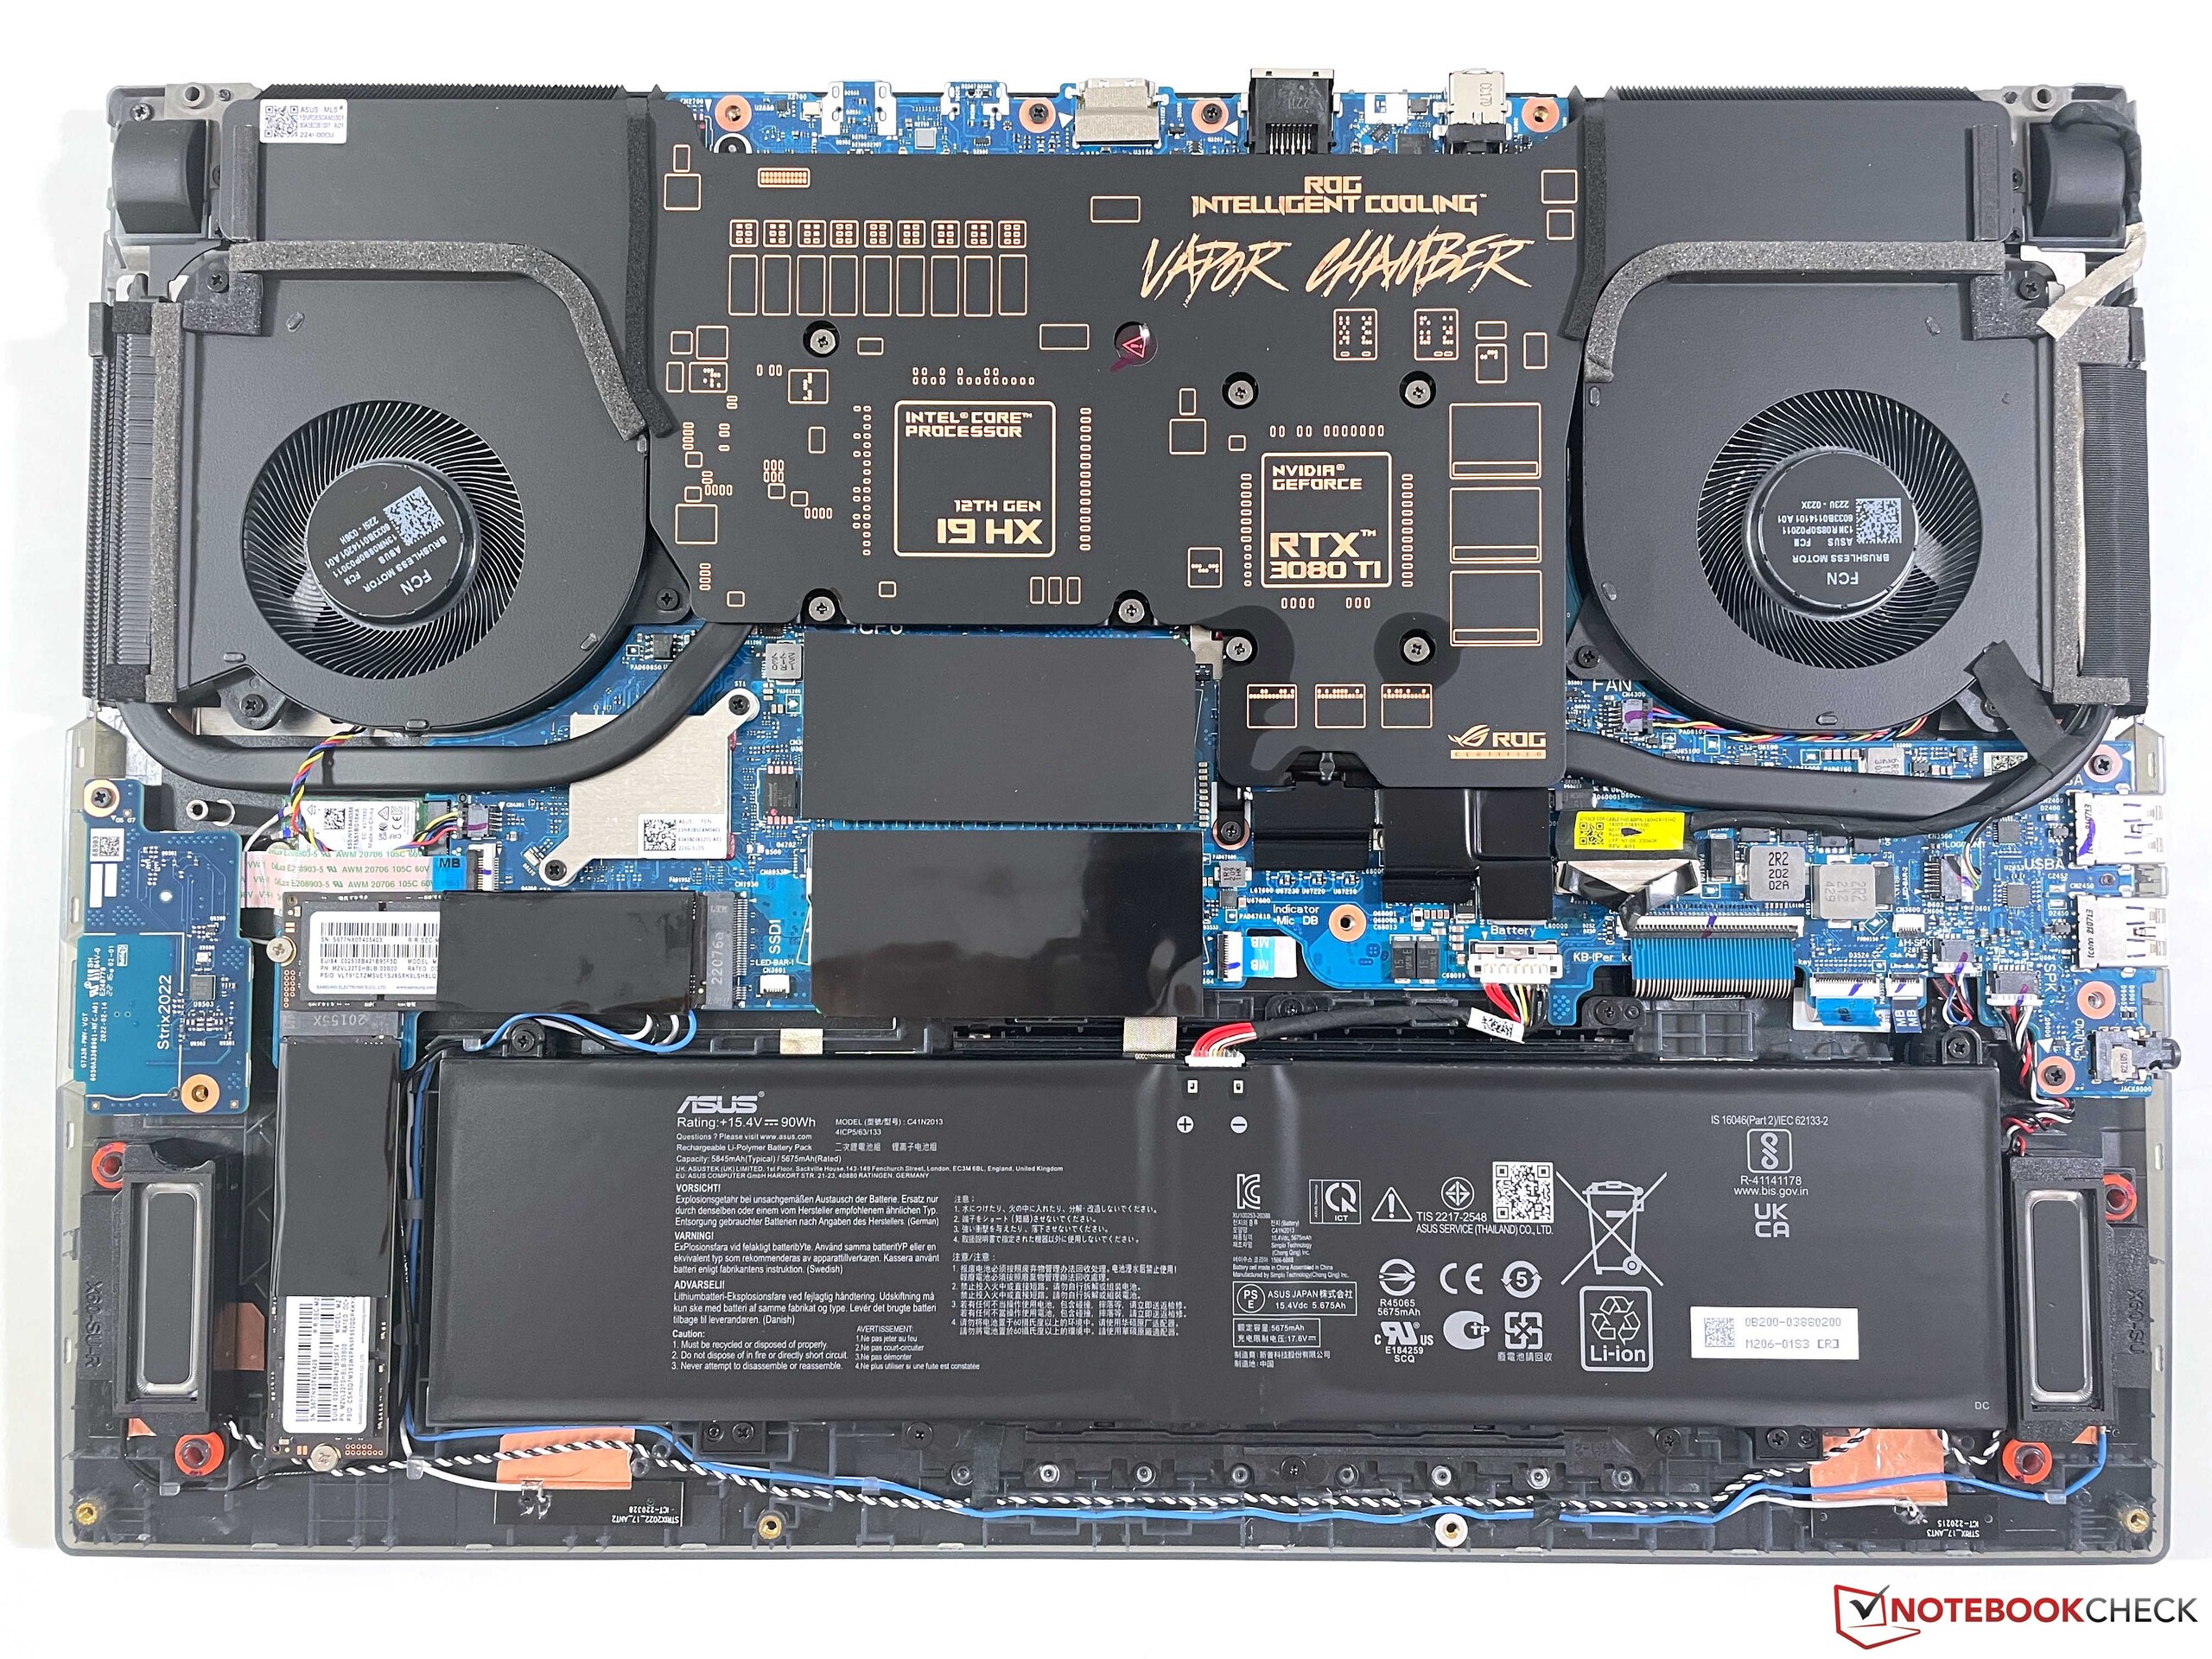
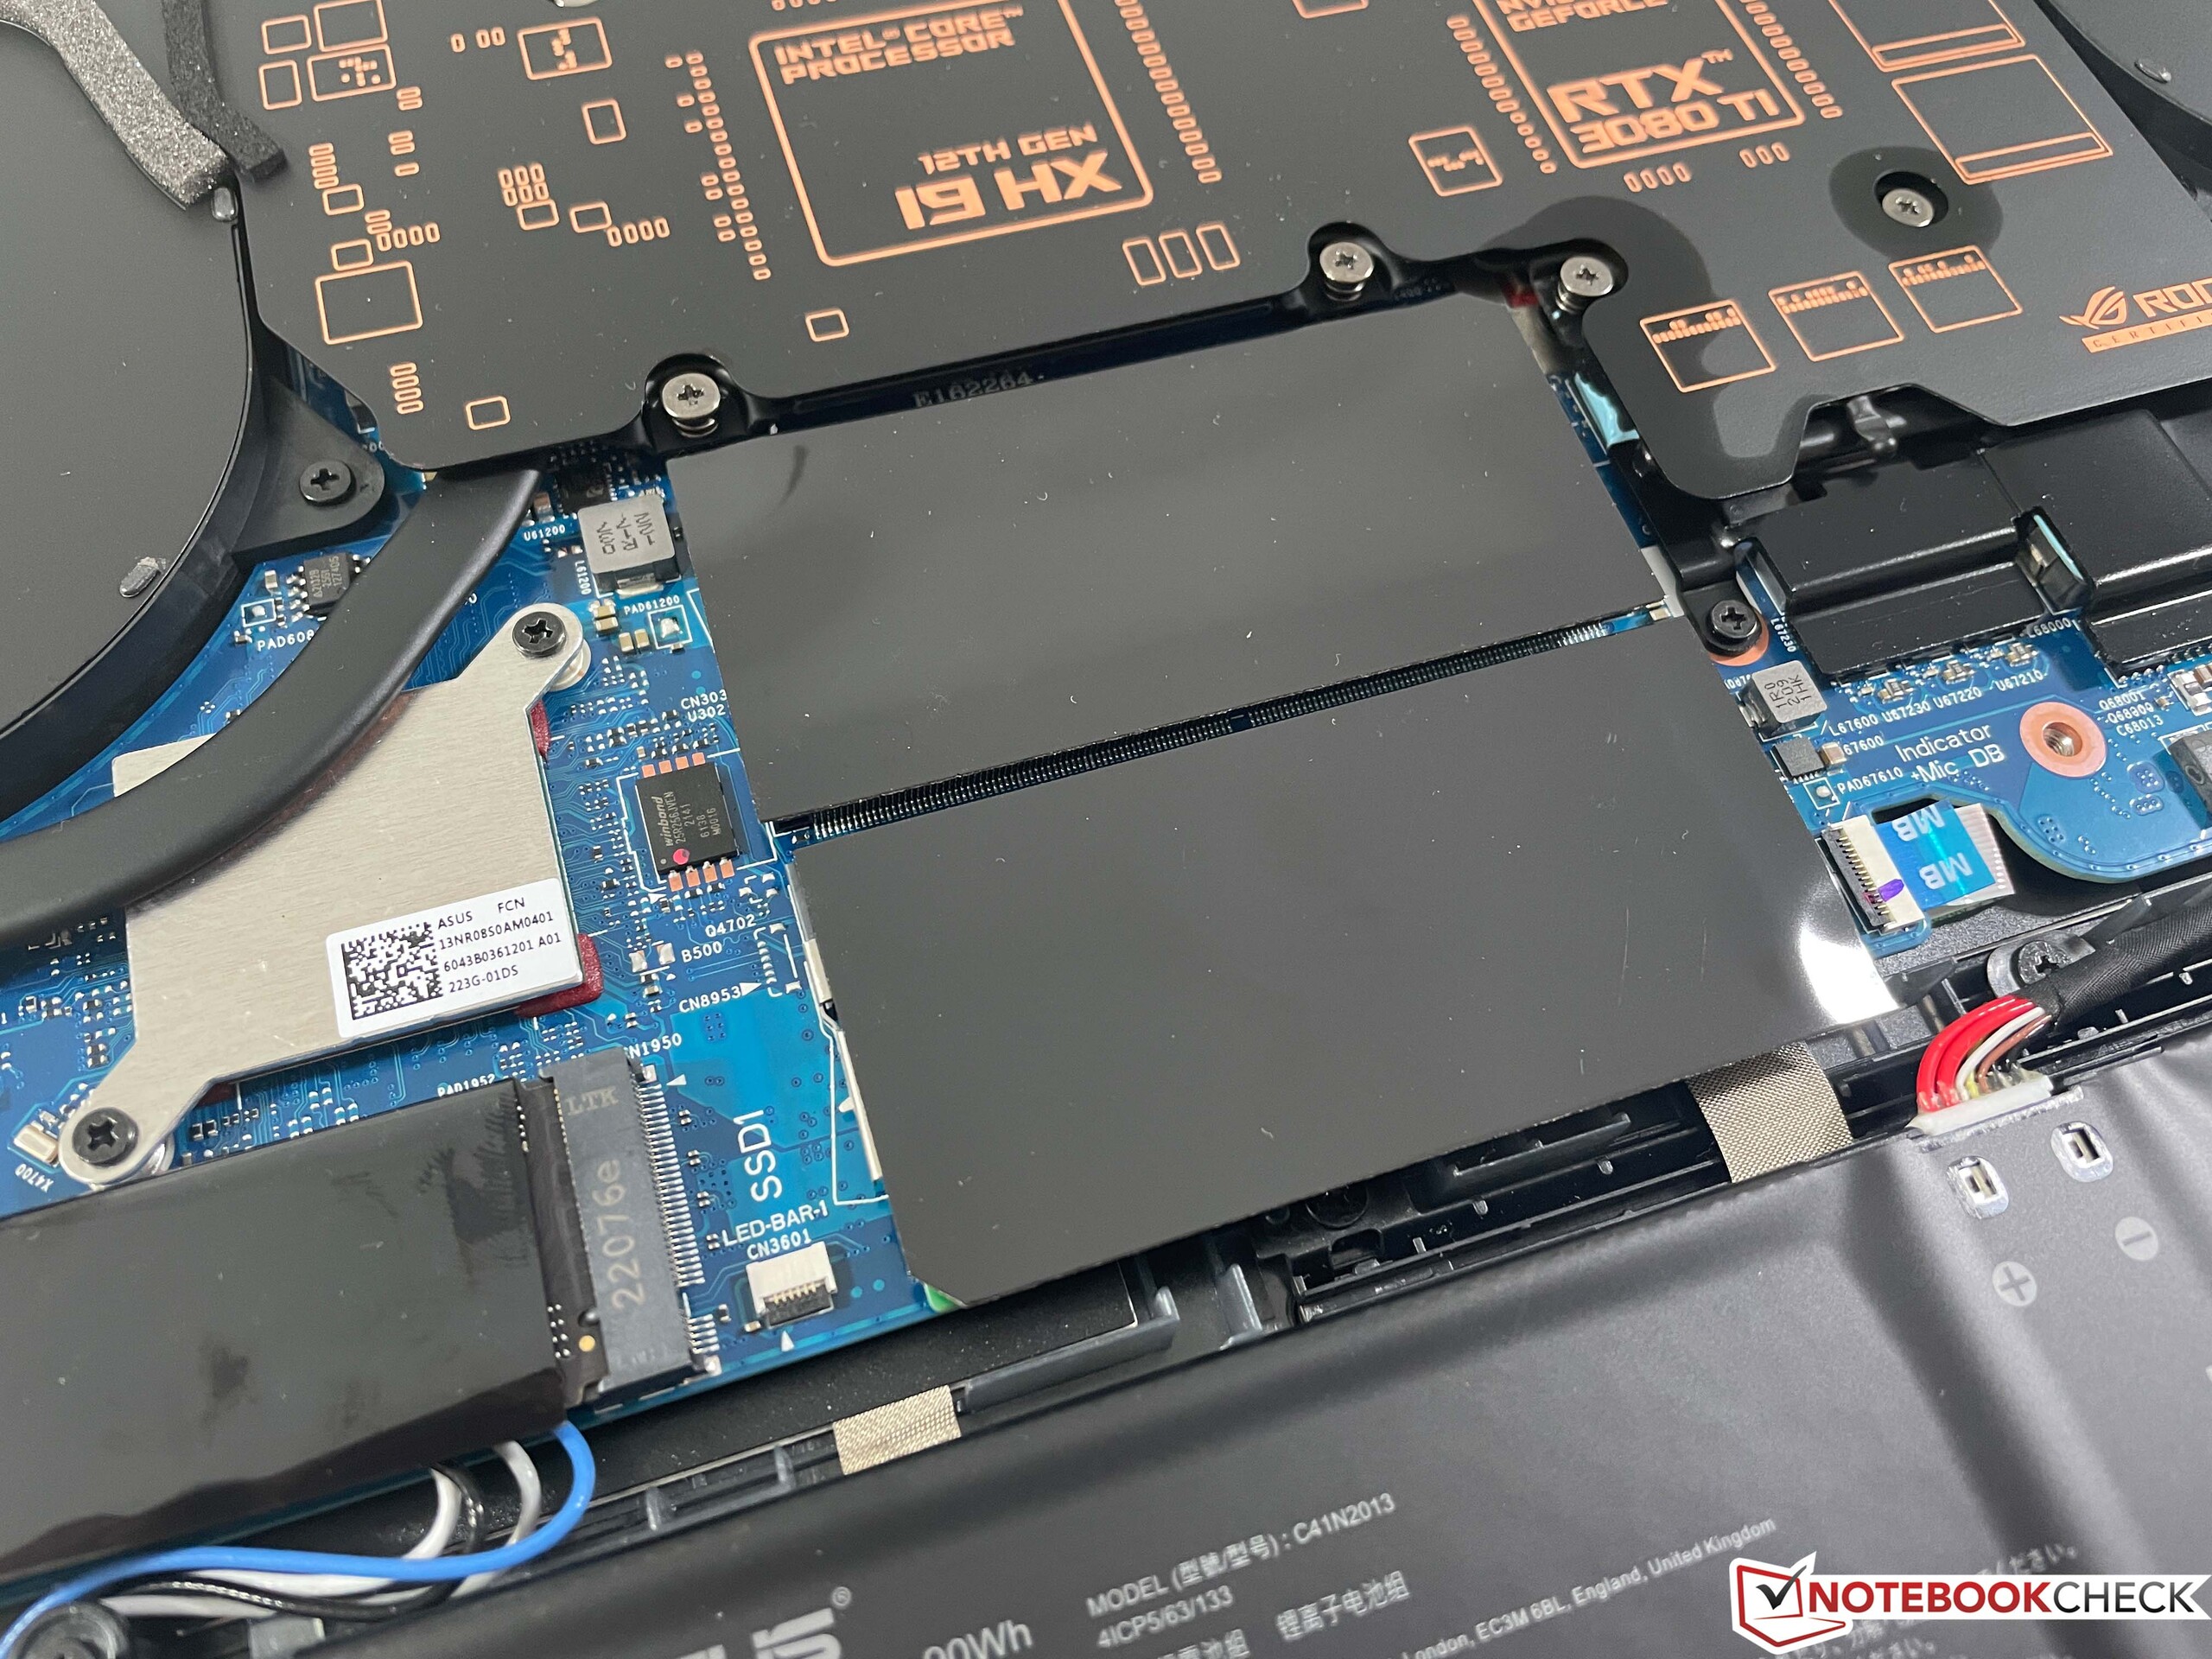
Even though the bottom cover of the case can be removed, you have to be careful doing that. Since the illumination is integrated into the part, you first have to disconnect two small flat cables, before you can remove the cover. With access to the fans, the two SSDs, two RAM modules, and the WLAN module, the maintenance options are good.
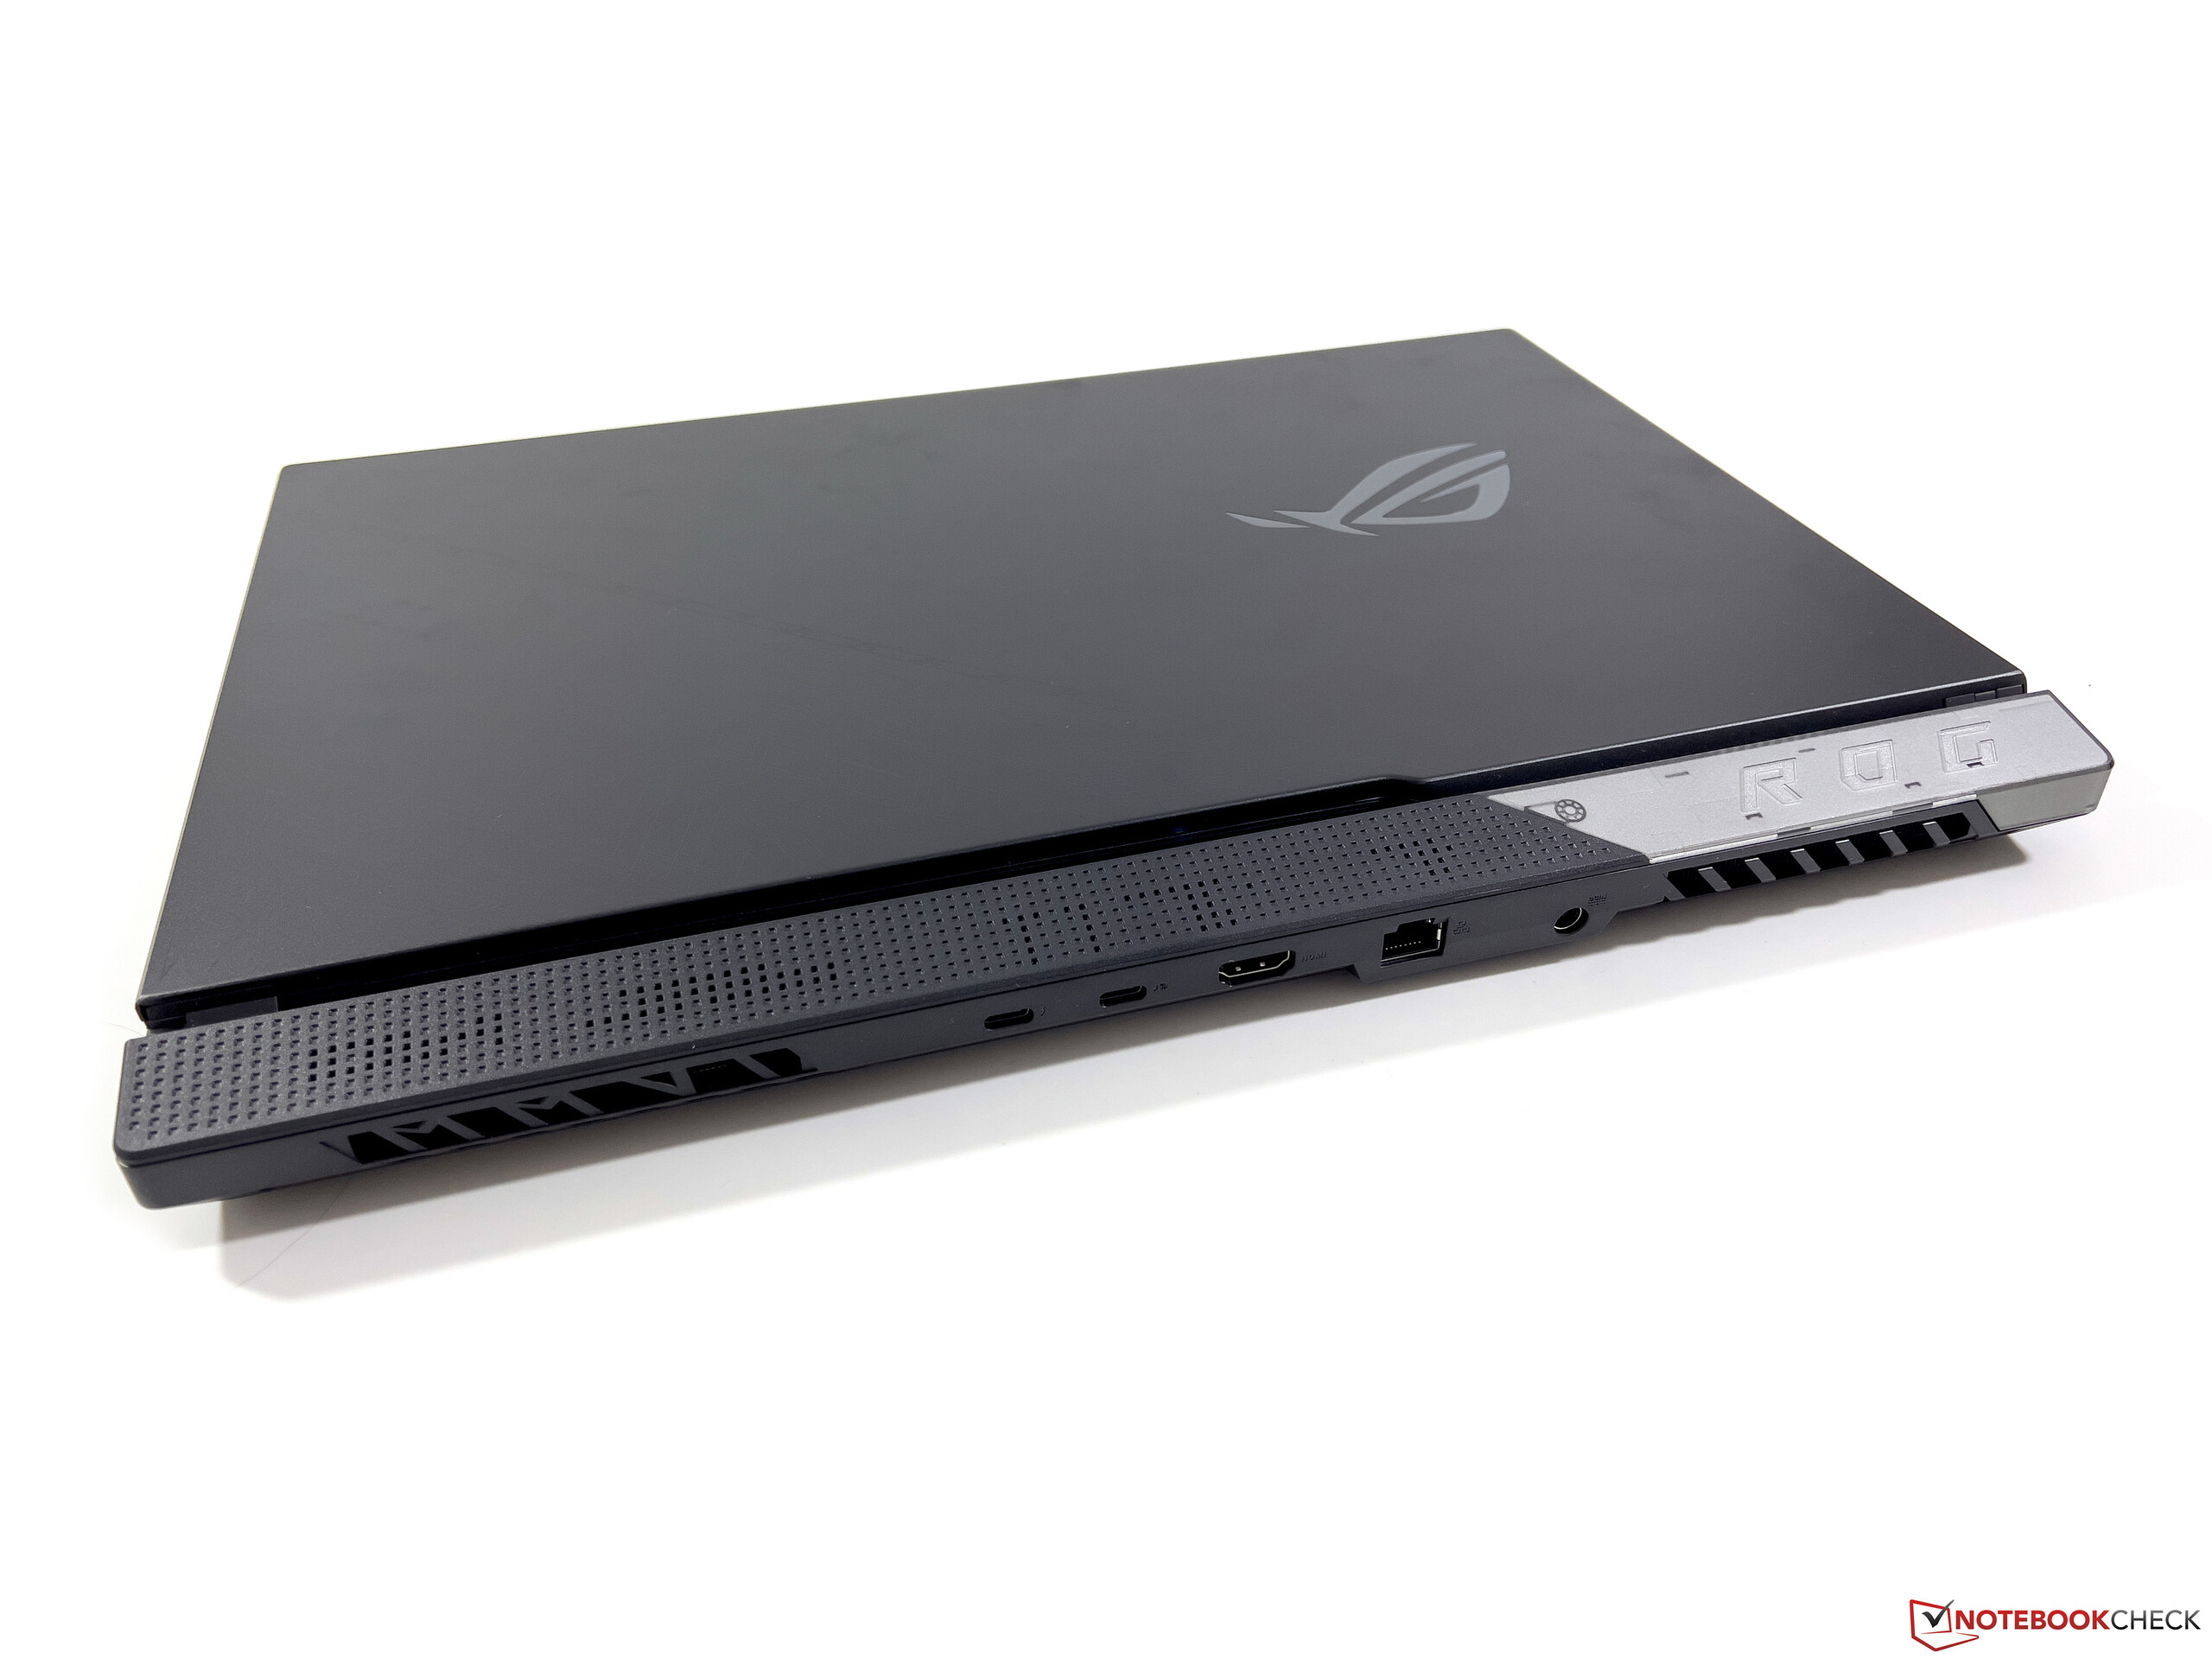
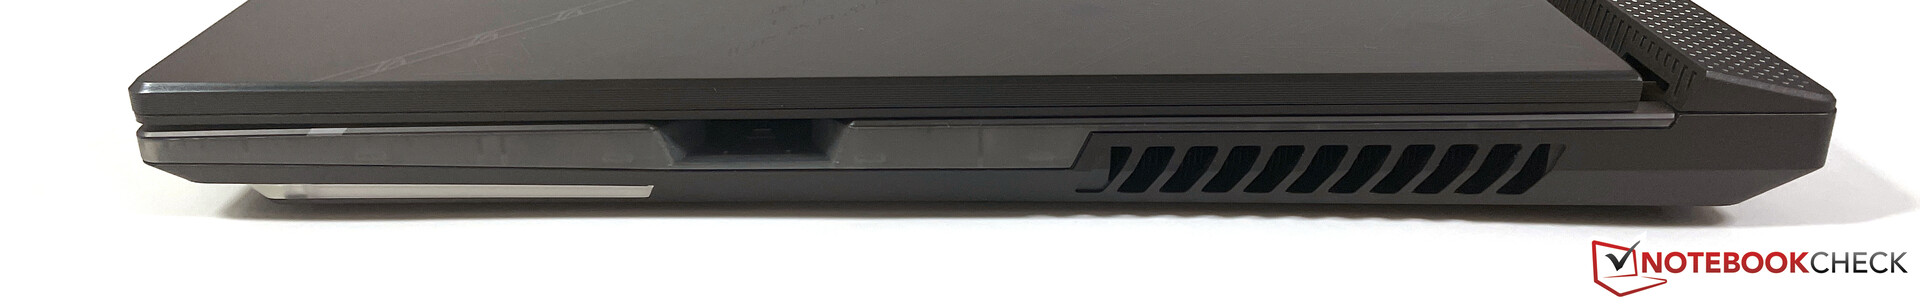
Equipment - ROG Strix Scar 17 with HDMI 2.1 & Wi-Fi 6E
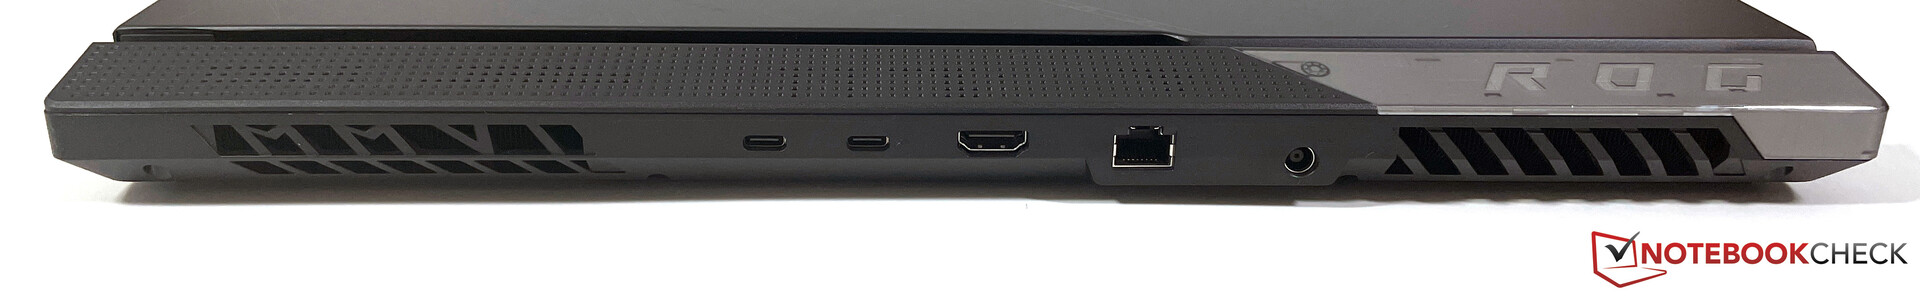
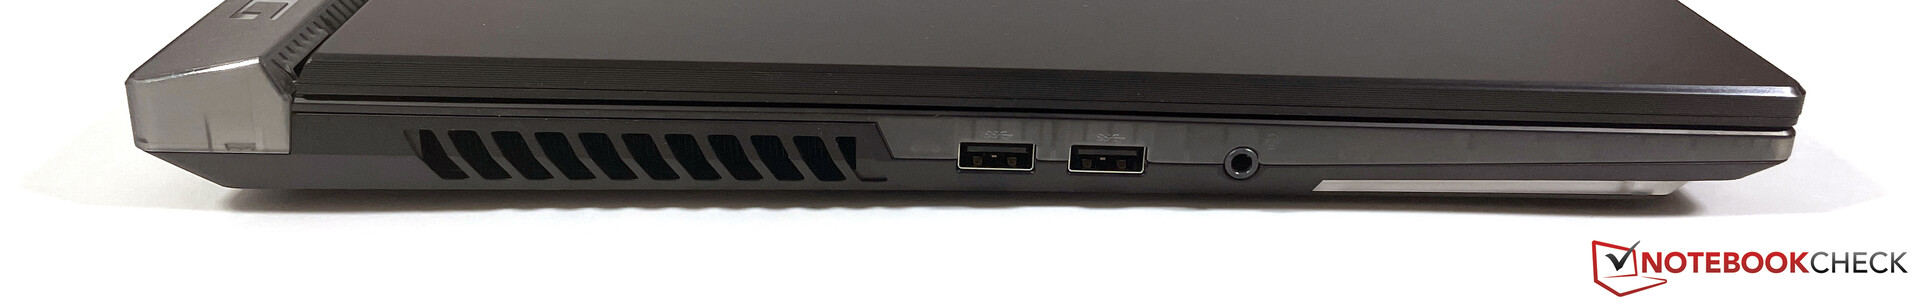
In addition to a Thunderbolt connection, the G733CX offers an HDMI 2.1 port, and the USB port on the back can also be used for charging on the road (max. 100 watts). Most of the connections are in the back, and you will only find two regular USB-A ports and the 3.5-mm audio port on the left side. The right side also offers a slot for Asus Keystone, allowing you to store the system settings and data.
The WLAN performance with Intel AX211 is very good, and we were also able to connect to the 6-GHz network of our Asus reference router without any trouble. There is also an Ethernet connection with 2.5 Gbit/s for wired connections. Users of the ROG Strix Scar 17 have to go without a webcam, but if necessary, the manufacturer offers a corresponding external webcam (ROG Eye S).
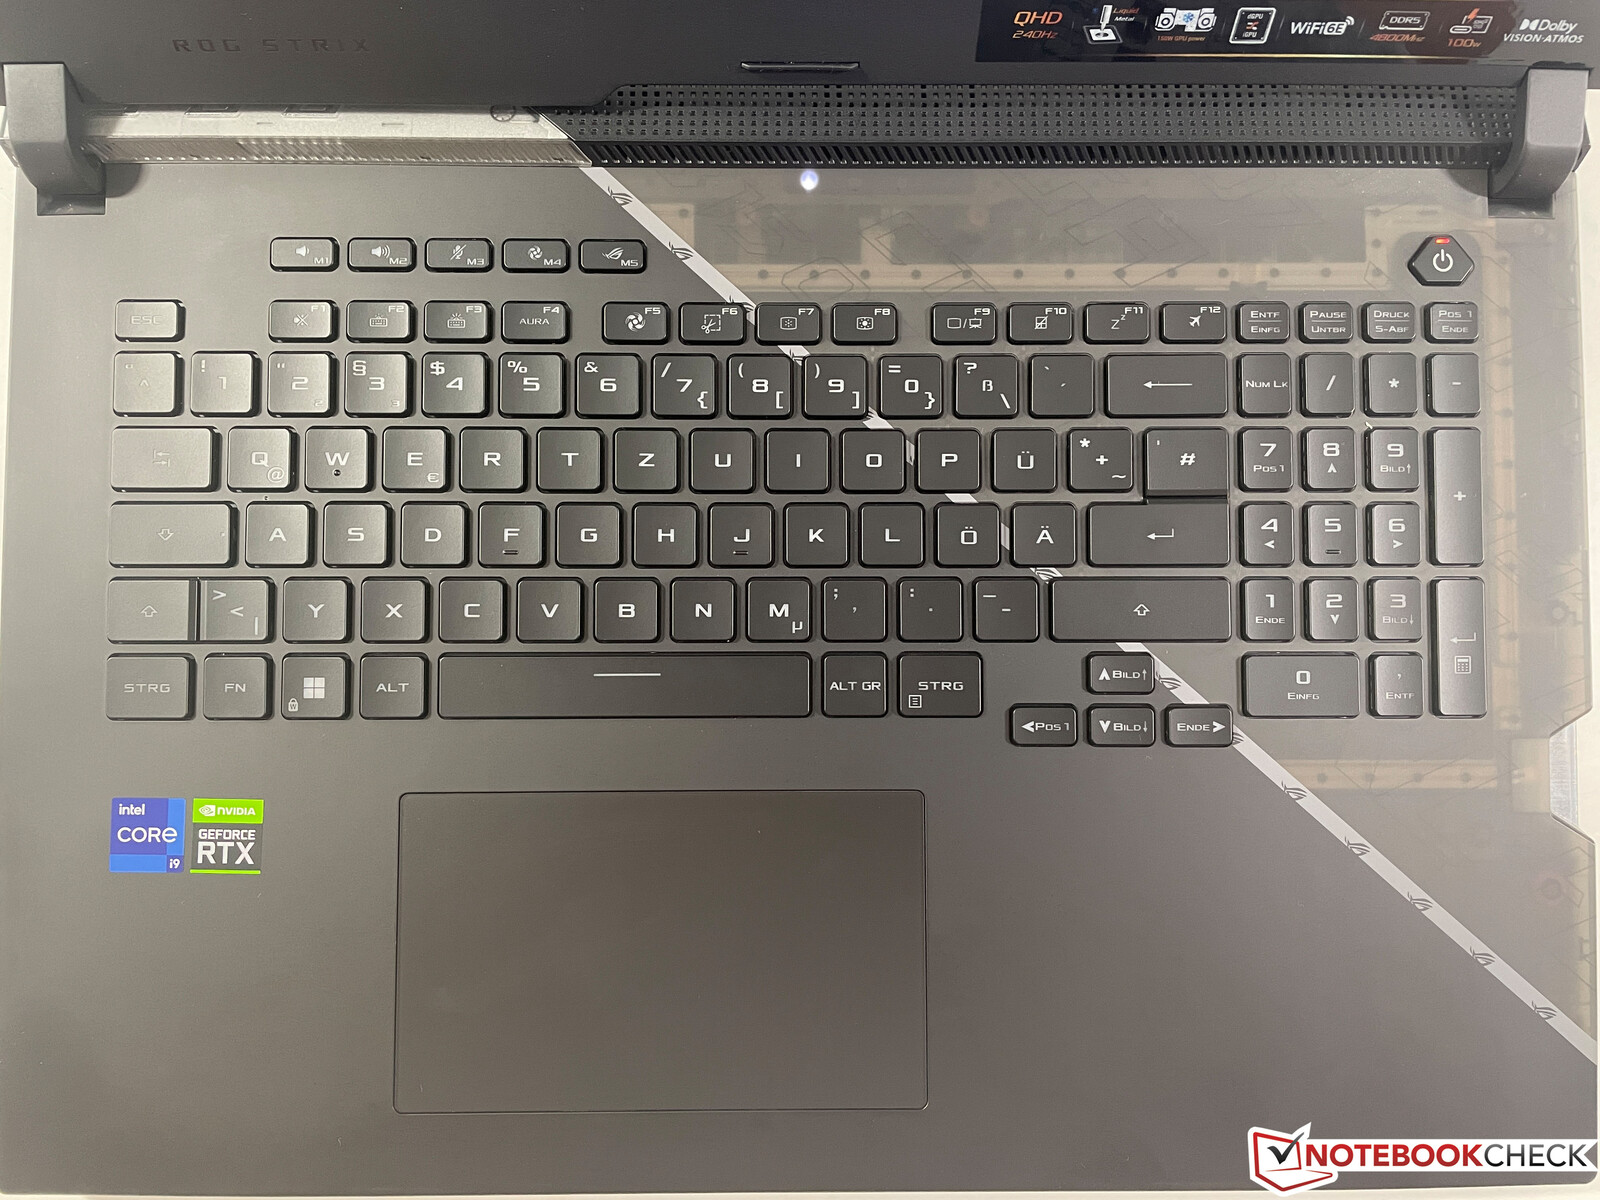
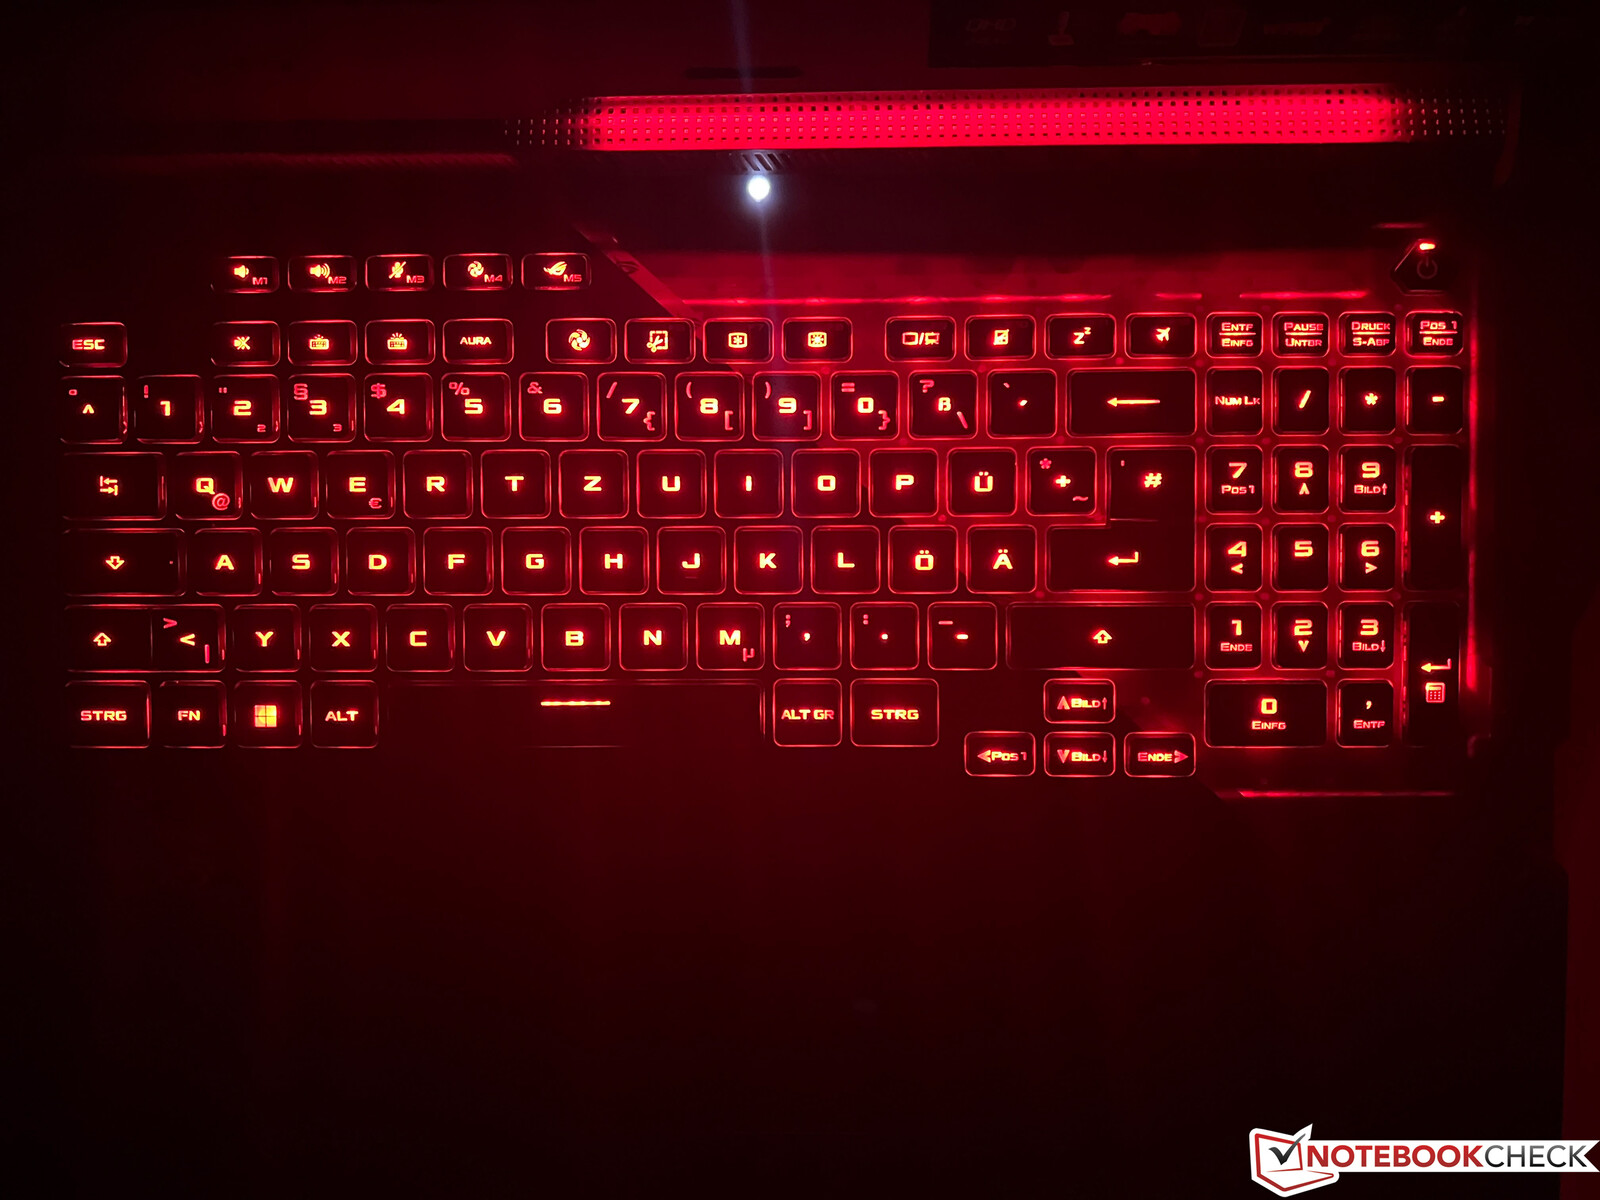
Input Devices - Asus with a good keyboard
Asus has changed the keyboard layout again, now using a more conventional layout with smaller special keys. There is also a "regular" number block again, which also means that the arrow keys have moved slightly to the left and are now smaller. Not all users would like this. However, the quality of the keyboard is very good with the long hub of 2 mm, and you can go wild on the illumination, which allows you to configure each key separately, including game specific modes via AuraSync technology. The large ClickPad offers good sliding characteristics and works reliably, but it is also fairly loud when you press it.
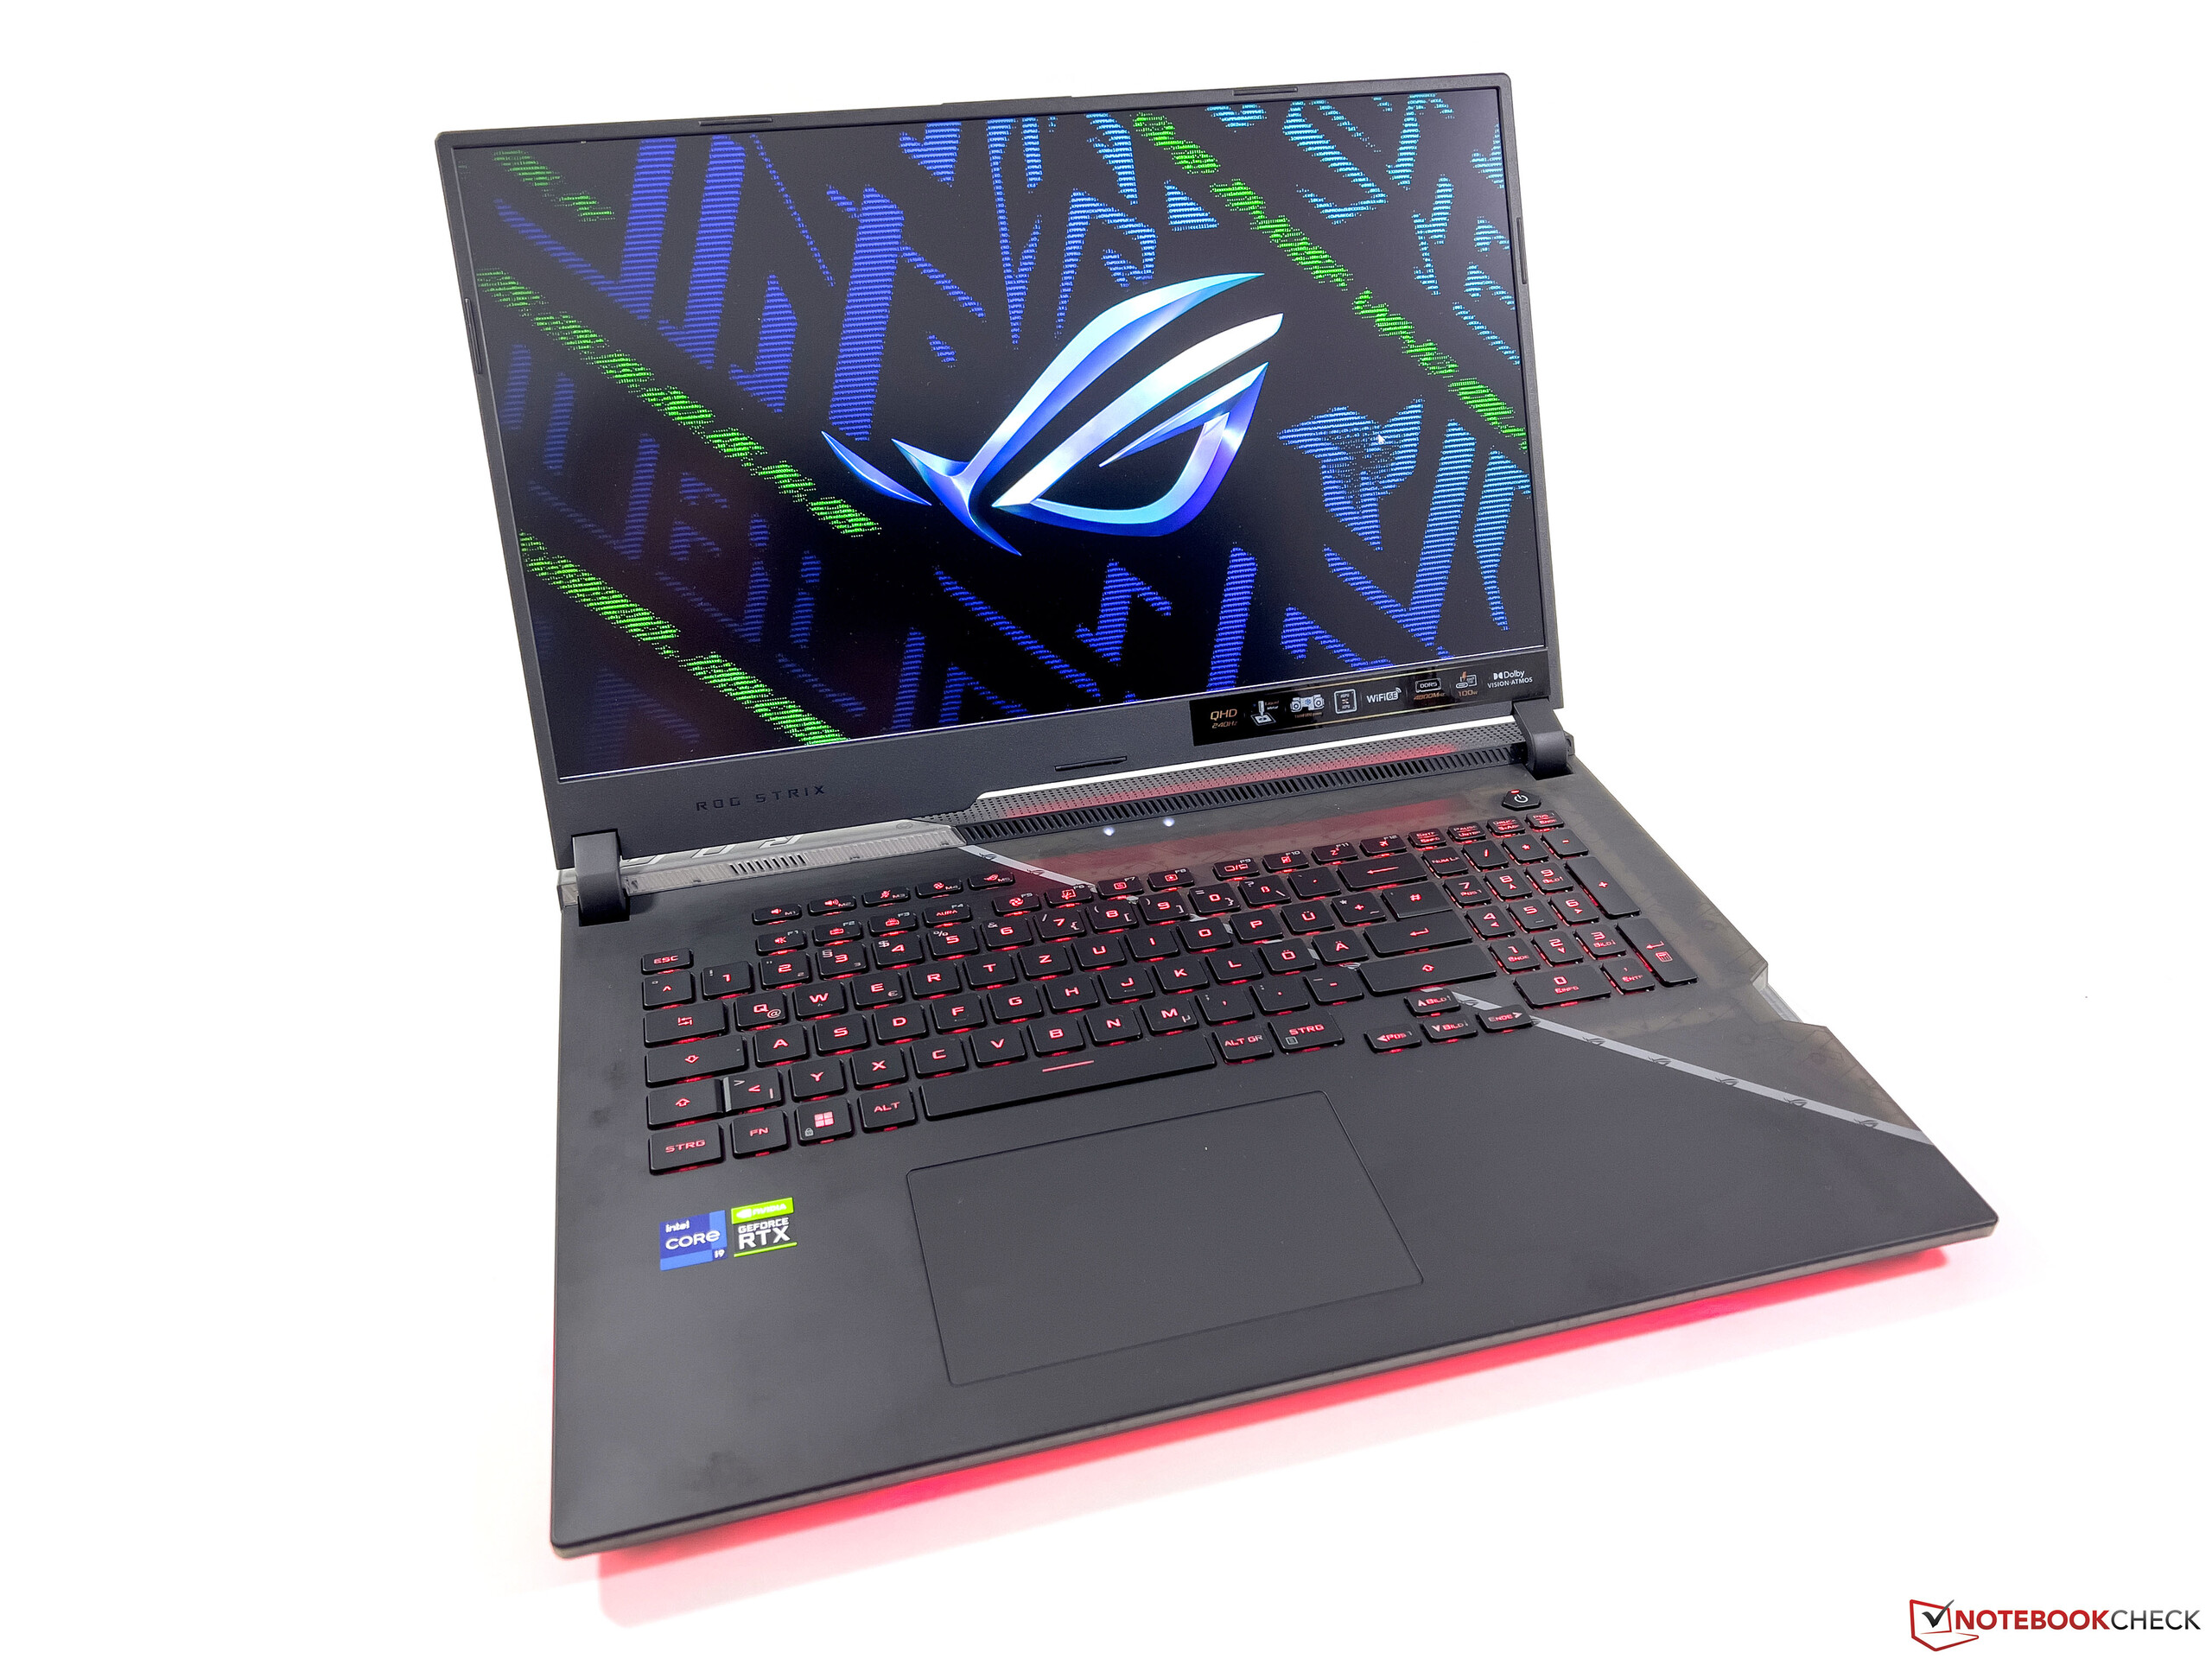
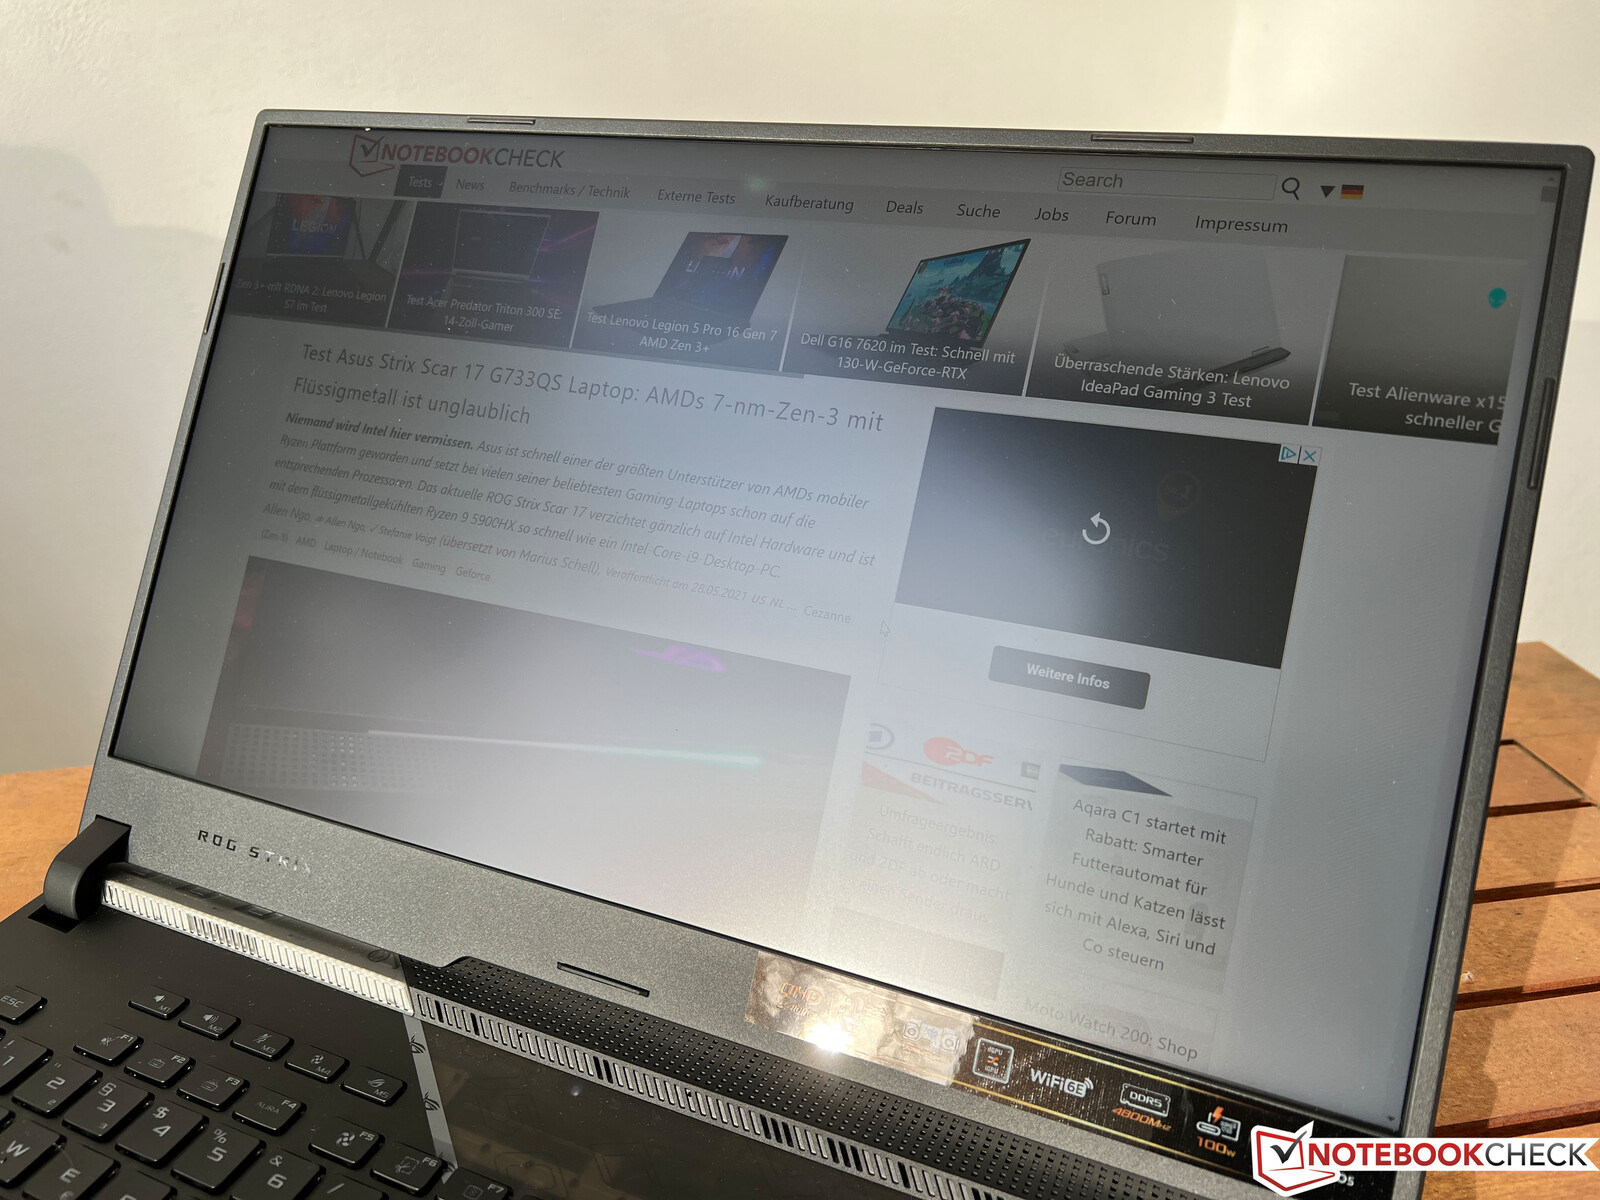
Display - QHD with 240 Hz
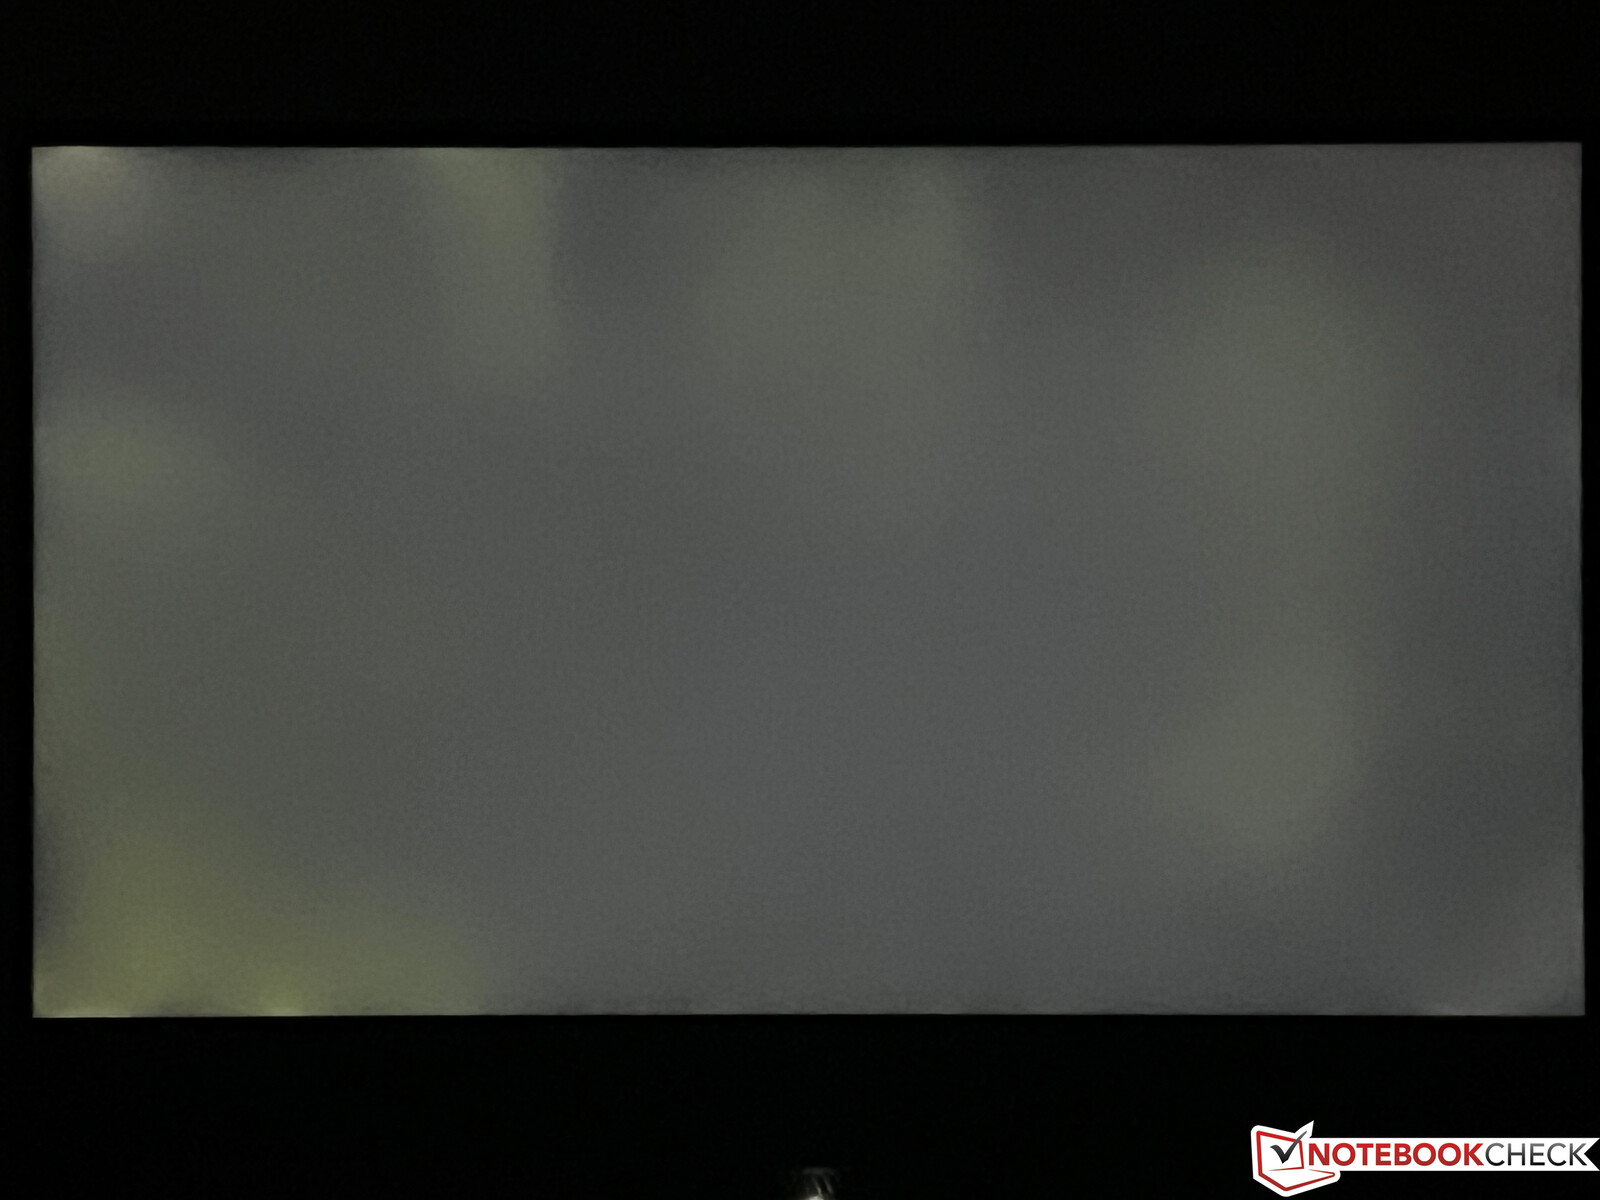
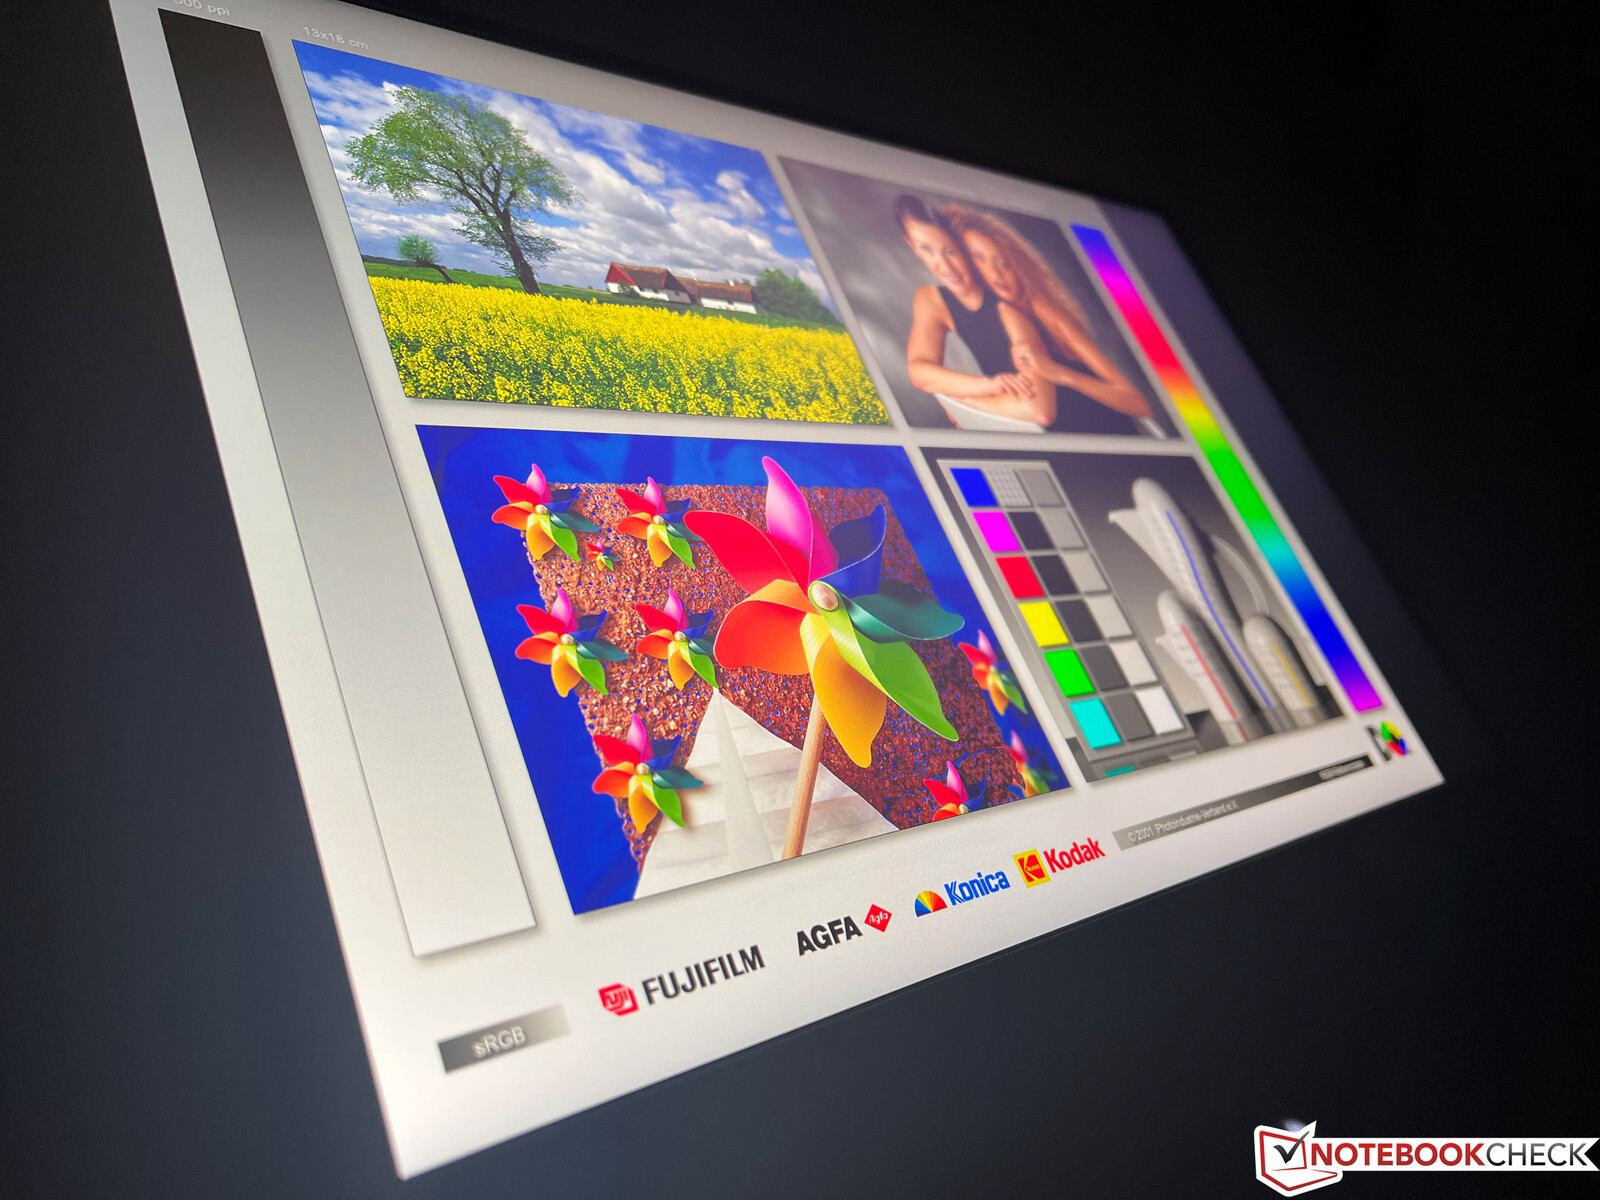
In addition to the Full-HD panel with 360 Hz that we tested in last year's Scar 17 G733QS, Asus also offers a QHD panel with a 240 Hz refresh rate, which is the panel in our test unit. The subjective image impression of the matte IPS panel (2560 x 1440 pixels, 16:9) is very good, and in addition to Dolby Vision HDR, Adaptive Sync is also supported. The response times are extremely fast, and PWM isn't used. The brightness is about 300 cd/m² on average, which is also the same level as the Full-HD panel with 360 Hz. On the other hand, the black value is a bit high, also resulting in a mediocre contrast ratio of around 1,000:1.
| |||||||||||||||||||||||||
Brightness Distribution: 87 %
Center on Battery: 320 cd/m²
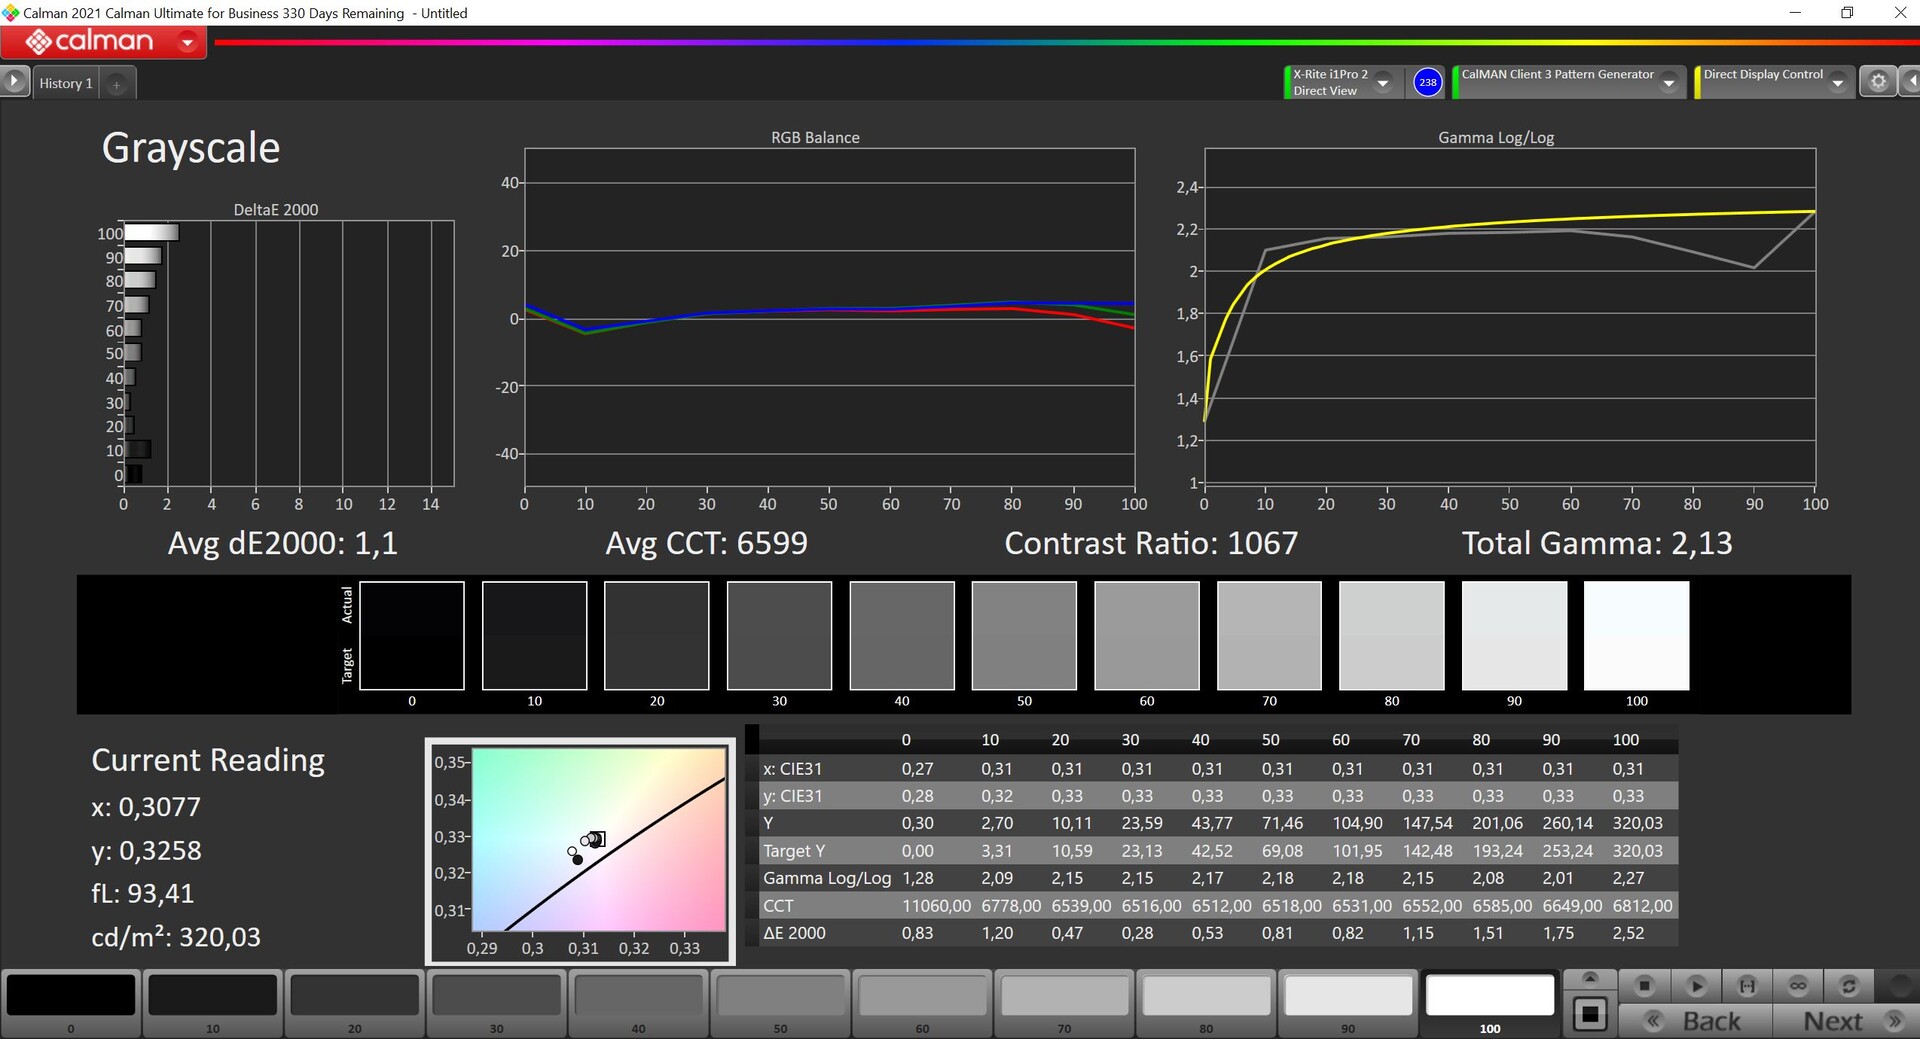
Contrast: 1067:1 (Black: 0.3 cd/m²)
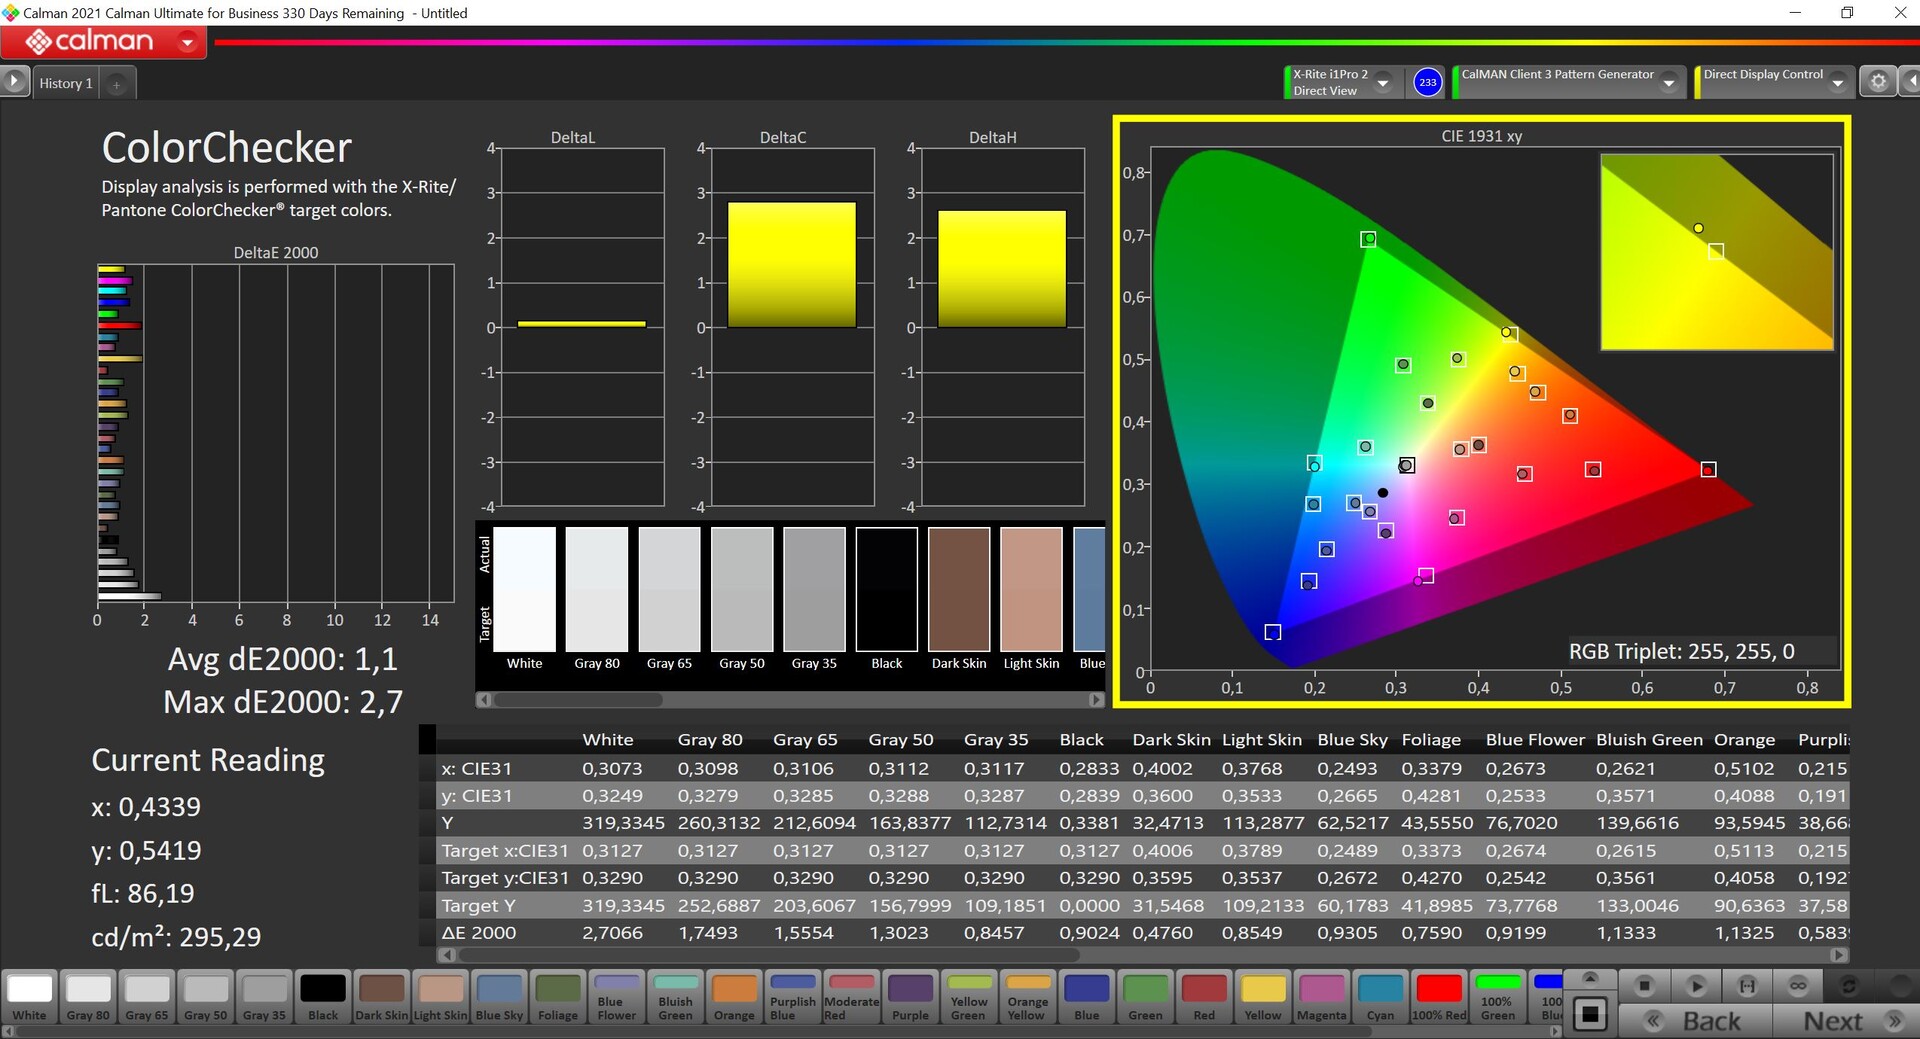
ΔE ColorChecker Calman: 1.1 | ∀{0.5-29.43 Ø4.73}
ΔE Greyscale Calman: 1.1 | ∀{0.09-98 Ø4.97}
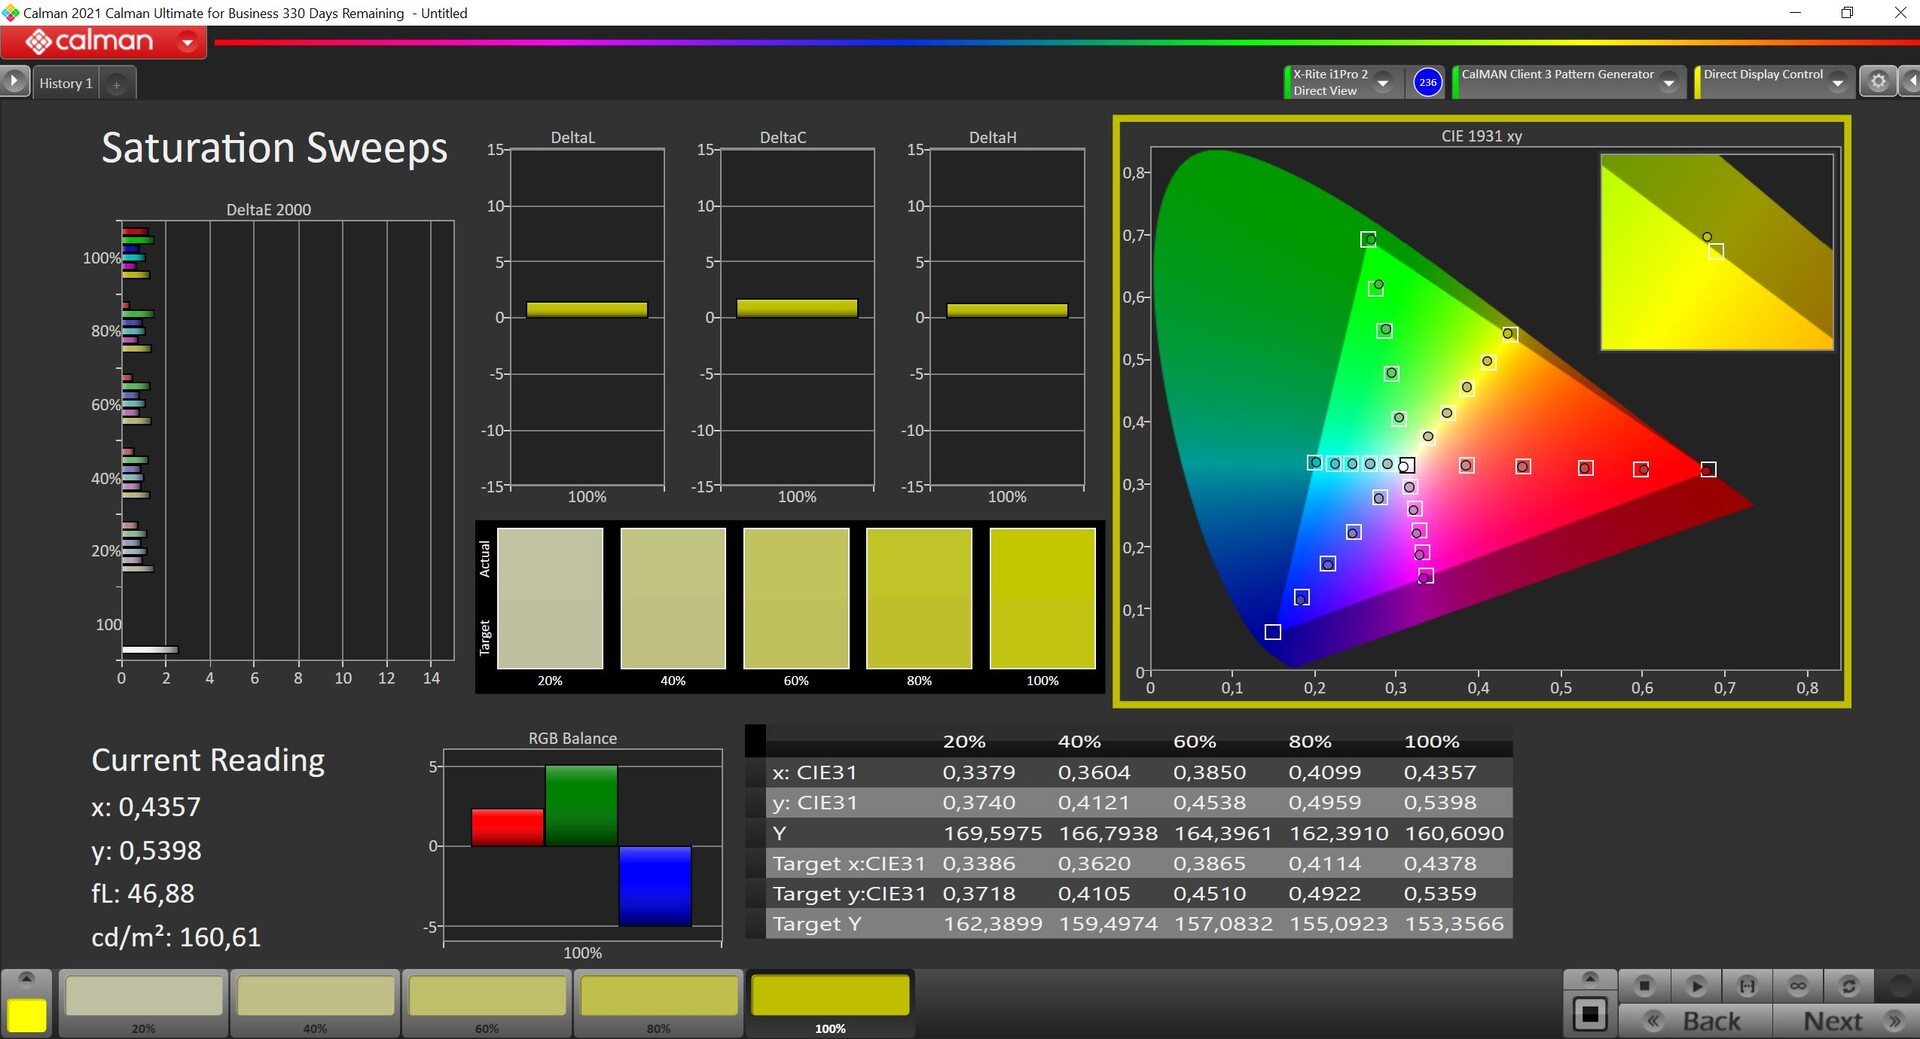
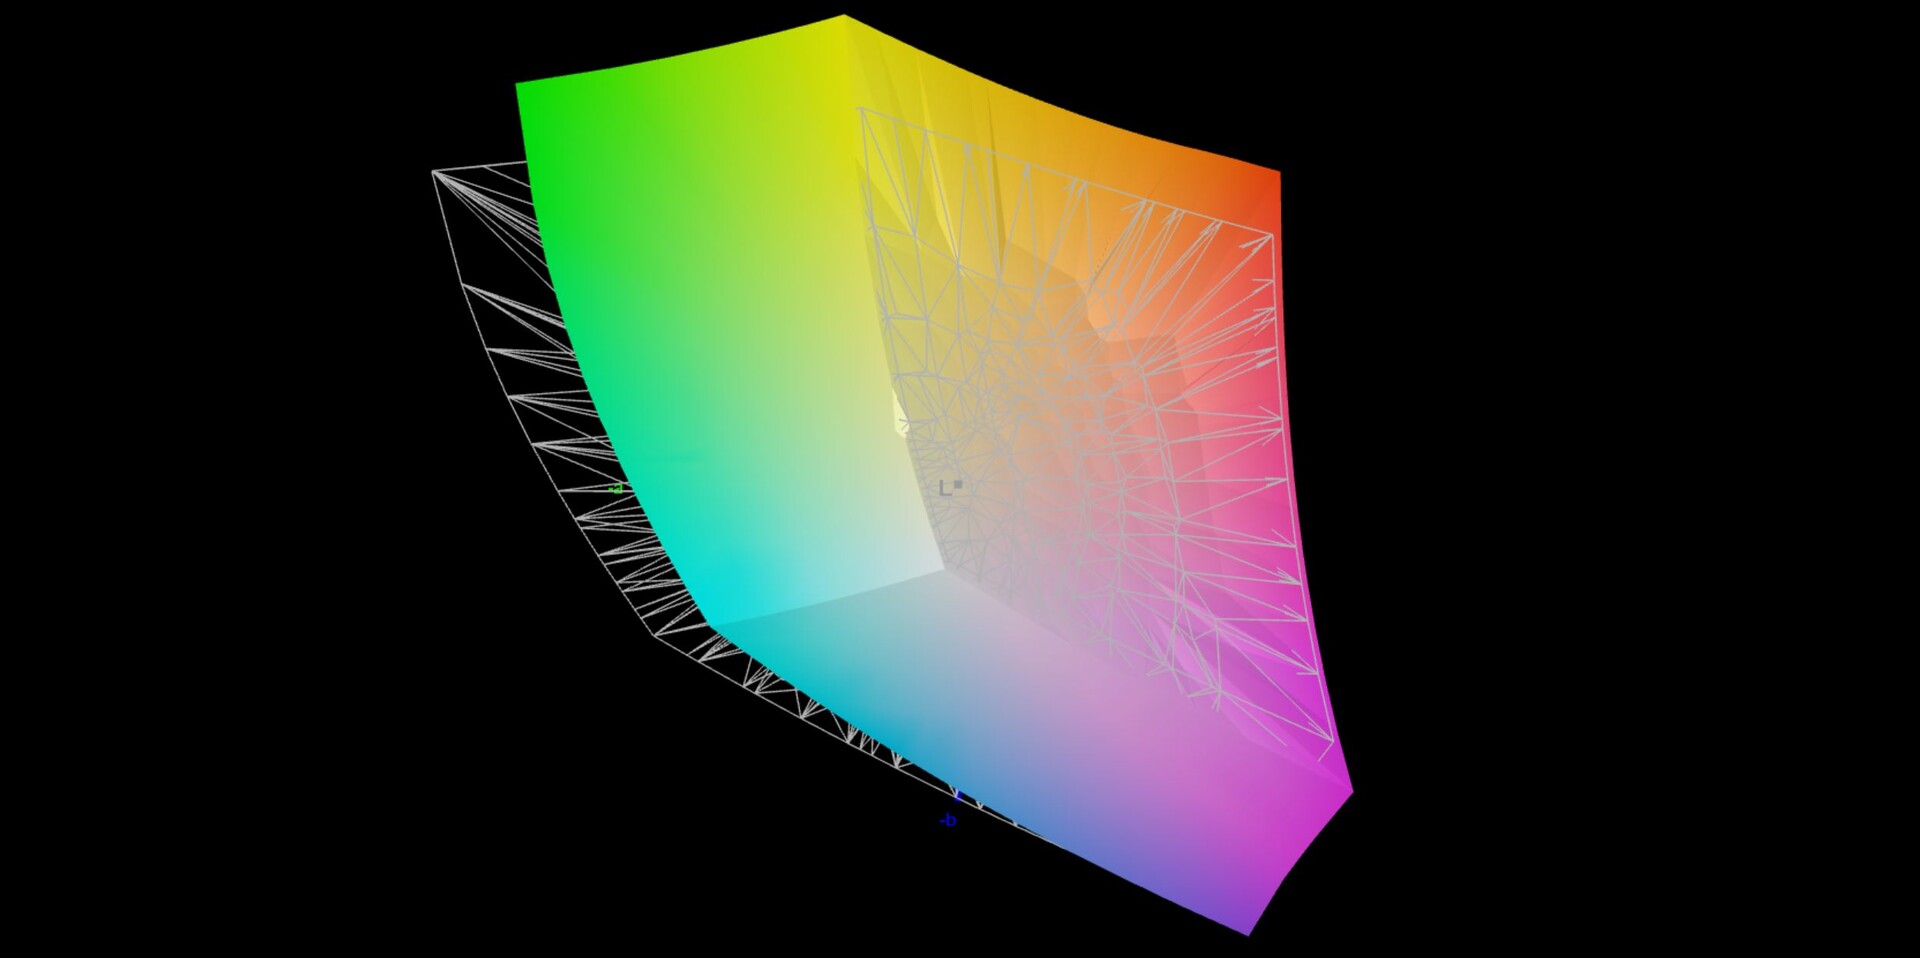
84.8% AdobeRGB 1998 (Argyll 3D)
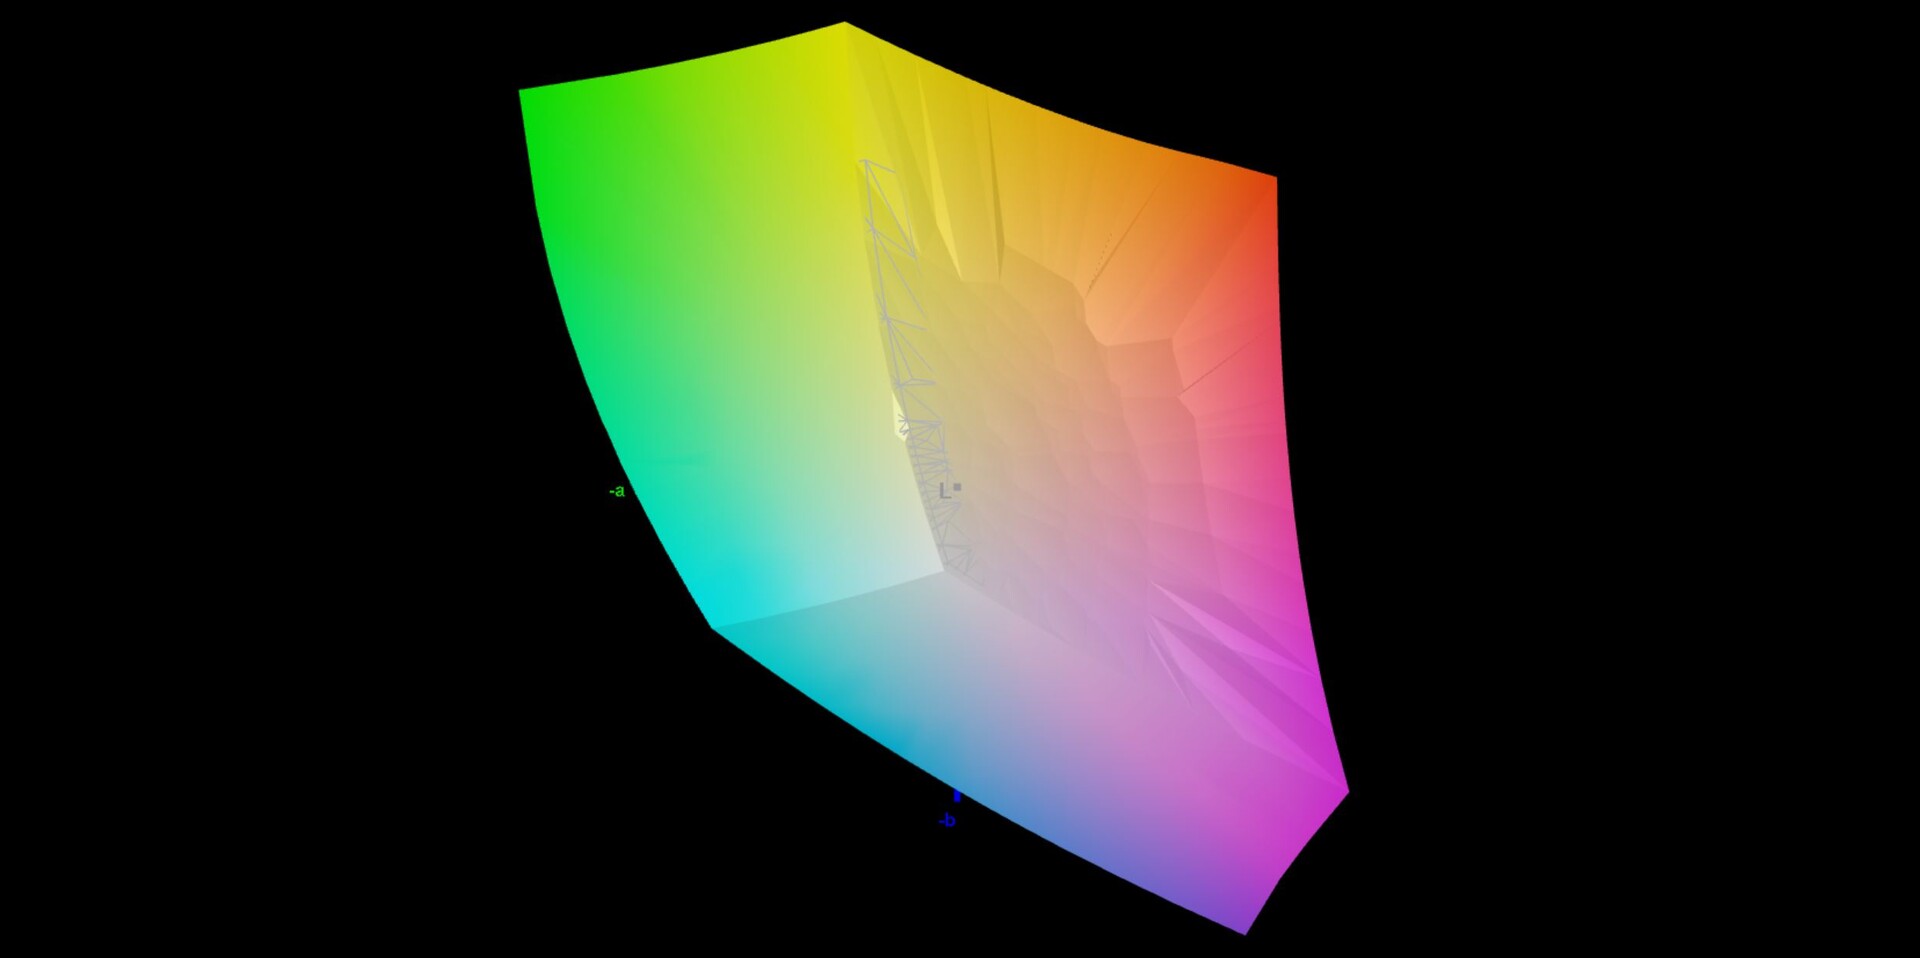
99.9% sRGB (Argyll 3D)
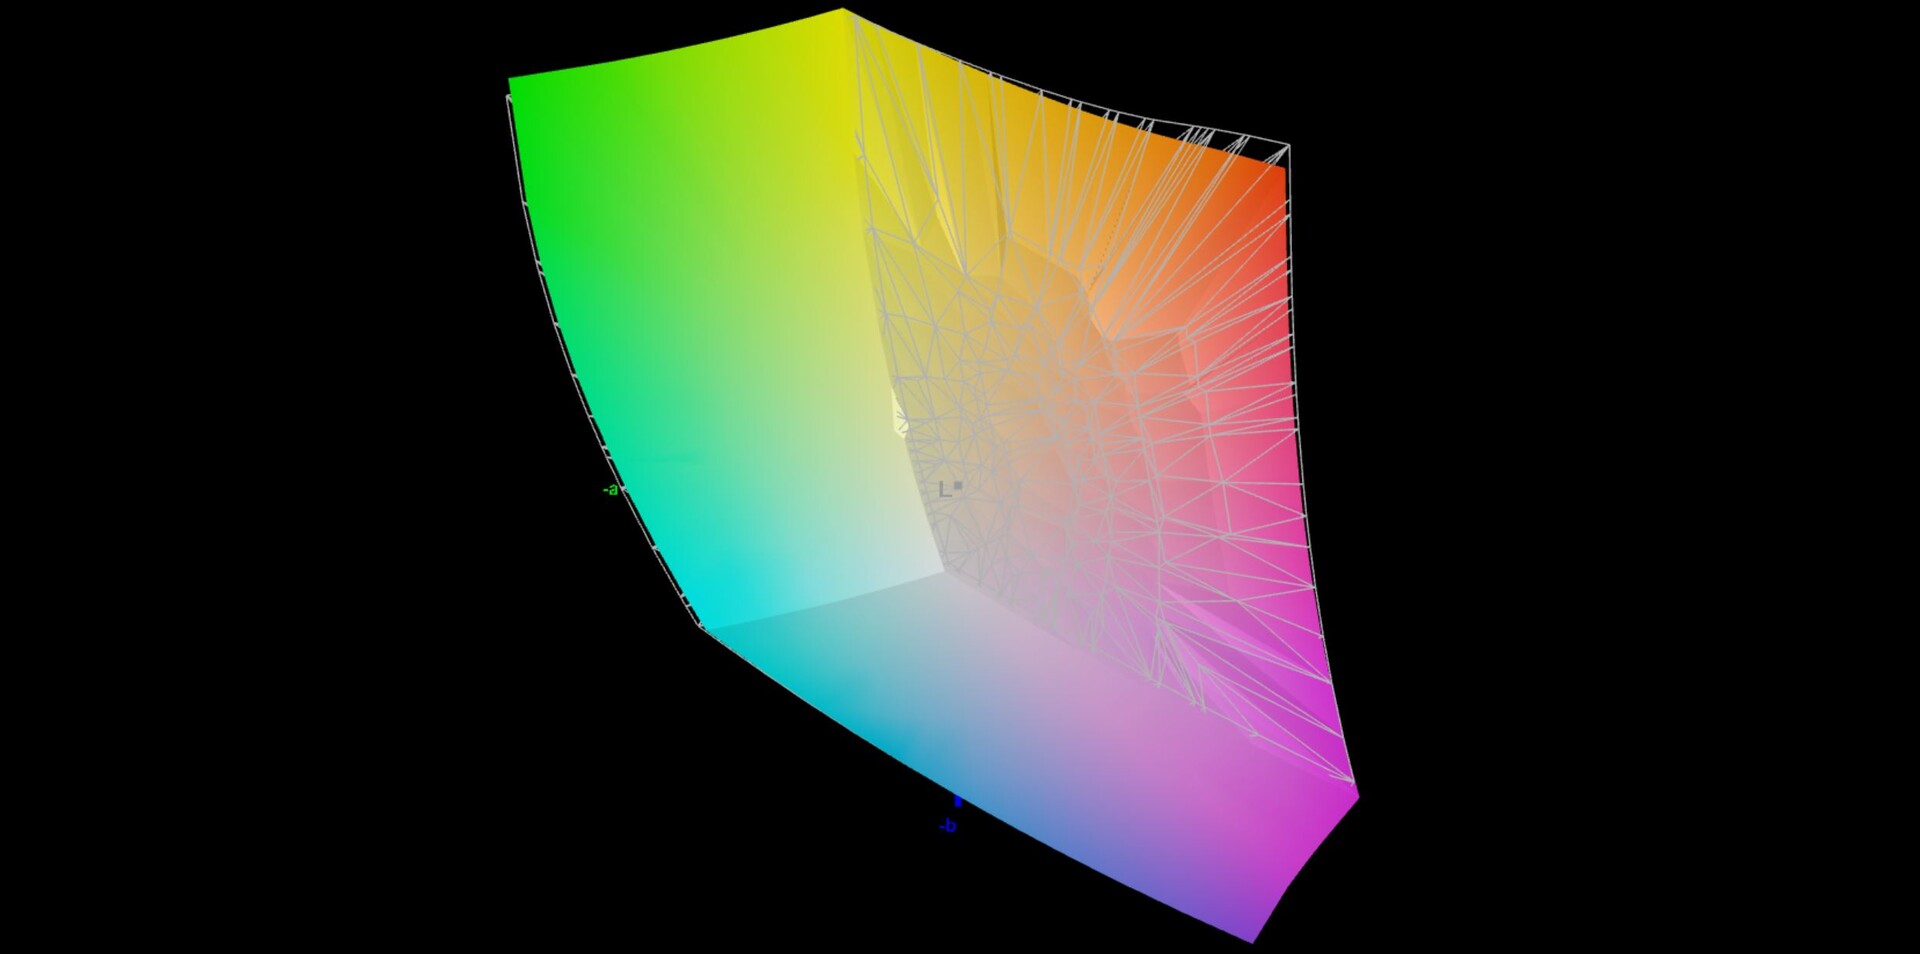
97.1% Display P3 (Argyll 3D)
Gamma: 2.13
CCT: 6599 K
| Asus ROG Strix Scar 17 SE G733CX-LL014W NE173QHM-NZ2, IPS, 2560x1440, 17.3" | Lenovo Legion 7 16IAX7-82TD004SGE NE160QDM-NY1, IPS, 2560x1600, 16" | MSI Titan GT77 12UHS Sharp SHP1544 LQ173M1JW08, IPS-Level, 1920x1080, 17.3" | Schenker XMG Neo 17 M22 BOE0A99, IPS, 2560x1600, 17" | Alienware x17 R2 P48E AU Optronics B173HAN, IPS, 1920x1080, 17.3" | Asus Strix Scar 17 G733QSA-XS99 AU Optronics B173HAN05.4, IPS, 1920x1080, 17.3" | |
|---|---|---|---|---|---|---|
| Display | -16% | -14% | -16% | -8% | -14% | |
| Display P3 Coverage (%) | 97.1 | 69.3 -29% | 70.8 -27% | 69 -29% | 79.2 -18% | 71 -27% |
| sRGB Coverage (%) | 99.9 | 98.2 -2% | 98.9 -1% | 99.8 0% | 99.8 0% | 99.4 -1% |
| AdobeRGB 1998 Coverage (%) | 84.8 | 70.8 -17% | 73 -14% | 69.6 -18% | 79.6 -6% | 72.2 -15% |
| Response Times | -38% | 48% | -25% | -55% | -12% | |
| Response Time Grey 50% / Grey 80% * (ms) | 5.7 ? | 12.6 ? -121% | 3.03 ? 47% | 10.8 ? -89% | 12.4 ? -118% | 6.6 ? -16% |
| Response Time Black / White * (ms) | 10.1 ? | 5.6 ? 45% | 5.28 ? 48% | 6.1 ? 40% | 9.2 ? 9% | 10.8 ? -7% |
| PWM Frequency (Hz) | ||||||
| Screen | -41% | -63% | -9% | -89% | -25% | |
| Brightness middle (cd/m²) | 320 | 547 71% | 280 -12% | 415 30% | 365.4 14% | 303.8 -5% |
| Brightness (cd/m²) | 303 | 523 73% | 275 -9% | 399 32% | 344 14% | 292 -4% |
| Brightness Distribution (%) | 87 | 88 1% | 79 -9% | 90 3% | 85 -2% | 85 -2% |
| Black Level * (cd/m²) | 0.3 | 0.44 -47% | 0.4 -33% | 0.43 -43% | 0.29 3% | 0.23 23% |
| Contrast (:1) | 1067 | 1243 16% | 700 -34% | 965 -10% | 1260 18% | 1321 24% |
| Colorchecker dE 2000 * | 1.1 | 2.1 -91% | 2.1 -91% | 1.44 -31% | 3.17 -188% | 1.87 -70% |
| Colorchecker dE 2000 max. * | 2.7 | 7 -159% | 5.83 -116% | 2.33 14% | 7.69 -185% | 3.26 -21% |
| Greyscale dE 2000 * | 1.1 | 3.2 -191% | 3.3 -200% | 1.8 -64% | 5.3 -382% | 2.7 -145% |
| Gamma | 2.13 103% | 2.23 99% | 2.13 103% | 2.132 103% | 2.18 101% | 2.26 97% |
| CCT | 6599 98% | 6979 93% | 7060 92% | 6327 103% | 5879 111% | 6436 101% |
| Colorchecker dE 2000 calibrated * | 0.9 | 1.58 | 0.89 | 0.51 | 1.45 | |
| Color Space (Percent of AdobeRGB 1998) (%) | 65.6 | |||||
| Color Space (Percent of sRGB) (%) | 99.4 | |||||
| Total Average (Program / Settings) | -32% /
-35% | -10% /
-35% | -17% /
-13% | -51% /
-65% | -17% /
-20% |
* ... smaller is better
The display covers the P3 color space, and our analysis with the professional CalMAN software shows that the screen is already very accurate in the state of delivery. There is also no color tint, and our own calibration didn't lead to any additional improvement, so we are not offering a profile for you here. This QHD panel is suited for image and video processing without any limitations.
Display Response Times
| ↔ Response Time Black to White | ||
|---|---|---|
| 10.1 ms ... rise ↗ and fall ↘ combined | ↗ 5 ms rise | 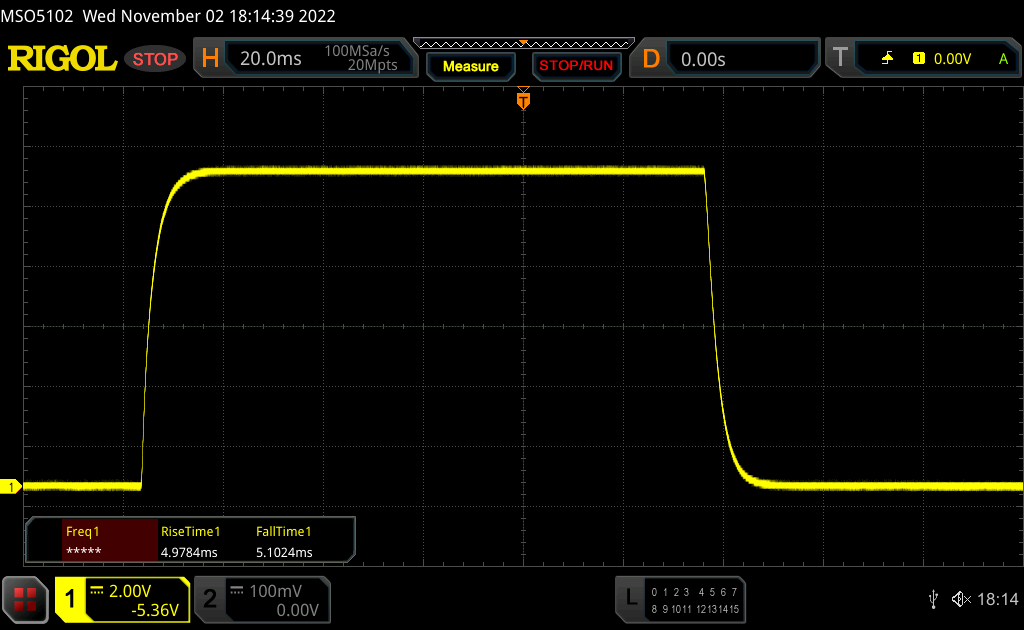 |
| ↘ 5.1 ms fall | ||
| The screen shows good response rates in our tests, but may be too slow for competitive gamers. In comparison, all tested devices range from 0.1 (minimum) to 240 (maximum) ms. » 28 % of all devices are better. This means that the measured response time is better than the average of all tested devices (19.9 ms). | ||
| ↔ Response Time 50% Grey to 80% Grey | ||
| 5.7 ms ... rise ↗ and fall ↘ combined | ↗ 2.7 ms rise | 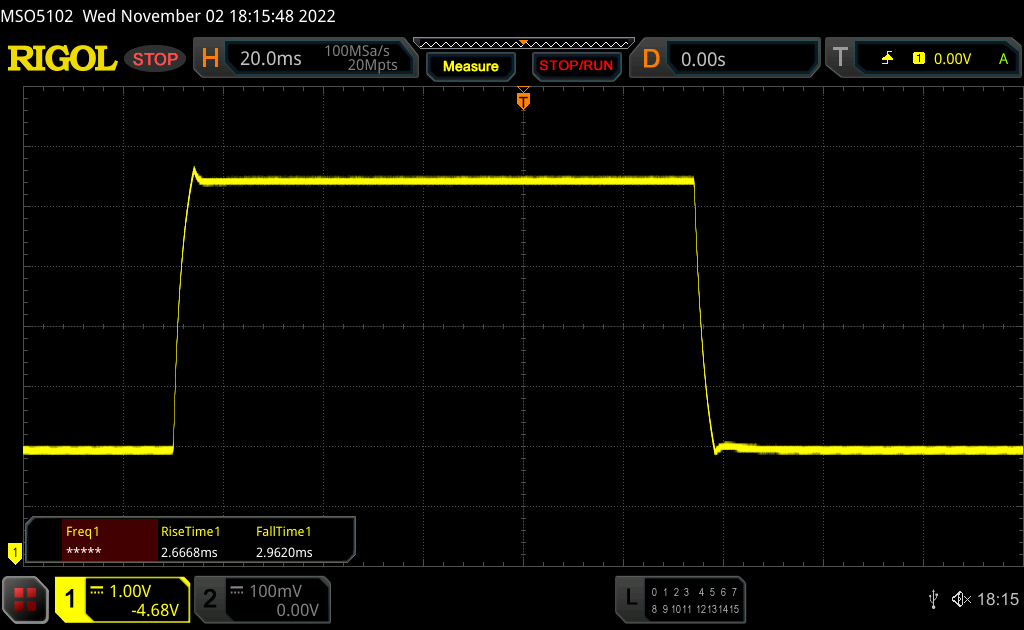 |
| ↘ 3 ms fall | ||
| The screen shows very fast response rates in our tests and should be very well suited for fast-paced gaming. In comparison, all tested devices range from 0.165 (minimum) to 636 (maximum) ms. » 18 % of all devices are better. This means that the measured response time is better than the average of all tested devices (31.1 ms). | ||
Screen Flickering / PWM (Pulse-Width Modulation)
| Screen flickering / PWM not detected | 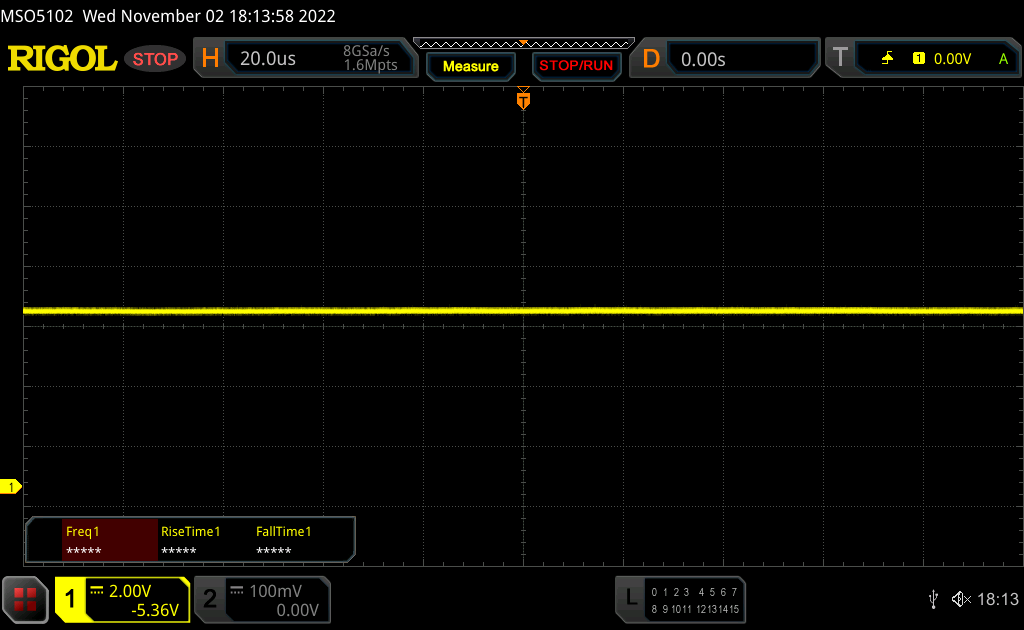 | ||
In comparison: 52 % of all tested devices do not use PWM to dim the display. If PWM was detected, an average of 7798 (minimum: 5 - maximum: 343500) Hz was measured. | |||
Performance - Intel HX with the brakes applied
Test Conditions
The ROG software offers extensive configuration options and power profiles. For example, you can completely deactivate the integrated GPU (MUX) or manually set the power values for the CPU and GPU. For our benchmarks and measurements below, we use the Performance profile, since this already makes the full GPU performance available. While the CPU performance is even slightly higher in Turbo mode, this doesn't justify the significantly higher fan noise in our opinion.
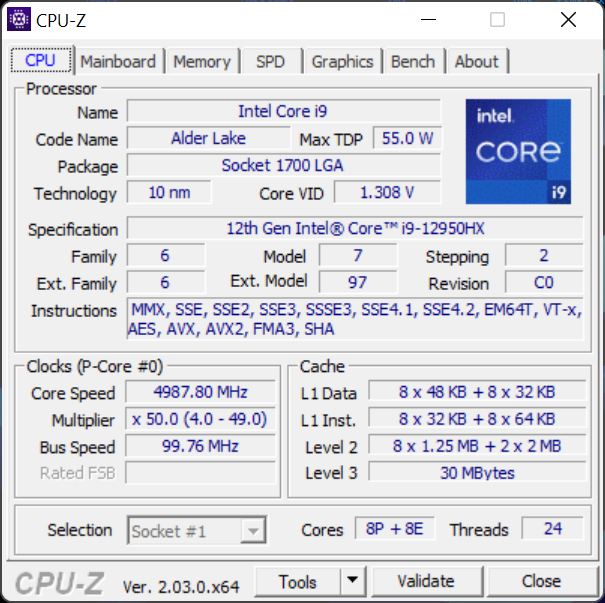
Processor - Core i9-12950HX
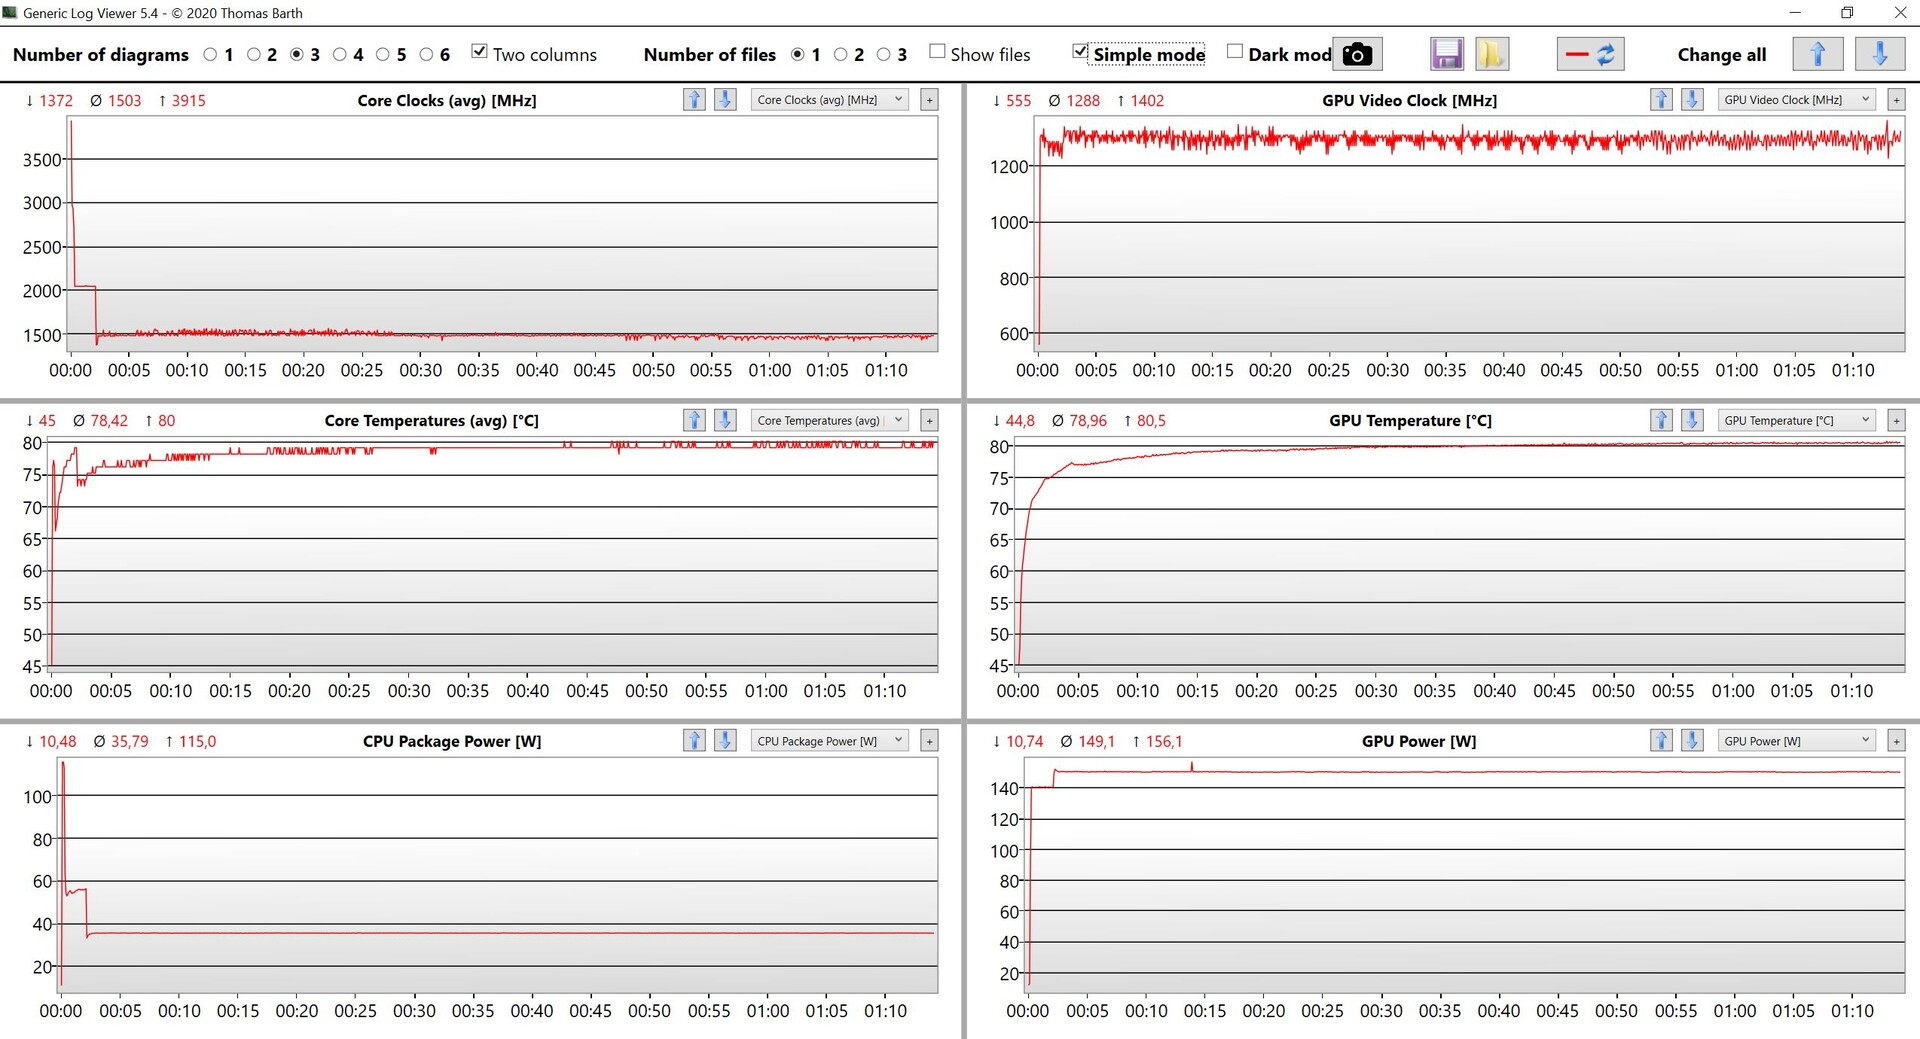
The Intel Core i9-12950HX is currently the fastest mobile processor from Intel. Even though it is able to consume up to 175 watts, it stays far from this value in our test unit. Instead, we see a maximum consumption of 115 watts (even in Turbo mode), and at some point the value levels out at 70 watts (105 watts in Turbo mode). While the CPU performance isn't bad at all, you could also get this with a regular Core i9, and the additional premium for the HX chip isn't worth the additional expense.
In battery operation, the power consumption is limited to 35 watts, leading to a multi-core performance that is reduced by about 40%. You can find additional CPU benchmarks in our corresponding technical section.
Cinebench R15 Multi Constant Load Test
Cinebench R23: Multi Core | Single Core
Cinebench R20: CPU (Multi Core) | CPU (Single Core)
Cinebench R15: CPU Multi 64Bit | CPU Single 64Bit
Blender: v2.79 BMW27 CPU
7-Zip 18.03: 7z b 4 | 7z b 4 -mmt1
Geekbench 5.5: Multi-Core | Single-Core
HWBOT x265 Benchmark v2.2: 4k Preset
LibreOffice : 20 Documents To PDF
R Benchmark 2.5: Overall mean
| CPU Performance rating | |
| Average of class Gaming | |
| Lenovo Legion 7 16IAX7-82TD004SGE | |
| MSI Titan GT77 12UHS | |
| Asus ROG Strix Scar 17 SE G733CX-LL014W | |
| Average Intel Core i9-12950HX | |
| Alienware x17 R2 P48E | |
| Schenker XMG Neo 17 M22 | |
| Asus Strix Scar 17 G733QSA-XS99 | |
| Cinebench R23 / Multi Core | |
| Average of class Gaming (10488 - 40970, n=112, last 2 years) | |
| MSI Titan GT77 12UHS | |
| Lenovo Legion 7 16IAX7-82TD004SGE | |
| Asus ROG Strix Scar 17 SE G733CX-LL014W | |
| Average Intel Core i9-12950HX (16277 - 23113, n=7) | |
| Alienware x17 R2 P48E | |
| Schenker XMG Neo 17 M22 | |
| Asus Strix Scar 17 G733QSA-XS99 | |
| Cinebench R23 / Single Core | |
| Average of class Gaming (1166 - 2356, n=112, last 2 years) | |
| Lenovo Legion 7 16IAX7-82TD004SGE | |
| MSI Titan GT77 12UHS | |
| Alienware x17 R2 P48E | |
| Asus ROG Strix Scar 17 SE G733CX-LL014W | |
| Average Intel Core i9-12950HX (1465 - 1922, n=7) | |
| Schenker XMG Neo 17 M22 | |
| Asus Strix Scar 17 G733QSA-XS99 | |
| Cinebench R20 / CPU (Multi Core) | |
| Average of class Gaming (4029 - 16108, n=111, last 2 years) | |
| MSI Titan GT77 12UHS | |
| Lenovo Legion 7 16IAX7-82TD004SGE | |
| Average Intel Core i9-12950HX (6625 - 8777, n=7) | |
| Asus ROG Strix Scar 17 SE G733CX-LL014W | |
| Alienware x17 R2 P48E | |
| Schenker XMG Neo 17 M22 | |
| Asus Strix Scar 17 G733QSA-XS99 | |
| Cinebench R20 / CPU (Single Core) | |
| Average of class Gaming (442 - 895, n=111, last 2 years) | |
| Lenovo Legion 7 16IAX7-82TD004SGE | |
| Asus ROG Strix Scar 17 SE G733CX-LL014W | |
| MSI Titan GT77 12UHS | |
| Alienware x17 R2 P48E | |
| Average Intel Core i9-12950HX (703 - 741, n=7) | |
| Schenker XMG Neo 17 M22 | |
| Asus Strix Scar 17 G733QSA-XS99 | |
| Cinebench R15 / CPU Multi 64Bit | |
| Average of class Gaming (1578 - 6271, n=111, last 2 years) | |
| MSI Titan GT77 12UHS | |
| Lenovo Legion 7 16IAX7-82TD004SGE | |
| Asus ROG Strix Scar 17 SE G733CX-LL014W | |
| Average Intel Core i9-12950HX (2464 - 3530, n=7) | |
| Alienware x17 R2 P48E | |
| Schenker XMG Neo 17 M22 | |
| Asus Strix Scar 17 G733QSA-XS99 | |
| Cinebench R15 / CPU Single 64Bit | |
| Average of class Gaming (188.8 - 343, n=111, last 2 years) | |
| Lenovo Legion 7 16IAX7-82TD004SGE | |
| MSI Titan GT77 12UHS | |
| Asus ROG Strix Scar 17 SE G733CX-LL014W | |
| Alienware x17 R2 P48E | |
| Average Intel Core i9-12950HX (167 - 276, n=7) | |
| Schenker XMG Neo 17 M22 | |
| Asus Strix Scar 17 G733QSA-XS99 | |
| Blender / v2.79 BMW27 CPU | |
| Asus Strix Scar 17 G733QSA-XS99 | |
| Schenker XMG Neo 17 M22 | |
| Asus ROG Strix Scar 17 SE G733CX-LL014W | |
| Alienware x17 R2 P48E | |
| Average Intel Core i9-12950HX (138 - 193, n=7) | |
| Average of class Gaming (80 - 330, n=109, last 2 years) | |
| Lenovo Legion 7 16IAX7-82TD004SGE | |
| MSI Titan GT77 12UHS | |
| 7-Zip 18.03 / 7z b 4 | |
| Average of class Gaming (33491 - 148086, n=110, last 2 years) | |
| Lenovo Legion 7 16IAX7-82TD004SGE | |
| MSI Titan GT77 12UHS | |
| Average Intel Core i9-12950HX (65637 - 85019, n=7) | |
| Asus ROG Strix Scar 17 SE G733CX-LL014W | |
| Alienware x17 R2 P48E | |
| Schenker XMG Neo 17 M22 | |
| Asus Strix Scar 17 G733QSA-XS99 | |
| 7-Zip 18.03 / 7z b 4 -mmt1 | |
| Average of class Gaming (4199 - 7436, n=110, last 2 years) | |
| Lenovo Legion 7 16IAX7-82TD004SGE | |
| MSI Titan GT77 12UHS | |
| Asus ROG Strix Scar 17 SE G733CX-LL014W | |
| Average Intel Core i9-12950HX (6022 - 6318, n=7) | |
| Schenker XMG Neo 17 M22 | |
| Alienware x17 R2 P48E | |
| Asus Strix Scar 17 G733QSA-XS99 | |
| Geekbench 5.5 / Multi-Core | |
| Average of class Gaming (6460 - 27010, n=110, last 2 years) | |
| Lenovo Legion 7 16IAX7-82TD004SGE | |
| MSI Titan GT77 12UHS | |
| Asus ROG Strix Scar 17 SE G733CX-LL014W | |
| Average Intel Core i9-12950HX (14028 - 16009, n=7) | |
| Alienware x17 R2 P48E | |
| Schenker XMG Neo 17 M22 | |
| Asus Strix Scar 17 G733QSA-XS99 | |
| Geekbench 5.5 / Single-Core | |
| Average of class Gaming (986 - 2474, n=110, last 2 years) | |
| MSI Titan GT77 12UHS | |
| Average Intel Core i9-12950HX (1847 - 1945, n=7) | |
| Alienware x17 R2 P48E | |
| Lenovo Legion 7 16IAX7-82TD004SGE | |
| Asus ROG Strix Scar 17 SE G733CX-LL014W | |
| Schenker XMG Neo 17 M22 | |
| Asus Strix Scar 17 G733QSA-XS99 | |
| HWBOT x265 Benchmark v2.2 / 4k Preset | |
| Average of class Gaming (11.5 - 44.3, n=110, last 2 years) | |
| MSI Titan GT77 12UHS | |
| Lenovo Legion 7 16IAX7-82TD004SGE | |
| Asus ROG Strix Scar 17 SE G733CX-LL014W | |
| Average Intel Core i9-12950HX (18.6 - 26.5, n=7) | |
| Alienware x17 R2 P48E | |
| Schenker XMG Neo 17 M22 | |
| Asus Strix Scar 17 G733QSA-XS99 | |
| LibreOffice / 20 Documents To PDF | |
| Schenker XMG Neo 17 M22 | |
| Average of class Gaming (19 - 88.8, n=110, last 2 years) | |
| Asus Strix Scar 17 G733QSA-XS99 | |
| Alienware x17 R2 P48E | |
| Average Intel Core i9-12950HX (34.7 - 45.4, n=7) | |
| MSI Titan GT77 12UHS | |
| Asus ROG Strix Scar 17 SE G733CX-LL014W | |
| Lenovo Legion 7 16IAX7-82TD004SGE | |
| R Benchmark 2.5 / Overall mean | |
| Asus Strix Scar 17 G733QSA-XS99 | |
| Schenker XMG Neo 17 M22 | |
| Average Intel Core i9-12950HX (0.4251 - 0.4515, n=7) | |
| Alienware x17 R2 P48E | |
| Average of class Gaming (0.3439 - 0.759, n=111, last 2 years) | |
| Asus ROG Strix Scar 17 SE G733CX-LL014W | |
| Lenovo Legion 7 16IAX7-82TD004SGE | |
| MSI Titan GT77 12UHS | |
* ... smaller is better
AIDA64: FP32 Ray-Trace | FPU Julia | CPU SHA3 | CPU Queen | FPU SinJulia | FPU Mandel | CPU AES | CPU ZLib | FP64 Ray-Trace | CPU PhotoWorxx
| Performance rating | |
| Average of class Gaming | |
| MSI Titan GT77 12UHS | |
| Asus ROG Strix Scar 17 SE G733CX-LL014W | |
| Average Intel Core i9-12950HX | |
| Schenker XMG Neo 17 M22 | |
| Asus Strix Scar 17 G733QSA-XS99 | |
| Lenovo Legion 7 16IAX7-82TD004SGE | |
| Alienware x17 R2 P48E | |
| AIDA64 / FP32 Ray-Trace | |
| Average of class Gaming (10227 - 85542, n=109, last 2 years) | |
| MSI Titan GT77 12UHS | |
| Average Intel Core i9-12950HX (15499 - 22868, n=7) | |
| Asus ROG Strix Scar 17 SE G733CX-LL014W | |
| Schenker XMG Neo 17 M22 | |
| Asus Strix Scar 17 G733QSA-XS99 | |
| Lenovo Legion 7 16IAX7-82TD004SGE | |
| Alienware x17 R2 P48E | |
| AIDA64 / FPU Julia | |
| Average of class Gaming (51376 - 238426, n=109, last 2 years) | |
| MSI Titan GT77 12UHS | |
| Asus Strix Scar 17 G733QSA-XS99 | |
| Schenker XMG Neo 17 M22 | |
| Average Intel Core i9-12950HX (77846 - 115907, n=7) | |
| Asus ROG Strix Scar 17 SE G733CX-LL014W | |
| Lenovo Legion 7 16IAX7-82TD004SGE | |
| Alienware x17 R2 P48E | |
| AIDA64 / CPU SHA3 | |
| Average of class Gaming (2180 - 9817, n=109, last 2 years) | |
| MSI Titan GT77 12UHS | |
| Lenovo Legion 7 16IAX7-82TD004SGE | |
| Asus ROG Strix Scar 17 SE G733CX-LL014W | |
| Average Intel Core i9-12950HX (3426 - 5069, n=7) | |
| Alienware x17 R2 P48E | |
| Asus Strix Scar 17 G733QSA-XS99 | |
| Schenker XMG Neo 17 M22 | |
| AIDA64 / CPU Queen | |
| Average of class Gaming (49785 - 173351, n=100, last 2 years) | |
| Alienware x17 R2 P48E | |
| Asus ROG Strix Scar 17 SE G733CX-LL014W | |
| Average Intel Core i9-12950HX (102752 - 104726, n=7) | |
| Asus Strix Scar 17 G733QSA-XS99 | |
| MSI Titan GT77 12UHS | |
| Schenker XMG Neo 17 M22 | |
| Lenovo Legion 7 16IAX7-82TD004SGE | |
| AIDA64 / FPU SinJulia | |
| Average of class Gaming (4424 - 33636, n=109, last 2 years) | |
| Lenovo Legion 7 16IAX7-82TD004SGE | |
| MSI Titan GT77 12UHS | |
| Schenker XMG Neo 17 M22 | |
| Asus Strix Scar 17 G733QSA-XS99 | |
| Average Intel Core i9-12950HX (10134 - 12823, n=7) | |
| Asus ROG Strix Scar 17 SE G733CX-LL014W | |
| Alienware x17 R2 P48E | |
| AIDA64 / FPU Mandel | |
| Average of class Gaming (25115 - 128721, n=109, last 2 years) | |
| Asus Strix Scar 17 G733QSA-XS99 | |
| Schenker XMG Neo 17 M22 | |
| MSI Titan GT77 12UHS | |
| Average Intel Core i9-12950HX (37146 - 57340, n=7) | |
| Asus ROG Strix Scar 17 SE G733CX-LL014W | |
| Lenovo Legion 7 16IAX7-82TD004SGE | |
| Alienware x17 R2 P48E | |
| AIDA64 / CPU AES | |
| MSI Titan GT77 12UHS | |
| Asus ROG Strix Scar 17 SE G733CX-LL014W | |
| Schenker XMG Neo 17 M22 | |
| Asus Strix Scar 17 G733QSA-XS99 | |
| Lenovo Legion 7 16IAX7-82TD004SGE | |
| Average Intel Core i9-12950HX (72599 - 181128, n=7) | |
| Alienware x17 R2 P48E | |
| Average of class Gaming (39258 - 247074, n=109, last 2 years) | |
| AIDA64 / CPU ZLib | |
| Average of class Gaming (574 - 2531, n=109, last 2 years) | |
| Lenovo Legion 7 16IAX7-82TD004SGE | |
| MSI Titan GT77 12UHS | |
| Asus ROG Strix Scar 17 SE G733CX-LL014W | |
| Alienware x17 R2 P48E | |
| Average Intel Core i9-12950HX (996 - 1417, n=7) | |
| Asus Strix Scar 17 G733QSA-XS99 | |
| Schenker XMG Neo 17 M22 | |
| AIDA64 / FP64 Ray-Trace | |
| Average of class Gaming (5509 - 45446, n=109, last 2 years) | |
| MSI Titan GT77 12UHS | |
| Average Intel Core i9-12950HX (8455 - 12432, n=7) | |
| Asus ROG Strix Scar 17 SE G733CX-LL014W | |
| Asus Strix Scar 17 G733QSA-XS99 | |
| Schenker XMG Neo 17 M22 | |
| Lenovo Legion 7 16IAX7-82TD004SGE | |
| Alienware x17 R2 P48E | |
| AIDA64 / CPU PhotoWorxx | |
| Average of class Gaming (12271 - 89891, n=109, last 2 years) | |
| Asus ROG Strix Scar 17 SE G733CX-LL014W | |
| MSI Titan GT77 12UHS | |
| Average Intel Core i9-12950HX (35479 - 42655, n=7) | |
| Lenovo Legion 7 16IAX7-82TD004SGE | |
| Alienware x17 R2 P48E | |
| Schenker XMG Neo 17 M22 | |
| Asus Strix Scar 17 G733QSA-XS99 | |
System Performance
The subjective performance impression is excellent, which is also confirmed by the good benchmark results. We do not notice any problems at all during the tests.
CrossMark: Overall | Productivity | Creativity | Responsiveness
| PCMark 10 / Score | |
| Lenovo Legion 7 16IAX7-82TD004SGE | |
| Average of class Gaming (5828 - 11574, n=95, last 2 years) | |
| MSI Titan GT77 12UHS | |
| Alienware x17 R2 P48E | |
| Asus ROG Strix Scar 17 SE G733CX-LL014W | |
| Average Intel Core i9-12950HX, NVIDIA GeForce RTX 3080 Ti Laptop GPU (n=1) | |
| Asus Strix Scar 17 G733QSA-XS99 | |
| Schenker XMG Neo 17 M22 | |
| PCMark 10 / Essentials | |
| Alienware x17 R2 P48E | |
| Lenovo Legion 7 16IAX7-82TD004SGE | |
| MSI Titan GT77 12UHS | |
| Average of class Gaming (8810 - 12600, n=99, last 2 years) | |
| Asus Strix Scar 17 G733QSA-XS99 | |
| Asus ROG Strix Scar 17 SE G733CX-LL014W | |
| Average Intel Core i9-12950HX, NVIDIA GeForce RTX 3080 Ti Laptop GPU (n=1) | |
| Schenker XMG Neo 17 M22 | |
| PCMark 10 / Productivity | |
| Lenovo Legion 7 16IAX7-82TD004SGE | |
| Average of class Gaming (6845 - 18766, n=97, last 2 years) | |
| MSI Titan GT77 12UHS | |
| Alienware x17 R2 P48E | |
| Asus ROG Strix Scar 17 SE G733CX-LL014W | |
| Average Intel Core i9-12950HX, NVIDIA GeForce RTX 3080 Ti Laptop GPU (n=1) | |
| Asus Strix Scar 17 G733QSA-XS99 | |
| Schenker XMG Neo 17 M22 | |
| PCMark 10 / Digital Content Creation | |
| Lenovo Legion 7 16IAX7-82TD004SGE | |
| Average of class Gaming (7602 - 19657, n=97, last 2 years) | |
| MSI Titan GT77 12UHS | |
| Alienware x17 R2 P48E | |
| Asus ROG Strix Scar 17 SE G733CX-LL014W | |
| Average Intel Core i9-12950HX, NVIDIA GeForce RTX 3080 Ti Laptop GPU (n=1) | |
| Asus Strix Scar 17 G733QSA-XS99 | |
| Schenker XMG Neo 17 M22 | |
| CrossMark / Overall | |
| Lenovo Legion 7 16IAX7-82TD004SGE | |
| Asus ROG Strix Scar 17 SE G733CX-LL014W | |
| Average Intel Core i9-12950HX, NVIDIA GeForce RTX 3080 Ti Laptop GPU (n=1) | |
| MSI Titan GT77 12UHS | |
| Average of class Gaming (1366 - 2409, n=97, last 2 years) | |
| Alienware x17 R2 P48E | |
| Schenker XMG Neo 17 M22 | |
| CrossMark / Productivity | |
| Lenovo Legion 7 16IAX7-82TD004SGE | |
| MSI Titan GT77 12UHS | |
| Asus ROG Strix Scar 17 SE G733CX-LL014W | |
| Average Intel Core i9-12950HX, NVIDIA GeForce RTX 3080 Ti Laptop GPU (n=1) | |
| Average of class Gaming (1386 - 2254, n=97, last 2 years) | |
| Alienware x17 R2 P48E | |
| Schenker XMG Neo 17 M22 | |
| CrossMark / Creativity | |
| Asus ROG Strix Scar 17 SE G733CX-LL014W | |
| Average Intel Core i9-12950HX, NVIDIA GeForce RTX 3080 Ti Laptop GPU (n=1) | |
| Lenovo Legion 7 16IAX7-82TD004SGE | |
| MSI Titan GT77 12UHS | |
| Average of class Gaming (1343 - 2729, n=97, last 2 years) | |
| Alienware x17 R2 P48E | |
| Schenker XMG Neo 17 M22 | |
| CrossMark / Responsiveness | |
| Lenovo Legion 7 16IAX7-82TD004SGE | |
| MSI Titan GT77 12UHS | |
| Asus ROG Strix Scar 17 SE G733CX-LL014W | |
| Average Intel Core i9-12950HX, NVIDIA GeForce RTX 3080 Ti Laptop GPU (n=1) | |
| Average of class Gaming (1226 - 2334, n=97, last 2 years) | |
| Alienware x17 R2 P48E | |
| Schenker XMG Neo 17 M22 | |
| PCMark 10 Score | 7208 points | |
Help | ||
| AIDA64 / Memory Copy | |
| Average of class Gaming (21750 - 129946, n=109, last 2 years) | |
| MSI Titan GT77 12UHS | |
| Lenovo Legion 7 16IAX7-82TD004SGE | |
| Asus ROG Strix Scar 17 SE G733CX-LL014W | |
| Average Intel Core i9-12950HX (59731 - 64732, n=7) | |
| Alienware x17 R2 P48E | |
| Schenker XMG Neo 17 M22 | |
| Asus Strix Scar 17 G733QSA-XS99 | |
| AIDA64 / Memory Read | |
| Average of class Gaming (22956 - 118858, n=109, last 2 years) | |
| Lenovo Legion 7 16IAX7-82TD004SGE | |
| Asus ROG Strix Scar 17 SE G733CX-LL014W | |
| Average Intel Core i9-12950HX (59744 - 70359, n=7) | |
| MSI Titan GT77 12UHS | |
| Alienware x17 R2 P48E | |
| Schenker XMG Neo 17 M22 | |
| Asus Strix Scar 17 G733QSA-XS99 | |
| AIDA64 / Memory Write | |
| Average of class Gaming (22297 - 135096, n=109, last 2 years) | |
| Asus ROG Strix Scar 17 SE G733CX-LL014W | |
| Lenovo Legion 7 16IAX7-82TD004SGE | |
| Average Intel Core i9-12950HX (57750 - 67899, n=7) | |
| MSI Titan GT77 12UHS | |
| Schenker XMG Neo 17 M22 | |
| Alienware x17 R2 P48E | |
| Asus Strix Scar 17 G733QSA-XS99 | |
| AIDA64 / Memory Latency | |
| Average of class Gaming (75.3 - 259, n=109, last 2 years) | |
| Alienware x17 R2 P48E | |
| Schenker XMG Neo 17 M22 | |
| MSI Titan GT77 12UHS | |
| Average Intel Core i9-12950HX (84.5 - 92.2, n=7) | |
| Lenovo Legion 7 16IAX7-82TD004SGE | |
| Asus ROG Strix Scar 17 SE G733CX-LL014W | |
| Asus Strix Scar 17 G733QSA-XS99 | |
* ... smaller is better
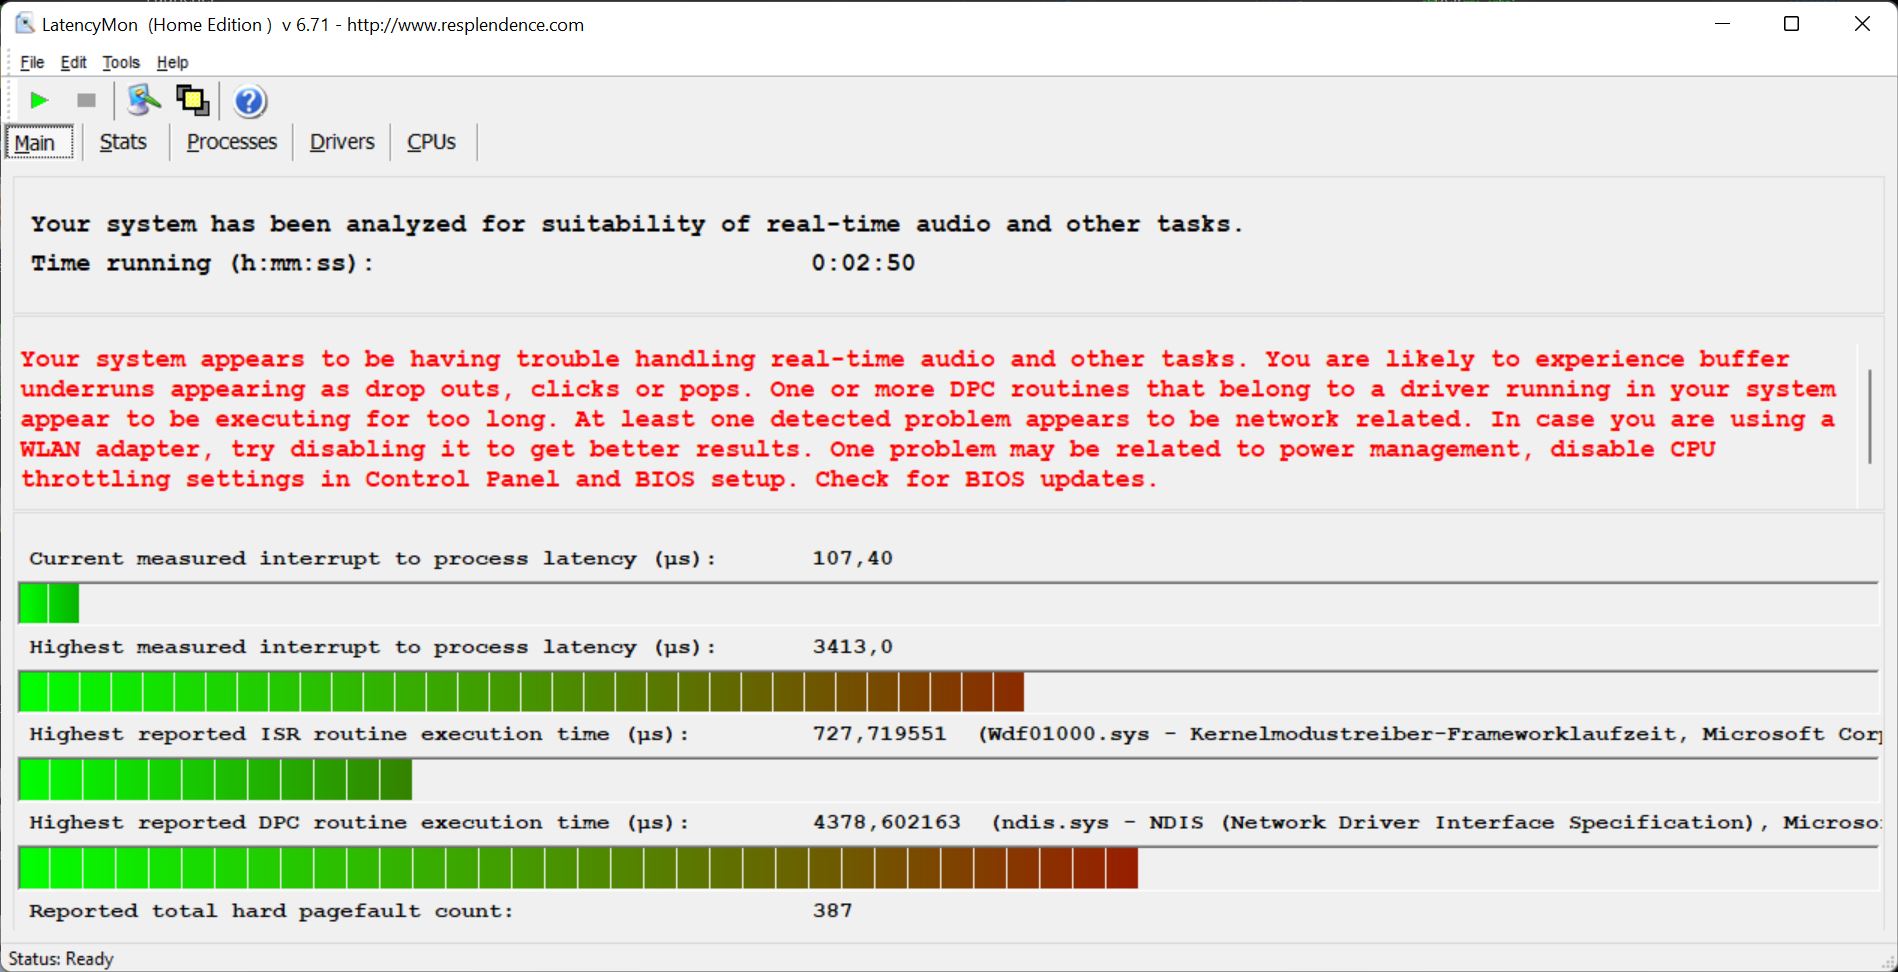
DPC Latencies
In our standardized latency test (surfing the Internet, 4K YouTube video, CPU load), our test unit with its BIOS version has some problems, so it is not suited for real-time video and audio processing.
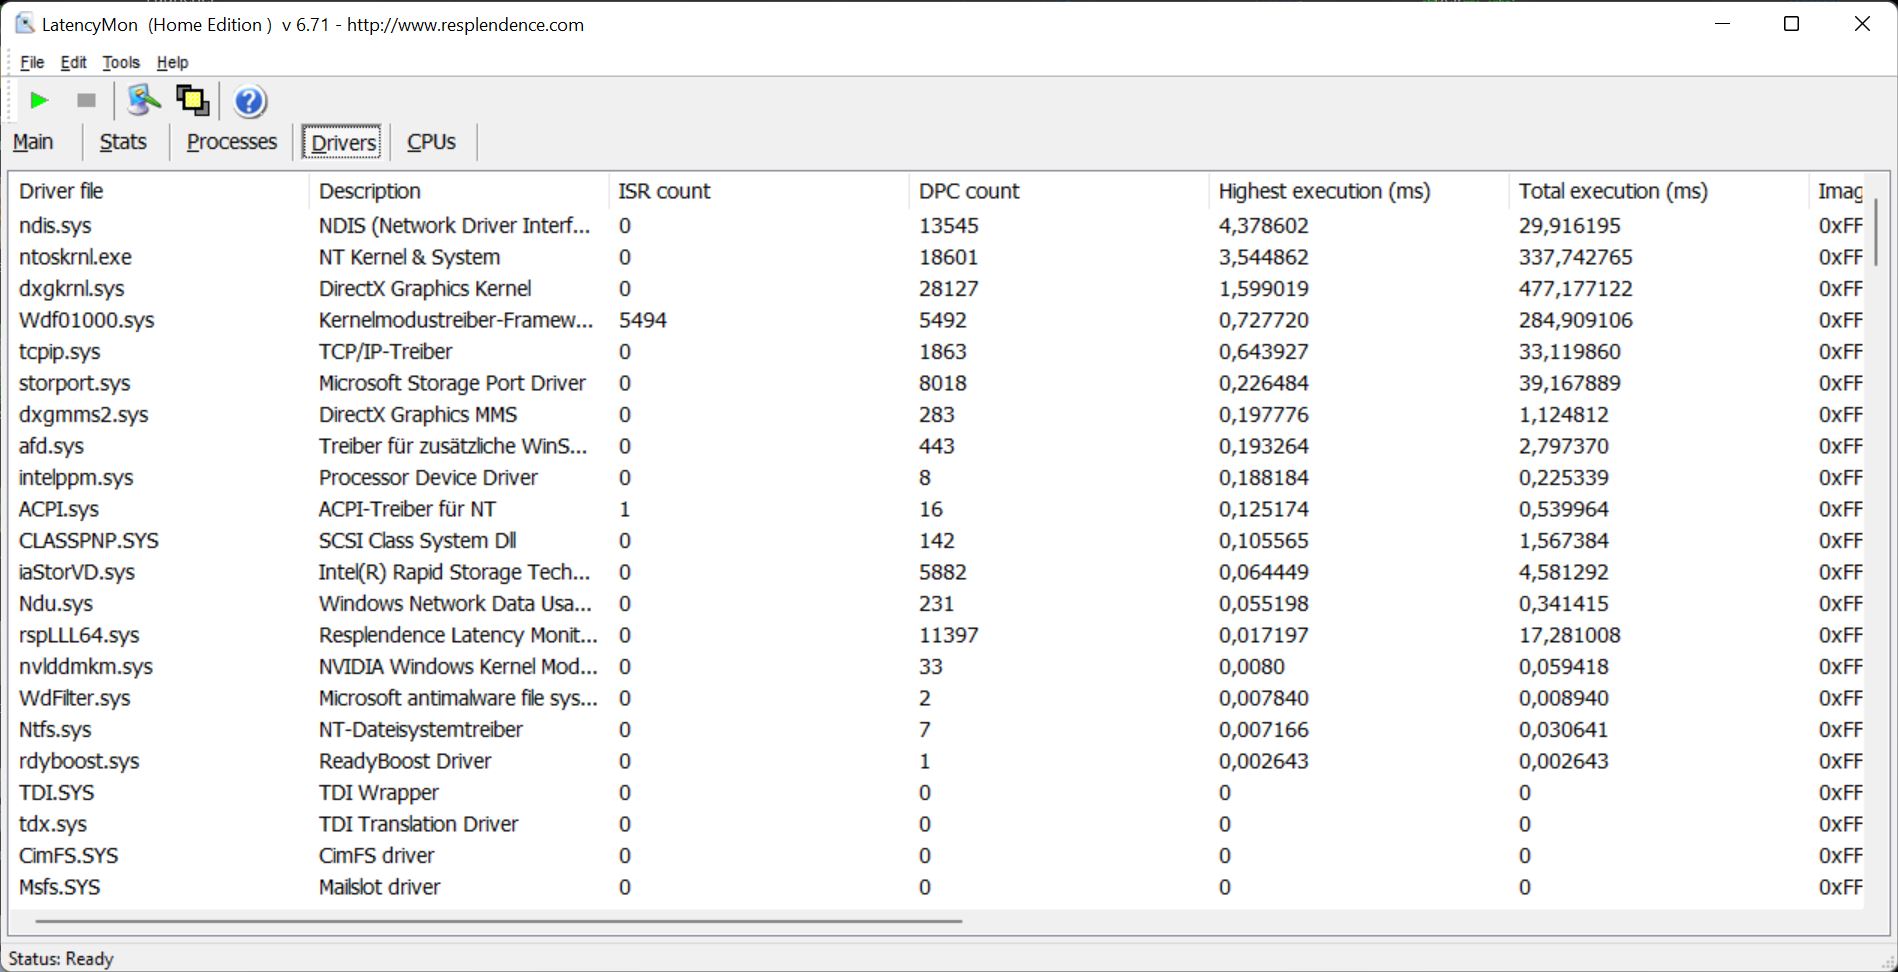
| DPC Latencies / LatencyMon - interrupt to process latency (max), Web, Youtube, Prime95 | |
| Schenker XMG Neo 17 M22 | |
| Asus ROG Strix Scar 17 SE G733CX-LL014W | |
| MSI Titan GT77 12UHS | |
| MSI Titan GT77 12UHS | |
| Lenovo Legion 7 16IAX7-82TD004SGE | |
| Alienware x17 R2 P48E | |
| Asus Strix Scar 17 G733QSA-XS99 | |
* ... smaller is better
Storage Solution
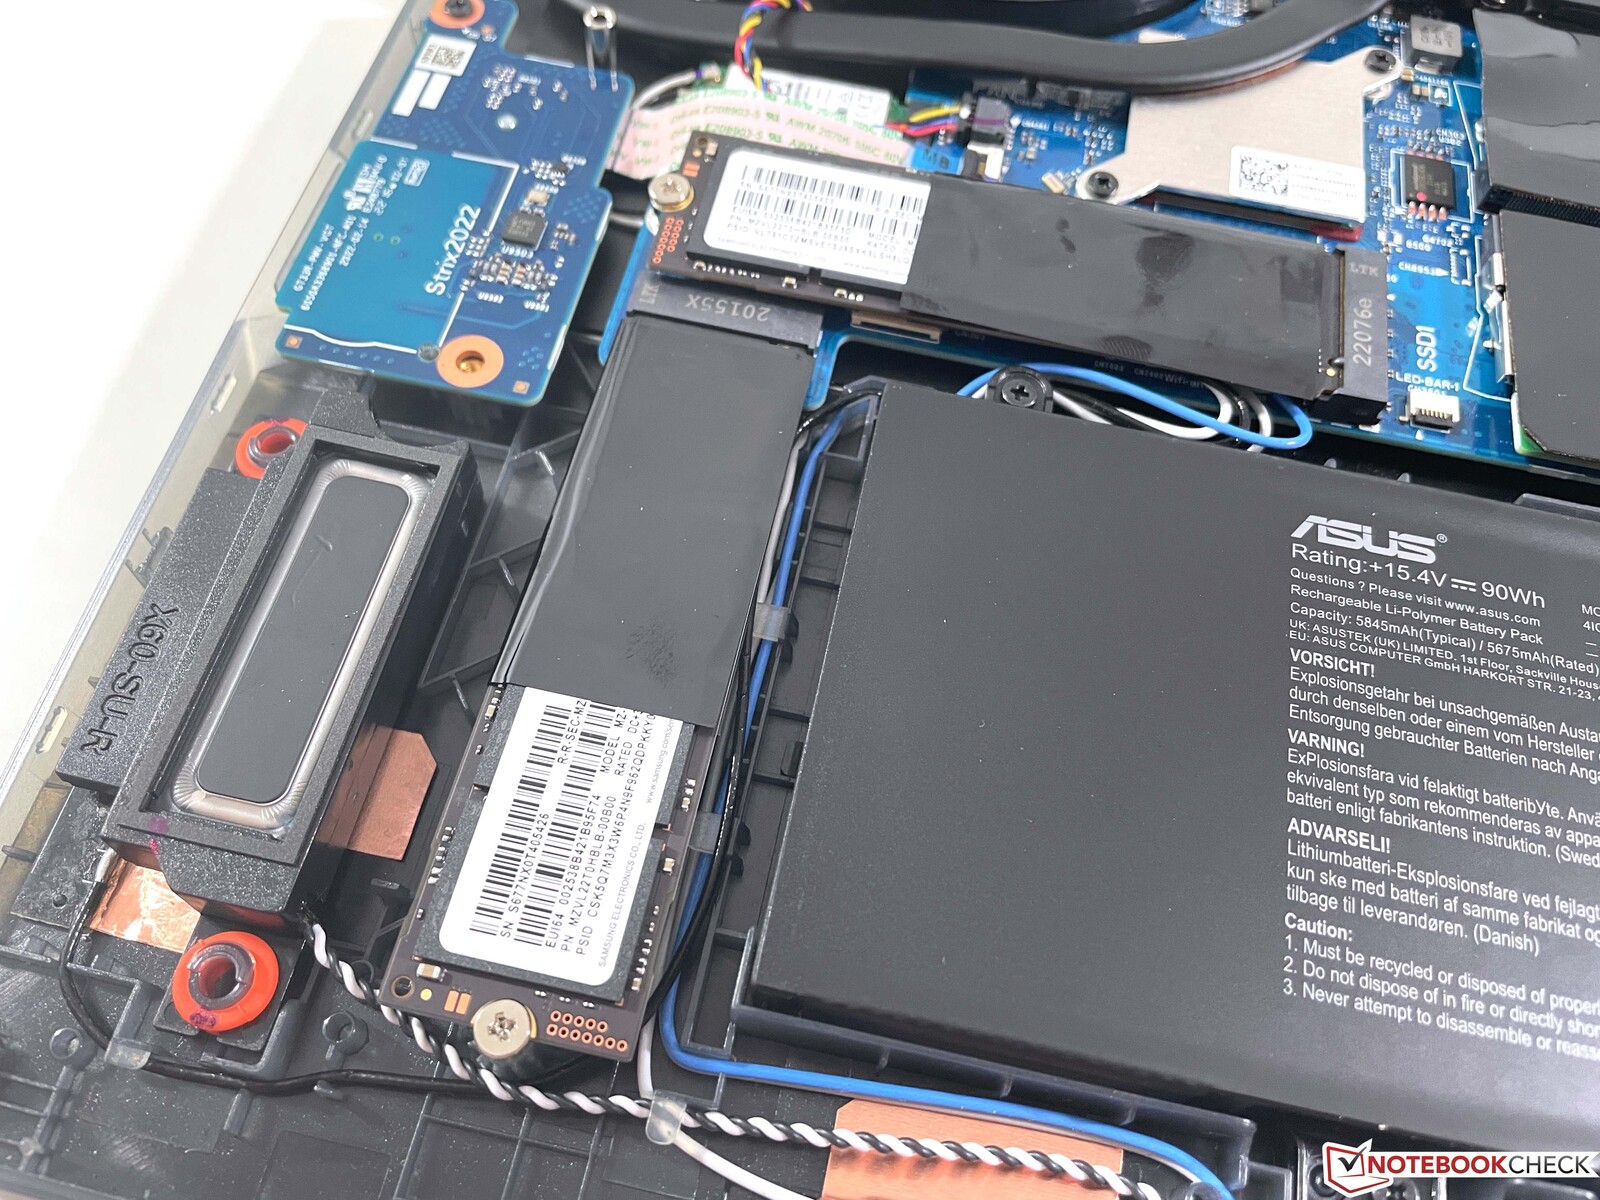
Asus uses two fast 2-TB SSDs from Samsung (PM91A) in a RAID 0 configuration here. This allows extremely high transfer rates of more than 10 GB/s. However, the performance doesn't remain stable under constant load, dropping massively instead. But that shouldn't cause any limitations during everyday gaming. You can find additional SSD benchmarks here.

* ... smaller is better
Disk Throttling: DiskSpd Read Loop, Queue Depth 8
Graphics Card
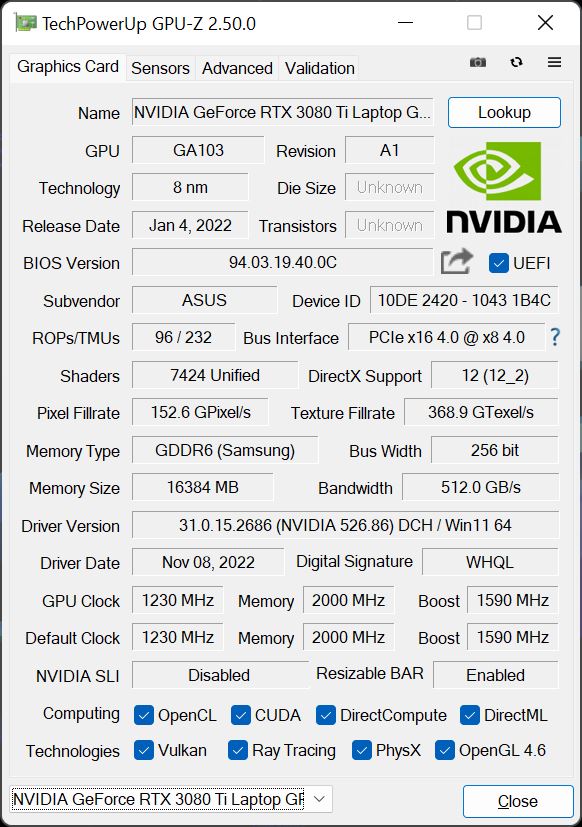
Asus uses the GeForce RTX 3080 Ti version with a TGP of 150 watts, and the GPU is also able to use an additional 25 watts Dynamic Boost from the processor. It also achieves this value (175 watts) in the Performance mode, so it is not necessary to use the Turbo mode. There is also a MUX that allows you to completely deactivate the integrated GPU (requires a restart), which improves the latencies while gaming but doesn't have much of an effect on the graphics performance itself.
The graphics performance falls within the group of top performers and is also higher than the average values for the RTX 3080 Ti in our database. In addition, the graphics performance remains completely stable. The 3DMark Time Spy stress test is passed without any problems, and there is also no performance drop in our The Witcher 3 constant load test. The gaming performance is easily sufficient for maximum details in the native QHD resolution, even in demanding games.
In battery operation, the GPU is allowed to consume a maximum of 44 watts, which corresponds to a performance drop of about 70%. You can find additional GPU benchmarks here.
| 3DMark 11 Performance | 35997 points | |
| 3DMark Fire Strike Score | 28793 points | |
| 3DMark Time Spy Score | 12904 points | |
Help | ||
| Blender / v3.3 Classroom OPTIX/RTX | |
| Average NVIDIA GeForce RTX 3080 Ti Laptop GPU (20 - 28, n=13) | |
| Lenovo Legion 7 16IAX7-82TD004SGE | |
| Asus ROG Strix Scar 17 SE G733CX-LL014W | |
| MSI Titan GT77 12UHS | |
| Average of class Gaming (9 - 32, n=111, last 2 years) | |
| Blender / v3.3 Classroom CUDA | |
| Lenovo Legion 7 16IAX7-82TD004SGE | |
| Average NVIDIA GeForce RTX 3080 Ti Laptop GPU (32 - 41, n=13) | |
| Asus ROG Strix Scar 17 SE G733CX-LL014W | |
| Average of class Gaming (15 - 228, n=111, last 2 years) | |
| MSI Titan GT77 12UHS | |
| Blender / v3.3 Classroom CPU | |
| Asus ROG Strix Scar 17 SE G733CX-LL014W | |
| Average NVIDIA GeForce RTX 3080 Ti Laptop GPU (261 - 429, n=13) | |
| Lenovo Legion 7 16IAX7-82TD004SGE | |
| MSI Titan GT77 12UHS | |
| Average of class Gaming (122 - 565, n=107, last 2 years) | |
* ... smaller is better
| The Witcher 3 - 1920x1080 Ultra Graphics & Postprocessing (HBAO+) | |
| Average of class Gaming (95 - 240, n=8, last 2 years) | |
| MSI Titan GT77 12UHS | |
| Alienware x17 R2 P48E | |
| Schenker XMG Neo 17 M22 | |
| Asus ROG Strix Scar 17 SE G733CX-LL014W | |
| Lenovo Legion 7 16IAX7-82TD004SGE | |
| Average NVIDIA GeForce RTX 3080 Ti Laptop GPU (30 - 130.6, n=43) | |
| Asus Strix Scar 17 G733QSA-XS99 | |
| F1 22 | |
| 1920x1080 Ultra High Preset AA:T AF:16x | |
| Schenker XMG Neo 17 M22 | |
| Average NVIDIA GeForce RTX 3080 Ti Laptop GPU (78.9 - 91, n=4) | |
| MSI Titan GT77 12UHS | |
| Asus ROG Strix Scar 17 SE G733CX-LL014W | |
| Average of class Gaming (40.1 - 121.2, n=5, last 2 years) | |
| 2560x1440 Ultra High Preset AA:T AF:16x | |
| Schenker XMG Neo 17 M22 | |
| Average NVIDIA GeForce RTX 3080 Ti Laptop GPU (52.9 - 62, n=2) | |
| Average of class Gaming (42 - 77.8, n=3, last 2 years) | |
| Asus ROG Strix Scar 17 SE G733CX-LL014W | |
The Witcher 3 FPS Chart
| low | med. | high | ultra | QHD | |
|---|---|---|---|---|---|
| GTA V (2015) | 186.8 | 180.7 | 126.7 | 114.1 | |
| The Witcher 3 (2015) | 118.8 | ||||
| Dota 2 Reborn (2015) | 211 | 191 | 180.8 | 169.8 | |
| Final Fantasy XV Benchmark (2018) | 173.3 | 156.2 | 118.5 | 92.8 | |
| X-Plane 11.11 (2018) | 165.3 | 143.5 | 116.2 | ||
| Strange Brigade (2018) | 236 | 211 | 157.7 | ||
| F1 2021 (2021) | 236 | 211 | 132.8 | 106.2 | |
| Cyberpunk 2077 1.6 (2022) | 103 | 101 | 98 | 87 | 56 |
| F1 22 (2022) | 235 | 235 | 199.7 | 78.9 | 52.9 |
| Call of Duty Modern Warfare 2 2022 (2022) | 135 | 109 | 107 | 78 |
Emissions and Power Management
Noise Levels
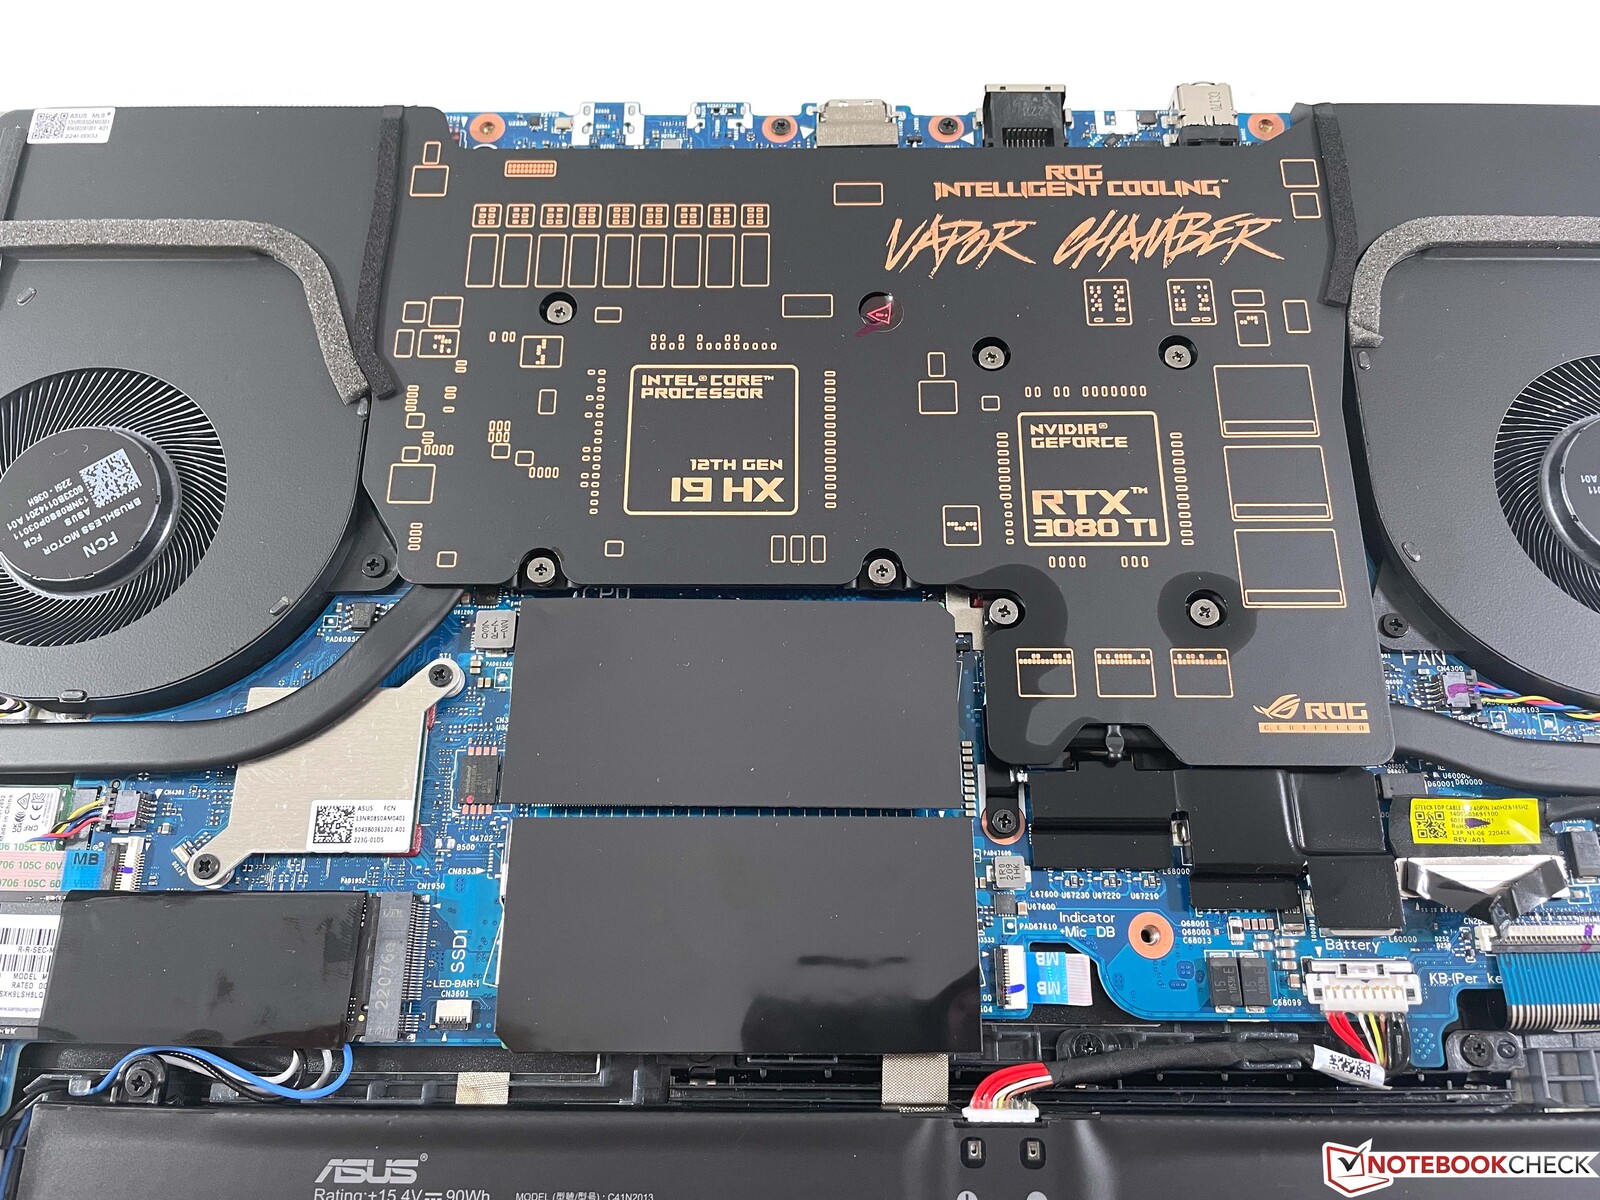
Asus uses a vapor chamber cooling system here. In the Performance power mode, the device also remains relatively quiet, and we are able to measure a maximum of 46 dB(A) during the stress test as well as while gaming. This is of course still noticeable, but our test unit is still significantly quieter with this than the competitors. In the Turbo mode, the gaming performance is only insignificantly higher, but the two running fans produce a loud 54 dB(A). During idle operation, the fans often remain turned off, but we almost always notice some quiet electronic noises. Under load, there is also some audible coil whine coming from the GPU, we are guessing.
Noise level
| Idle |
| 23.9 / 23.9 / 23.9 dB(A) |
| Load |
| 34.3 / 45.9 dB(A) |
 | ||
30 dB silent 40 dB(A) audible 50 dB(A) loud |
||
min: | ||
| Asus ROG Strix Scar 17 SE G733CX-LL014W GeForce RTX 3080 Ti Laptop GPU, i9-12950HX, Samsung PM9A1 MZVL22T0HBLB | Lenovo Legion 7 16IAX7-82TD004SGE GeForce RTX 3080 Ti Laptop GPU, i9-12900HX, Micron 3400 1TB MTFDKBA1T0TFH | MSI Titan GT77 12UHS GeForce RTX 3080 Ti Laptop GPU, i9-12900HX, Samsung PM9A1 MZVL21T0HCLR | Schenker XMG Neo 17 M22 GeForce RTX 3080 Ti Laptop GPU, R9 6900HX, Samsung SSD 980 Pro 1TB MZ-V8P1T0BW | Alienware x17 R2 P48E GeForce RTX 3080 Ti Laptop GPU, i9-12900HK, 2x Samsung PM9A1 1TB (RAID 0) | Asus Strix Scar 17 G733QSA-XS99 GeForce RTX 3080 Laptop GPU, R9 5900HX, 2x Samsung PM981a MZVLB1T0HBLR (RAID 0) | |
|---|---|---|---|---|---|---|
| Noise | -19% | -9% | -27% | 1% | -4% | |
| off / environment * (dB) | 23.9 | 24.5 -3% | 21.9 8% | 26 -9% | 22.7 5% | 25 -5% |
| Idle Minimum * (dB) | 23.9 | 24.5 -3% | 24.53 -3% | 26 -9% | 23.1 3% | 25.2 -5% |
| Idle Average * (dB) | 23.9 | 30 -26% | 24.53 -3% | 29 -21% | 23.1 3% | 25.2 -5% |
| Idle Maximum * (dB) | 23.9 | 32.5 -36% | 24.53 -3% | 40 -67% | 23.1 3% | 25.2 -5% |
| Load Average * (dB) | 34.3 | 43.9 -28% | 46.25 -35% | 47 -37% | 31.9 7% | 30.7 10% |
| Load Maximum * (dB) | 45.9 | 54.2 -18% | 54.25 -18% | 54 -18% | 52.5 -14% | 51.3 -12% |
| Witcher 3 ultra * (dB) | 48.8 | 56.86 | 52 | 52.5 | 51.3 |
* ... smaller is better
Temperature
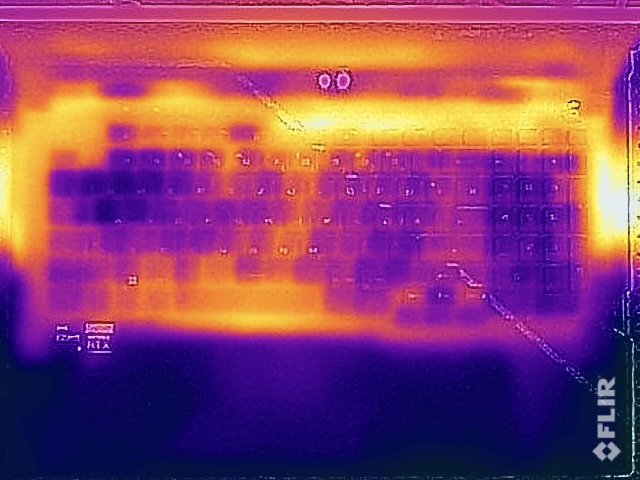
Despite the relatively quiet fans, the surface temperatures give no reason for concern. Even though we measure more than 50 °C (122 °F) in some isolated spots under load, the keyboard remains very cool and there are no limitations at all during gaming.
During the stress test, the GPU receives preferential treatment, running stably at 150 watts as soon as the processor has leveled out at about 36 watts. There is no performance reduction right after the stress test.
(-) The maximum temperature on the upper side is 48.8 °C / 120 F, compared to the average of 40.4 °C / 105 F, ranging from 21.2 to 68.8 °C for the class Gaming.
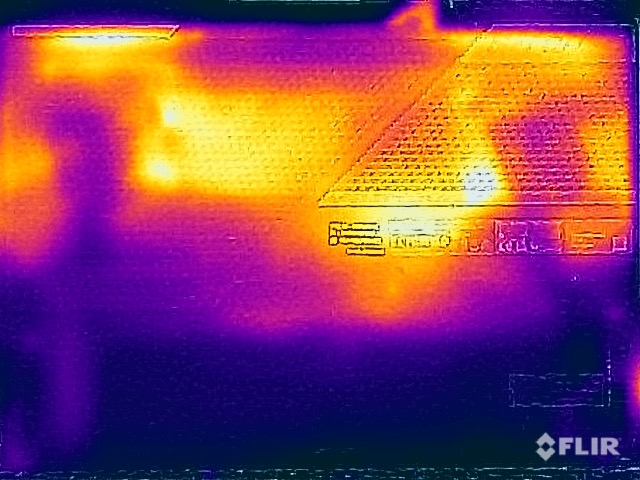
(-) The bottom heats up to a maximum of 52.4 °C / 126 F, compared to the average of 43.2 °C / 110 F
(+) In idle usage, the average temperature for the upper side is 28.6 °C / 83 F, compared to the device average of 33.9 °C / 93 F.
(±) Playing The Witcher 3, the average temperature for the upper side is 35.1 °C / 95 F, compared to the device average of 33.9 °C / 93 F.
(+) The palmrests and touchpad are cooler than skin temperature with a maximum of 26 °C / 78.8 F and are therefore cool to the touch.
(+) The average temperature of the palmrest area of similar devices was 28.8 °C / 83.8 F (+2.8 °C / 5 F).
| Asus ROG Strix Scar 17 SE G733CX-LL014W Intel Core i9-12950HX, NVIDIA GeForce RTX 3080 Ti Laptop GPU | Lenovo Legion 7 16IAX7-82TD004SGE Intel Core i9-12900HX, NVIDIA GeForce RTX 3080 Ti Laptop GPU | MSI Titan GT77 12UHS Intel Core i9-12900HX, NVIDIA GeForce RTX 3080 Ti Laptop GPU | Schenker XMG Neo 17 M22 AMD Ryzen 9 6900HX, NVIDIA GeForce RTX 3080 Ti Laptop GPU | Alienware x17 R2 P48E Intel Core i9-12900HK, NVIDIA GeForce RTX 3080 Ti Laptop GPU | Asus Strix Scar 17 G733QSA-XS99 AMD Ryzen 9 5900HX, NVIDIA GeForce RTX 3080 Laptop GPU | |
|---|---|---|---|---|---|---|
| Heat | -8% | -3% | 1% | 7% | 4% | |
| Maximum Upper Side * (°C) | 48.8 | 44.4 9% | 40.8 16% | 49 -0% | 49.6 -2% | 40 18% |
| Maximum Bottom * (°C) | 52.4 | 60.8 -16% | 52.4 -0% | 52 1% | 42.4 19% | 39.8 24% |
| Idle Upper Side * (°C) | 30.4 | 33.8 -11% | 34.6 -14% | 30 1% | 29.2 4% | 34.6 -14% |
| Idle Bottom * (°C) | 34.1 | 38.8 -14% | 38.4 -13% | 33 3% | 32 6% | 38.4 -13% |
* ... smaller is better
Speakers
The sound system consists of a total of four modules that produce a powerful and spacious sound. Even though the speakers aren't the loudest on the market, the quality is very good overall. However, due to the loud fan noise while gaming, we still recommend a headset.
Asus ROG Strix Scar 17 SE G733CX-LL014W audio analysis
(±) | speaker loudness is average but good (73.3 dB)
Bass 100 - 315 Hz
(±) | reduced bass - on average 6.2% lower than median
(±) | linearity of bass is average (7.5% delta to prev. frequency)
Mids 400 - 2000 Hz
(+) | balanced mids - only 2% away from median
(+) | mids are linear (3.9% delta to prev. frequency)
Highs 2 - 16 kHz
(+) | balanced highs - only 3.5% away from median
(±) | linearity of highs is average (9.3% delta to prev. frequency)
Overall 100 - 16.000 Hz
(+) | overall sound is linear (13.6% difference to median)
Compared to same class
» 20% of all tested devices in this class were better, 7% similar, 73% worse
» The best had a delta of 6%, average was 18%, worst was 132%
Compared to all devices tested
» 15% of all tested devices were better, 4% similar, 82% worse
» The best had a delta of 4%, average was 24%, worst was 134%
MSI Titan GT77 12UHS audio analysis
(+) | speakers can play relatively loud (83.4 dB)
Bass 100 - 315 Hz
(-) | nearly no bass - on average 71.8% lower than median
(+) | bass is linear (0% delta to prev. frequency)
Mids 400 - 2000 Hz
(-) | nearly no mids - on average 71.8% lower than median
(+) | mids are linear (0% delta to prev. frequency)
Highs 2 - 16 kHz
(-) | nearly no highs - on average 71.8% lower than median
(+) | highs are linear (0% delta to prev. frequency)
Overall 100 - 16.000 Hz
(-) | overall sound is not linear (107.7% difference to median)
Compared to same class
» 100% of all tested devices in this class were better, 0% similar, 0% worse
» The best had a delta of 6%, average was 18%, worst was 132%
Compared to all devices tested
» 96% of all tested devices were better, 0% similar, 4% worse
» The best had a delta of 4%, average was 24%, worst was 134%
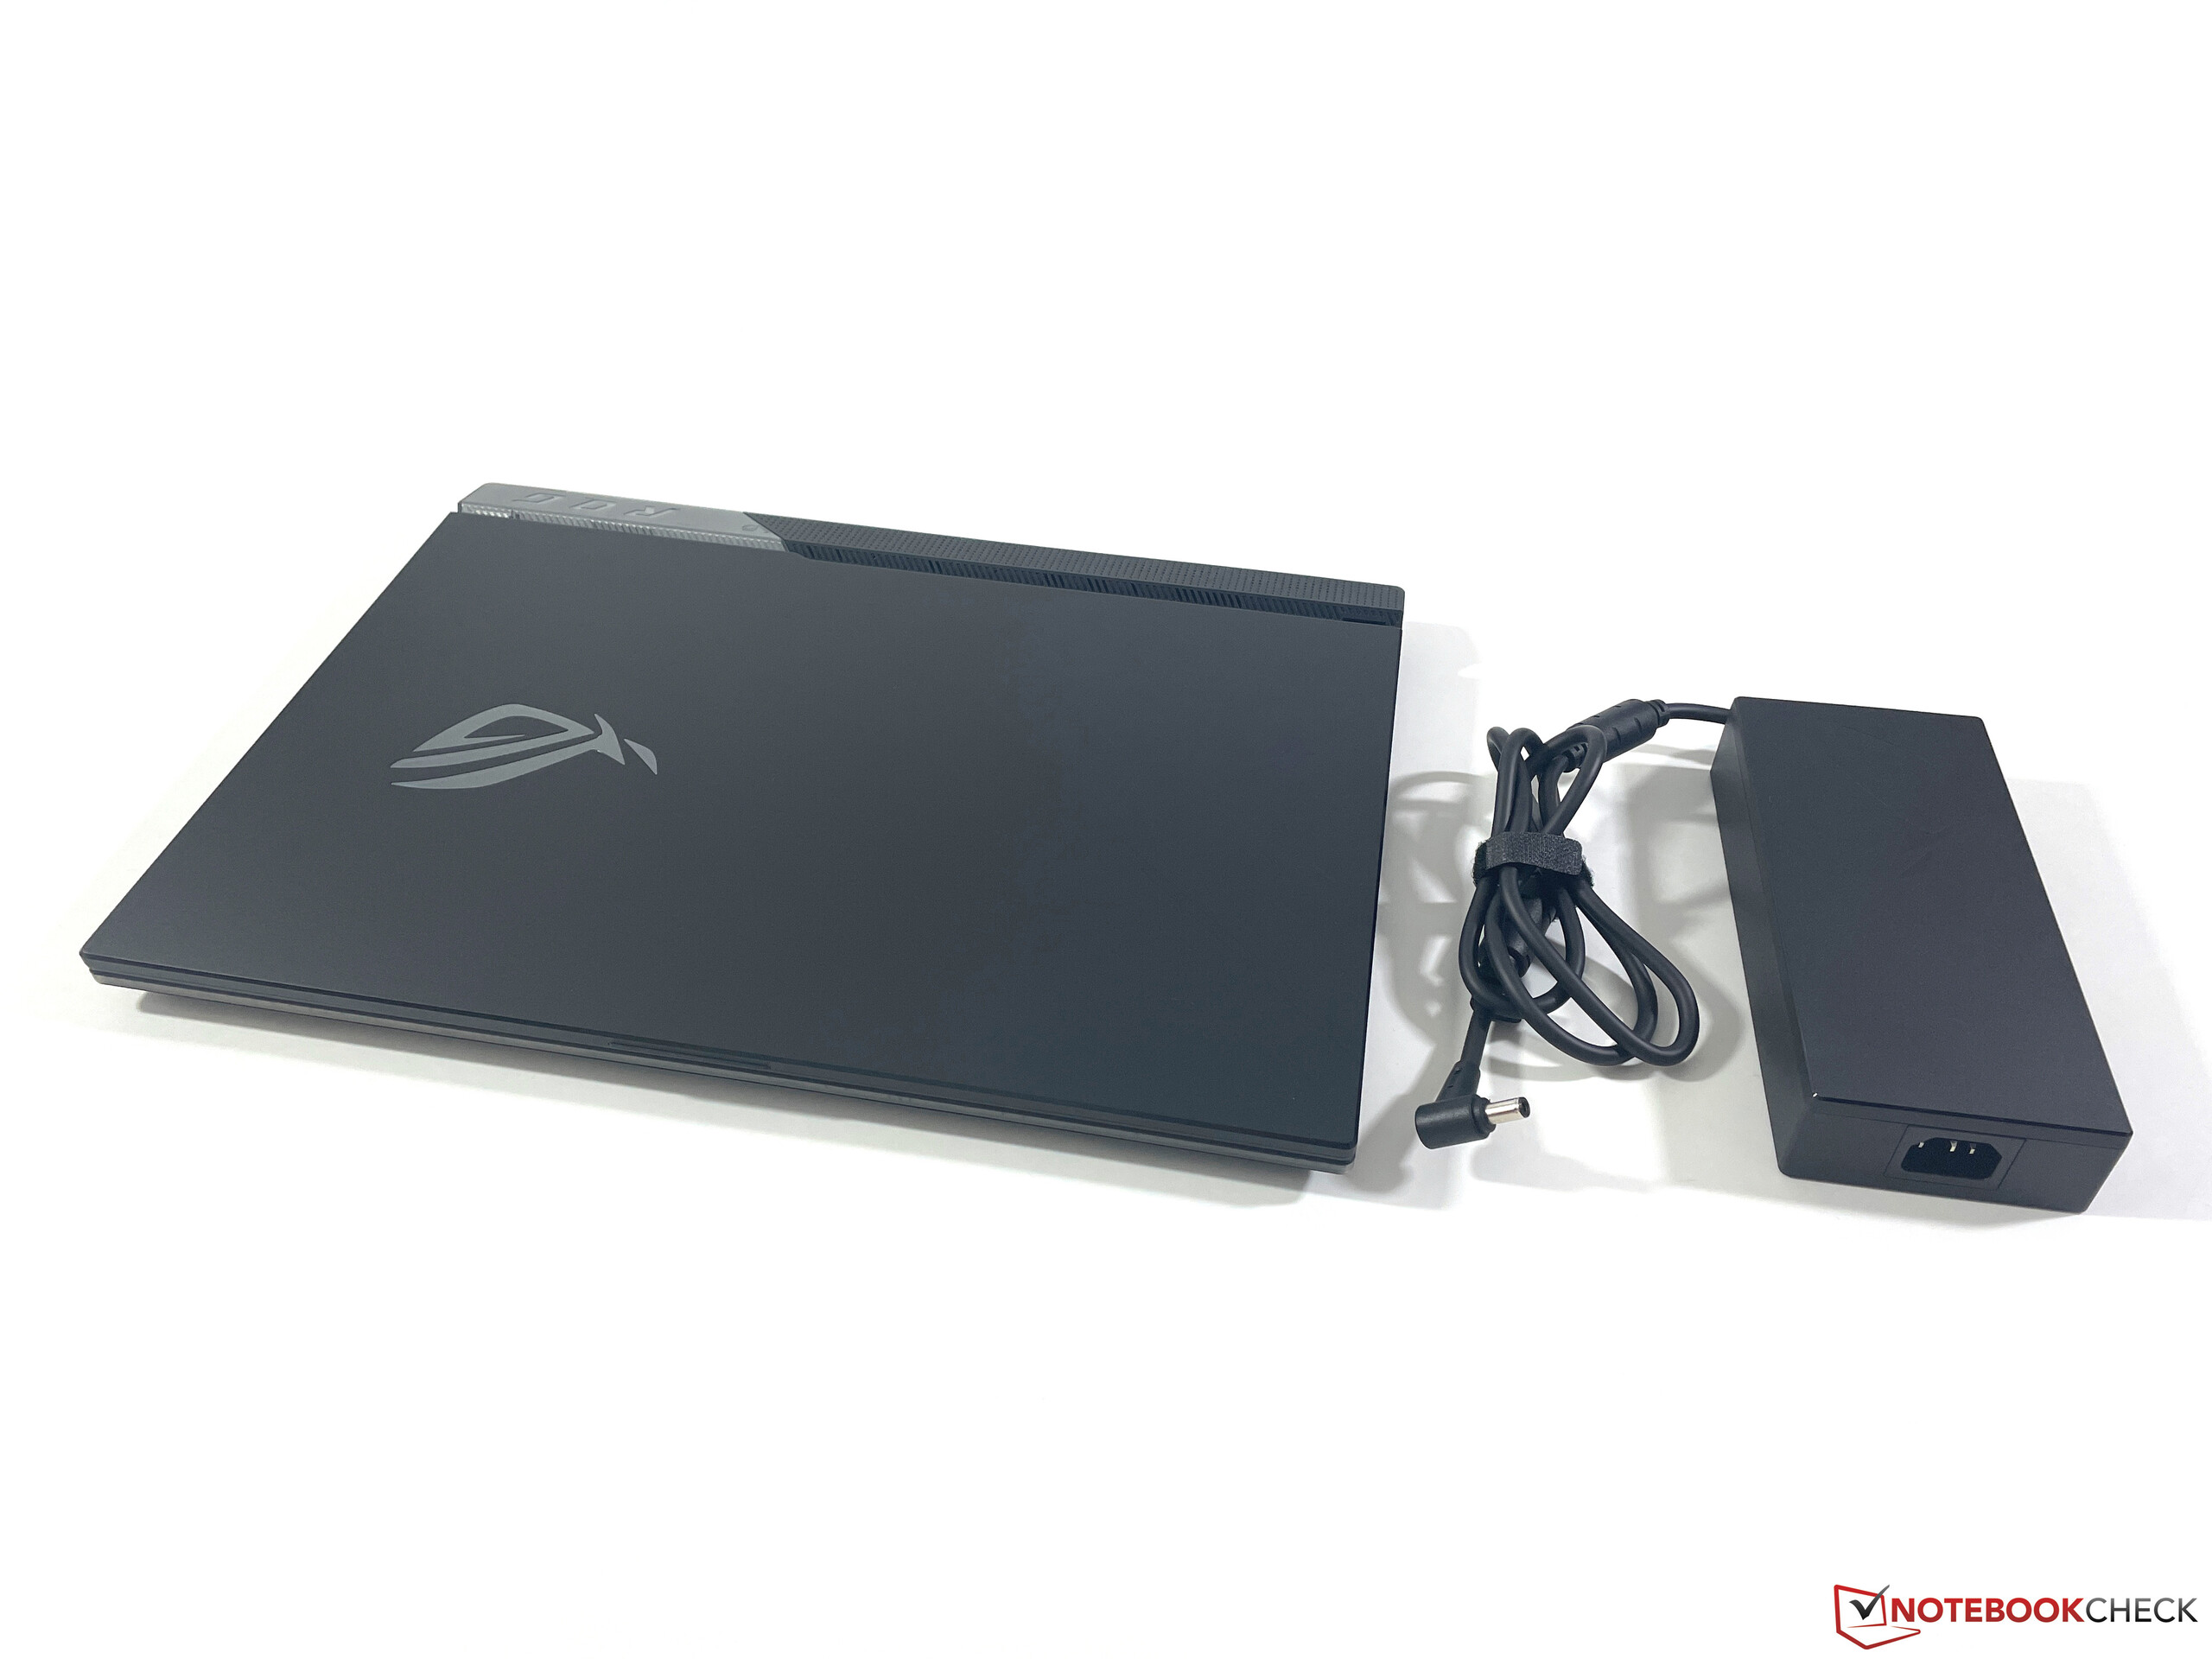
Power Consumption
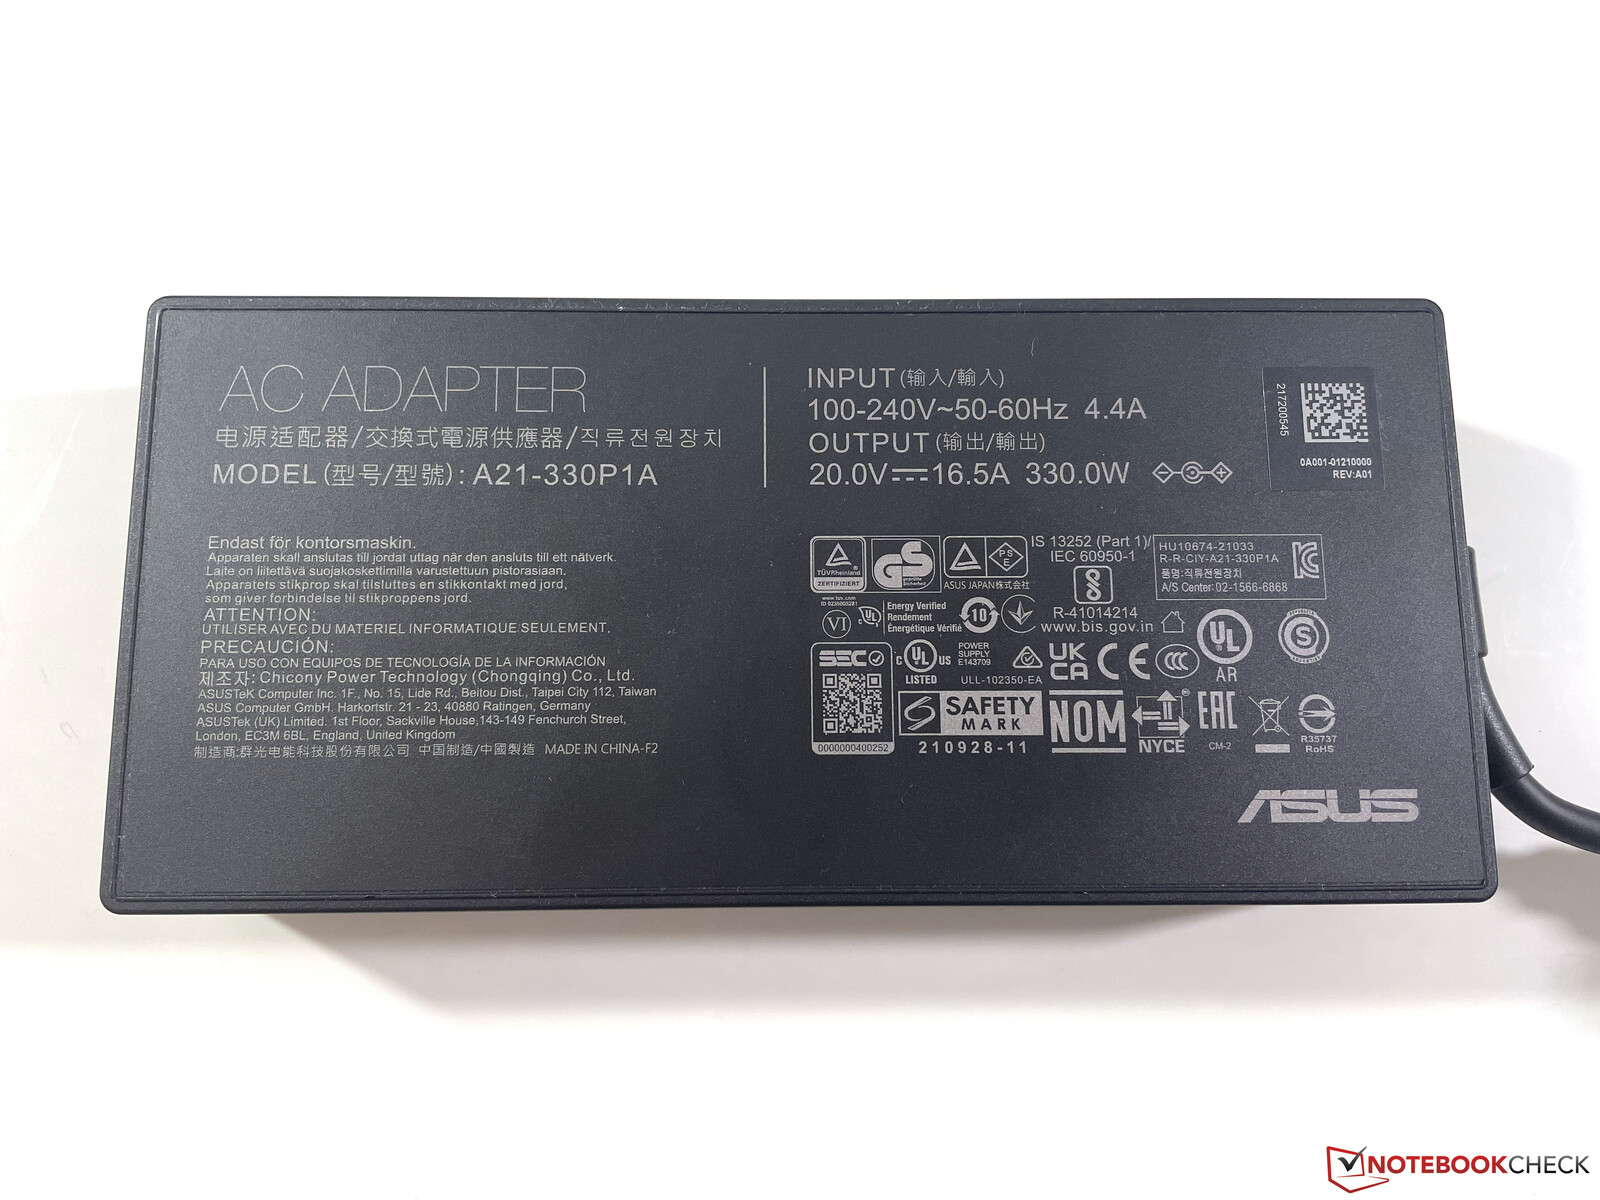
The ROG Strix Scar 17 SE isn't a very efficient laptop, which is not very surprising considering the powerful hardware. We already measure up to 27 watts during idle operation, and while gaming the value increases to about 230 watts. The 330-Watt power supply is therefore sufficiently large. The standby consumption is also fairly high at 2.6 watts, but this is due to the lighting effects that are activated by default.
| Off / Standby | |
| Idle | |
| Load |
|
Key:
min: | |
Power Consumption The Witcher 3 / Stress Test
Power Consumption With External Monitor
Battery Life
In our WLAN runtime test at 150 cd/m², which corresponds to 48% of the maximum brightness, our test unit only lasts for about 4 hours. Considering the high consumption values, this isn't very surprising. Some of the competitors last significantly longer here, if you need to bridge the times away from the outlet. Gaming is possible for about one hour but only with a significant performance reduction. It takes about 100 minutes to completely recharge the 90-Wh battery, with 80% of the capacity already available after about 53 minutes.
Pros
Cons
Verdict - A fully equipped fast gaming laptop
The current Asus ROG Strix Scar 17 SE delivers really everything a gamer's heart desires. A fast QHD panel with 240 Hz together with the GeForce RTX 3080 Ti, which also offers sufficient power for the native resolution in maximum details. While the CPU performance is also good for a gaming laptop, the potential of the HX processor cannot be used fully. You should therefore save yourself the additional premium for the more powerful processor and just choose a regular Core i9.
Other advantages include the very accurate colors, if you have to work on video processing directly, for example, the moderate surface temperatures, and the relatively quiet fans during gaming. Although a Turbo mode is available, which also becomes significantly louder, this doesn't have much of an impact on the gaming performance, so it isn't worthwhile in our opinion.
The new Asus ROG Strix Scar 17 SE offers plenty of performance and gaming features, but you should save on the additional premium for the Intel HX processor.
The competitors in the gaming market offer similar performance specifications but also brighter displays in parts and less flashy cases. In addition, electronic noises can become annoying in the long run.
Price and Availability
Our test configuration of the ROG Strix Scar 17 SE is available from Amazon for $3899, and a smaller configuration with the regular Core i9-12900H is also available there for $2278.
Asus ROG Strix Scar 17 SE G733CX-LL014W
- 11/18/2022 v7 (old)
Andreas Osthoff
Price comparison

