Asus Strix Scar 17 G733QS Laptop Review: Liquid Metal 7 nm AMD Zen 3 Is Stunning
The Asus ROG Strix Scar 17 G733 series is a direct successor to last year's ROG Strix Scar 17 G732 series by introducing a refreshed chassis, 360 Hz FHD display, AMD Zen 3 Cezanne CPUs, 130 W TGP Nvidia Ampere GPUs, and a new integrated mechanical keyboard. The year-to-year updates are significant on this model when considering that the G732 was running on Intel CPUs and Turing GPUs instead. Asus is offering no Intel options at the moment meaning the company is betting big on AMD and its latest generation of Ryzen CPUs.
Our test unit is the highest-end configuration with the Ryzen 9 5900HX CPU, GeForce RTX 3080 GPU, and 360 Hz FHD display for about $3000 USD but other SKUs are available with the Ryzen 7 5800H, GeForce RTX 3060/3070, or 165 Hz QHD display instead. Direct competitors include other flagship 17.3-inch gaming laptops like the MSI GE76, Razer Blade Pro 17, Schenker XMG Ultra 17, or Gigabyte Aorus 17X.
More Asus reviews:
potential competitors in comparison
Rating | Date | Model | Weight | Height | Size | Resolution | Price |
|---|---|---|---|---|---|---|---|
| 86.6 % v7 (old) | 05 / 2021 | Asus Strix Scar 17 G733QSA-XS99 R9 5900HX, GeForce RTX 3080 Laptop GPU | 2.8 kg | 28.3 mm | 17.30" | 1920x1080 | |
| 82.7 % v7 (old) | 07 / 2020 | Asus Strix Scar 17 G732LXS i9-10980HK, GeForce RTX 2080 Super Mobile | 2.9 kg | 26.5 mm | 17.30" | 1920x1080 | |
| 87.1 % v7 (old) | 03 / 2021 | MSI GE76 Raider 10UH i7-10870H, GeForce RTX 3080 Laptop GPU | 3 kg | 27.4 mm | 17.30" | 1920x1080 | |
| 85.3 % v7 (old) | 04 / 2021 | Alienware m17 R4 i9-10980HK, GeForce RTX 3080 Laptop GPU | 3 kg | 22 mm | 17.30" | 1920x1080 | |
| 87.8 % v7 (old) | 02 / 2021 | Razer Blade Pro 17 2021 (QHD Touch) i7-10875H, GeForce RTX 3080 Laptop GPU | 3 kg | 19.9 mm | 17.30" | 3840x2160 | |
| 82.4 % v7 (old) | 08 / 2020 | Asus Zephyrus S17 GX701LXS i7-10875H, GeForce RTX 2080 Super Max-Q | 2.6 kg | 18.7 mm | 17.30" | 1920x1080 |
Case
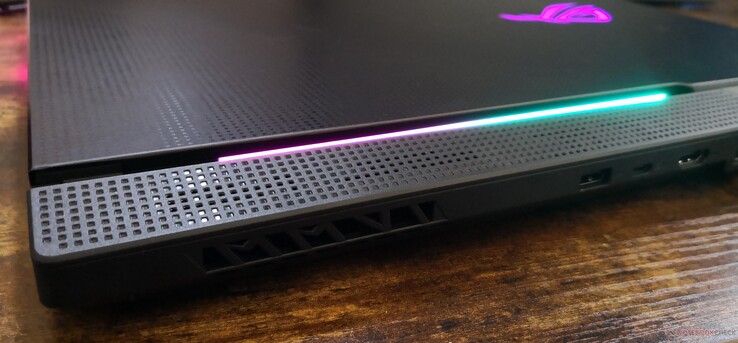
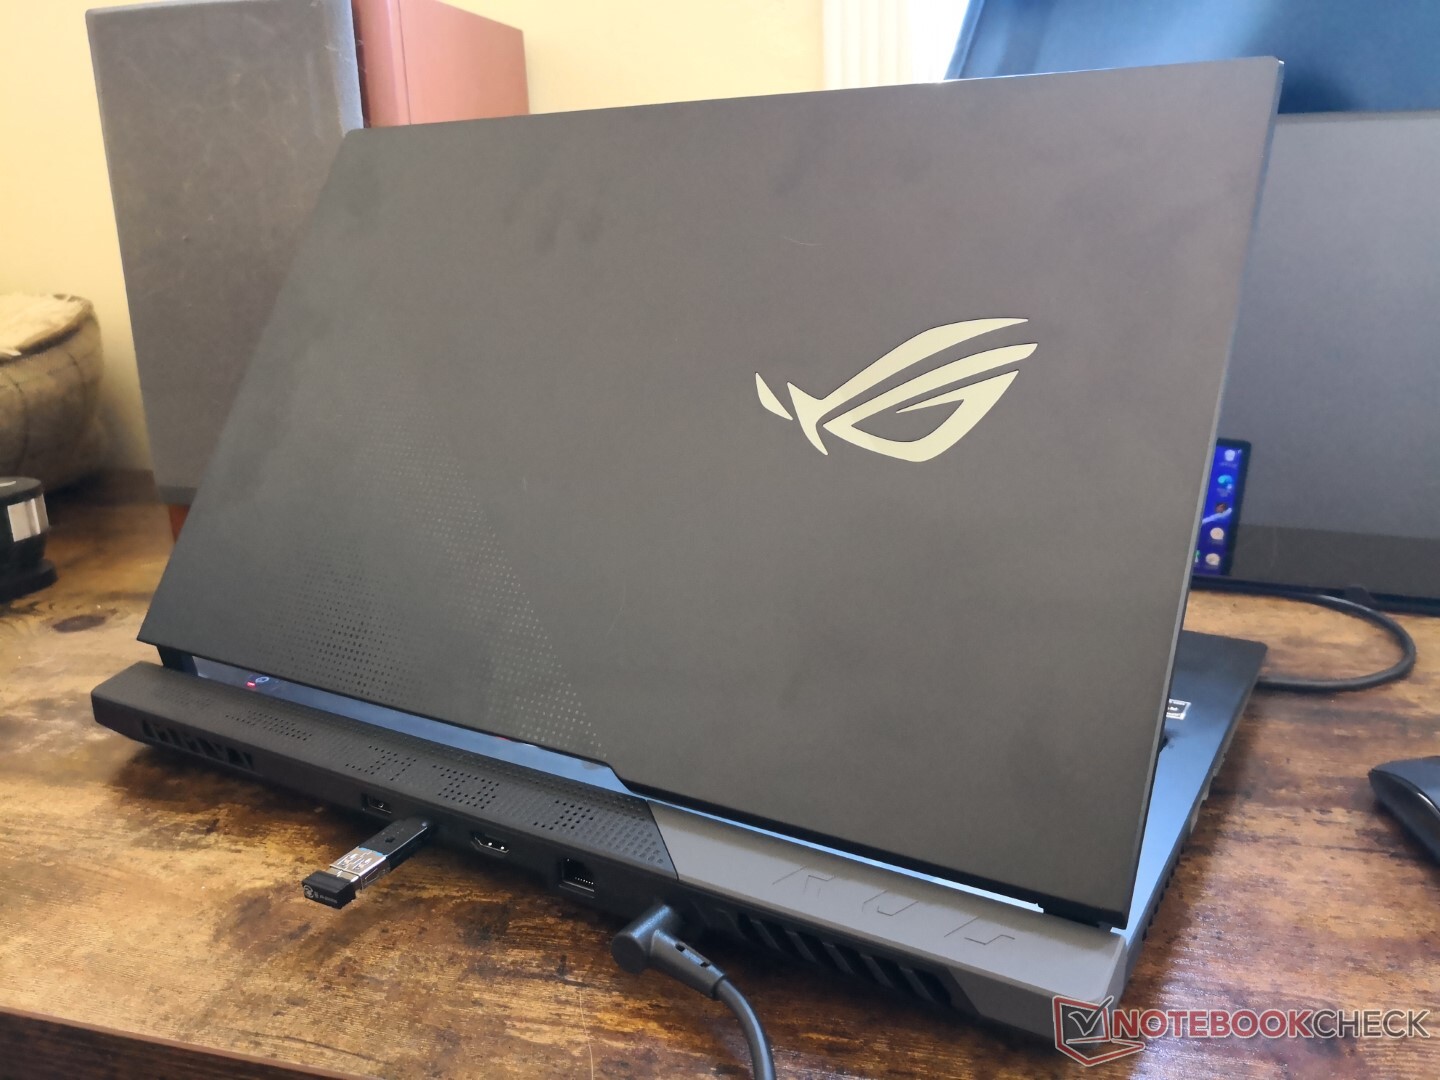
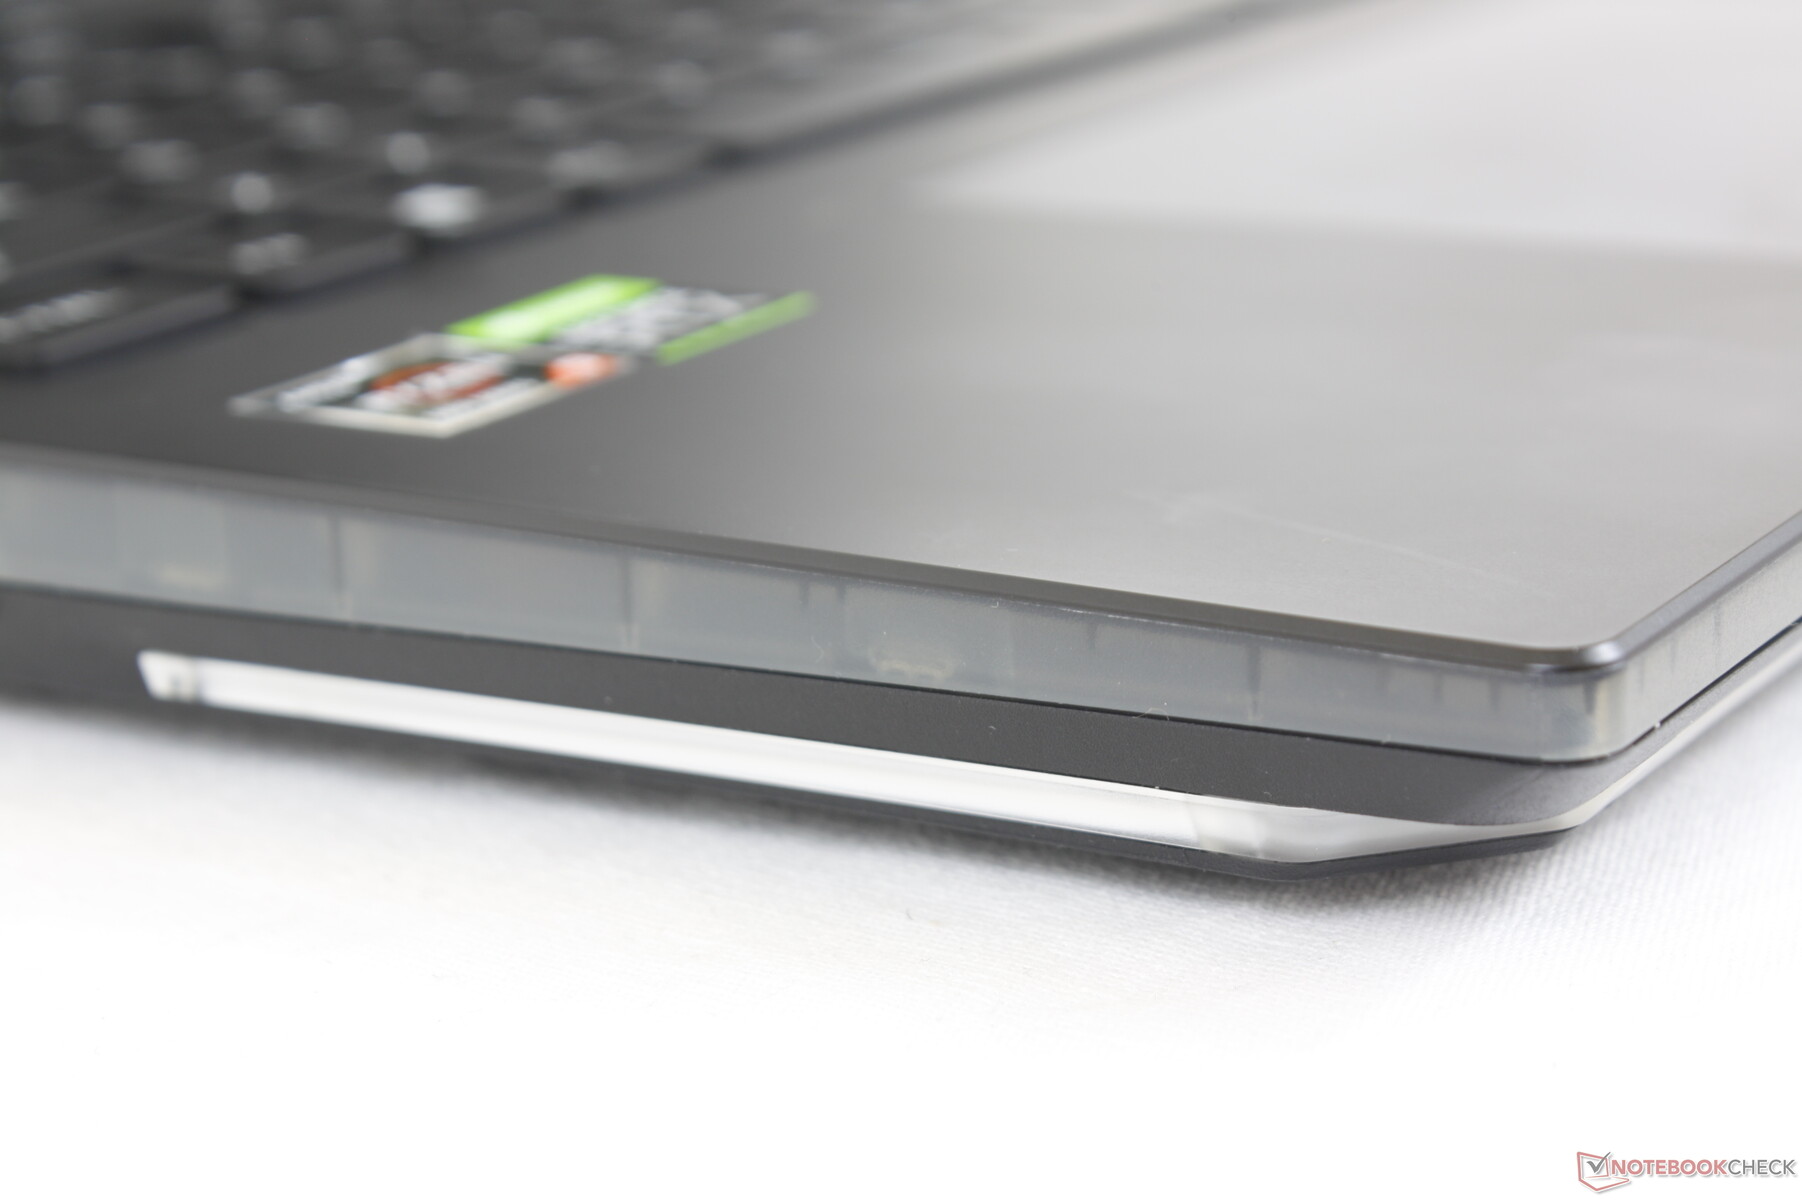
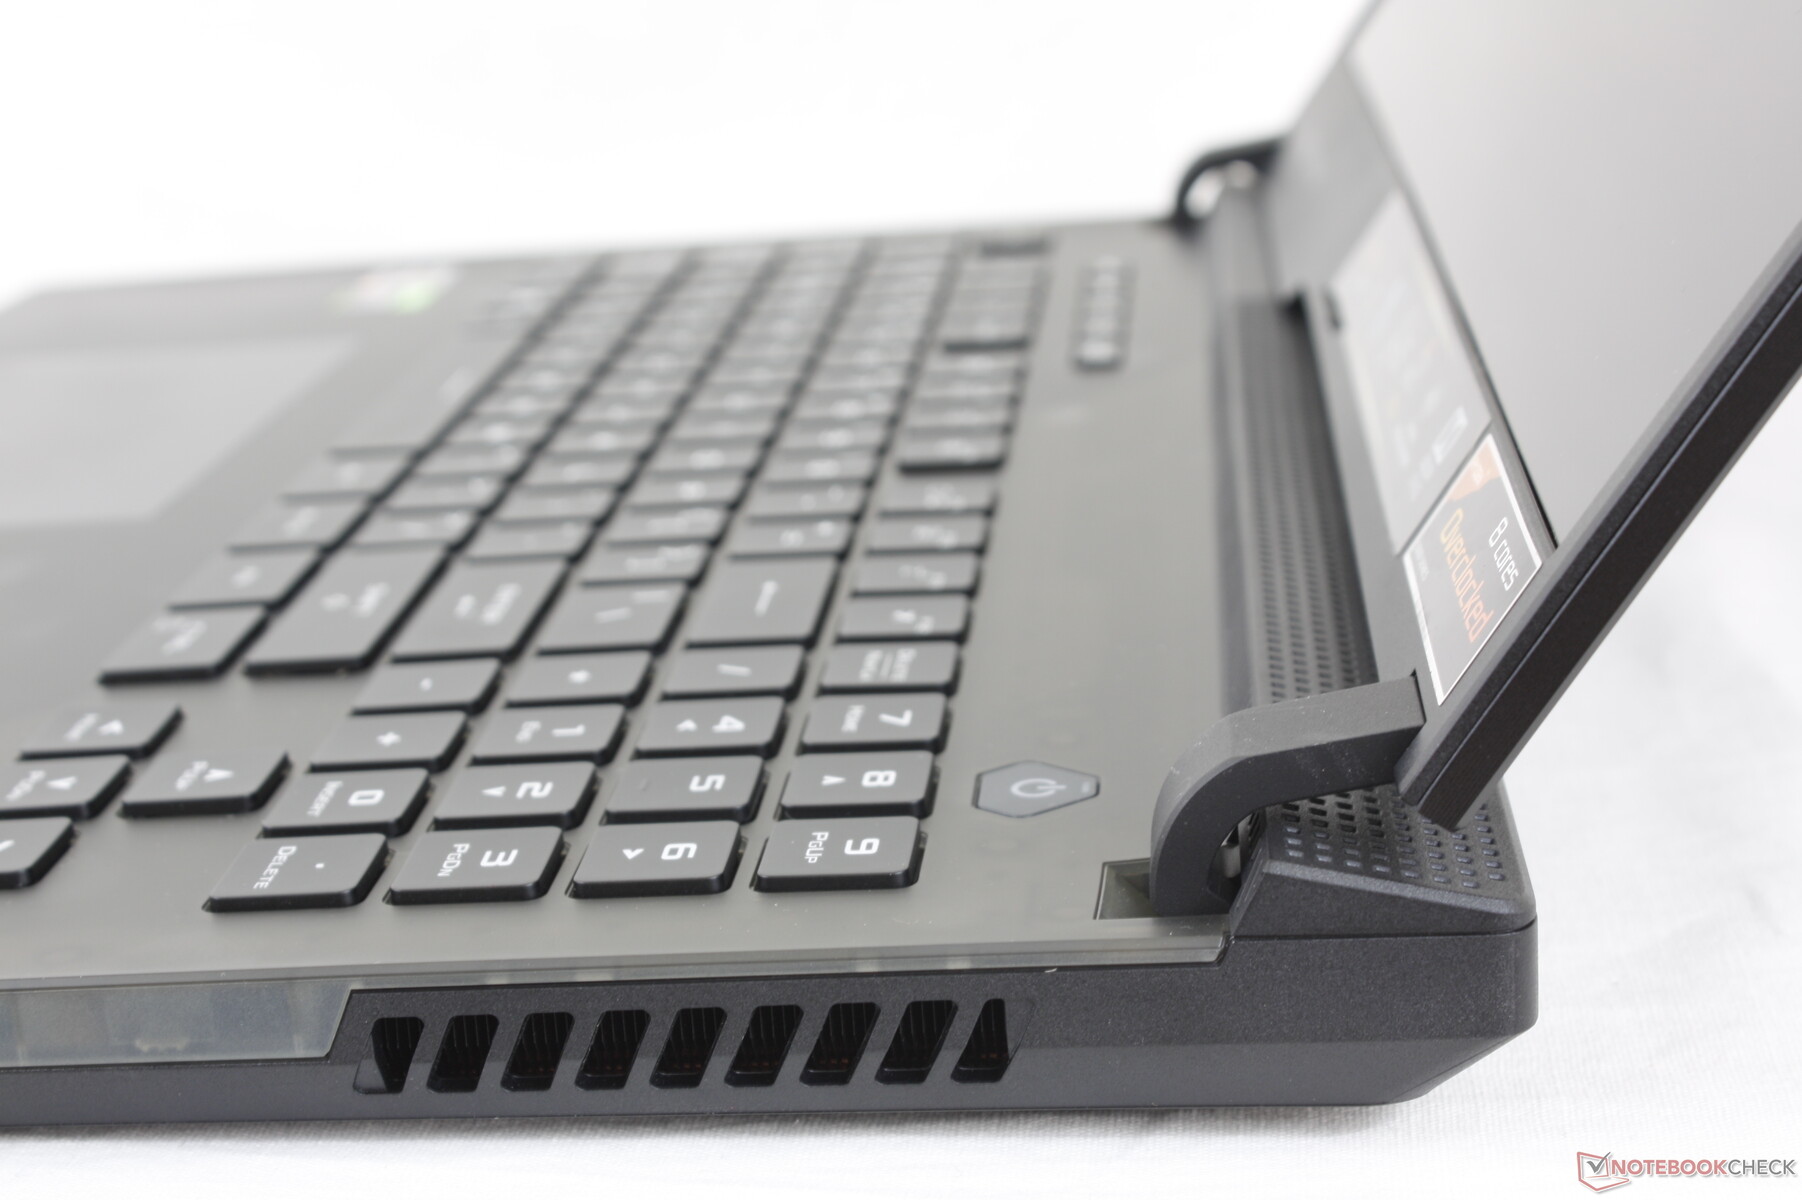
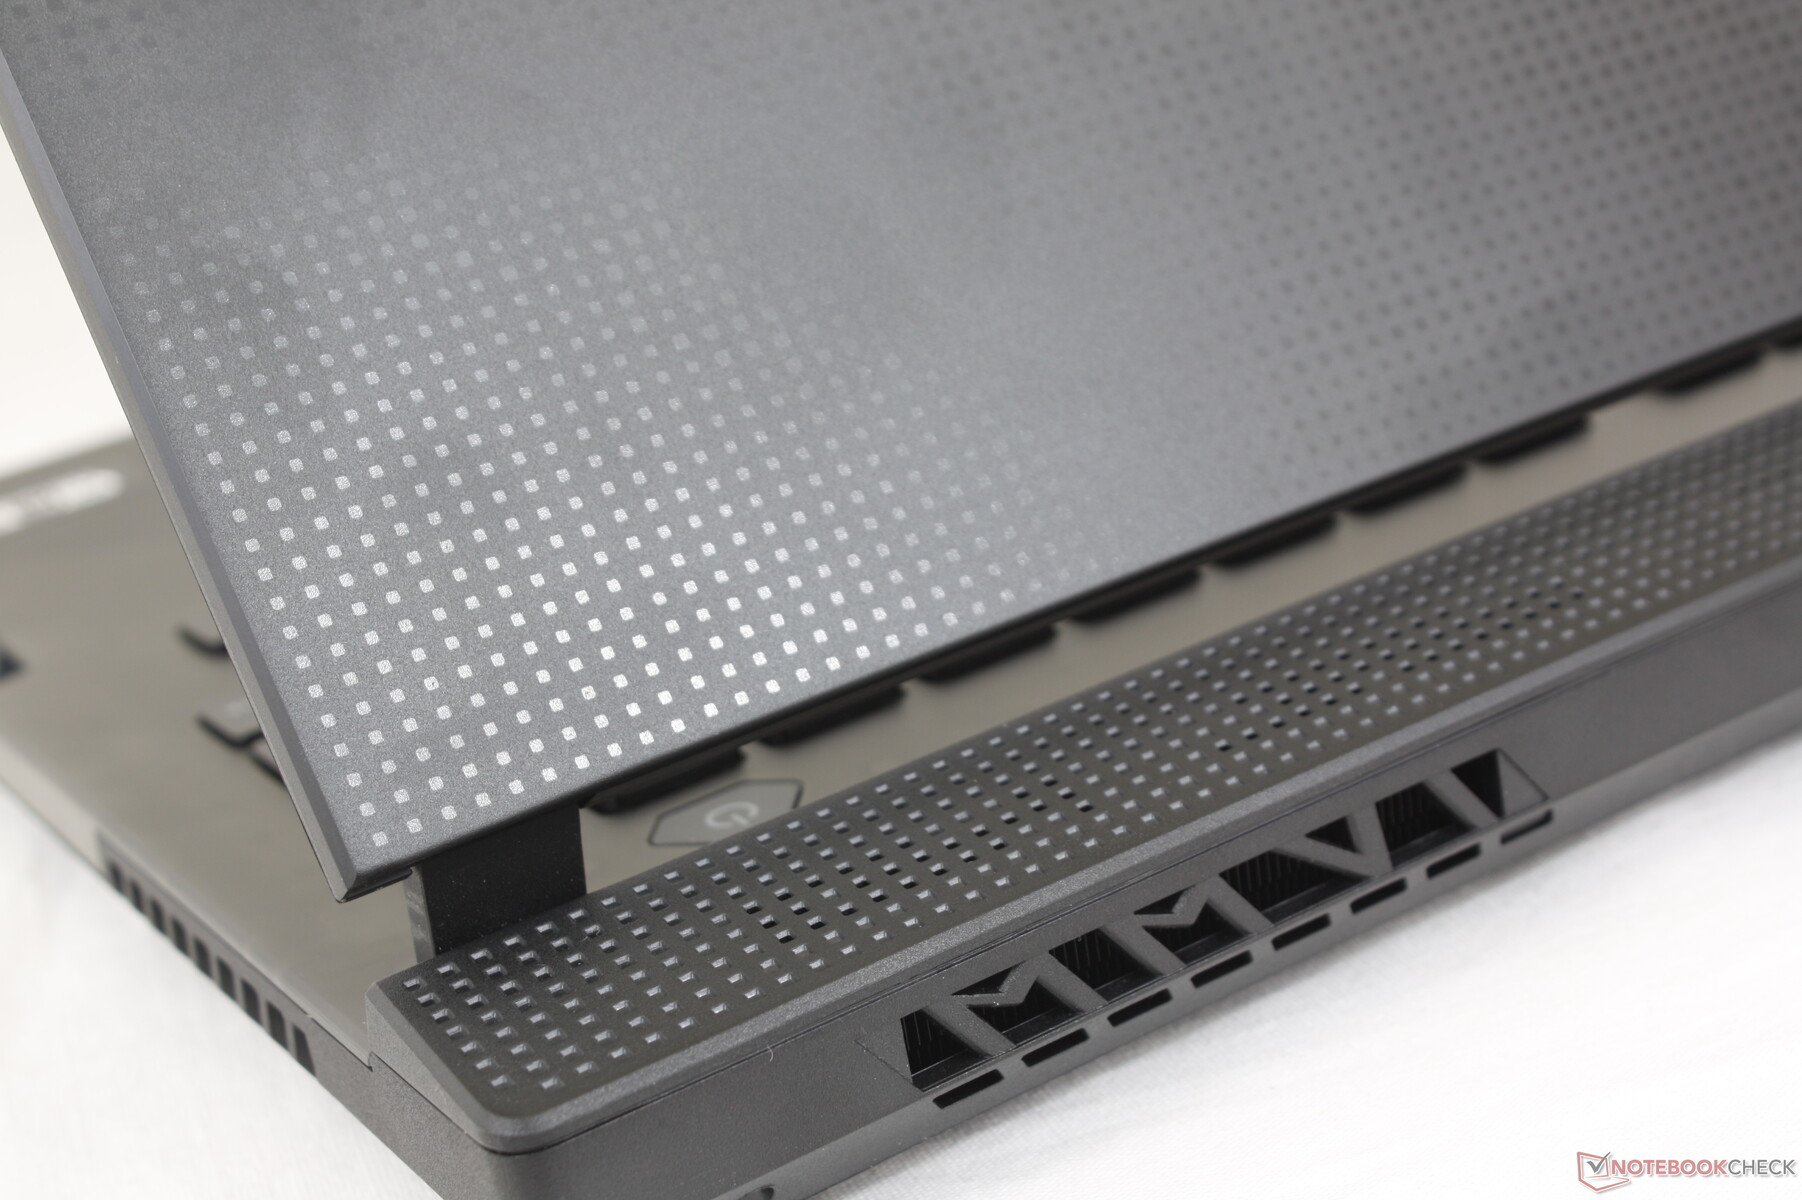
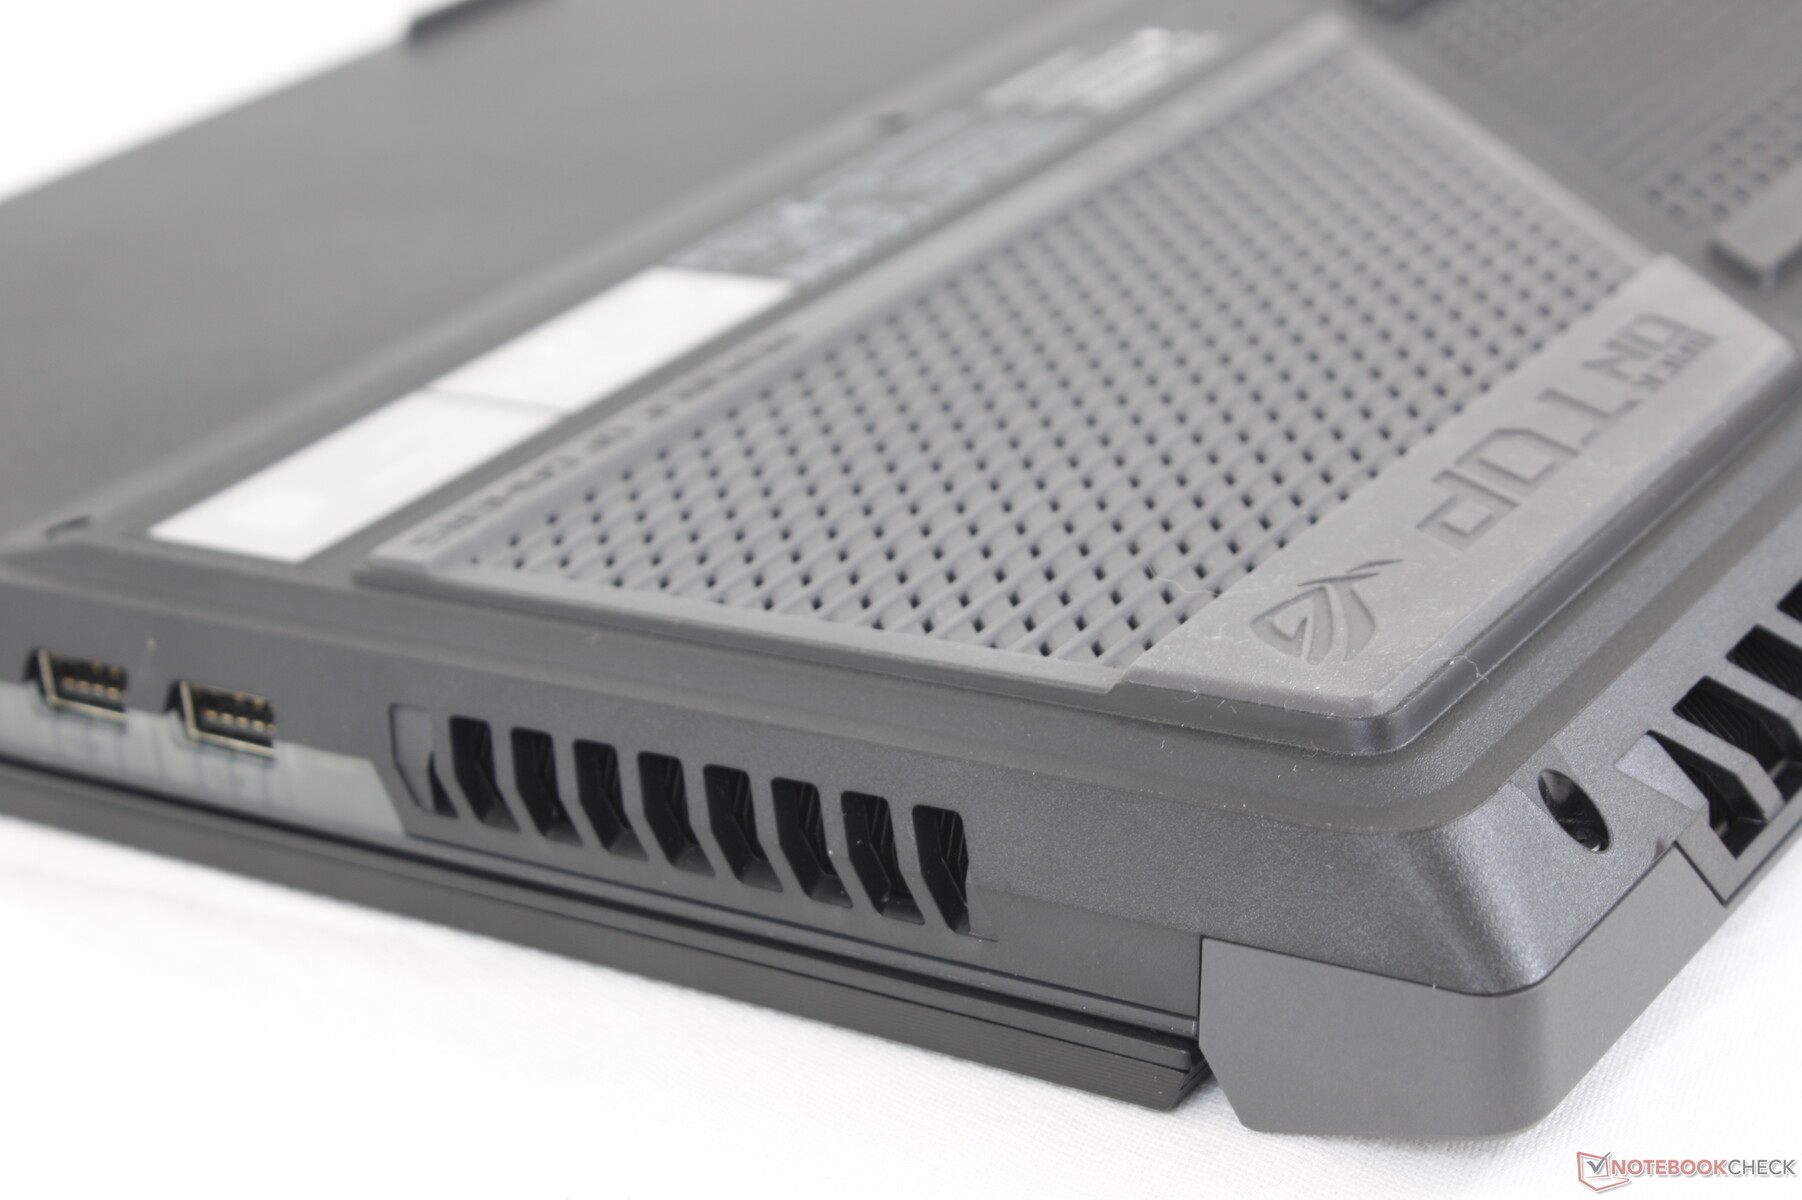
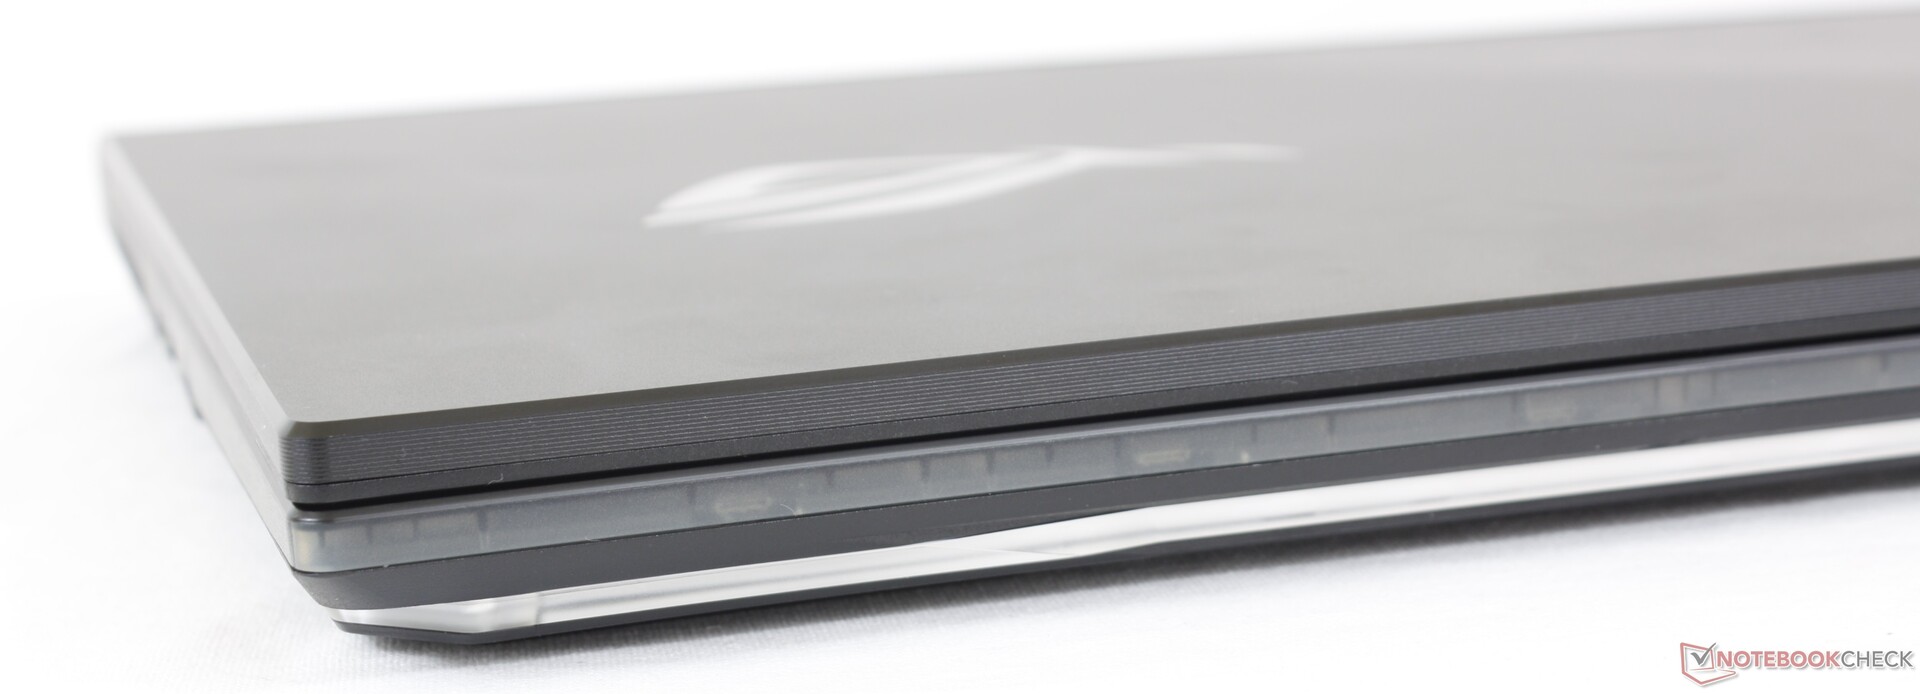
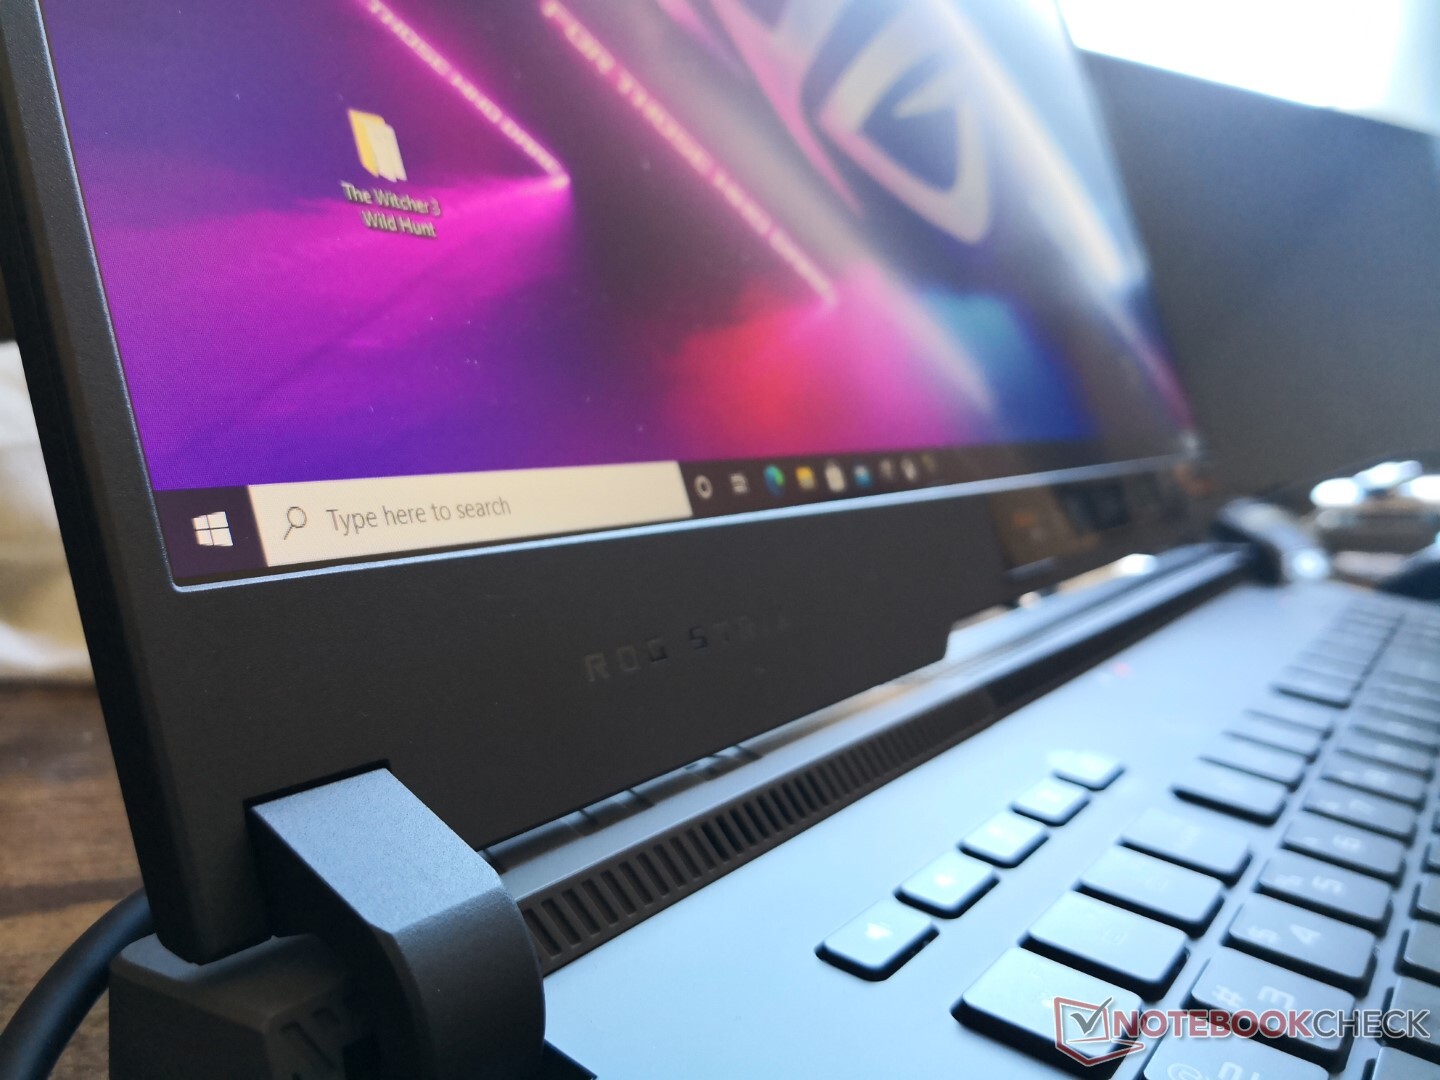
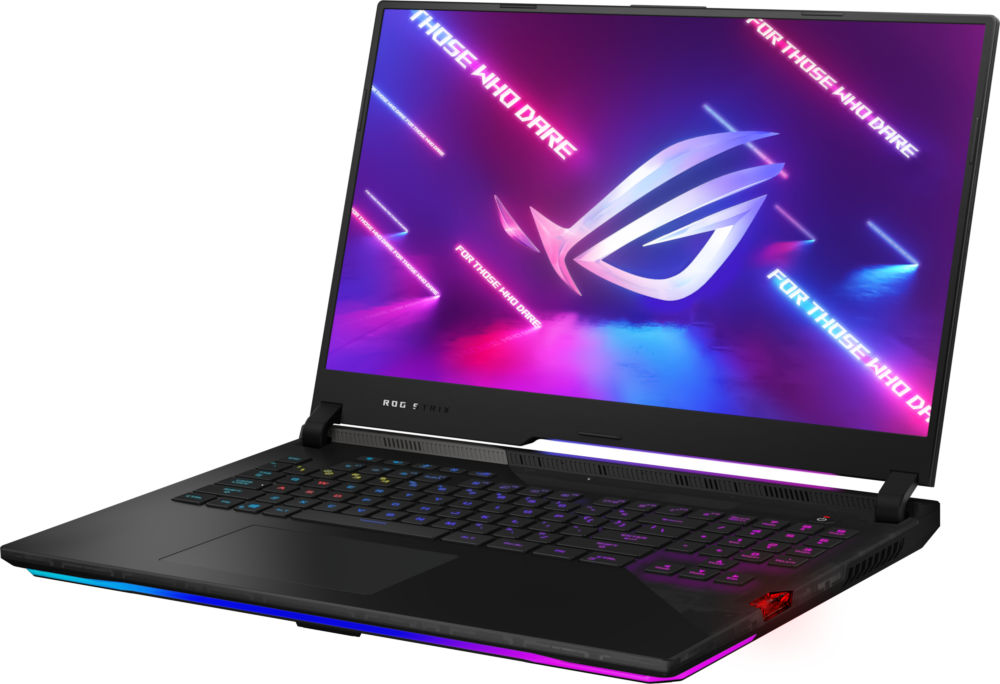
Asus ROG laptops are almost the opposite of Razer laptops in terms of aesthetic design. While Razer models tend to be flat and minimalist with no LED extremities, Asus models tend to look busier with all kinds of bumps and curves and LED RGB options. The G733 takes this one step further by incorporating translucency onto portions of its chassis so users can see a bit of the motherboard inside.
Chassis rigidity remains pretty much the same as on last year's G732 despite all the aesthetic changes. The base is fairly rigid, but it creaks slightly when opening the lid or twisting its corners. The lid also flexes more easily than the lids of the MSI GE76 or Razer Blade Pro.
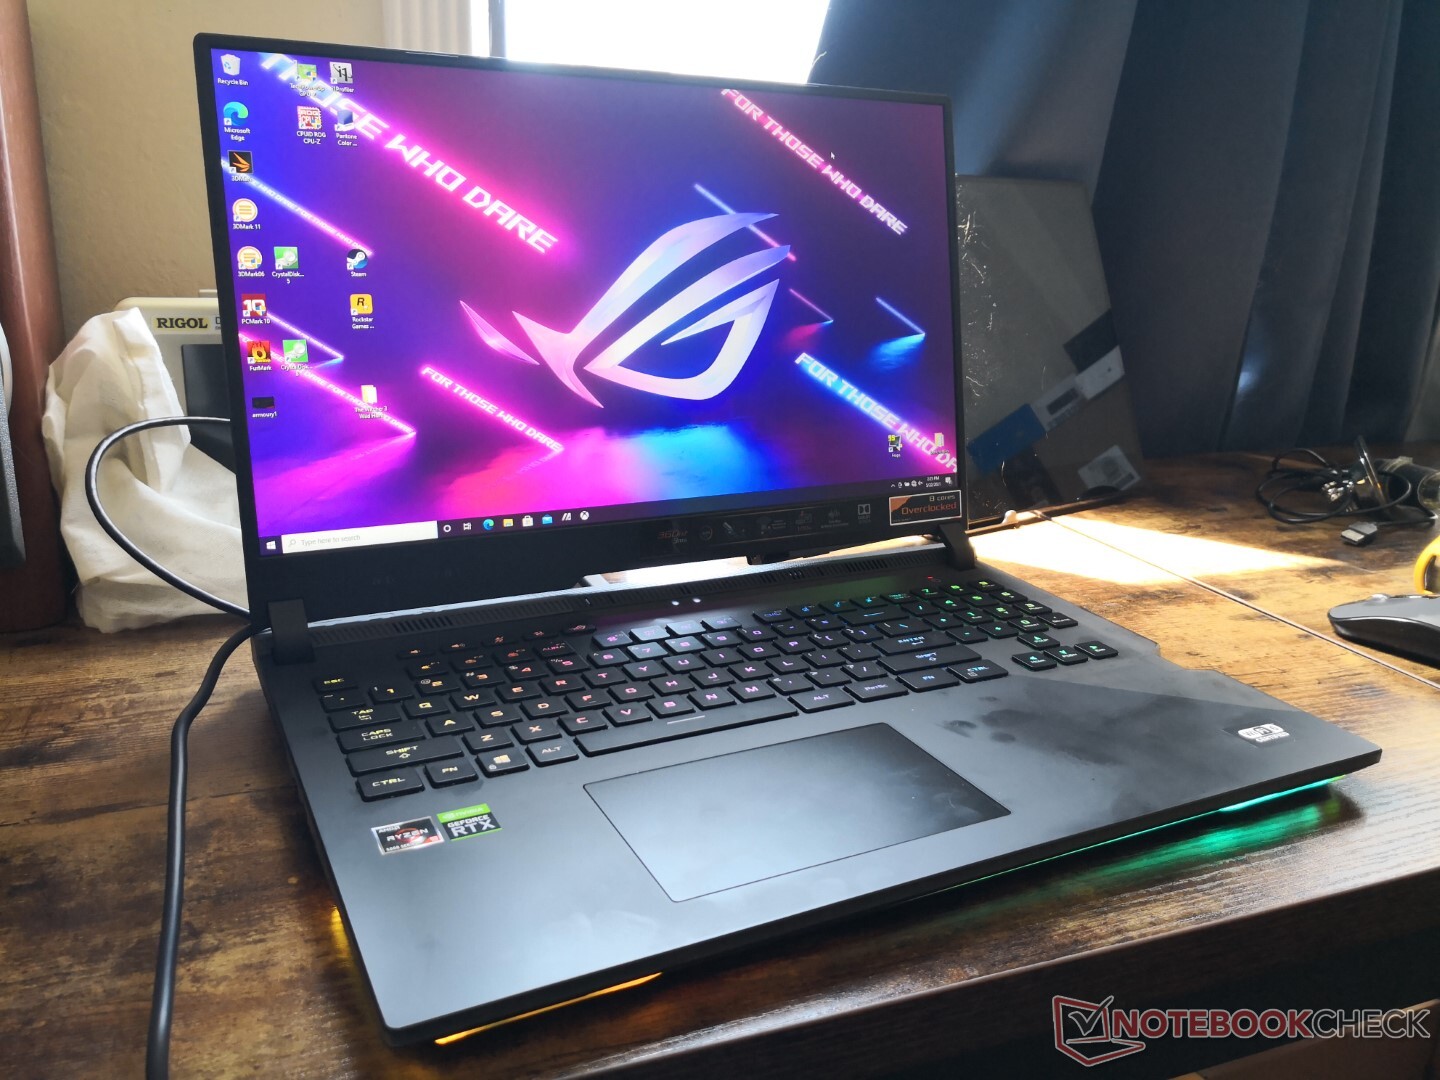
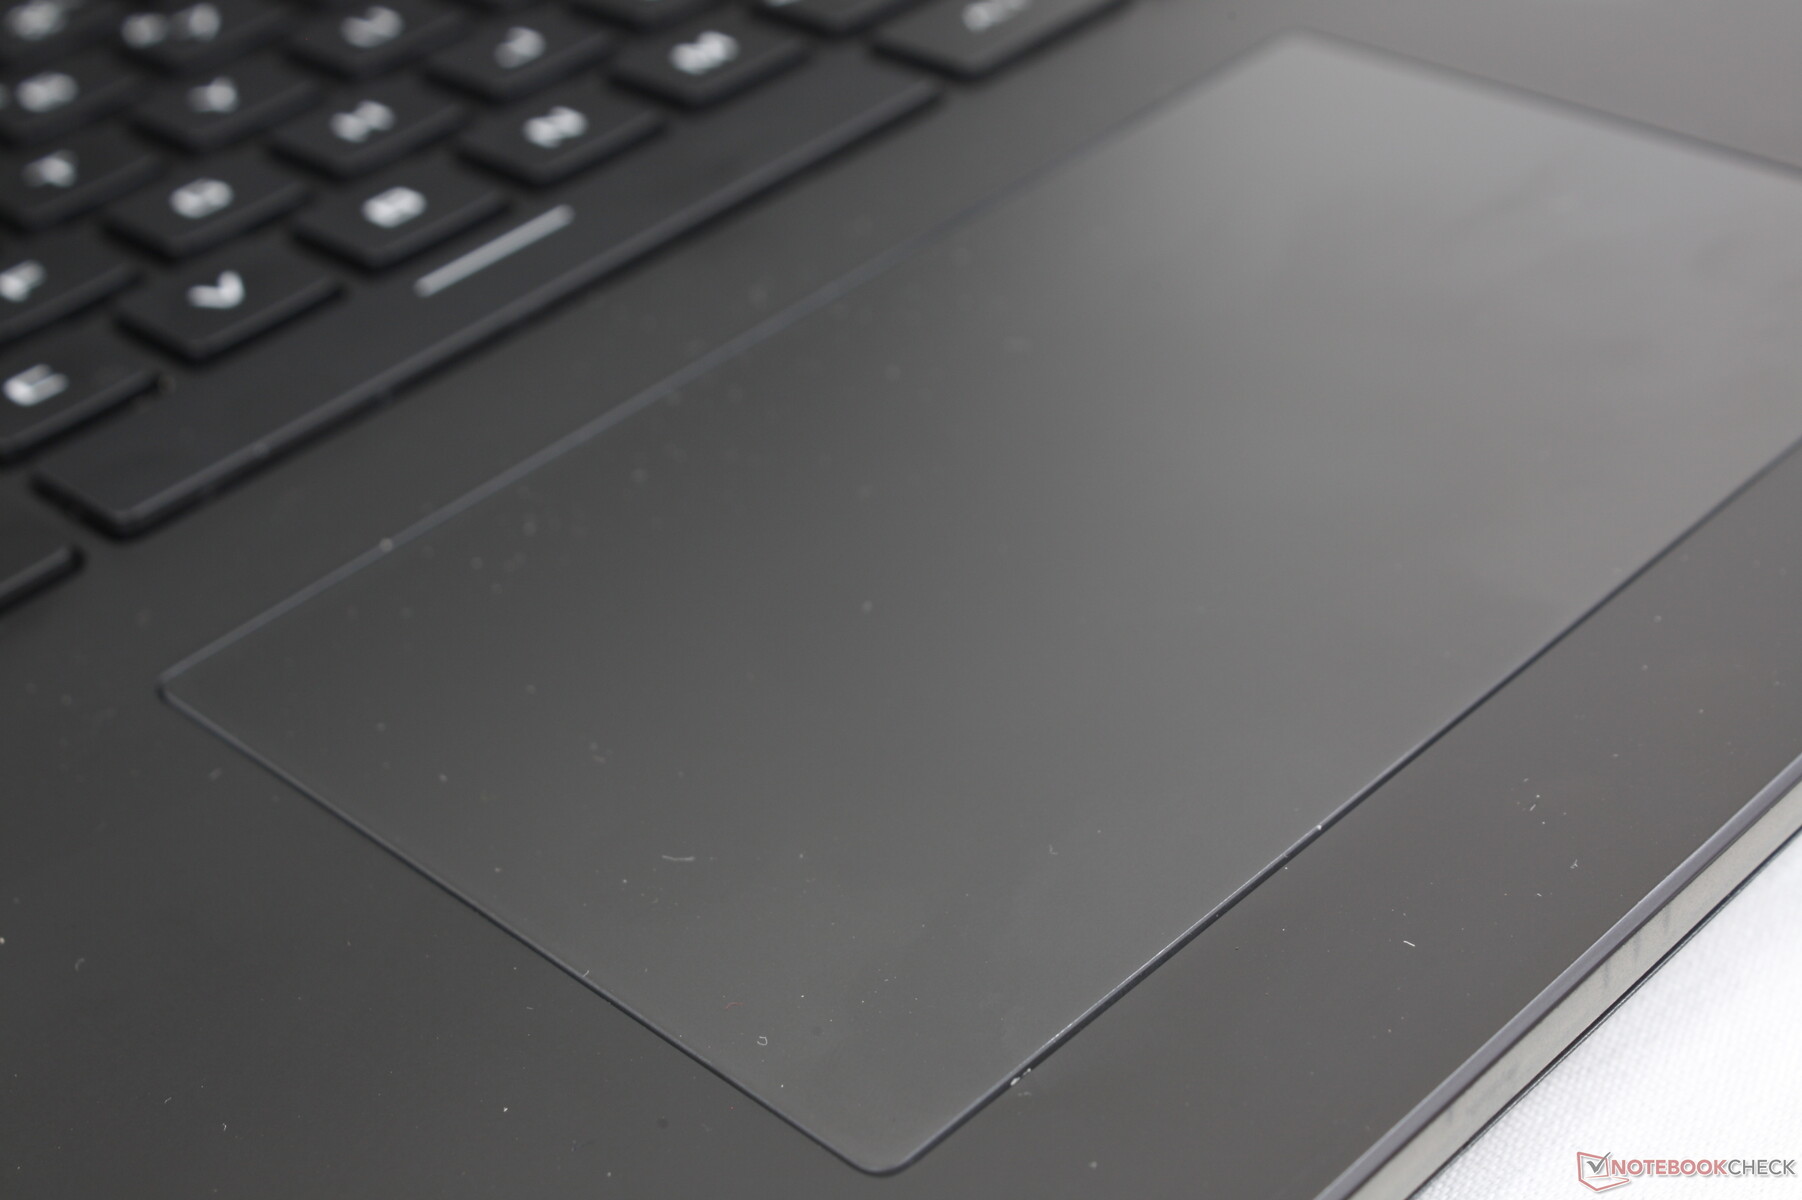
One of our biggest complaints about the case is that its surfaces, clickpad, and keys are huge fingerprint magnets as shown by the image below even after just a few days of use.
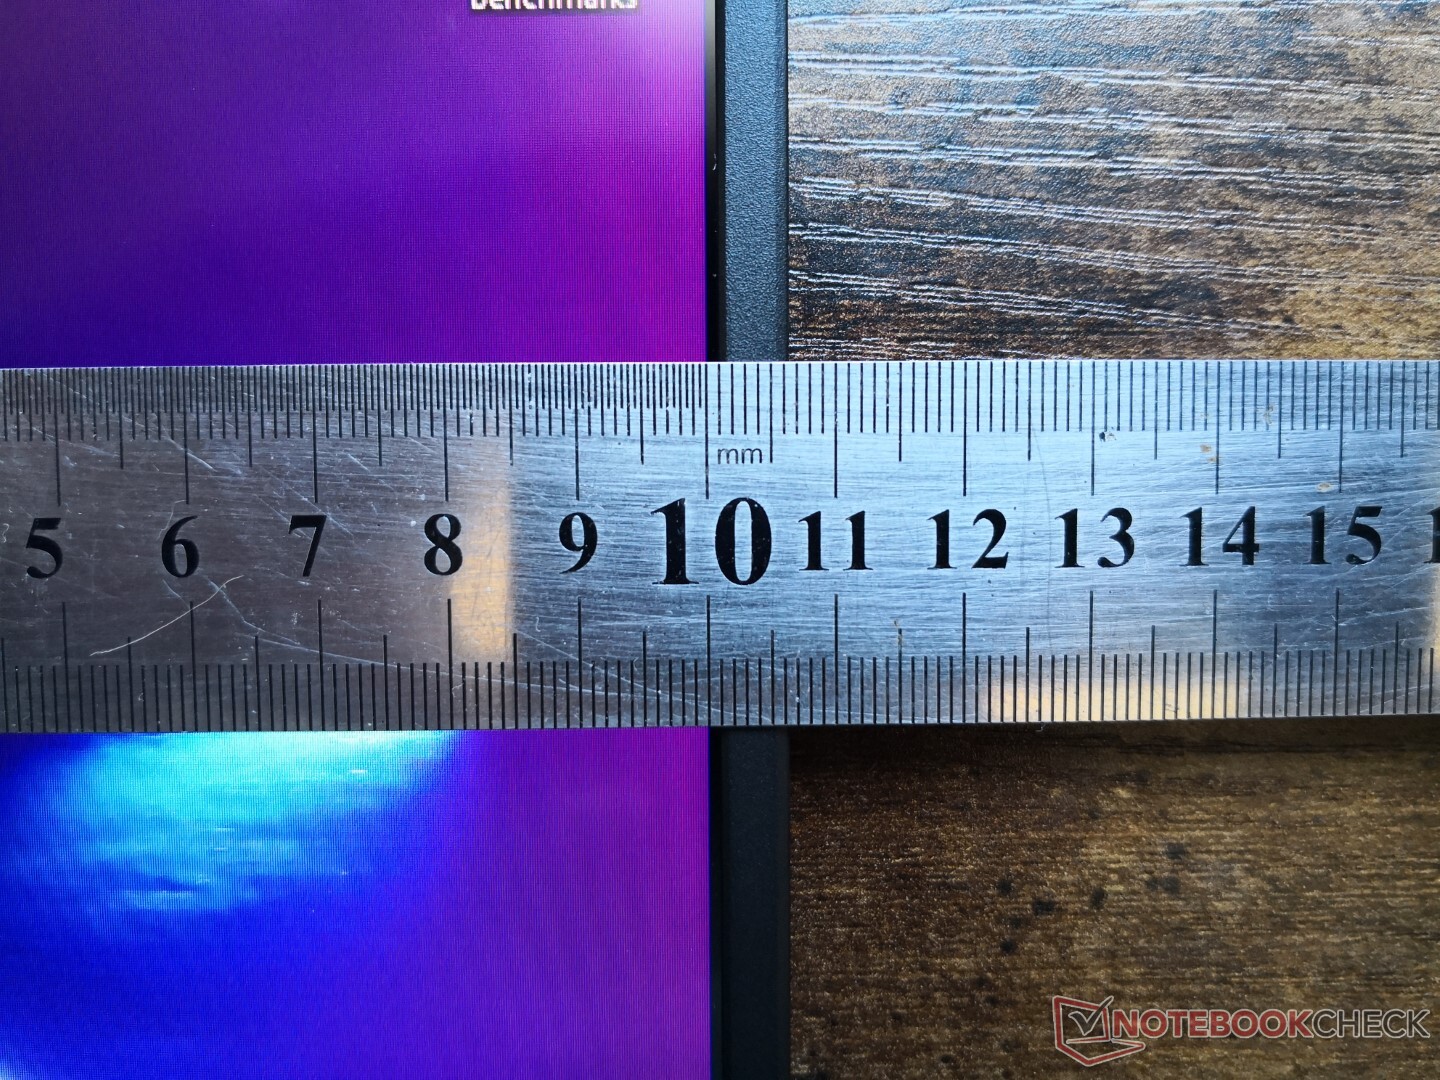
The chassis is slightly thicker than last year's G732 while being smaller in length and width. The competing MSI GE76, however, is both smaller and heavier than our G733 to be the denser laptop. Overall size and weight sit comfortably in between the Zephyrus S series and larger G703 series.
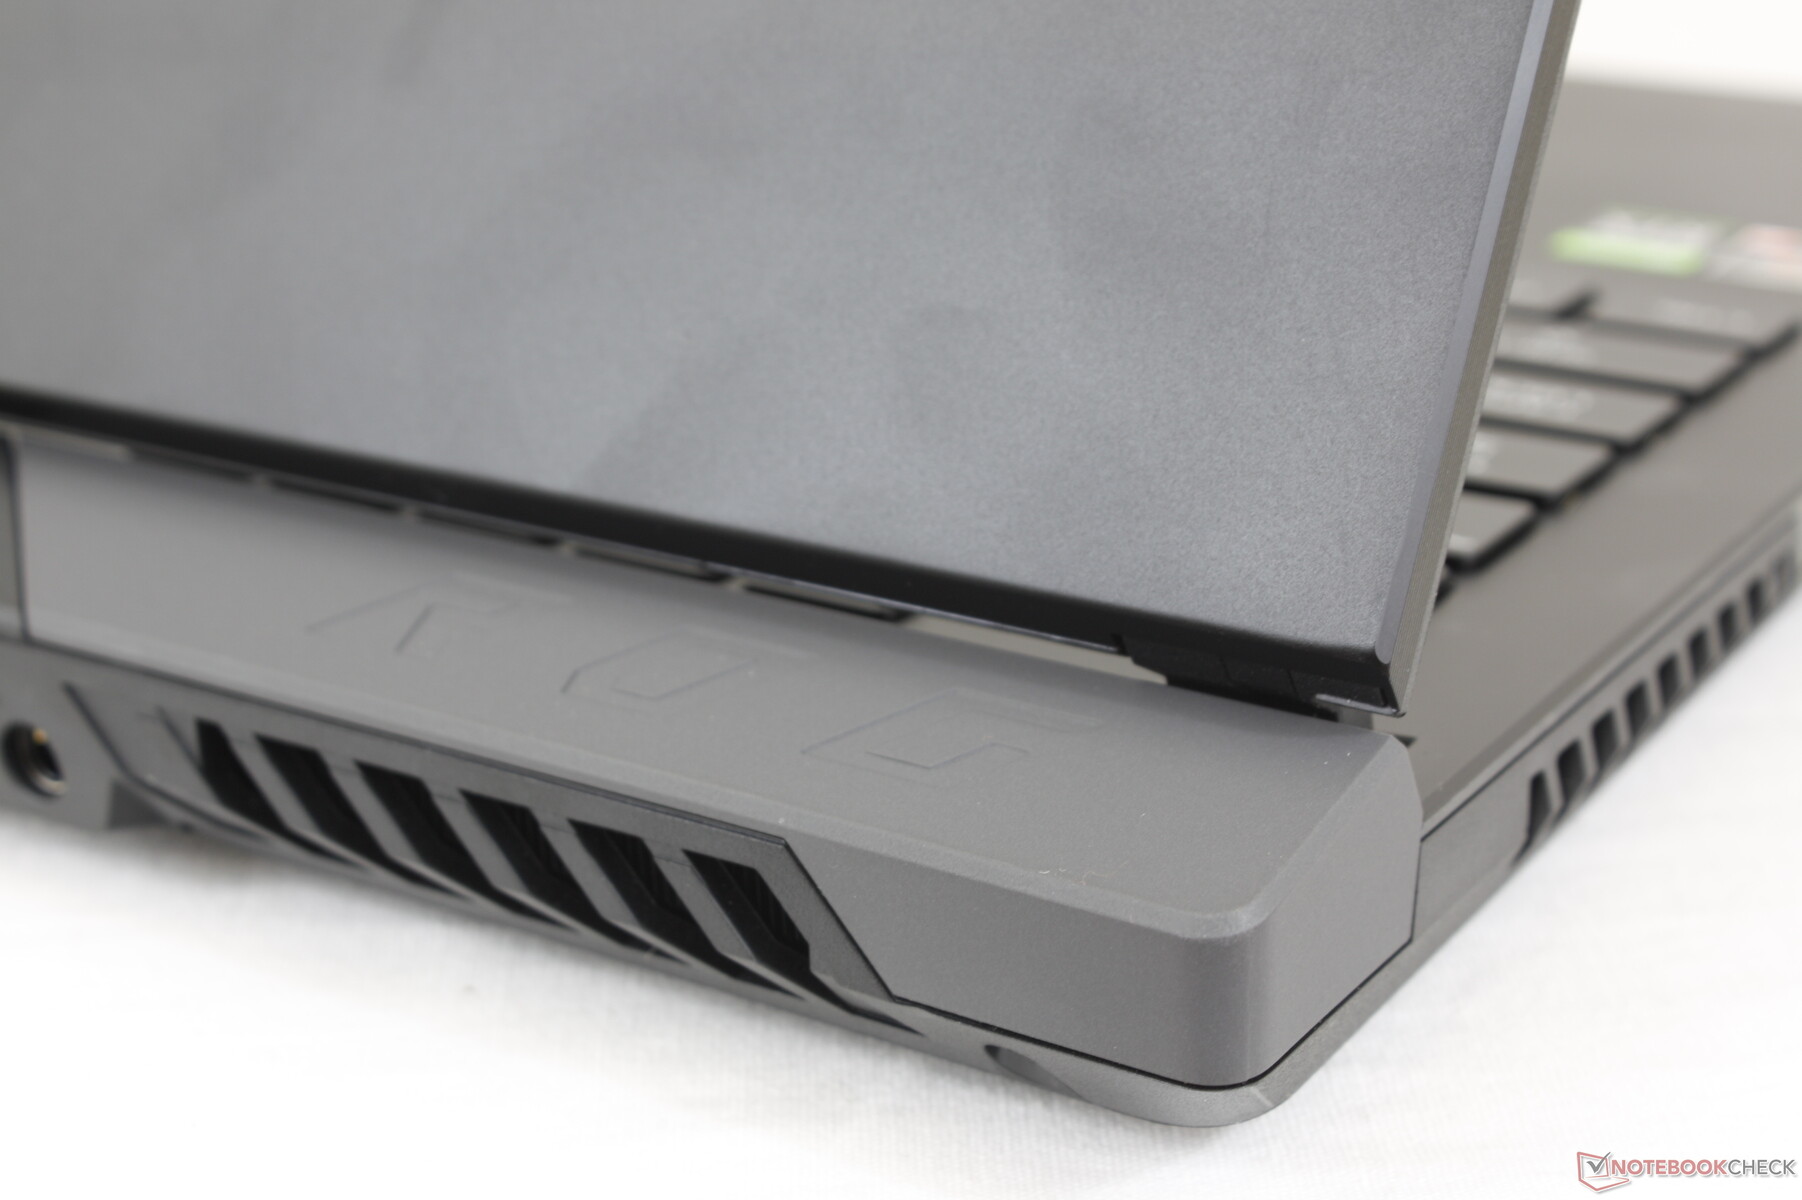
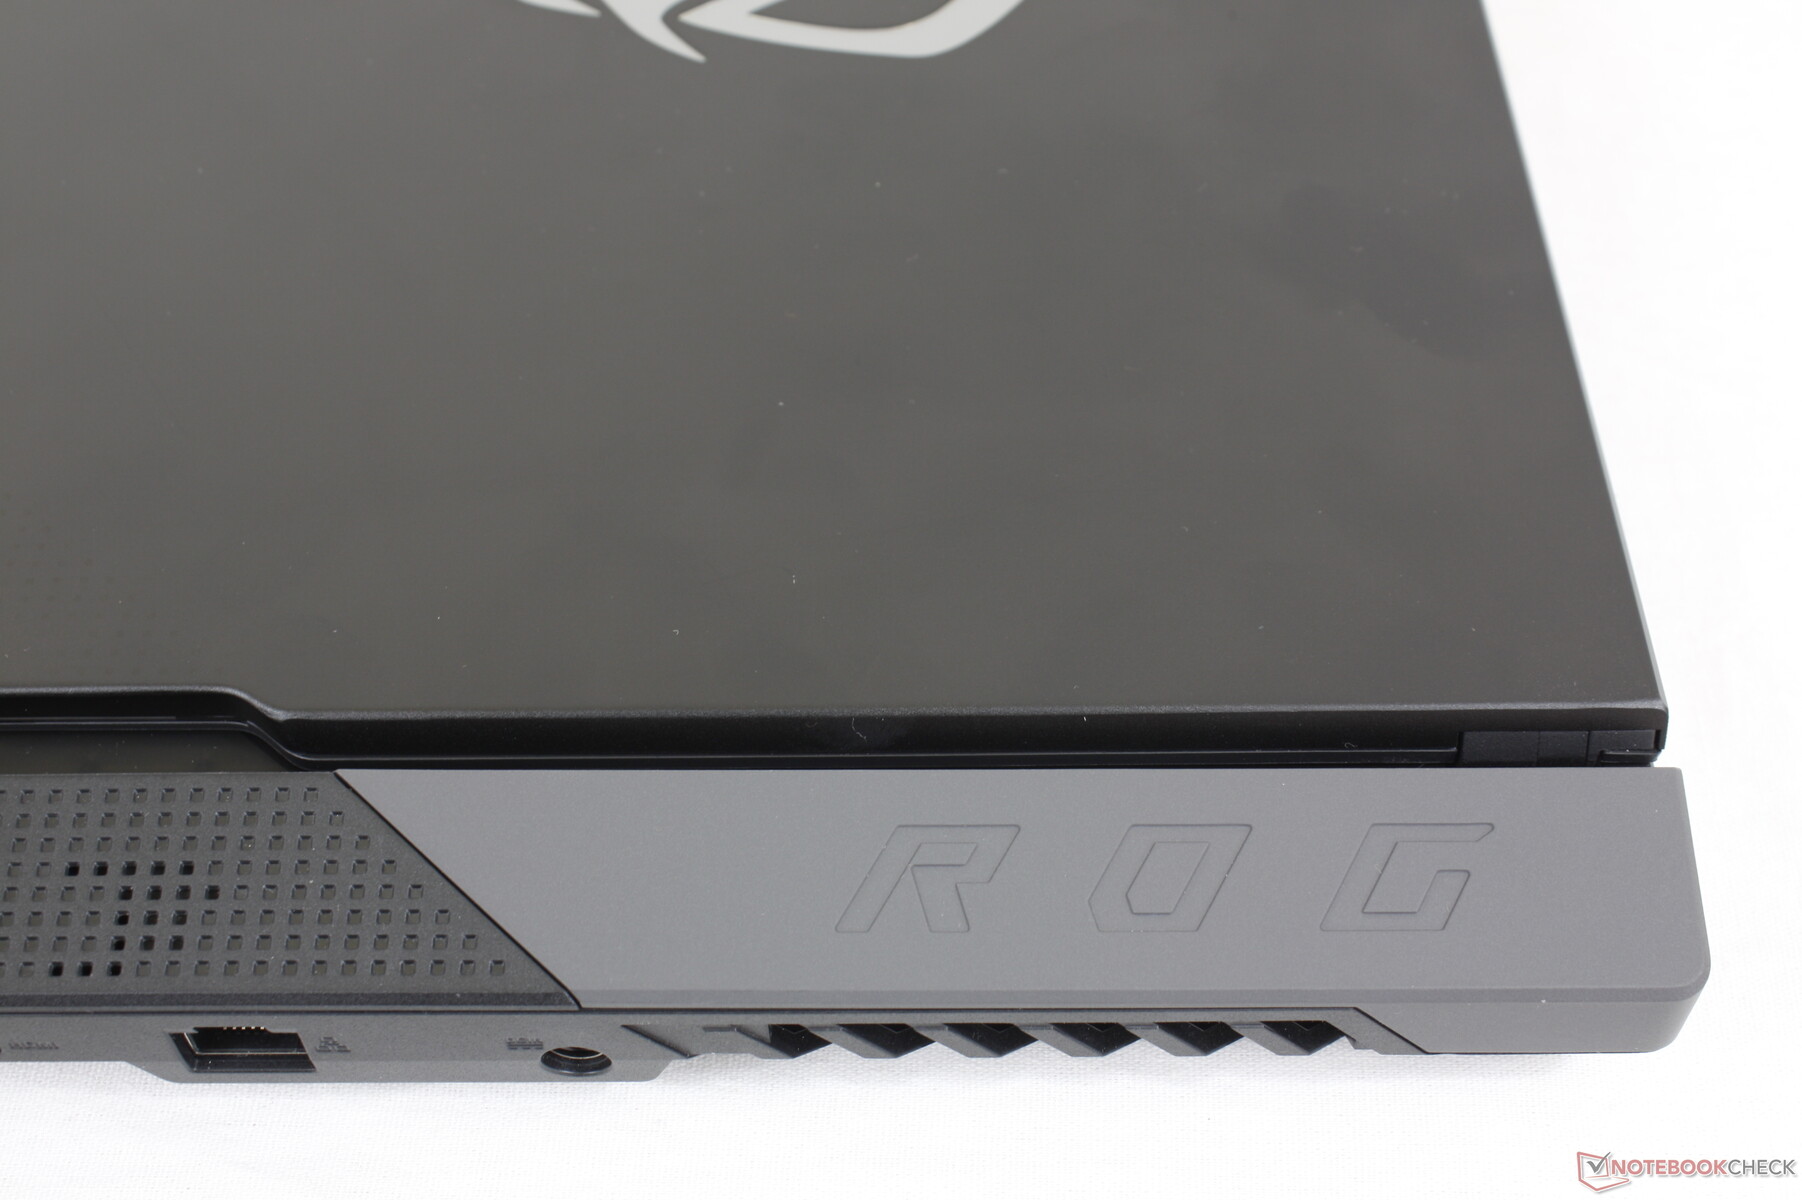
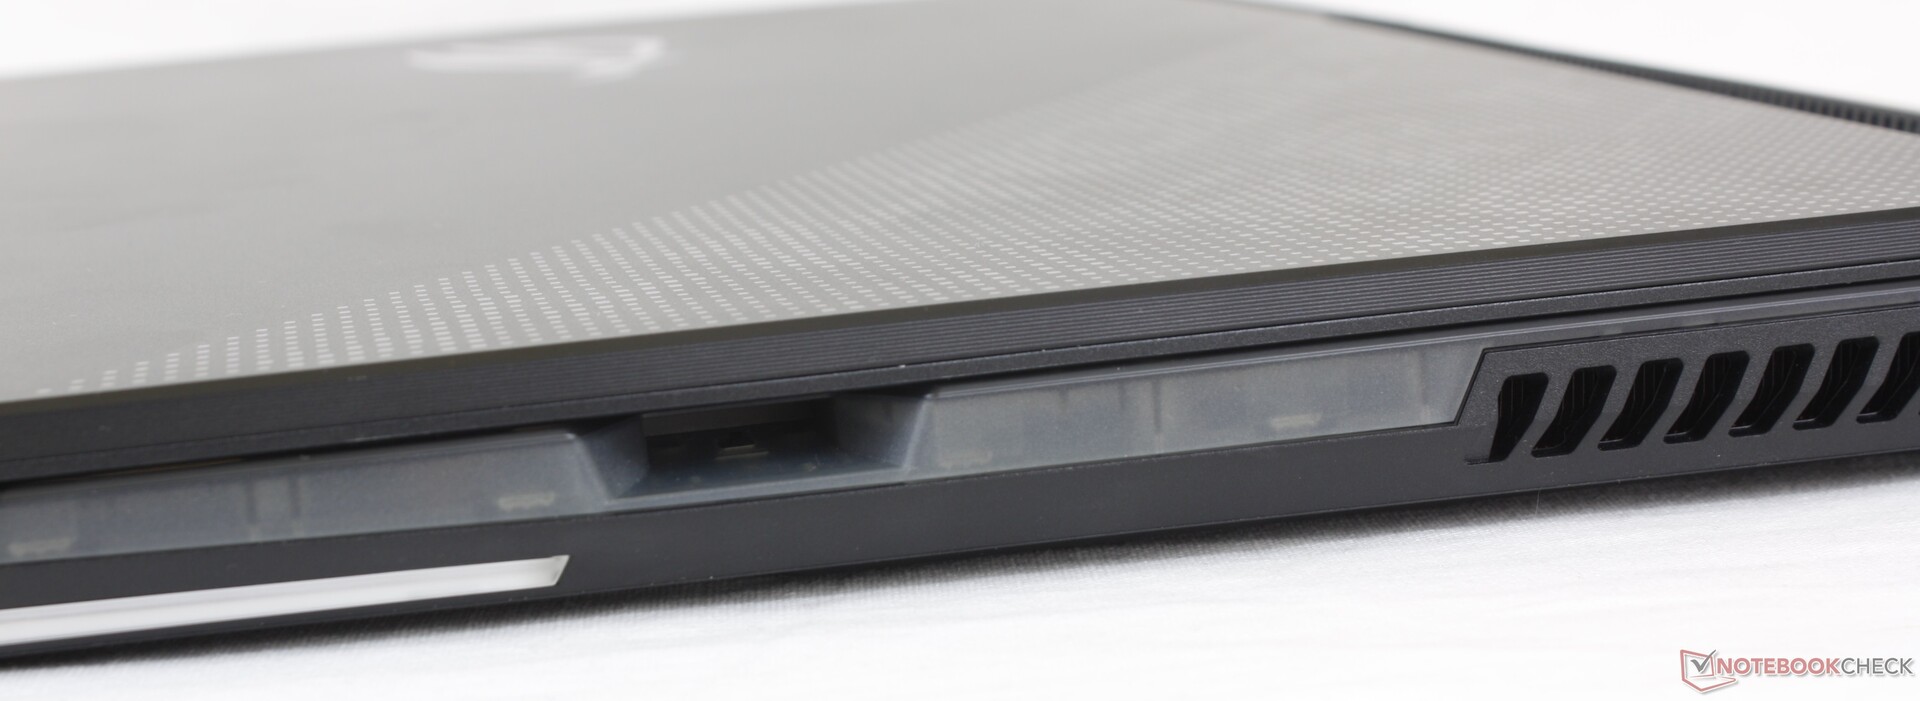
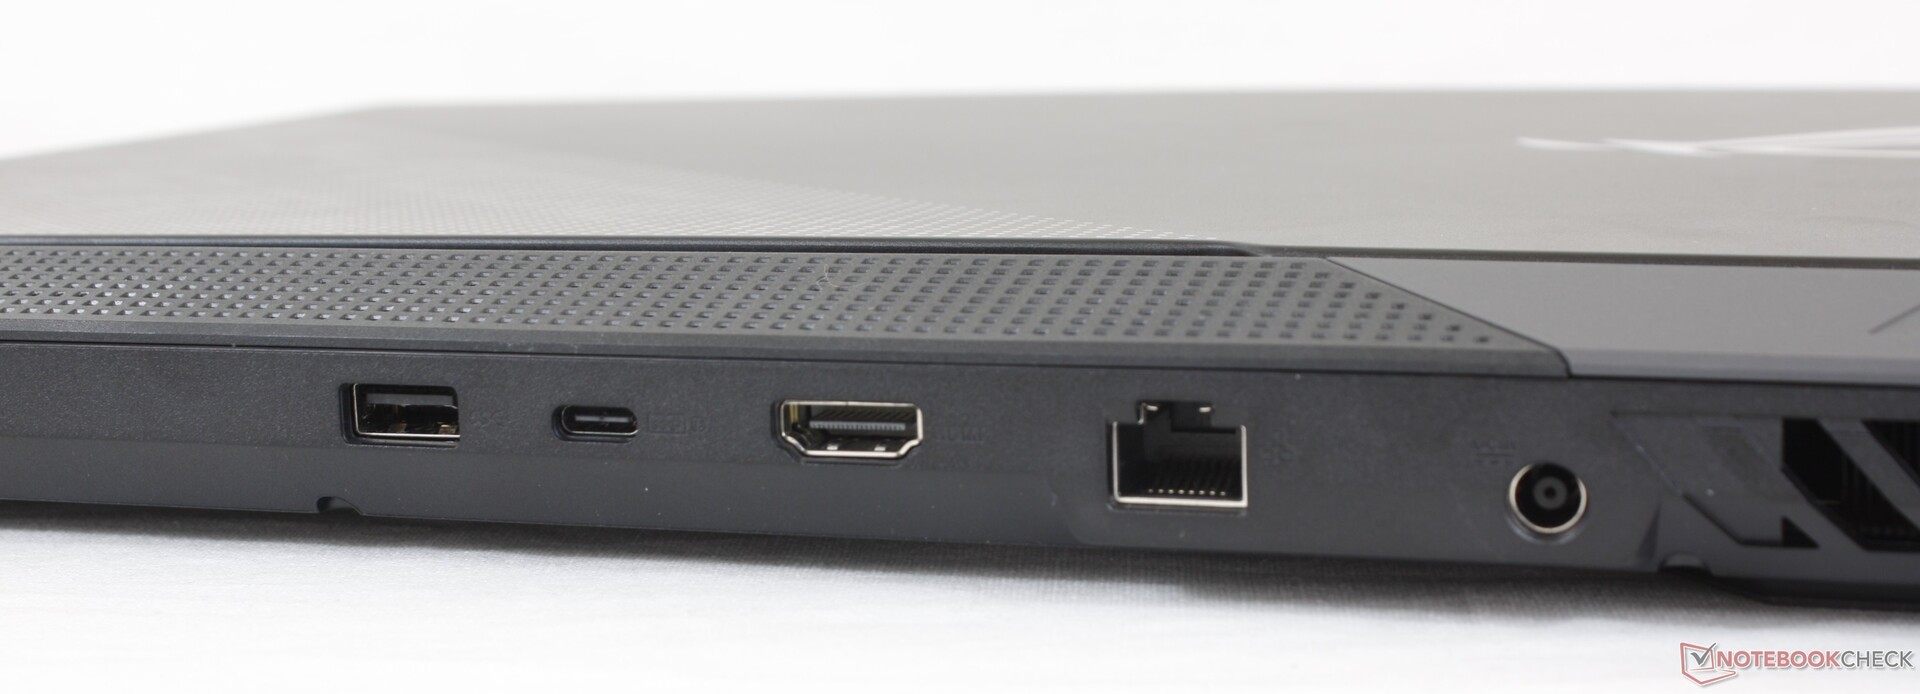
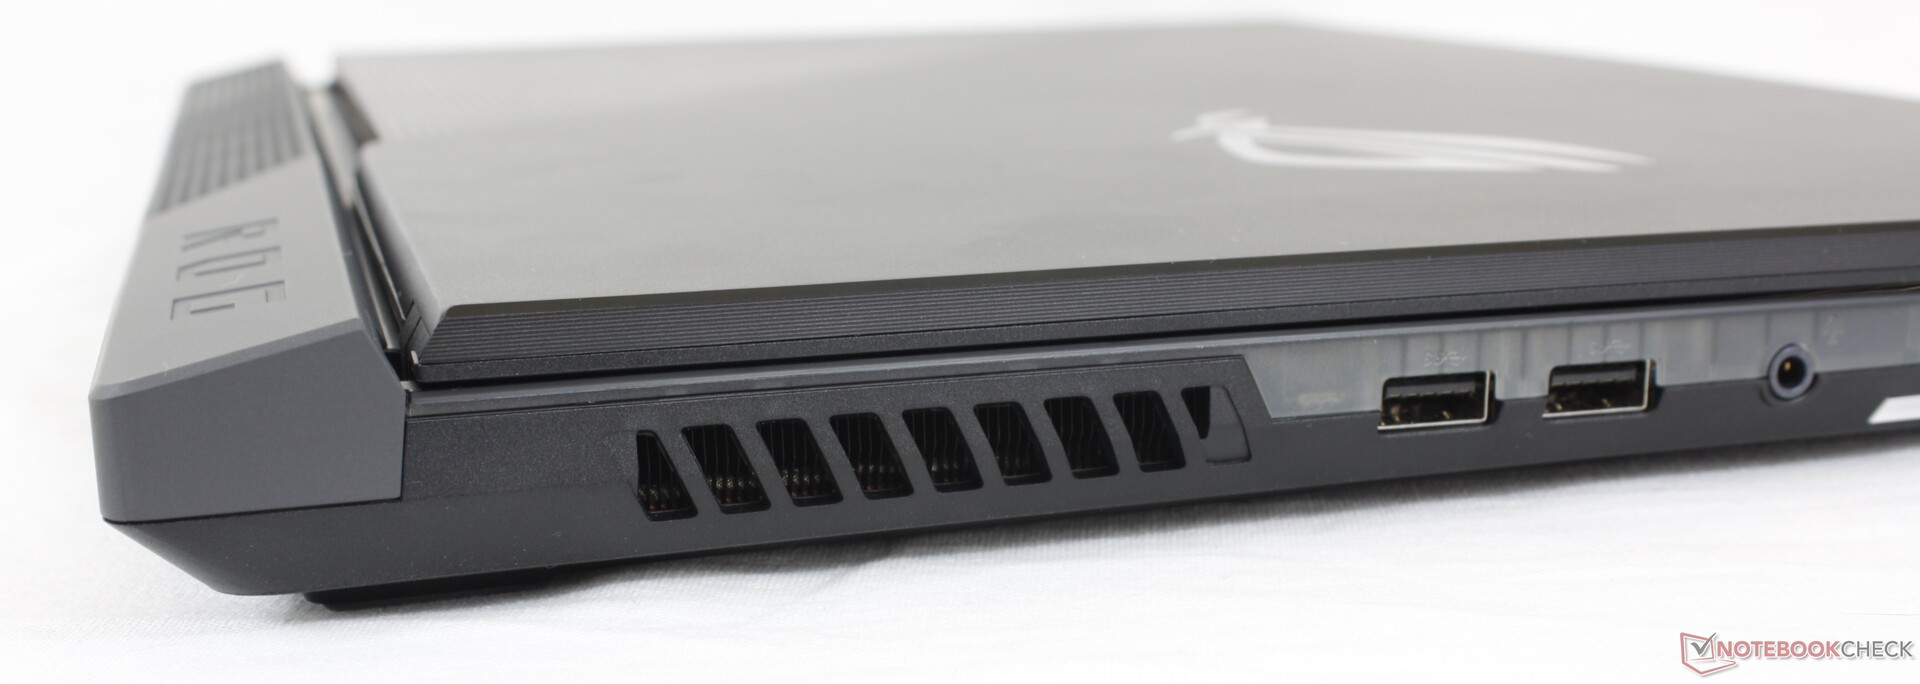
Connectivity
Port options haven't changed from last year's ROG Strix Scar 17 G732LXS including the lack of Thunderbolt support. We would have liked an integrated SD card reader or at least an additional USB-C port. Most of the ports are also along the rear of the system which can be annoying to reach.
Communication
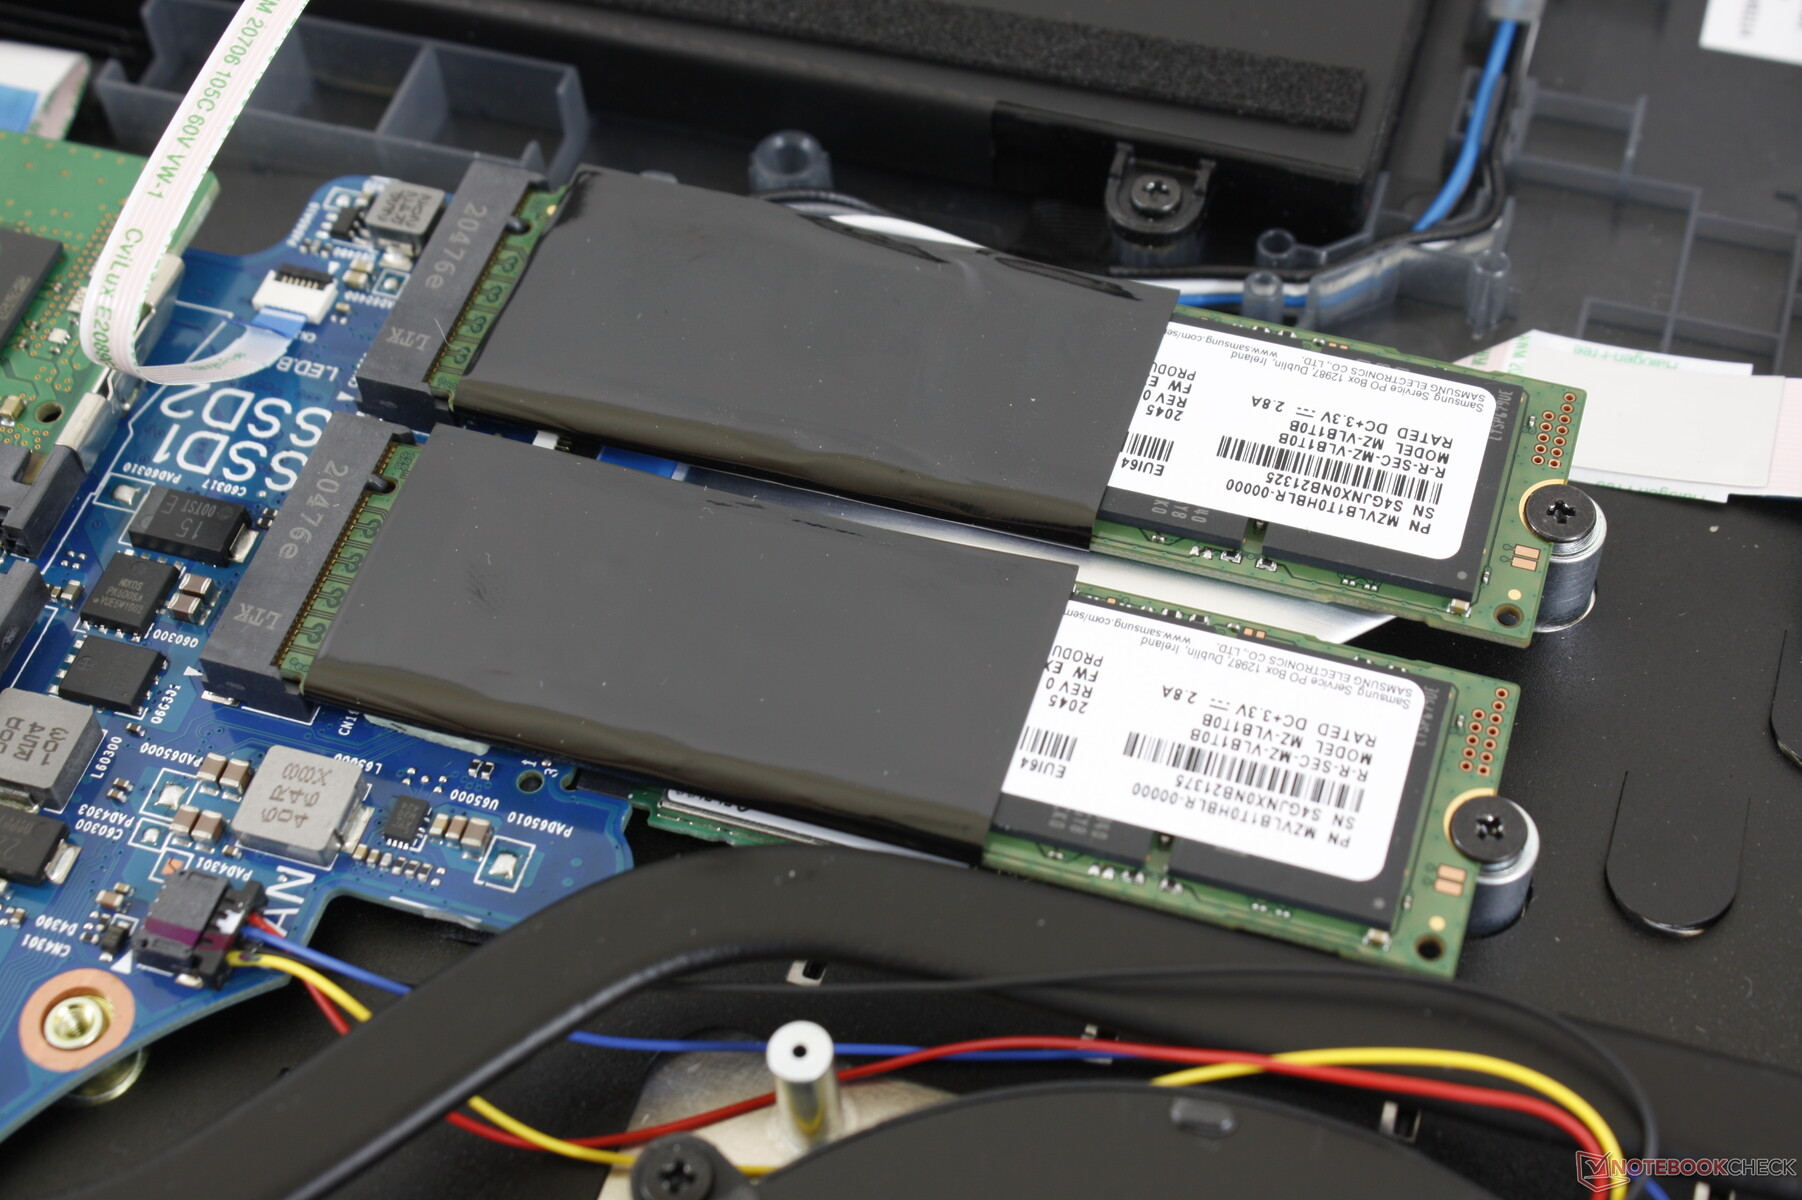
Maintenance
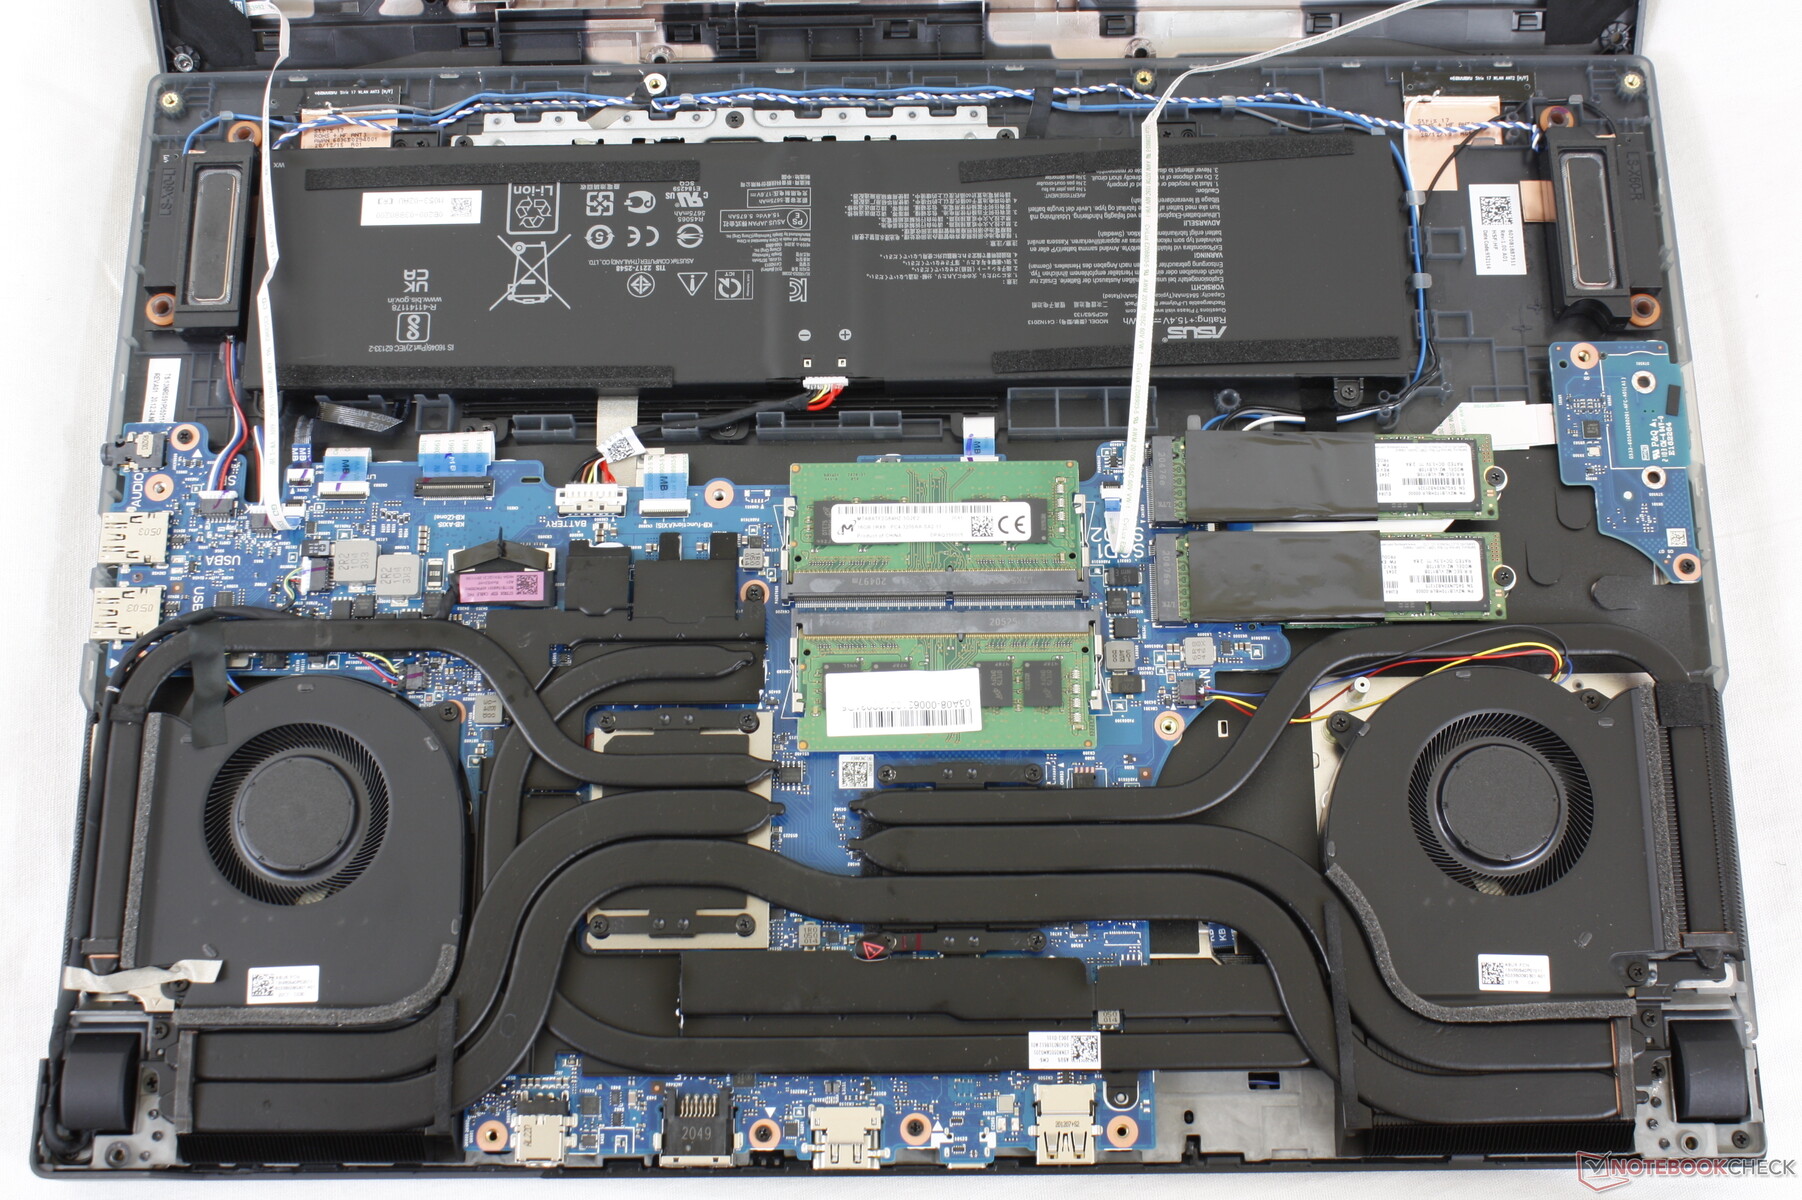
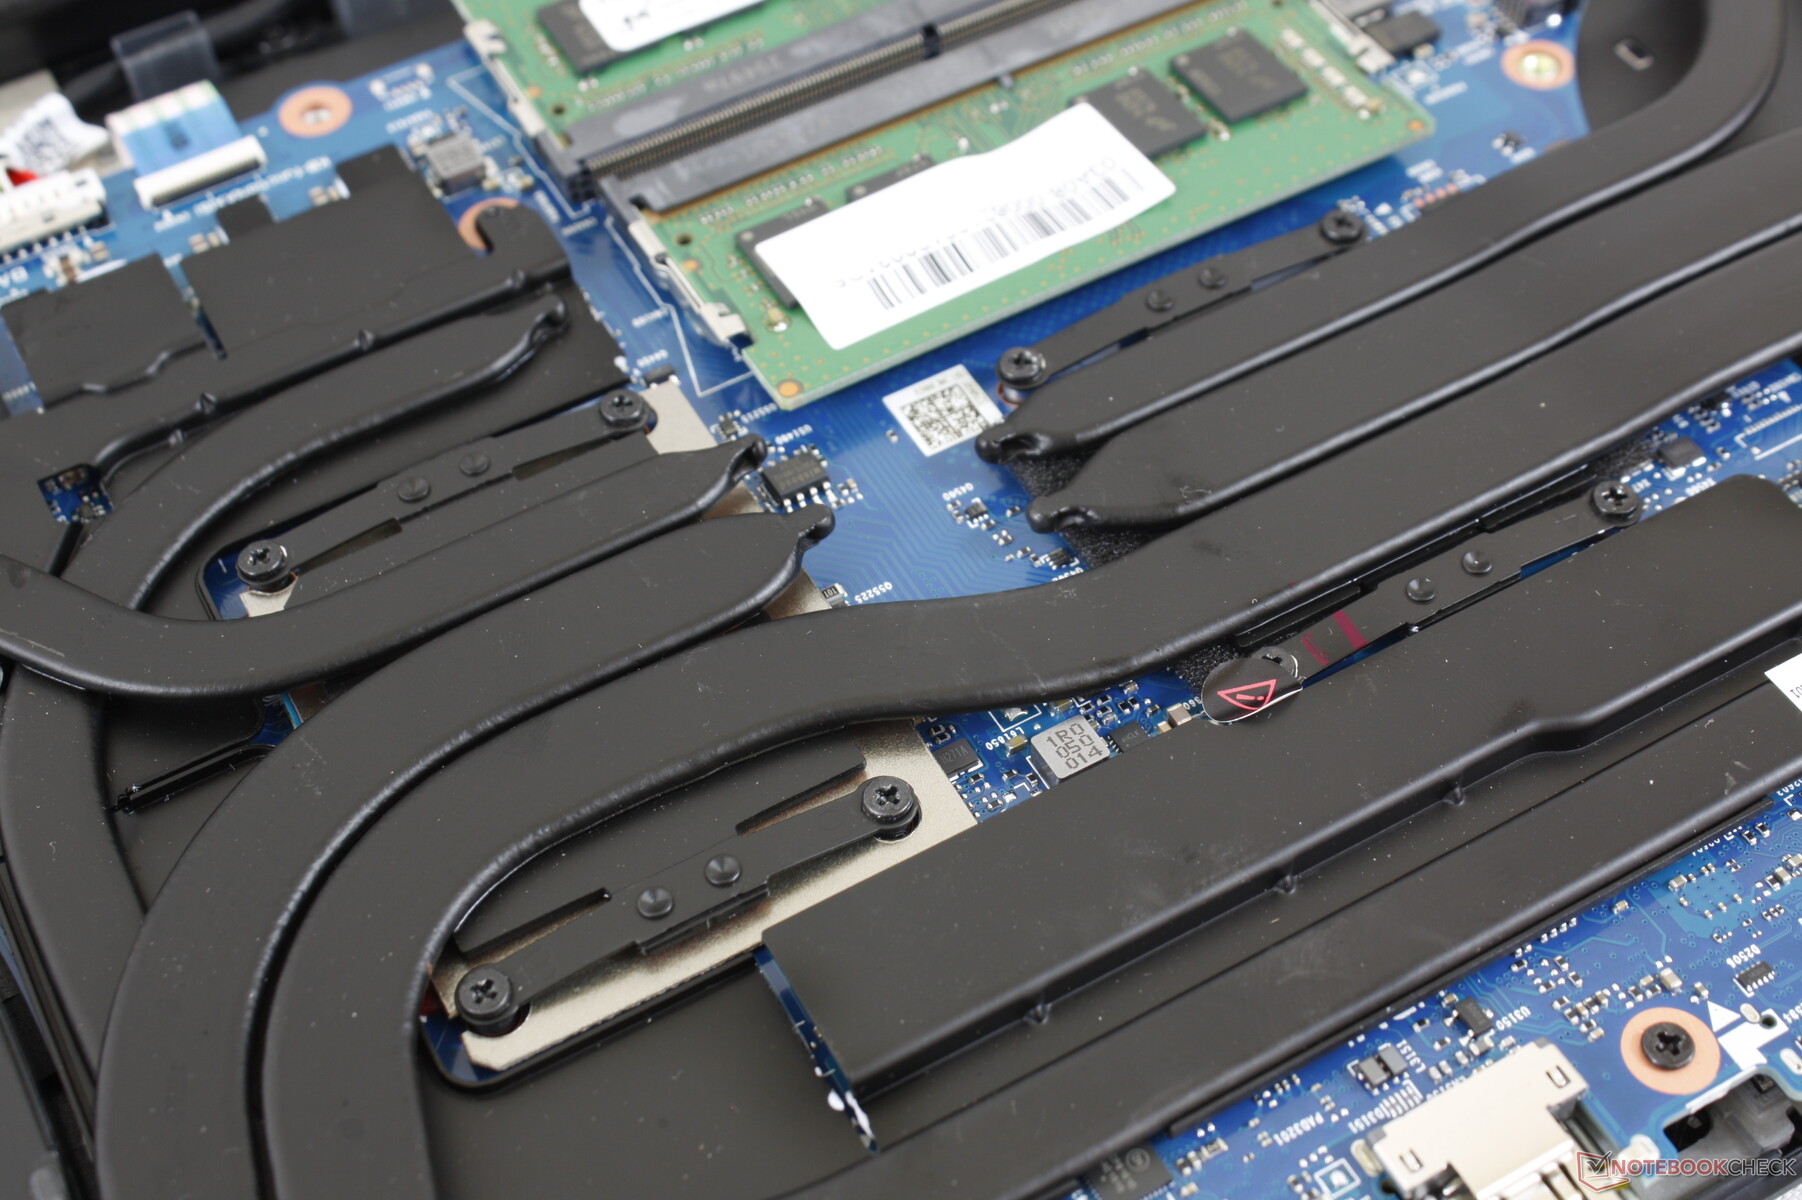
The bottom panel is secured by 11 accessible Philips screws. Its edges and corners are tricky to detach, however, and so a flat edge like a credit card is highly recommended. The panel is connected to the base via two ribbon cables since it houses customizable LEDs unlike on most other laptops.
Accessories and Warranty
The retail box includes two additional removable "ROG" pieces that go on the rear corner of the chassis plus a Keystone and carabiner.
The standard one-year limited manufacturer warranty applies.
Input Devices
Keyboard
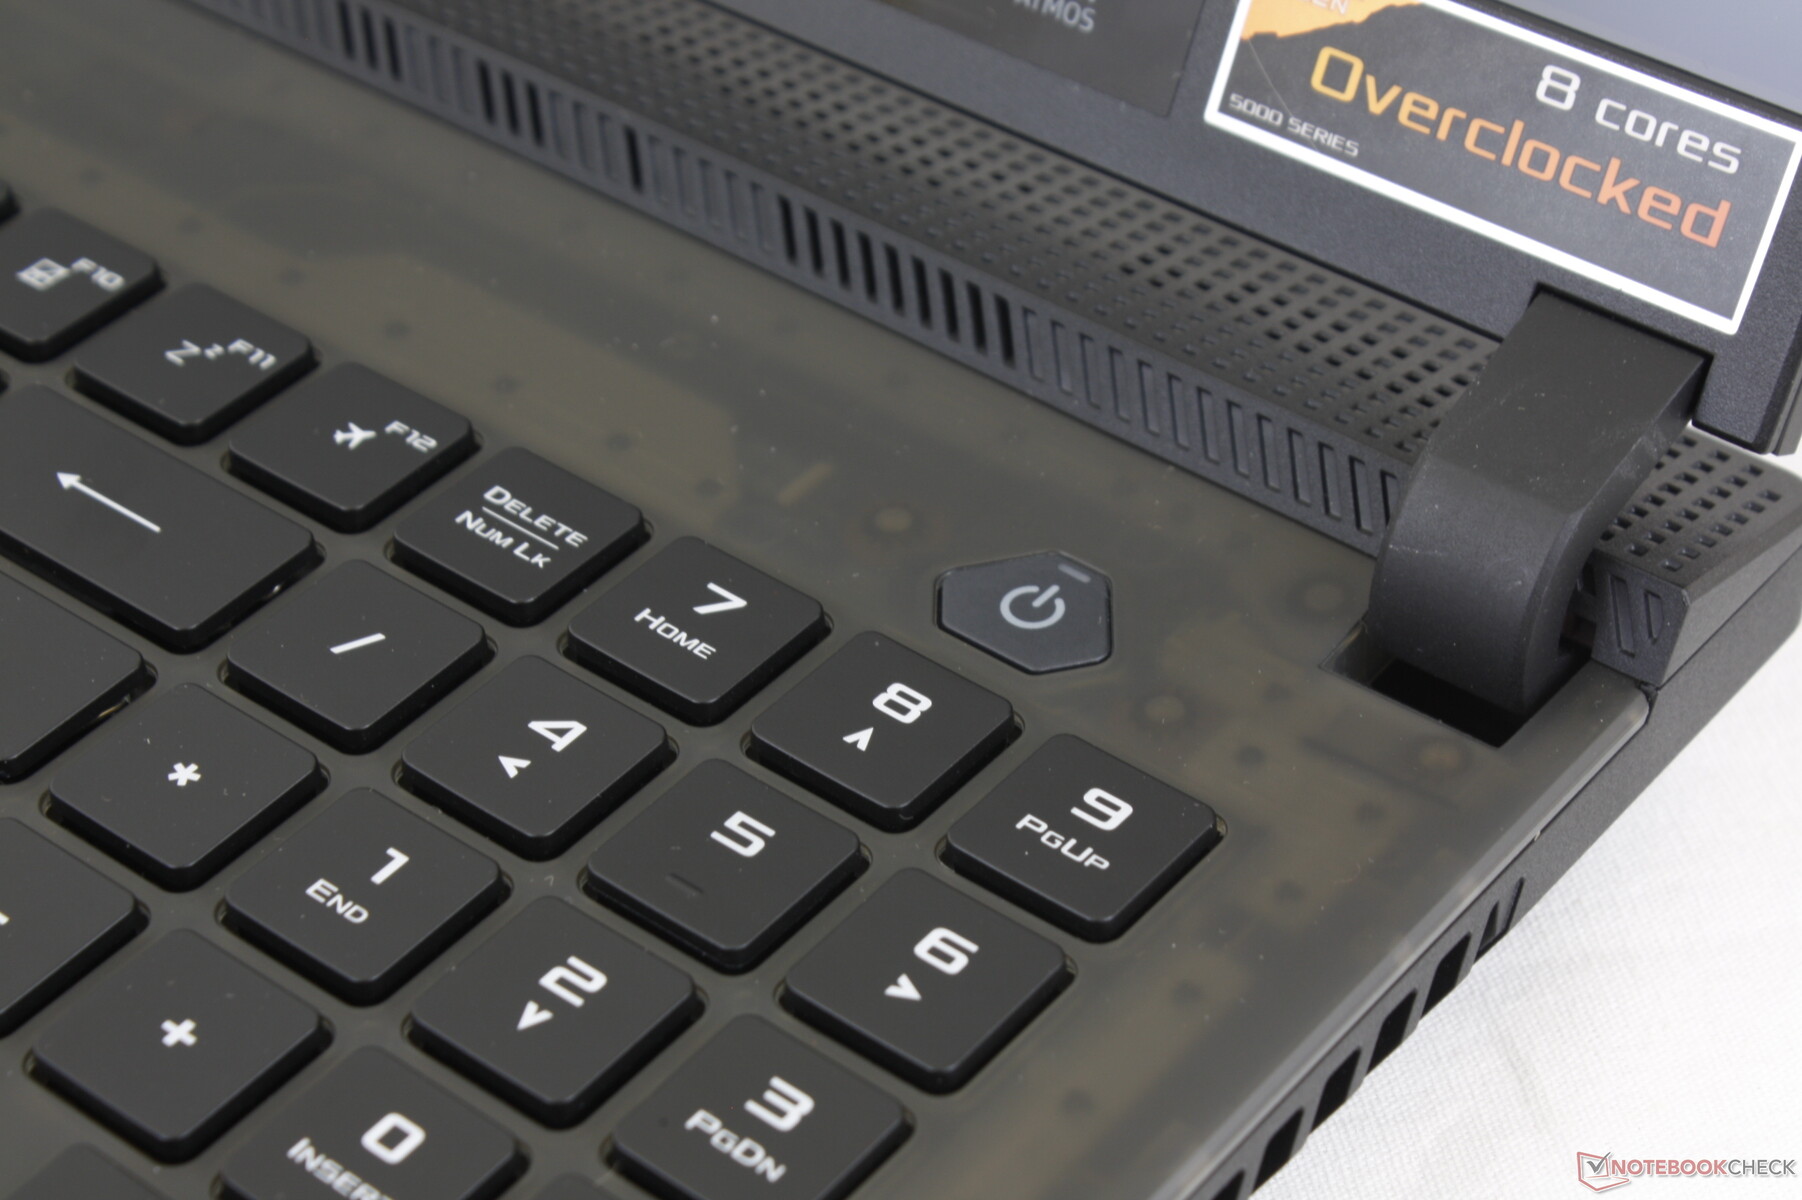
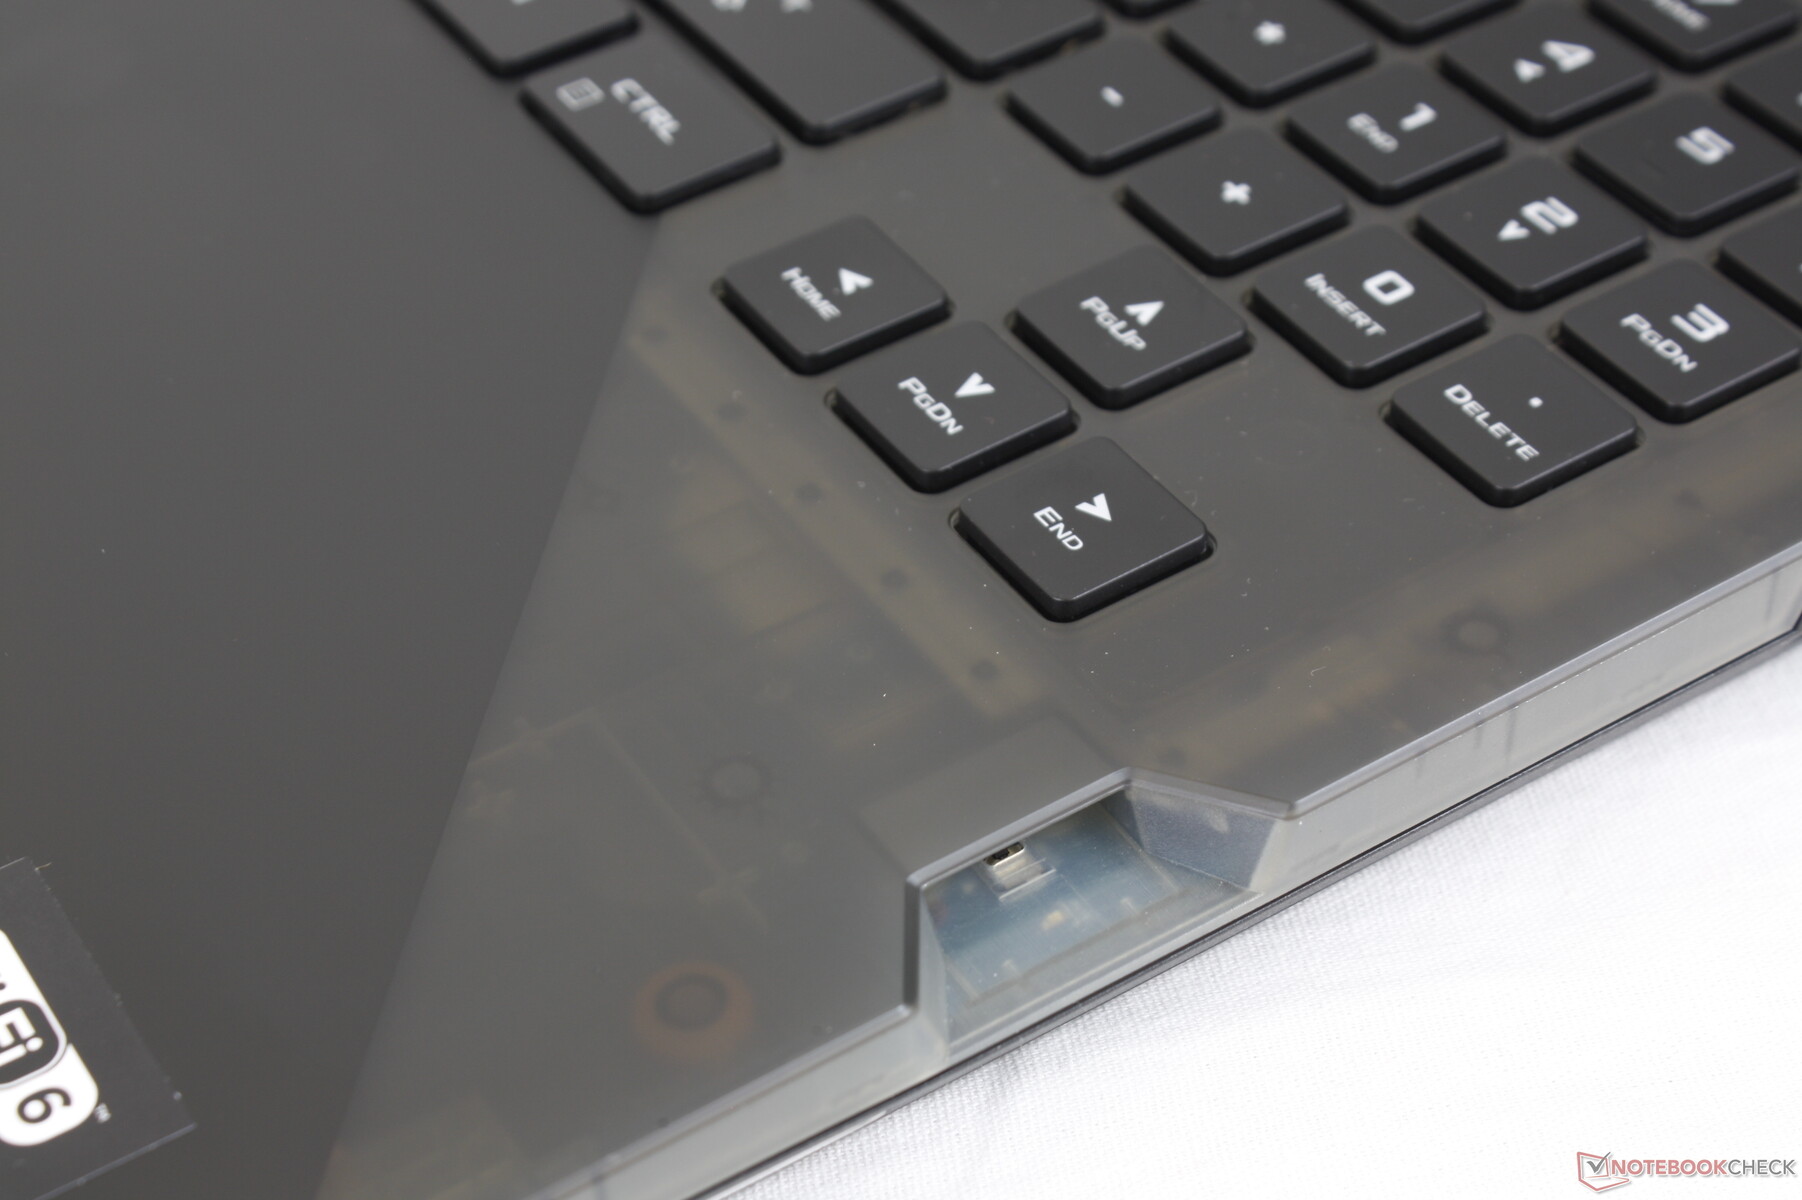
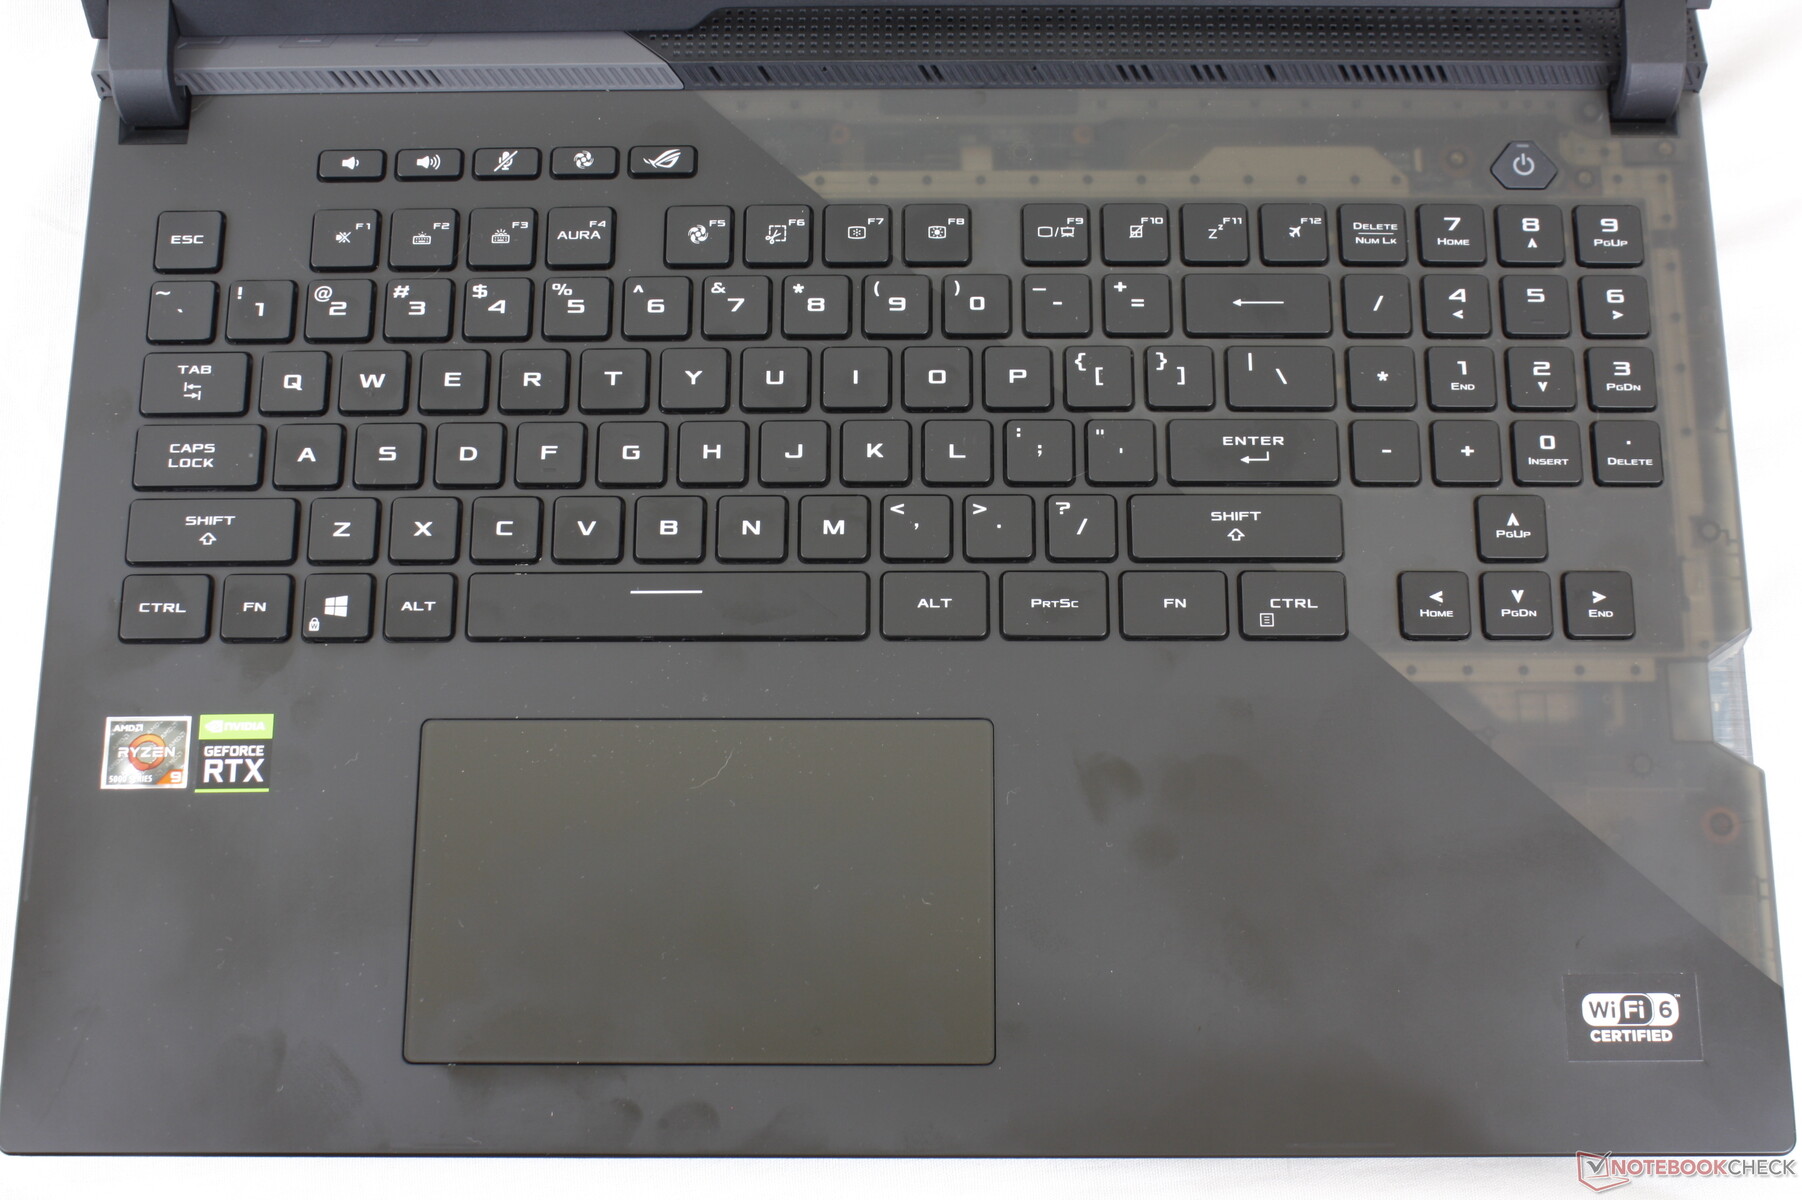
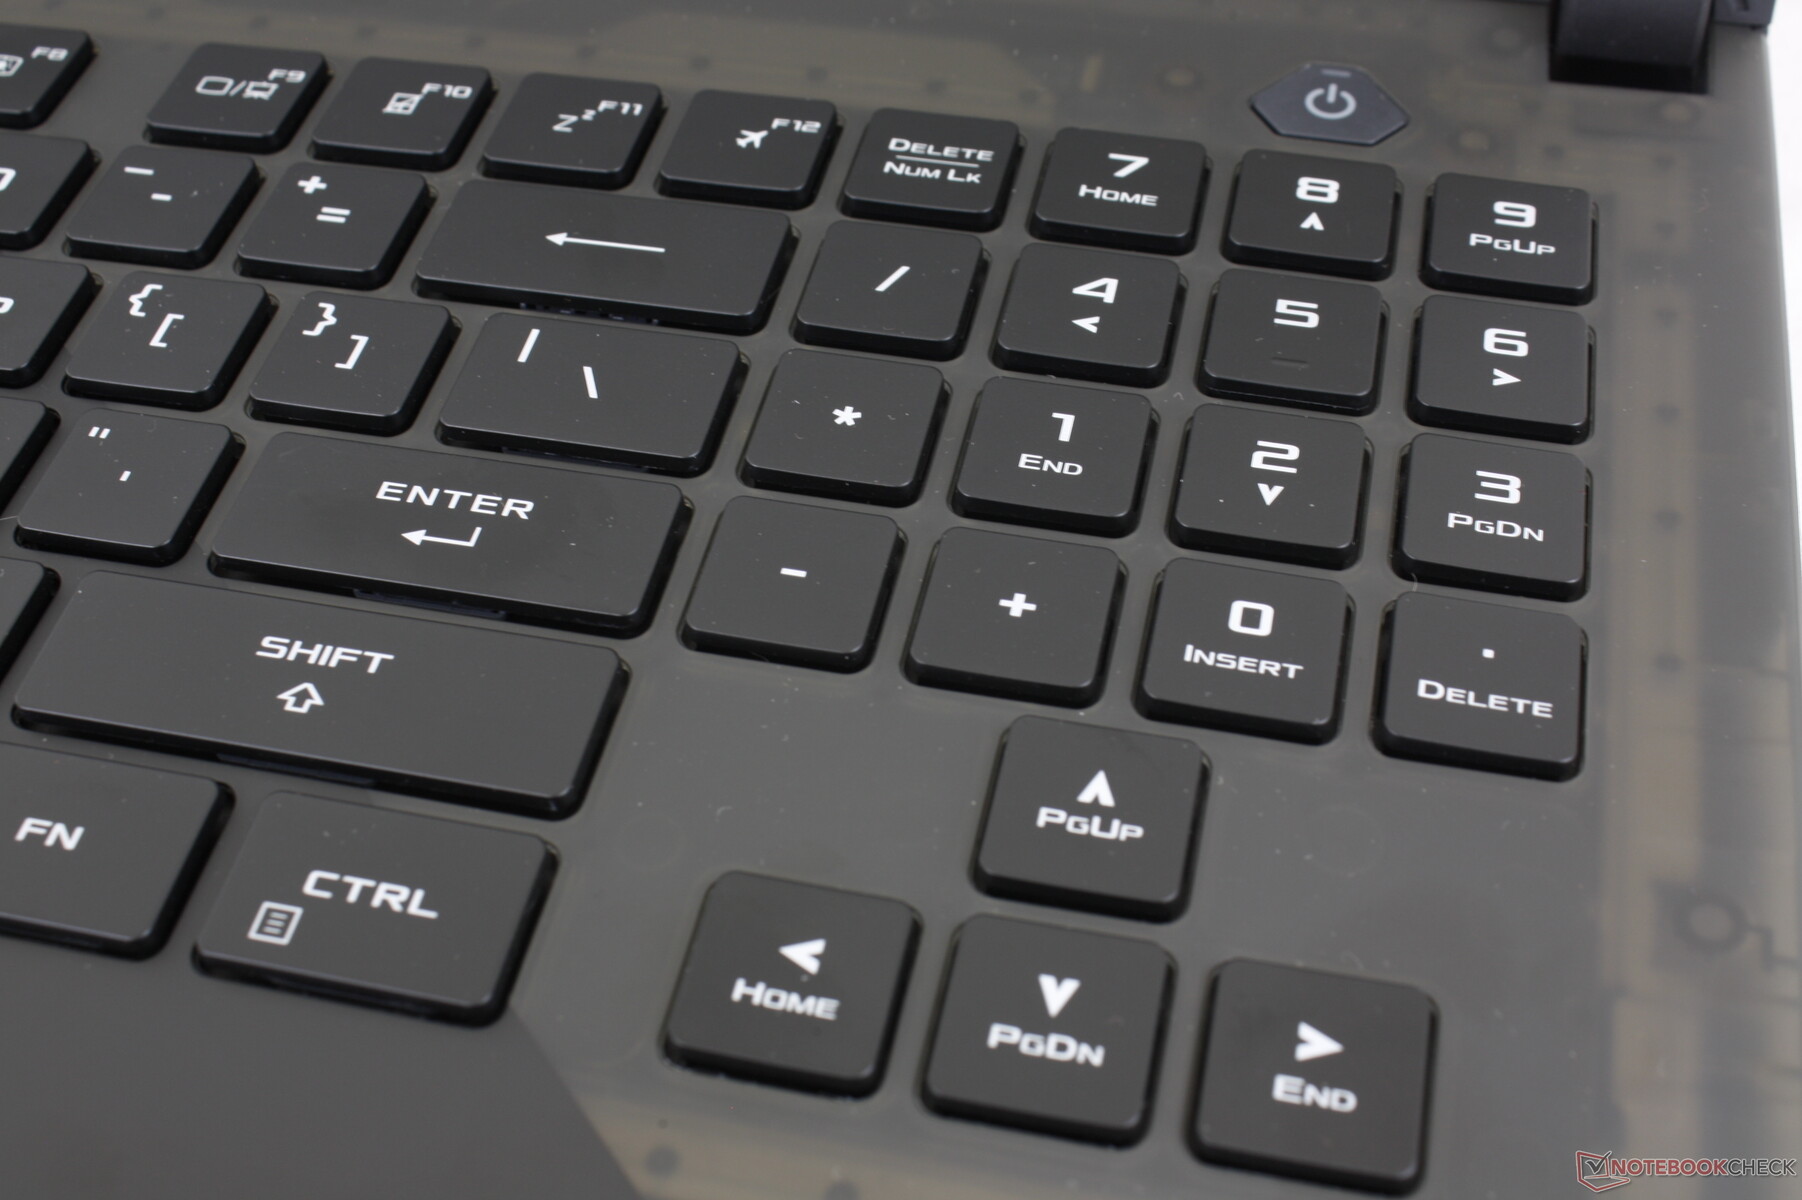
The typing experience is very different from last year's G732 because Asus has changed both the key layout and underlying key switch technology. Firstly, many of the auxiliary keys like the function, numpad, and arrow keys are now larger and therefore more uniform and not as cramped to use. Secondly, the keys are now mechanical instead of the usual rubber membrane for a different feel than most other gaming laptops. Whether or not the new keys are better for gaming is debatable, but fans of loud keys will likely love the change.
The five smaller keys along the top row are regular keys and not mechanical.
Per-key RGB Aura Sync lighting is available by default. All key symbols are lit unlike on some Razer Blade models.
Touchpad
Asus has removed the dedicated mouse buttons on the G732 in favor of a larger clickpad (13 x 7.6 cm) on the G733. Traction is very smooth with barely any sticking even if gliding at slow speeds. Clicking on the clickpad returns an audibly loud click, but travel is too shallow and feedback is on the weak side.

Display
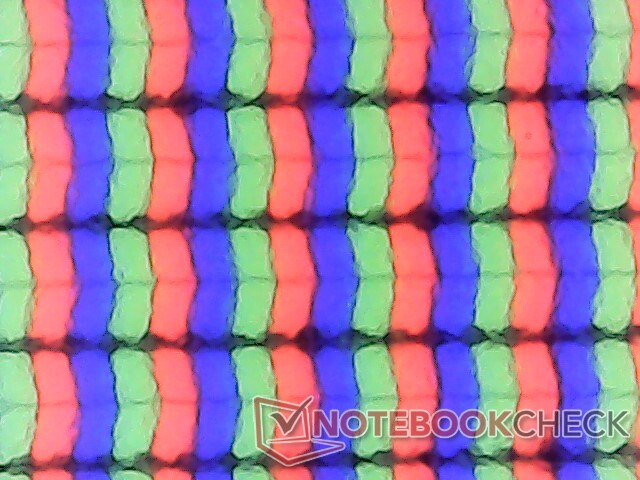
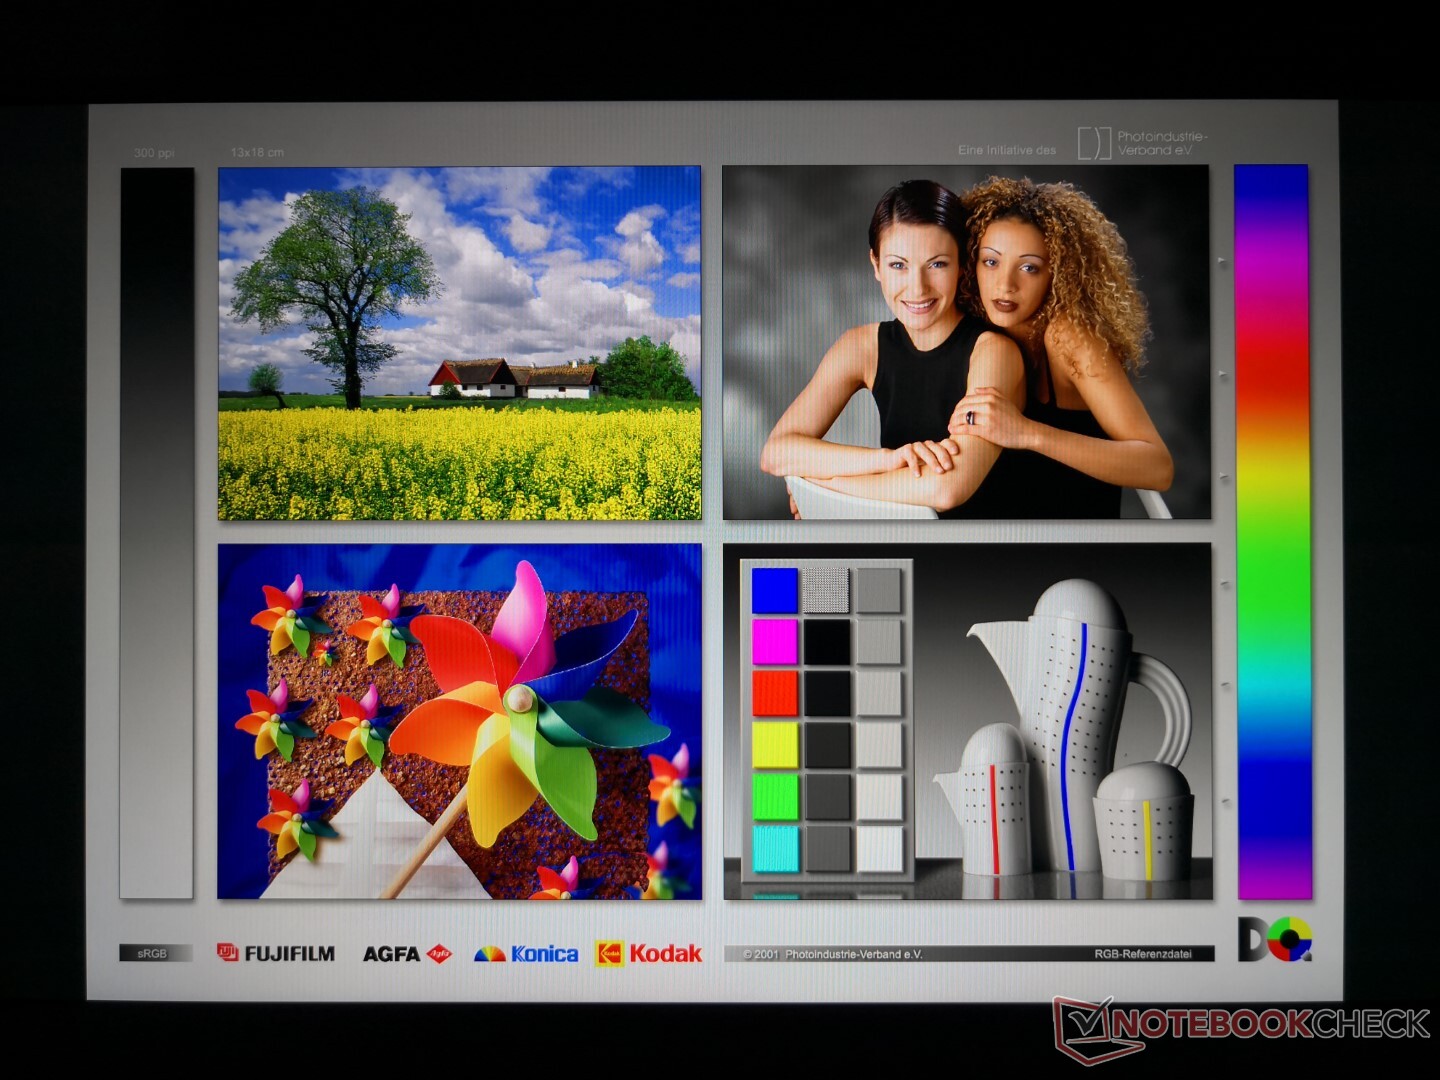
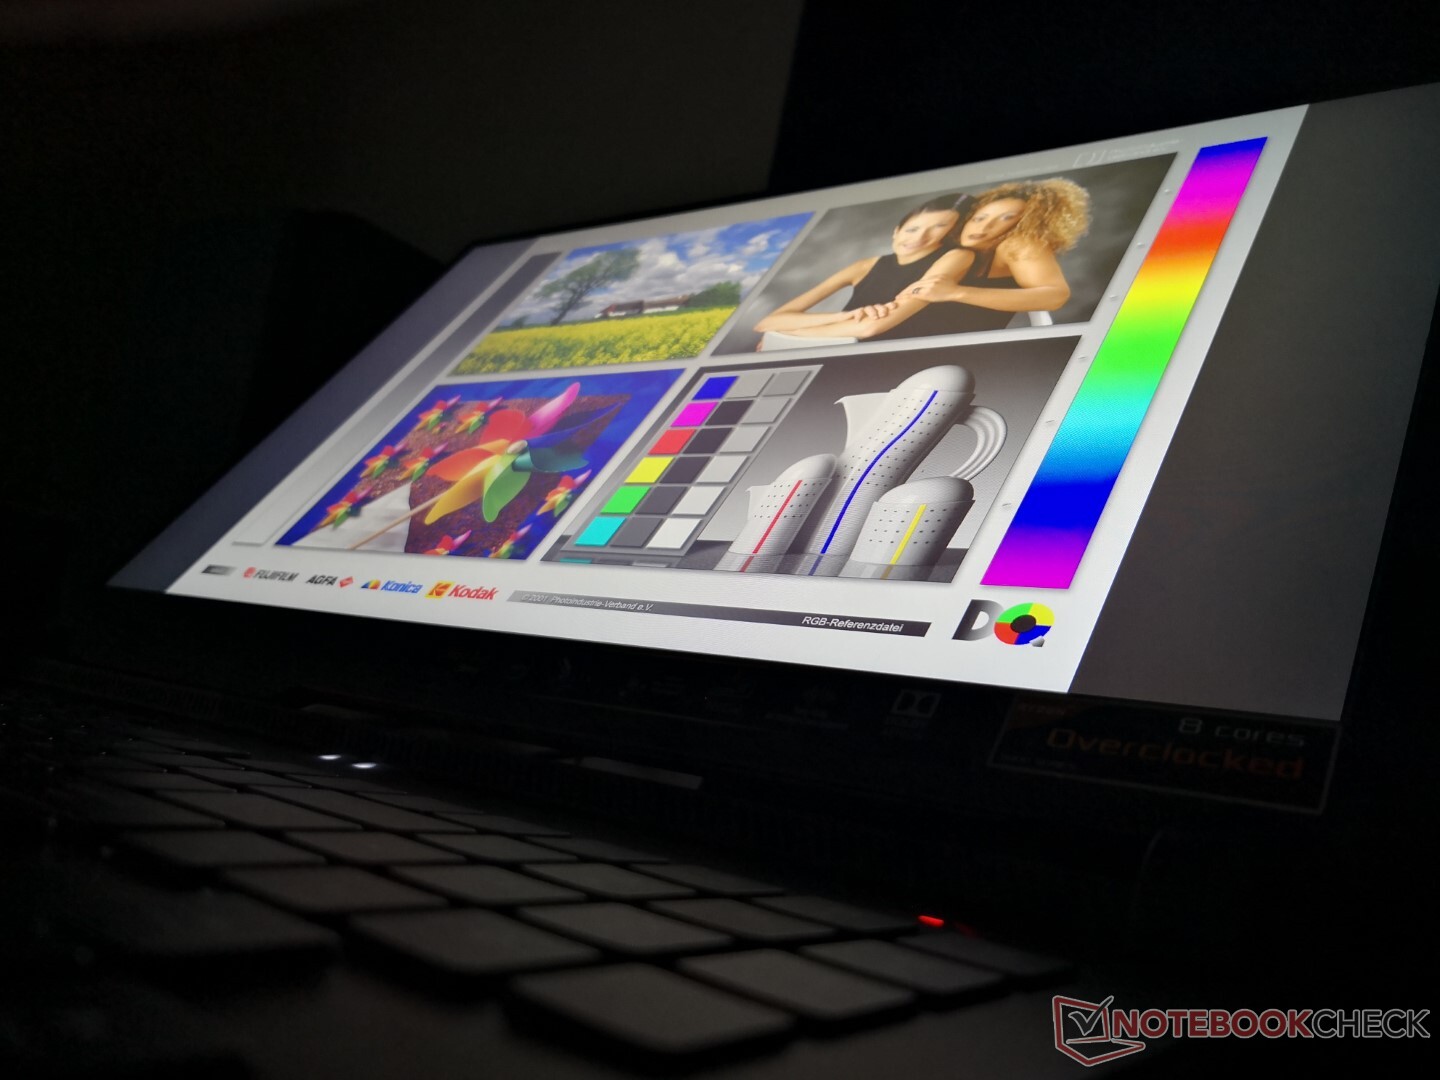
The G733 is one of the first laptop to come equipped with the 360 Hz AU Optronics B173HAN05.4 IPS panel which is a direct upgrade to last year's 300 Hz AU Optronics B173HAN05.1. Refresh rate is higher without sacrificing black-white or gray-gray response times, contrast ratios, color reproduction, or brightness meaning this is a straight-up refresh rate update and nothing else. While obviously extremely smooth and responsive to use, the benefits of higher and higher refresh rates are becoming more marginal. Users won't be missing out on much if they can "only" afford a 240 Hz or 300 Hz panel instead.
Asus offers no 4K or OLED display options for its G733 series at the moment.
| |||||||||||||||||||||||||
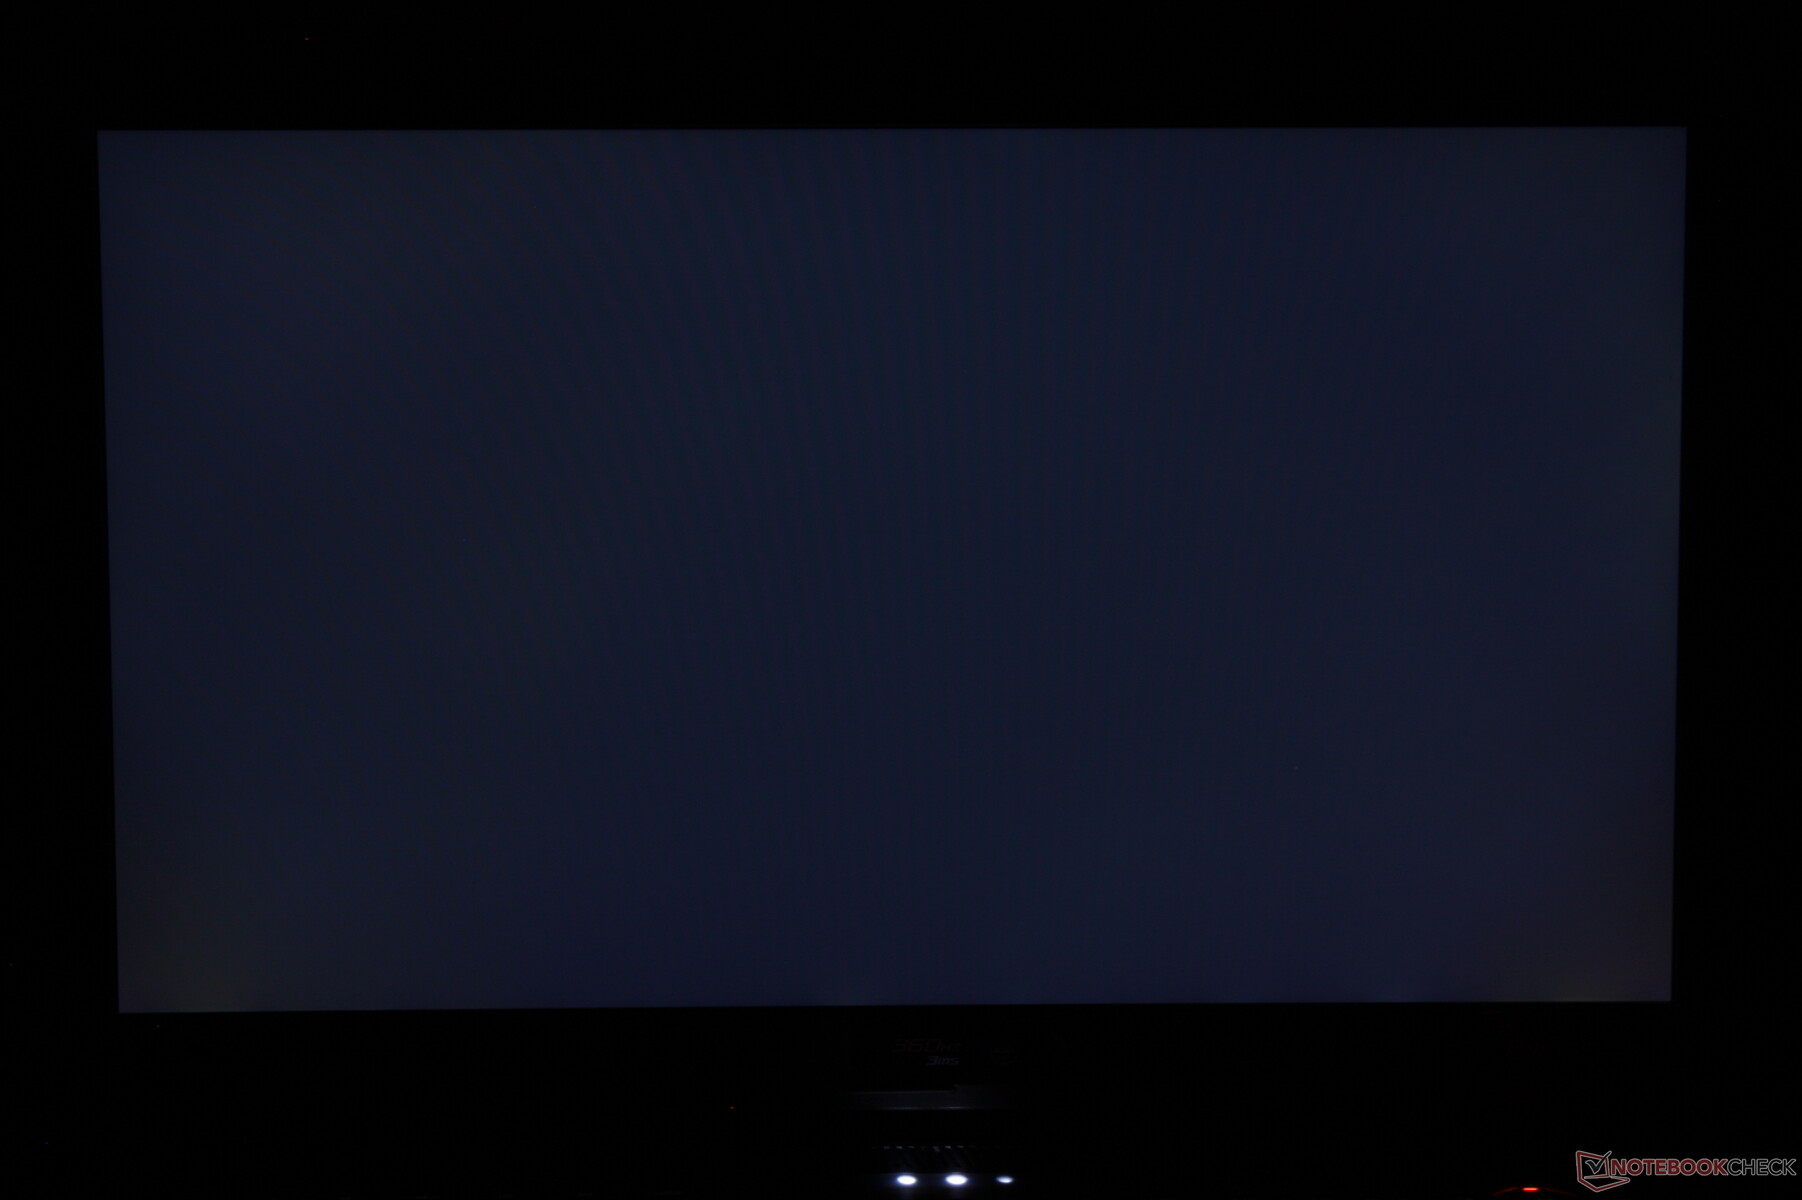
Brightness Distribution: 85 %
Center on Battery: 303.8 cd/m²
Contrast: 1321:1 (Black: 0.23 cd/m²)
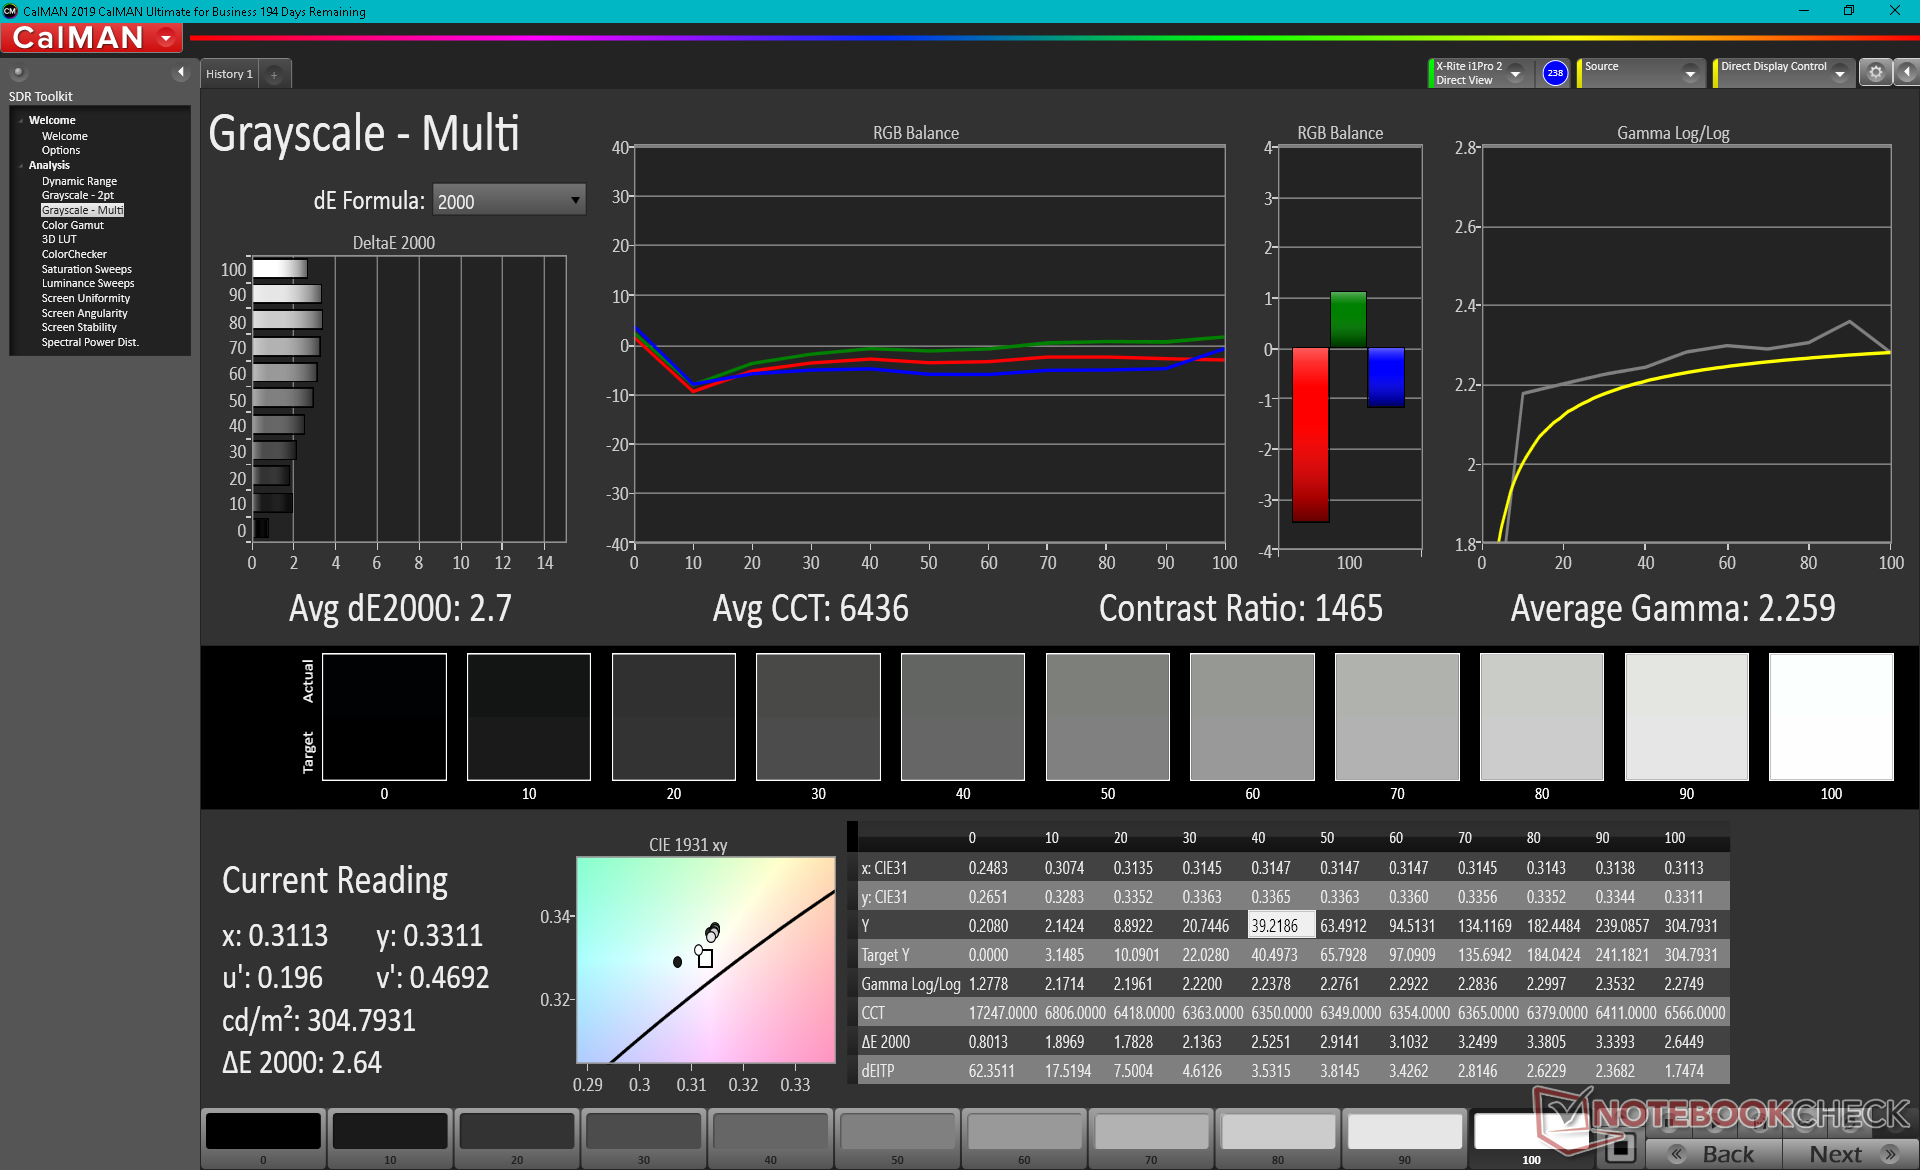
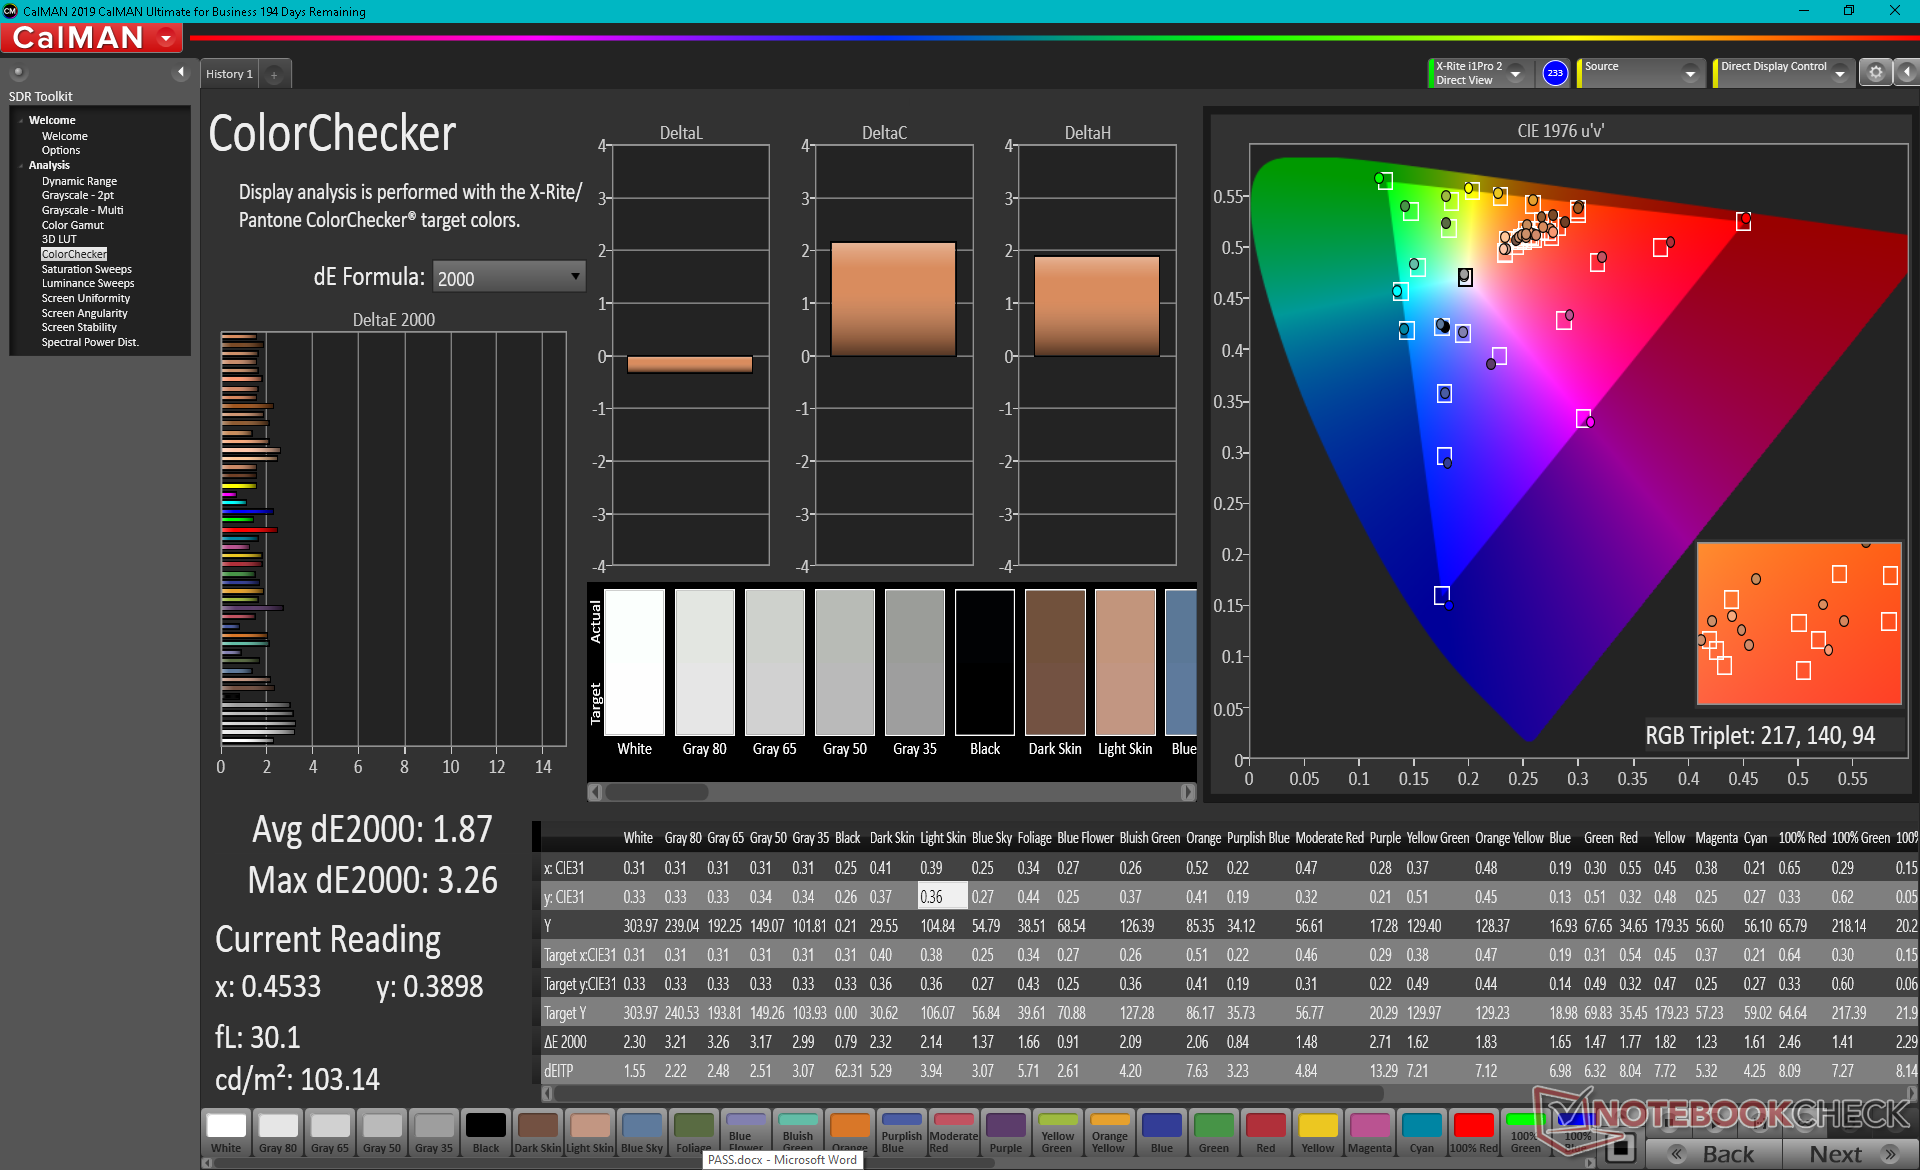
ΔE ColorChecker Calman: 1.87 | ∀{0.5-29.43 Ø4.73}
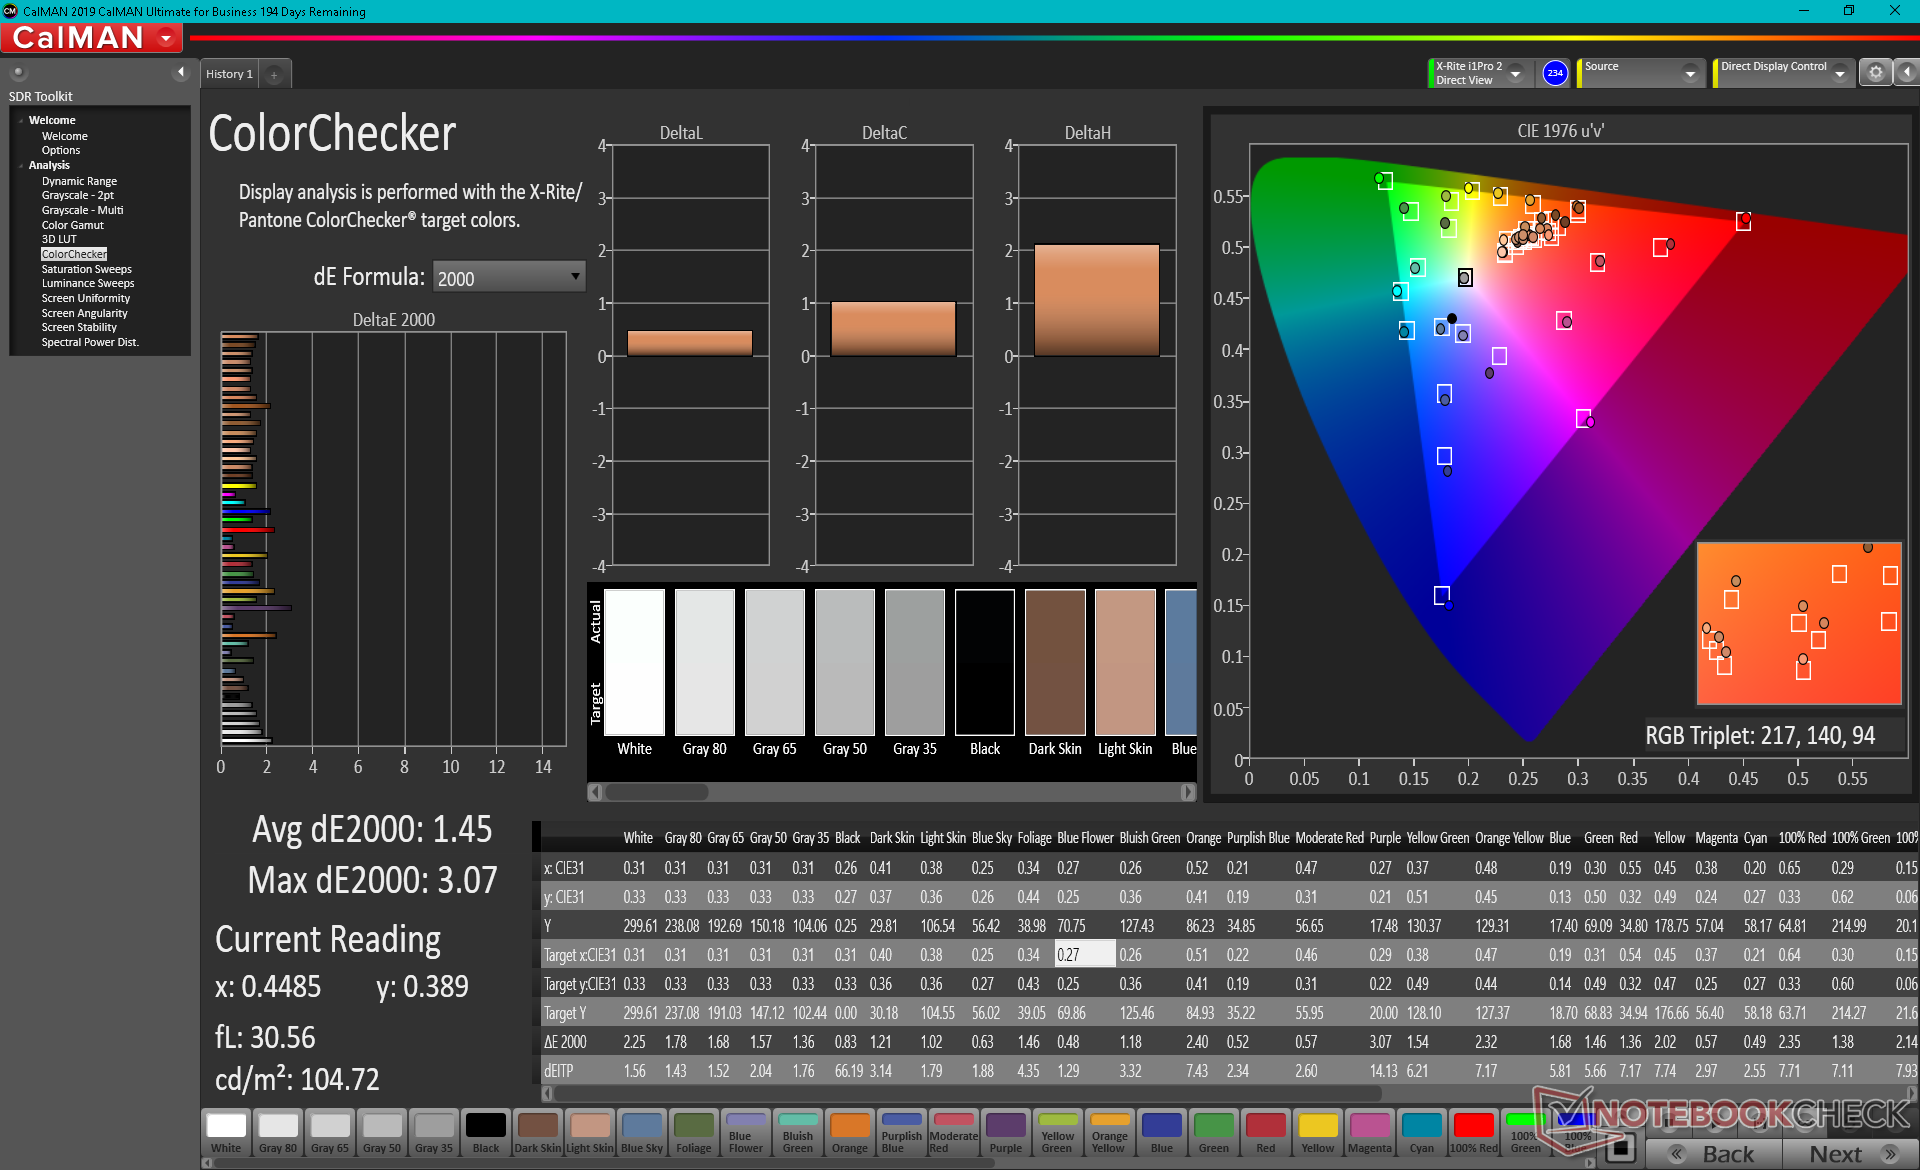
calibrated: 1.45
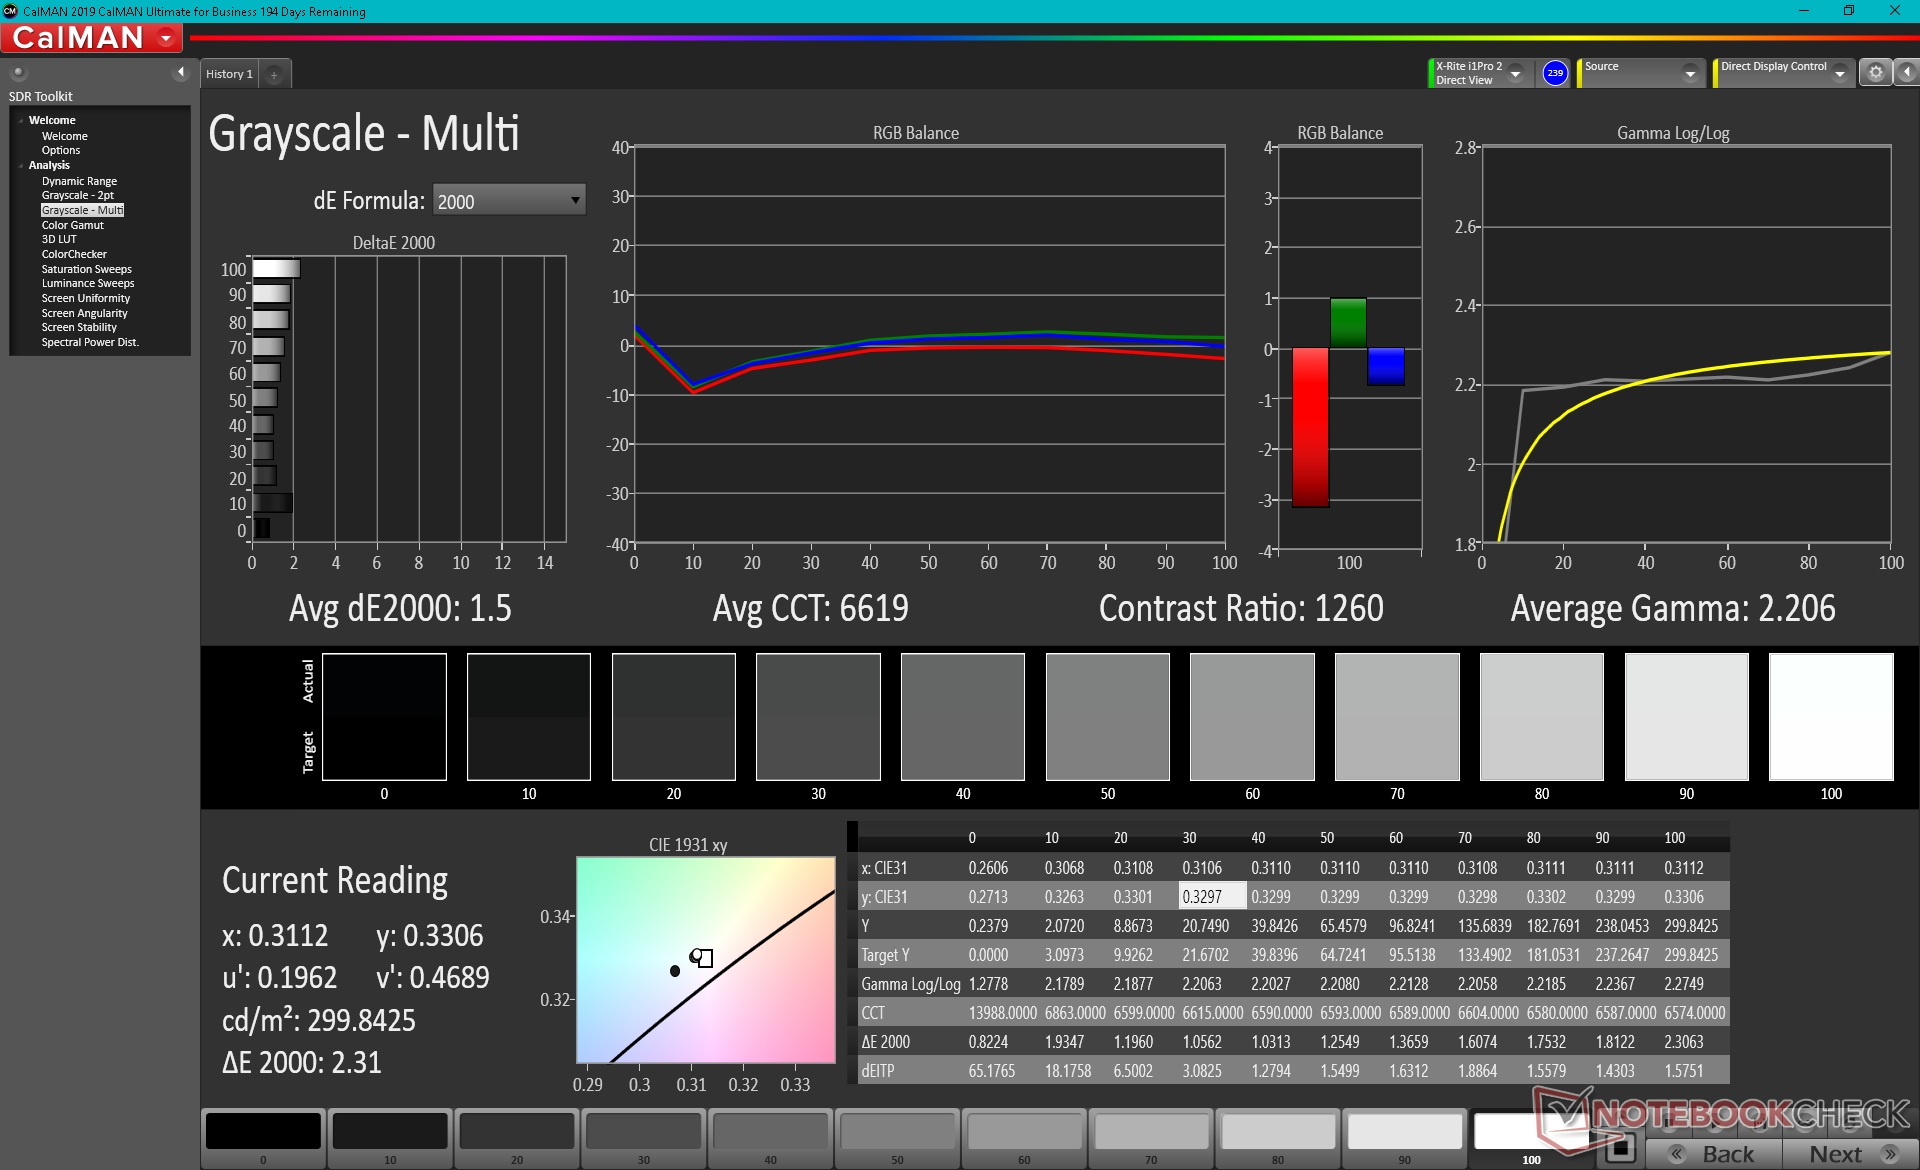
ΔE Greyscale Calman: 2.7 | ∀{0.09-98 Ø4.97}
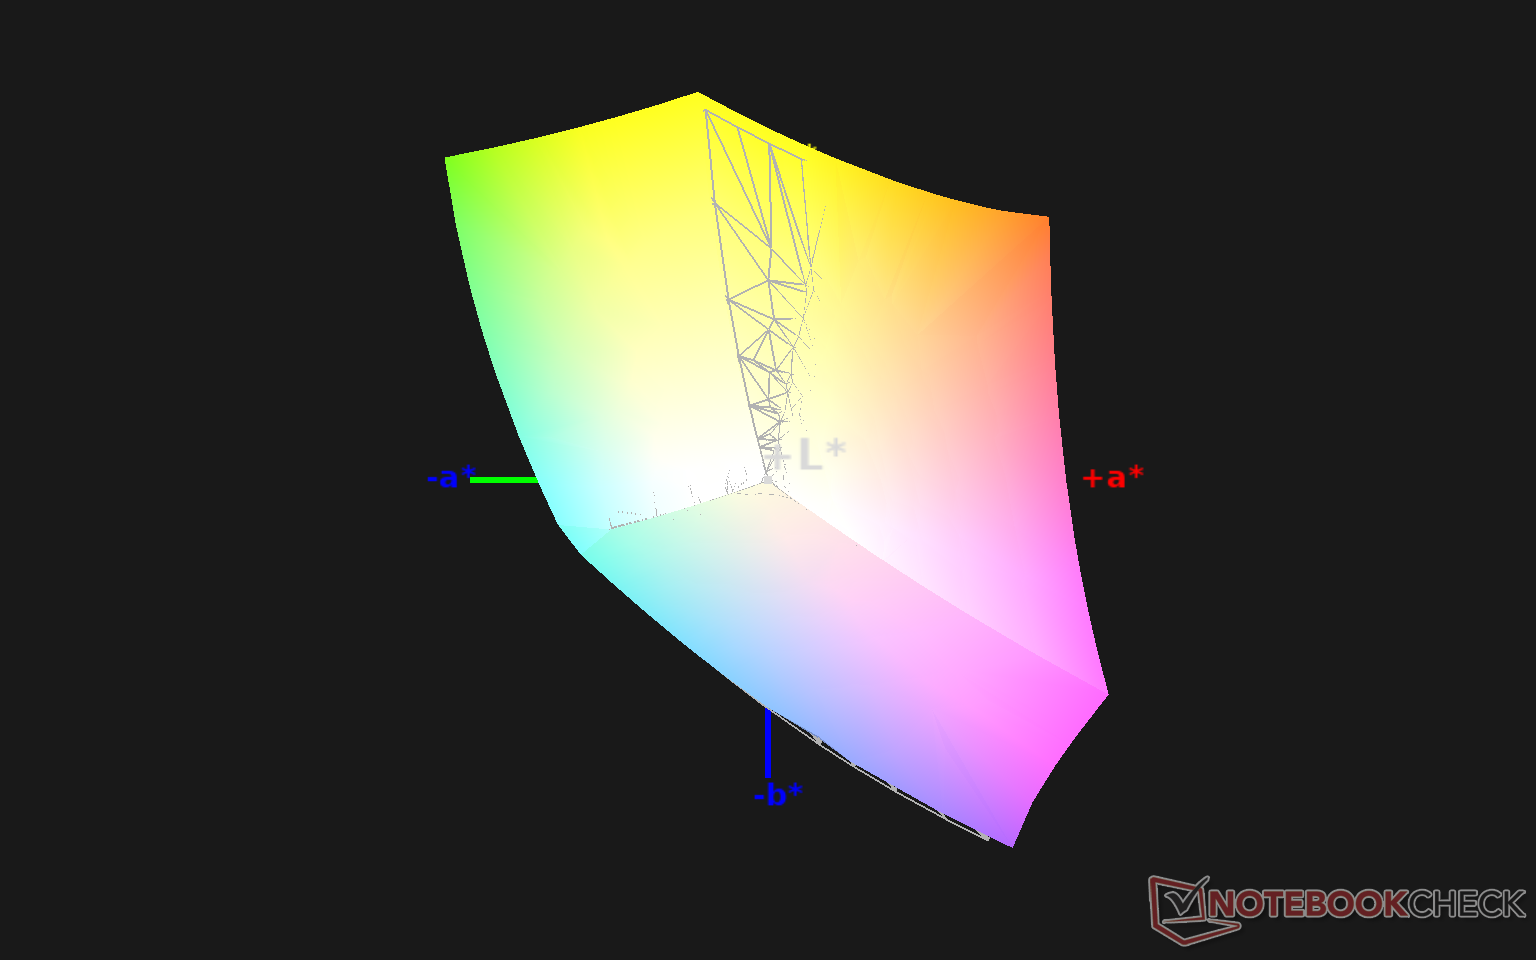
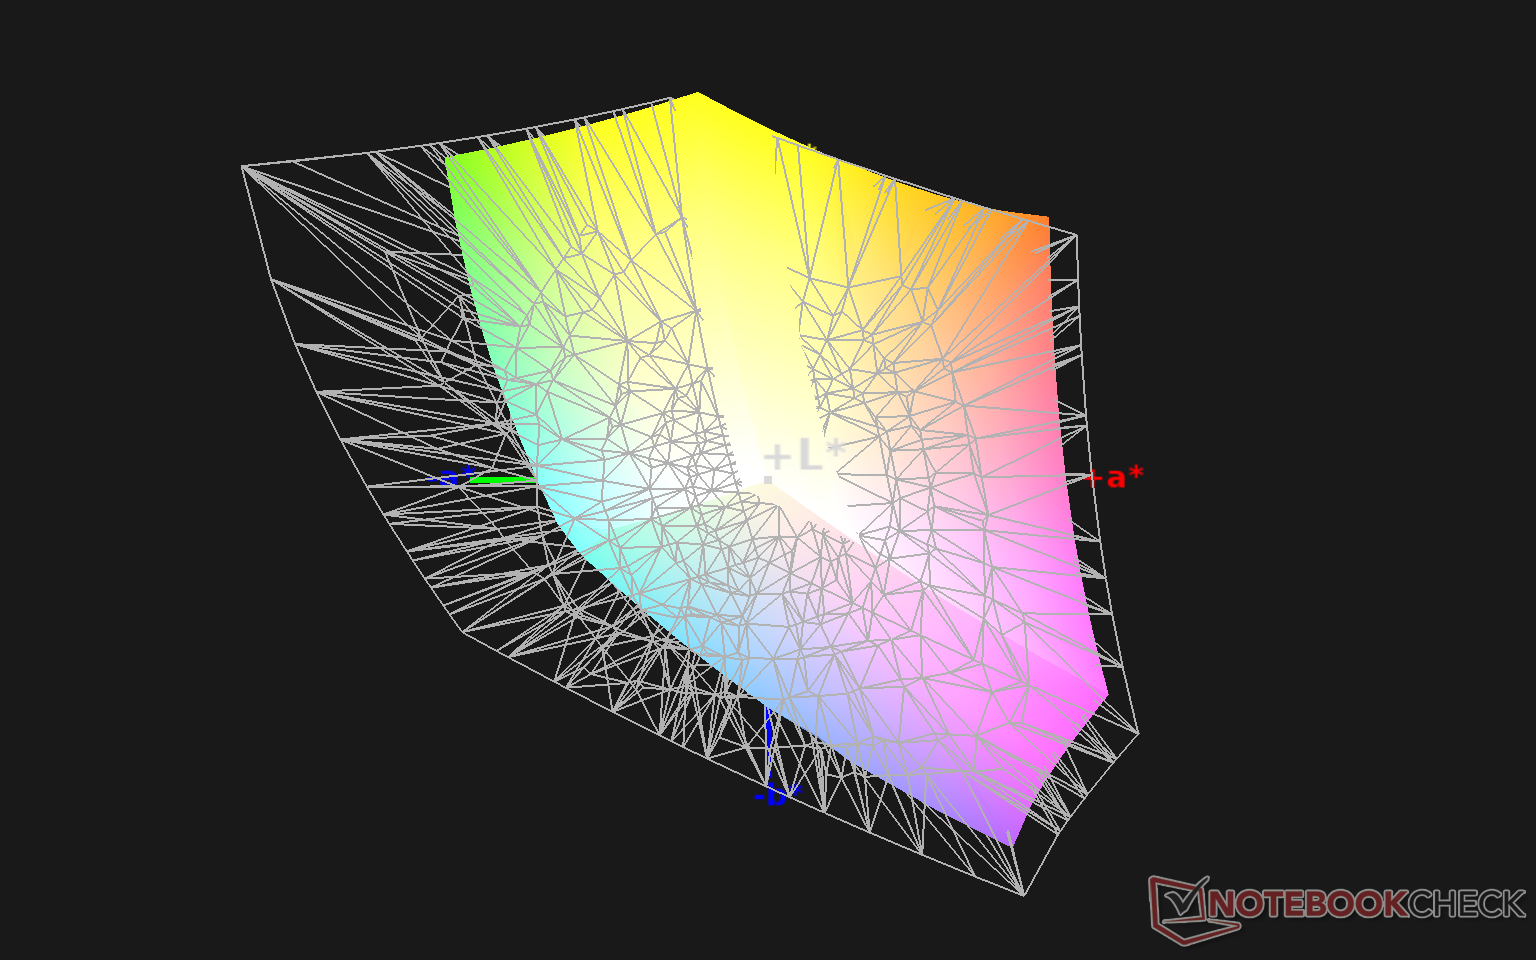
99.4% sRGB (Argyll 1.6.3 3D)
65.6% AdobeRGB 1998 (Argyll 1.6.3 3D)
72.2% AdobeRGB 1998 (Argyll 3D)
99.4% sRGB (Argyll 3D)
71% Display P3 (Argyll 3D)
Gamma: 2.26
CCT: 6436 K
| Asus Strix Scar 17 G733QSA-XS99 AU Optronics B173HAN05.4, IPS, 17.3", 1920x1080 | Asus Strix Scar 17 G732LXS LQ173M1JW03 (SHP14DC), IPS, 17.3", 1920x1080 | MSI GE76 Raider 10UH AU Optronics B173HAN05.1, IPS, 17.3", 1920x1080 | Alienware m17 R4 AU Optronics AUOEC91, IPS, 17.3", 1920x1080 | Razer Blade Pro 17 2021 (QHD Touch) AU Optronics B173ZAN03.3, IPS, 17.3", 3840x2160 | Asus Zephyrus S17 GX701LXS Sharp SHP14DC, IPS, 17.3", 1920x1080 | |
|---|---|---|---|---|---|---|
| Display | -0% | 1% | -1% | 21% | 2% | |
| Display P3 Coverage (%) | 71 | 71 0% | 71.8 1% | 69.8 -2% | 88.6 25% | 73.6 4% |
| sRGB Coverage (%) | 99.4 | 99 0% | 98.1 -1% | 99.7 0% | 100 1% | 99.7 0% |
| AdobeRGB 1998 Coverage (%) | 72.2 | 71.6 -1% | 73.9 2% | 71.6 -1% | 99.9 38% | 73.7 2% |
| Response Times | 17% | -101% | -43% | -71% | 25% | |
| Response Time Grey 50% / Grey 80% * (ms) | 6.6 ? | 5.8 ? 12% | 20.4 ? -209% | 13.2 ? -100% | 15.2 ? -130% | 5 ? 24% |
| Response Time Black / White * (ms) | 10.8 ? | 8.4 ? 22% | 10 ? 7% | 9.2 ? 15% | 12 ? -11% | 8 ? 26% |
| PWM Frequency (Hz) | 151500 | |||||
| Screen | -31% | -41% | 15% | -84% | -3% | |
| Brightness middle (cd/m²) | 303.8 | 310 2% | 324.6 7% | 305 0% | 407.2 34% | 308 1% |
| Brightness (cd/m²) | 292 | 311 7% | 312 7% | 301 3% | 403 38% | 310 6% |
| Brightness Distribution (%) | 85 | 82 -4% | 87 2% | 93 9% | 90 6% | 76 -11% |
| Black Level * (cd/m²) | 0.23 | 0.41 -78% | 0.28 -22% | 0.19 17% | 0.42 -83% | 0.34 -48% |
| Contrast (:1) | 1321 | 756 -43% | 1159 -12% | 1605 21% | 970 -27% | 906 -31% |
| Colorchecker dE 2000 * | 1.87 | 2.41 -29% | 3.87 -107% | 1.31 30% | 7.25 -288% | 1.49 20% |
| Colorchecker dE 2000 max. * | 3.26 | 8.59 -163% | 9.35 -187% | 2.32 29% | 12.51 -284% | 3.97 -22% |
| Colorchecker dE 2000 calibrated * | 1.45 | 1.13 22% | 1.42 2% | 0.91 37% | 3.62 -150% | 0.99 32% |
| Greyscale dE 2000 * | 2.7 | 4.3 -59% | 6.5 -141% | 2.3 15% | 8.1 -200% | 2.3 15% |
| Gamma | 2.26 97% | 2.149 102% | 2.23 99% | 2.281 96% | 2.24 98% | 2.193 100% |
| CCT | 6436 101% | 7059 92% | 5702 114% | 6449 101% | 5925 110% | 6981 93% |
| Color Space (Percent of AdobeRGB 1998) (%) | 65.6 | 72 10% | 66.3 1% | 72 10% | 88.1 34% | 74 13% |
| Color Space (Percent of sRGB) (%) | 99.4 | 94 -5% | 98 -1% | 94 -5% | 100 1% | 96 -3% |
| Total Average (Program / Settings) | -5% /
-19% | -47% /
-41% | -10% /
5% | -45% /
-62% | 8% /
2% |
* ... smaller is better
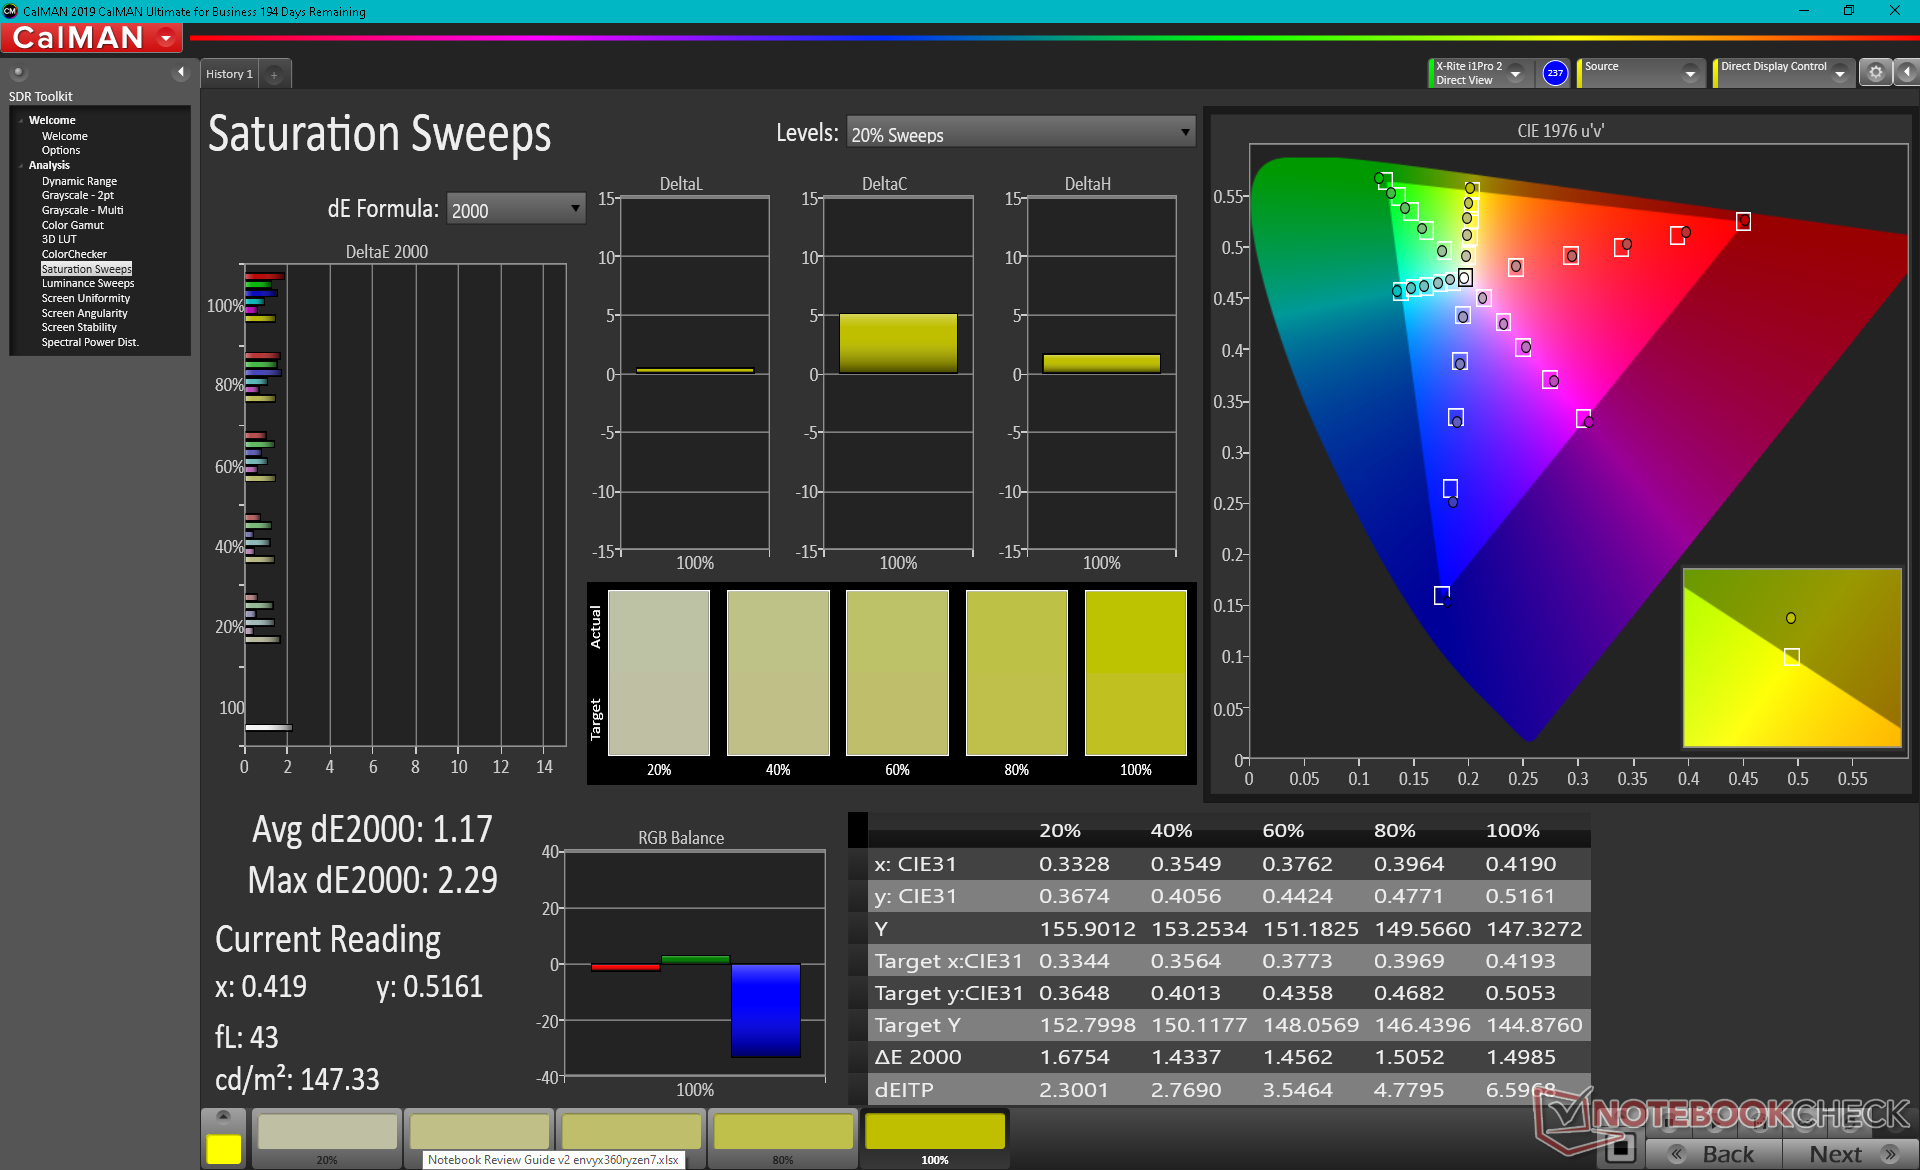
Color space covers all of sRGB to be sufficient for many digital editors. For even deeper colors, Asus has a WQHD (2560 x 1440) IPS SKU that promises full DCI-P3 coverage at the cost of a slower native refresh rate (165 Hz vs. 360 Hz).
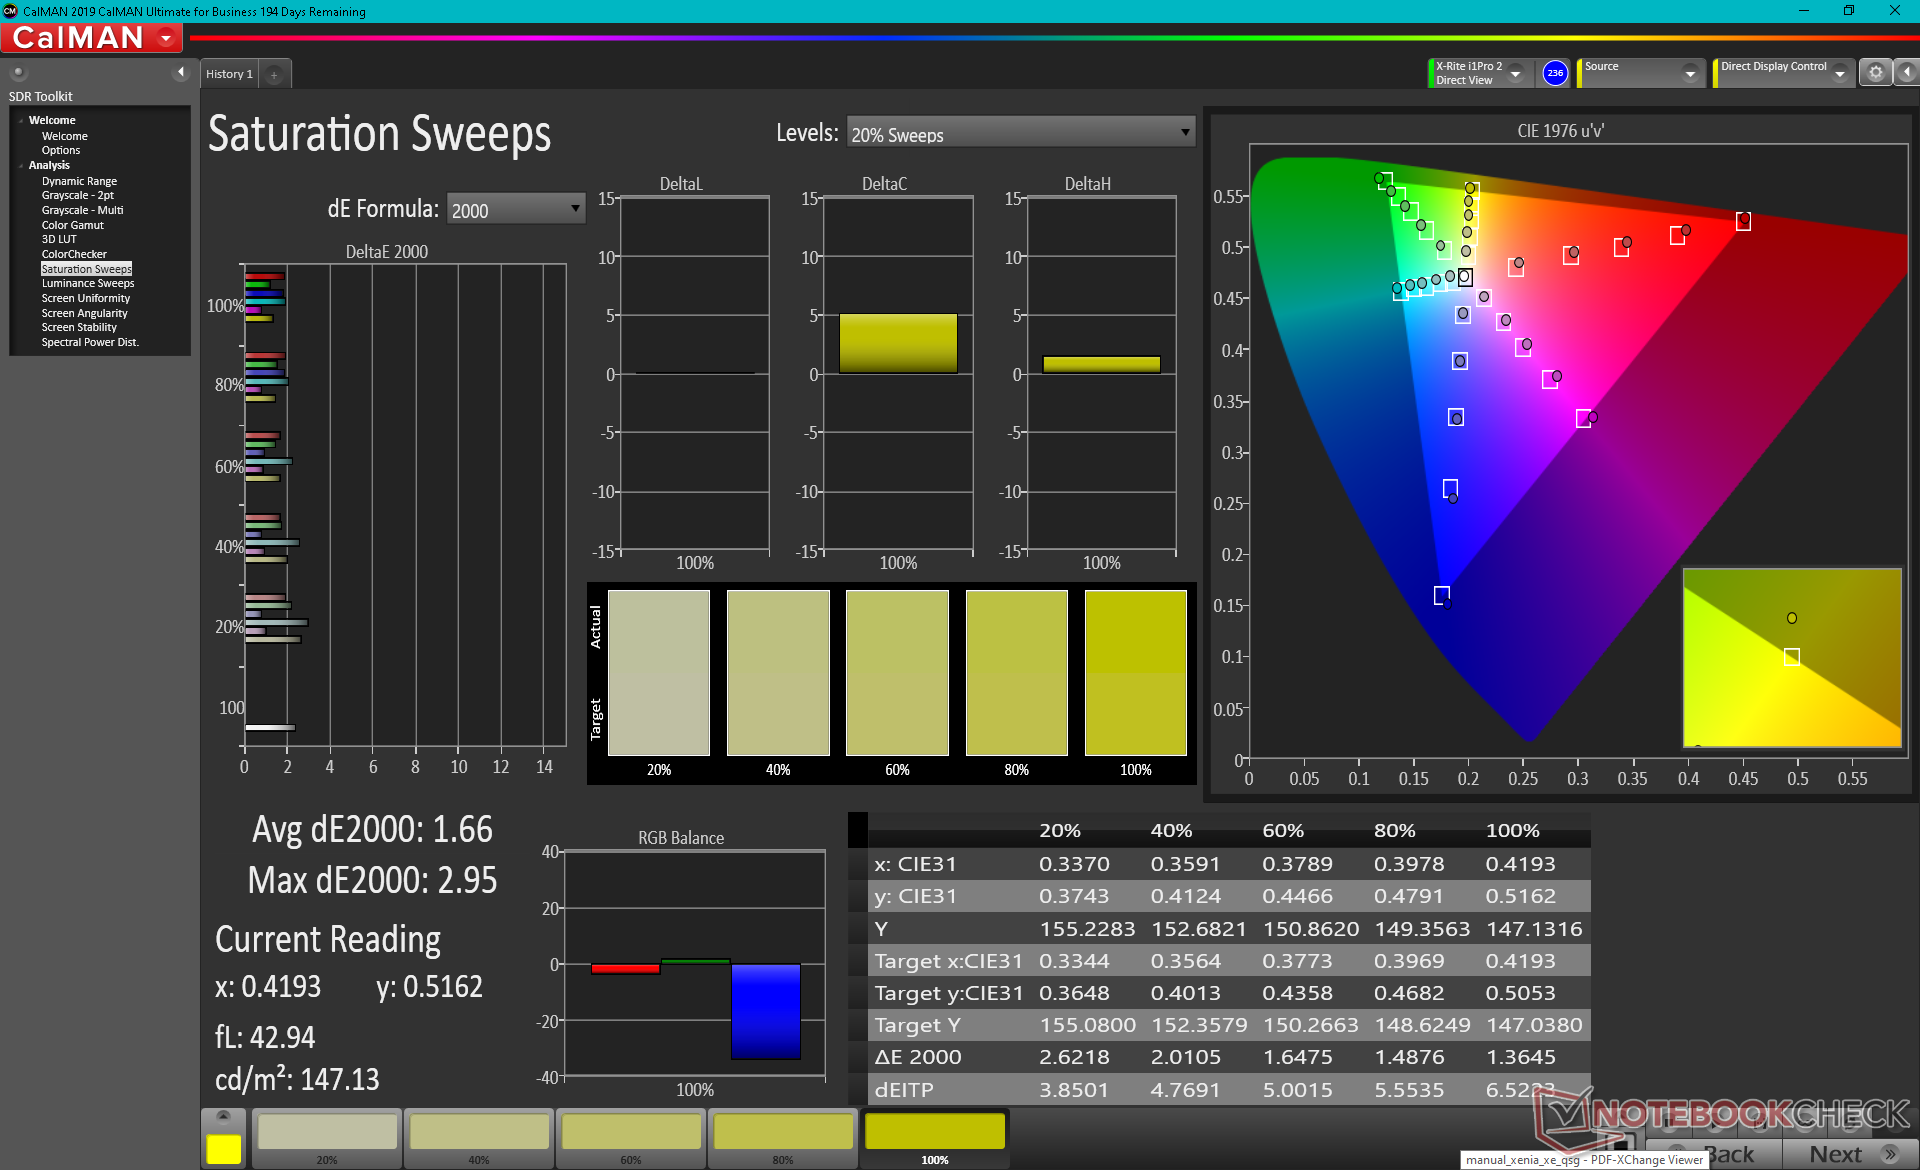
The display is already well calibrated out of the box with average DeltaE grayscale and color values of just 2.7 and 1.87, respectively. Our own calibration would decrease these averages even further by just narrow margins.
Display Response Times
| ↔ Response Time Black to White | ||
|---|---|---|
| 10.8 ms ... rise ↗ and fall ↘ combined | ↗ 5.2 ms rise | 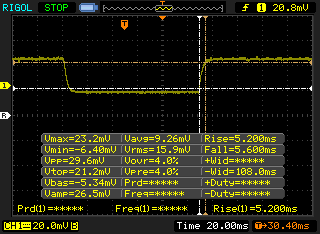 |
| ↘ 5.6 ms fall | ||
| The screen shows good response rates in our tests, but may be too slow for competitive gamers. In comparison, all tested devices range from 0.1 (minimum) to 240 (maximum) ms. » 29 % of all devices are better. This means that the measured response time is better than the average of all tested devices (19.9 ms). | ||
| ↔ Response Time 50% Grey to 80% Grey | ||
| 6.6 ms ... rise ↗ and fall ↘ combined | ↗ 2.2 ms rise | 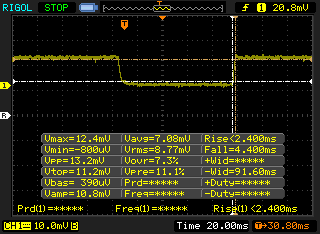 |
| ↘ 4.4 ms fall | ||
| The screen shows very fast response rates in our tests and should be very well suited for fast-paced gaming. In comparison, all tested devices range from 0.165 (minimum) to 636 (maximum) ms. » 19 % of all devices are better. This means that the measured response time is better than the average of all tested devices (31.1 ms). | ||
Screen Flickering / PWM (Pulse-Width Modulation)
| Screen flickering / PWM not detected | 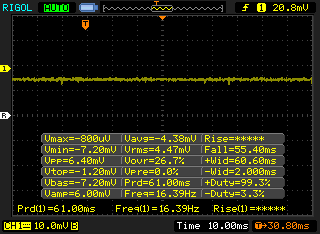 | ||
In comparison: 52 % of all tested devices do not use PWM to dim the display. If PWM was detected, an average of 7801 (minimum: 5 - maximum: 343500) Hz was measured. | |||
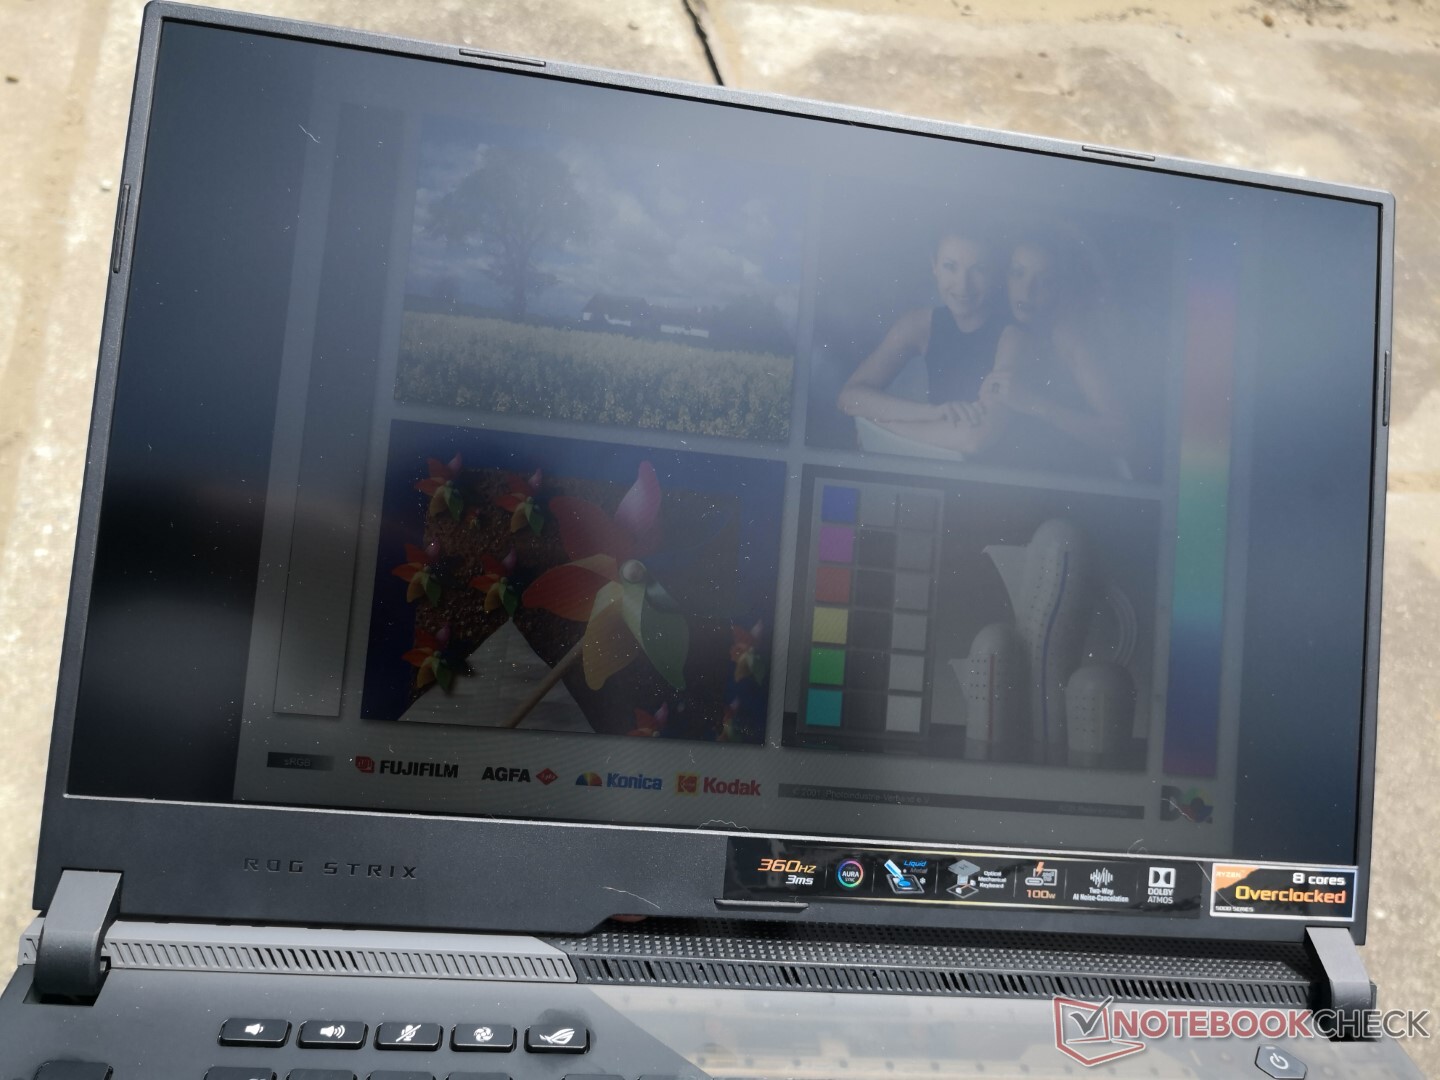
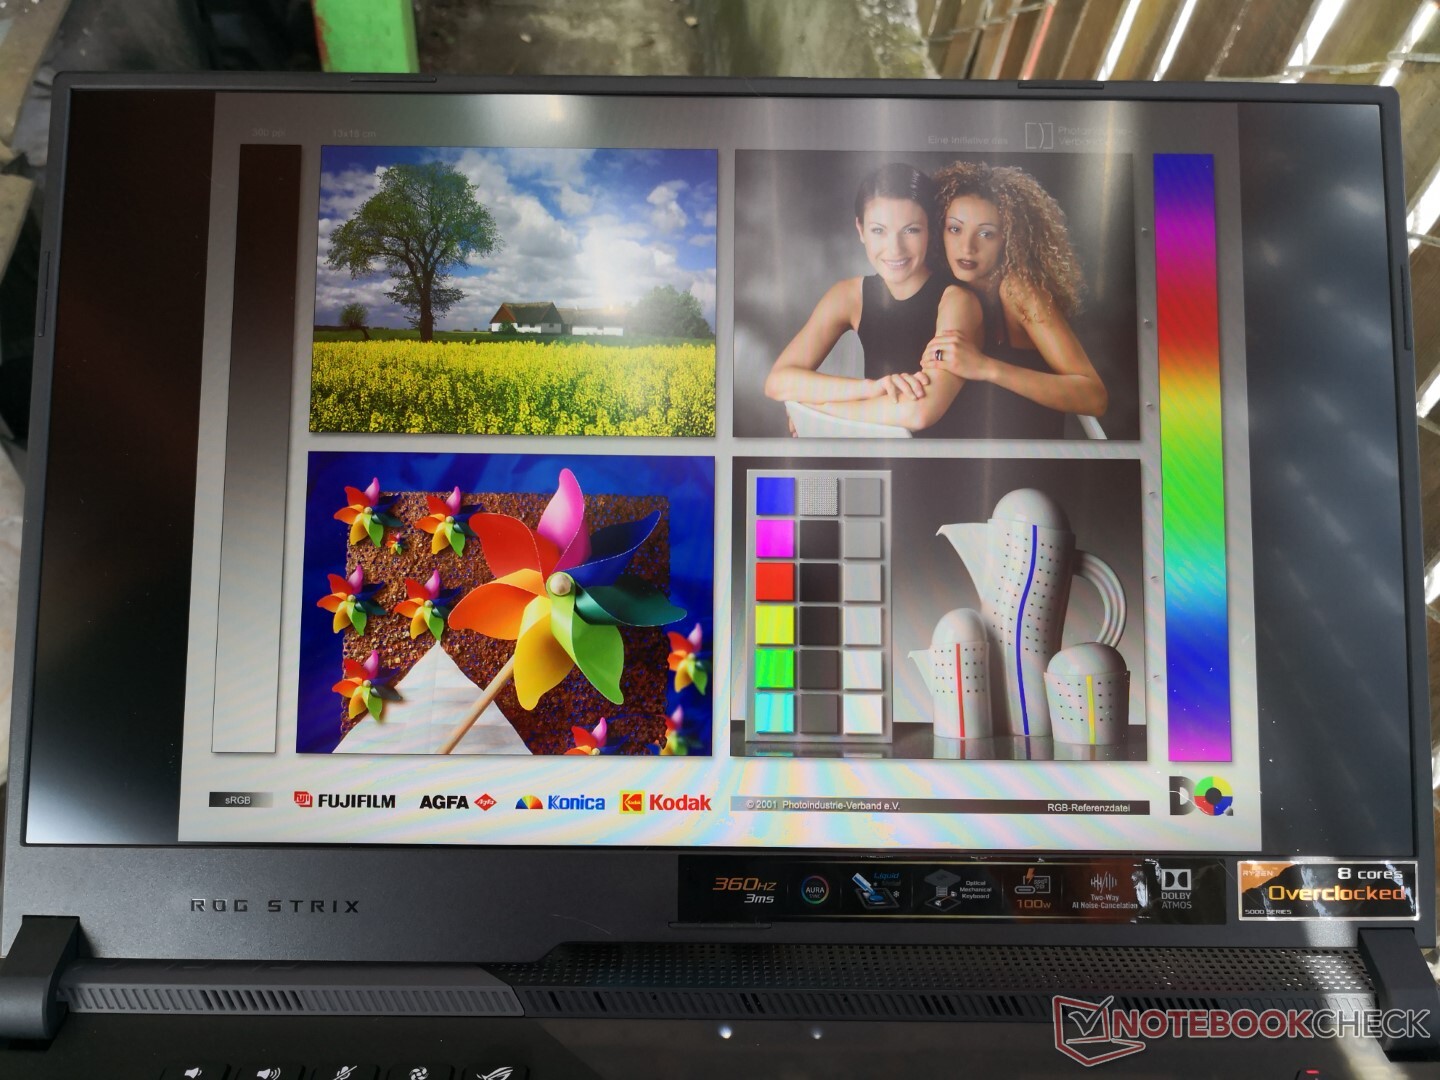
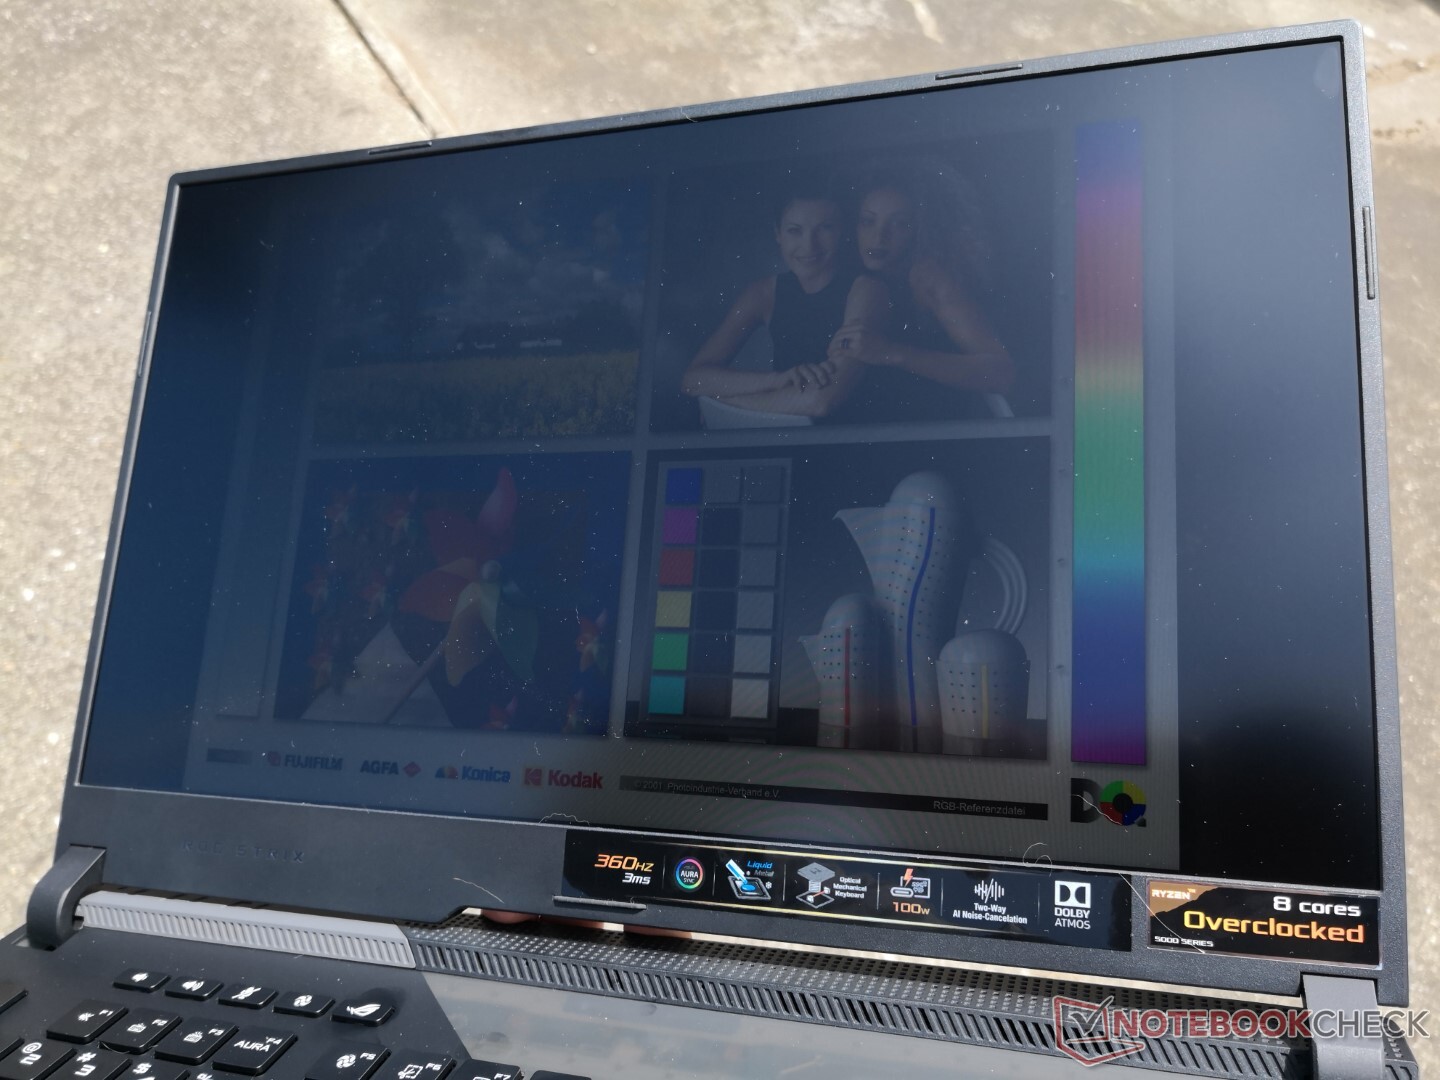
Outdoor visibility is average when under shade; brighter conditions will severely wash out the colors. Like most other 17.3-inch gaming laptops, the G733 is more of an indoor laptop than an outdoor one. Nonetheless, the display on the Razer Blade Pro 17 is brighter if outdoor visibility is a concern.
AMD Vari-Bright is enabled by default which decreases maximum brightness to just 177.6 nits if running on battery power. This feature can be toggled off through the Radeon software.
Performance
The ROG Strix Scar 17 G733 is a high-end gaming system with no mid-range SKUs. Thus, even the lowest-end options come with the Ryzen 7 5800H CPU with the GeForce RTX 3060 GPU and 360 Hz FHD display.
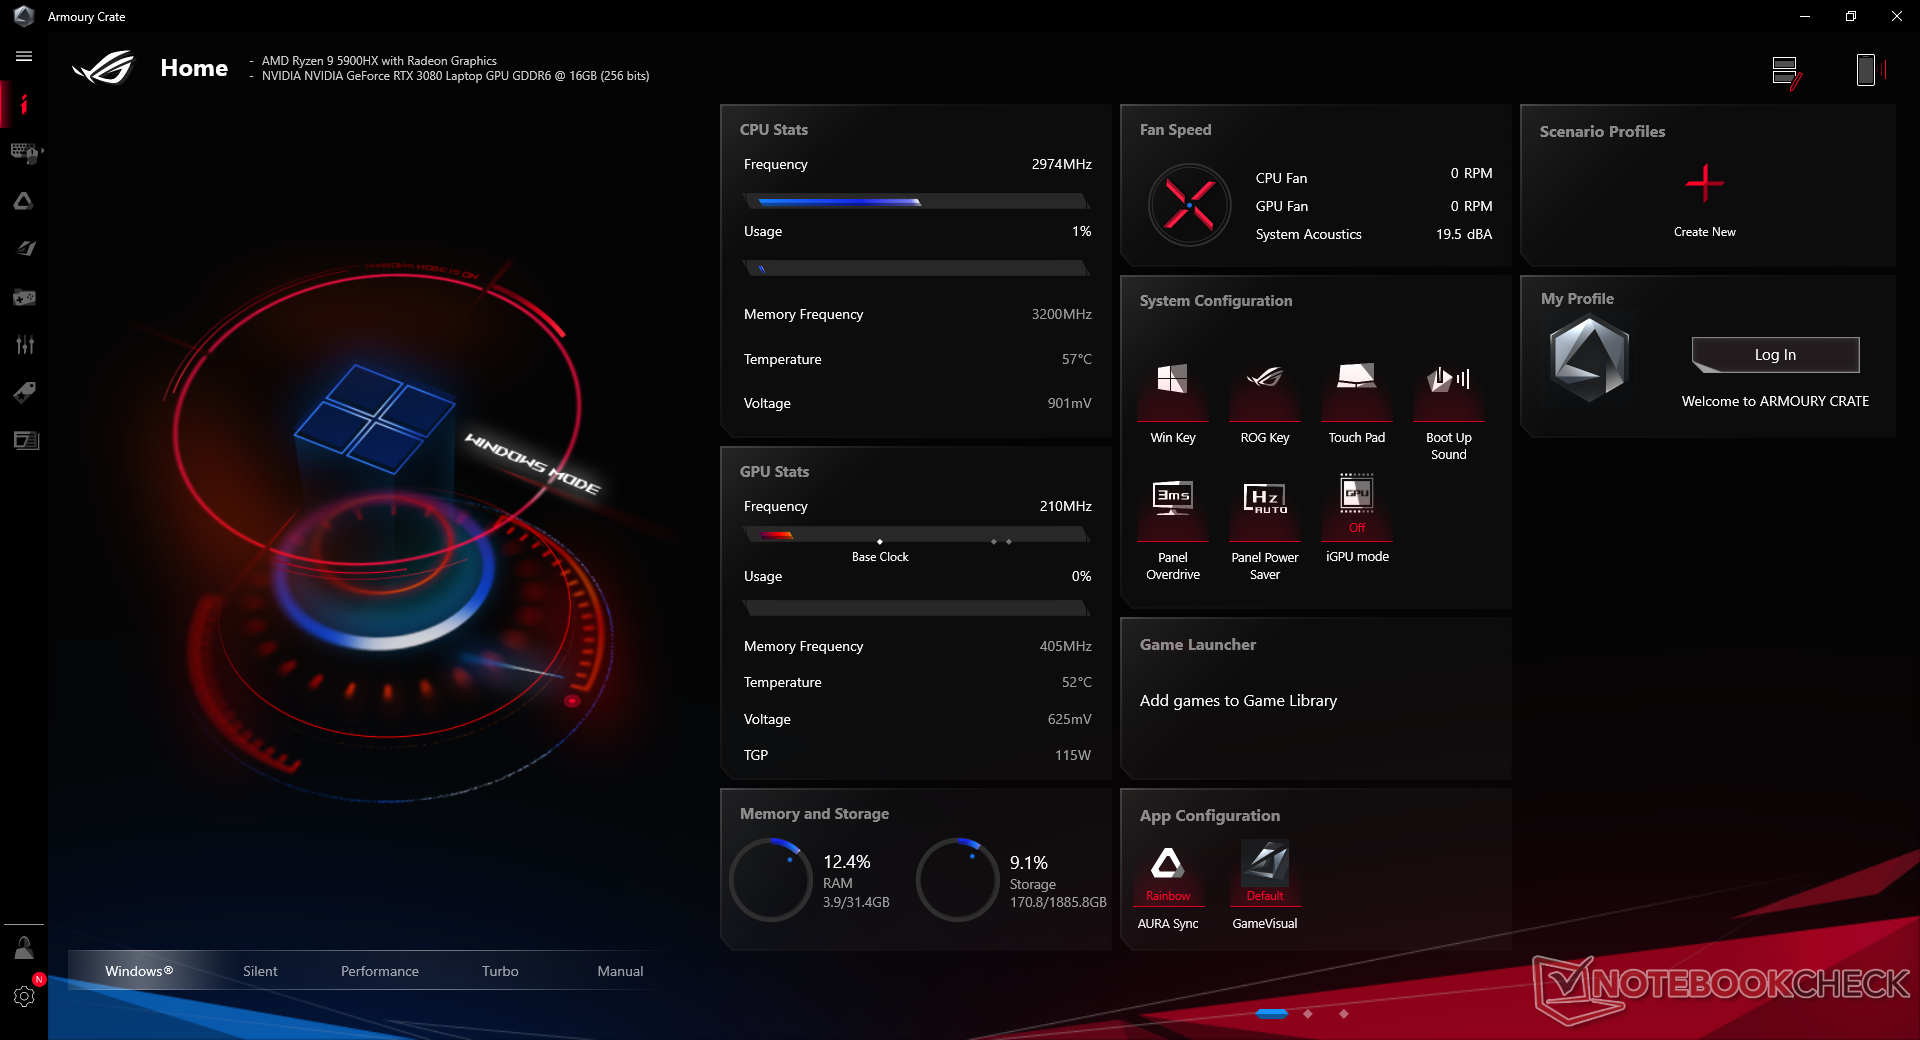
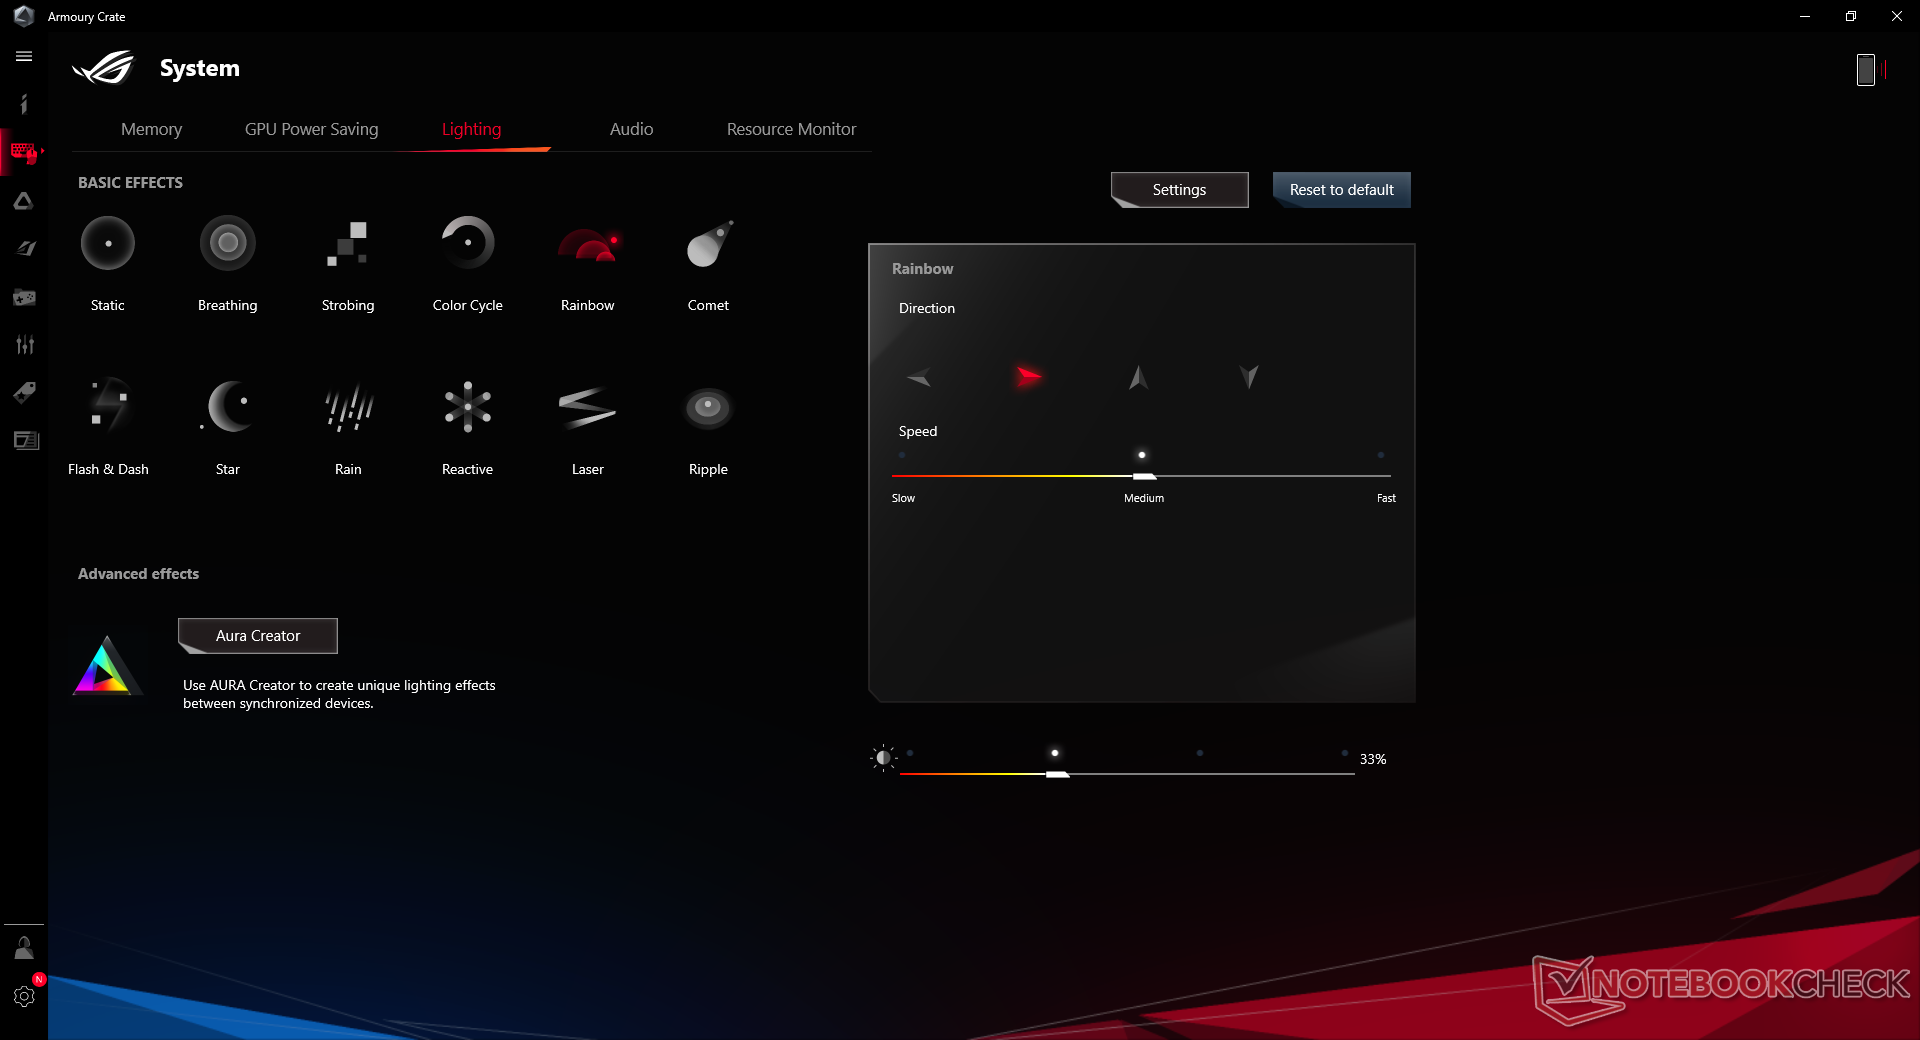
We highly recommend users become familiar with the pre-installed Asus Armoury Crate software as the power profiles here override the basic Windows power profiles. Furthermore, all lighting effects are toggled here as well. Our unit was set to Turbo mode prior to running any performance benchmarks below for the highest scores possible.
The system comes with both Nvidia Optimus and resizable bar. Advanced Optimus and G-Sync, however, are not supported on the main display.
Processor
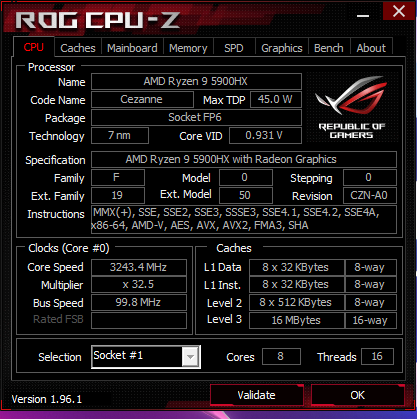
Like practically any other mobile Zen 2 or Zen 3 processor out there, the Ryzen 9 5900HX is insanely fast relative to what Intel has to offer. Raw multi-thread performance is comparable to the Core i9-11900K in the 17.3-inch Schenker XMG Ultra 17 while being about 10 percent slower in single-thread performance. Keep in mind that the aforementioned Core i9 is a costlier full-fledged 125 W TDP desktop processor in contrast to our 45 W mobile AMD processor.
When compared to the mobile Zen 2 series, however, the gen-to-gen performance increase is decent at best. Last year's Ryzen 7 4800H, for example, is only about 15 percent slower than the Ryzen 9 5900HX in both single- and multi-threaded loads. The Ryzen 4000H CPUs were already extremely impressive at launch and so it's perhaps not unexpected that the Ryzen 5000H series would be a more minor jump.
Cinebench R23: Multi Core | Single Core
Cinebench R15: CPU Multi 64Bit | CPU Single 64Bit
Blender: v2.79 BMW27 CPU
7-Zip 18.03: 7z b 4 -mmt1 | 7z b 4
Geekbench 5.5: Single-Core | Multi-Core
HWBOT x265 Benchmark v2.2: 4k Preset
LibreOffice : 20 Documents To PDF
R Benchmark 2.5: Overall mean
| Cinebench R23 / Multi Core | |
| AMD Ryzen 9 5900X | |
| MSI MEG Z590 ACE | |
| Schenker XMG Ultra 17 Rocket Lake | |
| Asus Strix Scar 17 G733QSA-XS99 | |
| Average AMD Ryzen 9 5900HX (6622 - 14363, n=30) | |
| Asus ROG Zephyrus G15 GA503Q | |
| Schenker XMG Neo 17 (Early 2021, RTX 3070, 5800H) | |
| Alienware m17 R4 | |
| MSI GE76 Raider 10UH | |
| Cinebench R23 / Single Core | |
| MSI MEG Z590 ACE | |
| Schenker XMG Ultra 17 Rocket Lake | |
| AMD Ryzen 9 5900X | |
| Asus Strix Scar 17 G733QSA-XS99 | |
| Asus ROG Zephyrus G15 GA503Q | |
| Average AMD Ryzen 9 5900HX (1218 - 1499, n=29) | |
| Schenker XMG Neo 17 (Early 2021, RTX 3070, 5800H) | |
| Alienware m17 R4 | |
| MSI GE76 Raider 10UH | |
| LibreOffice / 20 Documents To PDF | |
| Eluktronics RP-17 | |
| Asus ROG Zephyrus G15 GA503Q | |
| Schenker Compact 17 | |
| Average AMD Ryzen 9 5900HX (44.1 - 87.4, n=29) | |
| Asus Strix Scar 17 G732LXS | |
| Alienware m17 R4 | |
| MSI GP76 Leopard 10UG | |
| Schenker XMG Neo 17 (Early 2021, RTX 3070, 5800H) | |
| MSI GE76 Raider 10UH | |
| AMD Ryzen 9 5900X | |
| Asus Strix Scar 17 G733QSA-XS99 | |
| MSI MEG Z590 ACE | |
| Schenker XMG Ultra 17 Rocket Lake | |
Cinebench R23: Multi Core | Single Core
Cinebench R15: CPU Multi 64Bit | CPU Single 64Bit
Blender: v2.79 BMW27 CPU
7-Zip 18.03: 7z b 4 -mmt1 | 7z b 4
Geekbench 5.5: Single-Core | Multi-Core
HWBOT x265 Benchmark v2.2: 4k Preset
LibreOffice : 20 Documents To PDF
R Benchmark 2.5: Overall mean
* ... smaller is better
System Performance
PCMark results are excellent with scores that are consistently above other laptops equipped with the same GeForce RTX 3080 GPU.
We experienced a strange issue on our test unit where the display would sometimes remain blank after rebooting. We aren't able to reliably repeat the issue, but it did occur a handful of times during testing. A forced shutdown and reboot would solve the problem whenever it happened.
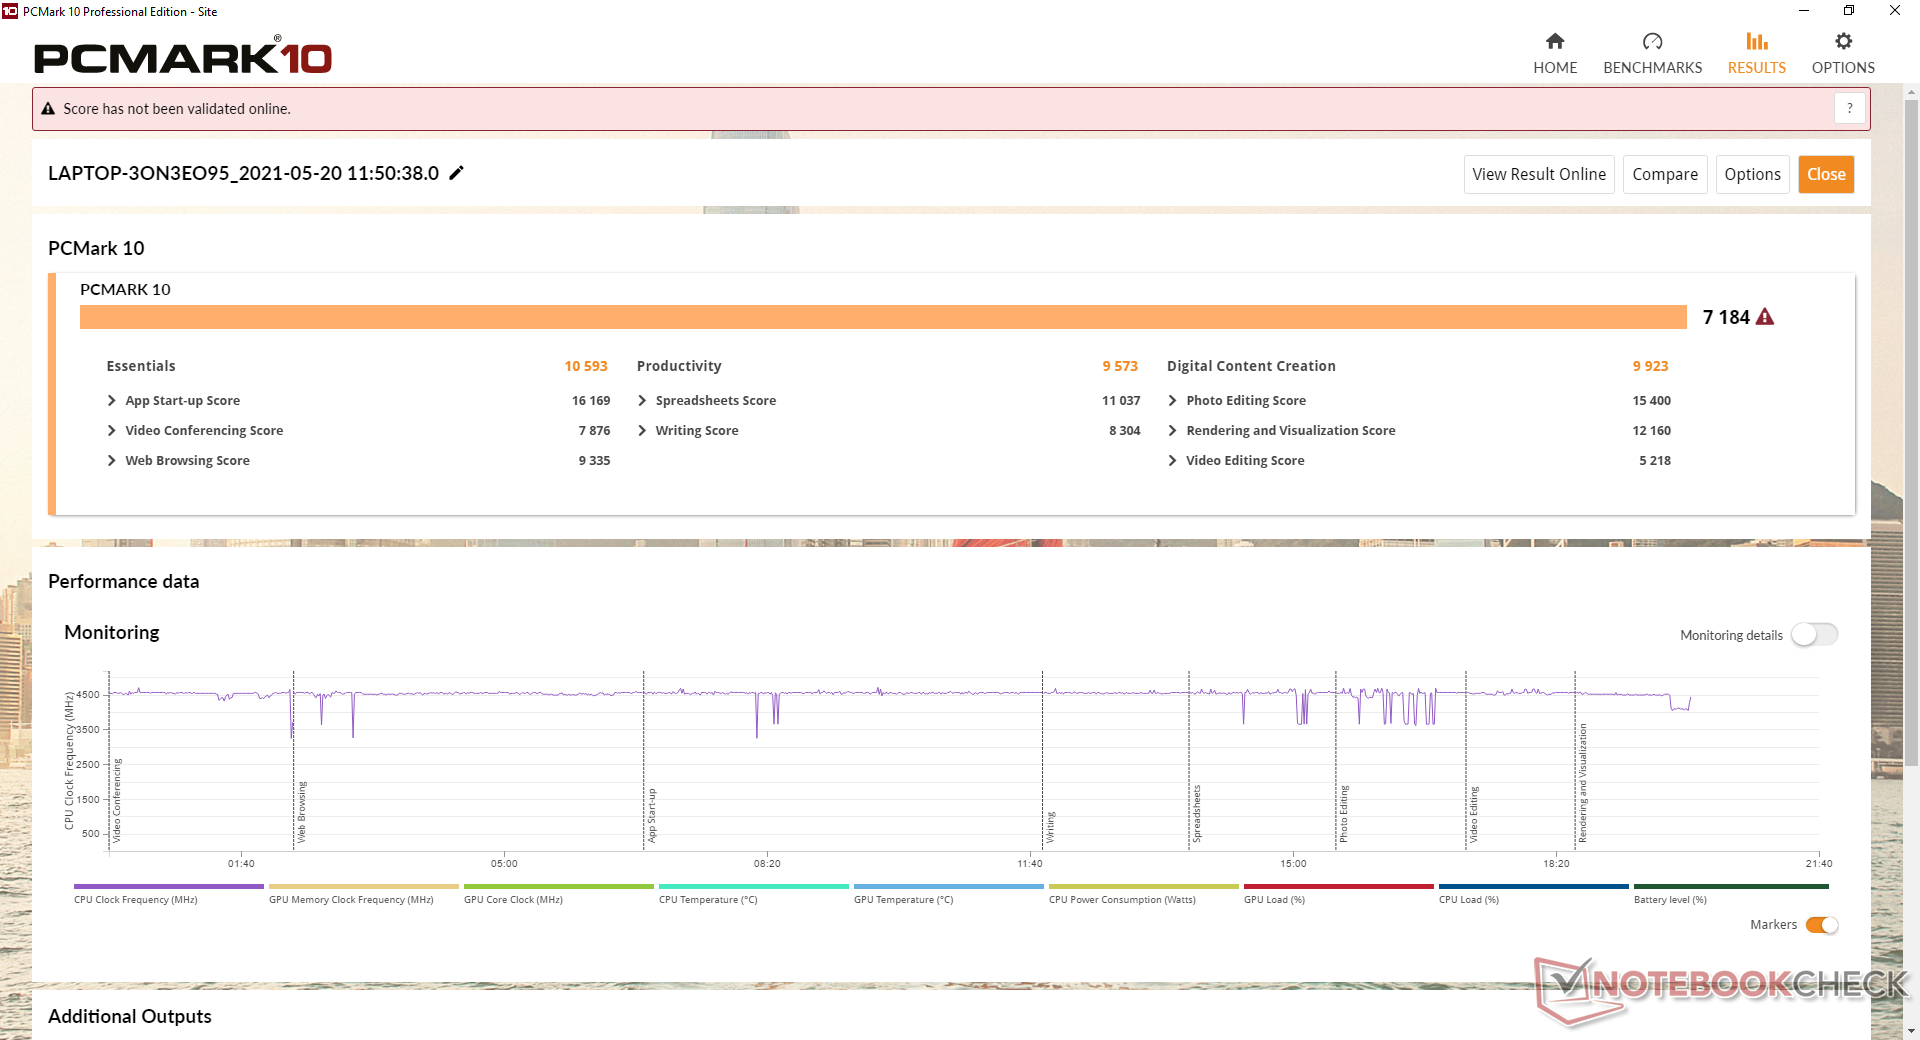
| PCMark 10 Score | 7184 points | |
Help | ||
DPC Latency
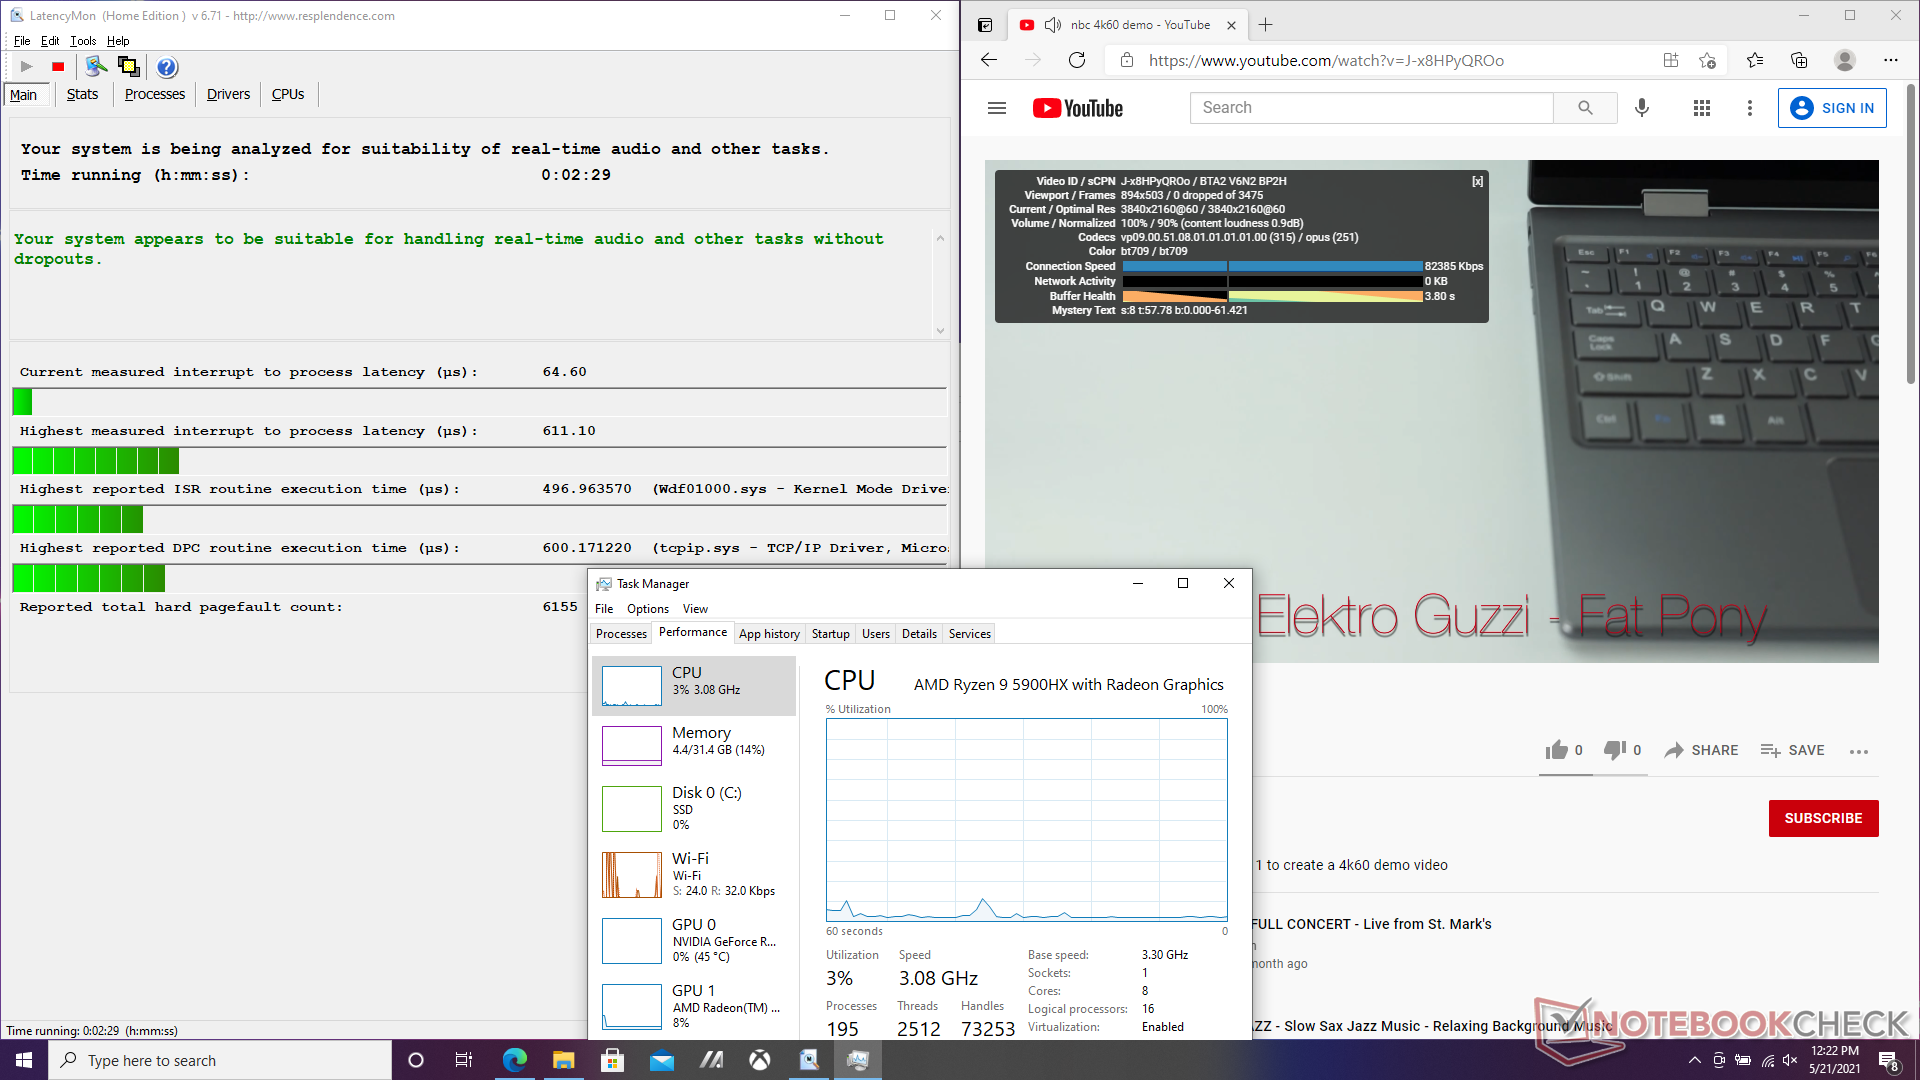
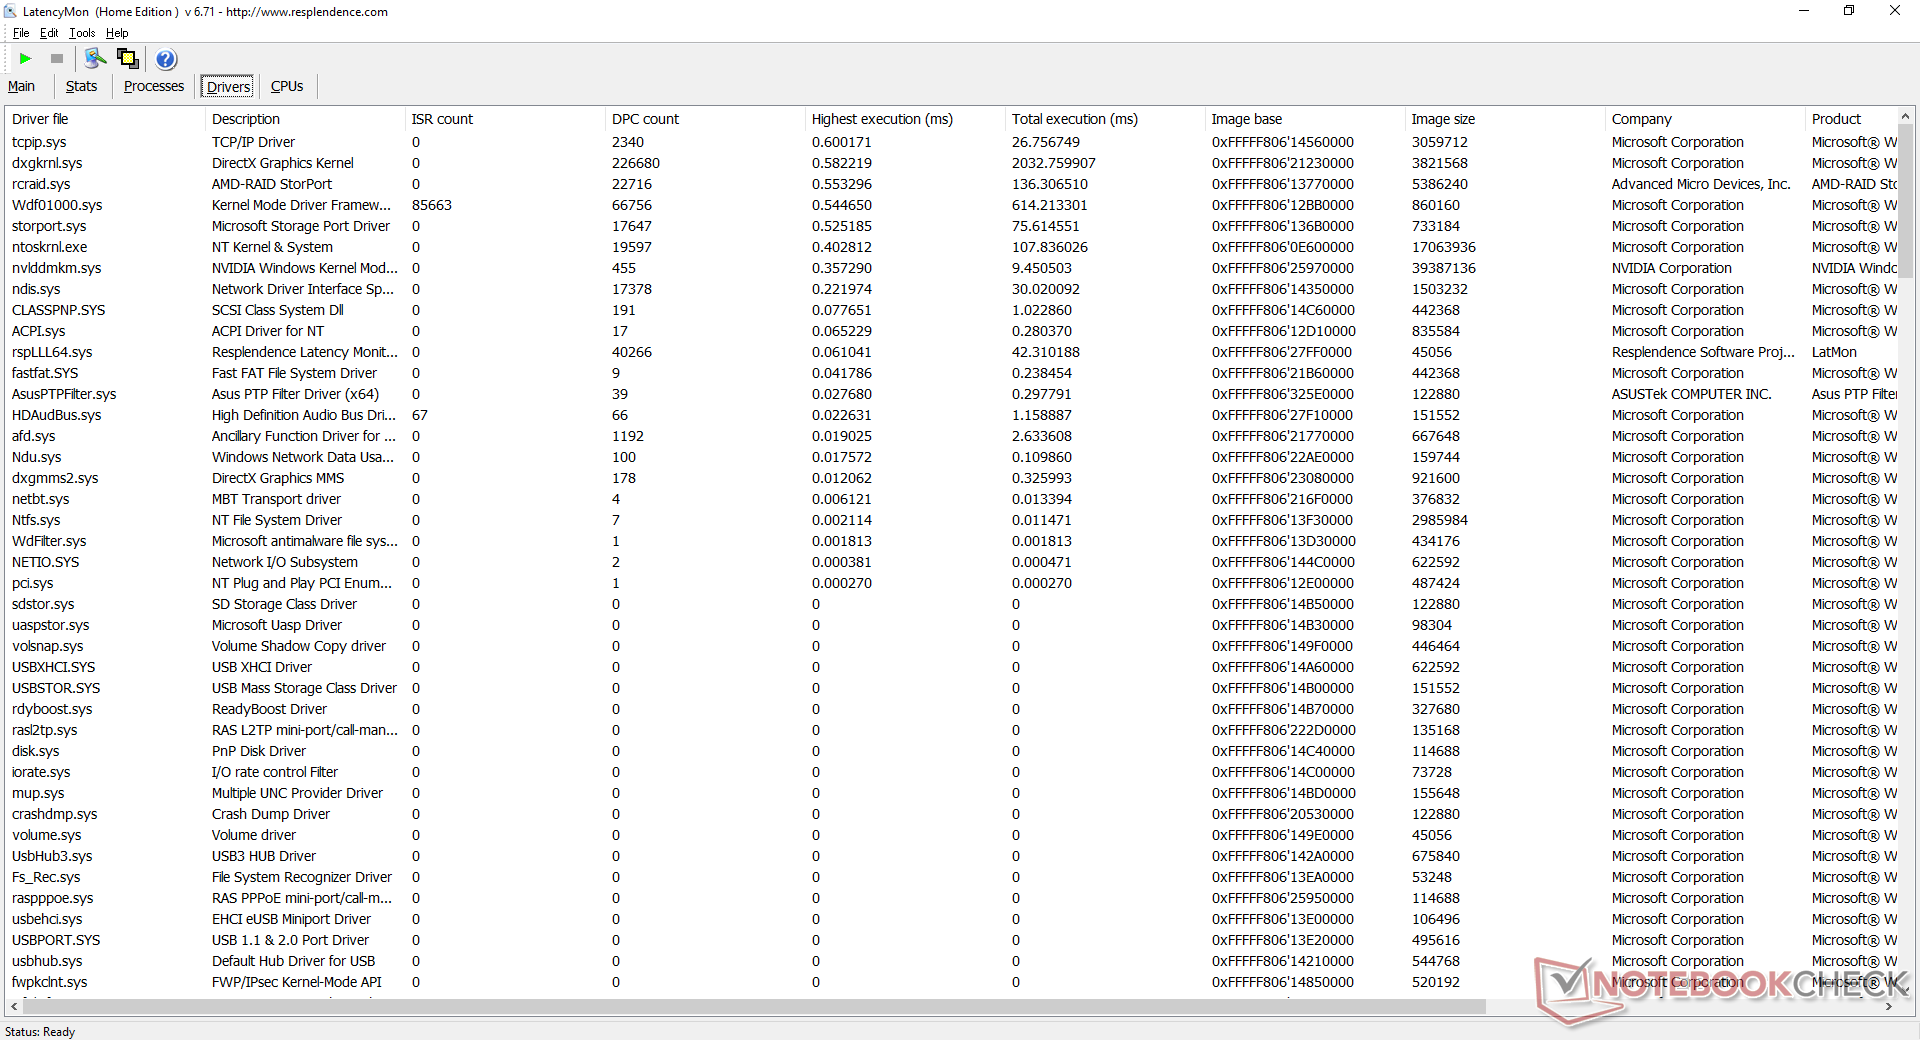
LatencyMon reveals no DPC latency issues when opening multiple tabs on our homepage. 4K video playback at 60 FPS is also perfect with very low CPU and GPU utilization and no dropped frames.
| DPC Latencies / LatencyMon - interrupt to process latency (max), Web, Youtube, Prime95 | |
| MSI GE76 Raider 10UH | |
| Asus Strix Scar 17 G732LXS | |
| Razer Blade Pro 17 2021 (QHD Touch) | |
| Asus Strix Scar 17 G733QSA-XS99 | |
| Alienware m17 R4 | |
| Asus Zephyrus S17 GX701LXS | |
* ... smaller is better
Storage Devices
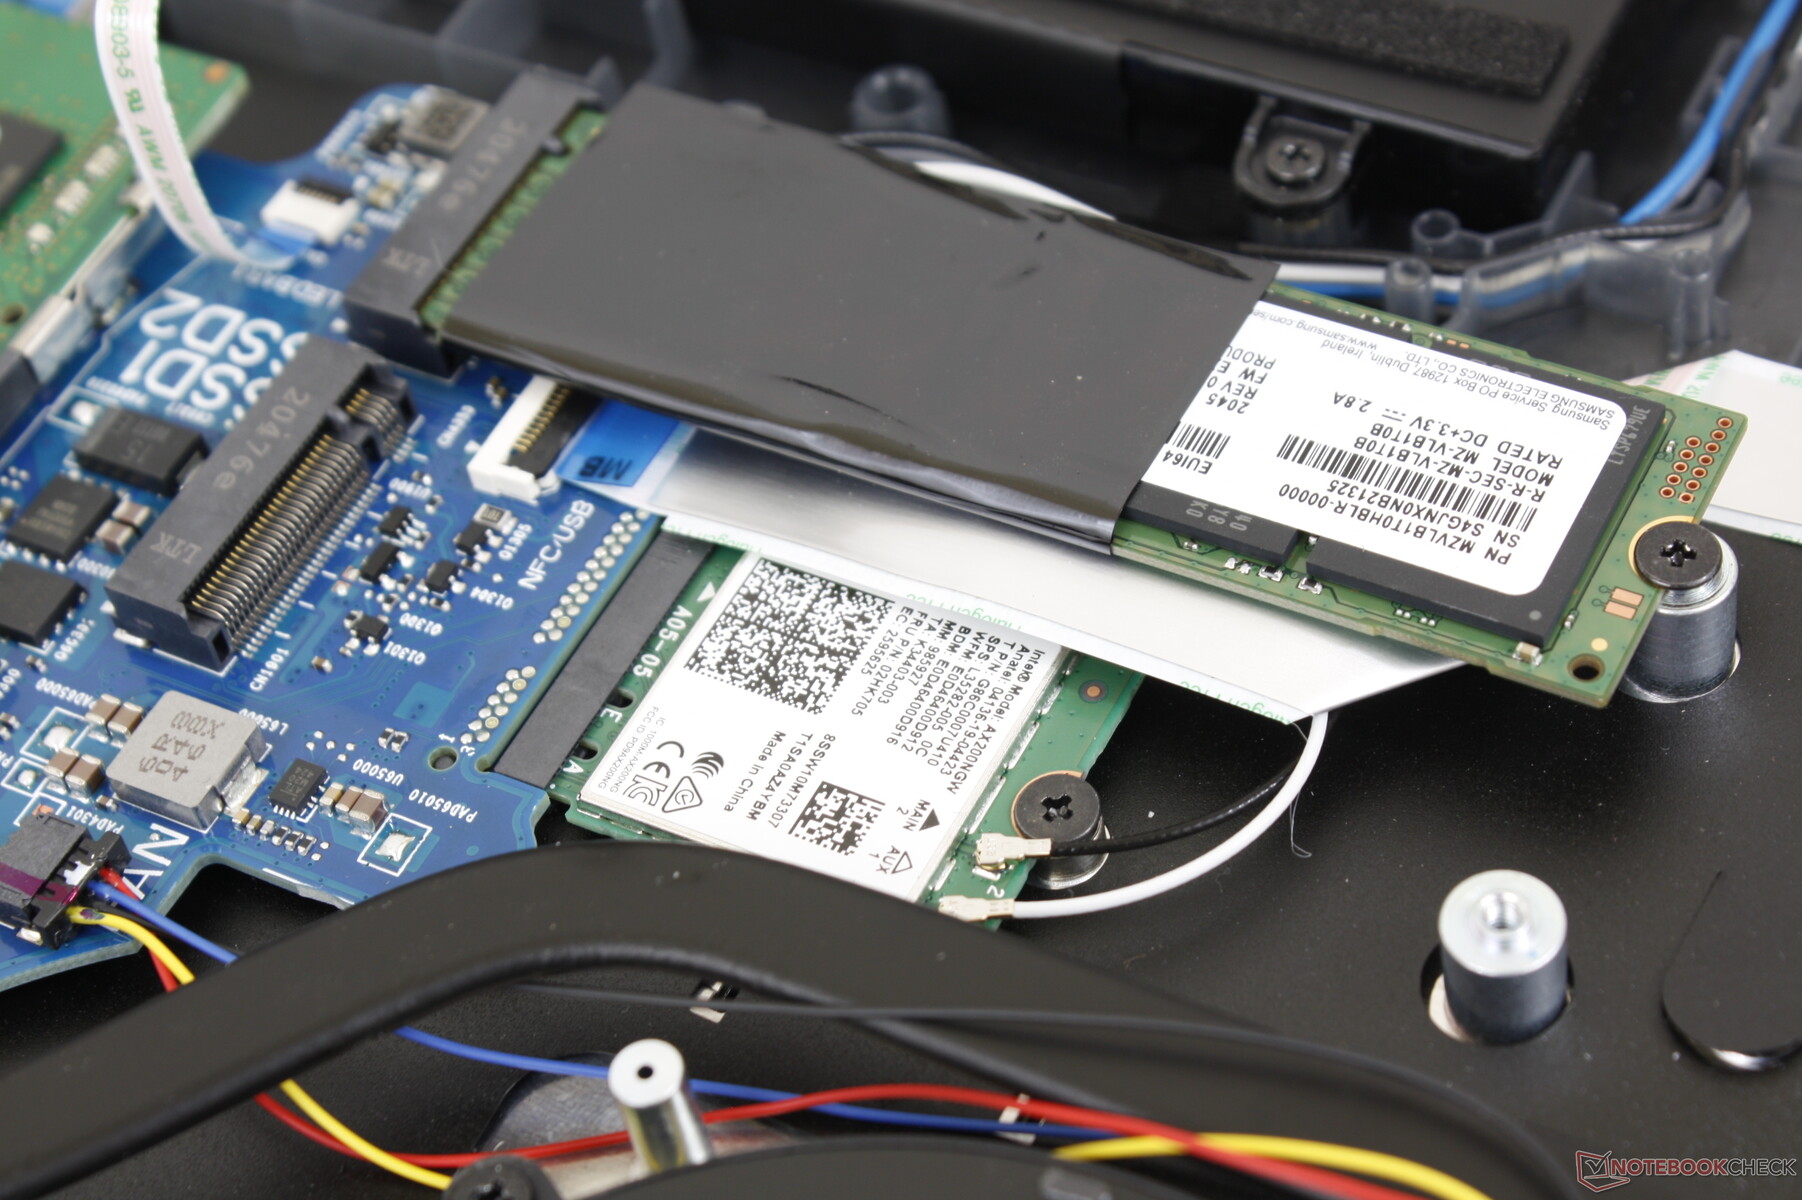
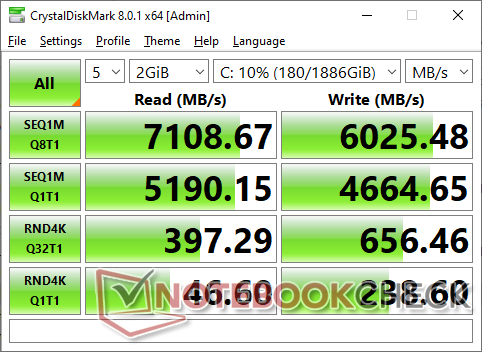
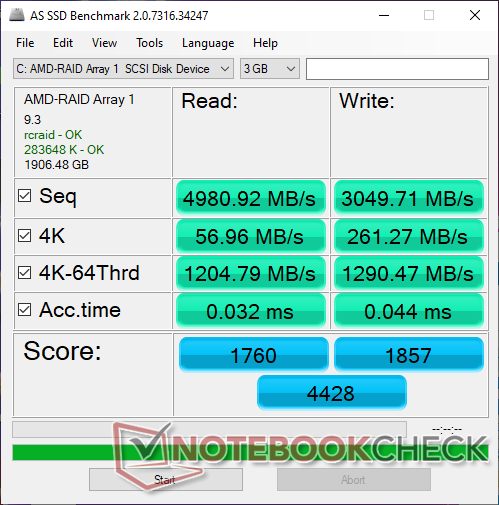
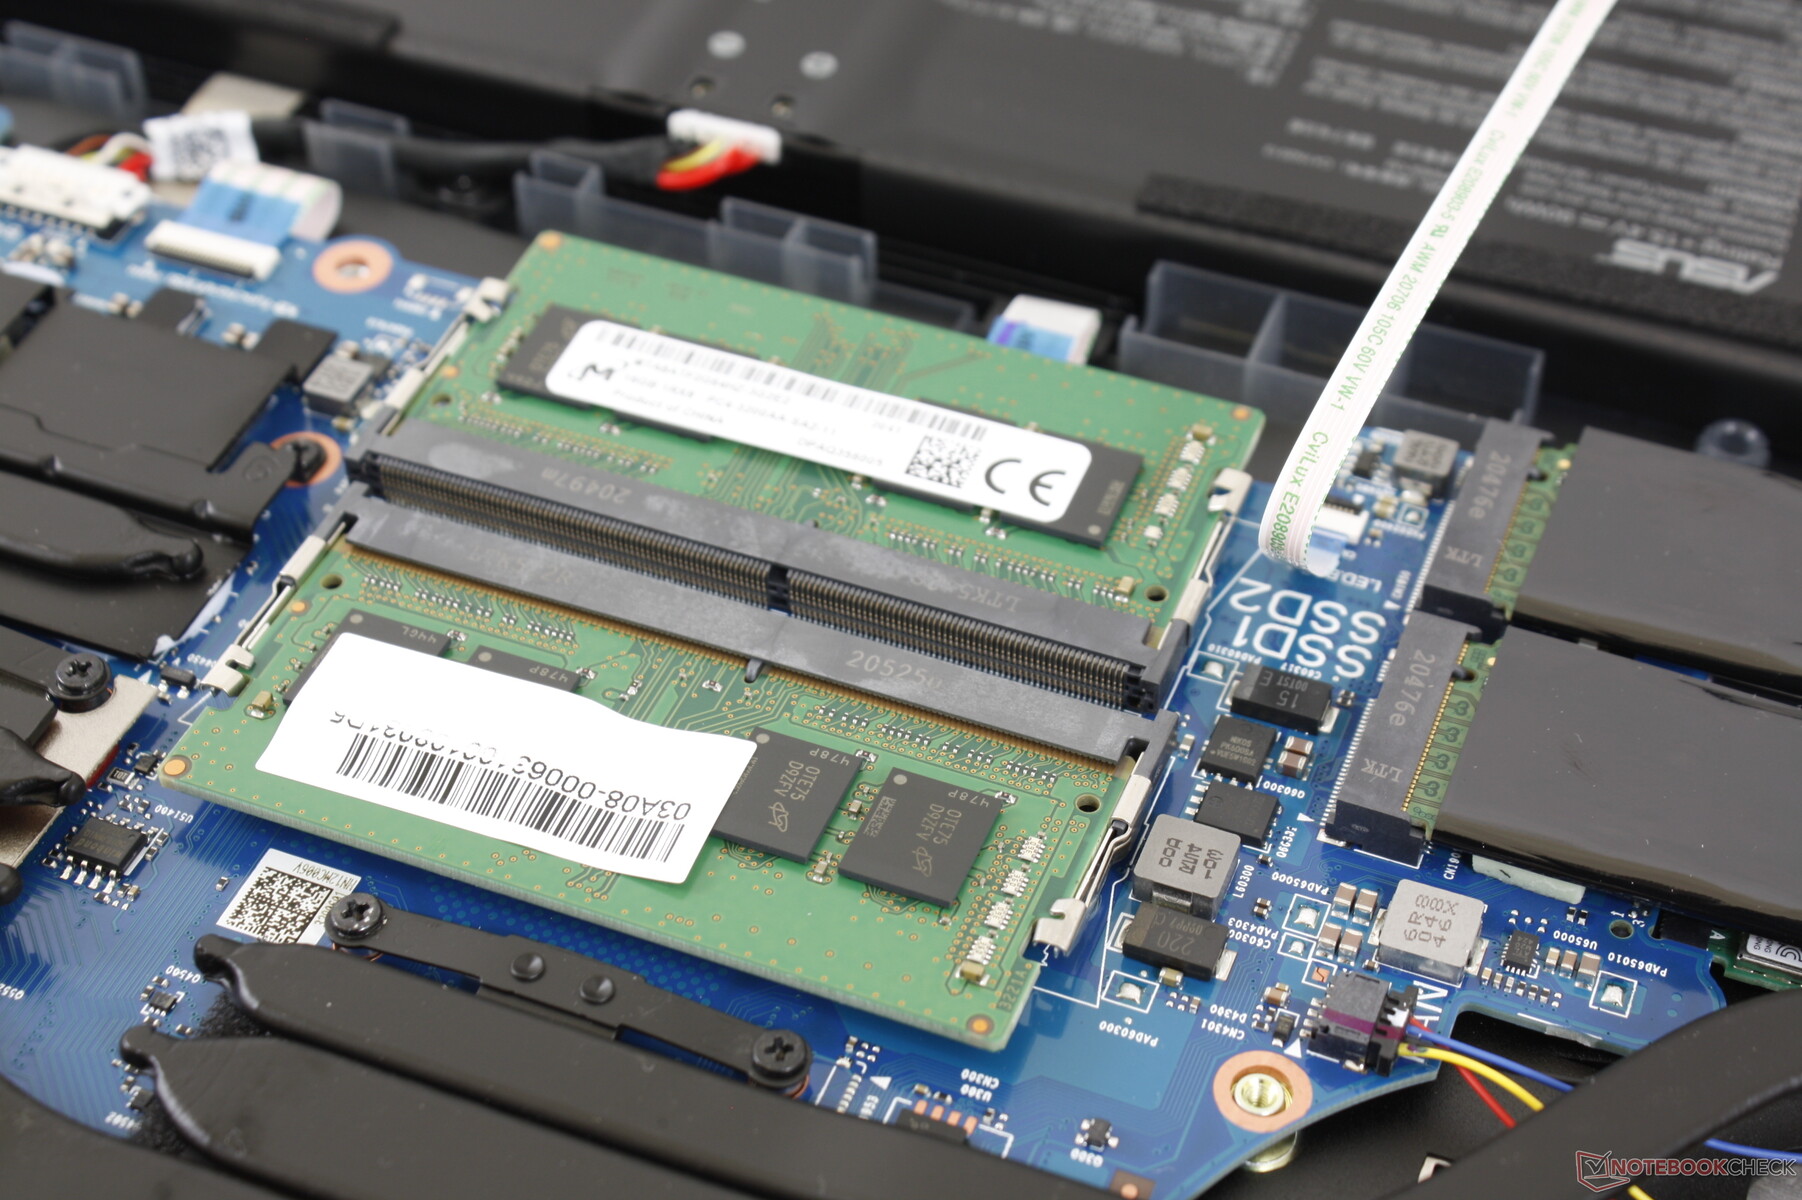
The G733 supports up to two M.2 PCIe 3.0 x4 drives down from three on last year's G732. Our test unit comes with two Samsung PM981a MZVLB1T0HBLR drives in RAID 0 for transfer rates surpassing 7000 MB/s, but we fully suspect next year's model to support PCIe 4.0 drives instead to achieve similar performance levels without RAID.
See our table of HDDs and SSDs for more benchmark comparisons.
| Asus Strix Scar 17 G733QSA-XS99 2x Samsung PM981a MZVLB1T0HBLR (RAID 0) | Asus Strix Scar 17 G732LXS 2x Intel SSD 660p 1TB SSDPEKNW010T8 (RAID 0) | MSI GE76 Raider 10UH WDC PC SN730 SDBPNTY-1T00 | Alienware m17 R4 2x Micron 2300 512 GB (RAID 0) | Asus Zephyrus S17 GX701LXS Samsung PM981a MZVLB1T0HBLR | |
|---|---|---|---|---|---|
| AS SSD | -54% | -32% | -31% | -20% | |
| Seq Read (MB/s) | 4981 | 2450 -51% | 2967 -40% | 2733 -45% | 2744 -45% |
| Seq Write (MB/s) | 3050 | 1436 -53% | 2604 -15% | 2822 -7% | 1351 -56% |
| 4K Read (MB/s) | 57 | 49.48 -13% | 42.97 -25% | 45.04 -21% | 47.24 -17% |
| 4K Write (MB/s) | 261.3 | 119.4 -54% | 107.8 -59% | 88.4 -66% | 109.1 -58% |
| 4K-64 Read (MB/s) | 1205 | 1032 -14% | 1684 40% | 1388 15% | 1118 -7% |
| 4K-64 Write (MB/s) | 1290 | 1229 -5% | 2164 68% | 1227 -5% | 1926 49% |
| Access Time Read * (ms) | 0.032 | 0.145 -353% | 0.116 -263% | 0.079 -147% | 0.064 -100% |
| Access Time Write * (ms) | 0.044 | 0.036 18% | 0.106 -141% | 0.095 -116% | 0.034 23% |
| Score Read (Points) | 1760 | 1327 -25% | 2023 15% | 1706 -3% | 1439 -18% |
| Score Write (Points) | 1857 | 1492 -20% | 2532 36% | 1598 -14% | 2170 17% |
| Score Total (Points) | 4428 | 3456 -22% | 5571 26% | 4184 -6% | 4283 -3% |
| Copy ISO MB/s (MB/s) | 3357 | 2106 -37% | 2414 -28% | ||
| Copy Program MB/s (MB/s) | 966 | 687 -29% | 1030 7% | ||
| Copy Game MB/s (MB/s) | 2051 | 1590 -22% | 1991 -3% | ||
| CrystalDiskMark 5.2 / 6 | -36% | -29% | -29% | -39% | |
| Write 4K (MB/s) | 235.9 | 125.8 -47% | 157.1 -33% | 93.1 -61% | 120 -49% |
| Read 4K (MB/s) | 48.02 | 52.9 10% | 46.3 -4% | 46.79 -3% | 45.24 -6% |
| Write Seq (MB/s) | 4822 | 1795 -63% | 2396 -50% | 2853 -41% | 2090 -57% |
| Read Seq (MB/s) | 5043 | 2315 -54% | 2245 -55% | 2556 -49% | 2246 -55% |
| Write 4K Q32T1 (MB/s) | 625 | 407.1 -35% | 436.1 -30% | 475 -24% | 392.5 -37% |
| Read 4K Q32T1 (MB/s) | 392.3 | 411.9 5% | 524 34% | 529 35% | 348.4 -11% |
| Write Seq Q32T1 (MB/s) | 5350 | 2844 -47% | 3086 -42% | 3331 -38% | 3015 -44% |
| Read Seq Q32T1 (MB/s) | 7130 | 3130 -56% | 3363 -53% | 3319 -53% | 3445 -52% |
| Total Average (Program / Settings) | -45% /
-46% | -31% /
-31% | -30% /
-31% | -30% /
-28% |
* ... smaller is better

Disk Throttling: DiskSpd Read Loop, Queue Depth 8
GPU Performance
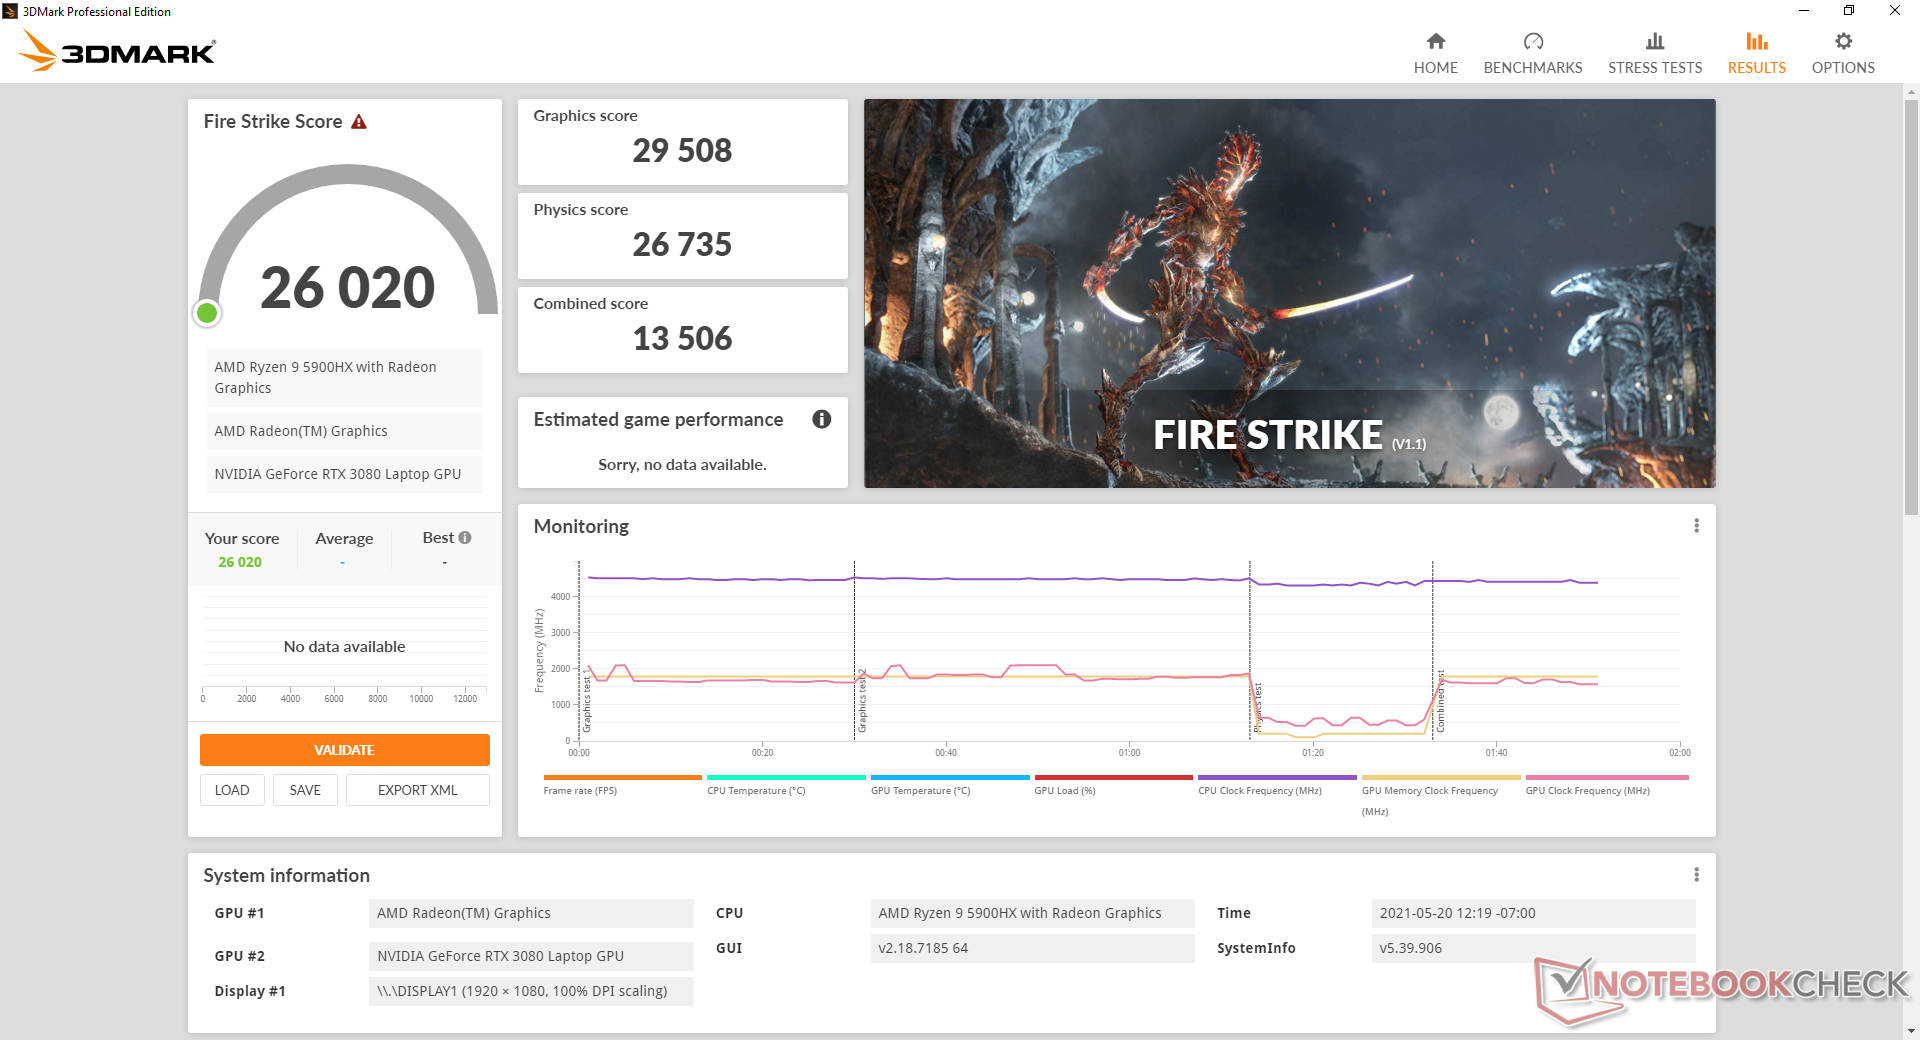
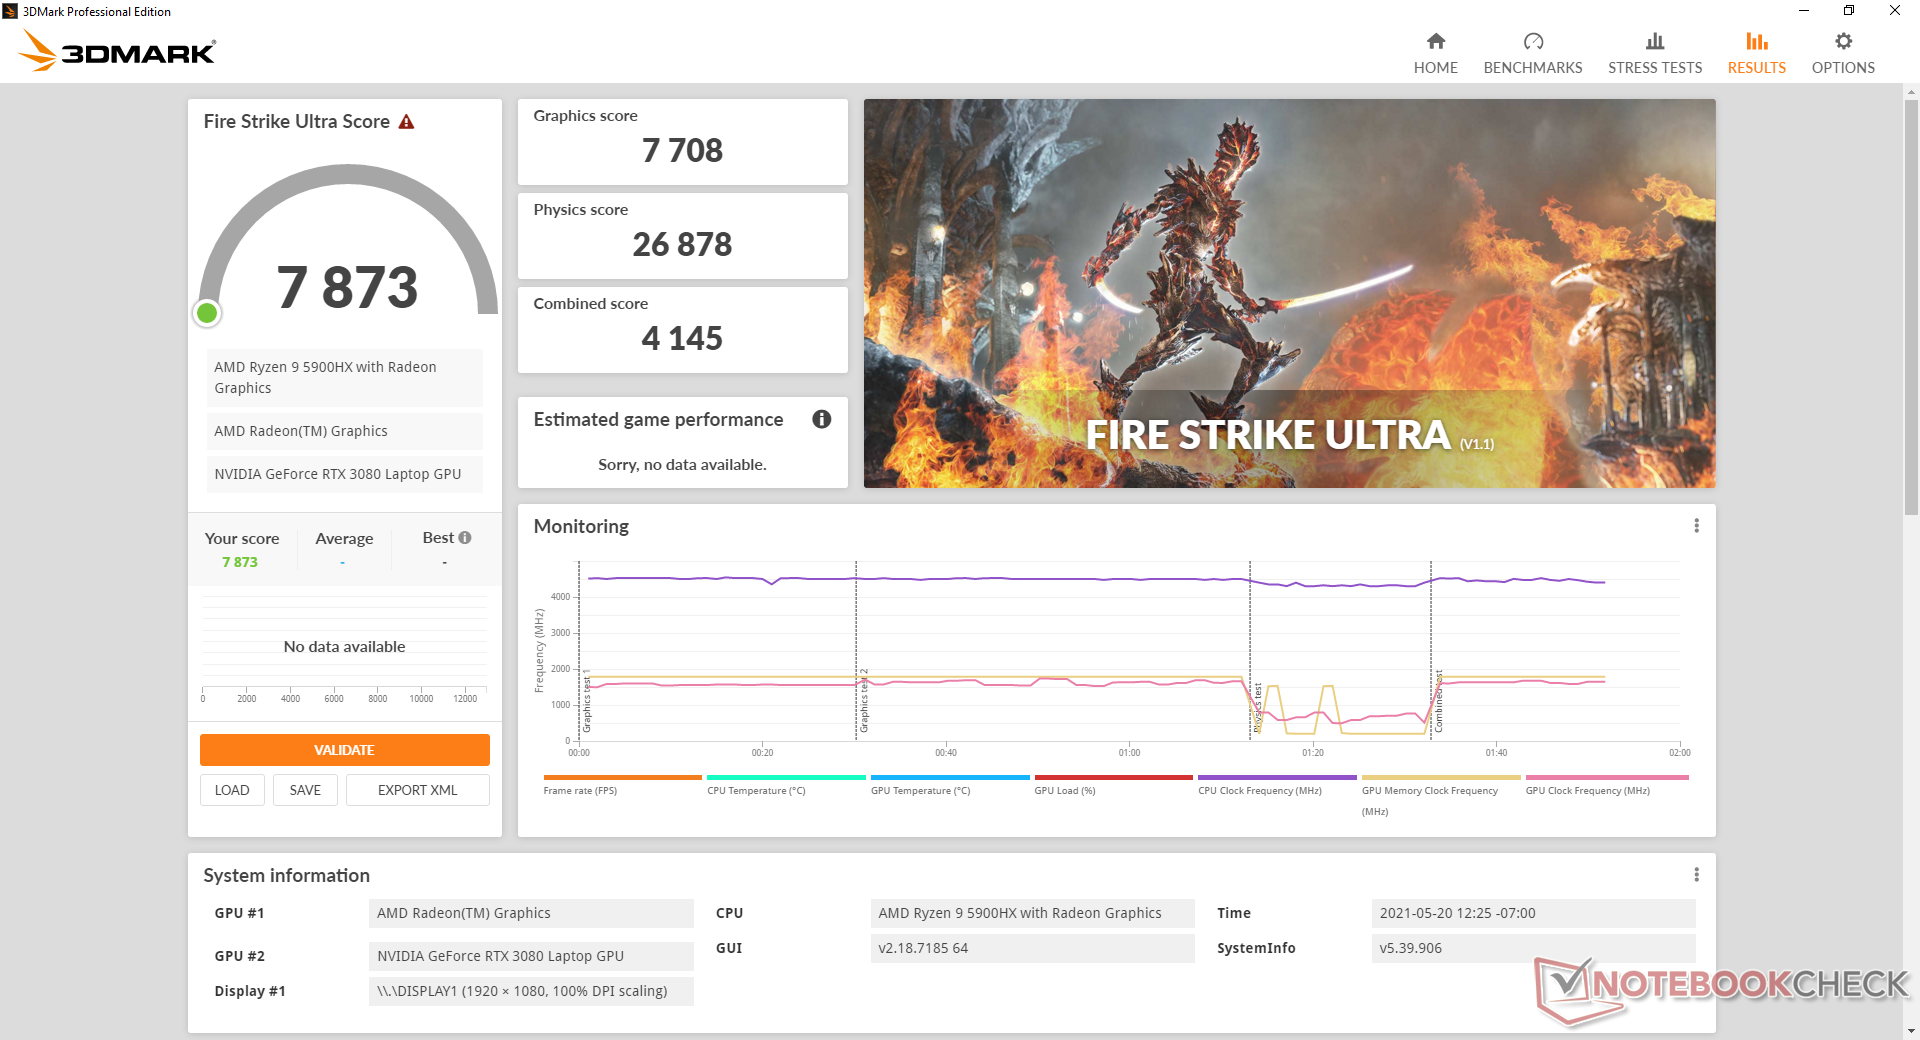
Our 130 W GeForce RTX 3080 is within 5 percent of the average laptop in our database equipped with the same GeForce RTX 3080 GPU. Perhaps most notably, 3DMark scores are about 25 to 30 percent higher than on the Asus ROG Zephyrus G15 which comes with the less demanding 100 W GeForce RTX 3080. Users upgrading from an older GTX 1080 or RTX 2080 laptop will see a graphics boost of roughly 70 percent and 15 percent, respectively.
In most cases, frame rates are within 2 to 3 percent of the average laptop equipped with the same GeForce RTX 3080 GPU and since most of these laptops are powered by Intel CPUs, we can safely say that our AMD system is comparable to any 10th gen Intel counterpart when gaming. The single exception out of the 9 tested games is Strange Brigade where our AMD system would score 10 percent slower than the average.
The desktop GeForce RTX 3080 is still noticeably faster any GeForce RTX 3080 laptop. In this case, our reference MSI GeForce RTX 3080 desktop PC outperforms our Asus laptop by about 25 to 50 percent.
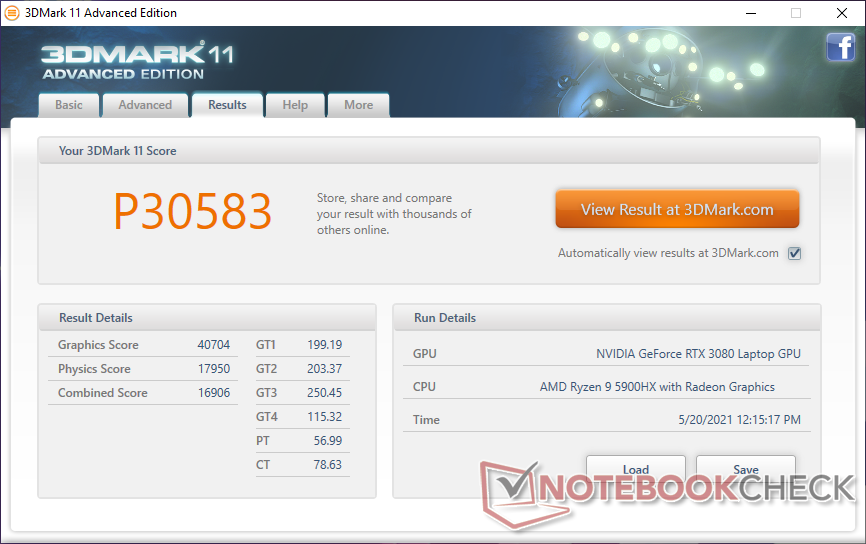
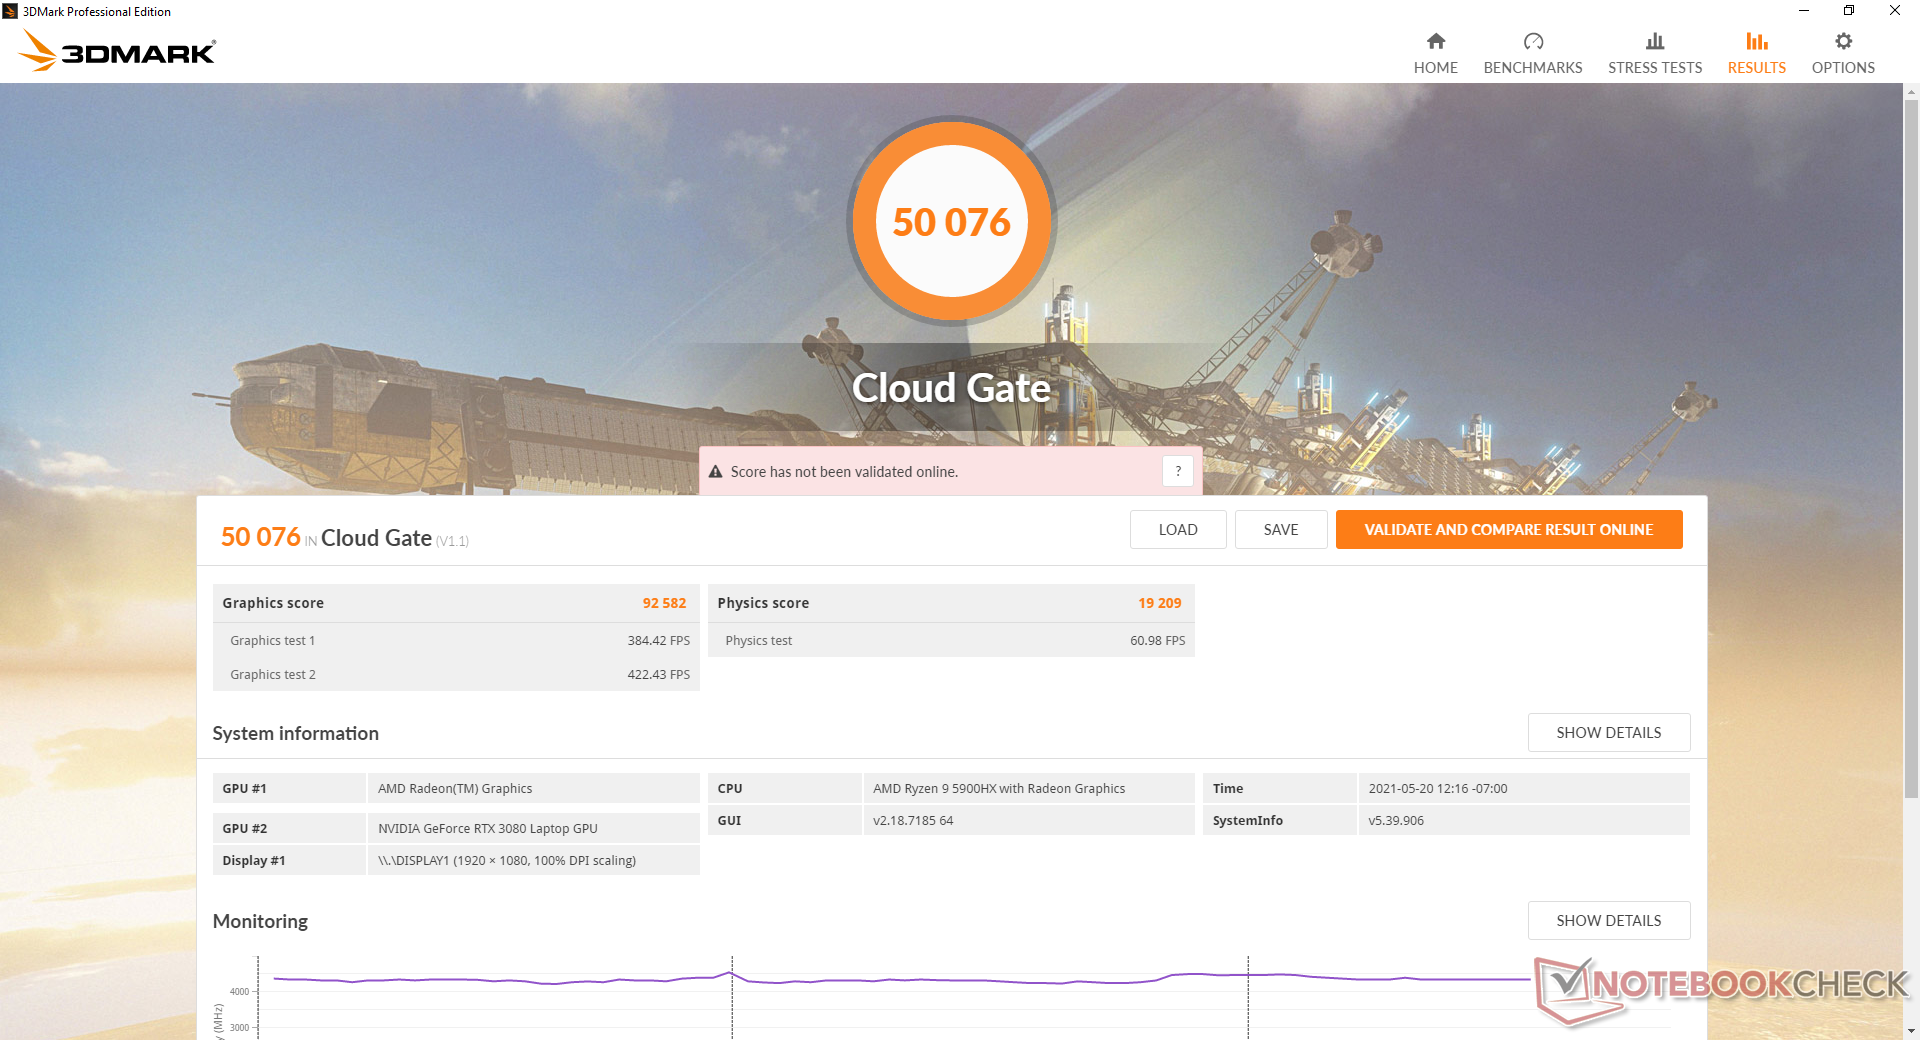
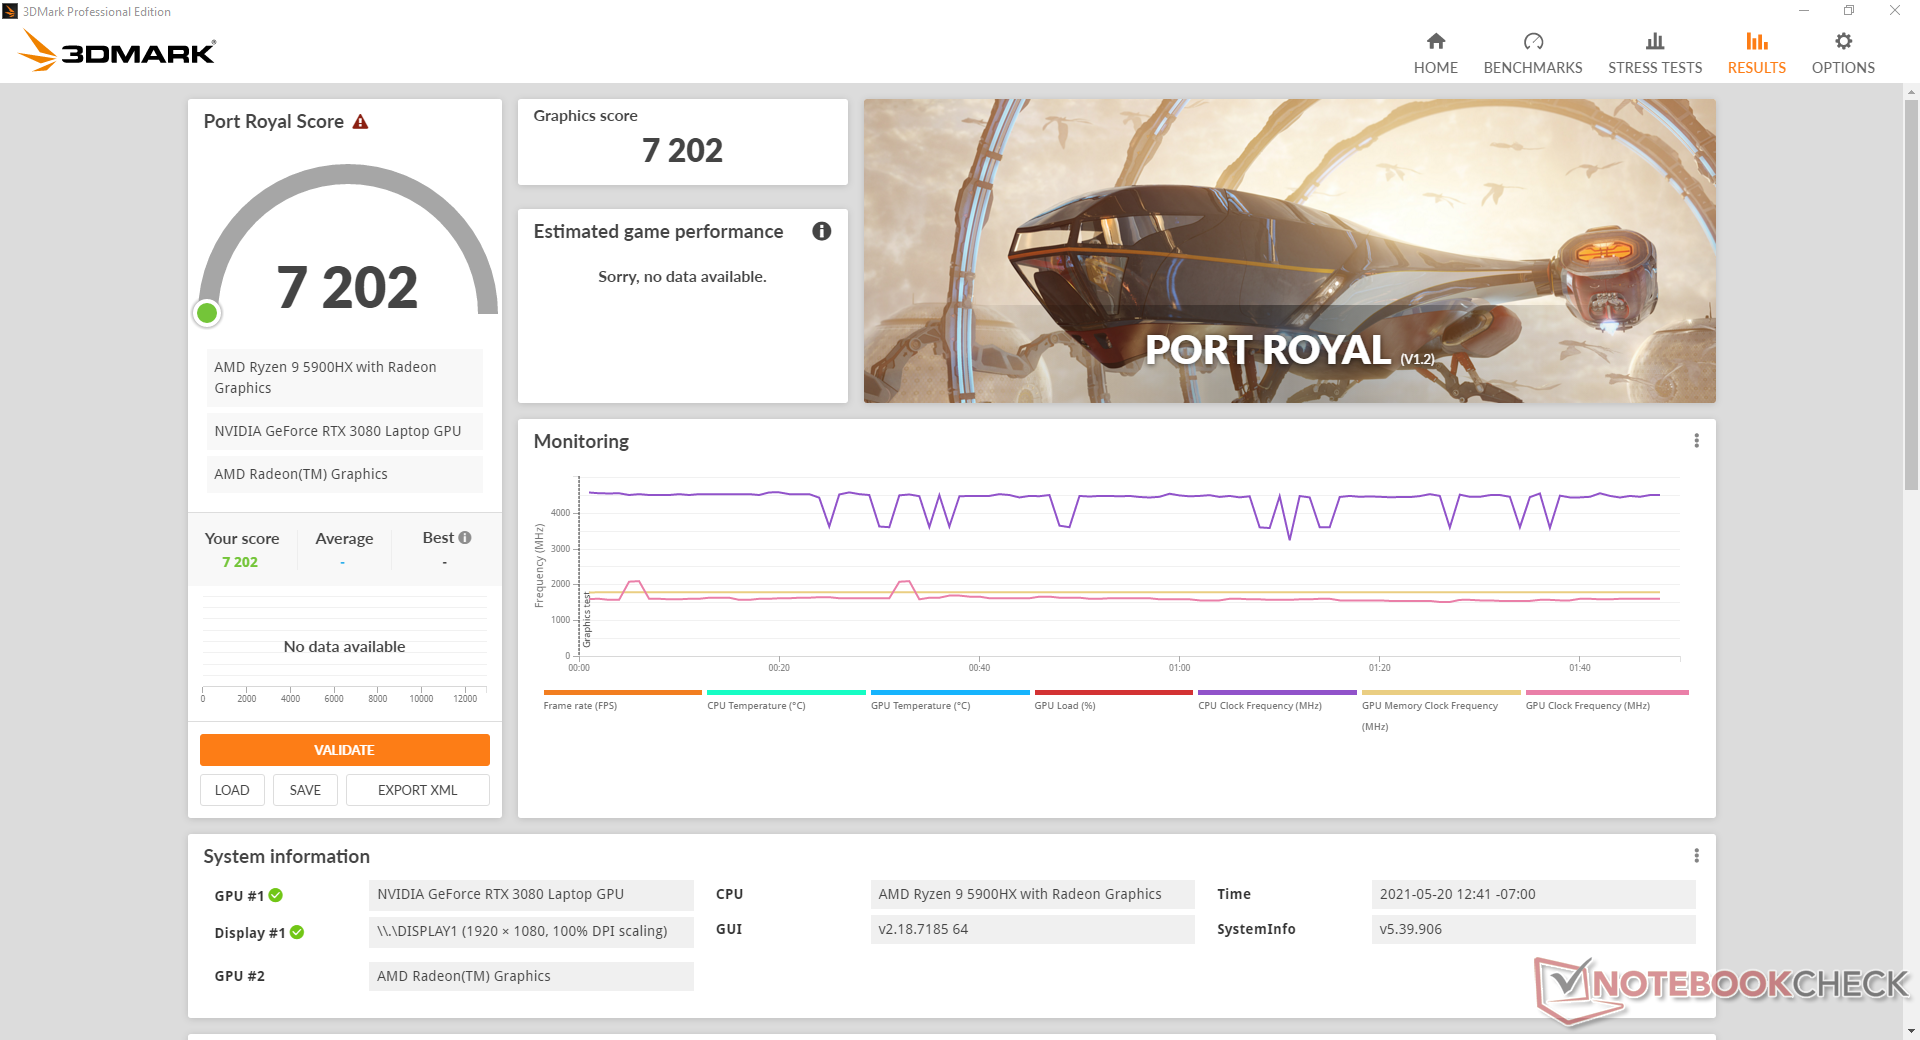
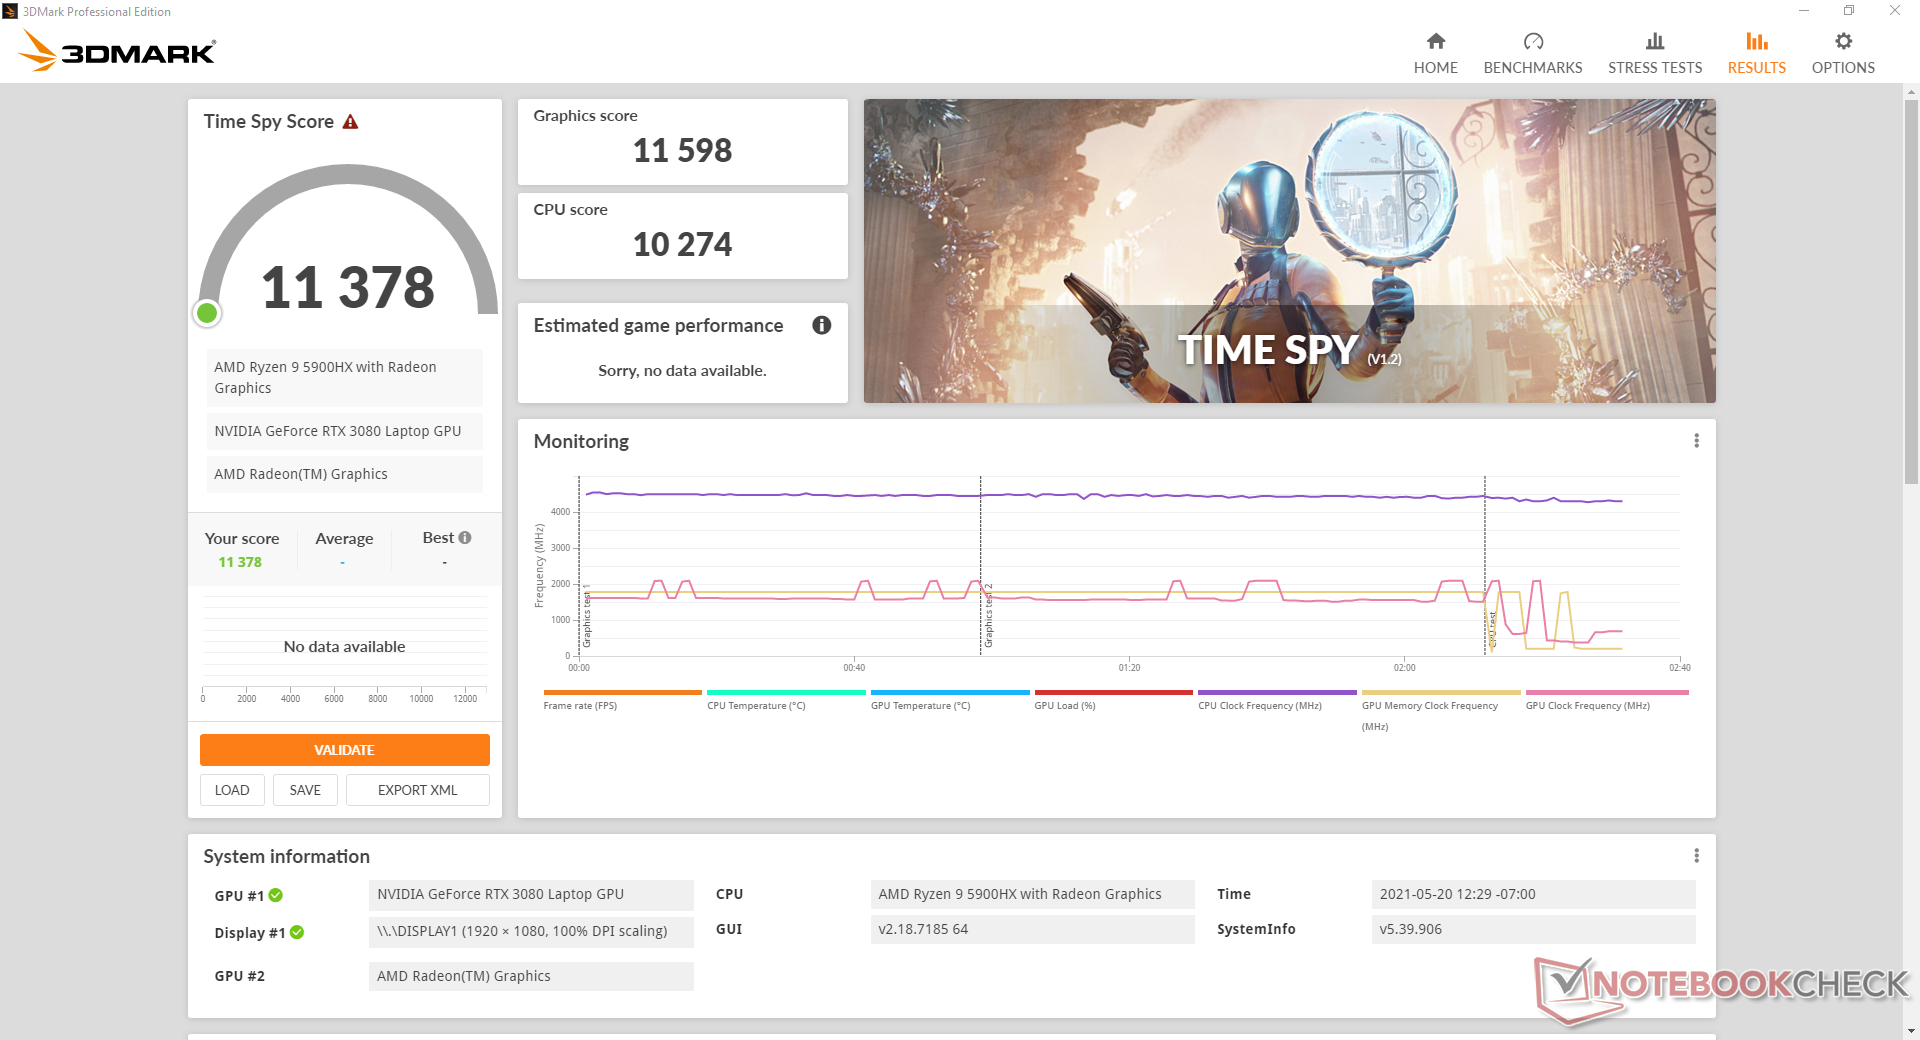
| 3DMark 11 Performance | 30583 points | |
| 3DMark Cloud Gate Standard Score | 50076 points | |
| 3DMark Fire Strike Score | 26020 points | |
| 3DMark Time Spy Score | 11378 points | |
Help | ||
Frame rates are consistent when idling on Witcher 3 save for a single short-lived dip to the 40 FPS range. The drop appears to be an outlier as it only occurred once during the hour-long test.
| low | med. | high | ultra | |
|---|---|---|---|---|
| GTA V (2015) | 179 | 156 | 93 | |
| The Witcher 3 (2015) | 318.8 | 184.9 | 105.5 | |
| Dota 2 Reborn (2015) | 153 | 146 | 130 | 123 |
| Final Fantasy XV Benchmark (2018) | 177 | 136 | 106 | |
| X-Plane 11.11 (2018) | 104 | 92.6 | 75.9 | |
| Far Cry 5 (2018) | 143 | 122 | 117 | 111 |
| Strange Brigade (2018) | 344 | 205 | 189 | 175 |
| Assassin´s Creed Valhalla (2020) | 127 | 98 | 85 | 76 |
Emissions
System Noise
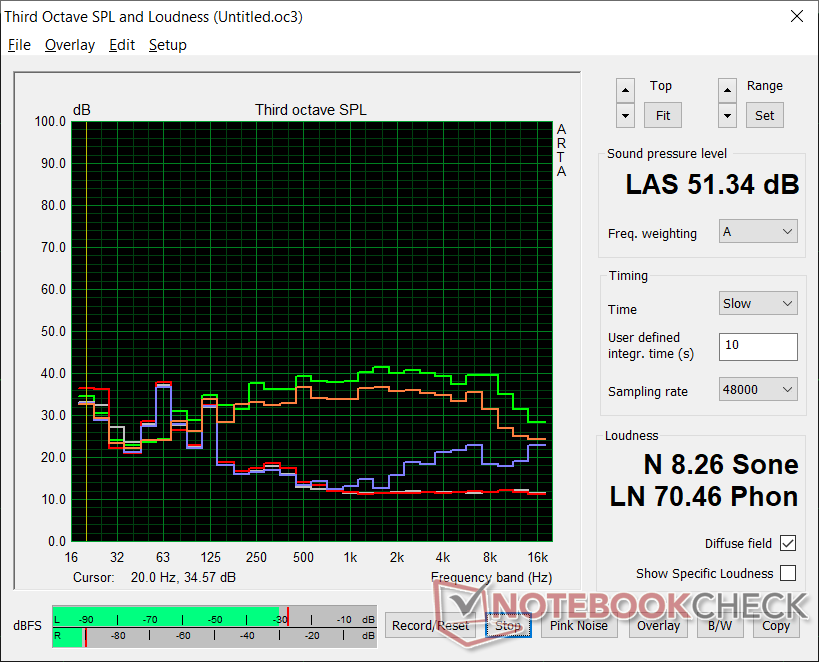
Fan behavior is intimately tied to Asus' Armoury Crate software. When gaming on Balanced or Windows mode, fan noise would top out at 46.9 dB(A). Setting the system to Turbo mode would raise the ceiling to 51.3 dB(A) which is about average for a high-end gaming laptop. CPU and GPU clock rates are at their highest only when set to Turbo mode meaning users must succumb to louder fan noise if they desire maximum frame rates.
Conversely, fan noise is surprisingly quiet under most day-to-day scenarios if set to Balanced mode or lower. A 90-second run on 3DMark 06 would induce a noise of just under 31 dB(A) compared to >40 dB(A) on most other gaming laptops to suggest that the fans in the Asus can remain quieter for longer. If streaming 4K video, fan noise would remain constant at about 31.2 dB(A) which is just barely audible in most scenarios.
| Asus Strix Scar 17 G733QSA-XS99 GeForce RTX 3080 Laptop GPU, R9 5900HX, 2x Samsung PM981a MZVLB1T0HBLR (RAID 0) | Asus Strix Scar 17 G732LXS GeForce RTX 2080 Super Mobile, i9-10980HK, 2x Intel SSD 660p 1TB SSDPEKNW010T8 (RAID 0) | MSI GE76 Raider 10UH GeForce RTX 3080 Laptop GPU, i7-10870H, WDC PC SN730 SDBPNTY-1T00 | Alienware m17 R4 GeForce RTX 3080 Laptop GPU, i9-10980HK, 2x Micron 2300 512 GB (RAID 0) | Razer Blade Pro 17 2021 (QHD Touch) GeForce RTX 3080 Laptop GPU, i7-10875H, Samsung PM981a MZVLB1T0HBLR | Asus Zephyrus S17 GX701LXS GeForce RTX 2080 Super Max-Q, i7-10875H, Samsung PM981a MZVLB1T0HBLR | |
|---|---|---|---|---|---|---|
| Noise | -34% | -2% | -10% | -13% | -21% | |
| off / environment * (dB) | 25 | 25 -0% | 25.3 -1% | 24 4% | 26.1 -4% | 25 -0% |
| Idle Minimum * (dB) | 25.2 | 33 -31% | 26.1 -4% | 24 5% | 26.1 -4% | 32 -27% |
| Idle Average * (dB) | 25.2 | 38 -51% | 26.1 -4% | 25 1% | 26.5 -5% | 35 -39% |
| Idle Maximum * (dB) | 25.2 | 45 -79% | 26.1 -4% | 36 -43% | 30.7 -22% | 43 -71% |
| Load Average * (dB) | 30.7 | 54 -76% | 37.2 -21% | 45 -47% | 43.5 -42% | 44 -43% |
| Witcher 3 ultra * (dB) | 51.3 | 50 3% | 36.8 28% | 47 8% | 54 -5% | 41 20% |
| Load Maximum * (dB) | 51.3 | 55 -7% | 56.9 -11% | 50 3% | 55 -7% | 45 12% |
* ... smaller is better
Noise level
| Idle |
| 25.2 / 25.2 / 25.2 dB(A) |
| Load |
| 30.7 / 51.3 dB(A) |
 | ||
30 dB silent 40 dB(A) audible 50 dB(A) loud |
||
min: | ||
Temperature
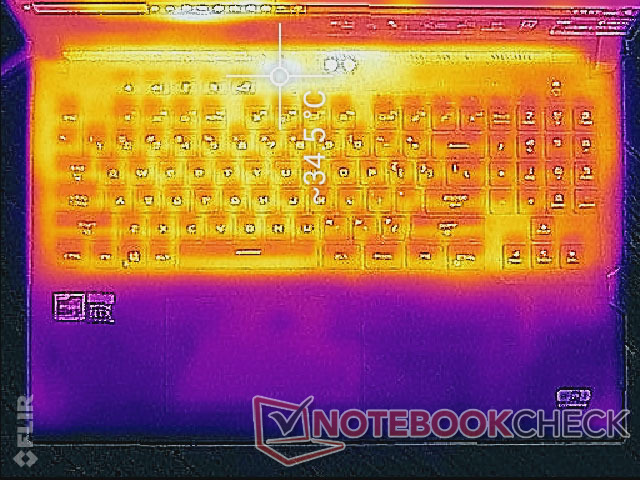
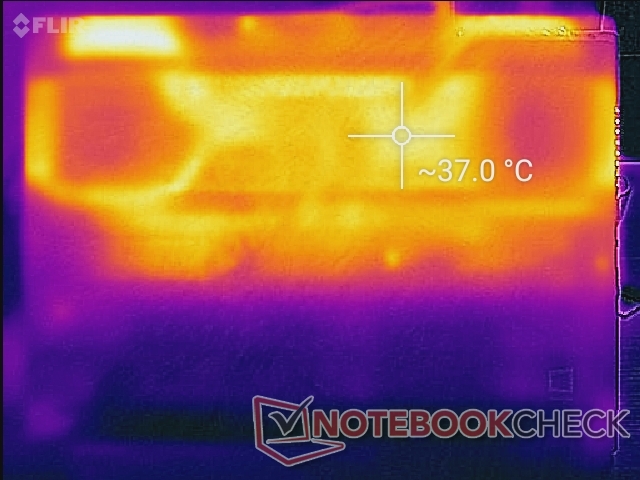
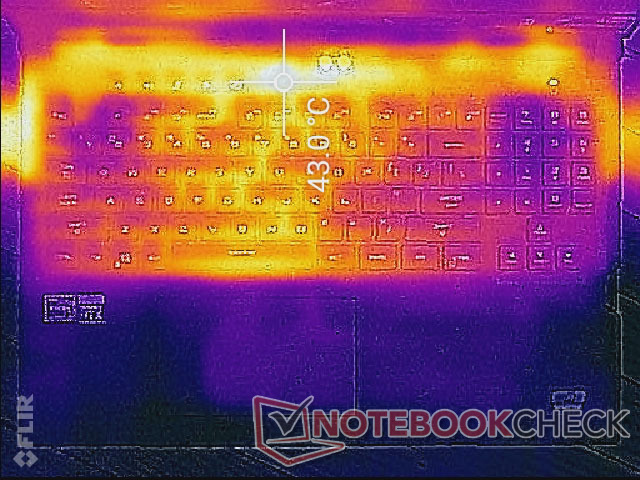
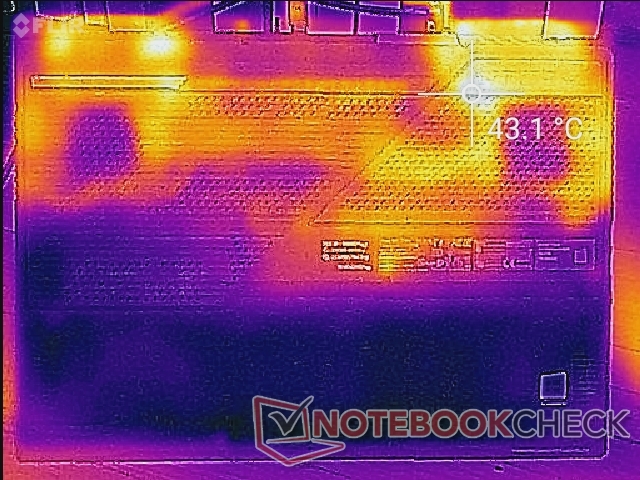
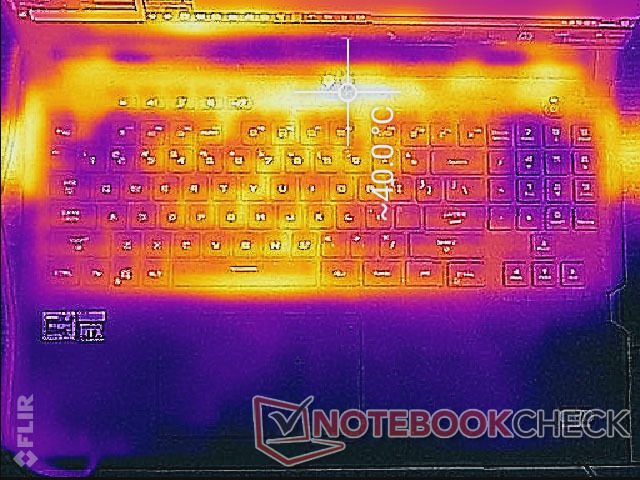
The clickpad and palm rests are always cool no matter the load since only the battery sits underneath them. When running higher loads like games, the keyboard center can be as warm as 38 C while the WASD keys and NumPad keys remain cooler at around 31 C each. Average surface temperature is a few degrees cooler than what we observed on the competing MSI GE76 on both the top and bottom sides.
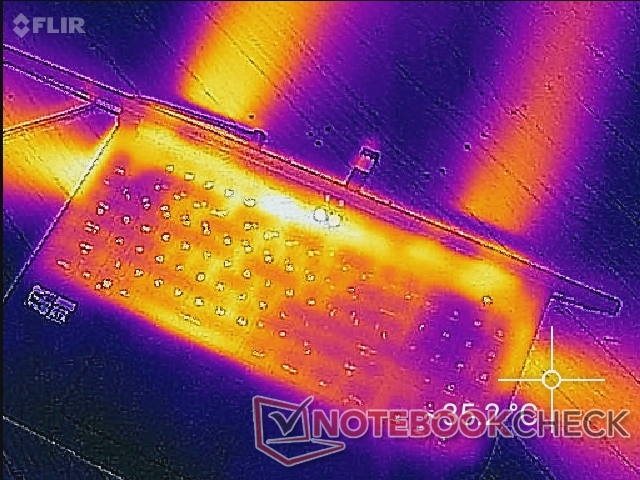
(±) The maximum temperature on the upper side is 40 °C / 104 F, compared to the average of 40.4 °C / 105 F, ranging from 21.2 to 68.8 °C for the class Gaming.
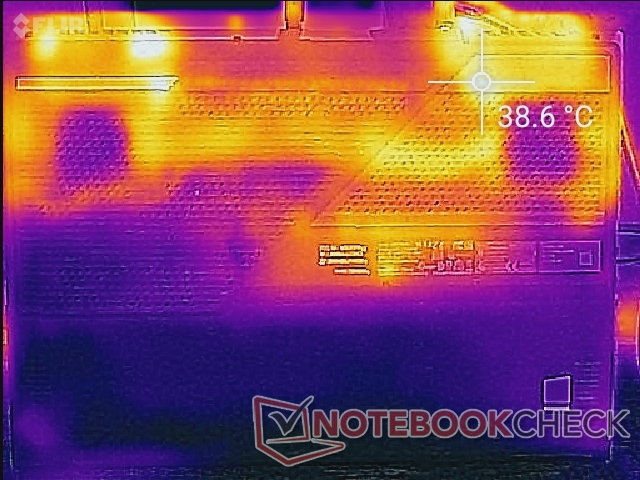
(+) The bottom heats up to a maximum of 39.8 °C / 104 F, compared to the average of 43.2 °C / 110 F
(+) In idle usage, the average temperature for the upper side is 28.3 °C / 83 F, compared to the device average of 33.9 °C / 93 F.
(±) Playing The Witcher 3, the average temperature for the upper side is 32.3 °C / 90 F, compared to the device average of 33.9 °C / 93 F.
(+) The palmrests and touchpad are cooler than skin temperature with a maximum of 23 °C / 73.4 F and are therefore cool to the touch.
(+) The average temperature of the palmrest area of similar devices was 28.8 °C / 83.8 F (+5.8 °C / 10.4 F).
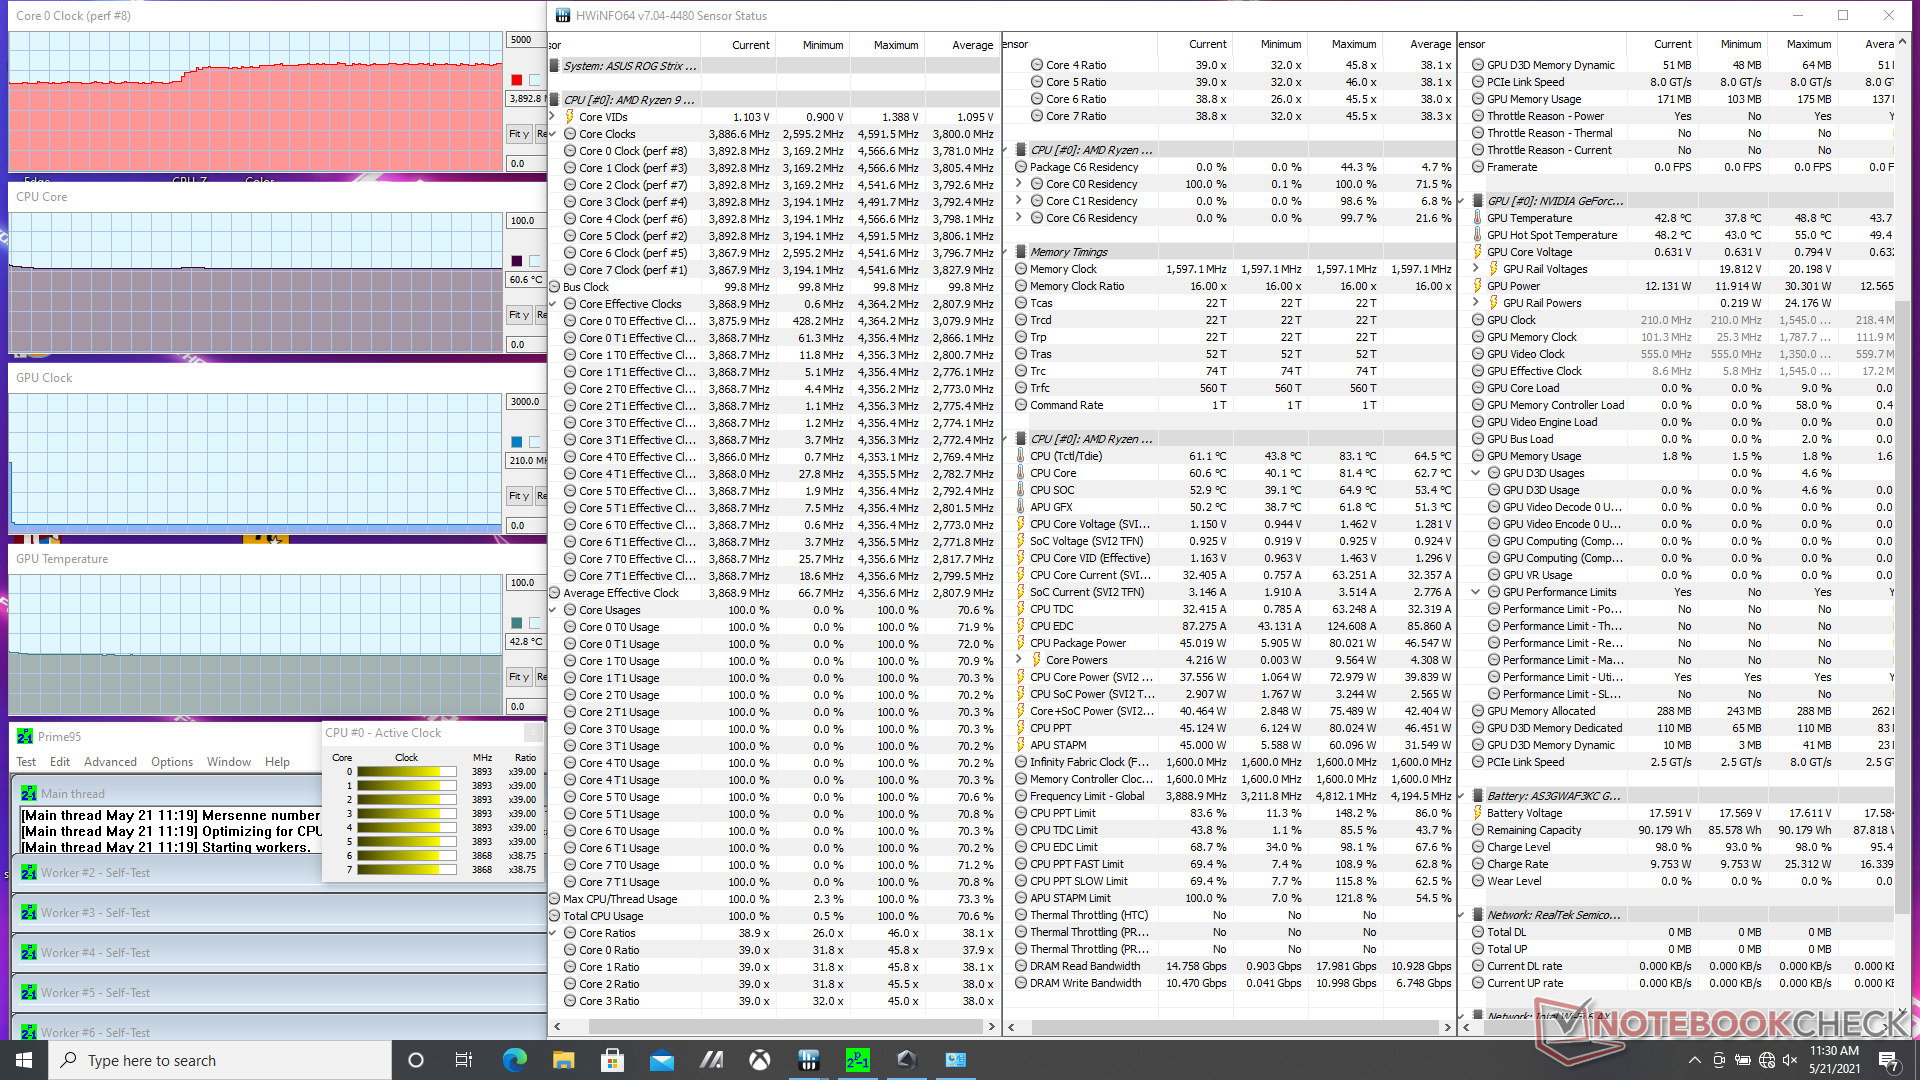
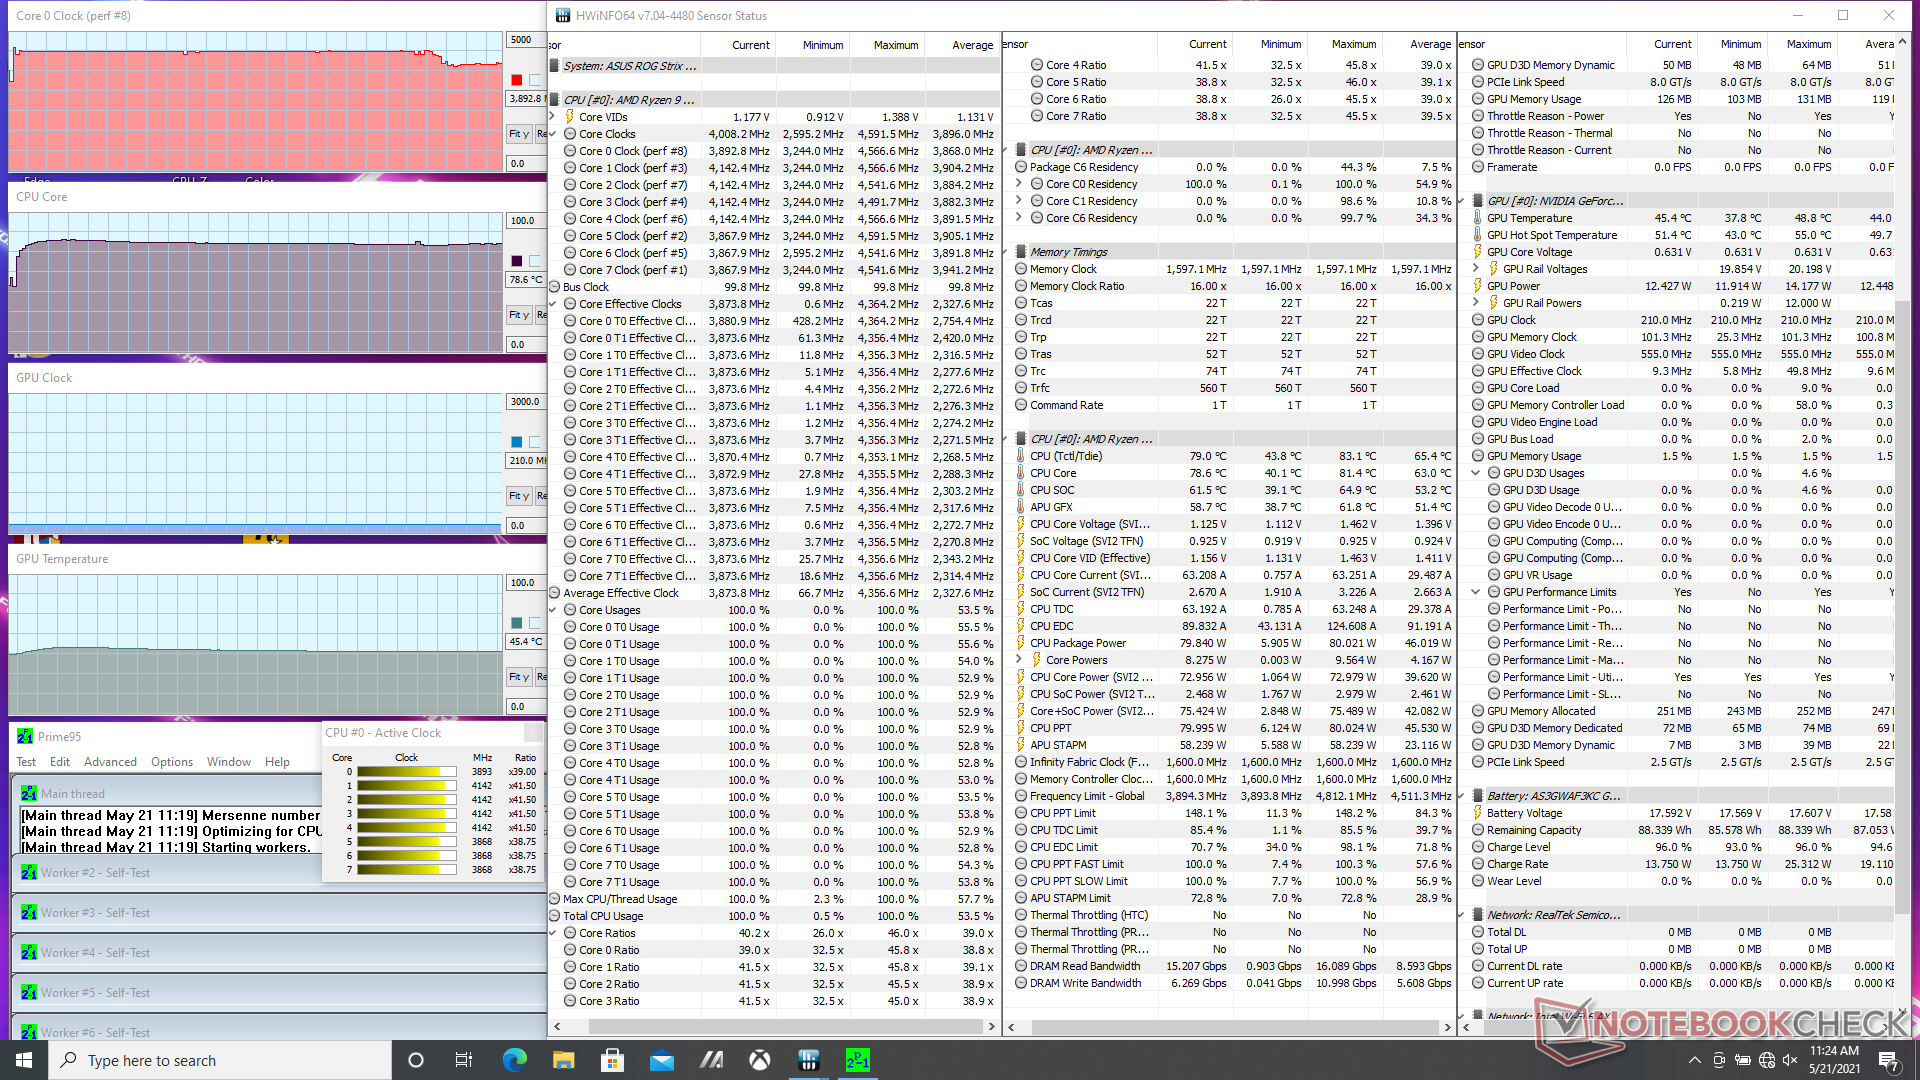
Stress Test
When running Prime95 on Turbo mode to stress the CPU, clock rates would range between 3.9 and 4.3 GHz at a steady core temperature of 79 C. More often than not, however, clock rates would stabilize closer to the 3.9 GHz instead of 4 GHz or higher. If Turbo mode is disabled, clock rates would drop to the 3.2 to 3.7 GHz range instead for a cooler core temperature of 61 C.
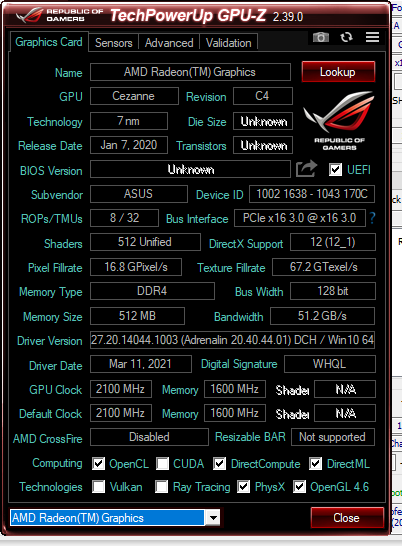
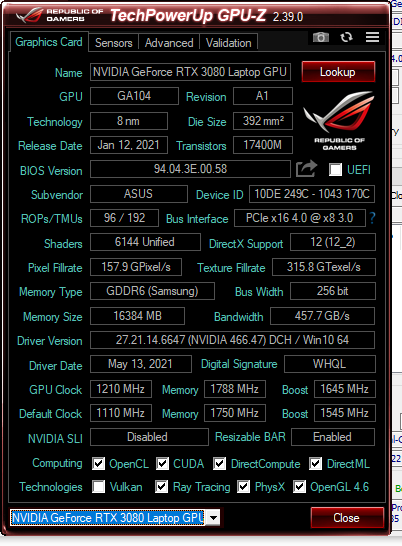
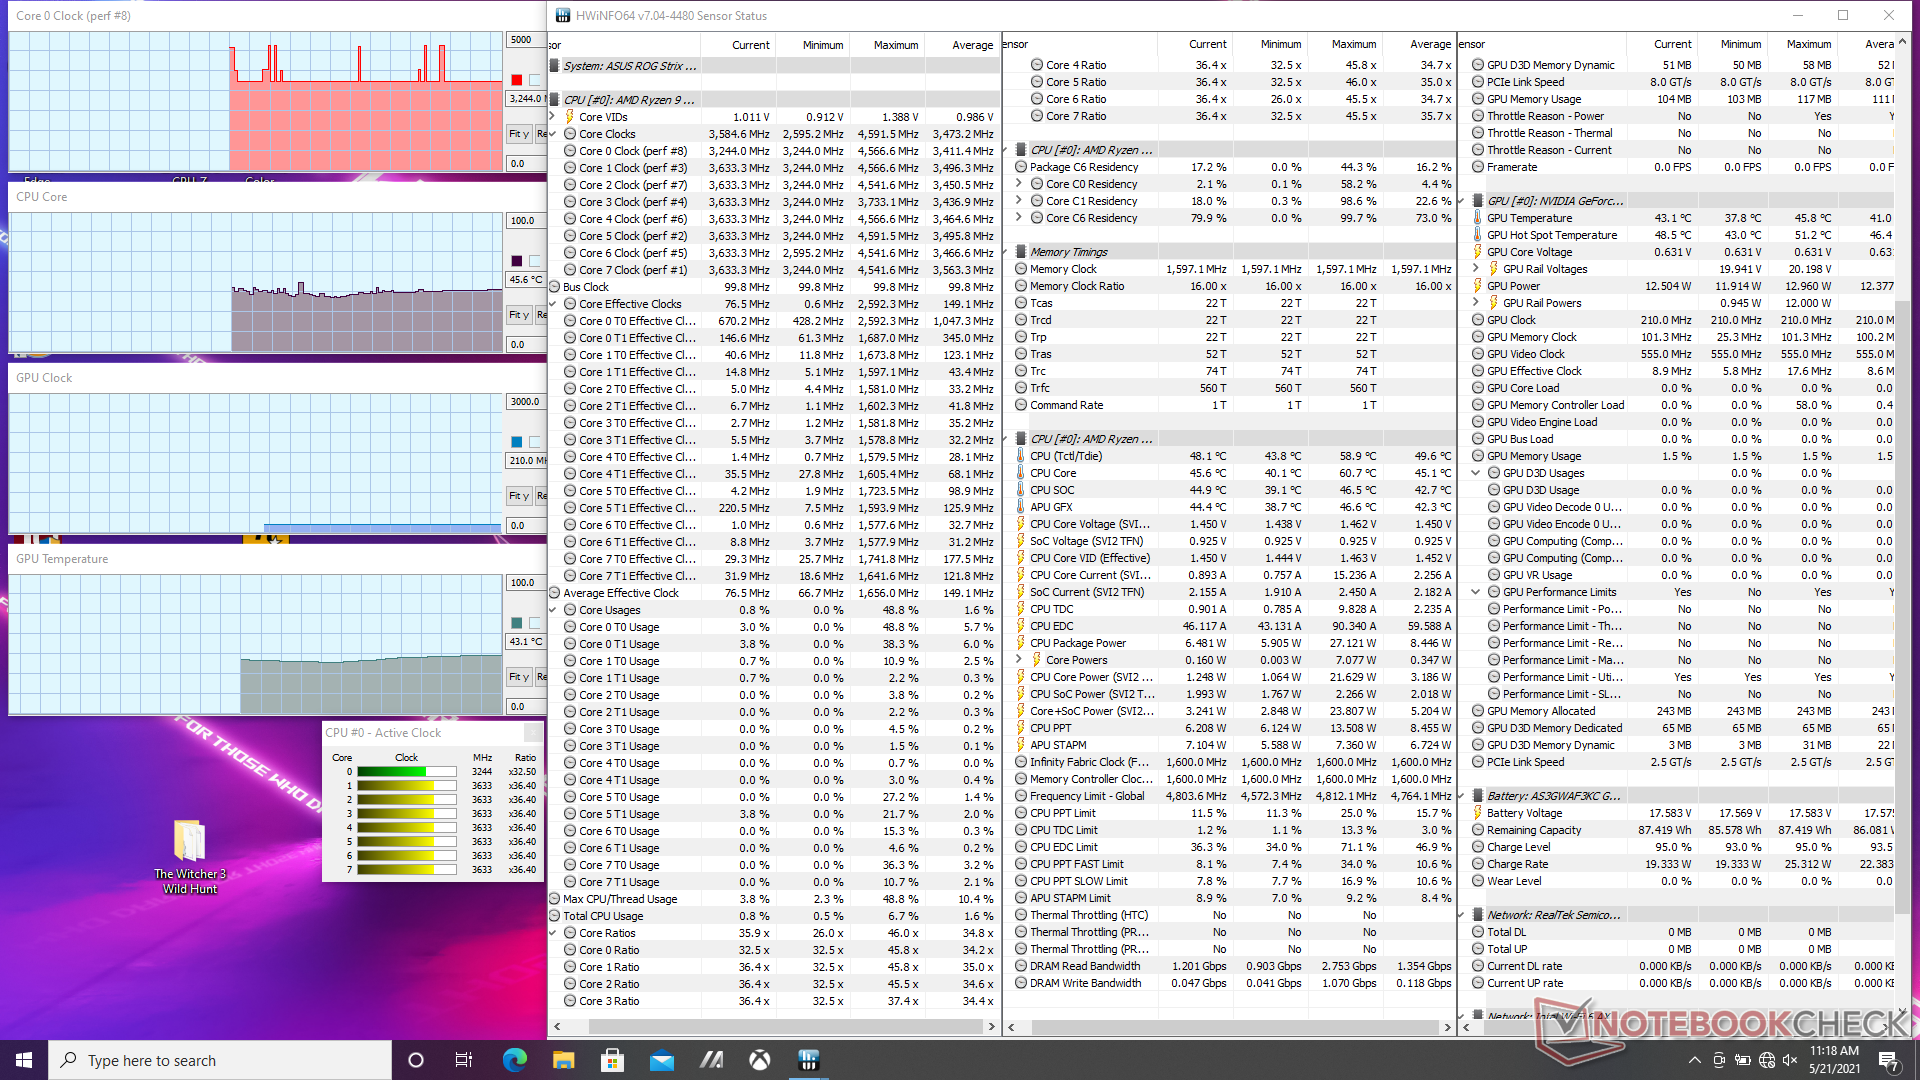
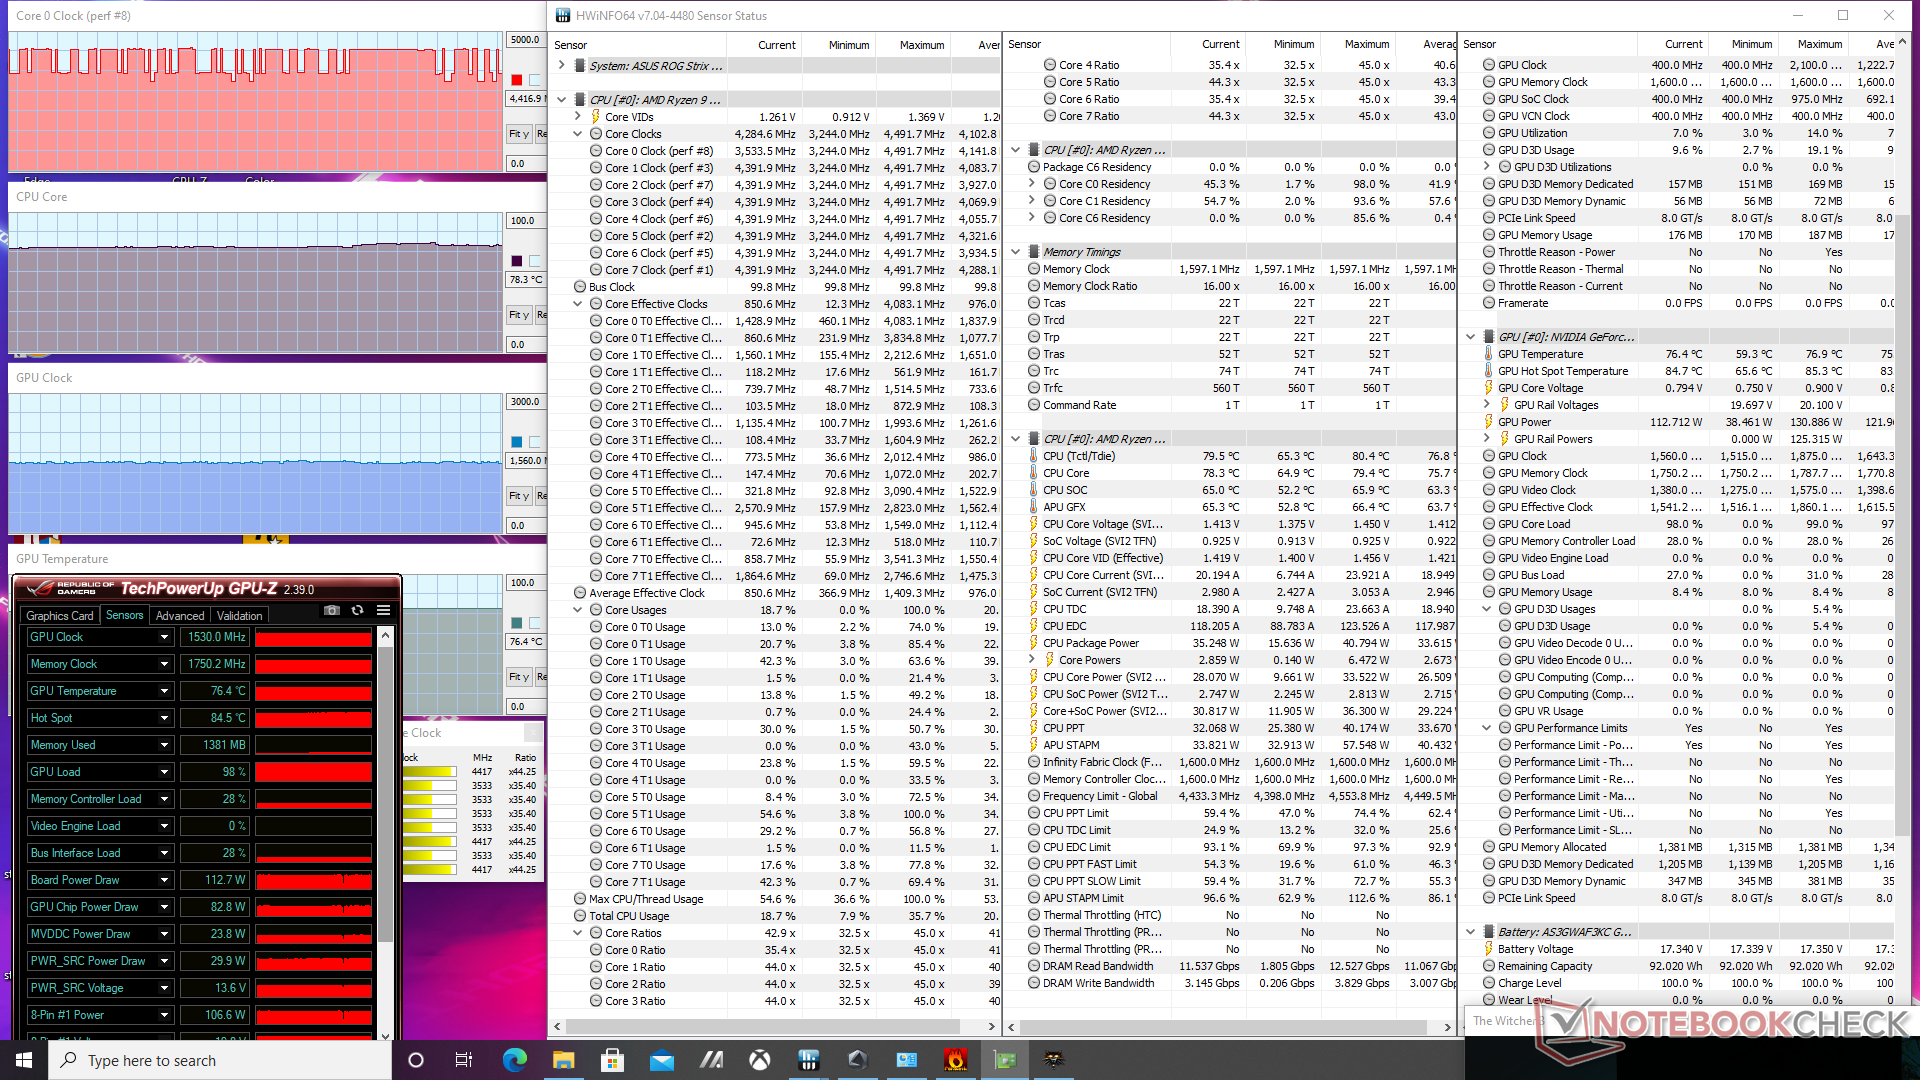
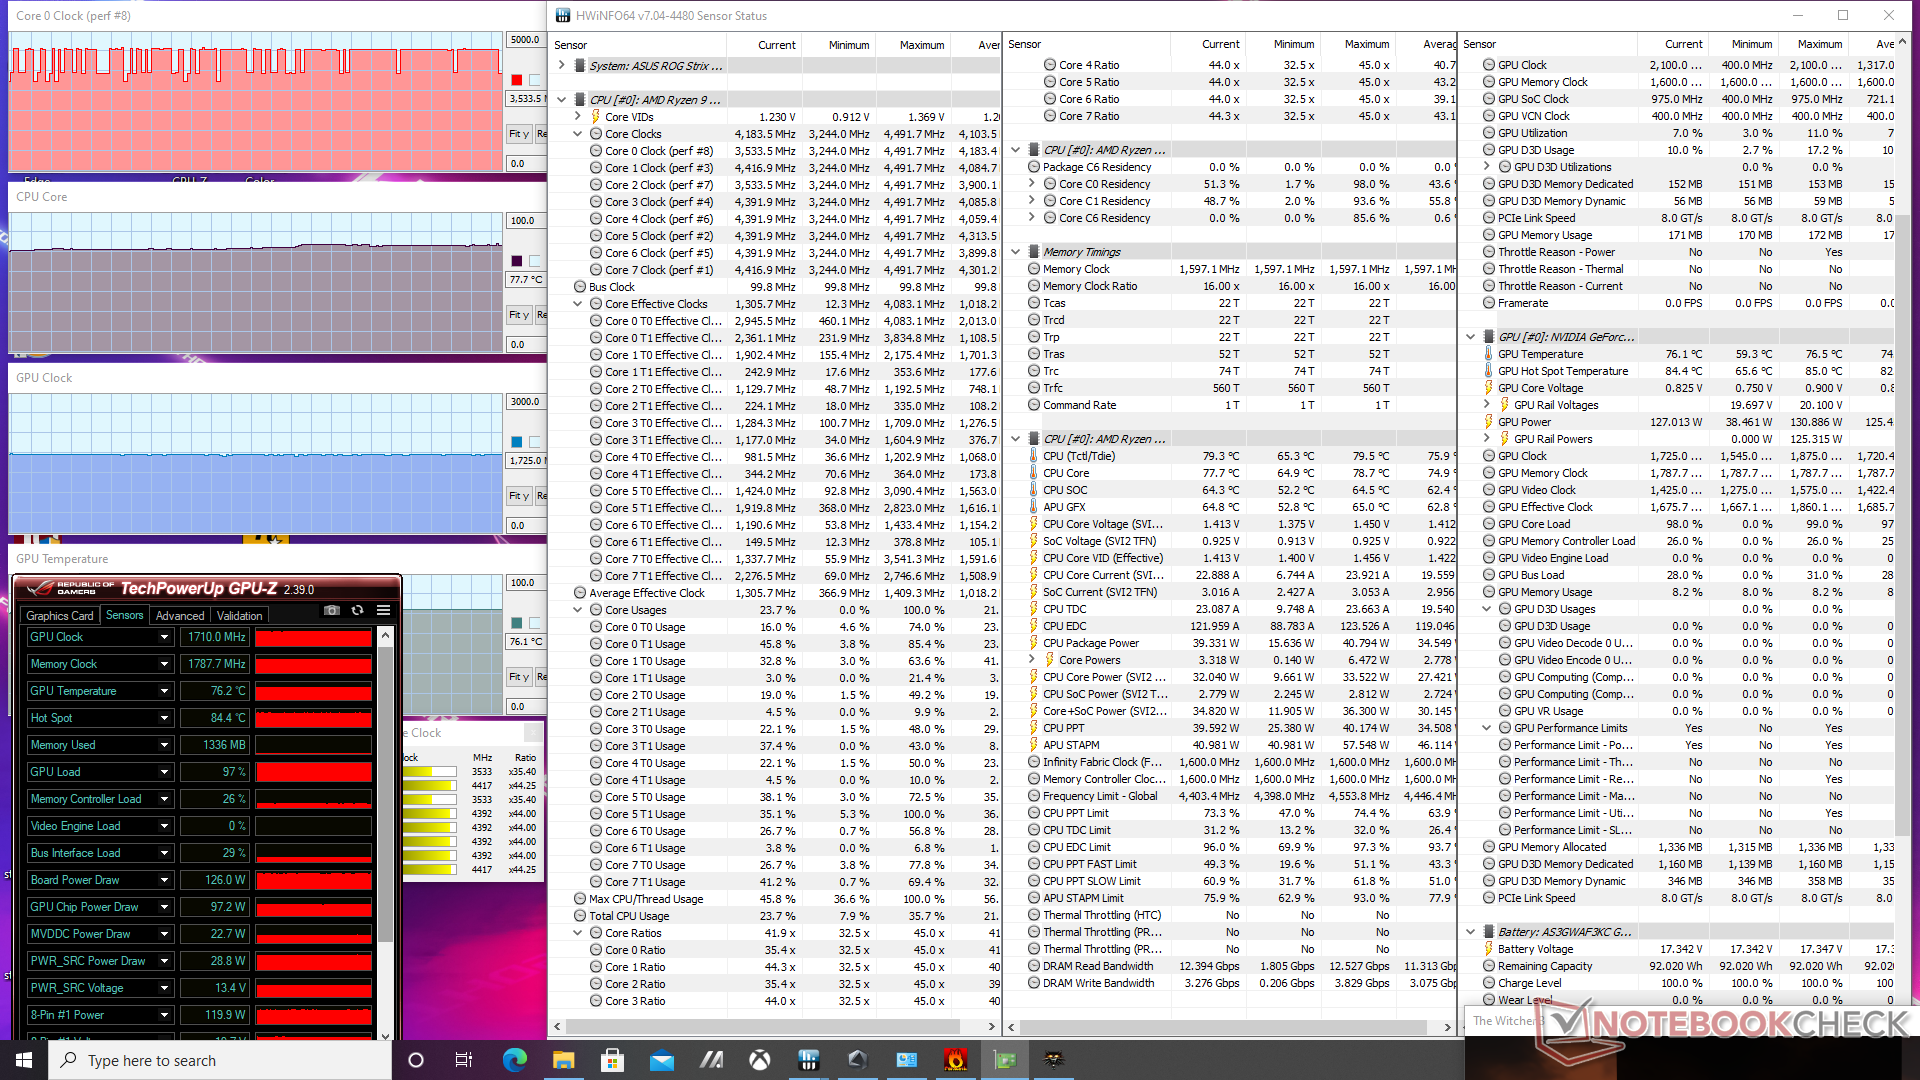
Turbo mode has an impact on gaming performance as well. Idling on Witcher 3 with Turbo mode off results in a steady GPU clock rate and memory clock rate of 1530 MHz and 1750 MHz, respectively. If Turbo mode is enabled, GPU clock rate and memory clock rate would boost to 1710 MHz and 1787.7 MHz (or +300 MHz). Board power draw would consequently jump from 113 W to 126 W according to GPU-Z.
Interestingly, CPU and GPU temperatures when gaming remain about the same no matter the Turbo mode setting since the louder fans of Turbo mode are able to offset the higher temperatures from the faster clock rates. Asus Turbo mode is therefore very different from MSI Turbo mode where temperatures would simply drop without much of a performance boost at all.
Running on battery will impact performance. A Fire Strike test on batteries would return Physics and Graphics scores of 24105 and 15479 points, respectively, compared to 26735 and 29508 points when on mains.
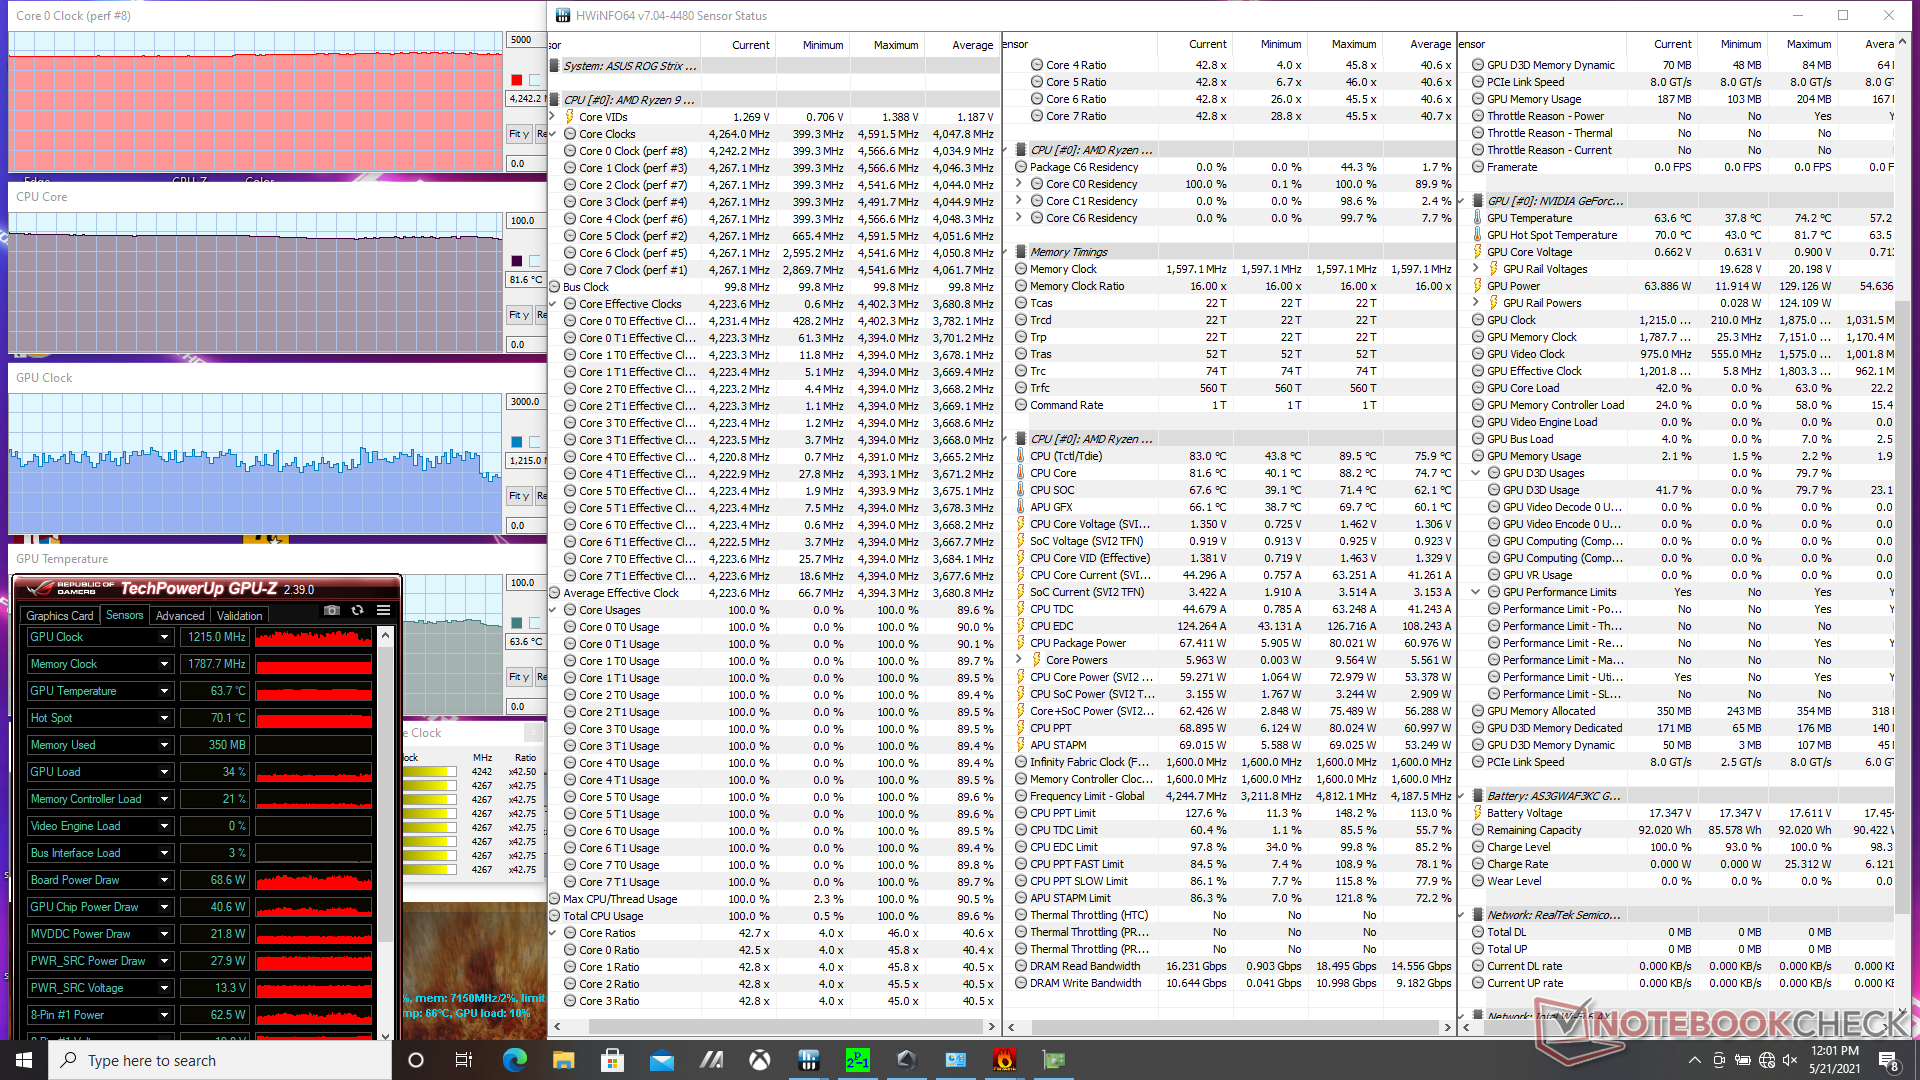
| CPU Clock (GHz) | GPU Clock (MHz) | Average CPU Temperature (°C) | Average GPU Temperature (°C) | |
| System Idle | -- | -- | 46 | 43 |
| Prime95 Stress (Turbo off) | 3.2 - 3.7 | -- | 61 | 43 |
| Prime95 Stress (Turbo on) | 3.9 - 4.3 | -- | 79 | 45 |
| Prime95 + FurMark Stress (Turbo on) | 4.2 | ~1215 | 82 | 64 |
| Witcher 3 Stress (Turbo off) | 3.6 - 4.4 | 1530 | 79 | 77 |
| Witcher 3 Stress (Turbo on) | 3.6 - 4.4 | 1710 | 78 | 76 |
Speakers


Asus Strix Scar 17 G733QSA-XS99 audio analysis
(±) | speaker loudness is average but good (73.7 dB)
Bass 100 - 315 Hz
(+) | good bass - only 2.1% away from median
(±) | linearity of bass is average (7% delta to prev. frequency)
Mids 400 - 2000 Hz
(+) | balanced mids - only 1.4% away from median
(+) | mids are linear (4.8% delta to prev. frequency)
Highs 2 - 16 kHz
(±) | higher highs - on average 5.9% higher than median
(±) | linearity of highs is average (8.7% delta to prev. frequency)
Overall 100 - 16.000 Hz
(+) | overall sound is linear (10.7% difference to median)
Compared to same class
» 7% of all tested devices in this class were better, 2% similar, 91% worse
» The best had a delta of 6%, average was 18%, worst was 132%
Compared to all devices tested
» 6% of all tested devices were better, 2% similar, 93% worse
» The best had a delta of 4%, average was 24%, worst was 134%
Apple MacBook 12 (Early 2016) 1.1 GHz audio analysis
(+) | speakers can play relatively loud (83.6 dB)
Bass 100 - 315 Hz
(±) | reduced bass - on average 11.3% lower than median
(±) | linearity of bass is average (14.2% delta to prev. frequency)
Mids 400 - 2000 Hz
(+) | balanced mids - only 2.4% away from median
(+) | mids are linear (5.5% delta to prev. frequency)
Highs 2 - 16 kHz
(+) | balanced highs - only 2% away from median
(+) | highs are linear (4.5% delta to prev. frequency)
Overall 100 - 16.000 Hz
(+) | overall sound is linear (10.2% difference to median)
Compared to same class
» 7% of all tested devices in this class were better, 2% similar, 91% worse
» The best had a delta of 5%, average was 18%, worst was 53%
Compared to all devices tested
» 5% of all tested devices were better, 1% similar, 94% worse
» The best had a delta of 4%, average was 24%, worst was 134%
Energy Management
Power Consumption
Idling on desktop at the lowest brightness setting and power profile consumes just under 11 W while the maximum brightness setting on Turbo mode would consume over twice as much at 27 W. Thus, it's worth setting the system to Power Saver mode when the extra horsepower isn't needed.
Overall power consumption is noticeably lower than on last year's Strix Scar 17 G732LXS equipped with the Core i9 and GeForce RTX 2080 Super even though our G733 offers 35 percent and 20 percent faster CPU performance and graphics performance, respectively. Performance-per-watt is therefore much higher gen-to-gen. The Razer Blade Pro 17 consumes even less power than our G733 albeit it comes with a slightly slower version of the RTX 3080.
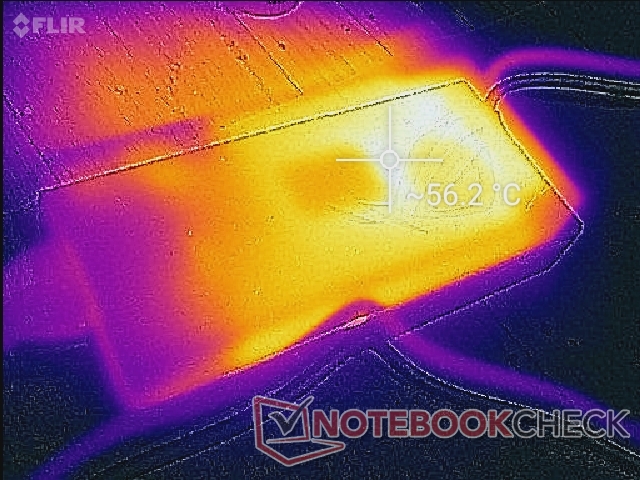
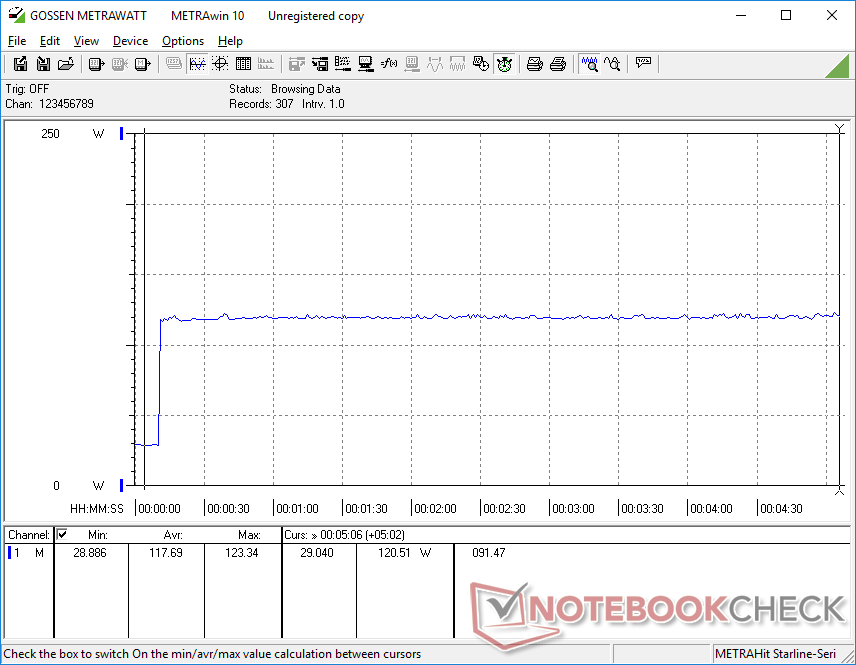
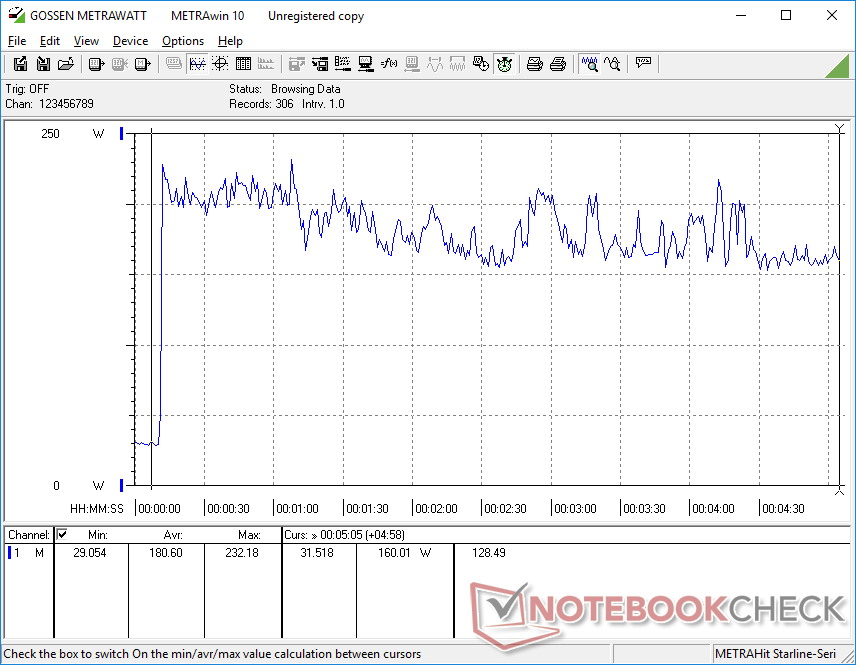
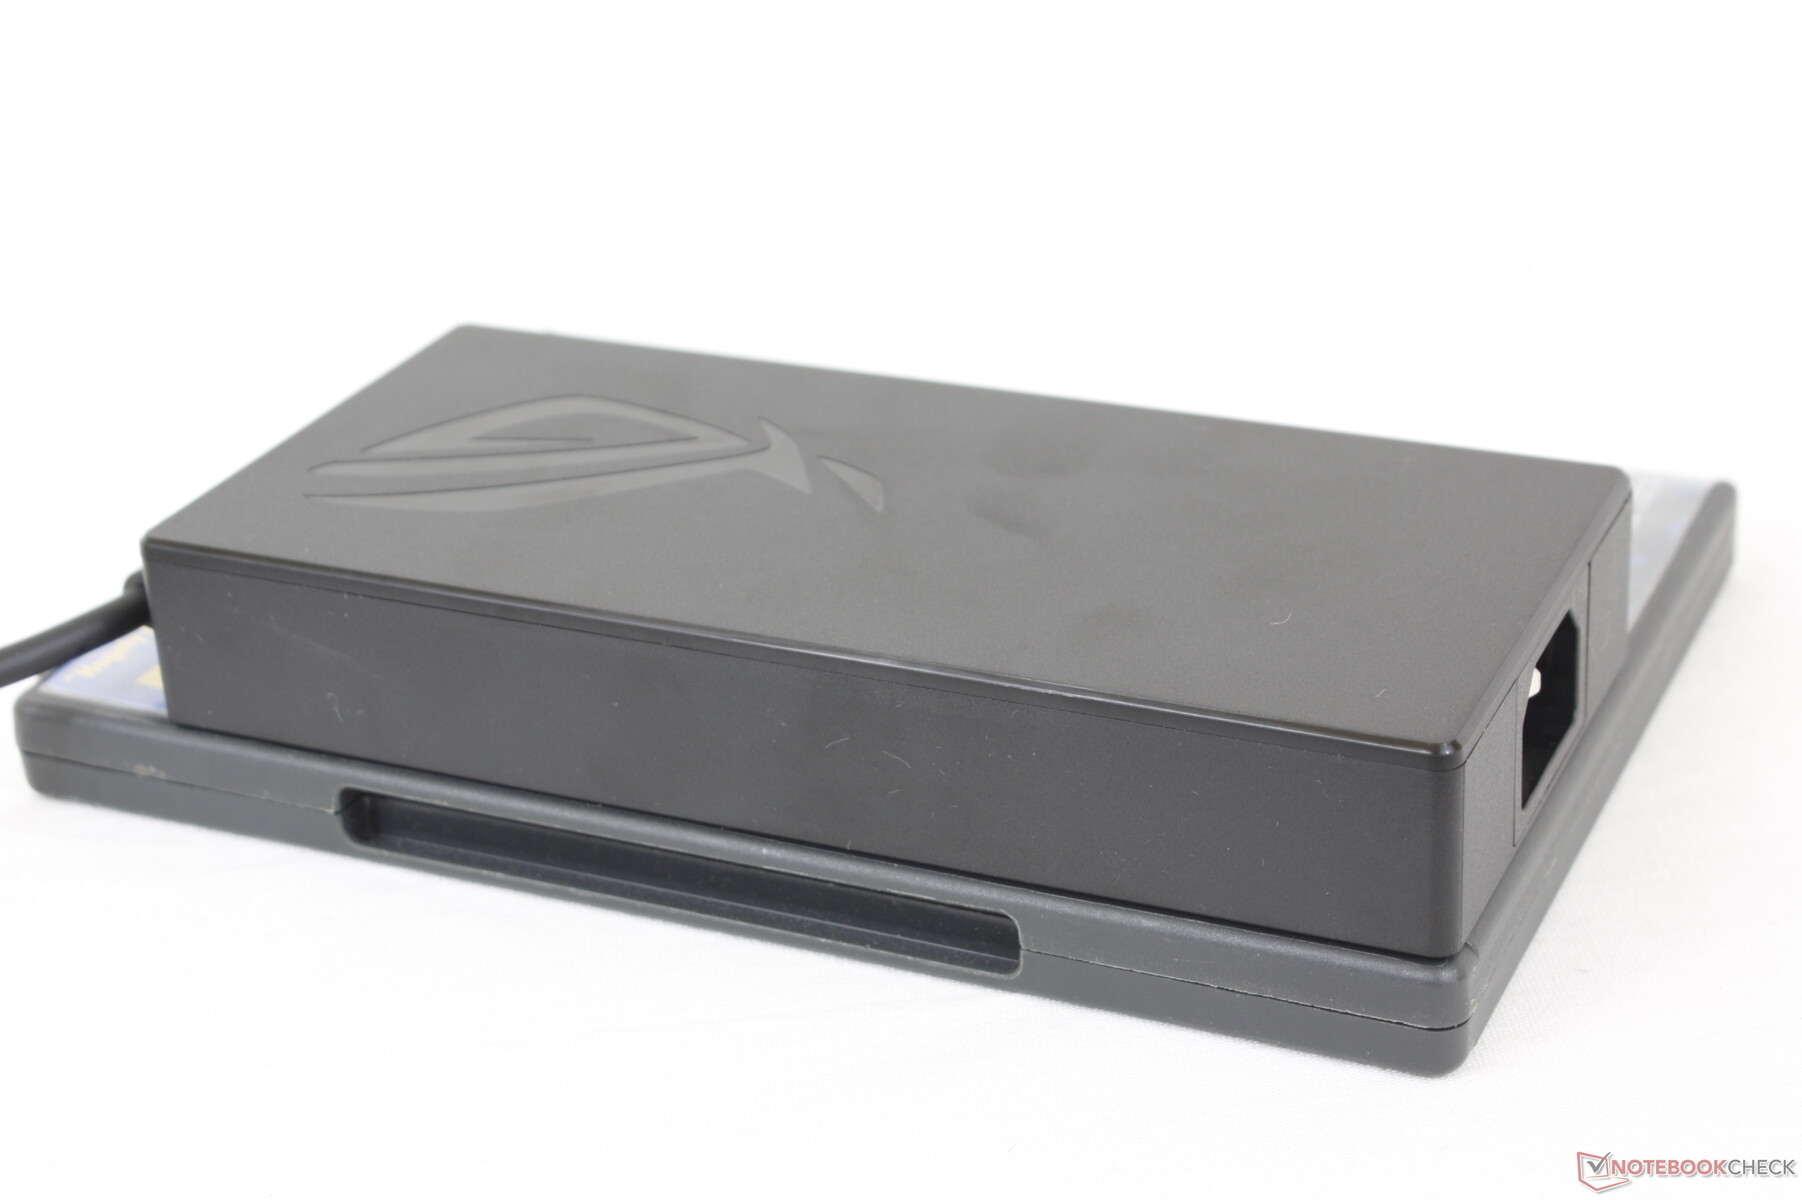
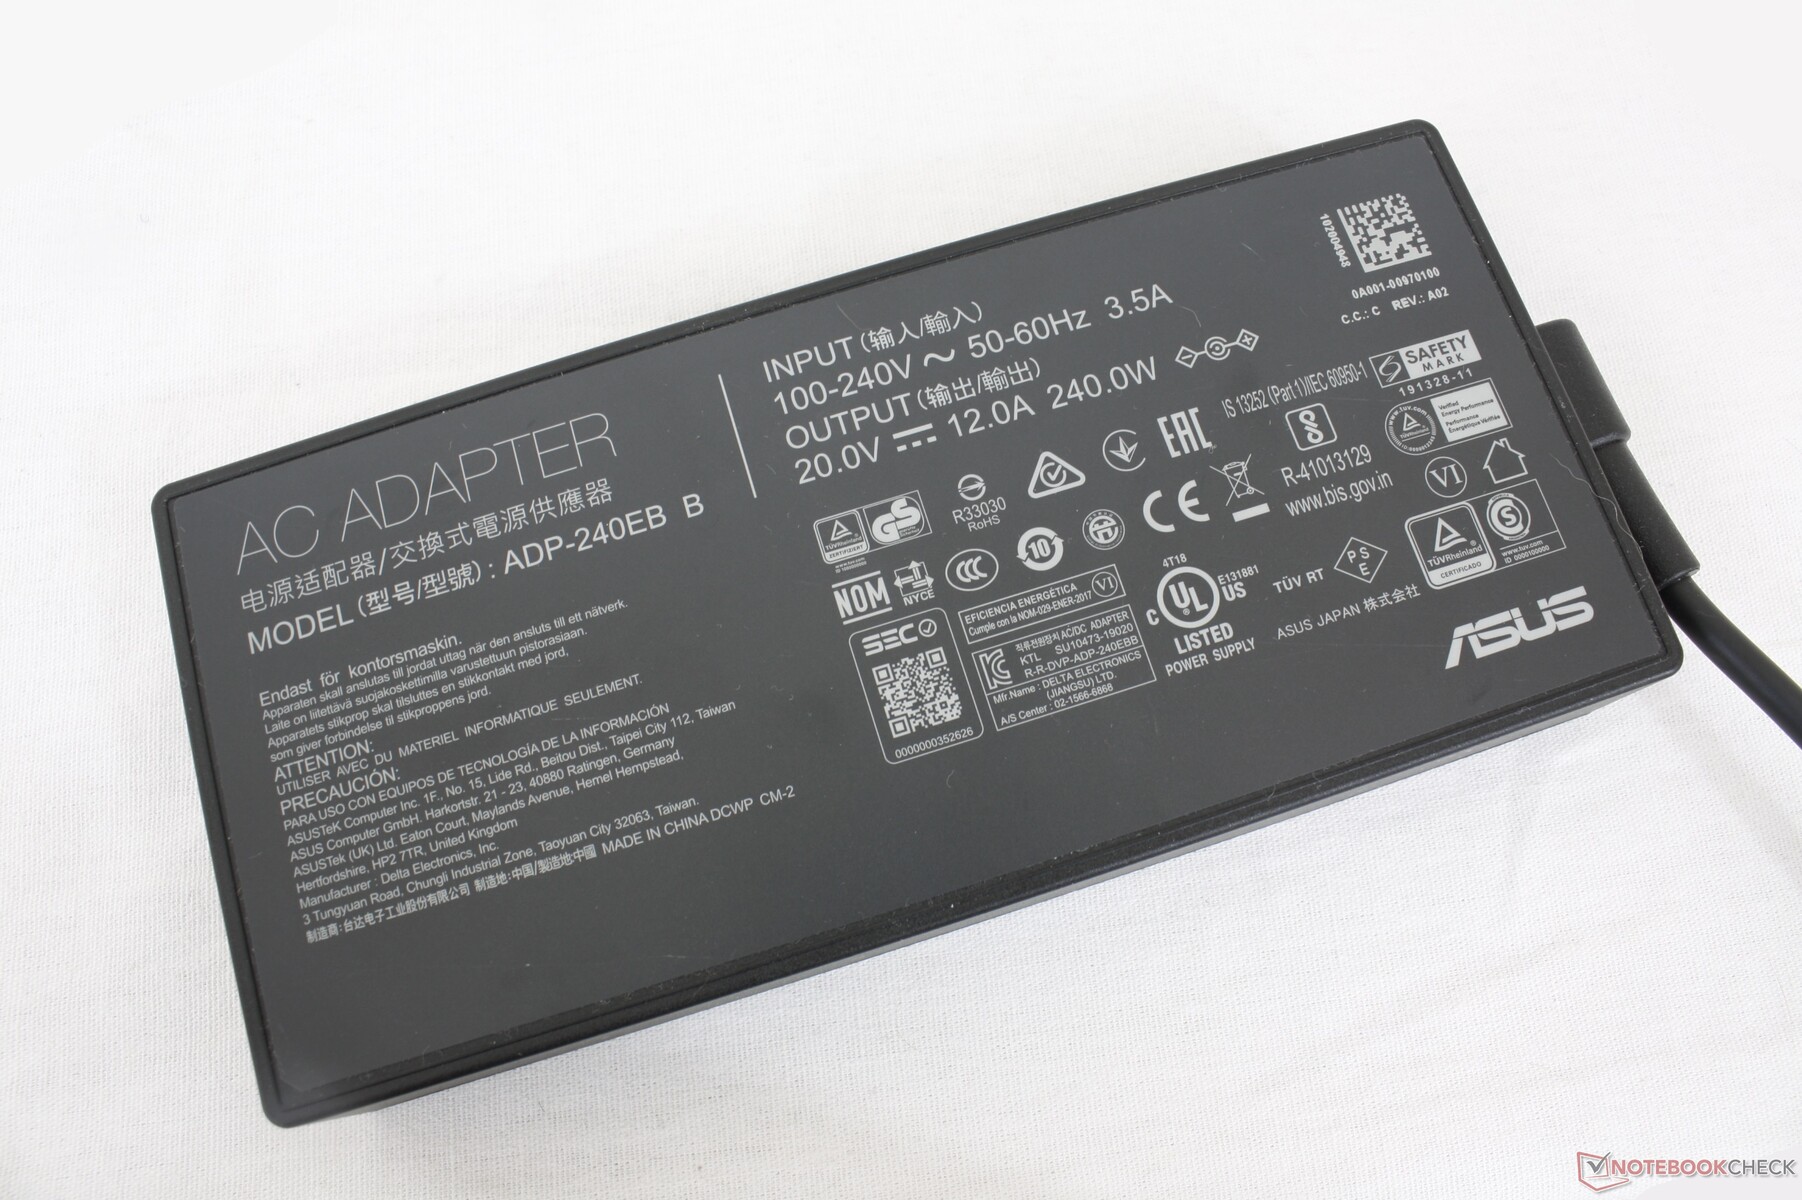
We're able to measure a temporary maximum draw of 228.4 W from the medium-sized (~16.4 x 7.5 x 2.6 cm) 240 W AC adapter when running Prime95 and FurMark simultaneously.
| Off / Standby | |
| Idle | |
| Load |
|
Key:
min: | |
| Asus Strix Scar 17 G733QSA-XS99 R9 5900HX, GeForce RTX 3080 Laptop GPU, 2x Samsung PM981a MZVLB1T0HBLR (RAID 0), IPS, 1920x1080, 17.3" | Asus Strix Scar 17 G732LXS i9-10980HK, GeForce RTX 2080 Super Mobile, 2x Intel SSD 660p 1TB SSDPEKNW010T8 (RAID 0), IPS, 1920x1080, 17.3" | MSI GE76 Raider 10UH i7-10870H, GeForce RTX 3080 Laptop GPU, WDC PC SN730 SDBPNTY-1T00, IPS, 1920x1080, 17.3" | Alienware m17 R4 i9-10980HK, GeForce RTX 3080 Laptop GPU, 2x Micron 2300 512 GB (RAID 0), IPS, 1920x1080, 17.3" | Razer Blade Pro 17 2021 (QHD Touch) i7-10875H, GeForce RTX 3080 Laptop GPU, Samsung PM981a MZVLB1T0HBLR, IPS, 3840x2160, 17.3" | Asus Zephyrus S17 GX701LXS i7-10875H, GeForce RTX 2080 Super Max-Q, Samsung PM981a MZVLB1T0HBLR, IPS, 1920x1080, 17.3" | |
|---|---|---|---|---|---|---|
| Power Consumption | -43% | -33% | -118% | -17% | -2% | |
| Idle Minimum * (Watt) | 10.9 | 16 -47% | 15.5 -42% | 42 -285% | 15.2 -39% | 10 8% |
| Idle Average * (Watt) | 14.7 | 25 -70% | 31.3 -113% | 48 -227% | 20.3 -38% | 16 -9% |
| Idle Maximum * (Watt) | 26.8 | 35 -31% | 31.7 -18% | 58 -116% | 37.3 -39% | 29 -8% |
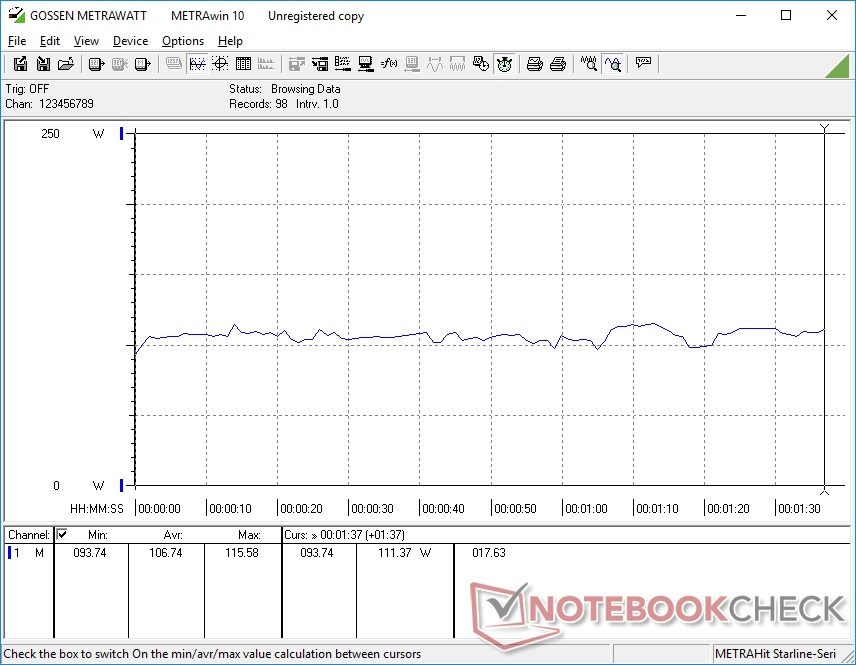
| Load Average * (Watt) | 106.7 | 177 -66% | 93.6 12% | 124 -16% | 114.9 -8% | 143 -34% |
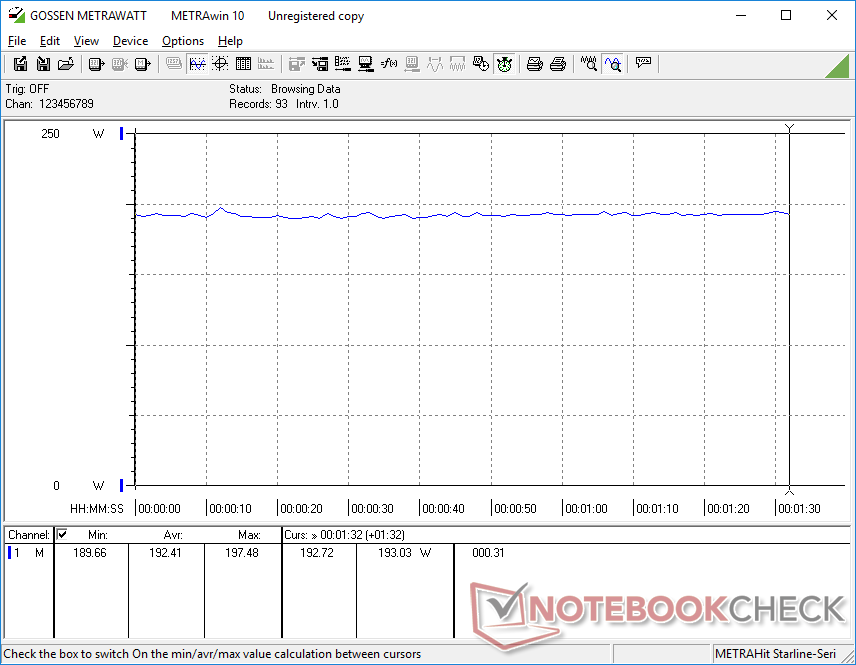
| Witcher 3 ultra * (Watt) | 192.4 | 227 -18% | 233 -21% | 219 -14% | 158.4 18% | 146 24% |
| Load Maximum * (Watt) | 228.4 | 280 -23% | 260.3 -14% | 337 -48% | 223.7 2% | 205 10% |
* ... smaller is better
Battery Life
Runtimes are surprisingly long for such a large gaming laptop. We're able to get almost 9.5 hours of real-world WLAN use when on the Balanced power profile with the iGPU active compared to several hours shorter on the older Strix Scar 17 G732LXS. The larger 90 Wh battery is a major contributing factor to the generally longer battery life.
Charging from empty to full capacity is relatively fast at under 1.5 hours with the included AC adapter. The battery continues to charge even when gaming or running extreme loads which is not always the case for a lot of high performance laptops. Charging via USB-C is also possible albeit at a slower rate.
| Asus Strix Scar 17 G733QSA-XS99 R9 5900HX, GeForce RTX 3080 Laptop GPU, 90 Wh | Asus Strix Scar 17 G732LXS i9-10980HK, GeForce RTX 2080 Super Mobile, 66 Wh | MSI GE76 Raider 10UH i7-10870H, GeForce RTX 3080 Laptop GPU, 99.9 Wh | Alienware m17 R4 i9-10980HK, GeForce RTX 3080 Laptop GPU, 86 Wh | Razer Blade Pro 17 2021 (QHD Touch) i7-10875H, GeForce RTX 3080 Laptop GPU, 70.5 Wh | Asus Zephyrus S17 GX701LXS i7-10875H, GeForce RTX 2080 Super Max-Q, 76 Wh | |
|---|---|---|---|---|---|---|
| Battery runtime | -18% | -16% | -44% | -21% | -46% | |
| Reader / Idle (h) | 13.3 | 10 -25% | 8.2 -38% | 9.9 -26% | 3.5 -74% | |
| WiFi v1.3 (h) | 9.3 | 5.9 -37% | 6.3 -32% | 2.4 -74% | 5.9 -37% | 2.8 -70% |
| Load (h) | 1.4 | 1.5 7% | 1.7 21% | 1.2 -14% | 1.4 0% | 1.5 7% |
Pros
Cons
Verdict
The raw performance increase is absolutely bonkers if you're upgrading from a laptop on Coffee Lake-H or older. The 45 W Ryzen 9 5900HX is neck-to-neck with the thicker, heavier, and hotter Schenker Ultra 17 running on a desktop-class Core i9-11900K despite their wide TDP differences. The performance-per-watt advantages can make Intel Rocket Lake feel like a last generation platform at times.
As for the chassis itself, it's a huge light show with RGB LEDs on almost all sides of the system. Though we don't mind the visual flair, the black palm rests, clickpad and keyboard deck attract unsightly grease far too easily which clashes with the colorful LEDs. Perhaps a different deck material or texture on future models would help mitigate the fingerprint buildup.
A colorful high-end gaming laptop that's all about processor performance and gaming. The forced mechanical keys may be great for LAN parties, but the loud key clatter can be a nuisance in most other scenarios.
Users must run the system on Turbo mode to fully exploit the CPU and GPU or else frame rates when gaming will be slightly lower. As a result, the fans must be on their loudest for full performance.
A few auxiliary features common on most other gaming laptops are inconspicuously missing on this Asus system. IR, webcam, Thunderbolt, SD card reader, fingerprint reader, 2.5 Gbps RJ-45, G-Sync, Advanced Optimus, and Kensington lock are all not available here which is odd for a $3000 gaming laptop.
Lastly, the new mechanical keys are so loud that there is real potential for them to annoy any nearby classmates or roommates. If you were thinking about using this laptop for everything from lecture notes to dorm room gaming, then a ZenBook Pro might be the better fit which is a shame because the larger numpad and arrow keys of the G733 are otherwise more comfortable to use. A standard non-mechanical keyboard option, much like what Dell is doing with its latest Alienware models, would have been great to see here.
Price and availability
Asus Strix Scar 17 G733QSA-XS99
- 05/24/2021 v7 (old)
Allen Ngo
Price comparison
