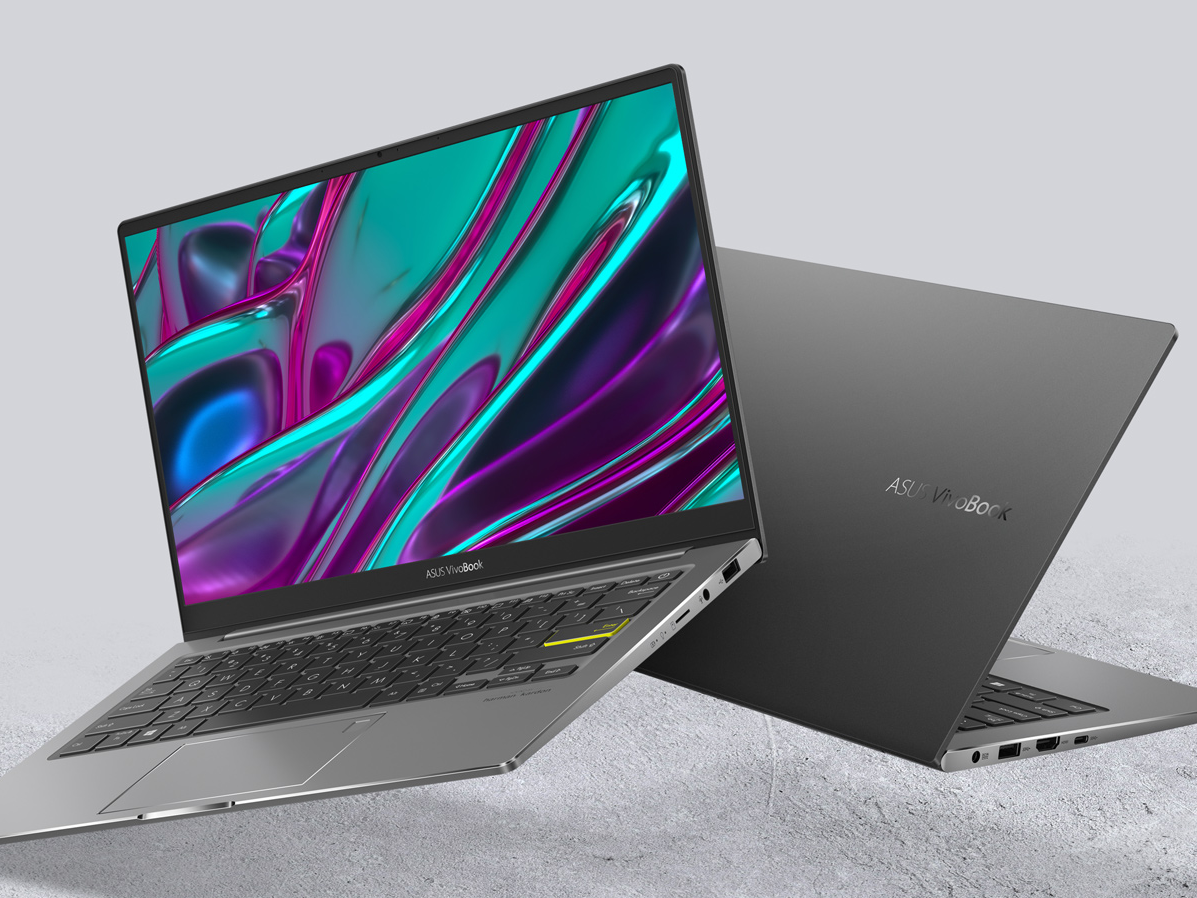
Asus VivoBook S13 S333JA Laptop Review: Great Display For Cheap
Asus unveiled the VivoBook S13 S333 series at CES 2020 alongside the larger VivoBook S15 S533 series. The newer models would ship with updated Intel processors and brand new chassis designs that emphasize "user personality" in an attempt to appeal to the younger generation. A quick look through Asus' official product page for the VivoBook S13 S333 shows exactly the kind of market and userbase the manufacturer wants to attract.
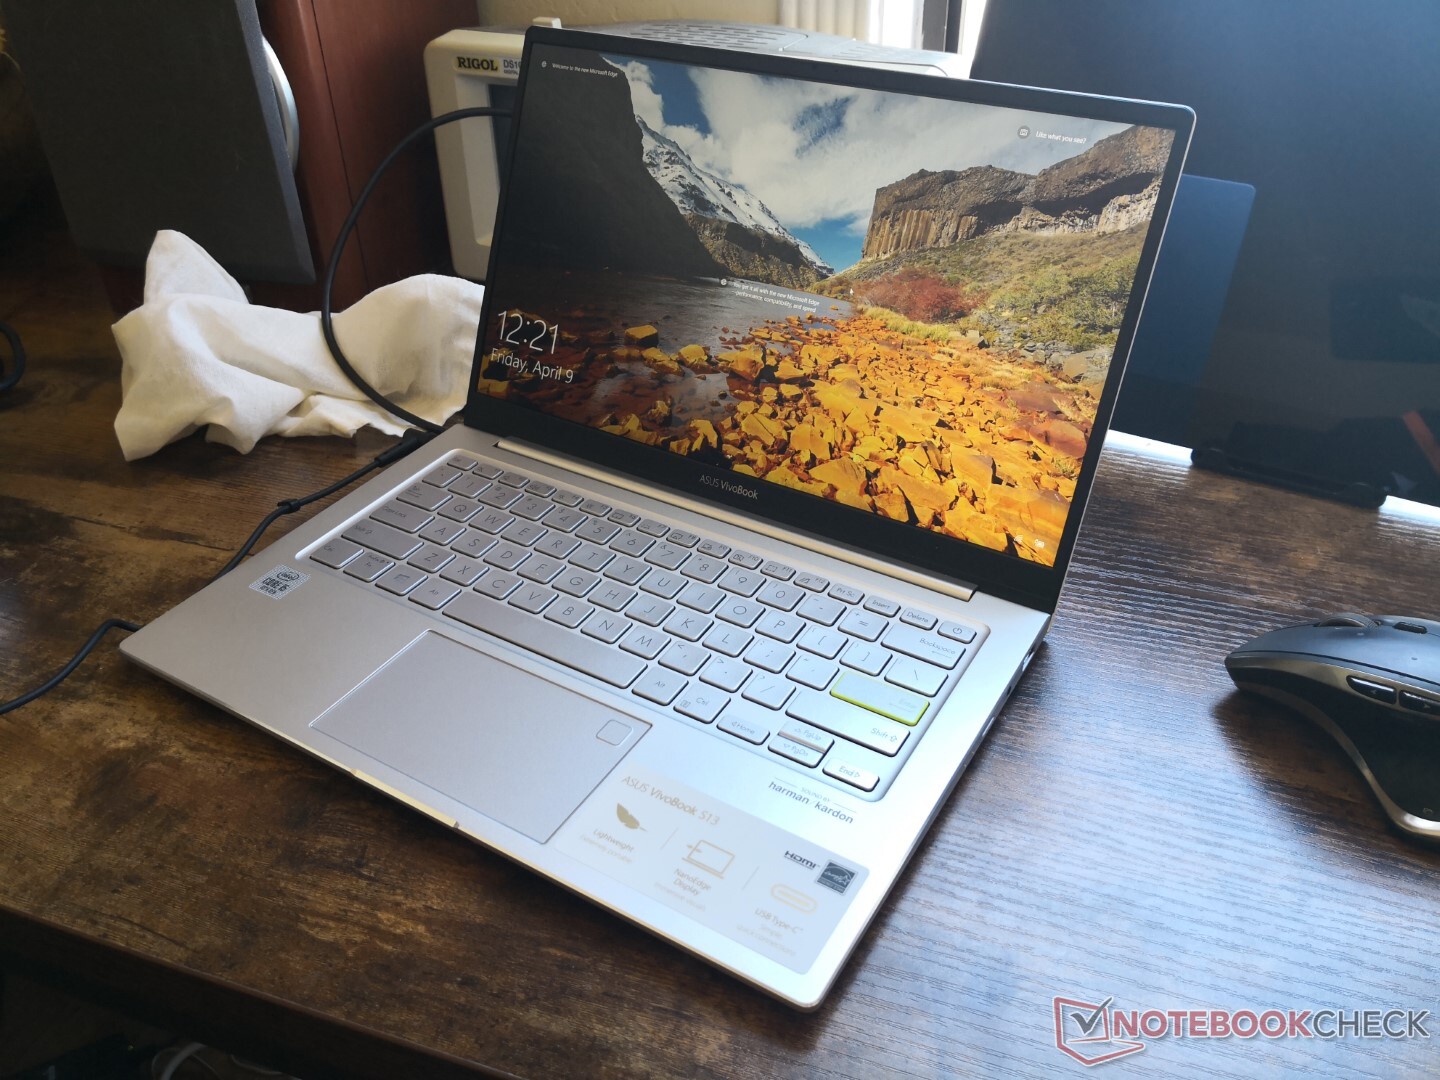
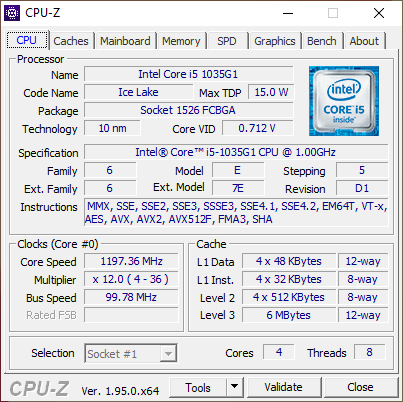
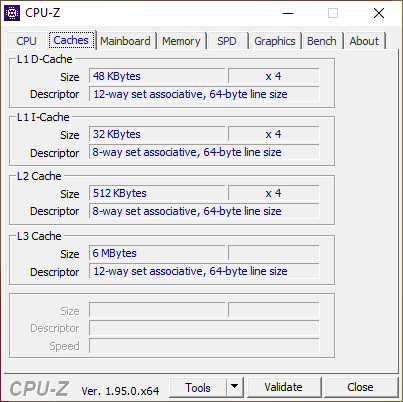
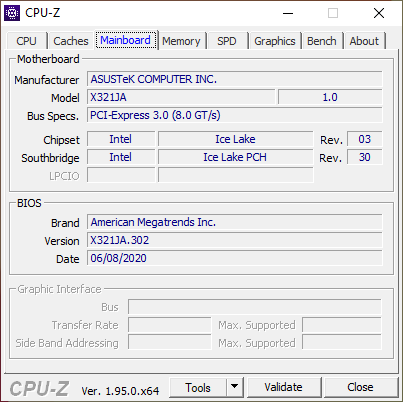
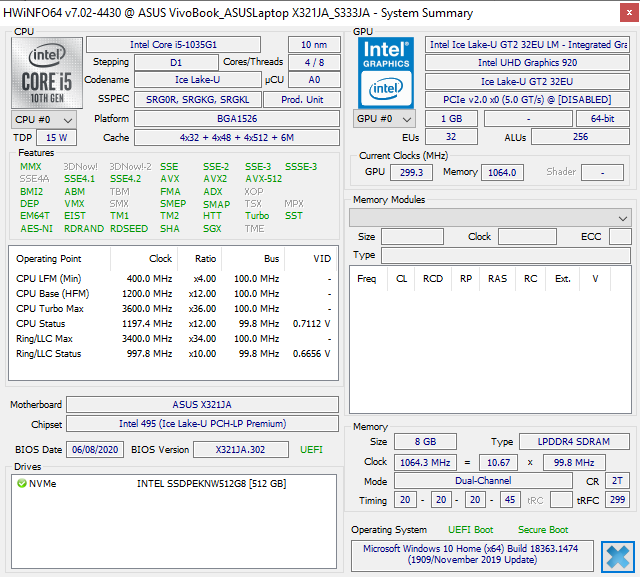
Our test unit here is the VivoBook S13 S333JA equipped with the 10th gen Ice Lake Core i5-1035G1 CPU, 8 GB of soldered RAM, 1080p IPS display, and 512 GB of storage for approximately $600 to $700 USD retail. Other SKUs of the S333 are available including the newer S333EA which comes with the latest 11th gen Intel CPUs. We'll be comparing the system to its predecessor the VivoBook S13 S330 as well as other budget 13.3-inch Ultrabooks like the Lenovo IdeaPad S540, 2020 HP Pavilion 13, or Huawei MateBook 13.
More Asus reviews:
potential competitors in comparison
Rating | Date | Model | Weight | Height | Size | Resolution | Price |
|---|---|---|---|---|---|---|---|
| 82.3 % v7 (old) | 04 / 2021 | Asus VivoBook S13 S333JA-DS51 i5-1035G1, UHD Graphics G1 (Ice Lake 32 EU) | 1.2 kg | 14.9 mm | 13.30" | 1920x1080 | |
| 85 % v6 (old) | 12 / 2018 | Asus VivoBook S13 S330UA-EY034T i5-8550U, UHD Graphics 620 | 1.2 kg | 17.9 mm | 13.30" | 1920x1080 | |
| 85 % v7 (old) | 11 / 2020 | Lenovo IdeaPad S540-13ARE-82DL000YGE R5 4600U, Vega 6 | 1.3 kg | 15.95 mm | 13.30" | 2560x1600 | |
| 88.1 % v7 (old) | 10 / 2020 | Dell XPS 13 9310 Core i7 FHD i7-1165G7, Iris Xe G7 96EUs | 1.3 kg | 14.8 mm | 13.40" | 1920x1200 | |
| 81.5 % v7 (old) | 12 / 2020 | HP Pavilion 13-bb0015cl i7-1165G7, Iris Xe G7 96EUs | 1.2 kg | 17.7 mm | 13.30" | 3840x2160 | |
| 87.5 % v7 (old) | 08 / 2020 | Asus ZenBook 13 UX325JA i7-1065G7, Iris Plus Graphics G7 (Ice Lake 64 EU) | 1.1 kg | 13.9 mm | 13.30" | 1920x1080 |
Case
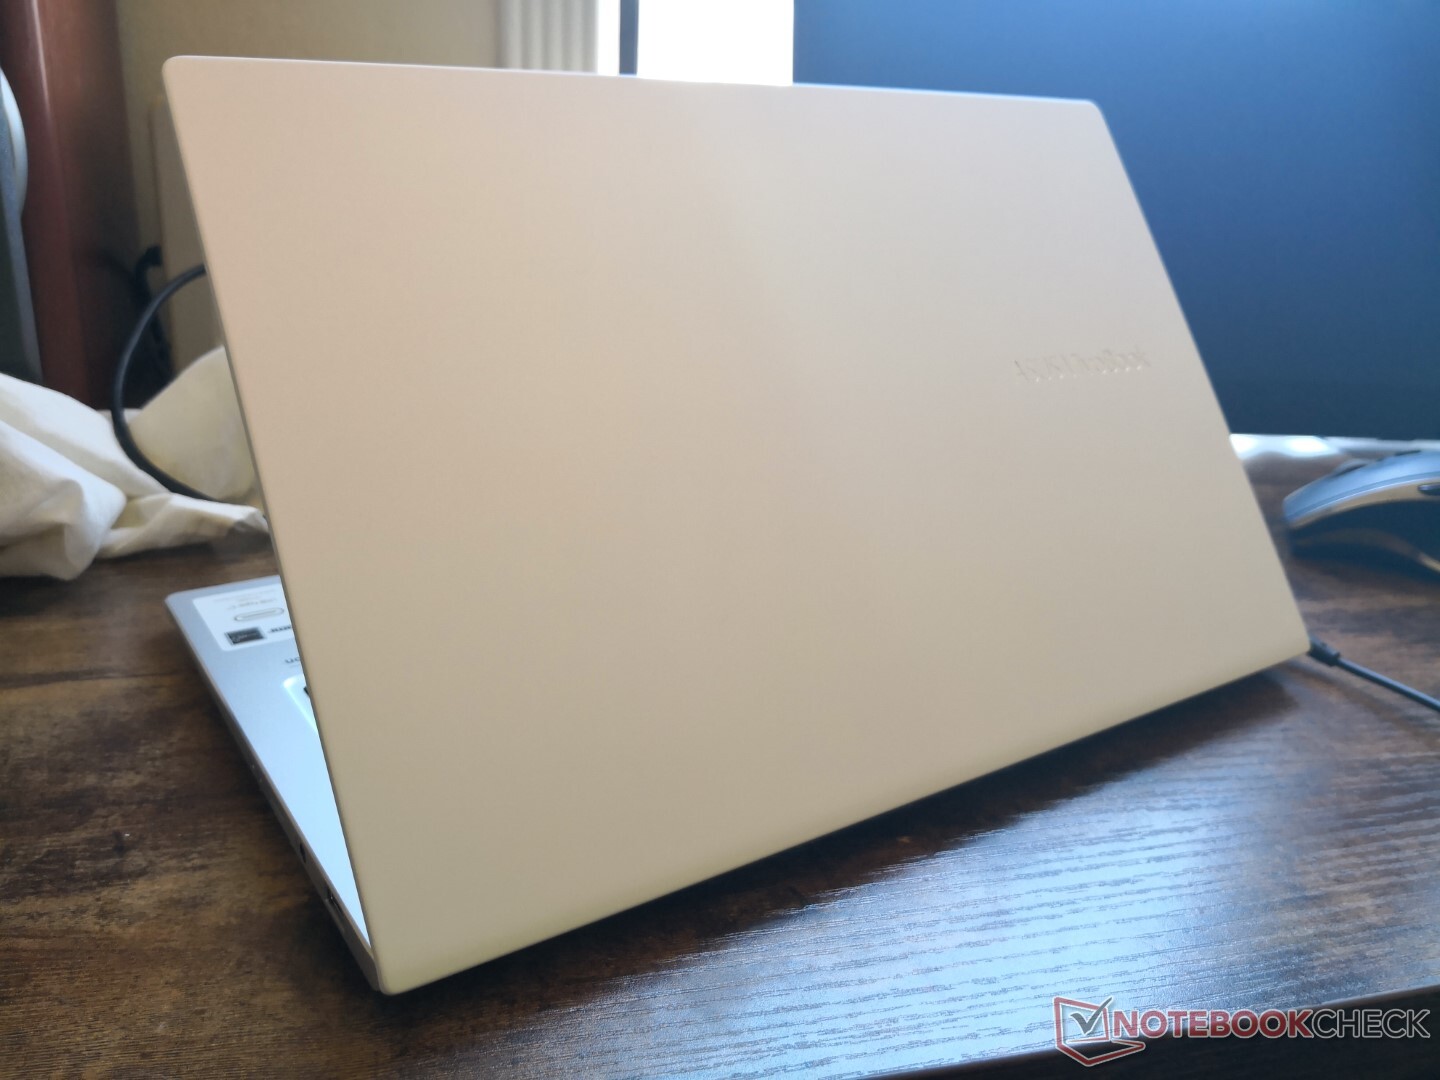
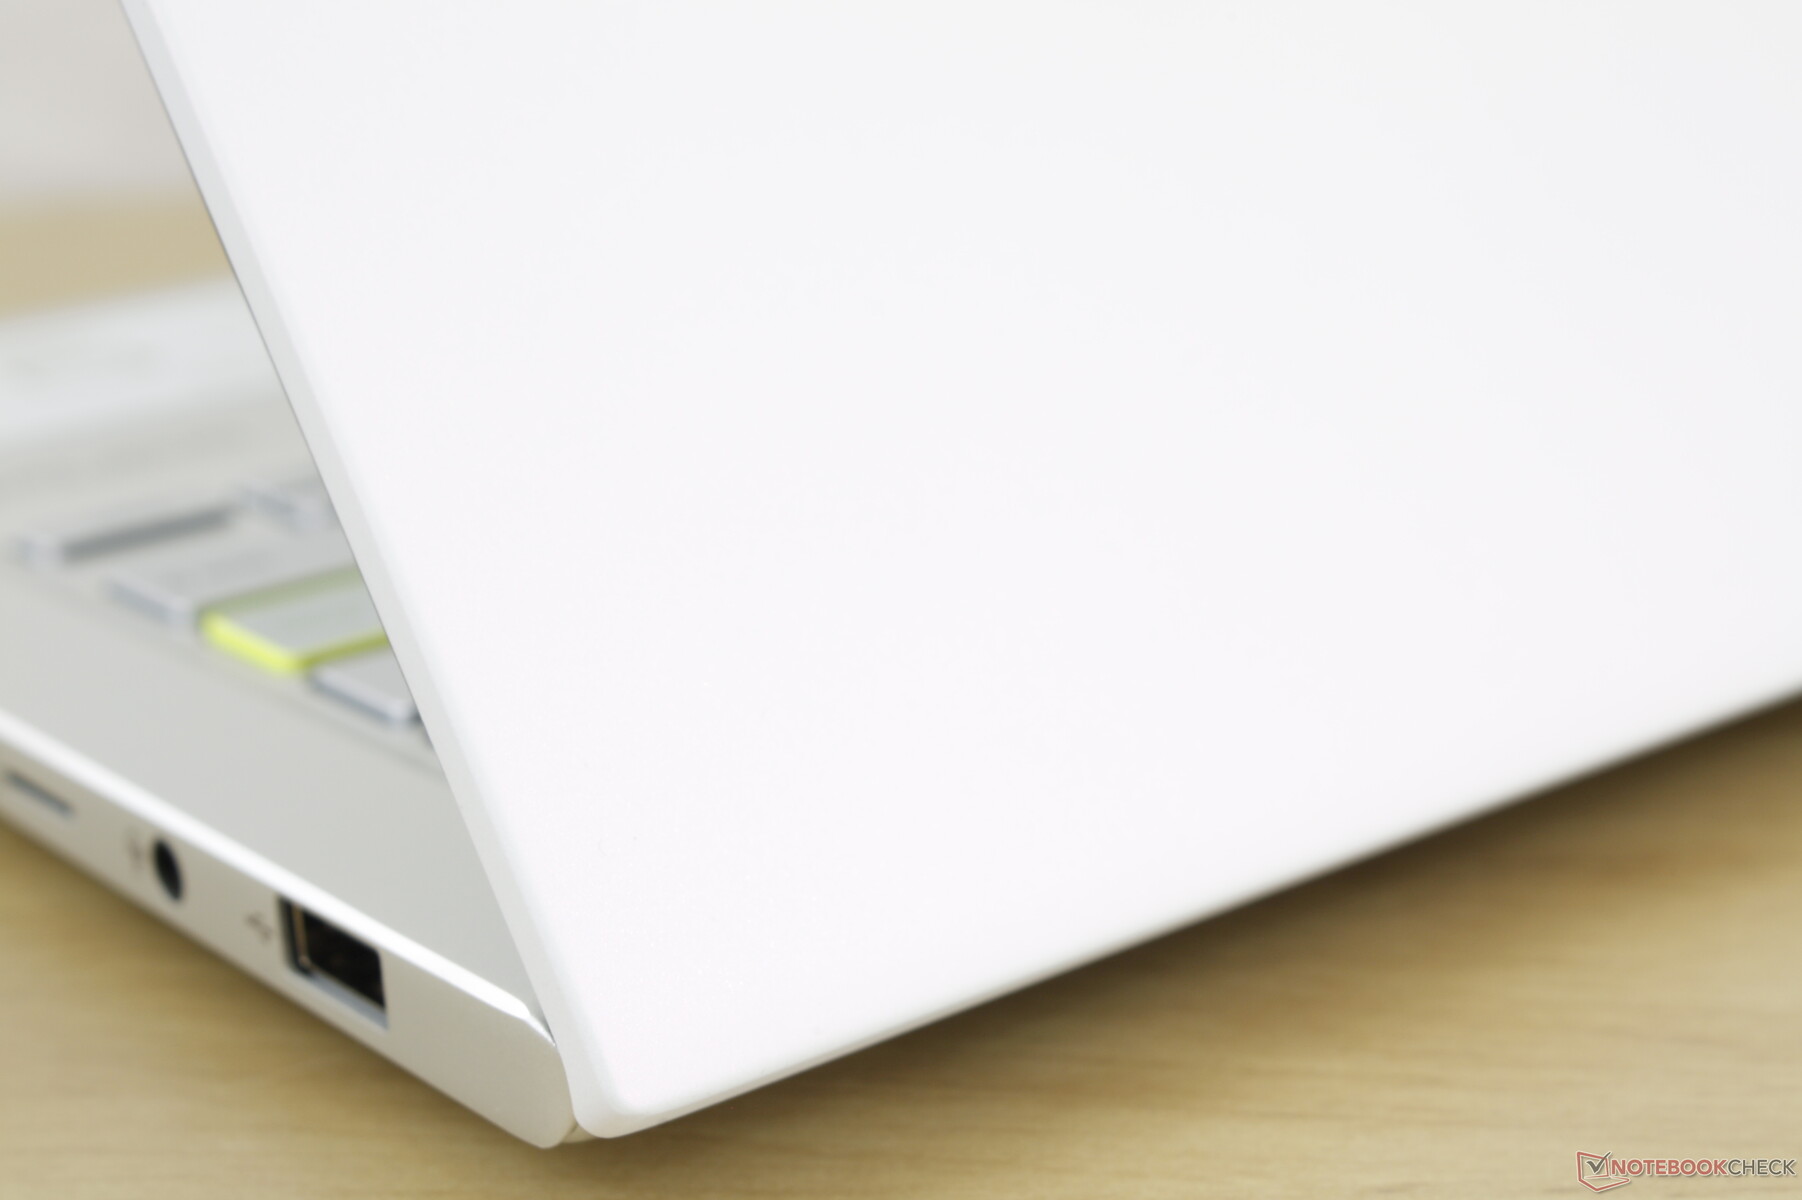
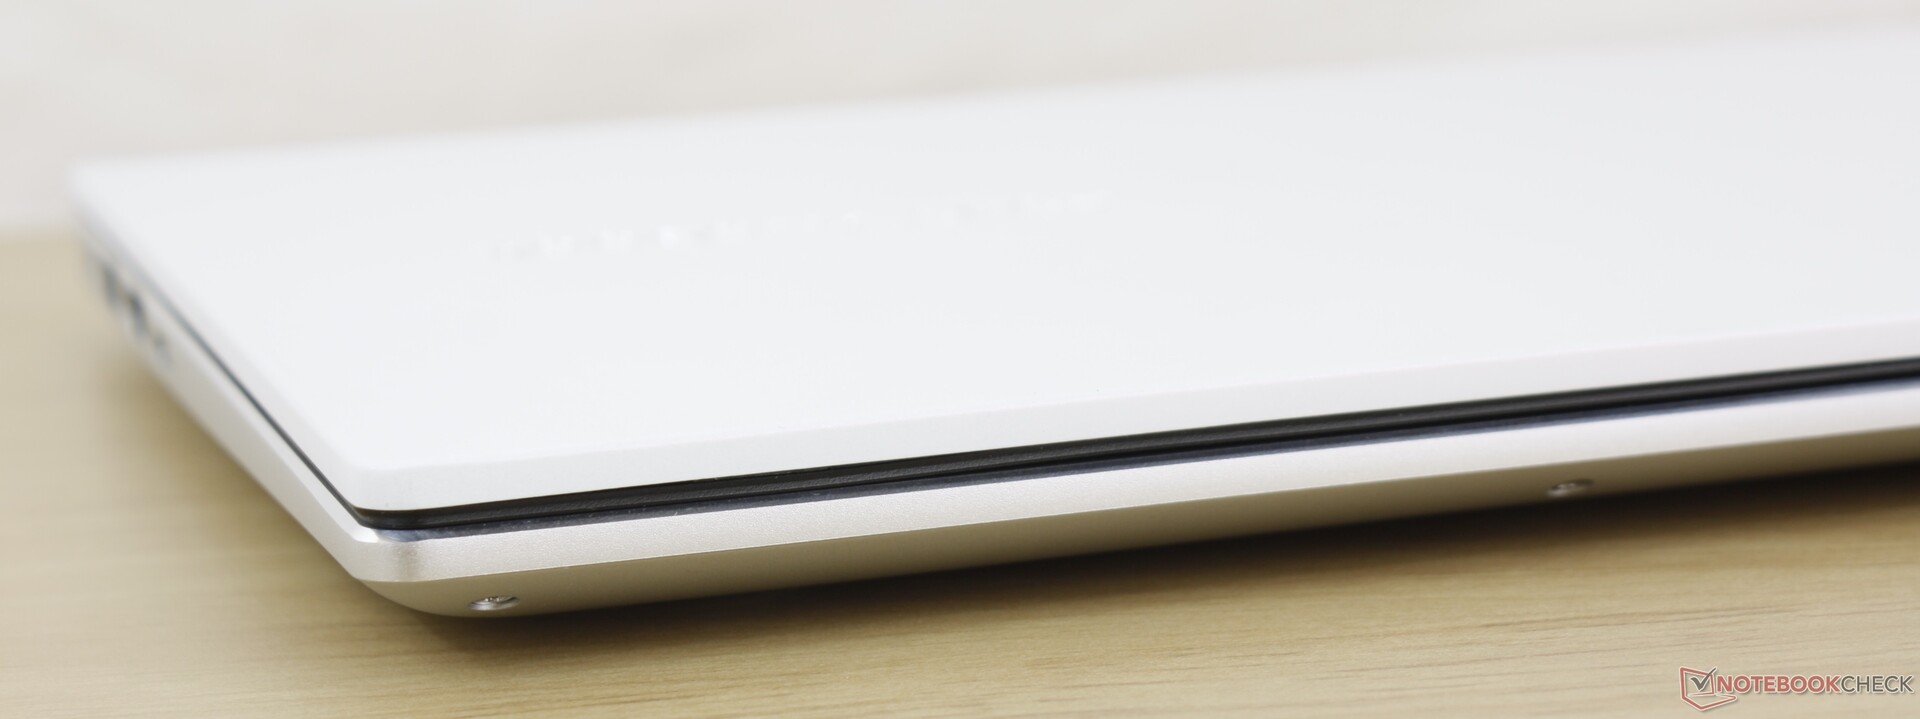
Chassis rigidity is better than expected despite the low price. The base exhibits no creaking with minimal flexing and even the lid is quite stiff. Overall quality is in between that of the cheap Lenovo IdeaPad S540 and more expensive ZenBook S13.
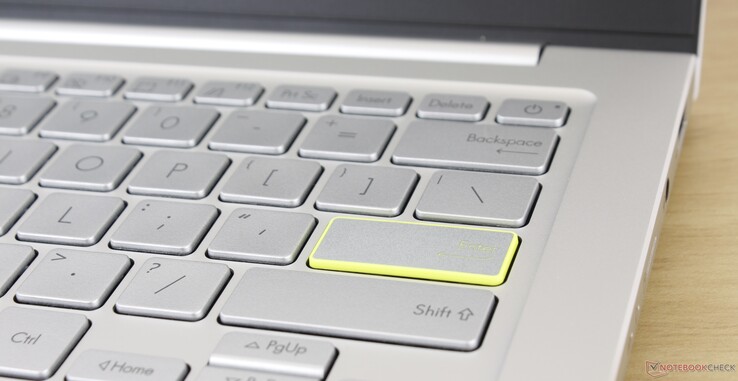
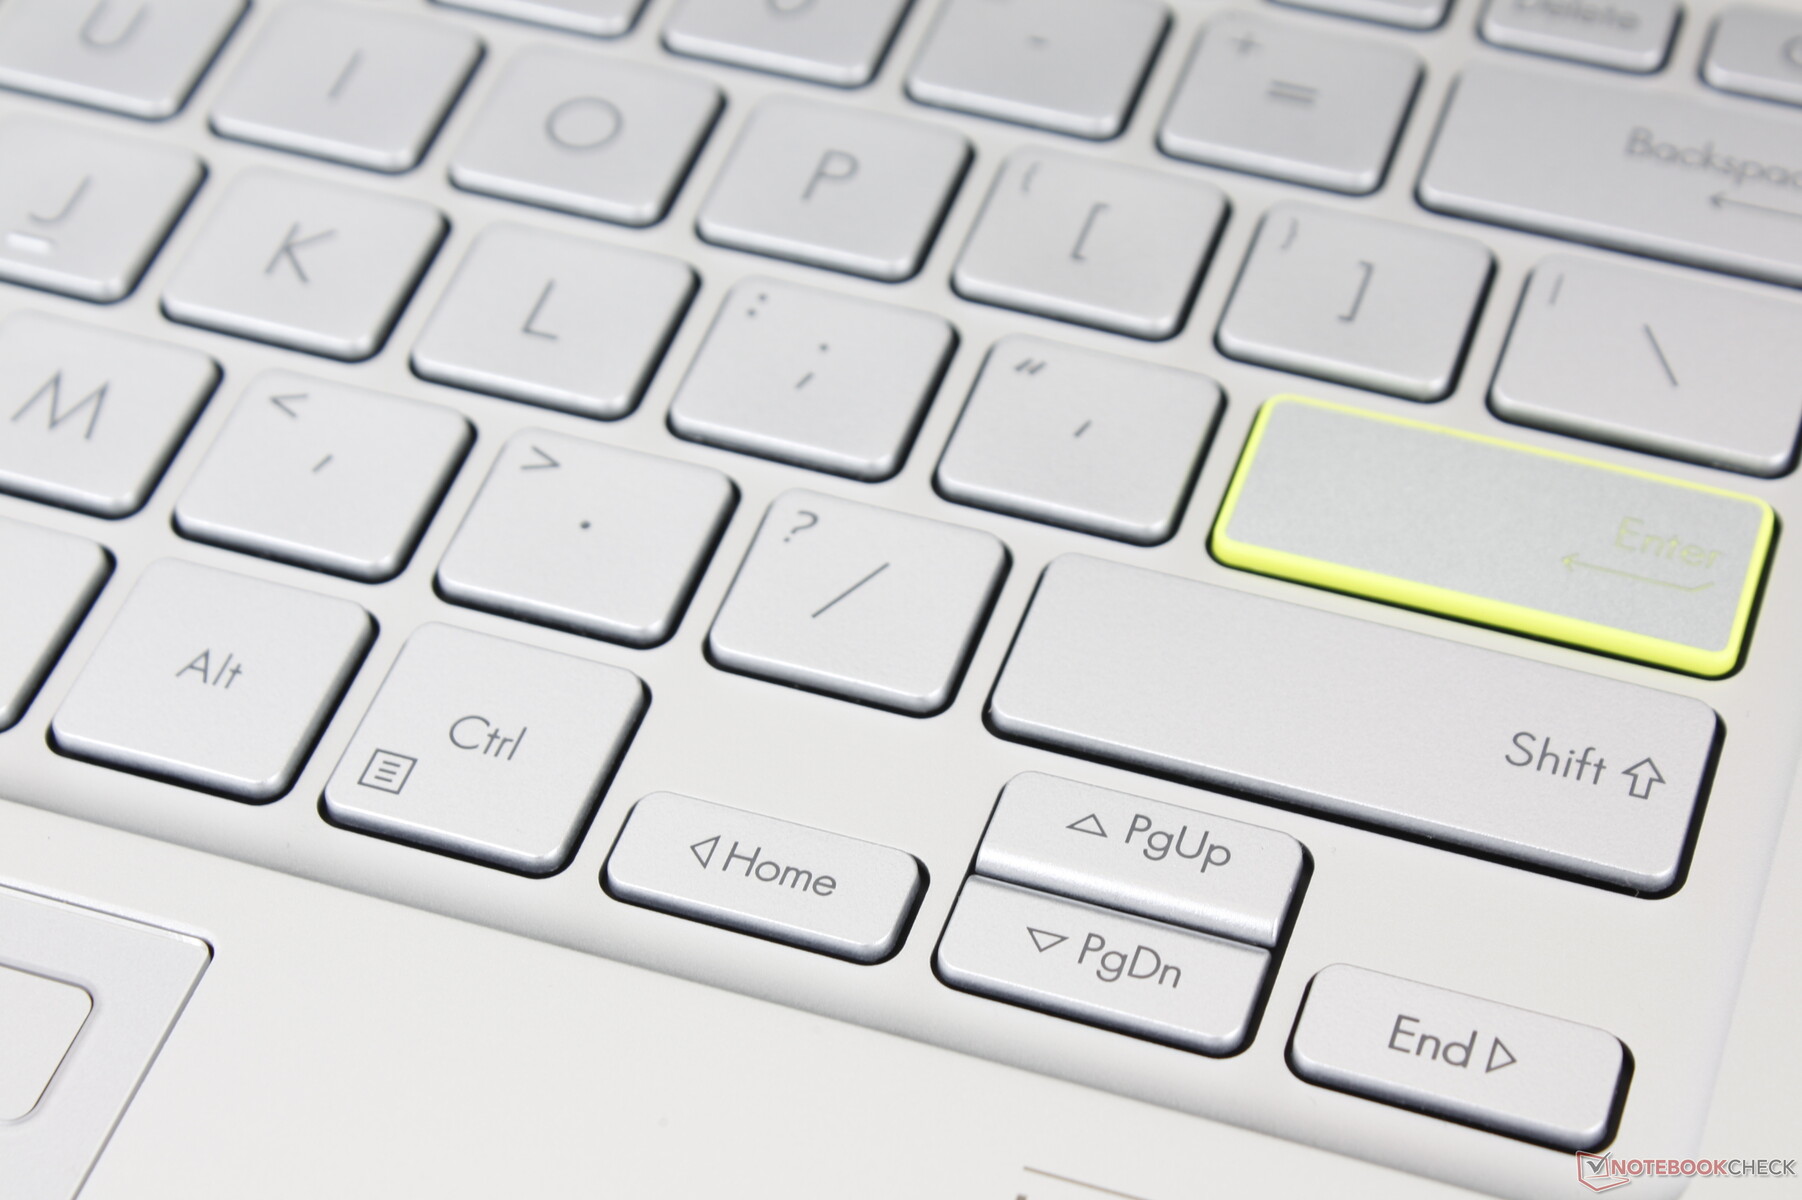
An easy way to distinguish the S333 from other laptops or is its yellow-colored Enter key. Though purely aesthetic, it makes us wish that other color options were available aside from only yellow.
The system is 3 mm thinner than the last generation S330 while length, width, and weight are all nearly the same. Competing 13.3-inch laptops like the IdeaPad S540 or 2020 HP Pavilion 13 are thicker, heavier, and/or larger than our Asus.
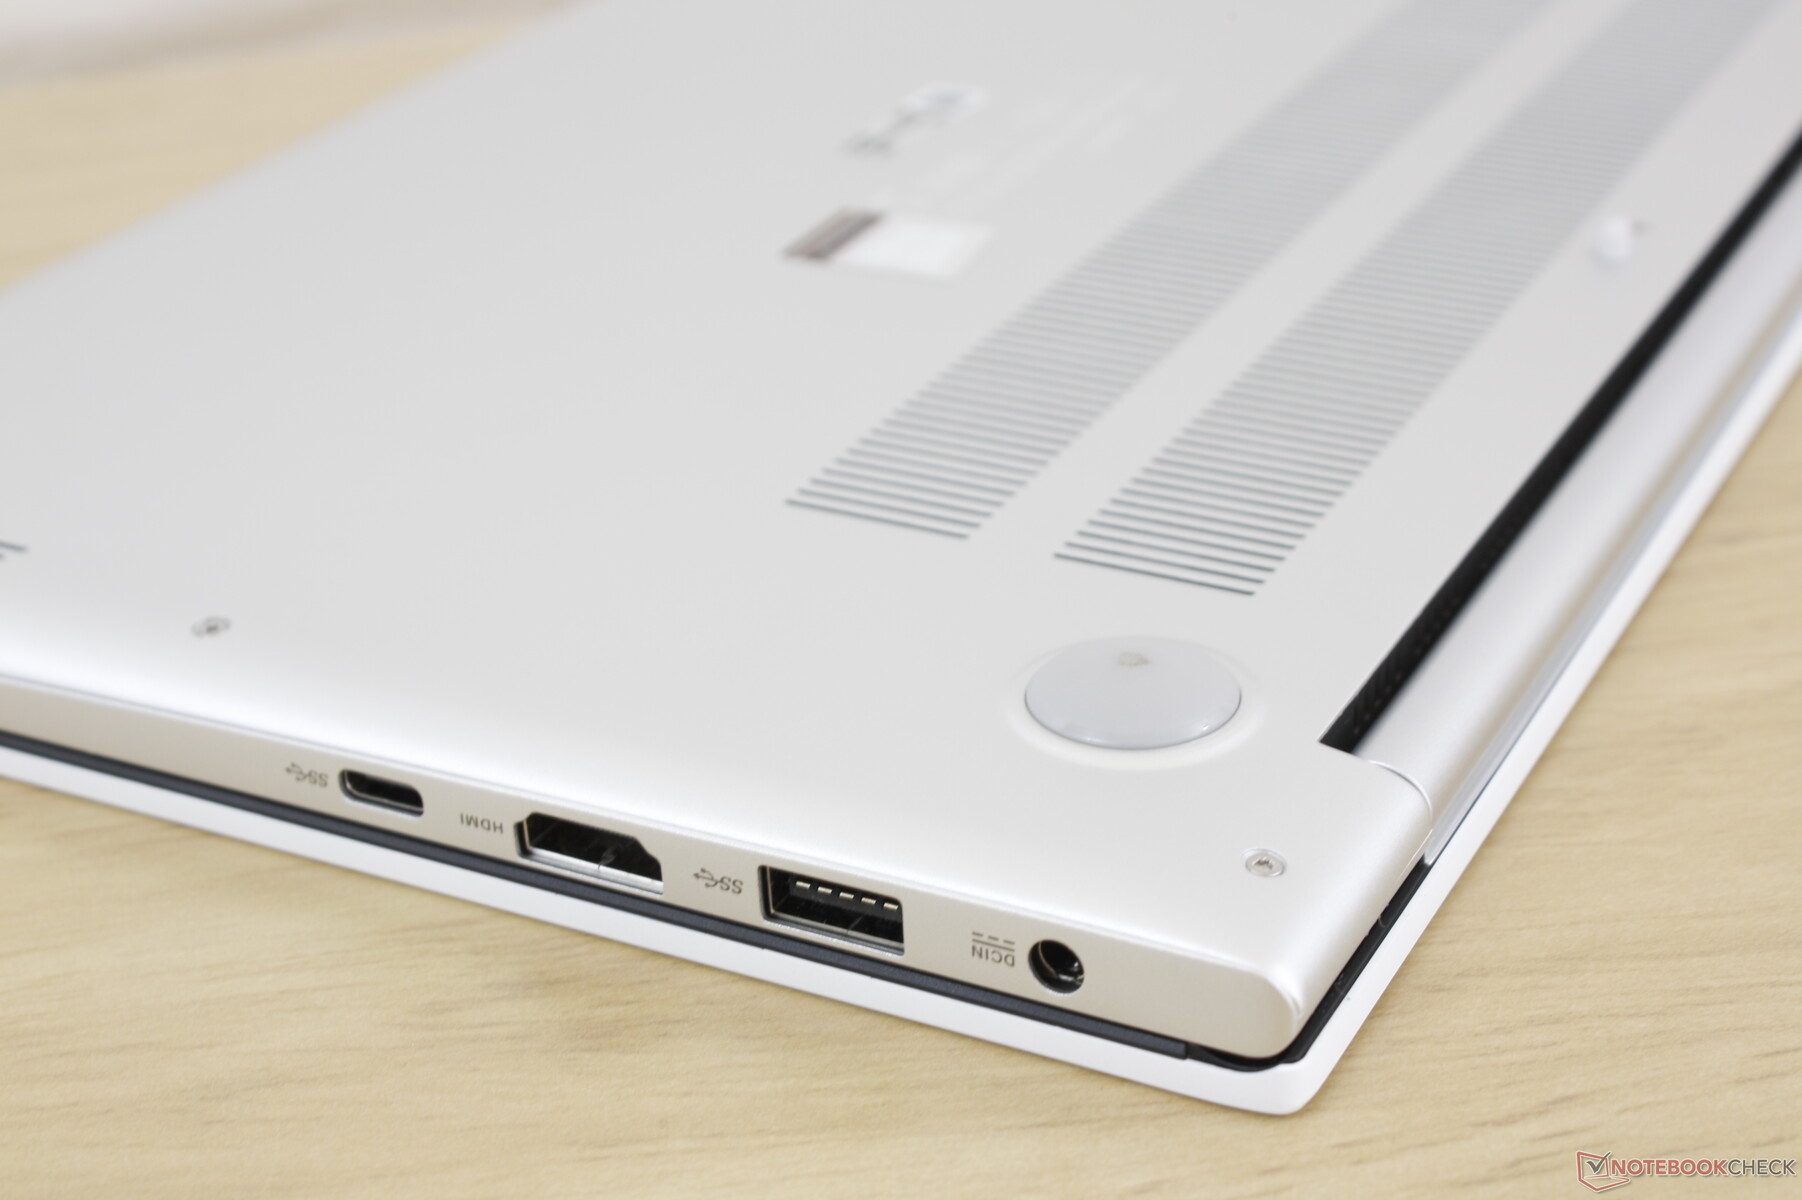
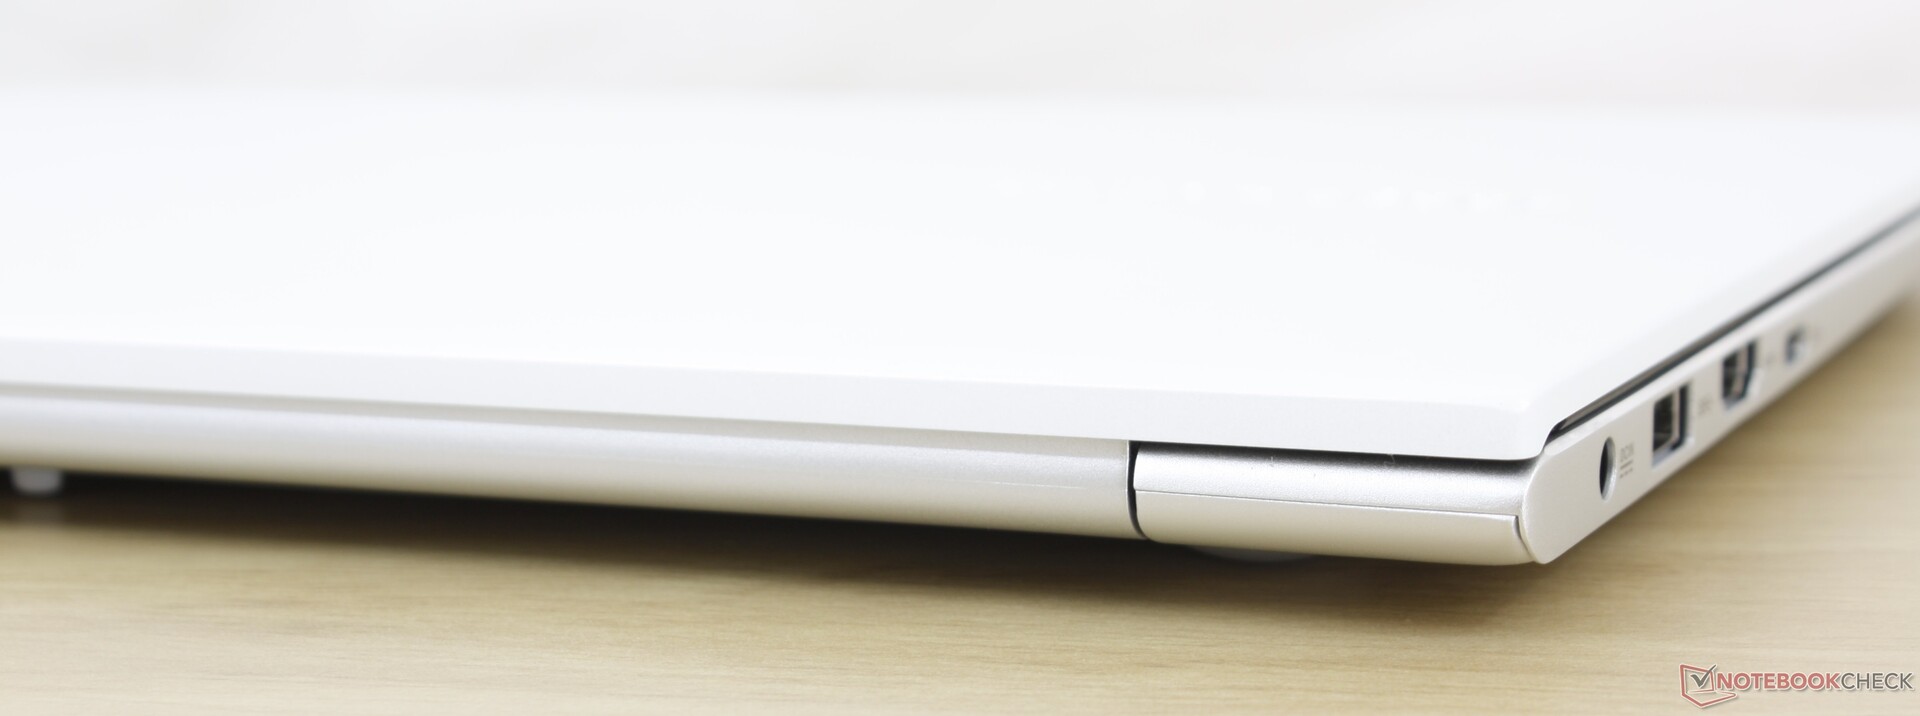
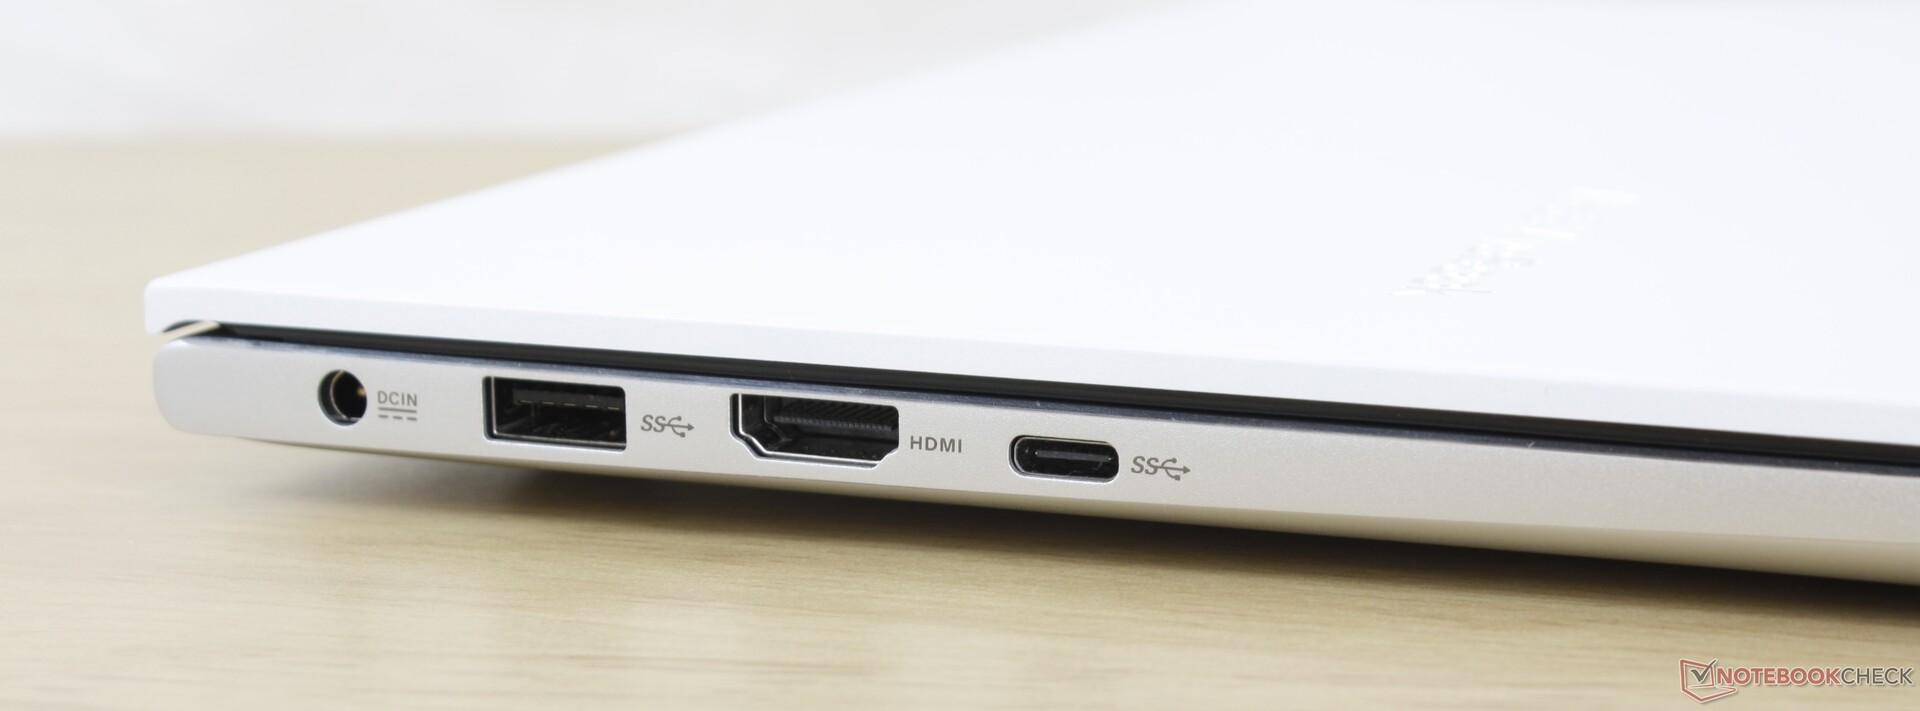
Connectivity
Port options and even positioning are almost identical to the VivoBook S330. While we're relieved that nothing has been dropped, we're also bummed that nothing has been improved. The HDMI port, for example, continues to be 1.4 instead of 2.0 meaning 4K60 external monitors are not supported. Furthermore, the USB-C port here does not support DisplayPort or Power Delivery meaning users will have to upgrade to the pricier VivoBook S13 S333EA or ZenBook series instead for such features.

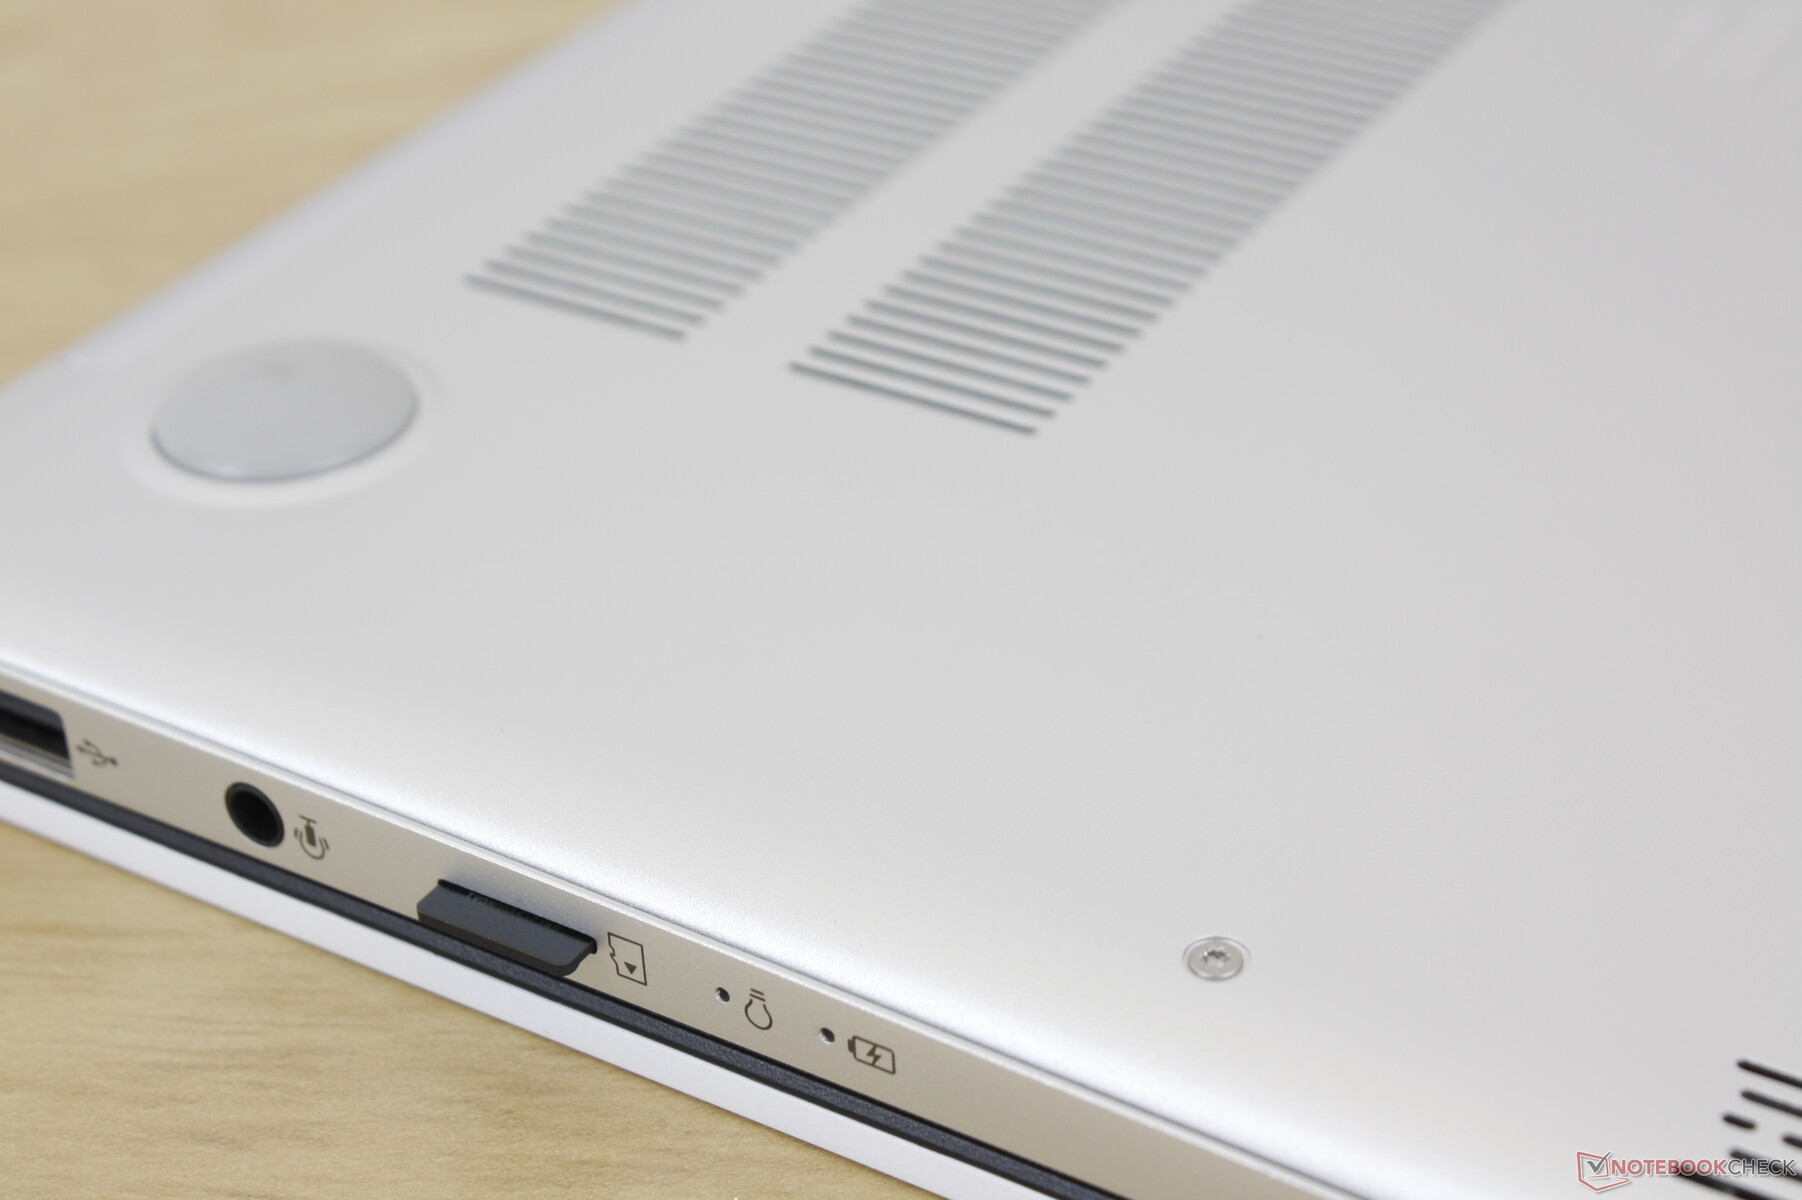
SD Card Reader
Transfer rates from the MicroSD reader are slow at just under 30 MB/s to be over two times slower than the card reader on the ZenBook 13. Plan to wait about 50 seconds per gigabyte if moving files between the laptop and MicroSD card.
Note that the MicroSD card can be difficult to remove since the reader is not spring loaded.
| SD Card Reader | |
| average JPG Copy Test (av. of 3 runs) | |
| Dell XPS 13 9310 Core i7 FHD (Toshiba Exceria Pro M501 64 GB UHS-II) | |
| HP Pavilion 13-bb0015cl (Toshiba Exceria Pro M501 32 GB UHS-II) | |
| Asus ZenBook 13 UX325JA (Toshiba Exceria Pro M501 microSDXC 64GB) | |
| Asus VivoBook S13 S330UA-EY034T (Toshiba Exceria Pro M501 64 GB UHS-II) | |
| Asus VivoBook S13 S333JA-DS51 (Angelbird 128GB AV Pro UHS-II) | |
| maximum AS SSD Seq Read Test (1GB) | |
| Dell XPS 13 9310 Core i7 FHD (Toshiba Exceria Pro M501 64 GB UHS-II) | |
| HP Pavilion 13-bb0015cl (Toshiba Exceria Pro M501 32 GB UHS-II) | |
| Asus ZenBook 13 UX325JA (Toshiba Exceria Pro M501 microSDXC 64GB) | |
| Asus VivoBook S13 S330UA-EY034T (Toshiba Exceria Pro M501 64 GB UHS-II) | |
| Asus VivoBook S13 S333JA-DS51 (Angelbird 128GB AV Pro UHS-II) | |
Communication
Webcam

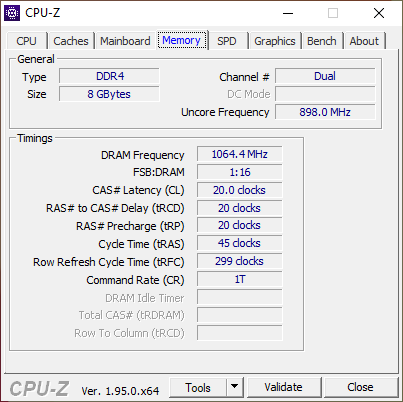
, i5-1035G1, Intel SSD 660p SSDPEKNW512G8")
, i5-1035G1, Intel SSD 660p SSDPEKNW512G8")
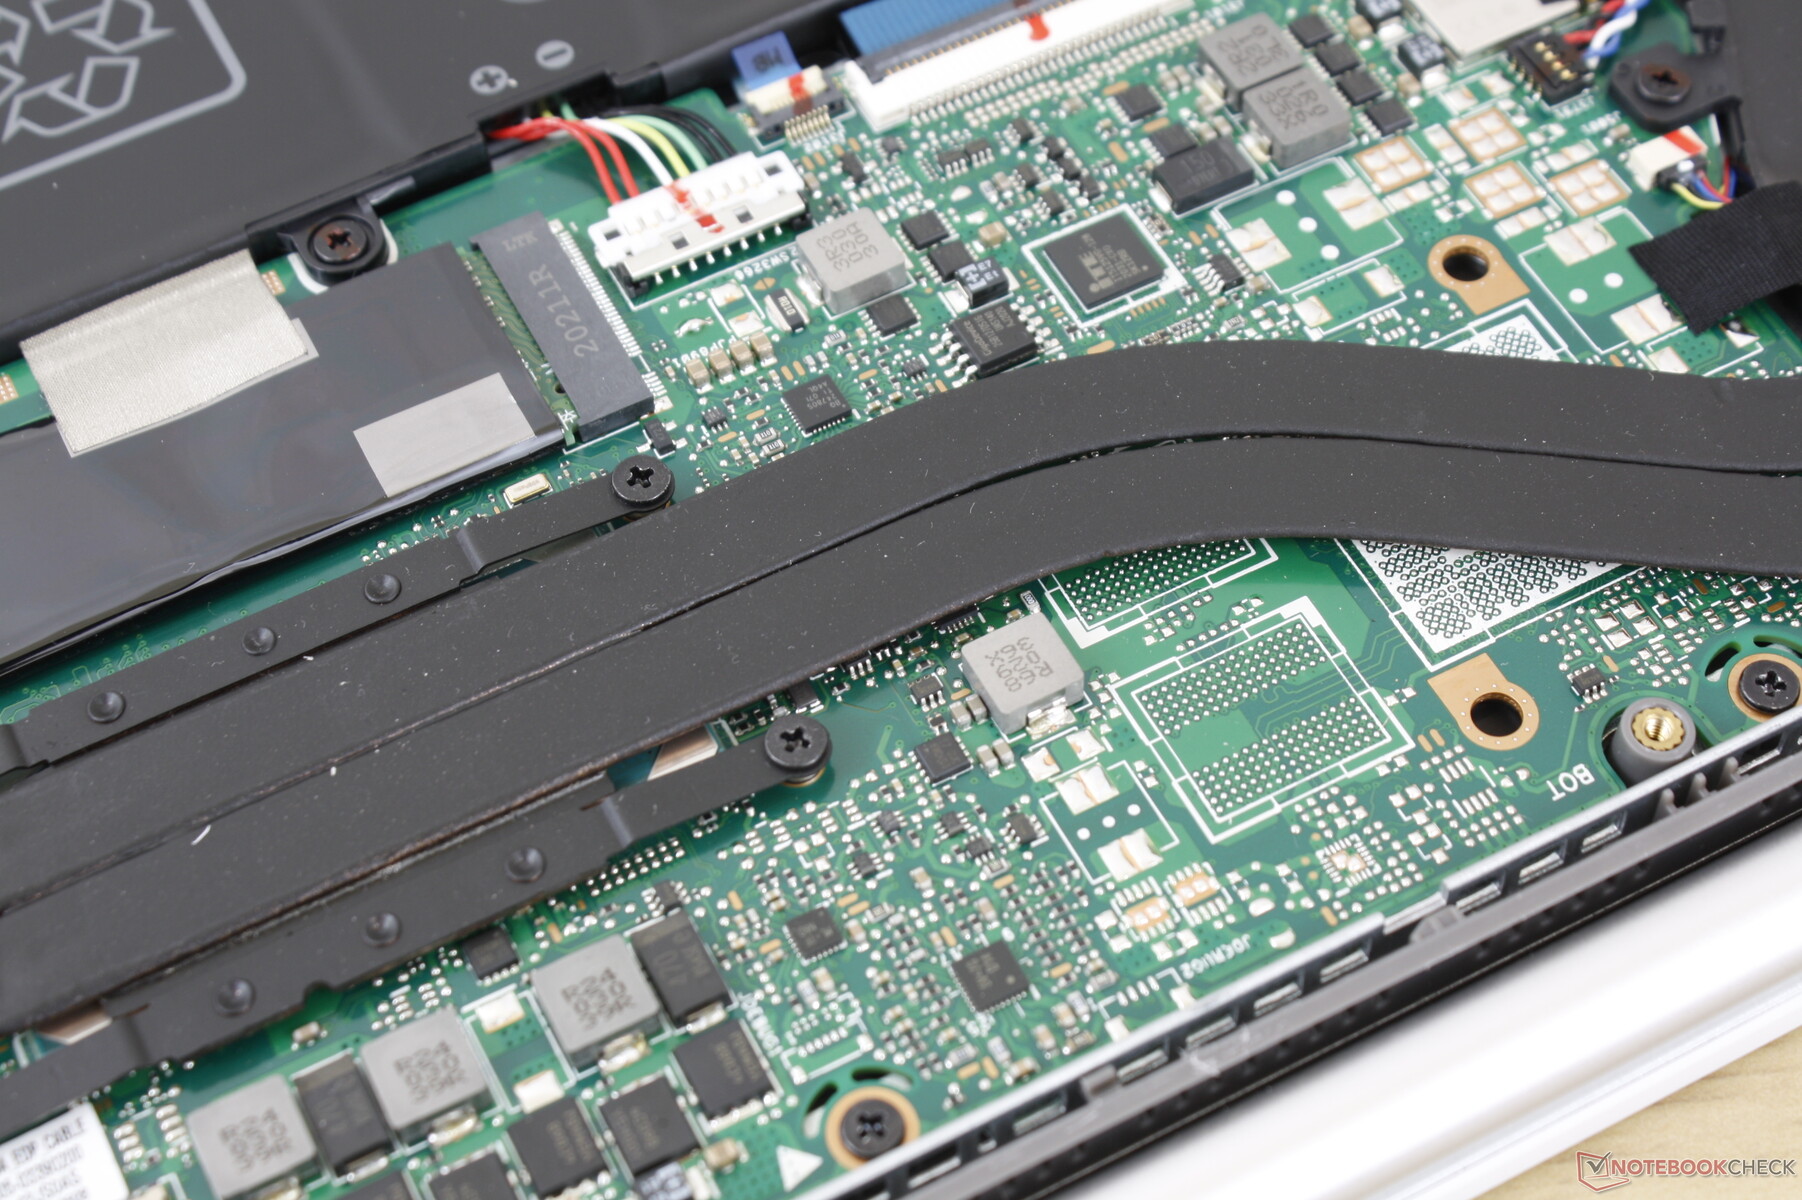
Maintenance
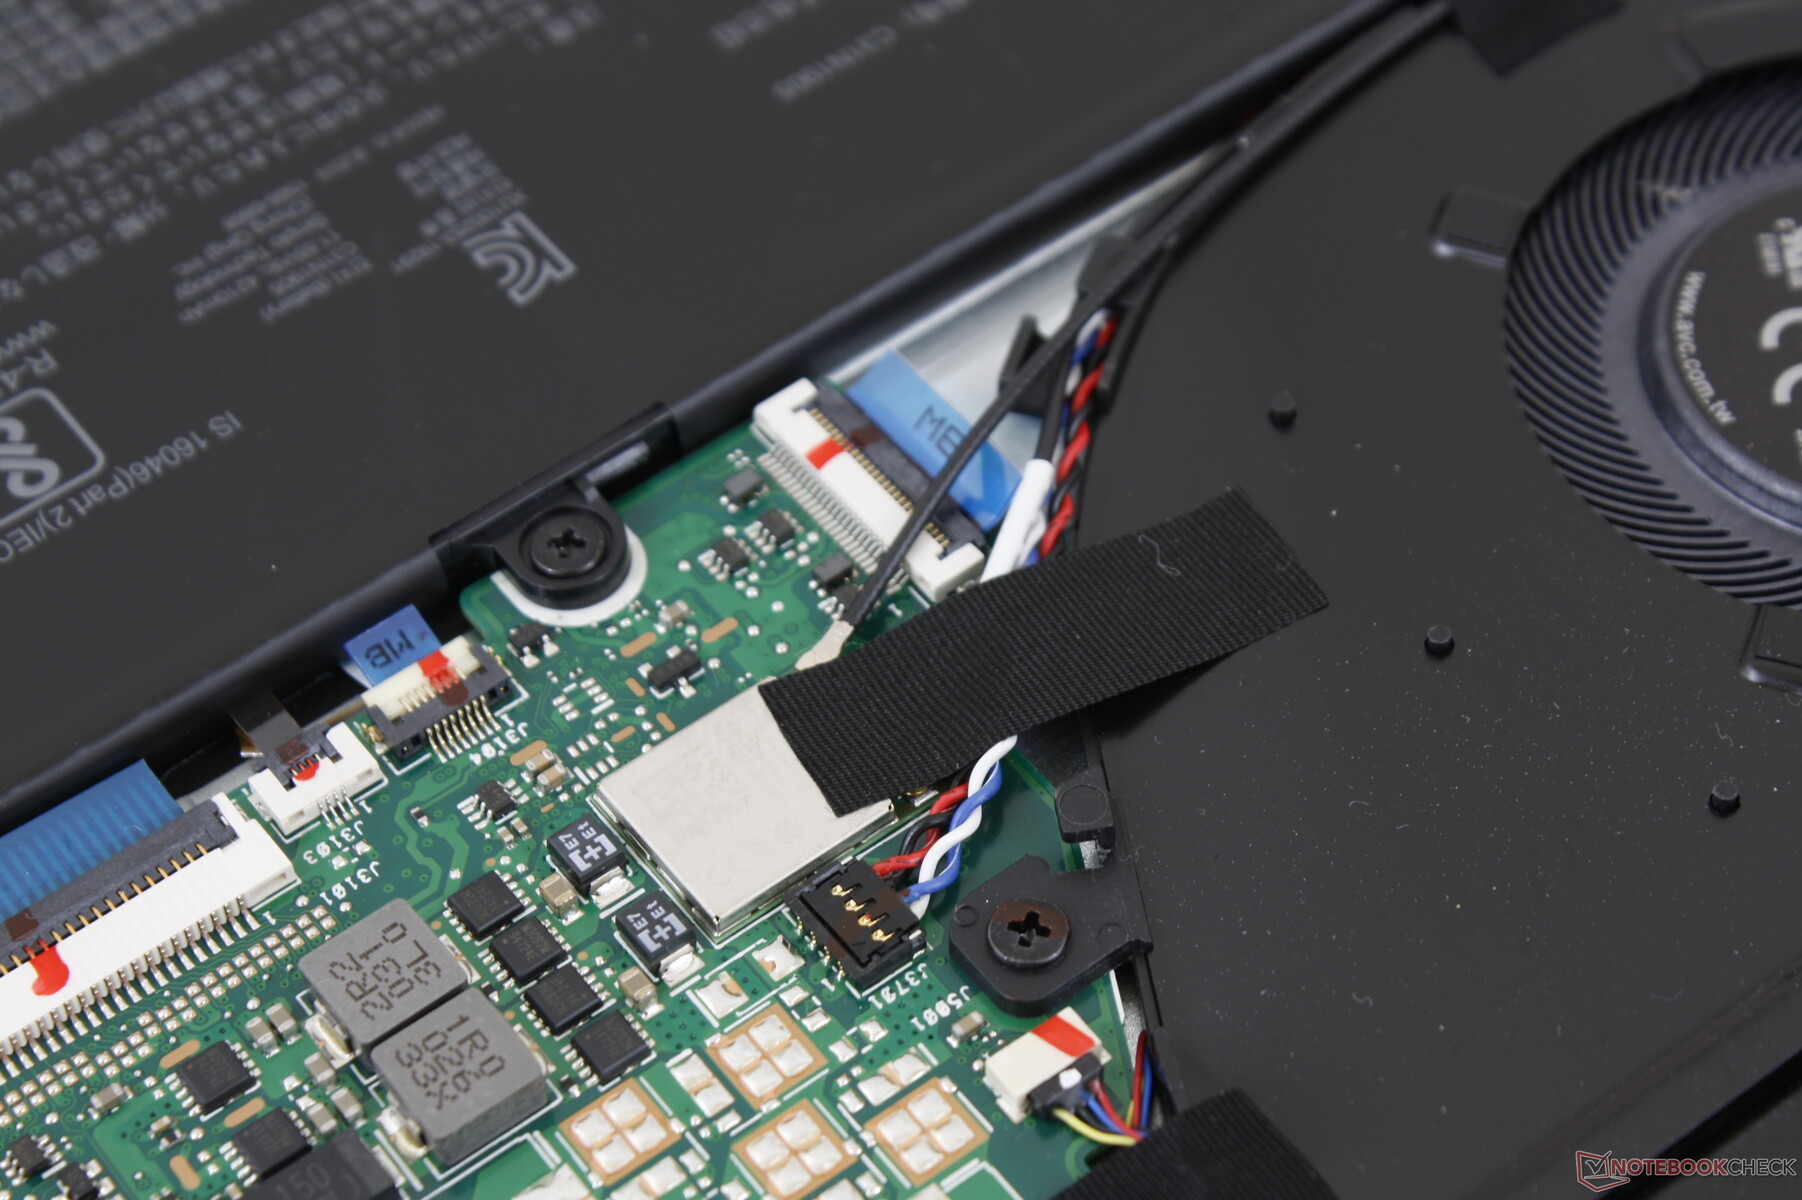
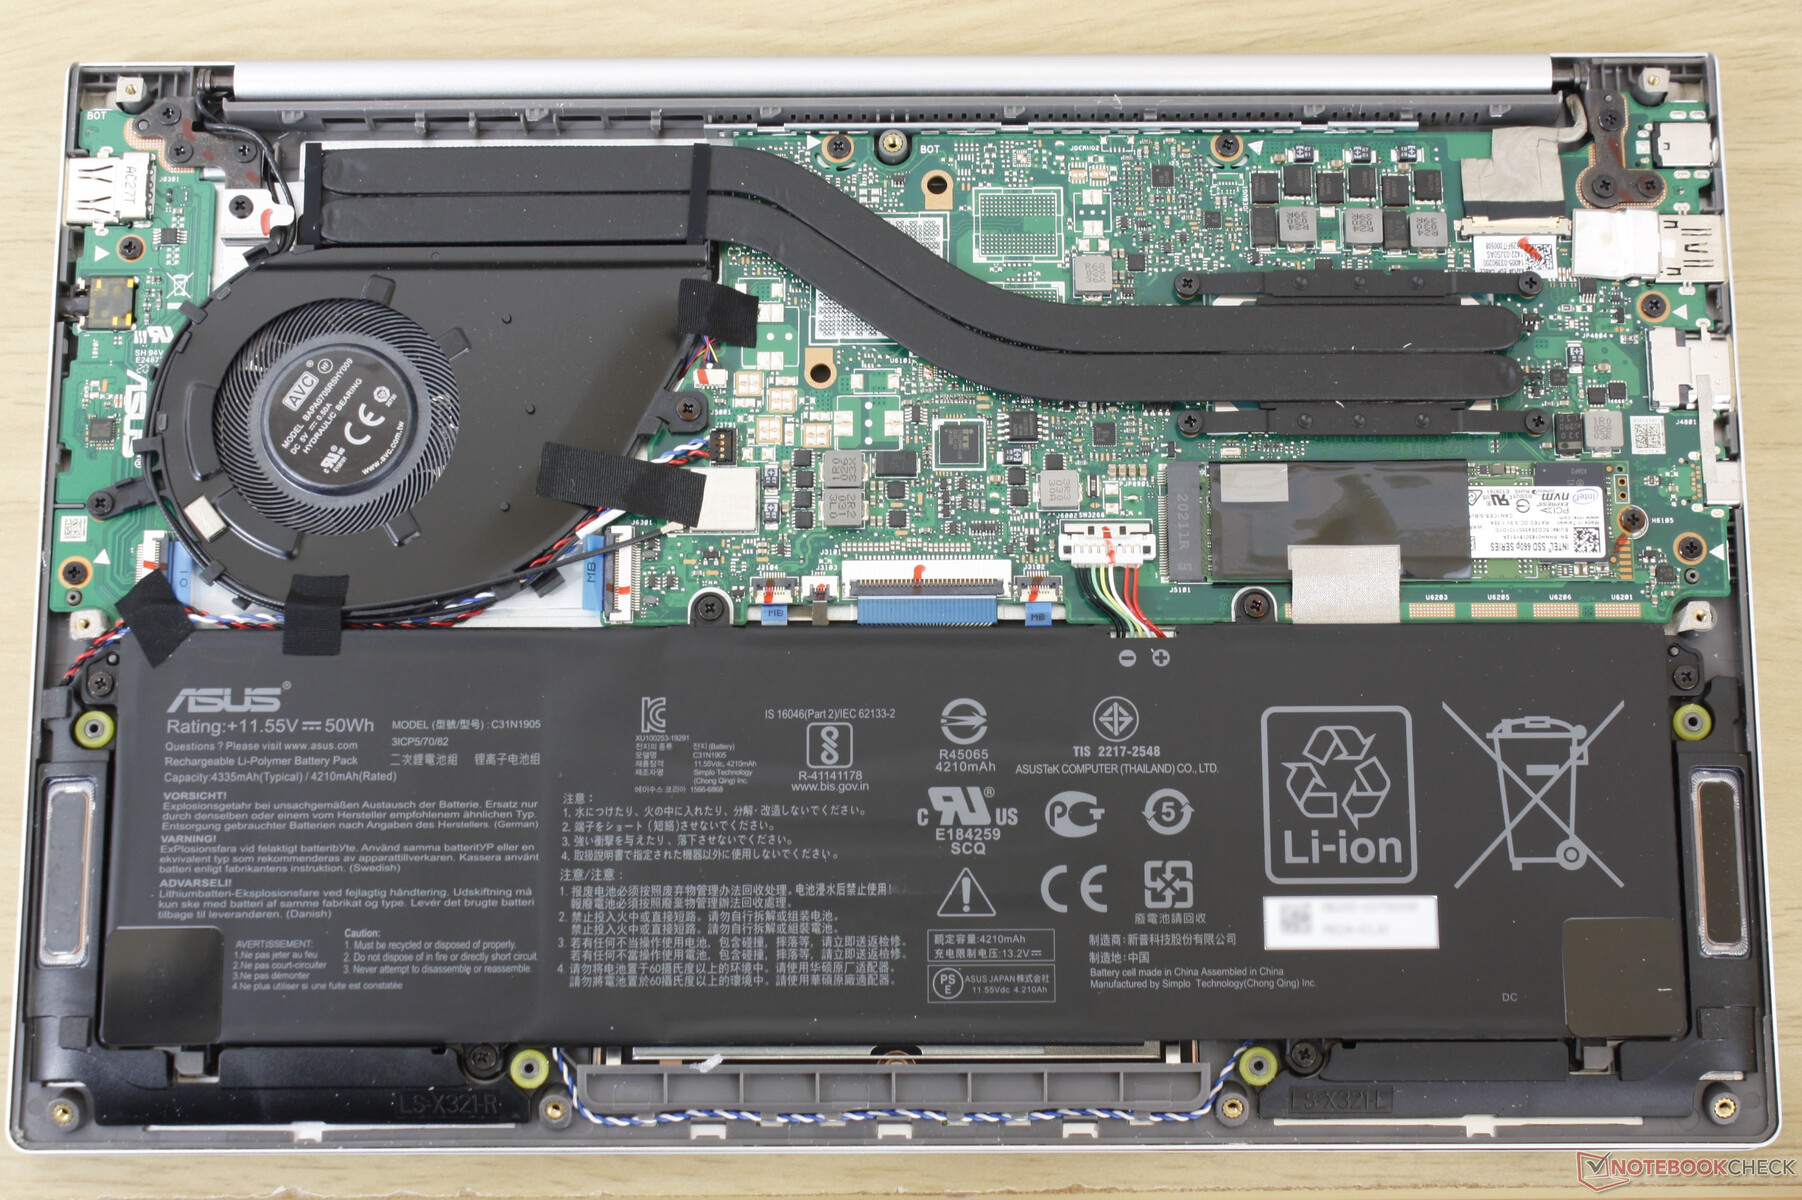
The bottom panel is difficult to remove because its edges and corners are both sharp and tightly latched to the metal base. We can at least appreciate that there are no hidden screws underneath any of the rubber feet.
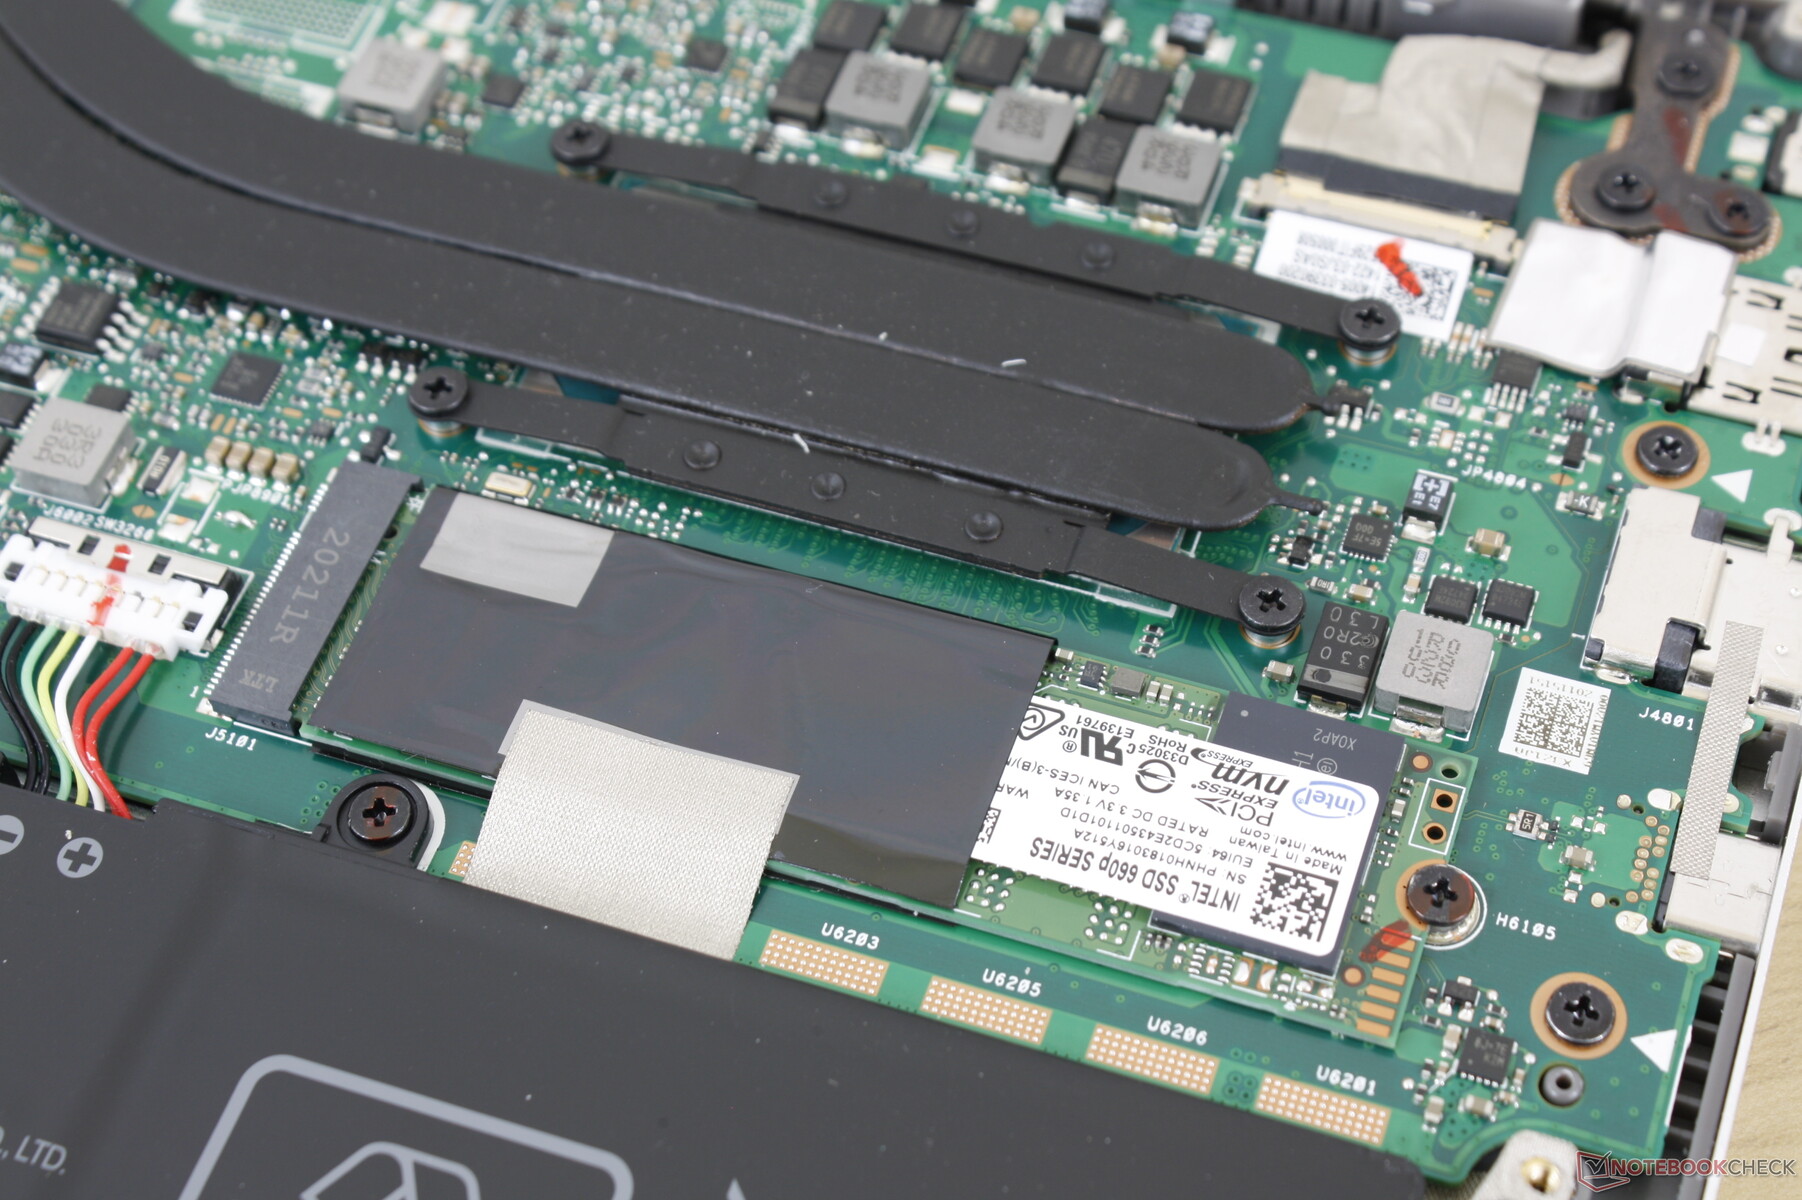
Once inside, users can only upgrade the M.2 SSD as both the WLAN and RAM modules are soldered.
Accessories and Warranty
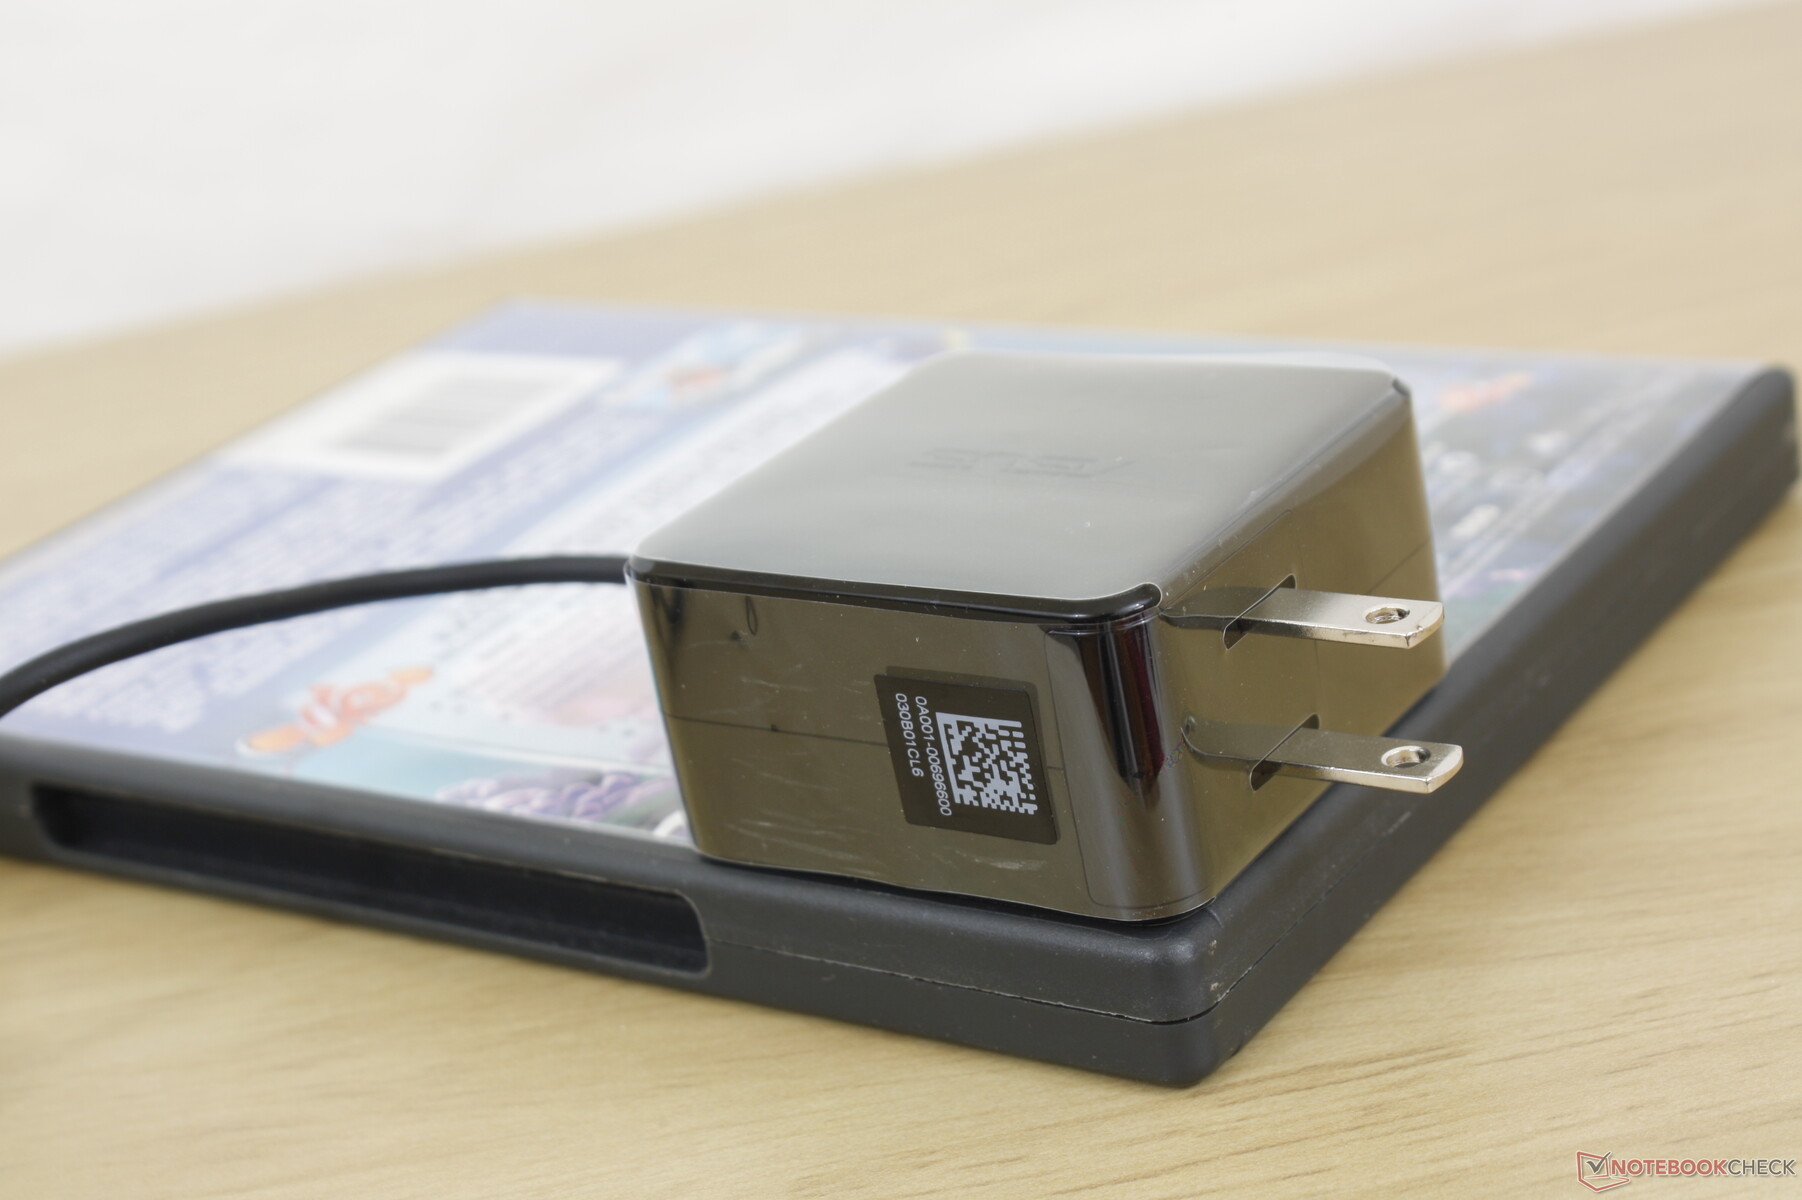
There are no extras in the box outside of the AC adapter and paperwork. The usual one-year limited manufacturer warranty applies.
Input Devices
Keyboard
The keys offer 1.4 mm of travel with crisp feedback when pressed. Clatter, however, is louder than average especially when pressing the Enter or Space keys.
All keys and symbols are lit when the white backlight is active. Keep in mind that the backlight should be disabled when working in well-lit environments because the white light contrasts poorly with the silver key caps.
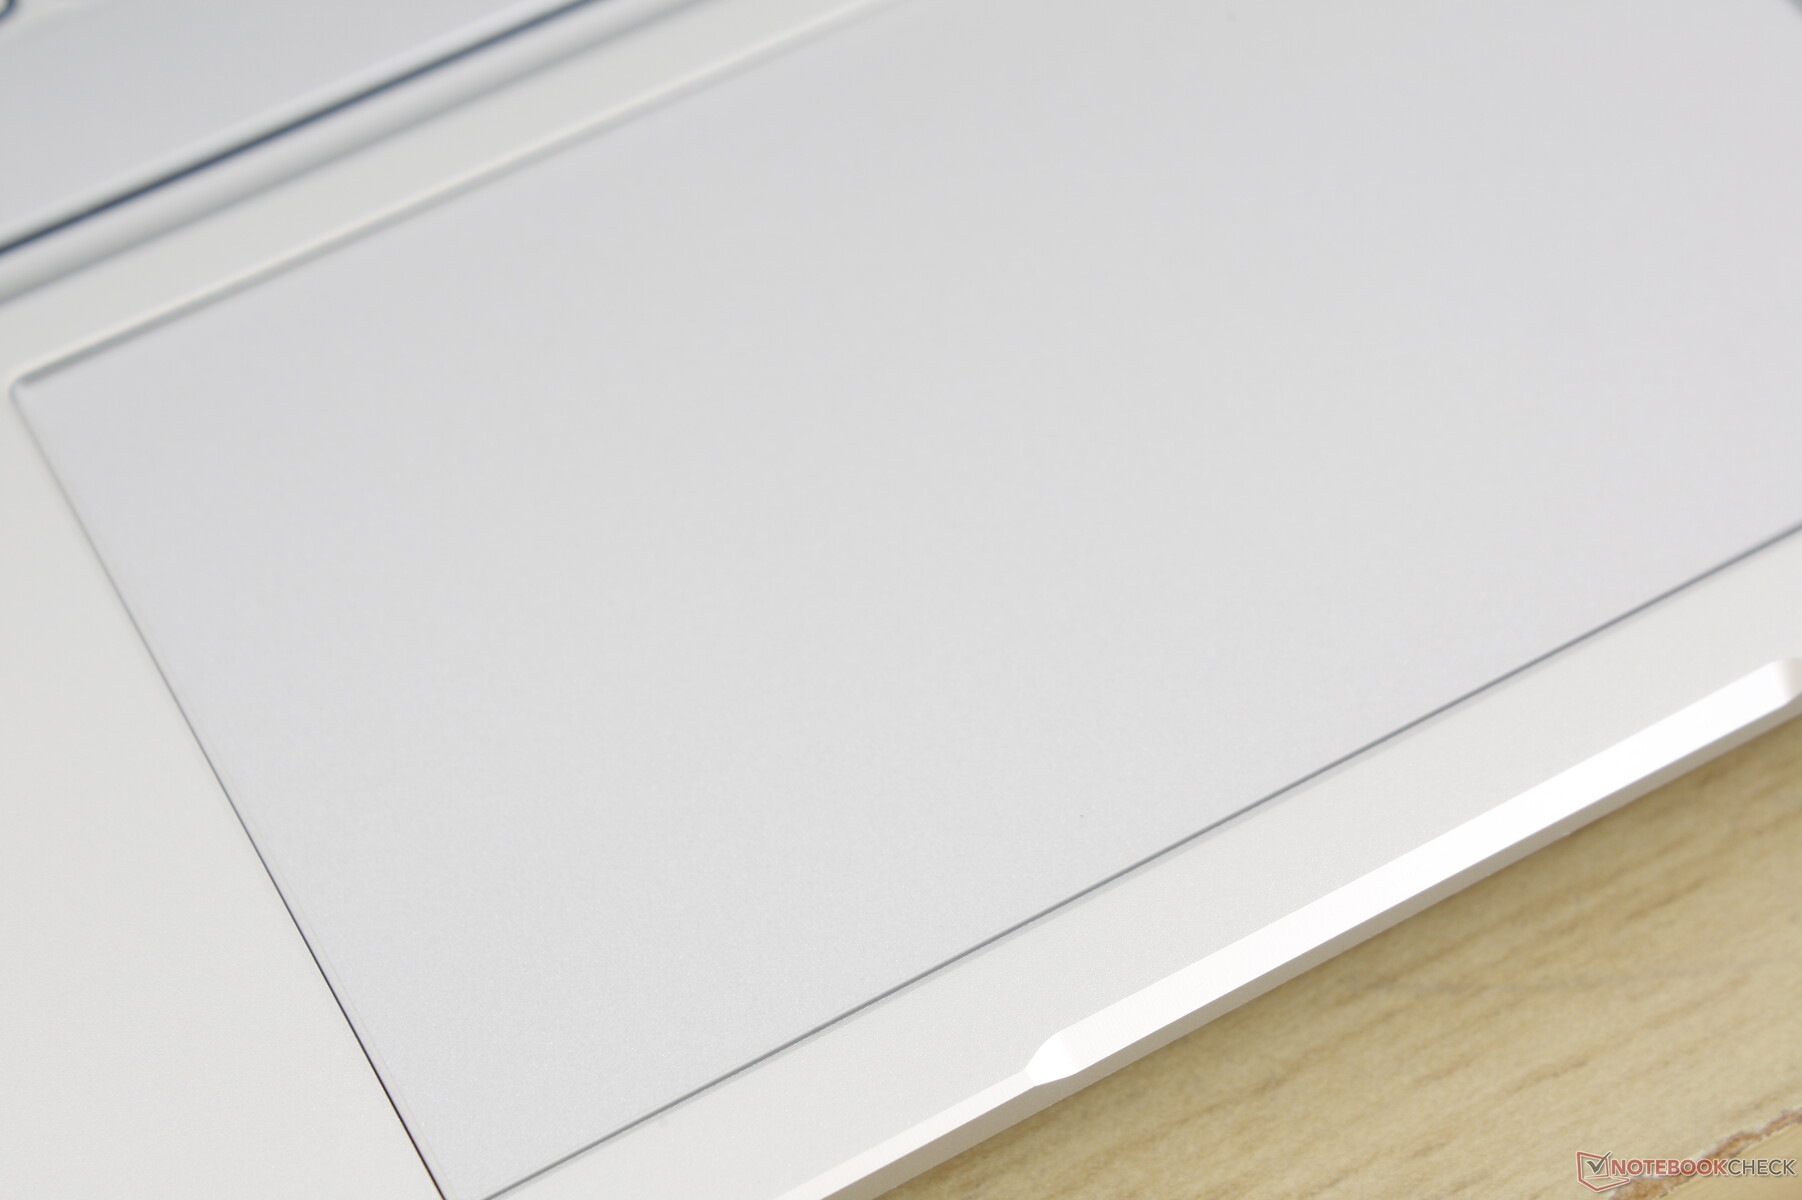
Touchpad
The clickpad is smaller than the clickpad on the ZenBook S13 (10 x 6 cm vs. 10.5 x 6.2 cm) and the top right corner is not even usable because the space is reserved for the fingerprint reader. It can feel cramped as a result especially for vertical movements. Glide is otherwise smooth and textureless if moving quickly while slower movements have moderate sticking for more accurate clicking.
The integrated mouse clicks are loud when pressed with shallow travel and weak feedback. Clickpads with weak feedback are usually quiet when pressed, but this VivoBook seems to be an exception.


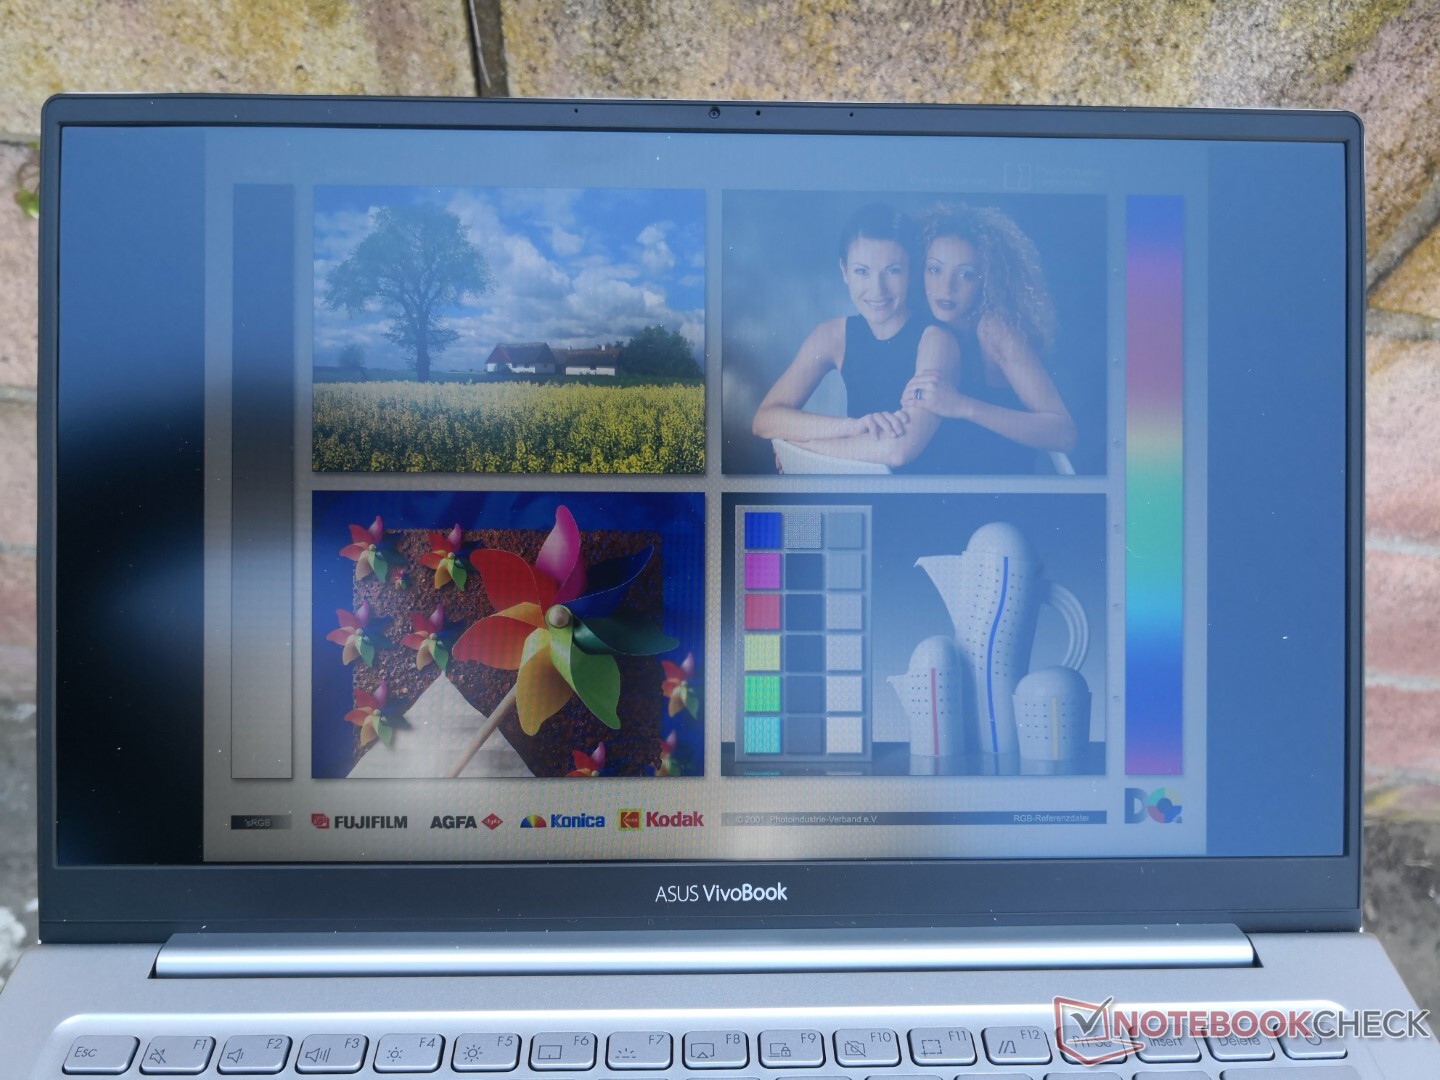
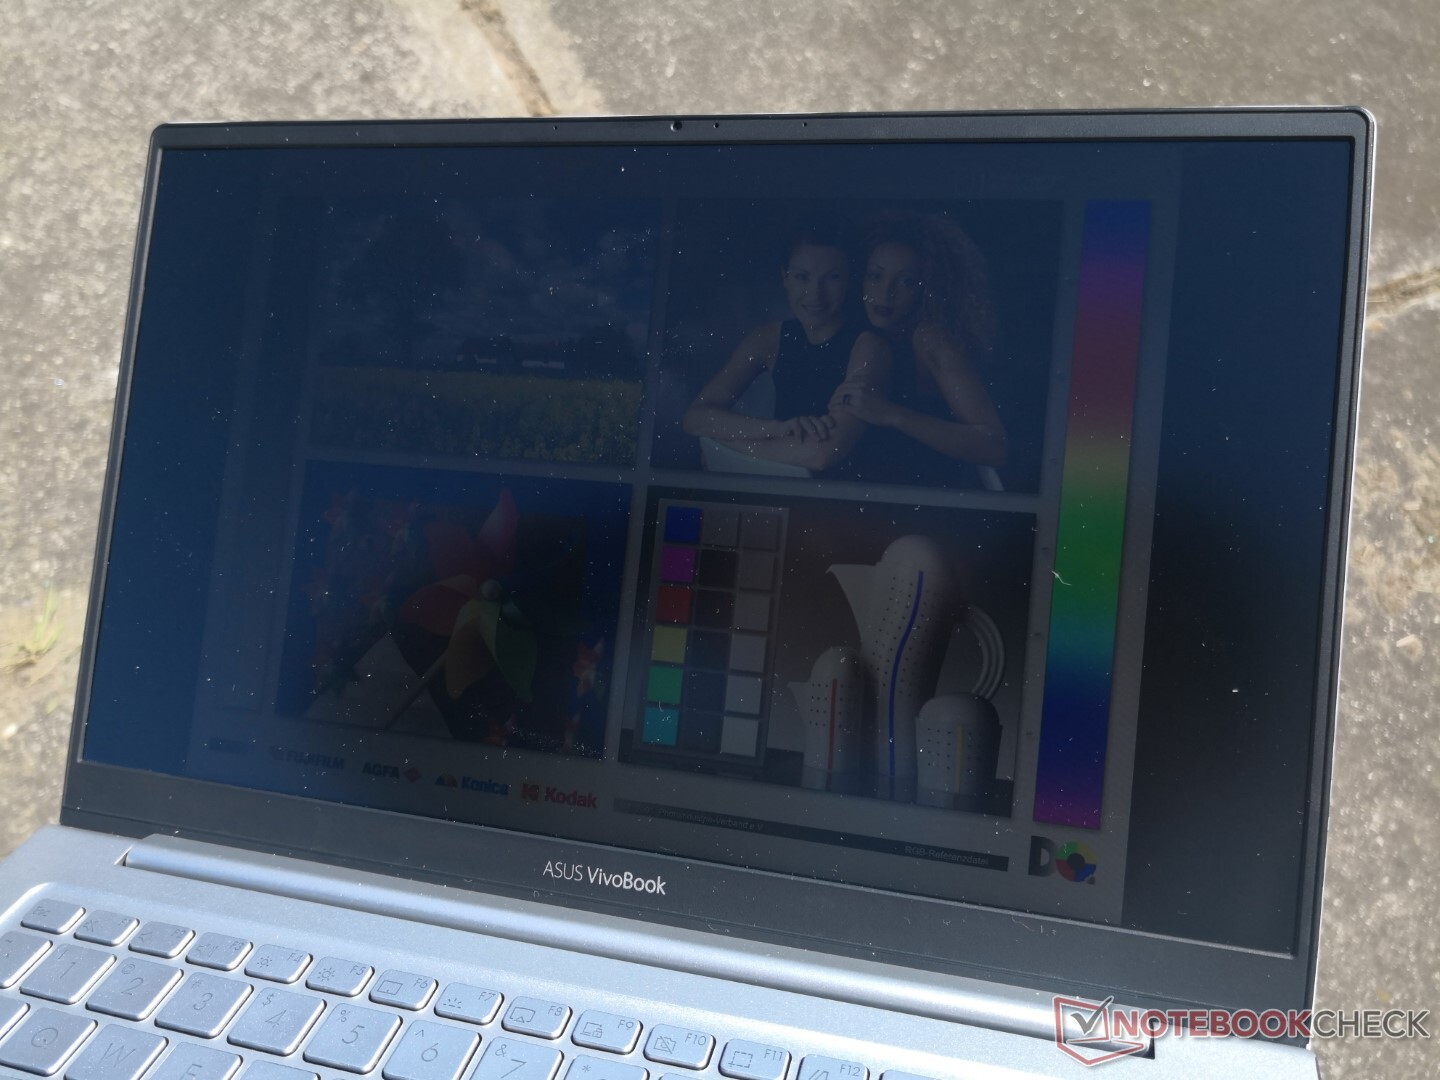
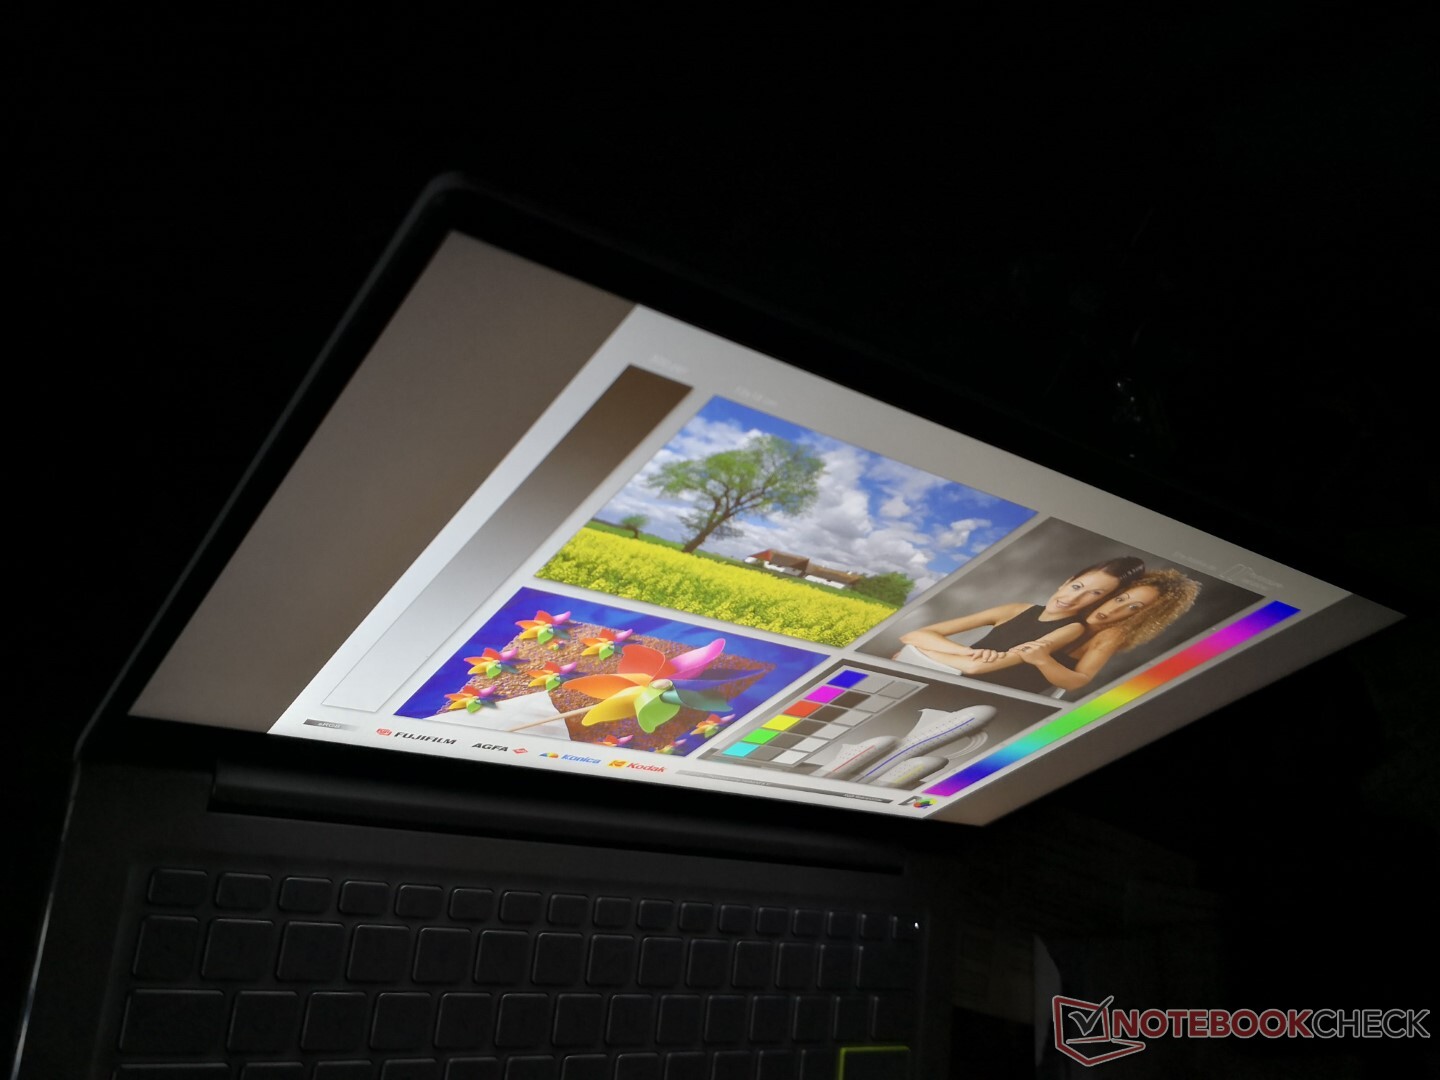
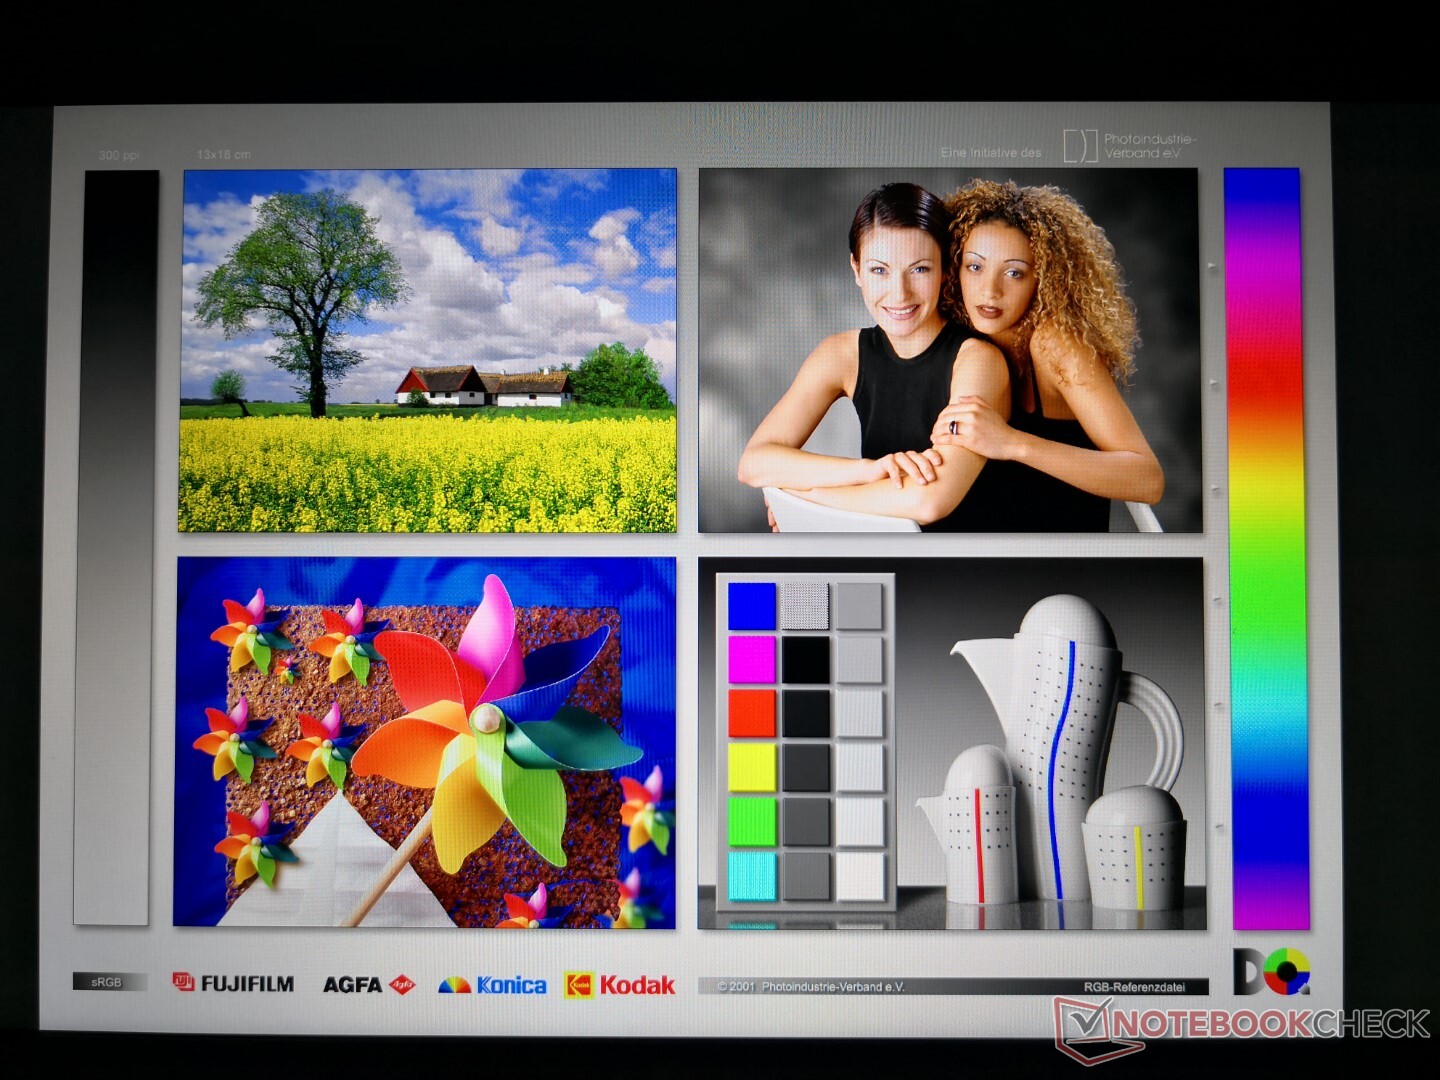
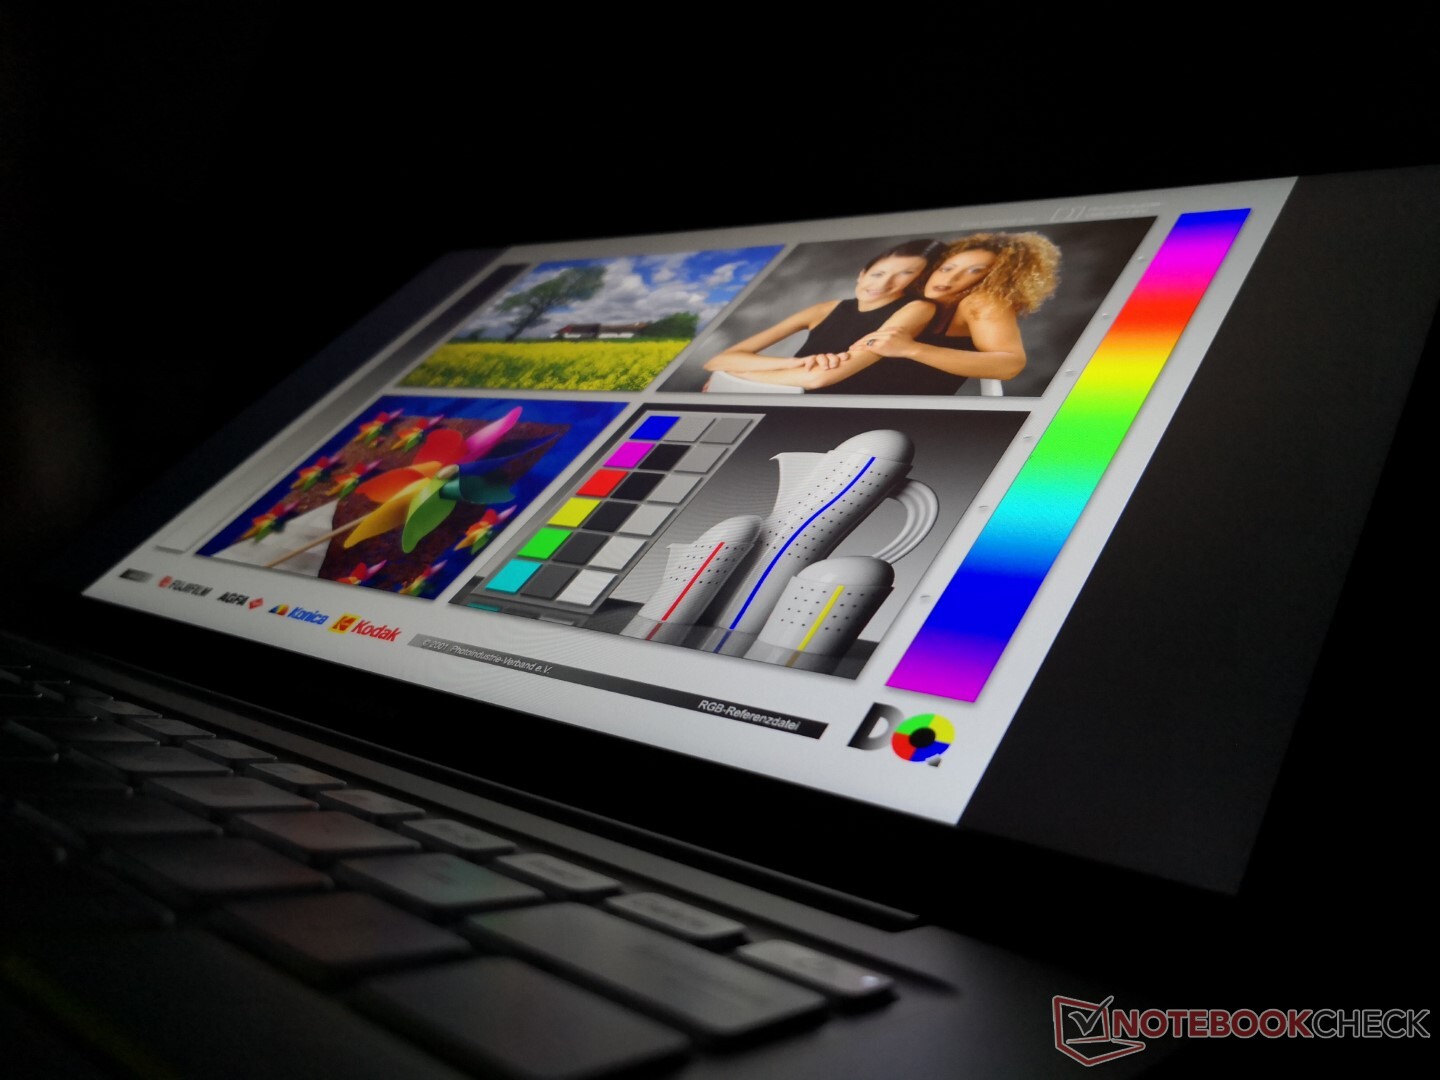
Display
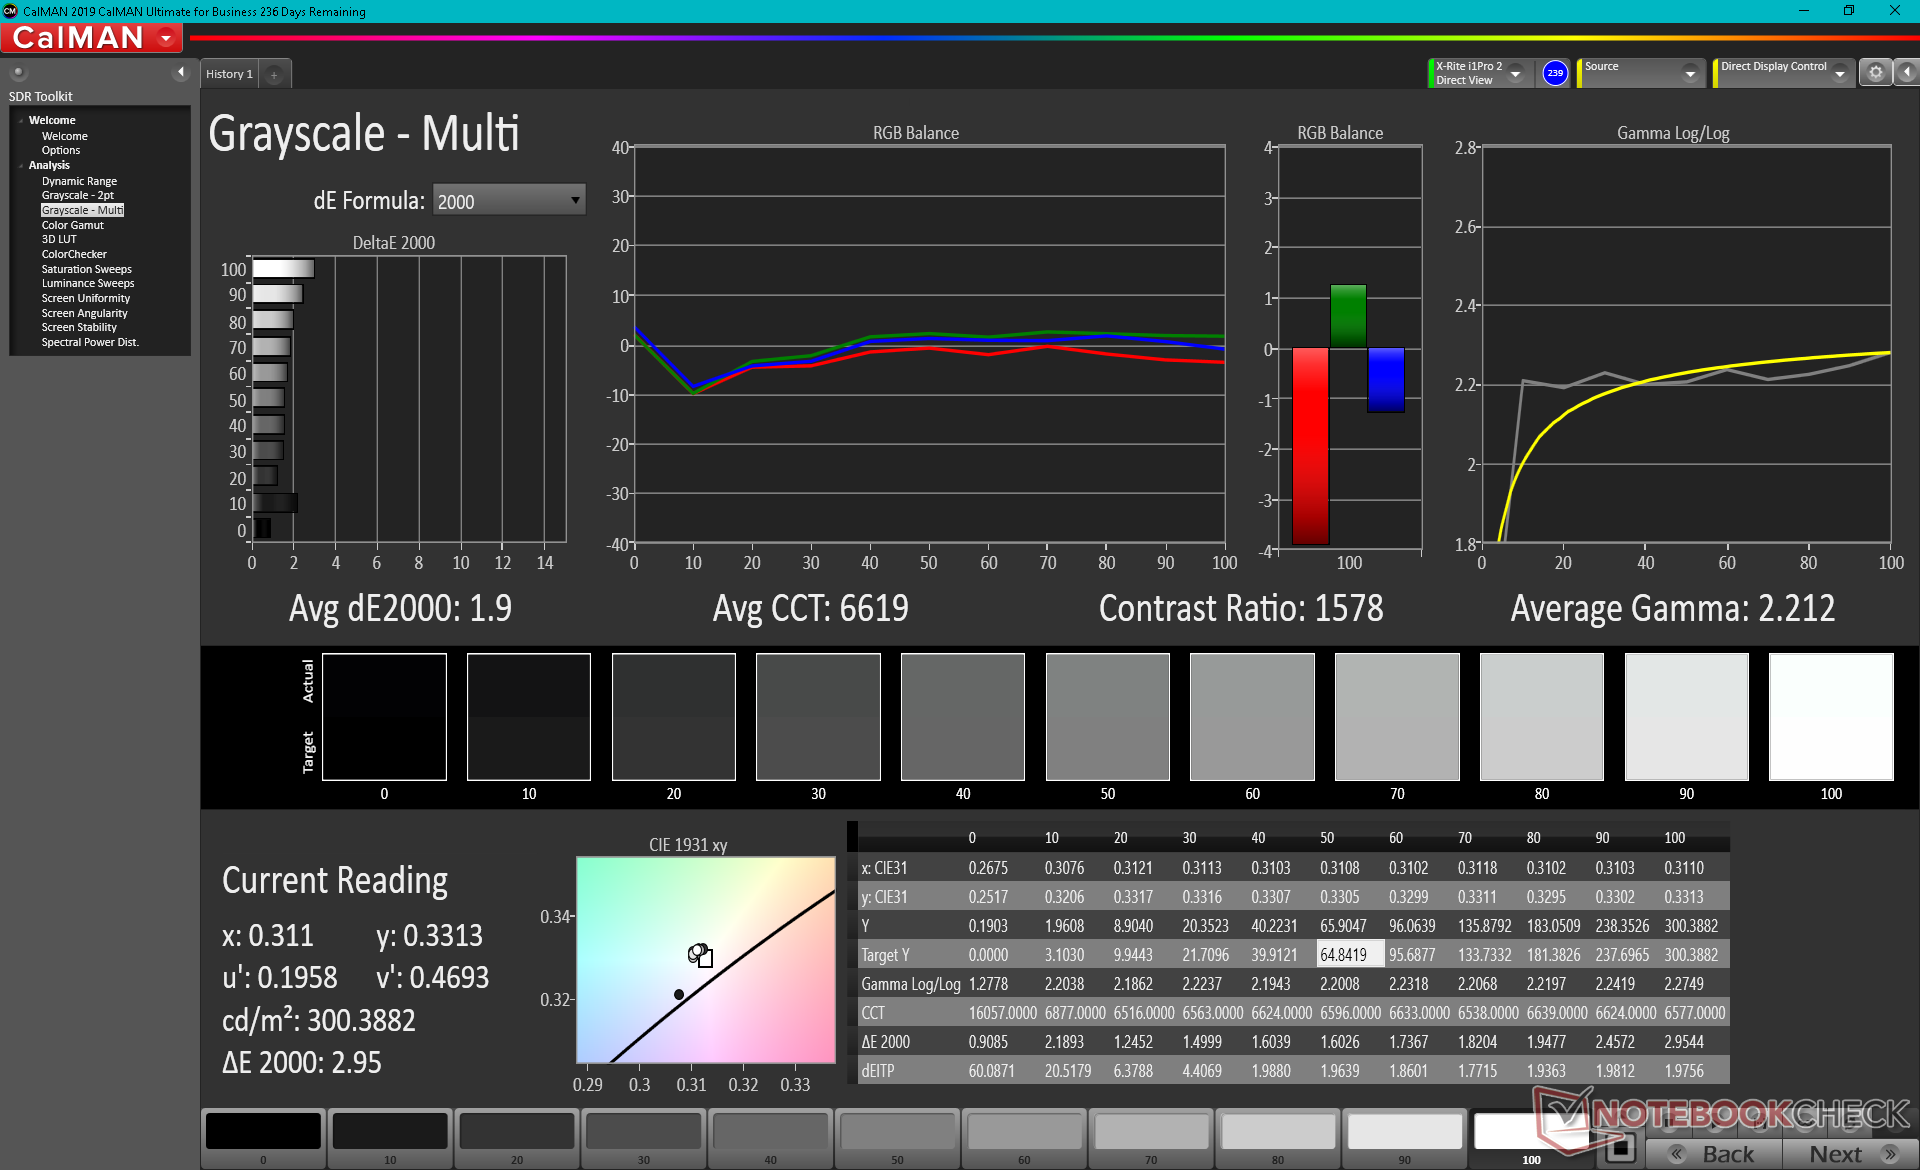
The VivoBook S13 S333 uses the same Chi Mei N133HCE-EN2 IPS panel as found on the Lenovo ThinkBook 13s and Fujitsu LifeBook U7310. Contrast is high at over 1000:1 while brightness is about 100 nits dimmer than on the higher-end ZenBook 13. Interestingly, both the VivoBook S330 and S333 exhibit the same 26040 Hz pulse-width modulation frequency at 29 percent brightness to suggest that Asus is using the same backlight on both models.

| |||||||||||||||||||||||||
Brightness Distribution: 87 %
Center on Battery: 313.4 cd/m²
Contrast: 1649:1 (Black: 0.19 cd/m²)
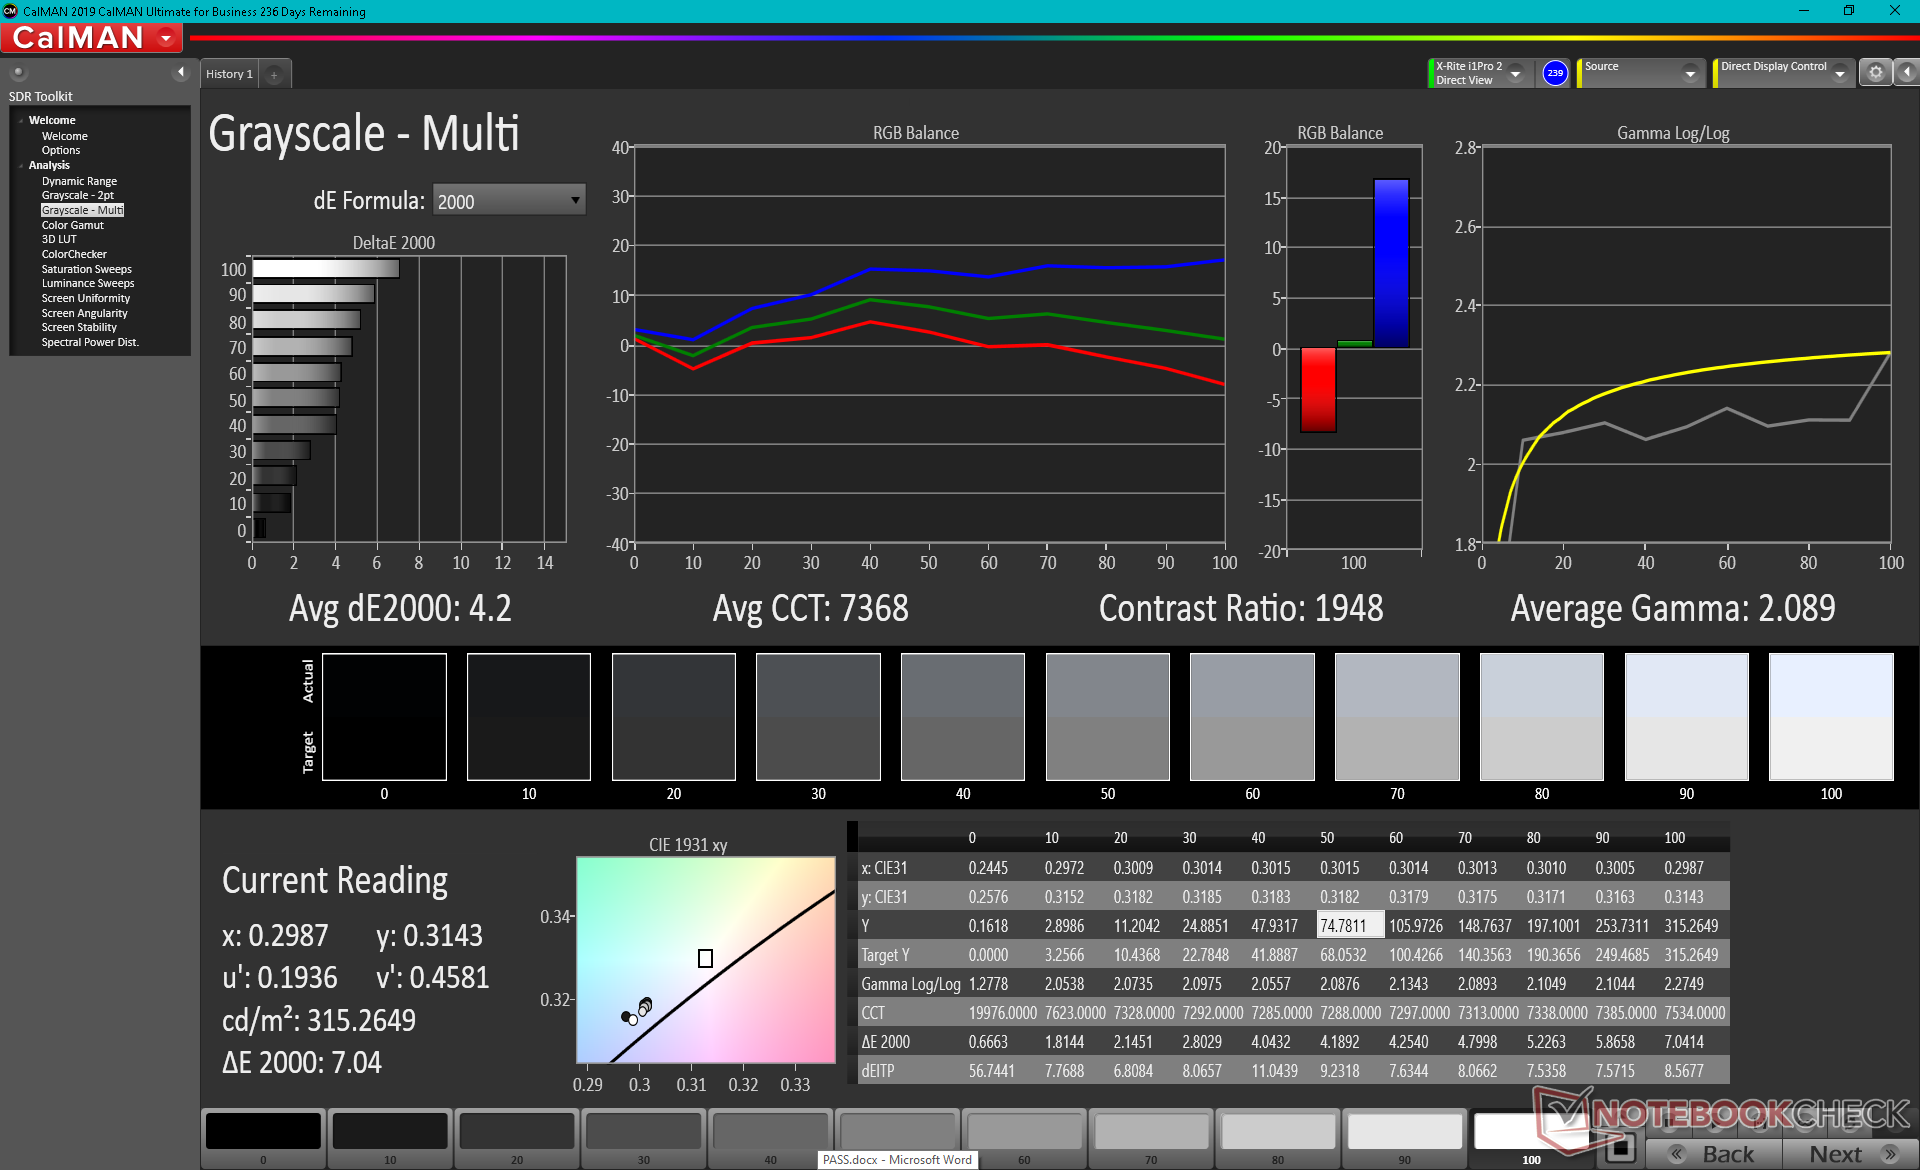
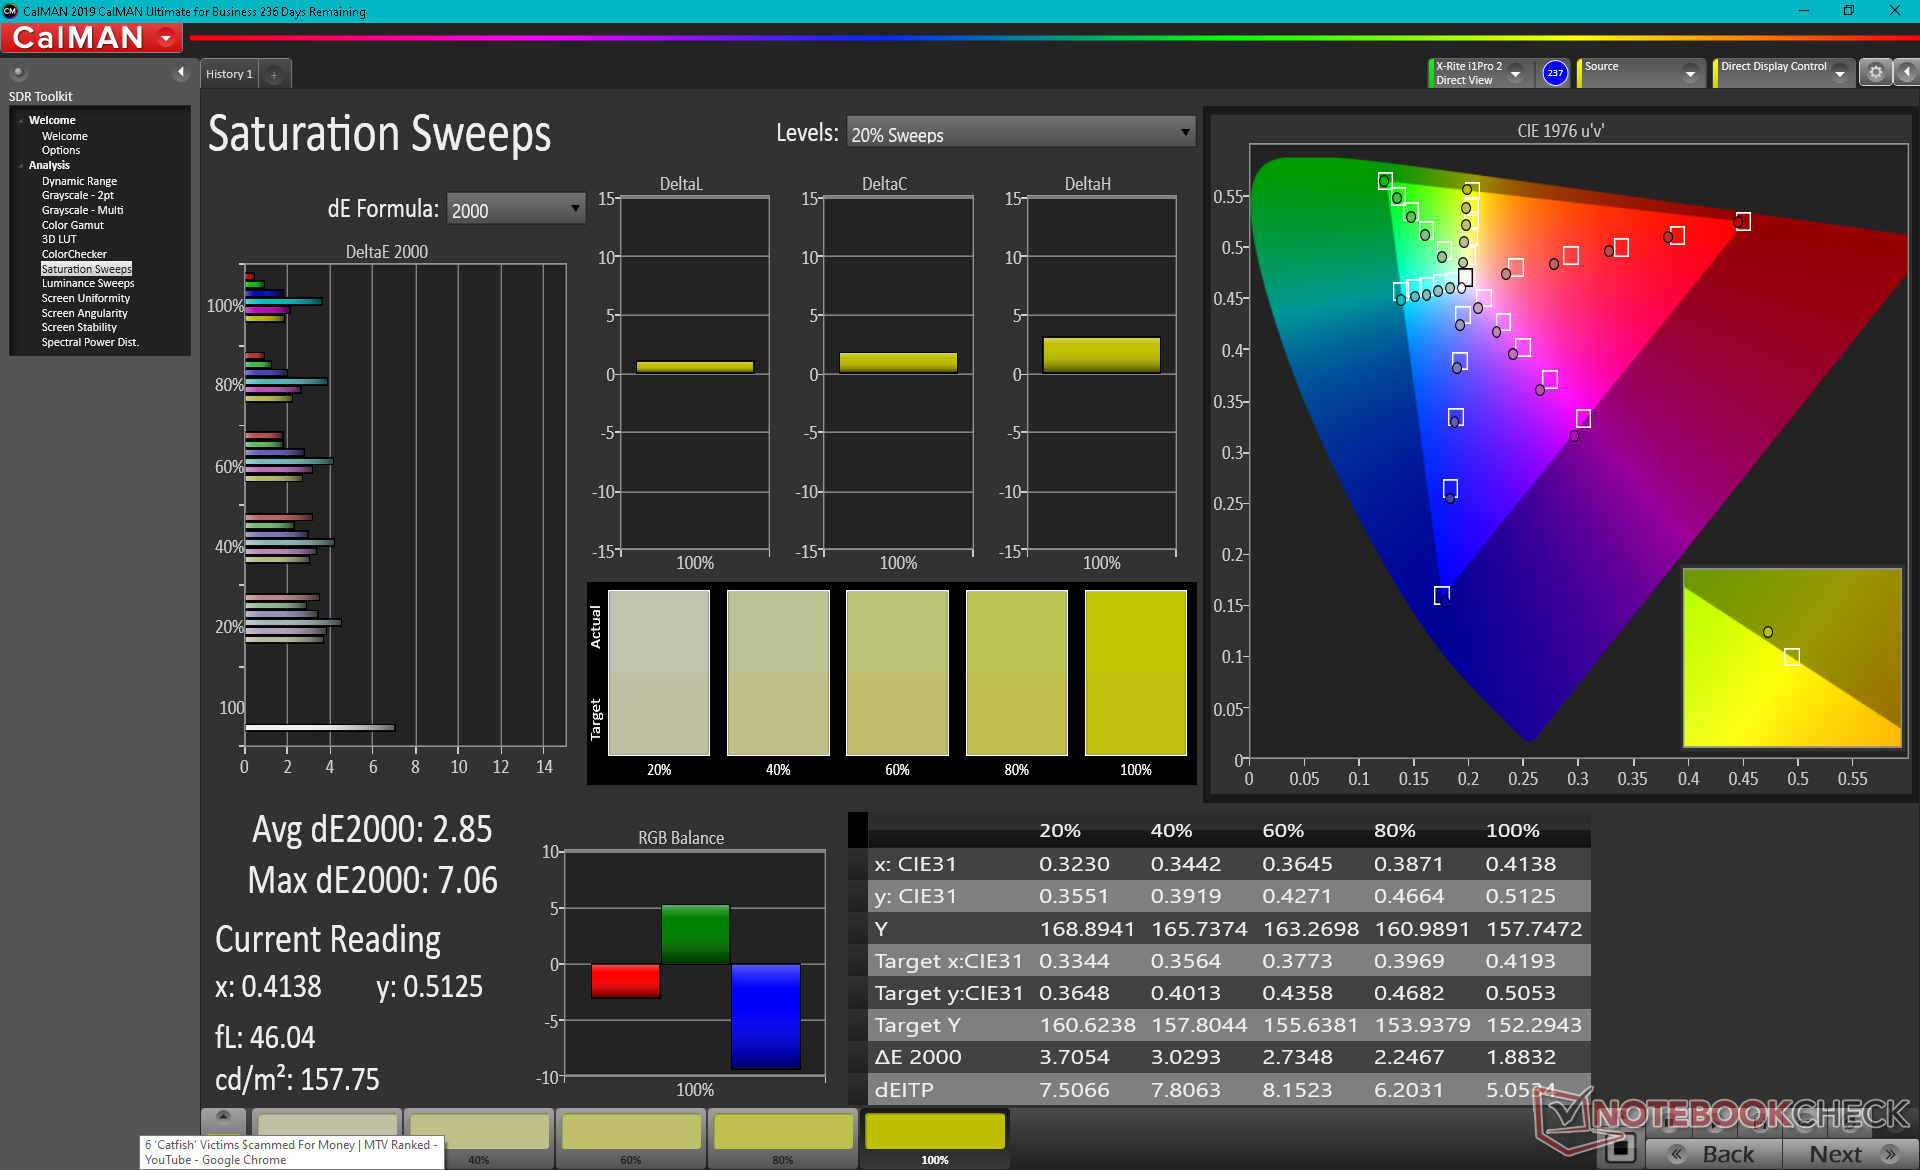
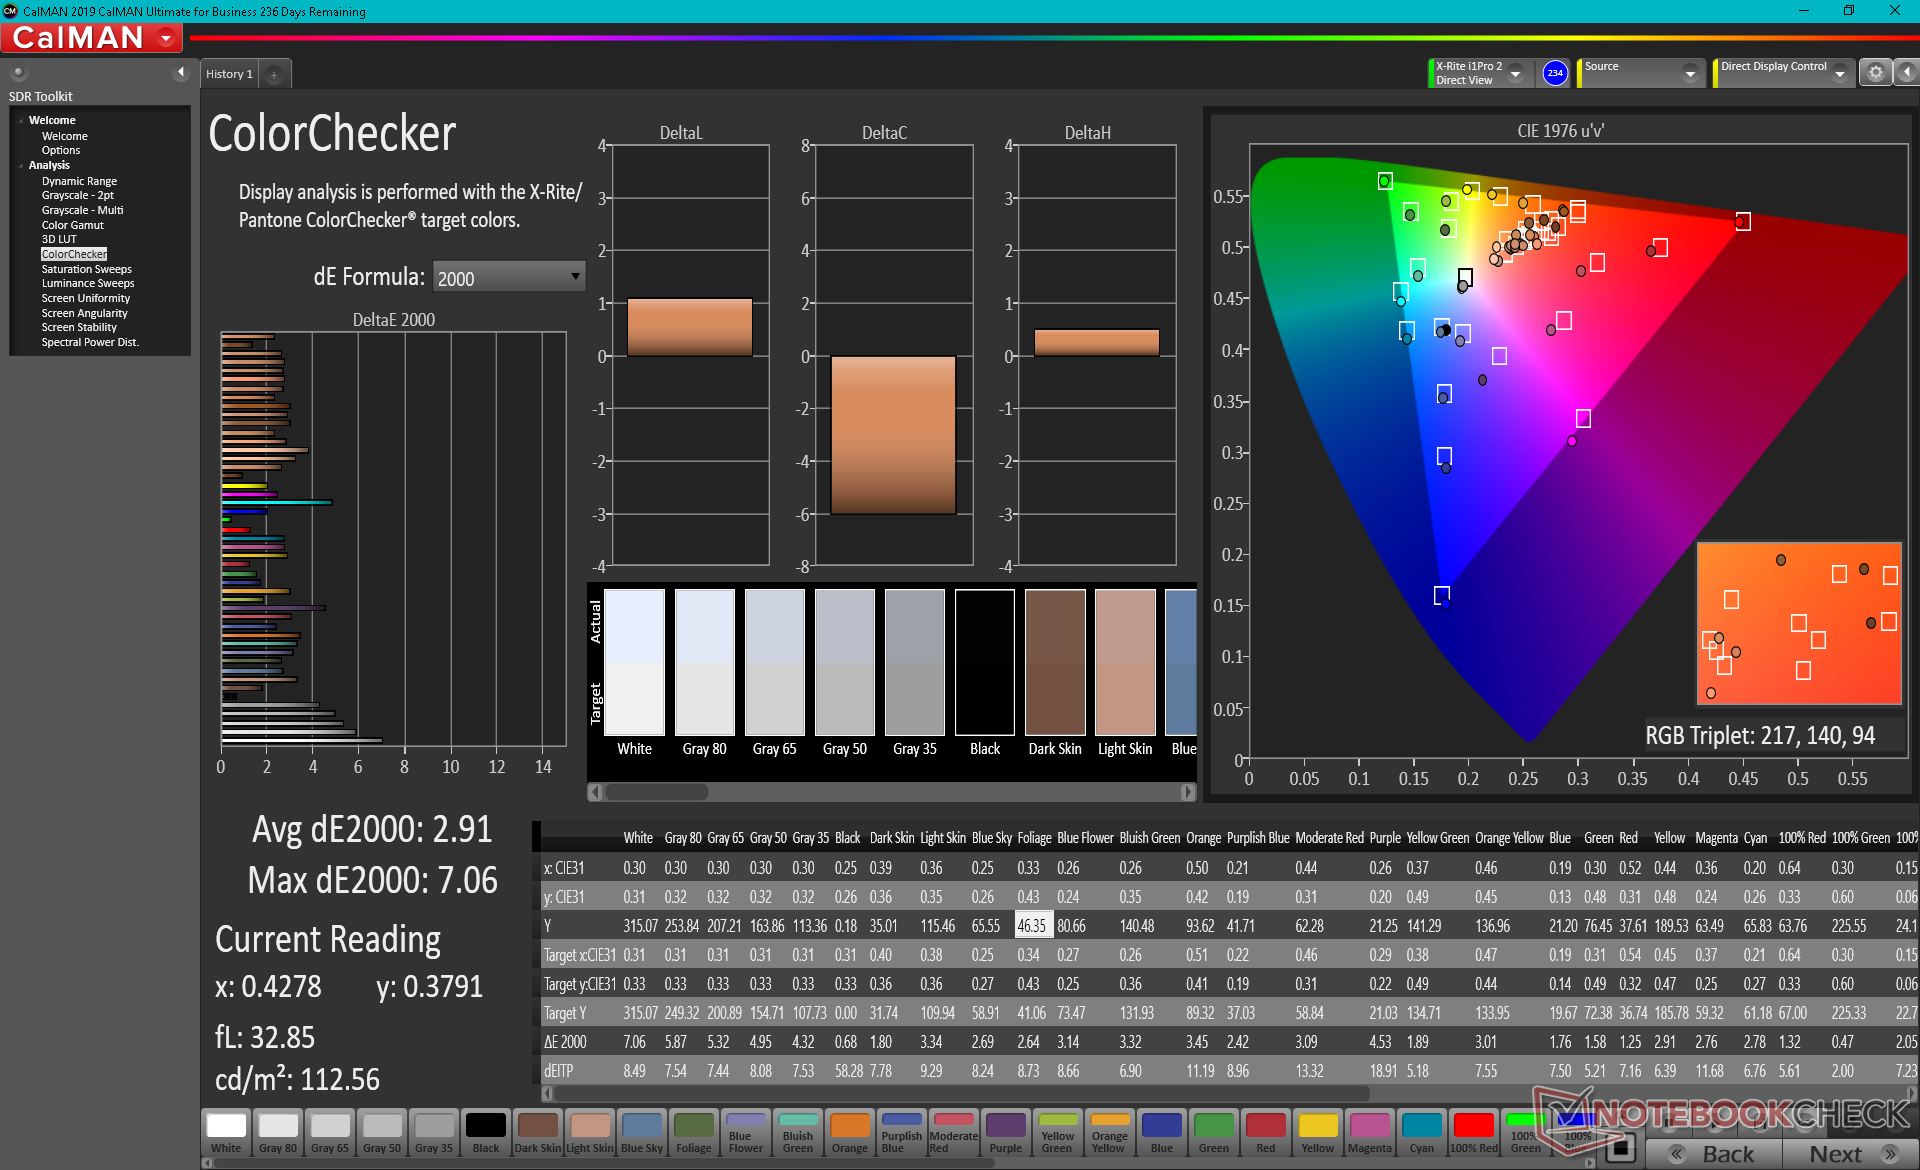
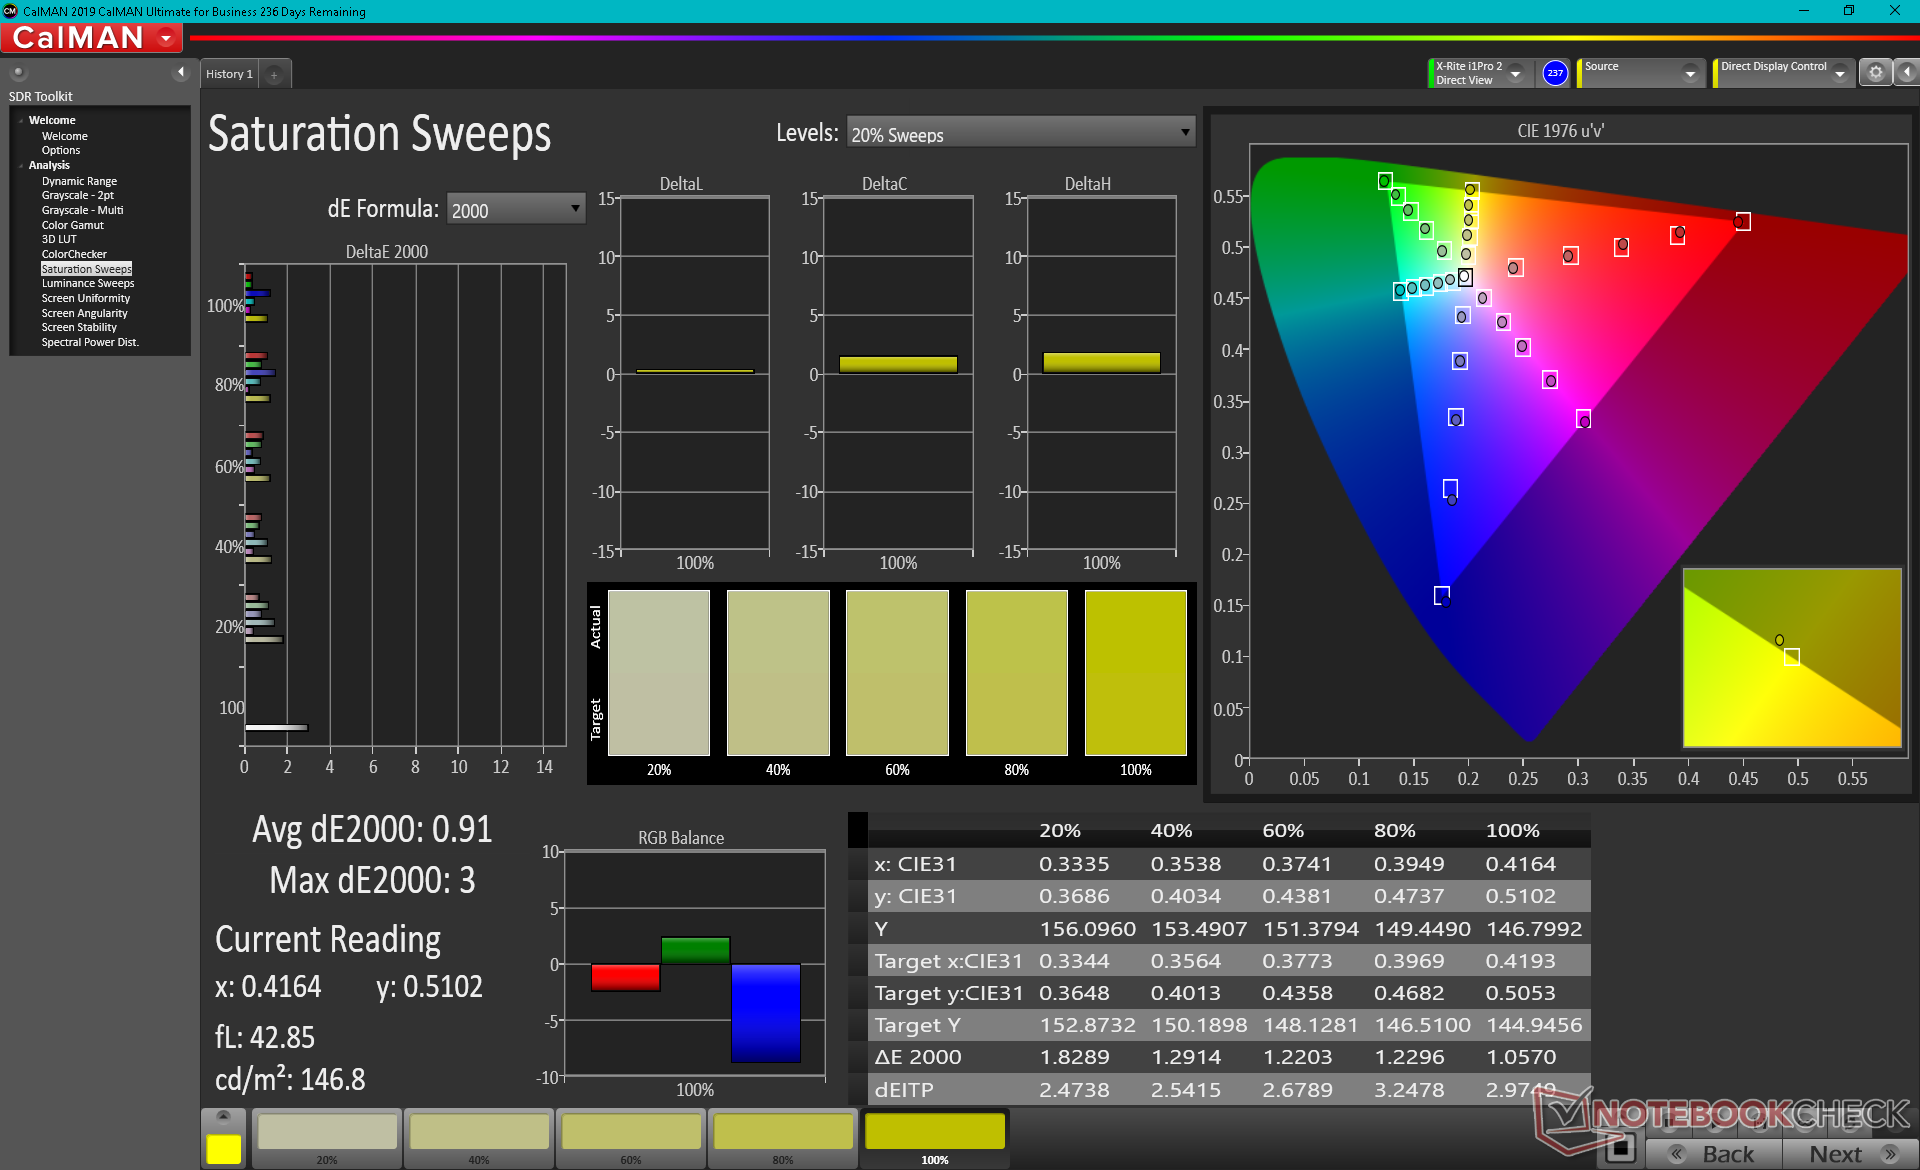
ΔE ColorChecker Calman: 2.91 | ∀{0.5-29.43 Ø4.73}
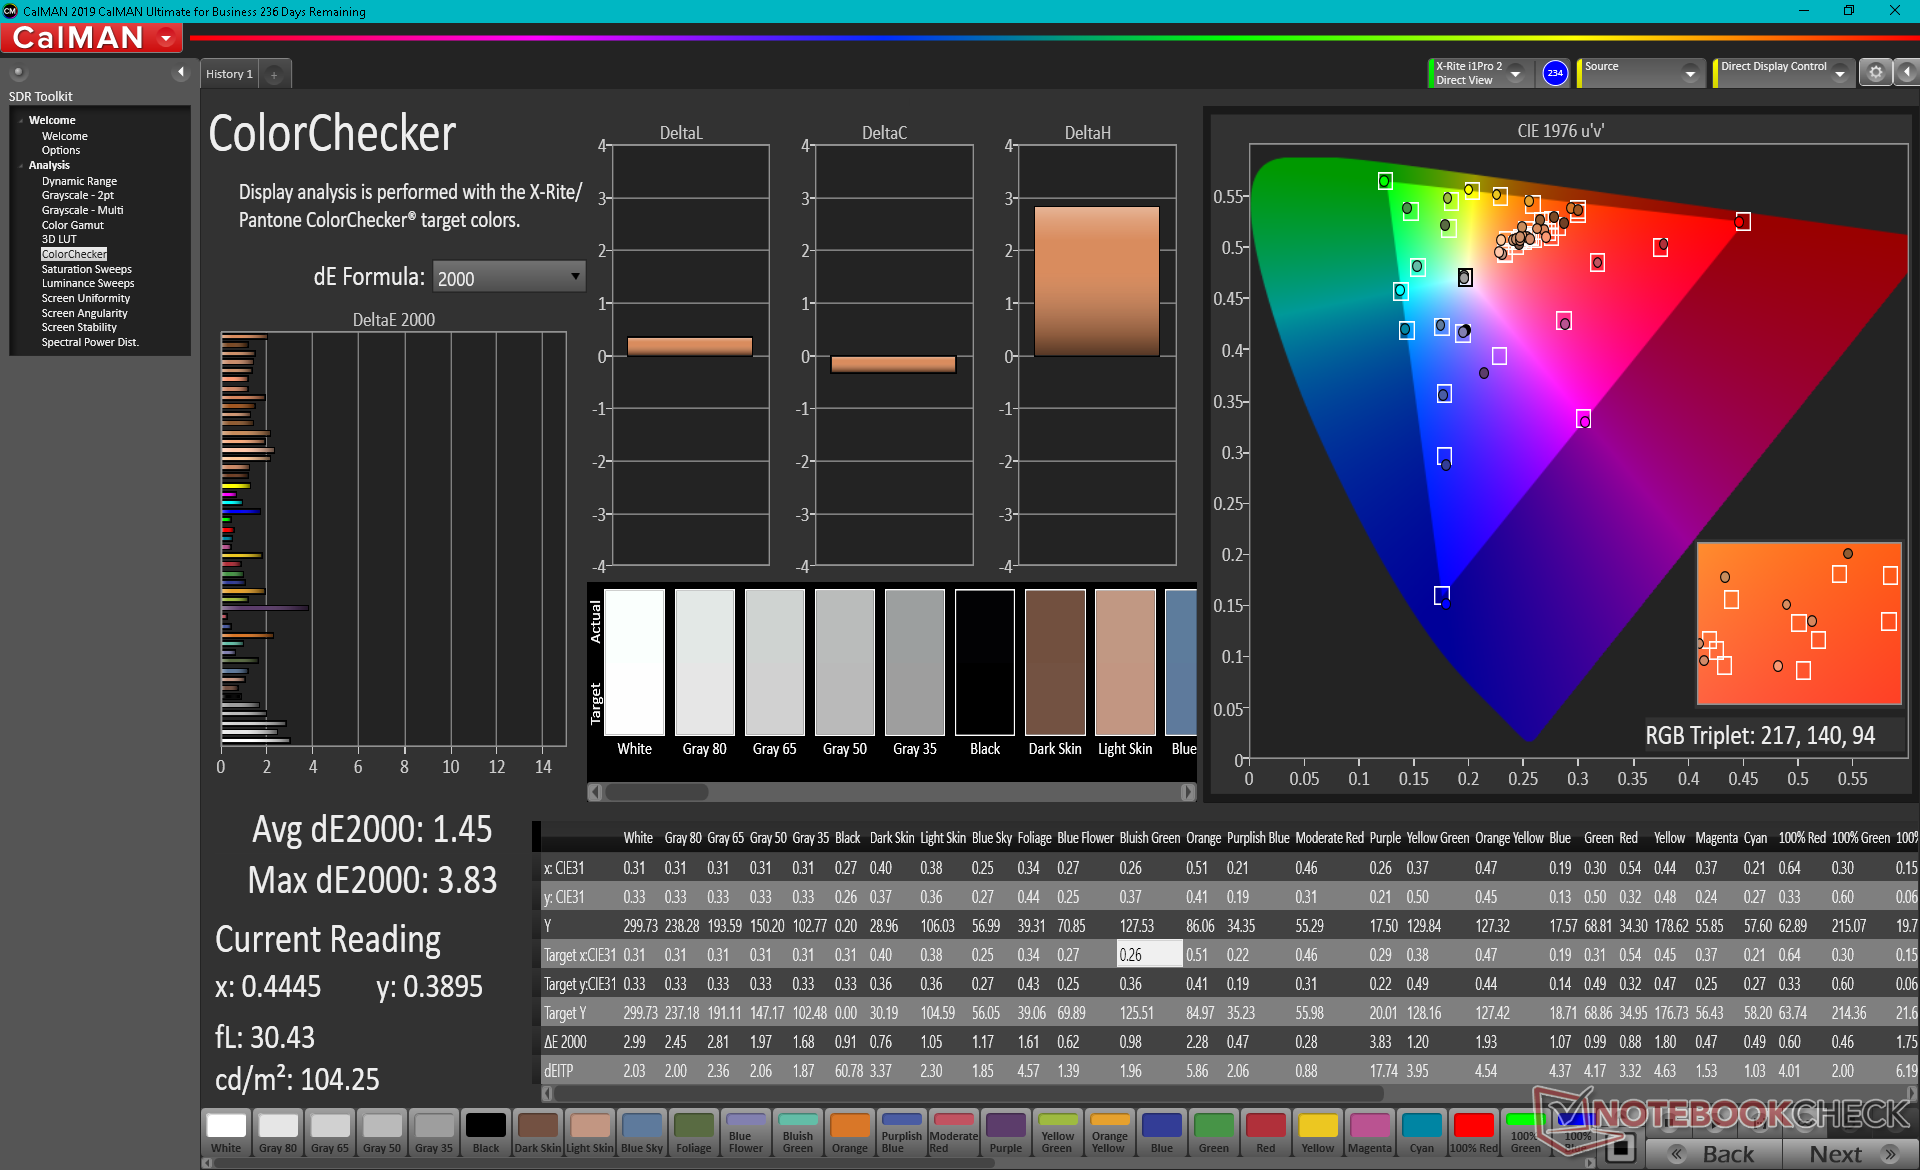
calibrated: 1.45
ΔE Greyscale Calman: 4.2 | ∀{0.09-98 Ø4.97}
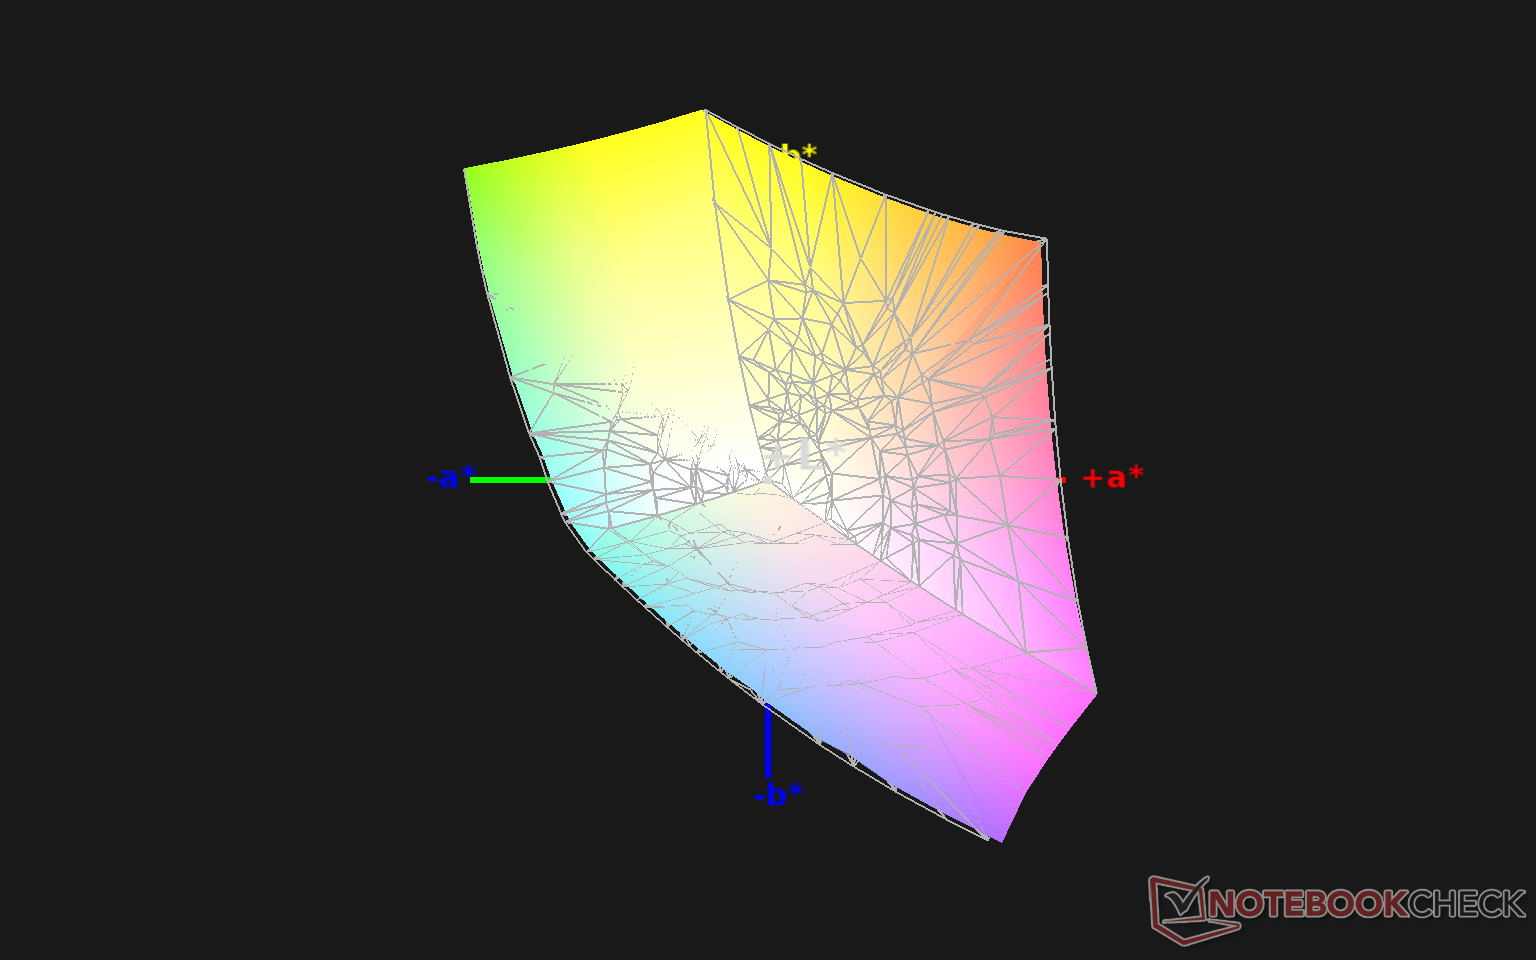
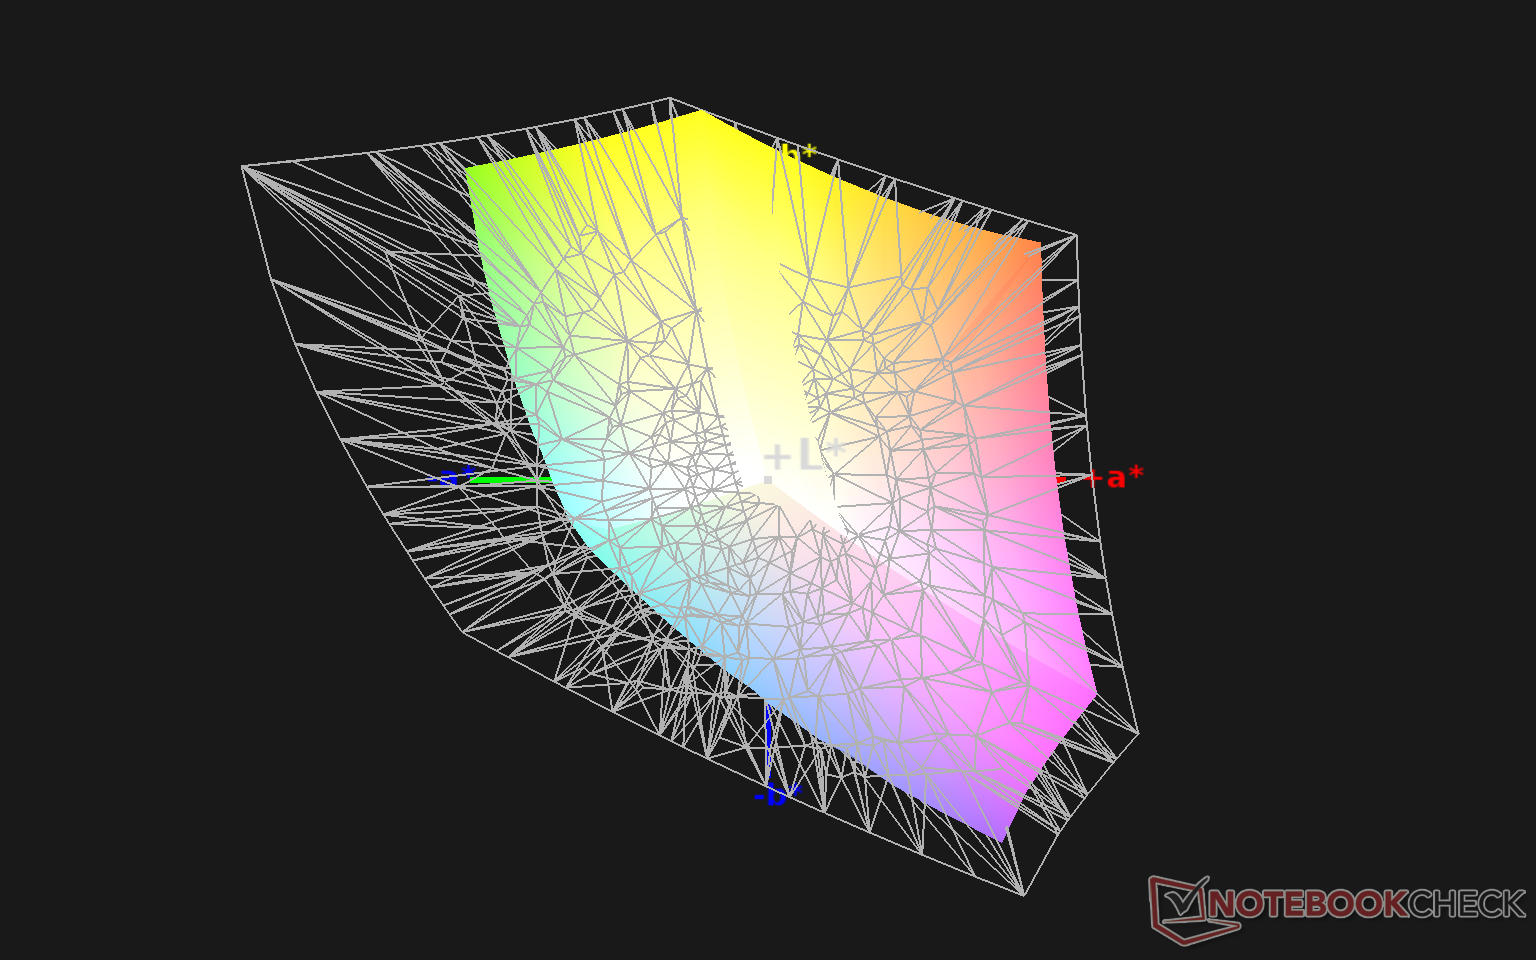
97.8% sRGB (Argyll 1.6.3 3D)
61.9% AdobeRGB 1998 (Argyll 1.6.3 3D)
67.3% AdobeRGB 1998 (Argyll 3D)
97.6% sRGB (Argyll 3D)
65.5% Display P3 (Argyll 3D)
Gamma: 2.09
CCT: 7368 K
| Asus VivoBook S13 S333JA-DS51 Chi Mei N133HCE-EN2, IPS, 13.3", 1920x1080 | Asus VivoBook S13 S330UA-EY034T N133HCE-EAA, IPS LED, 13.3", 1920x1080 | Lenovo IdeaPad S540-13ARE-82DL000YGE Chi Mei CMN13B0 (N133GCA-GQ1), IPS, 13.3", 2560x1600 | Dell XPS 13 9310 Core i7 FHD Sharp LQ134N1, IPS, 13.4", 1920x1200 | HP Pavilion 13-bb0015cl AUOCA8D, IPS, 13.3", 3840x2160 | Asus ZenBook 13 UX325JA Sharp LQ133M1JW40, IPS, 13.3", 1920x1080 | |
|---|---|---|---|---|---|---|
| Display | -35% | -2% | 6% | -2% | -3% | |
| Display P3 Coverage (%) | 65.5 | 42.16 -36% | 64.2 -2% | 70.9 8% | 65 -1% | 63.8 -3% |
| sRGB Coverage (%) | 97.6 | 63.2 -35% | 95.7 -2% | 99.1 2% | 93.4 -4% | 94.5 -3% |
| AdobeRGB 1998 Coverage (%) | 67.3 | 43.59 -35% | 66 -2% | 72.9 8% | 66.5 -1% | 64.9 -4% |
| Response Times | -16% | 8% | -39% | -56% | -8% | |
| Response Time Grey 50% / Grey 80% * (ms) | 35.6 ? | 40.8 ? -15% | 33 ? 7% | 52 ? -46% | 52.4 ? -47% | 47 ? -32% |
| Response Time Black / White * (ms) | 25.2 ? | 29.6 ? -17% | 23 ? 9% | 33.2 ? -32% | 41.6 ? -65% | 21 ? 17% |
| PWM Frequency (Hz) | 26040 ? | 26040 ? | 2475 ? | 250 ? | ||
| Screen | -57% | -10% | 3% | -9% | -10% | |
| Brightness middle (cd/m²) | 313.4 | 280 -11% | 321 2% | 543.3 73% | 514.1 64% | 435 39% |
| Brightness (cd/m²) | 298 | 265 -11% | 304 2% | 524 76% | 501 68% | 404 36% |
| Brightness Distribution (%) | 87 | 89 2% | 88 1% | 92 6% | 91 5% | 83 -5% |
| Black Level * (cd/m²) | 0.19 | 0.24 -26% | 0.32 -68% | 0.38 -100% | 0.37 -95% | 0.565 -197% |
| Contrast (:1) | 1649 | 1167 -29% | 1003 -39% | 1430 -13% | 1389 -16% | 770 -53% |
| Colorchecker dE 2000 * | 2.91 | 5.6 -92% | 3.41 -17% | 3.02 -4% | 4.35 -49% | 2.66 9% |
| Colorchecker dE 2000 max. * | 7.06 | 20.7 -193% | 7.61 -8% | 6.5 8% | 4.73 33% | |
| Colorchecker dE 2000 calibrated * | 1.45 | 4.3 -197% | 0.66 54% | 1.23 15% | 2.26 -56% | 1.19 18% |
| Greyscale dE 2000 * | 4.2 | 4.1 2% | 5.54 -32% | 5 -19% | 5.2 -24% | 3.65 13% |
| Gamma | 2.09 105% | 2.44 90% | 2.33 94% | 2.02 109% | 2.12 104% | 2.34 94% |
| CCT | 7368 88% | 6614 98% | 6476 100% | 6550 99% | 6308 103% | 7109 91% |
| Color Space (Percent of AdobeRGB 1998) (%) | 61.9 | 40.1 -35% | 61 -1% | 66.8 8% | 60.6 -2% | 60 -3% |
| Color Space (Percent of sRGB) (%) | 97.8 | 63 -36% | 96 -2% | 99.6 2% | 93.3 -5% | 95 -3% |
| Total Average (Program / Settings) | -36% /
-48% | -1% /
-6% | -10% /
-2% | -22% /
-14% | -7% /
-9% |
* ... smaller is better
Color space covers almost all of sRGB to be wider than expected for such an inexpensive laptop. Image quality is significant improved over the older VivoBook S13 S330 which covers just 63 percent of sRGB. Colors are noticeably more vibrant and closer to what a pricier ZenBook can offer.
The display is poorly calibrated out of the box which is a shame because its colors and contrast are otherwise impressive as noted above. Color temperature in particular is too cool and RGB balance is off. After calibrating the panel ourselves, the average grayscale and color deltaE values would improve noticeably from 4.2 and 2.91 to 1.9 and 1.45, respectively. We recommend applying our ICC profile above to get the most out of the display if owners don't have access to a colorimeter.
Display Response Times
| ↔ Response Time Black to White | ||
|---|---|---|
| 25.2 ms ... rise ↗ and fall ↘ combined | ↗ 16 ms rise | 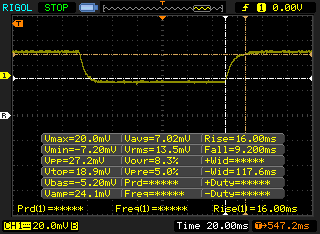 |
| ↘ 9.2 ms fall | ||
| The screen shows relatively slow response rates in our tests and may be too slow for gamers. In comparison, all tested devices range from 0.1 (minimum) to 240 (maximum) ms. » 60 % of all devices are better. This means that the measured response time is worse than the average of all tested devices (19.9 ms). | ||
| ↔ Response Time 50% Grey to 80% Grey | ||
| 35.6 ms ... rise ↗ and fall ↘ combined | ↗ 18 ms rise | 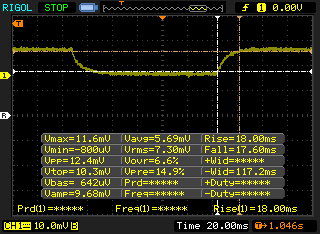 |
| ↘ 17.6 ms fall | ||
| The screen shows slow response rates in our tests and will be unsatisfactory for gamers. In comparison, all tested devices range from 0.165 (minimum) to 636 (maximum) ms. » 50 % of all devices are better. This means that the measured response time is worse than the average of all tested devices (31.1 ms). | ||
Screen Flickering / PWM (Pulse-Width Modulation)
| Screen flickering / PWM detected | 26040 Hz | ≤ 29 % brightness setting | 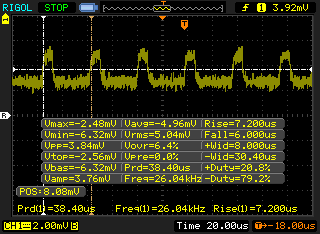 |
The display backlight flickers at 26040 Hz (worst case, e.g., utilizing PWM) Flickering detected at a brightness setting of 29 % and below. There should be no flickering or PWM above this brightness setting. The frequency of 26040 Hz is quite high, so most users sensitive to PWM should not notice any flickering. In comparison: 52 % of all tested devices do not use PWM to dim the display. If PWM was detected, an average of 7801 (minimum: 5 - maximum: 343500) Hz was measured. | |||
Outdoor visibility is passable if under shade as any brighter will wash out the screen. Users may want to consider higher-end XPS, ZenBook, or Huawei MateBook X Pro models if outdoor visibility is a concern.
Performance
Only Intel 10th gen Ice Lake or Comet Lake and 11th gen Tiger Lake Core U-series CPUs are available. Discrete GeForce MX250, MX330, or MX350 graphics are also available if configured with a Comet Lake CPU. AMD Ryzen is not an option at least at the time of writing.
We recommend SKUs with 16 GB of RAM because RAM is not upgradeable.
Processor
CPU performance is good for a Core i5 CPU. Though Turbo Boost performance is limited, clock rates are at least relatively steady over time as demonstrated by our CineBench R15 xT loop scores below. Overall performance is most similar to the older Kaby Lake-R Core i7-8550U. It's too bad that there are no AMD Ryzen options at the moment as the similarly priced Ryzen 5 4500U would have been more powerful than our Core i5-1035G1 at the same TDP.
Upgrading to the more recent Core i5-1135G7 or i7-1165G7 SKU will see relatively minimal CPU performance benefits over the i5-1035G1. GPU gains, however, would be significant because of Iris Xe.
Cinebench R15: CPU Multi 64Bit | CPU Single 64Bit
Blender: v2.79 BMW27 CPU
7-Zip 18.03: 7z b 4 -mmt1 | 7z b 4
Geekbench 5.5: Single-Core | Multi-Core
HWBOT x265 Benchmark v2.2: 4k Preset
LibreOffice : 20 Documents To PDF
R Benchmark 2.5: Overall mean
Cinebench R15: CPU Multi 64Bit | CPU Single 64Bit
Blender: v2.79 BMW27 CPU
7-Zip 18.03: 7z b 4 -mmt1 | 7z b 4
Geekbench 5.5: Single-Core | Multi-Core
HWBOT x265 Benchmark v2.2: 4k Preset
LibreOffice : 20 Documents To PDF
R Benchmark 2.5: Overall mean
* ... smaller is better
System Performance
PCMark 10 results are slightly better than what we recorded on the VivoBook S13 S330 save for the Productivity benchmark where our S333 underperforms. The latest 11th gen Core i7 and 3rd gen Ryzen 5 or 7 laptops handily outscore our budget Asus.
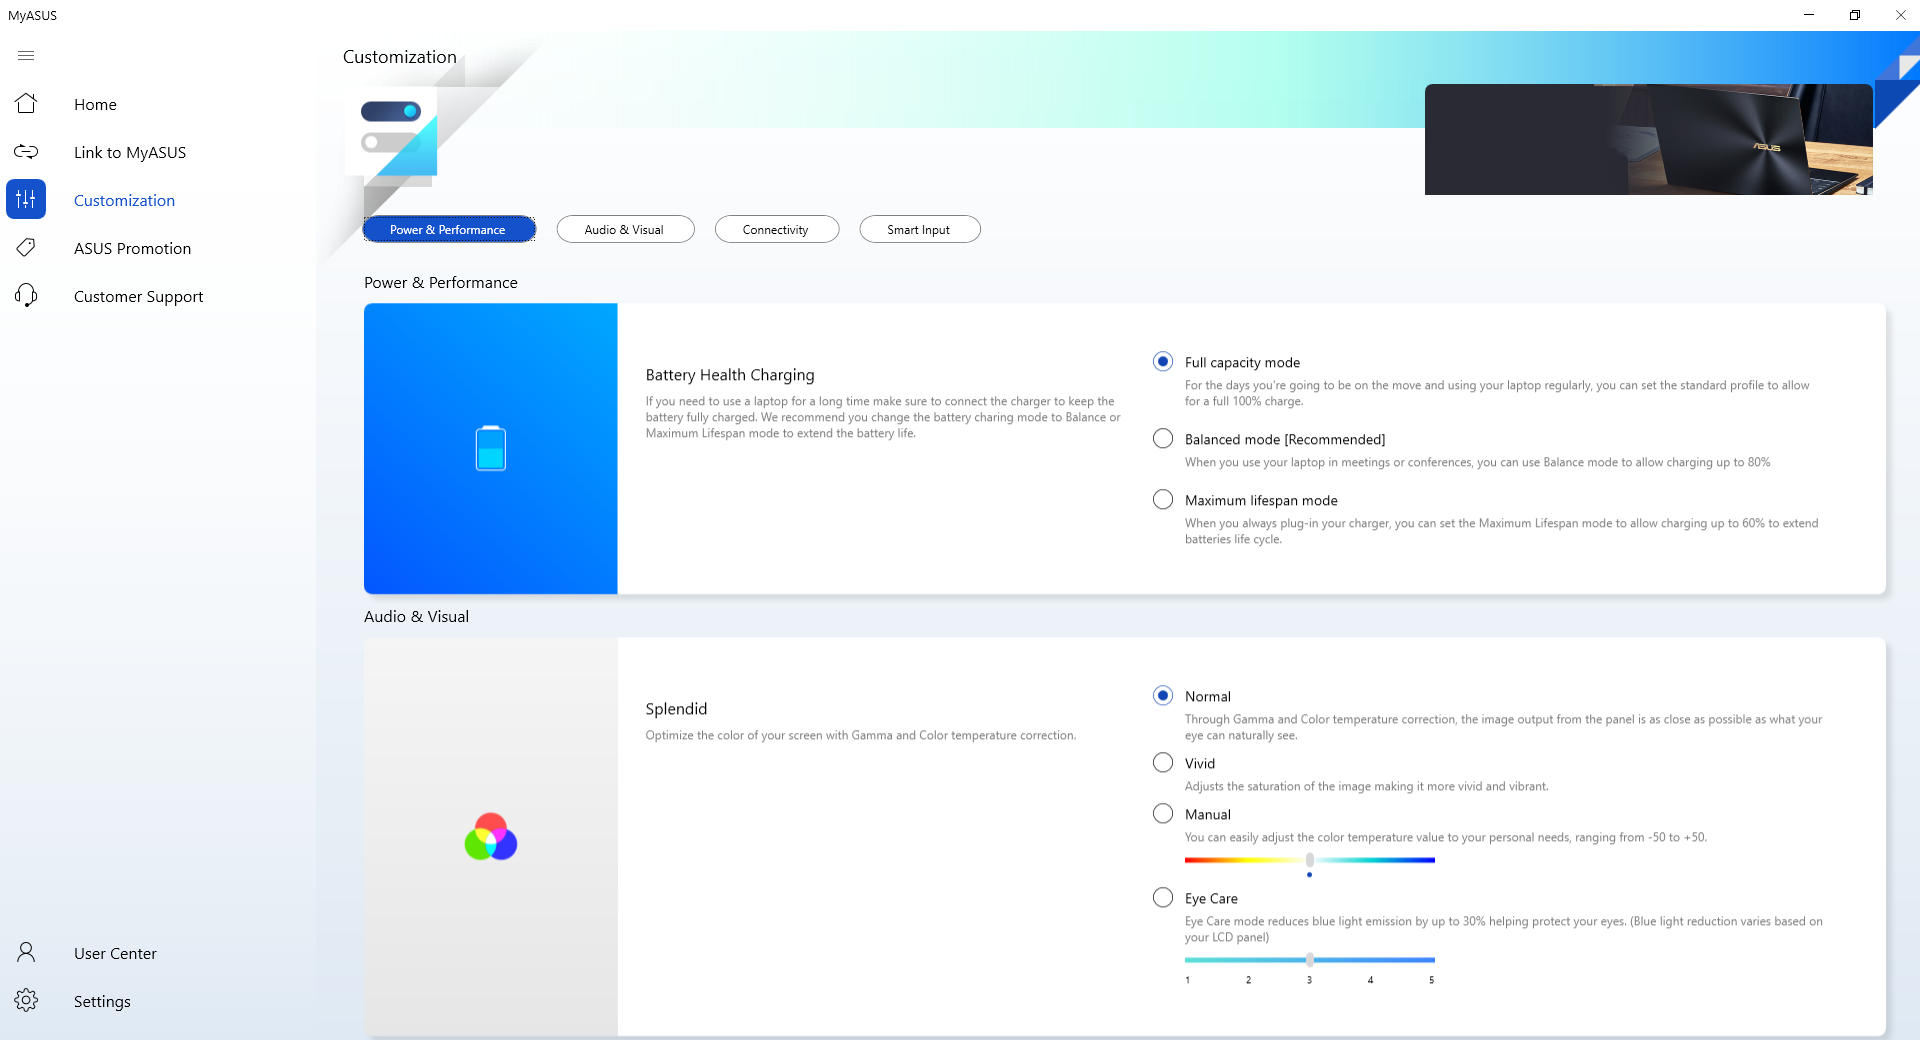
We experienced no software or hardware issues with our test unit. However, users should be aware of the pre-installed McAfee and MyAsus applications. MyAsus is especially important as key system settings are toggled here.
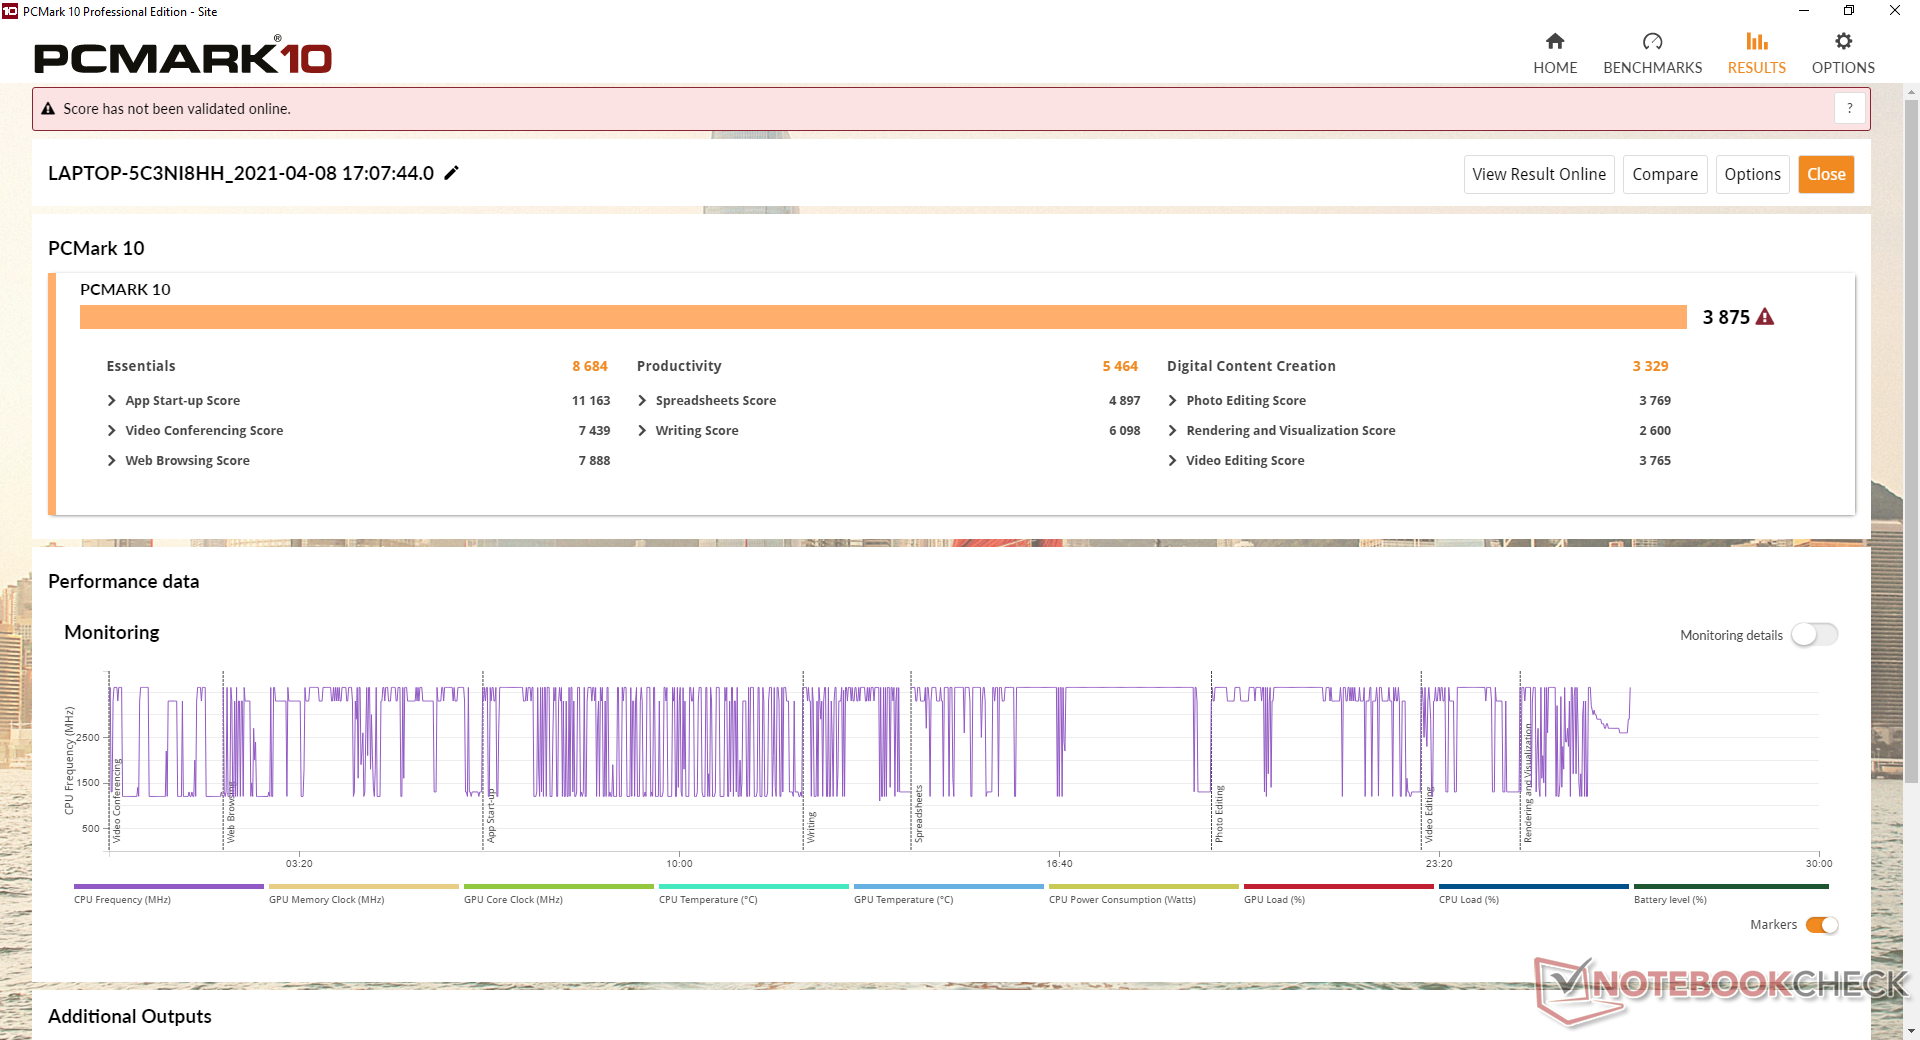
| PCMark 10 Score | 3875 points | |
Help | ||
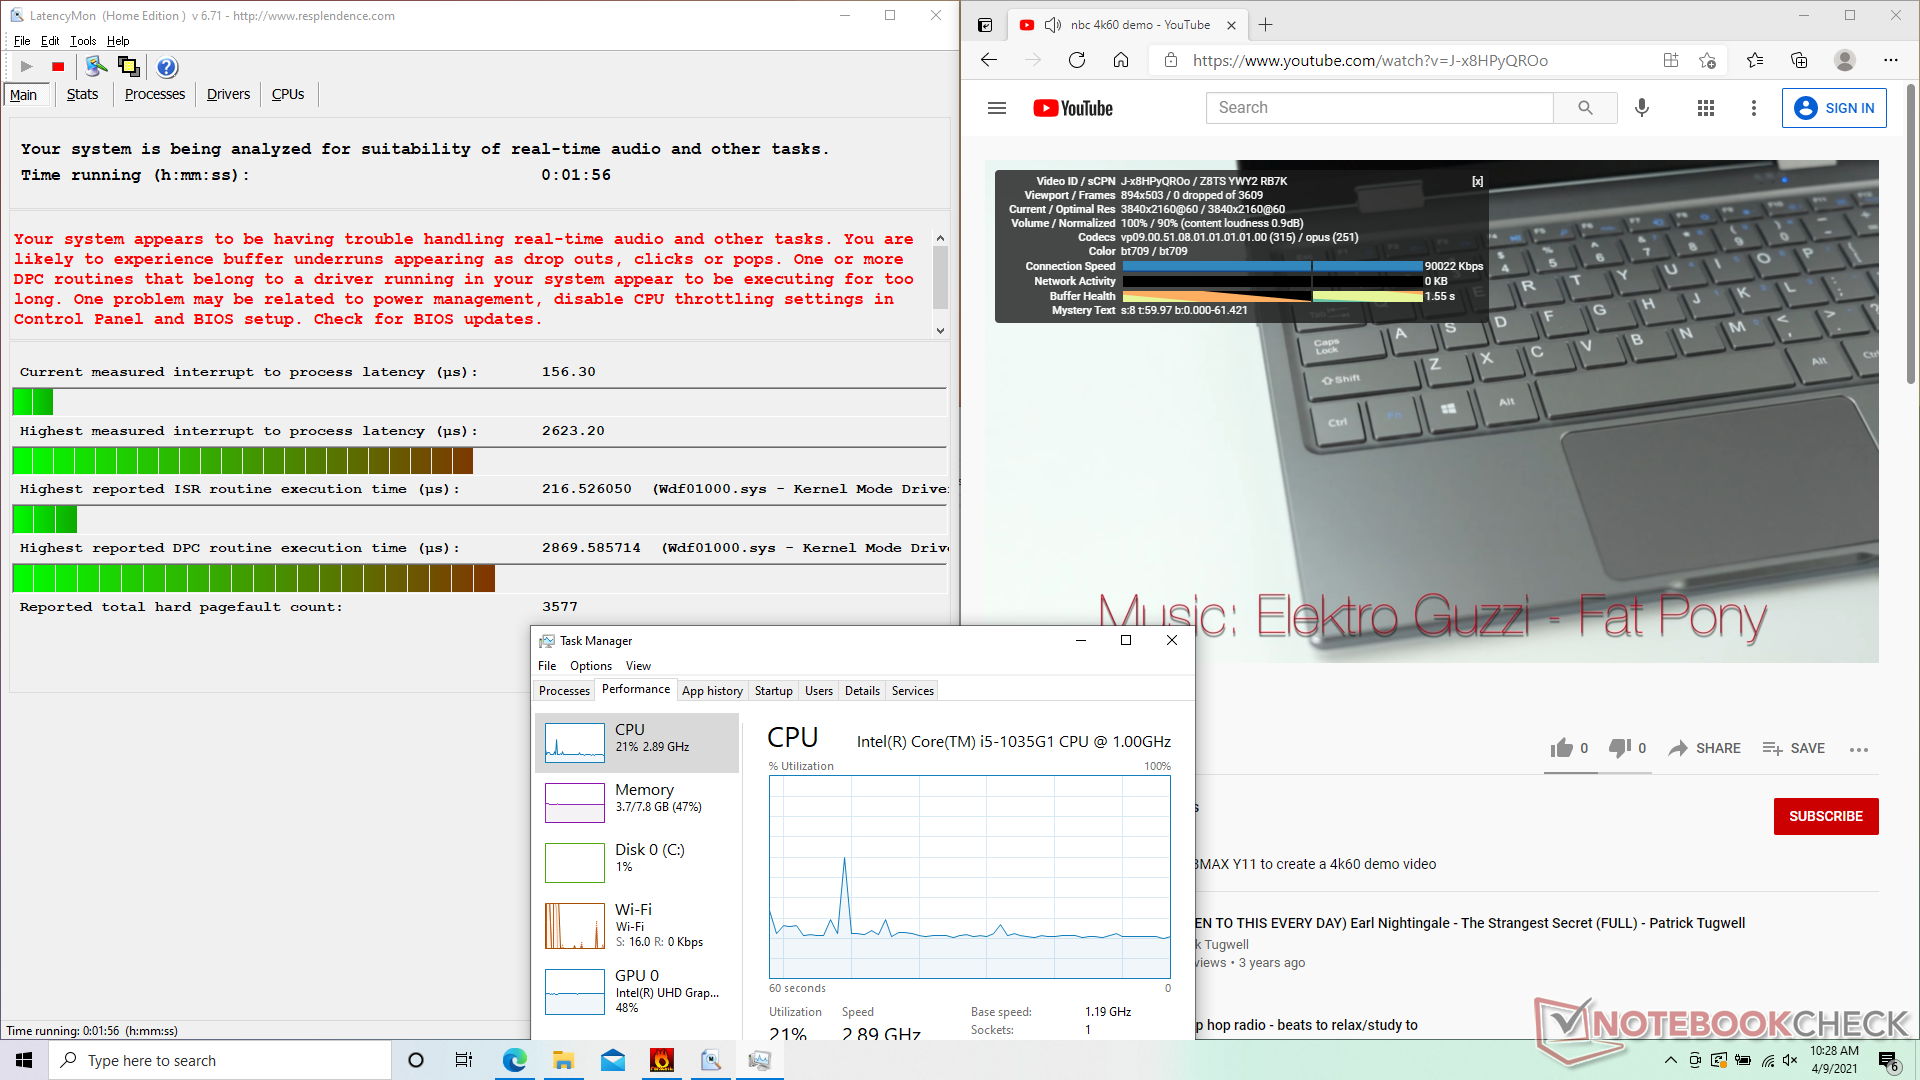
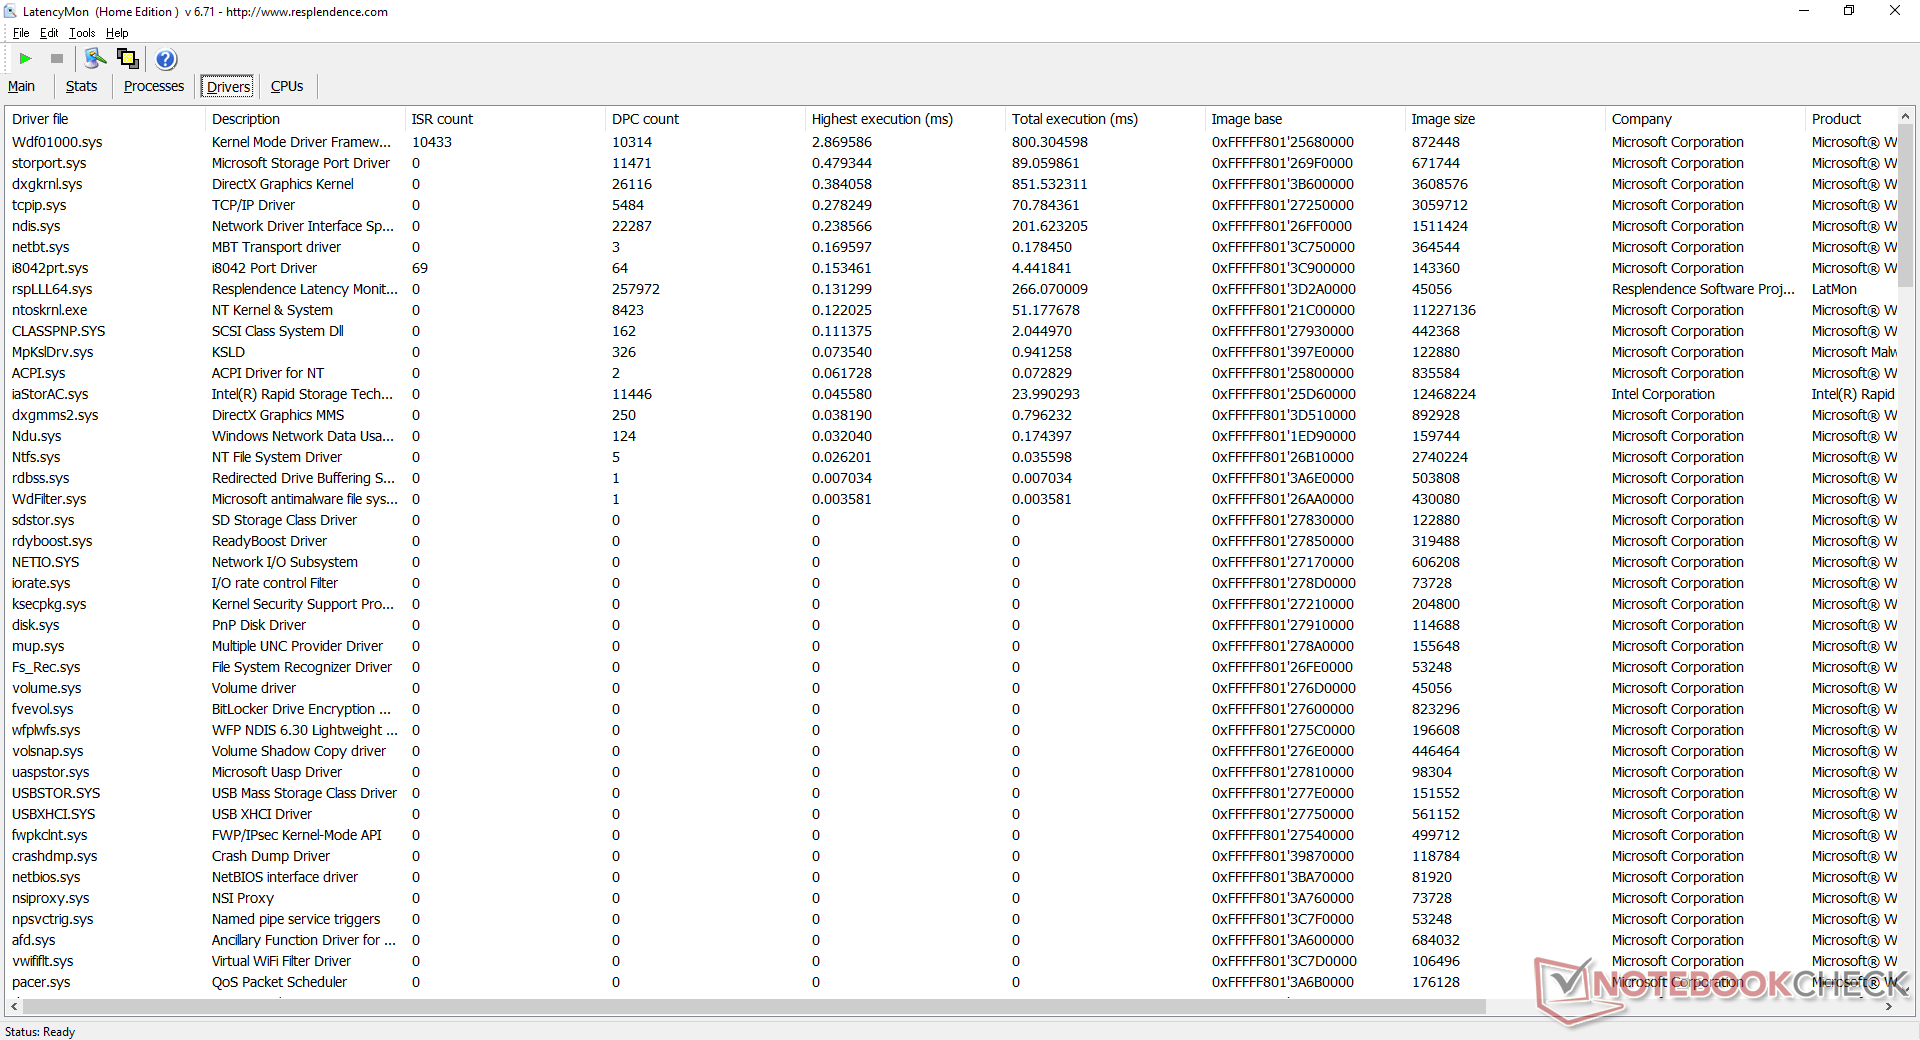
DPC Latency
LatencyMon reveals DPC latency issues when opening multiple browser tabs on our homepage. 4K UHD video playback at 60 FPS is otherwise smooth and with no dropped frames during our test. CPU and GPU utilization are relatively high at 21 percent and 48 percent, respectively, compared to half that on the latest Core i7 Tiger Lake-U systems.
| DPC Latencies / LatencyMon - interrupt to process latency (max), Web, Youtube, Prime95 | |
| Asus VivoBook S13 S333JA-DS51 | |
| HP Pavilion 13-bb0015cl | |
| Asus ZenBook 13 UX325JA | |
| Lenovo IdeaPad S540-13ARE-82DL000YGE | |
| Dell XPS 13 9310 Core i7 FHD | |
* ... smaller is better
Storage Devices
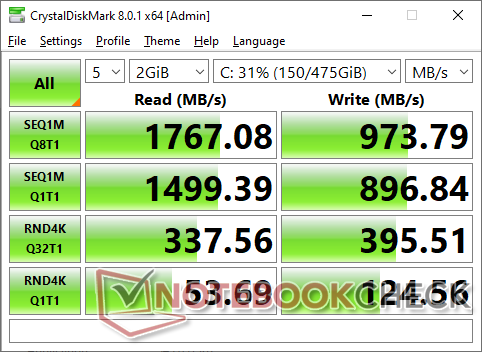
Our test unit comes with a 512 GB Intel 660p SSD which is a mid-range NVMe drive. Installing a higher-end SSD like the Samsung PM981 is possible, but the PCIe x2 interface of the budget VivoBook will bottleneck its performance. The cheaper Intel drive is therefore reasonable for keeping costs in check without significantly impacting the user experience.
See our table of SSDs and HDDs for more benchmark comparisons.
| Asus VivoBook S13 S333JA-DS51 Intel SSD 660p SSDPEKNW512G8 | Asus VivoBook S13 S330UA-EY034T Kingston RBU-SNS8180DS3512GJ | Lenovo IdeaPad S540-13ARE-82DL000YGE WDC PC SN730 SDBPNTY-256G | Dell XPS 13 9310 Core i7 FHD Micron 2300 512GB MTFDHBA512TDV | HP Pavilion 13-bb0015cl Samsung PM991 MZVLQ512HALU | Asus ZenBook 13 UX325JA Intel SSD 660p 1TB SSDPEKNW010T8 | |
|---|---|---|---|---|---|---|
| AS SSD | -46% | 32% | 49% | 38% | 15% | |
| Seq Read (MB/s) | 1482 | 485.5 -67% | 2193 48% | 2091 41% | 1632 10% | 1587 7% |
| Seq Write (MB/s) | 643 | 351 -45% | 1797 179% | 1396 117% | 896 39% | 938 46% |
| 4K Read (MB/s) | 50.2 | 30.94 -38% | 45.79 -9% | 49.29 -2% | 44.66 -11% | 51 2% |
| 4K Write (MB/s) | 122.9 | 61.6 -50% | 140.3 14% | 104.2 -15% | 128.4 4% | 141.9 15% |
| 4K-64 Read (MB/s) | 322.3 | 323.8 0% | 721 124% | 827 157% | 862 167% | 576 79% |
| 4K-64 Write (MB/s) | 815 | 439.9 -46% | 651 -20% | 1636 101% | 778 -5% | 584 -28% |
| Access Time Read * (ms) | 0.067 | 0.108 -61% | 0.086 -28% | 0.066 1% | 0.064 4% | 0.083 -24% |
| Access Time Write * (ms) | 0.138 | 0.174 -26% | 0.027 80% | 0.365 -164% | 0.081 41% | 0.04 71% |
| Score Read (Points) | 521 | 403 -23% | 986 89% | 1086 108% | 1070 105% | 785 51% |
| Score Write (Points) | 1002 | 537 -46% | 971 -3% | 1880 88% | 996 -1% | 820 -18% |
| Score Total (Points) | 1766 | 1150 -35% | 2453 39% | 3499 98% | 2586 46% | 1990 13% |
| Copy ISO MB/s (MB/s) | 899 | 546 -39% | 1201 34% | 1544 72% | 1283 43% | 1311 46% |
| Copy Program MB/s (MB/s) | 549 | 106.2 -81% | 303 -45% | 613 12% | 806 47% | 310.3 -43% |
| Copy Game MB/s (MB/s) | 842 | 151 -82% | 436.4 -48% | 1451 72% | 1182 40% | 801 -5% |
| CrystalDiskMark 5.2 / 6 | -52% | 51% | 53% | 8% | 20% | |
| Write 4K (MB/s) | 122.6 | 64.5 -47% | 157.4 28% | 97.5 -20% | 96.5 -21% | 139.7 14% |
| Read 4K (MB/s) | 53.4 | 24.91 -53% | 48.59 -9% | 50.9 -5% | 36.81 -31% | 56.4 6% |
| Write Seq (MB/s) | 894 | 453.4 -49% | 2199 146% | 1811 103% | 1168 31% | 1265 41% |
| Read Seq (MB/s) | 1457 | 424.9 -71% | 2011 38% | 1836 26% | 1476 1% | 1492 2% |
| Write 4K Q32T1 (MB/s) | 392.9 | 257.8 -34% | 265.3 -32% | 521 33% | 389.5 -1% | 402.5 2% |
| Read 4K Q32T1 (MB/s) | 337.9 | 200.4 -41% | 478.8 42% | 357.5 6% | 347.8 3% | 329.3 -3% |
| Write Seq Q32T1 (MB/s) | 975 | 504 -48% | 2193 125% | 2879 195% | 1398 43% | 1786 83% |
| Read Seq Q32T1 (MB/s) | 1729 | 459.6 -73% | 2870 66% | 3204 85% | 2364 37% | 1923 11% |
| Write 4K Q8T8 (MB/s) | 284.4 | |||||
| Read 4K Q8T8 (MB/s) | 301.2 | |||||
| Total Average (Program / Settings) | -49% /
-48% | 42% /
39% | 51% /
50% | 23% /
27% | 18% /
17% |
* ... smaller is better

Disk Throttling: DiskSpd Read Loop, Queue Depth 8
GPU Performance
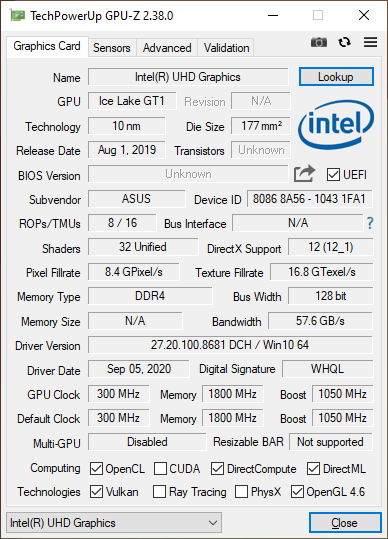
The UHD Graphics G1 is roughly 40 percent faster than the aging UHD Graphics 620 but still well below the Ice Lake Iris Plus G7, Tiger Lake Iris Xe, or the dedicated GeForce MX150/250/350 series. Even amateur video editors or light gamers will want to consider something more powerful than what is available on our review configuration.
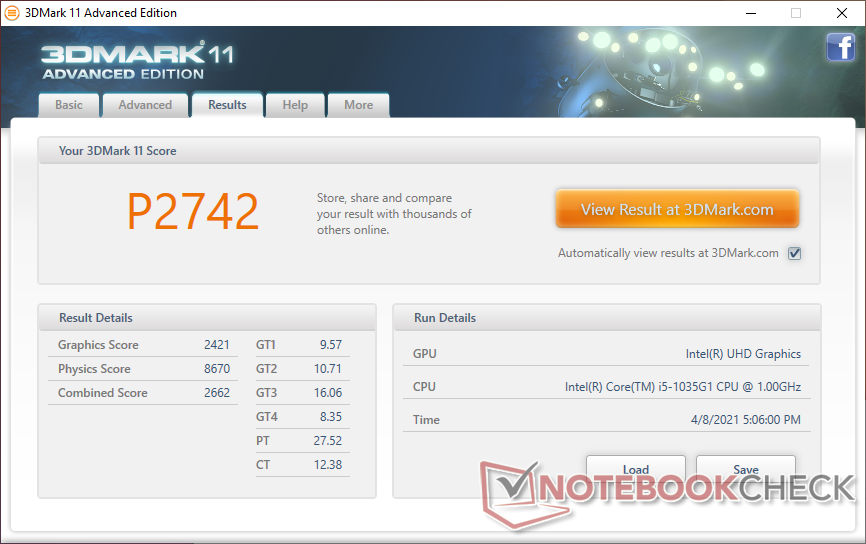
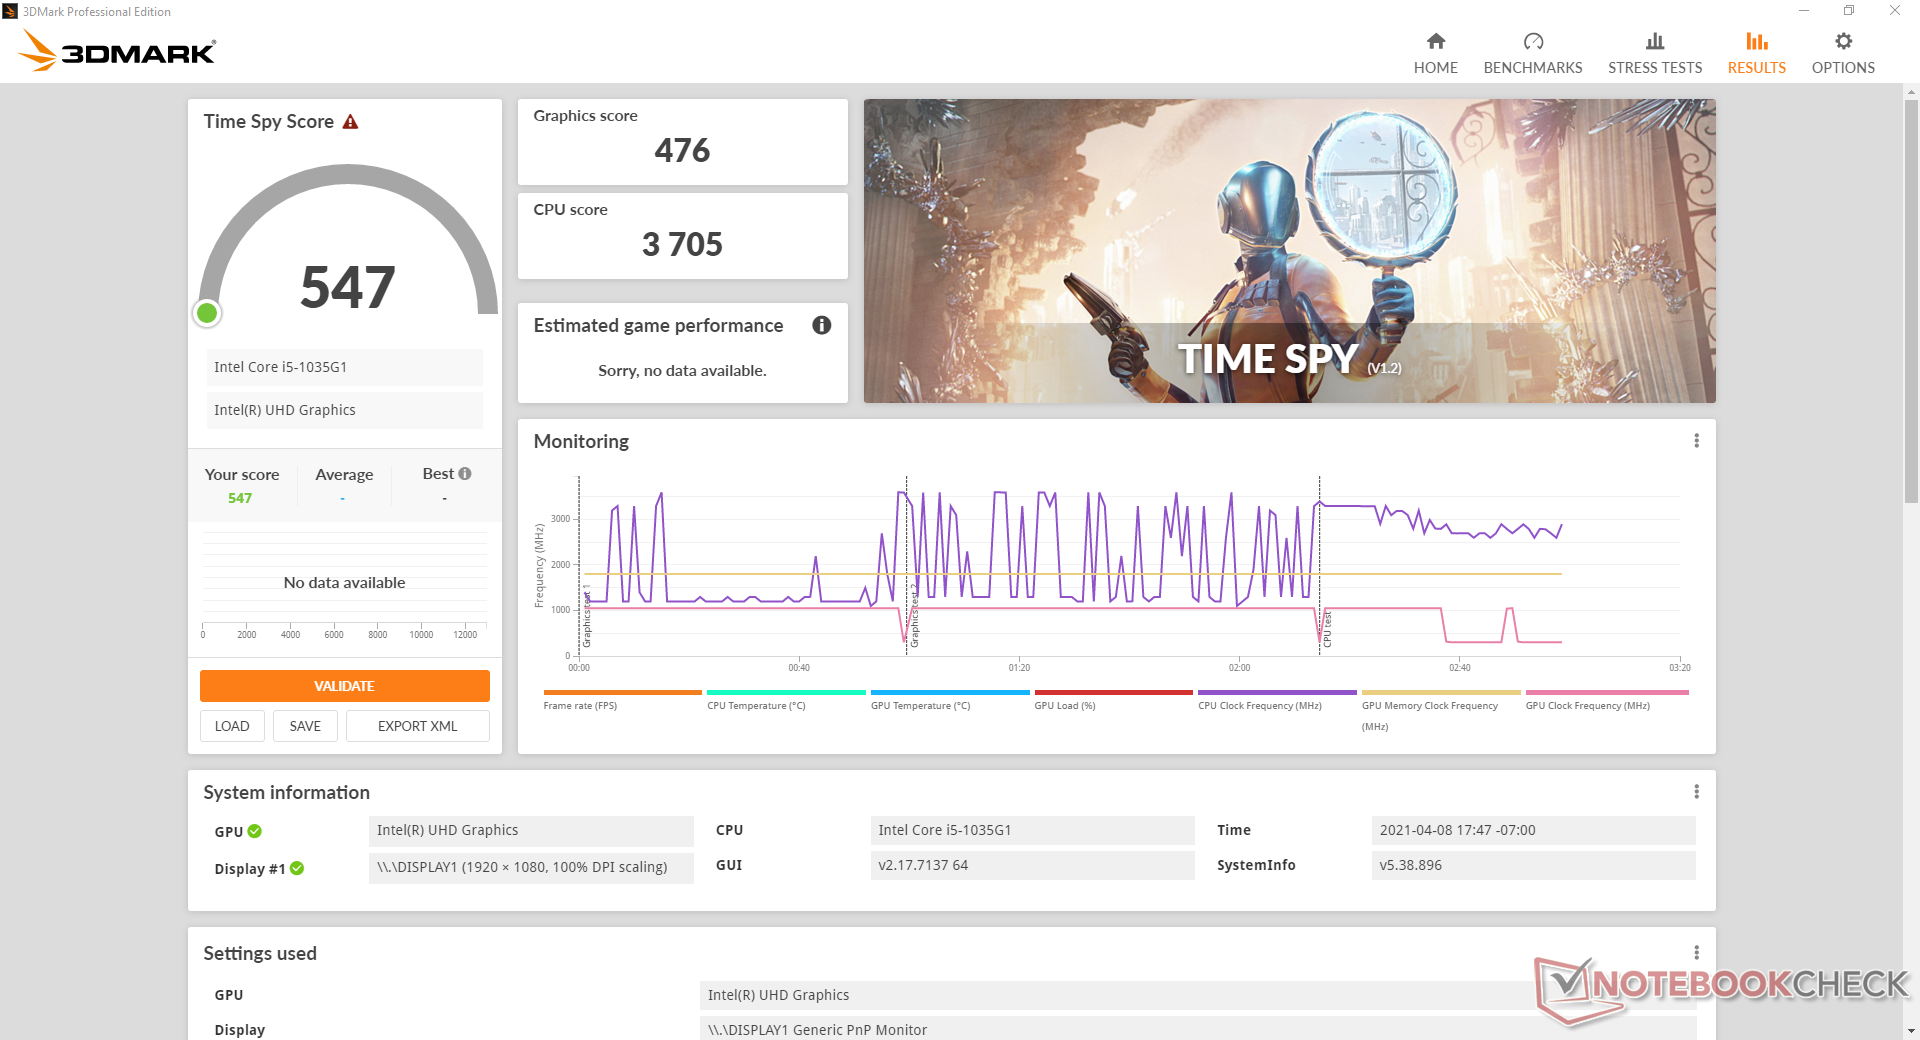
| 3DMark 11 Performance | 2742 points | |
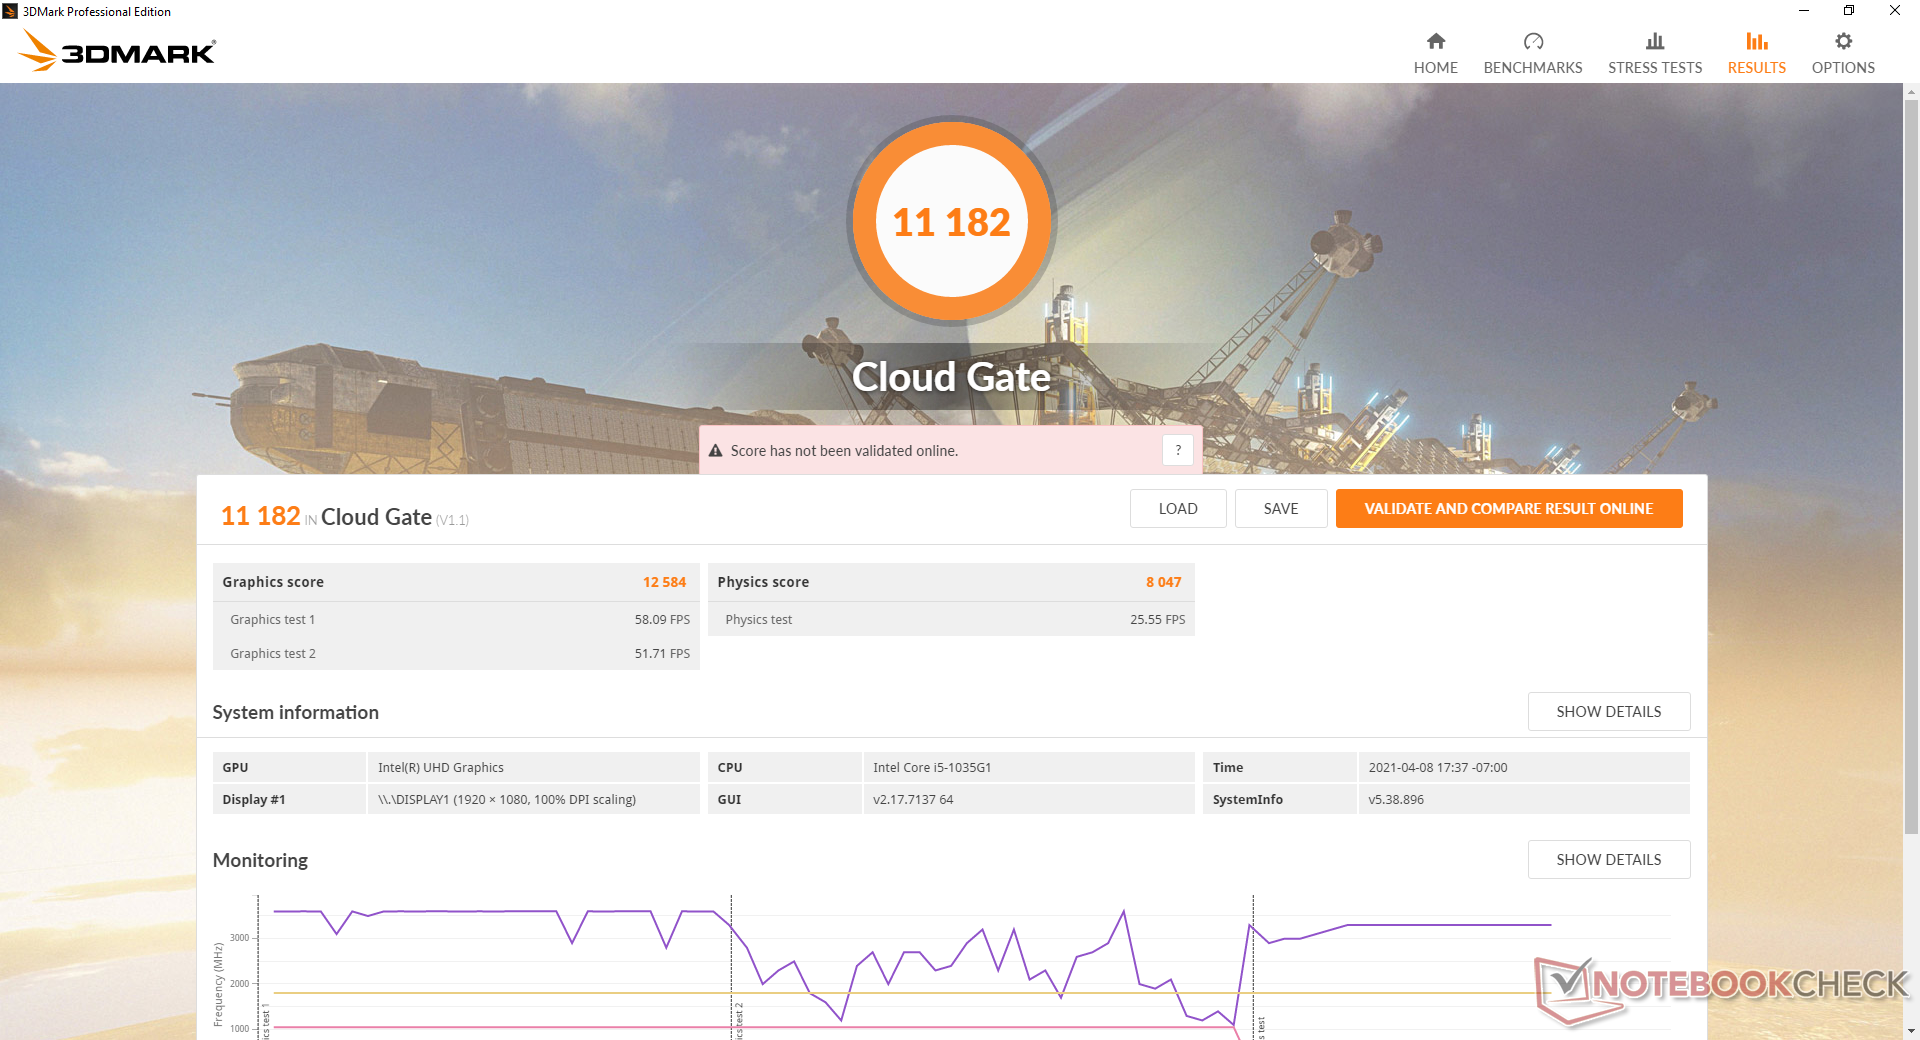
| 3DMark Cloud Gate Standard Score | 11182 points | |
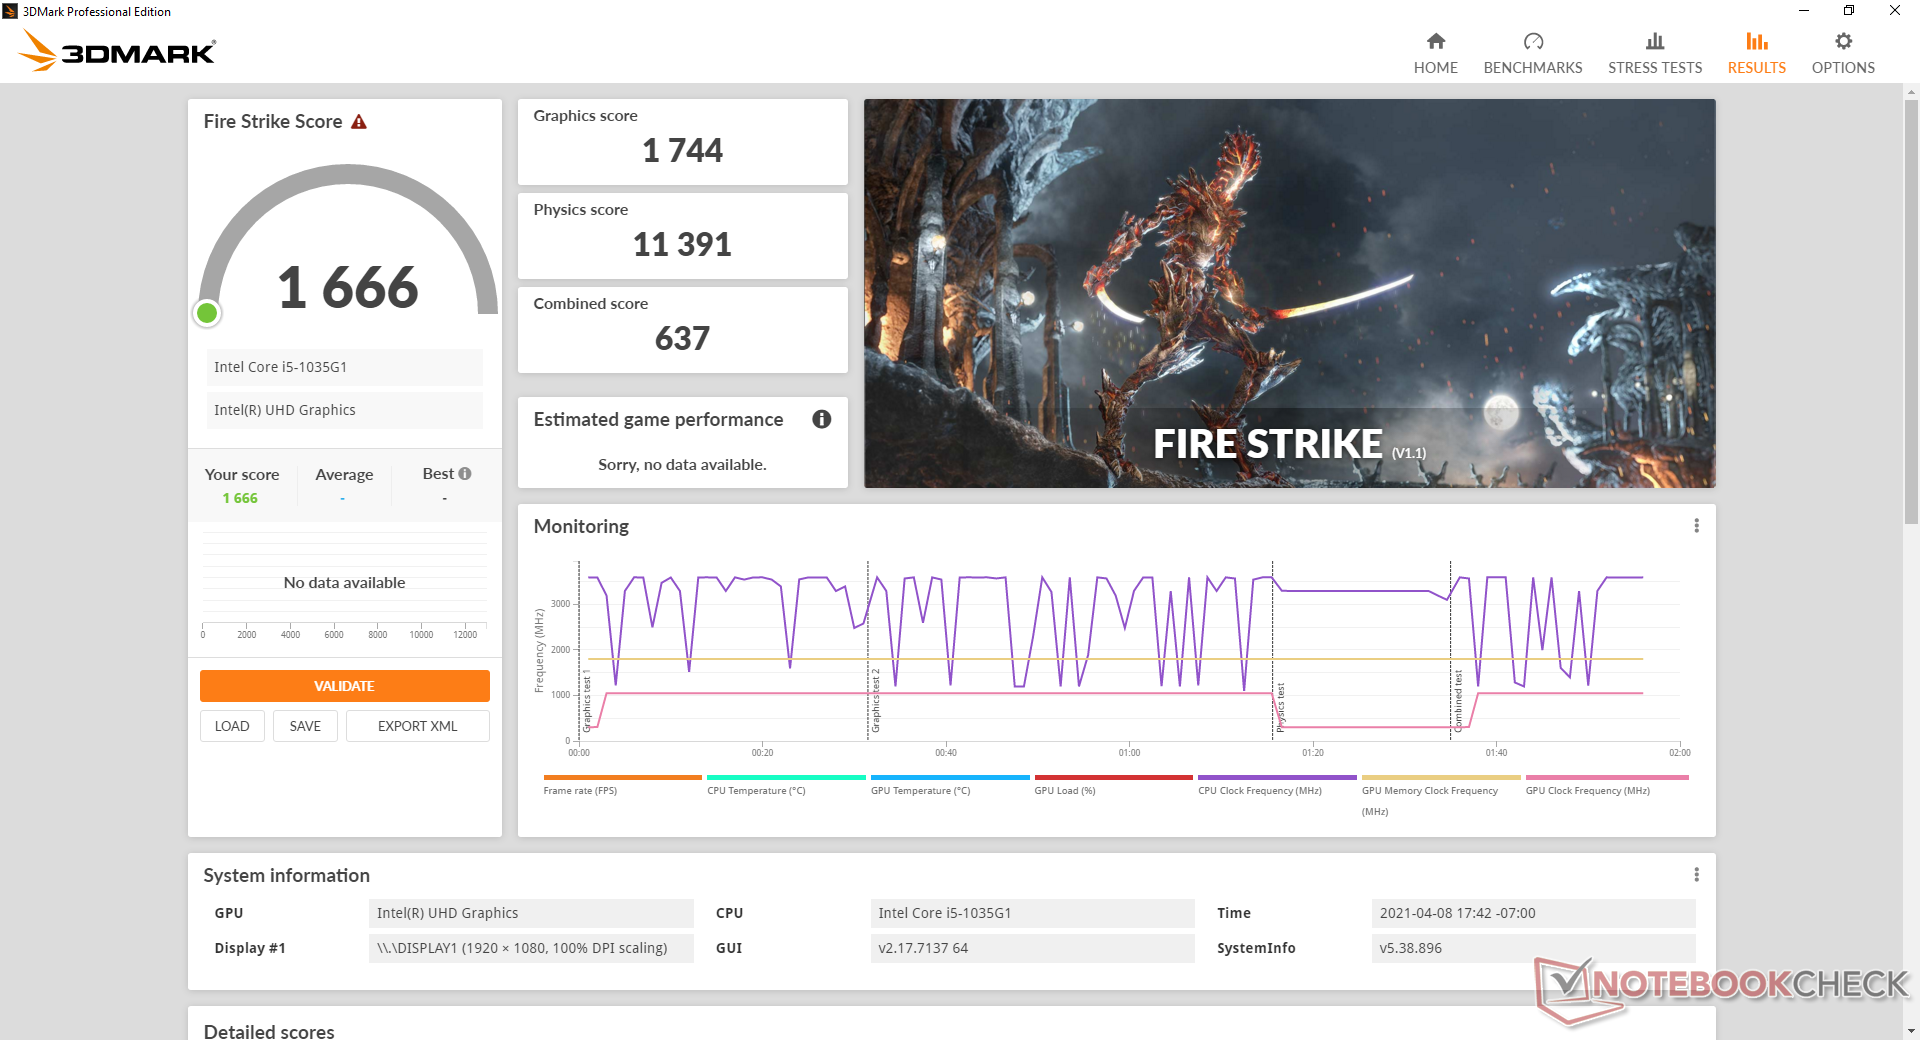
| 3DMark Fire Strike Score | 1666 points | |
| 3DMark Time Spy Score | 547 points | |
Help | ||
| low | med. | high | ultra | |
|---|---|---|---|---|
| Dota 2 Reborn (2015) | 84.1 | 49 | 25.7 | 23.8 |
| Final Fantasy XV Benchmark (2018) | 16.8 | 8.32 | 5.81 | |
| X-Plane 11.11 (2018) | 32.9 | 15.3 | 14.4 |
Emissions
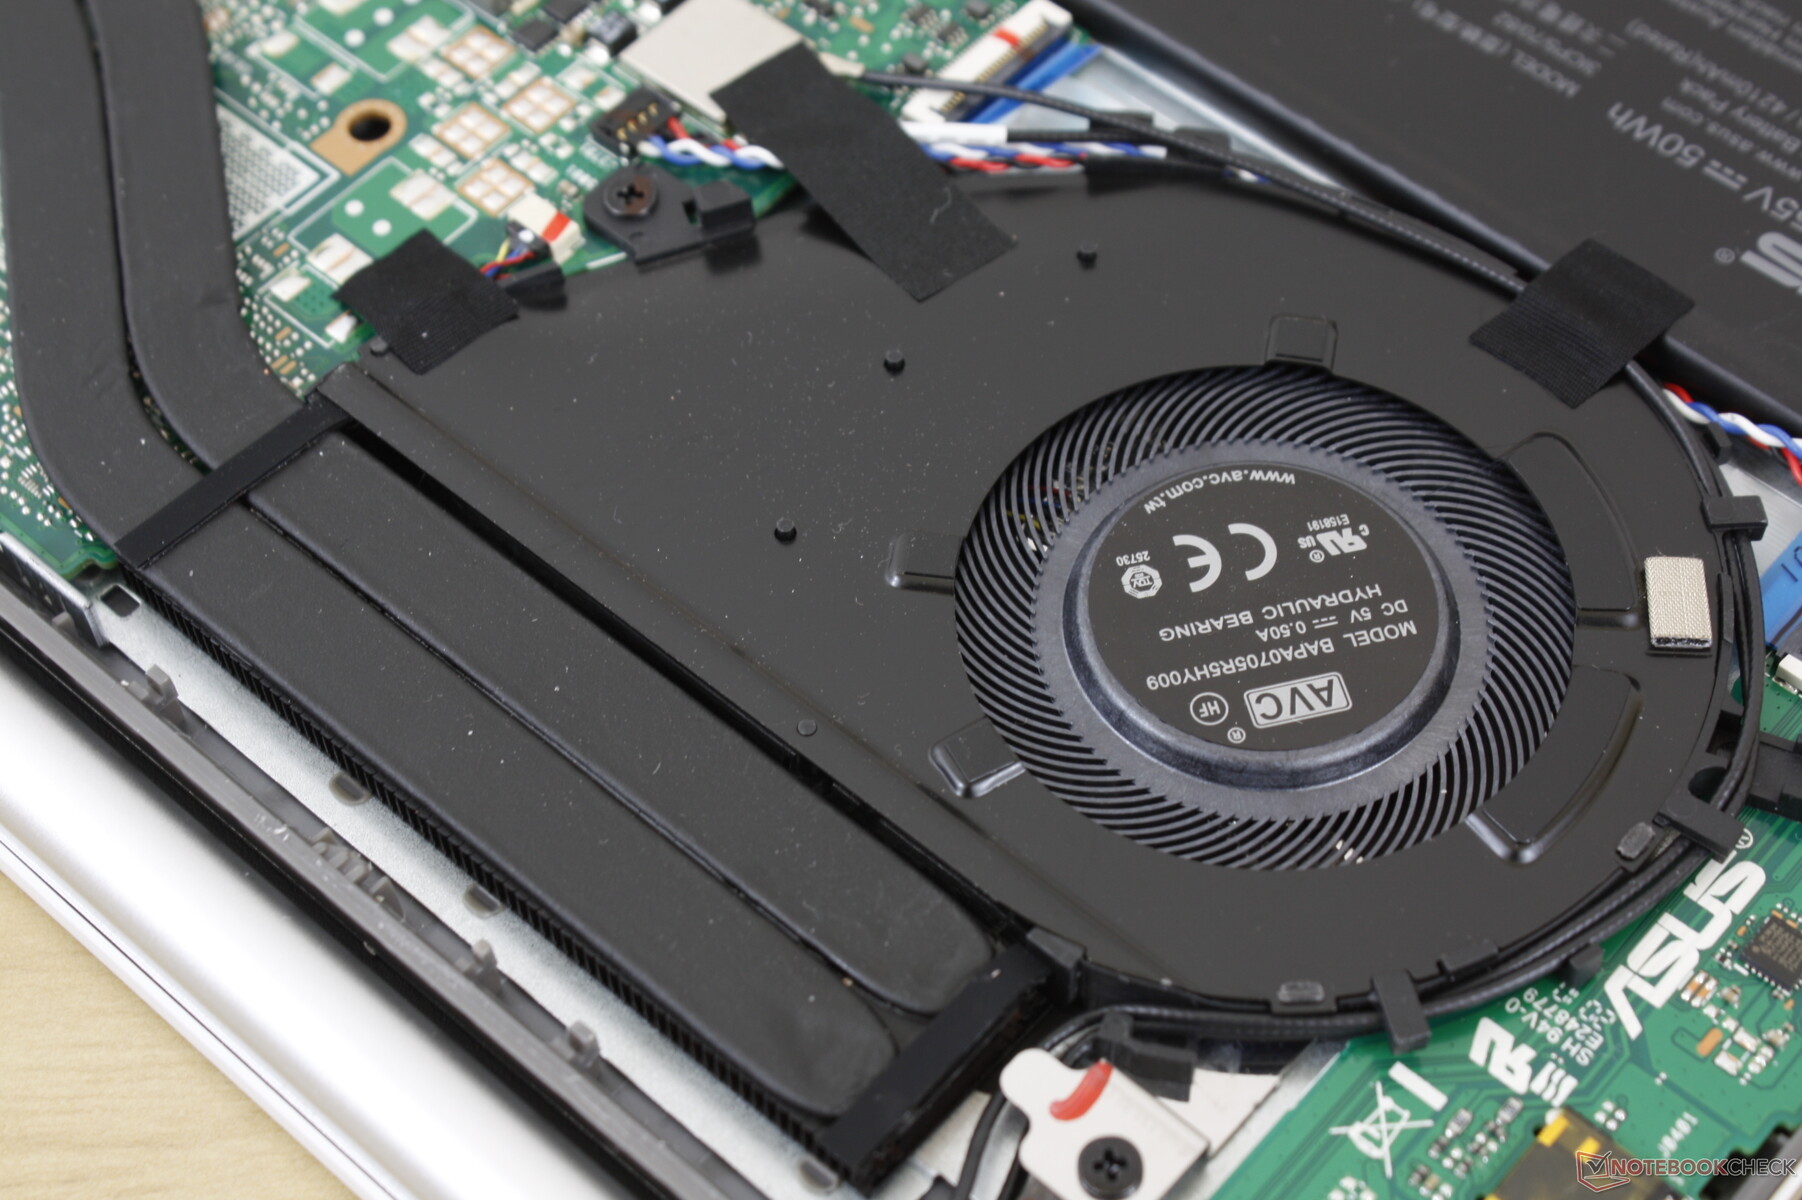
System Noise
The internal fan is silent at best and usually quiet during most low to low-medium loads with no annoying pulsing issues. Prolonged browsing or video streaming may induce a fan noise of 28.4 dB(A) against a silent background of 25 dB(A) to be just barely audible. If stressed even more with games or other demanding loads, fan noise would steadily rise up to 38.1 dB(A) to be comparable to the latest ZenBook S13.
Our unit exhibits a slight coil whine of 25.5 dB(A) and so it is never a truly silent experience even if the fan is idle. Fortunately, the whine is mostly unnoticeable from a normal sitting and typing distance.
| Asus VivoBook S13 S333JA-DS51 UHD Graphics G1 (Ice Lake 32 EU), i5-1035G1, Intel SSD 660p SSDPEKNW512G8 | Asus VivoBook S13 S330UA-EY034T UHD Graphics 620, i5-8550U, Kingston RBU-SNS8180DS3512GJ | Lenovo IdeaPad S540-13ARE-82DL000YGE Vega 6, R5 4600U, WDC PC SN730 SDBPNTY-256G | Dell XPS 13 9310 Core i7 FHD Iris Xe G7 96EUs, i7-1165G7, Micron 2300 512GB MTFDHBA512TDV | HP Pavilion 13-bb0015cl Iris Xe G7 96EUs, i7-1165G7, Samsung PM991 MZVLQ512HALU | Asus ZenBook 13 UX325JA Iris Plus Graphics G7 (Ice Lake 64 EU), i7-1065G7, Intel SSD 660p 1TB SSDPEKNW010T8 | |
|---|---|---|---|---|---|---|
| Noise | -7% | -3% | 2% | -9% | -13% | |
| off / environment * (dB) | 25 | 29 -16% | 25 -0% | 25.7 -3% | 28 -12% | 30.1 -20% |
| Idle Minimum * (dB) | 25.5 | 29 -14% | 25 2% | 25.7 -1% | 28 -10% | 30.1 -18% |
| Idle Average * (dB) | 25.5 | 29 -14% | 25 2% | 25.7 -1% | 28 -10% | 30.1 -18% |
| Idle Maximum * (dB) | 25.5 | 29 -14% | 25 2% | 25.9 -2% | 28 -10% | 30.1 -18% |
| Load Average * (dB) | 31.2 | 29.9 4% | 32.8 -5% | 26.2 16% | 35.2 -13% | 32.7 -5% |
| Load Maximum * (dB) | 38.1 | 33.3 13% | 44.5 -17% | 36.6 4% | 36.6 4% | 38.5 -1% |
| Witcher 3 ultra * (dB) | 36.5 | 36.8 | 38.6 |
* ... smaller is better
Noise level
| Idle |
| 25.5 / 25.5 / 25.5 dB(A) |
| Load |
| 31.2 / 38.1 dB(A) |
 | ||
30 dB silent 40 dB(A) audible 50 dB(A) loud |
||
min: | ||
Temperature
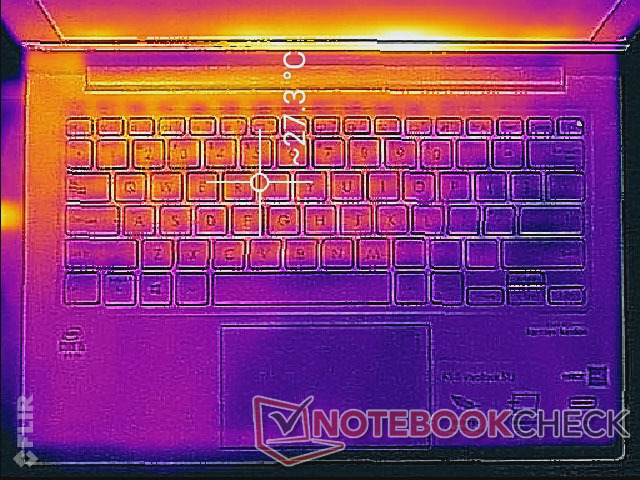
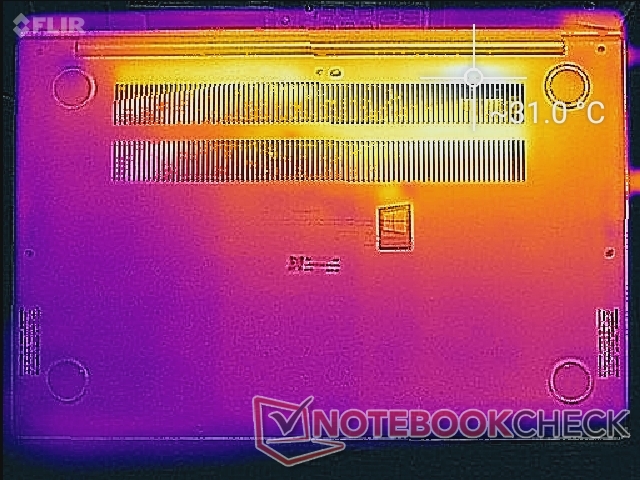
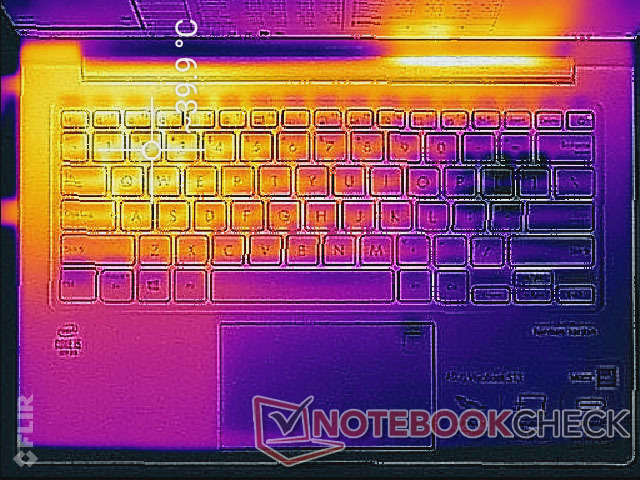
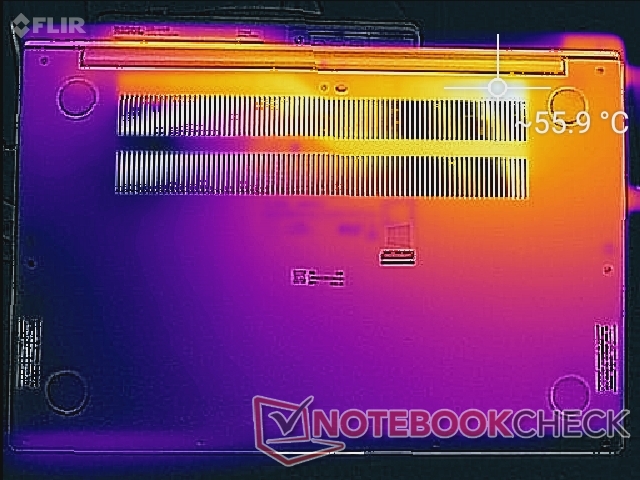
Though surface temperatures are ok during low loads like browsing or streaming, they can become warmer than expected when running higher loads like games. Hot spots can be as warm as 40 C to 56 C on the top and bottom, respectively. The high core temperatures when under load are likely responsible for the high surface temperatures as detailed in our Stress Test section below. Note that the left half of the laptop will always be warmer than the right half due to how the cooling solution is positioned inside.
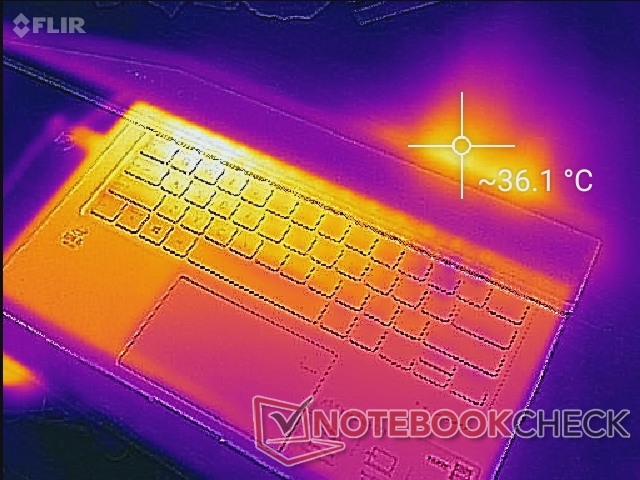
(±) The maximum temperature on the upper side is 40 °C / 104 F, compared to the average of 35.9 °C / 97 F, ranging from 21.4 to 59 °C for the class Subnotebook.
(-) The bottom heats up to a maximum of 55.6 °C / 132 F, compared to the average of 39.2 °C / 103 F
(+) In idle usage, the average temperature for the upper side is 26.2 °C / 79 F, compared to the device average of 30.8 °C / 87 F.
(+) The palmrests and touchpad are cooler than skin temperature with a maximum of 28 °C / 82.4 F and are therefore cool to the touch.
(±) The average temperature of the palmrest area of similar devices was 28.2 °C / 82.8 F (+0.2 °C / 0.4 F).
Stress Test
When running Prime95 to fully stress the processor, the CPU would boost to 3.3 GHz for the first few seconds before quickly dropping to the 2.1 to 2.2 GHz range in order to maintain a core temperature of 91 C. This temperature is actually quite high; the Dell XPS 13 with the faster Core i7 would stabilize in the cooler 71 C to 78 C range when under similar conditions.
Running on battery power would limit CPU performance. A 3DMark 11 run on batteries would return Physics and Graphics scores of 6744 and 2339 points, respectively, compared to 8670 and 2421 points when on mains.
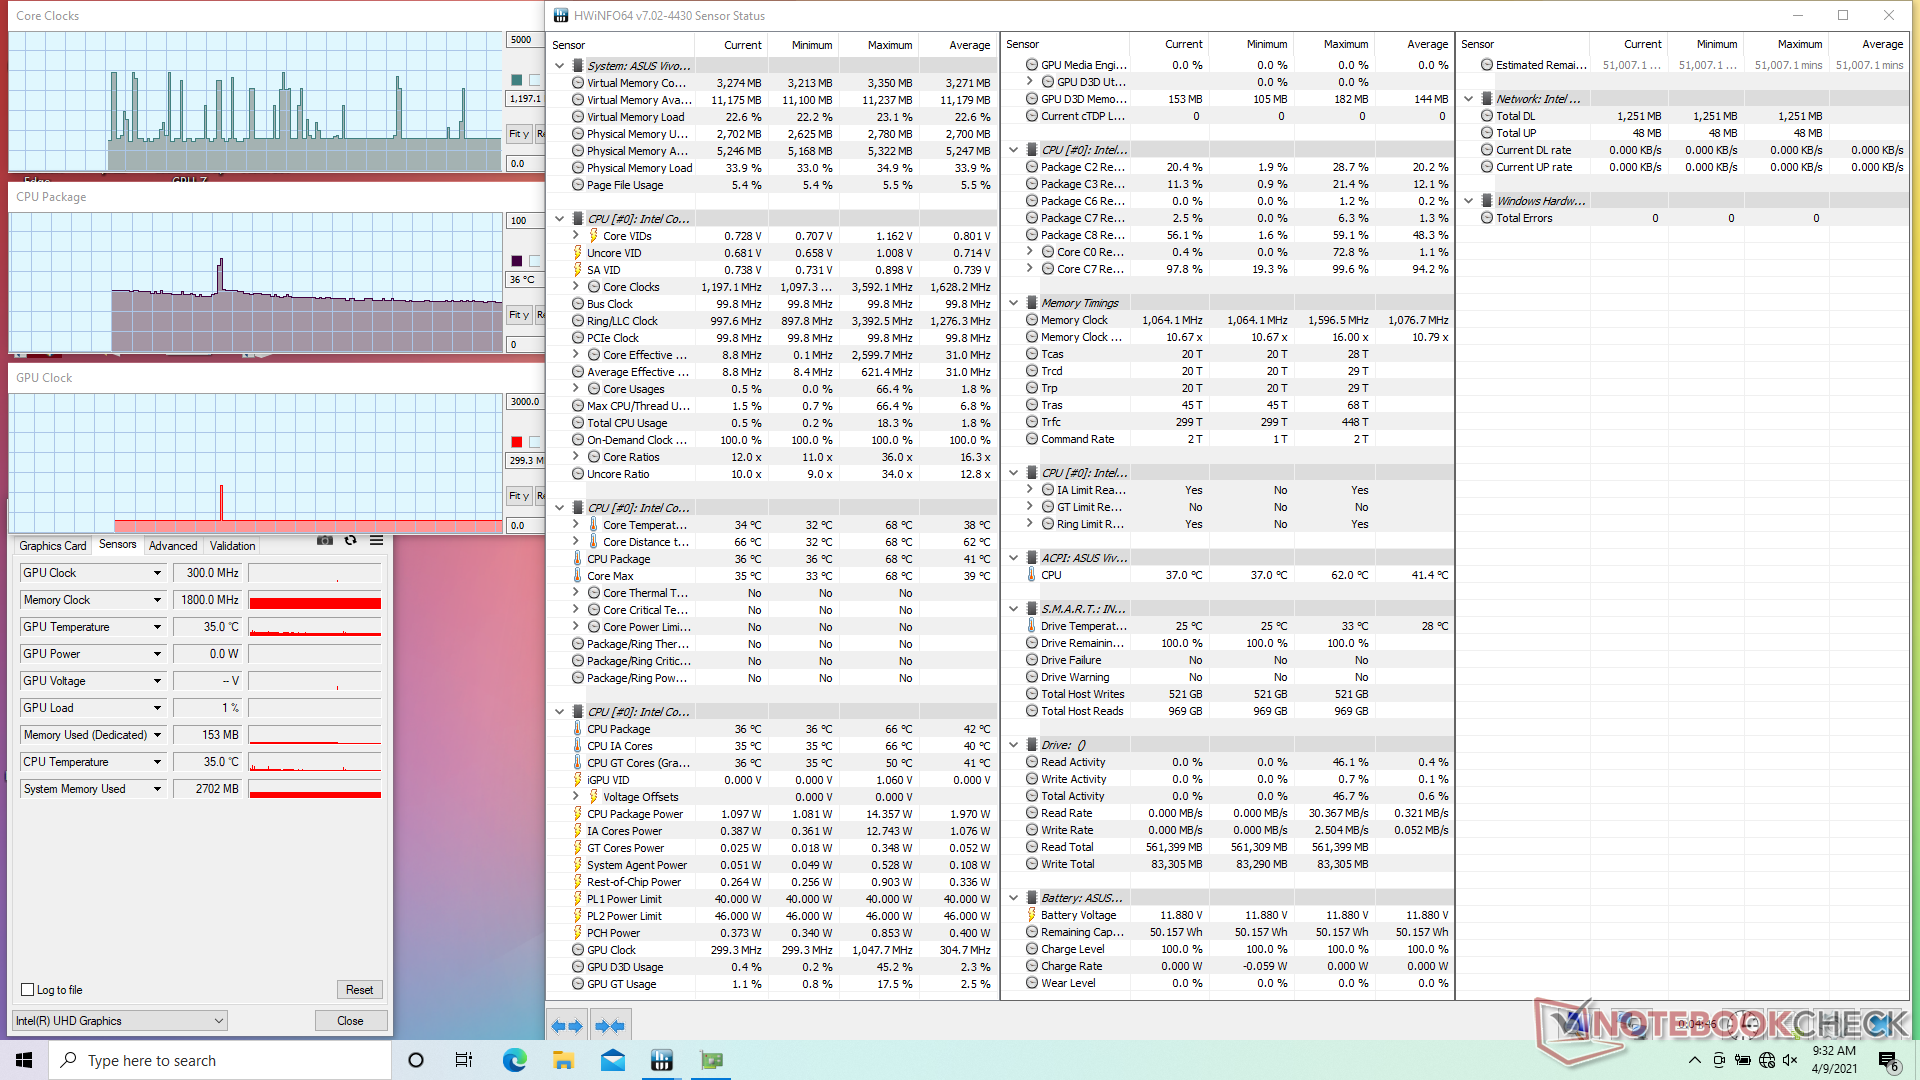
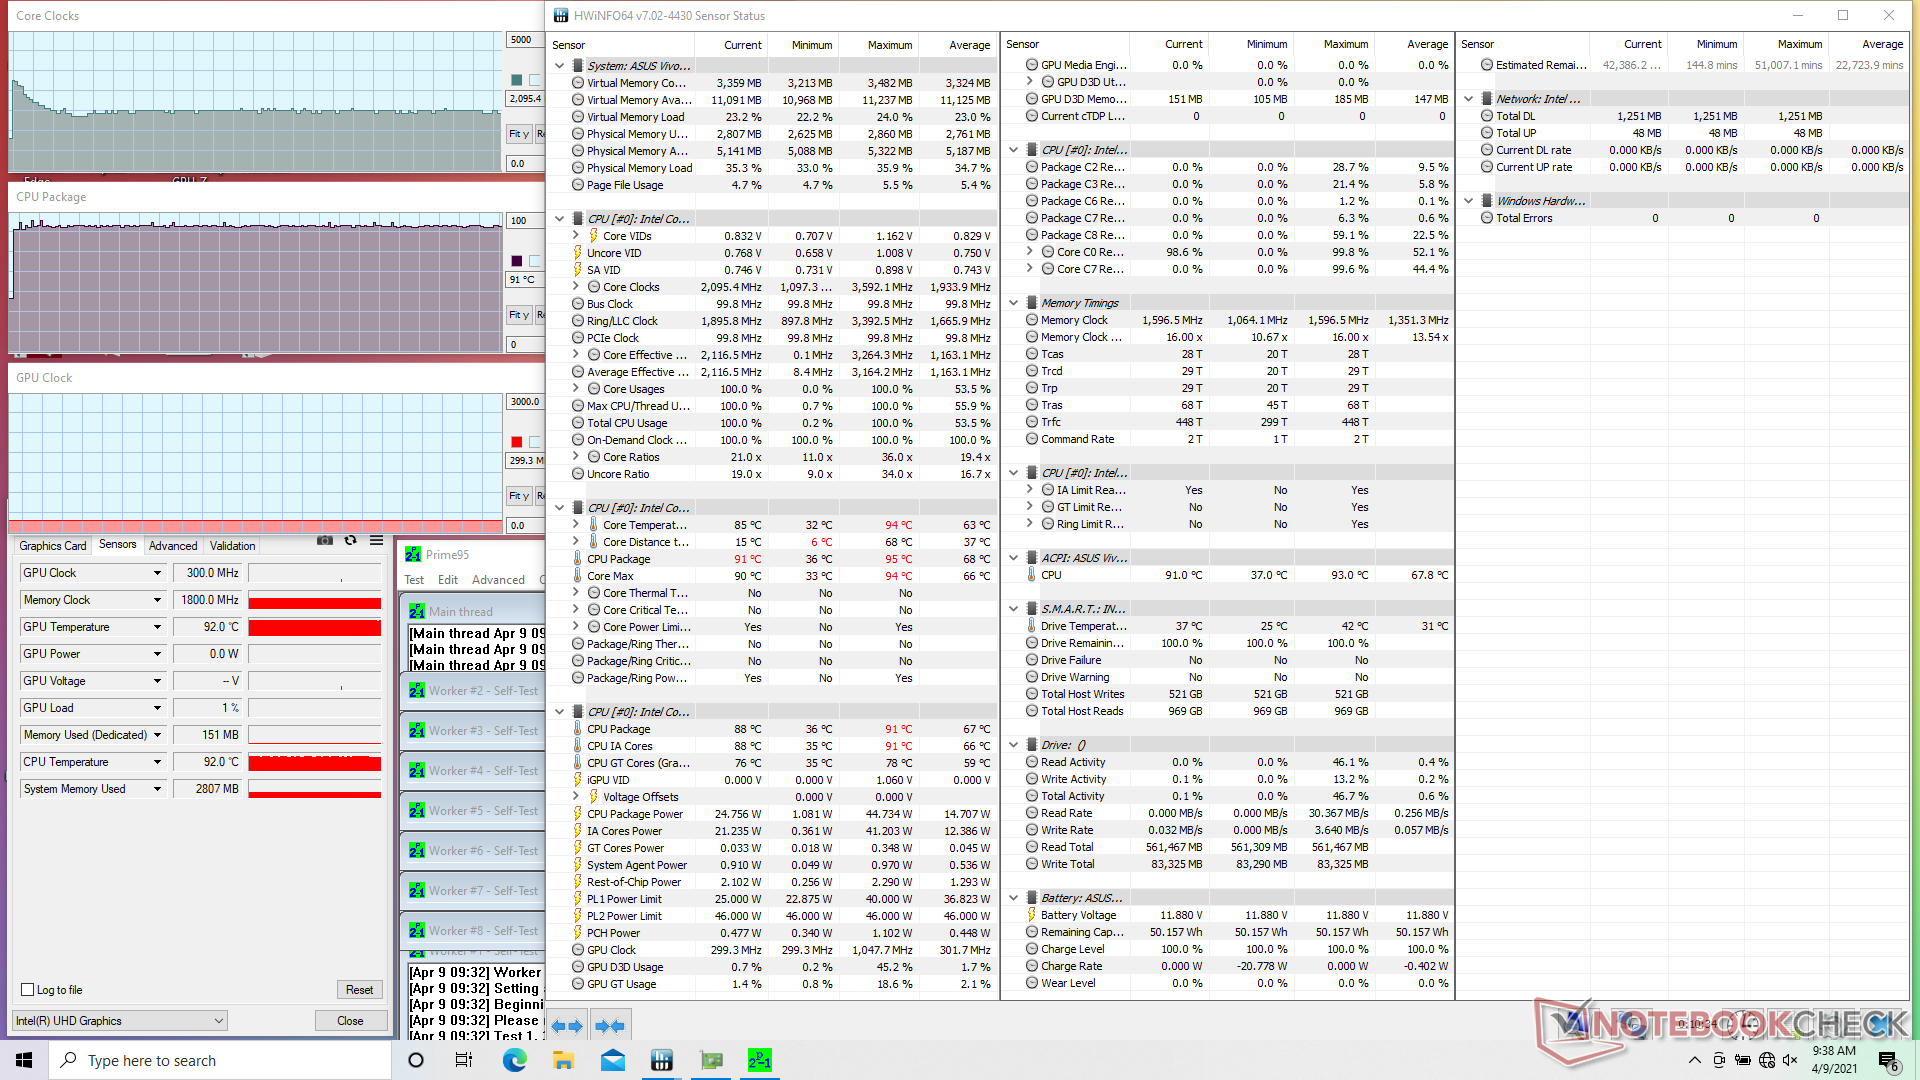
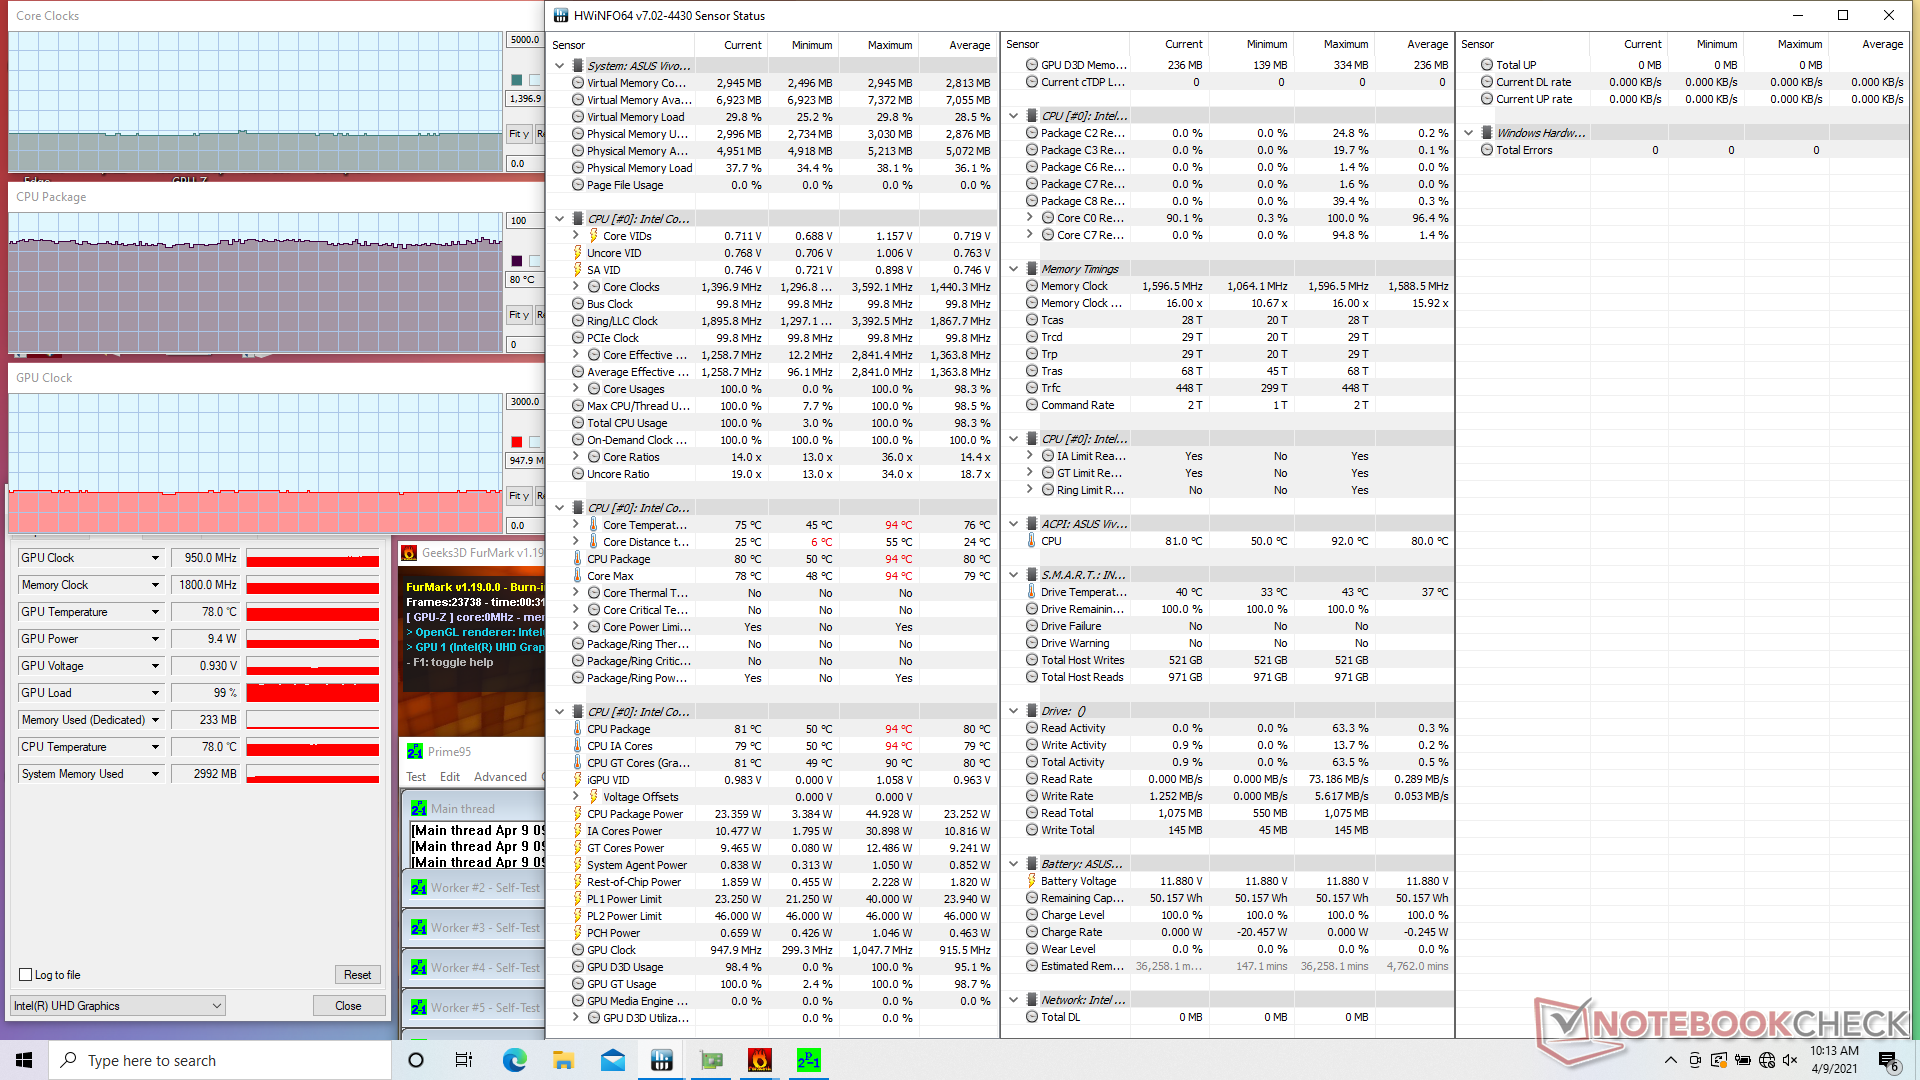
| CPU Clock (GHz) | GPU Clock (MHz) | Average CPU Temperature (°C) | |
| System Idle | -- | -- | 36 |
| Prime95 Stress | 2.1 - 2.2 | -- | 91 |
| Prime95 + FurMark Stress | 1.3 - 1.4 | 950 | 80 |
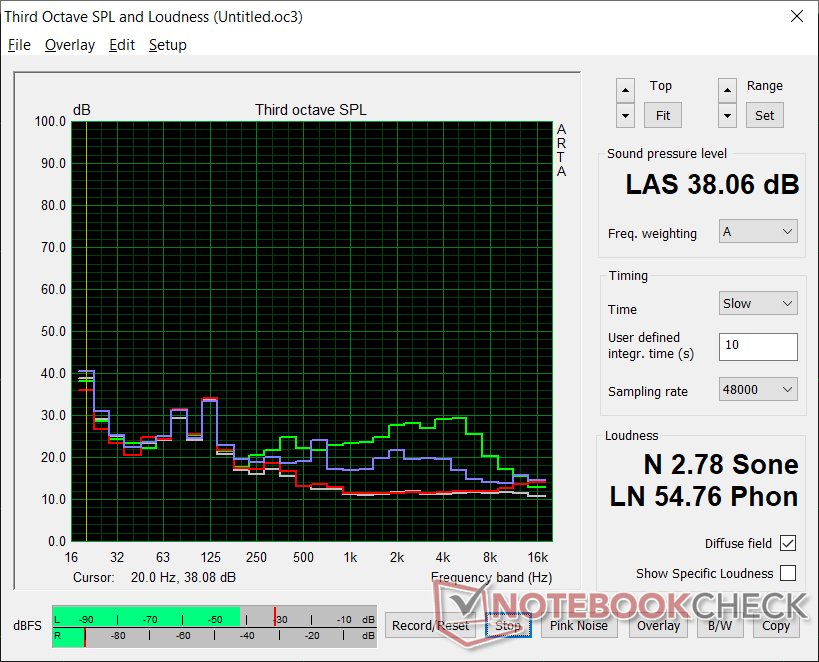
Speakers


Asus VivoBook S13 S333JA-DS51 audio analysis
(±) | speaker loudness is average but good (80.8 dB)
Bass 100 - 315 Hz
(±) | reduced bass - on average 13.2% lower than median
(±) | linearity of bass is average (9.9% delta to prev. frequency)
Mids 400 - 2000 Hz
(+) | balanced mids - only 2.6% away from median
(+) | mids are linear (4.3% delta to prev. frequency)
Highs 2 - 16 kHz
(+) | balanced highs - only 1.5% away from median
(+) | highs are linear (3.6% delta to prev. frequency)
Overall 100 - 16.000 Hz
(+) | overall sound is linear (11.3% difference to median)
Compared to same class
» 11% of all tested devices in this class were better, 2% similar, 86% worse
» The best had a delta of 5%, average was 18%, worst was 53%
Compared to all devices tested
» 7% of all tested devices were better, 2% similar, 91% worse
» The best had a delta of 4%, average was 24%, worst was 134%
Apple MacBook 12 (Early 2016) 1.1 GHz audio analysis
(+) | speakers can play relatively loud (83.6 dB)
Bass 100 - 315 Hz
(±) | reduced bass - on average 11.3% lower than median
(±) | linearity of bass is average (14.2% delta to prev. frequency)
Mids 400 - 2000 Hz
(+) | balanced mids - only 2.4% away from median
(+) | mids are linear (5.5% delta to prev. frequency)
Highs 2 - 16 kHz
(+) | balanced highs - only 2% away from median
(+) | highs are linear (4.5% delta to prev. frequency)
Overall 100 - 16.000 Hz
(+) | overall sound is linear (10.2% difference to median)
Compared to same class
» 7% of all tested devices in this class were better, 2% similar, 91% worse
» The best had a delta of 5%, average was 18%, worst was 53%
Compared to all devices tested
» 5% of all tested devices were better, 1% similar, 94% worse
» The best had a delta of 4%, average was 24%, worst was 134%
Energy Management
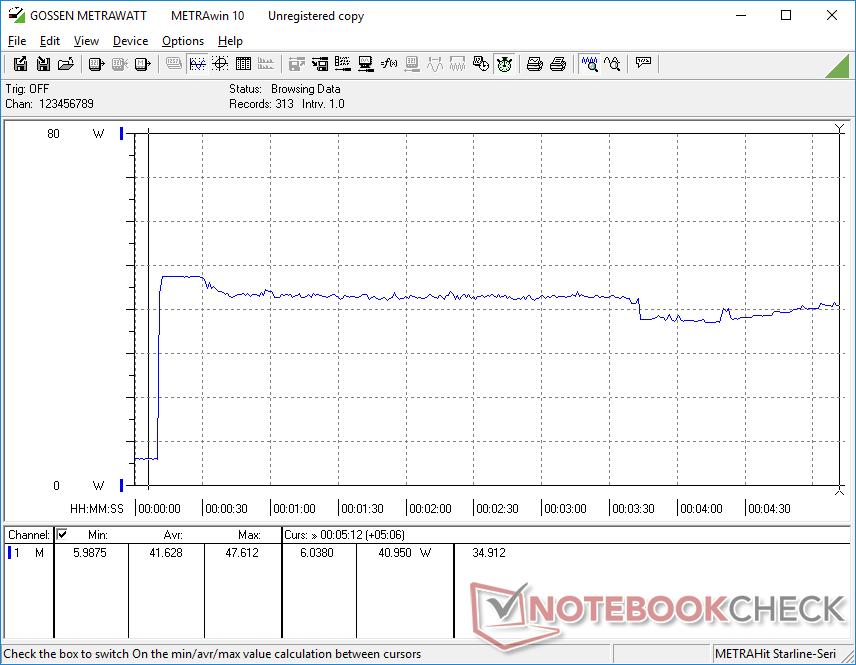
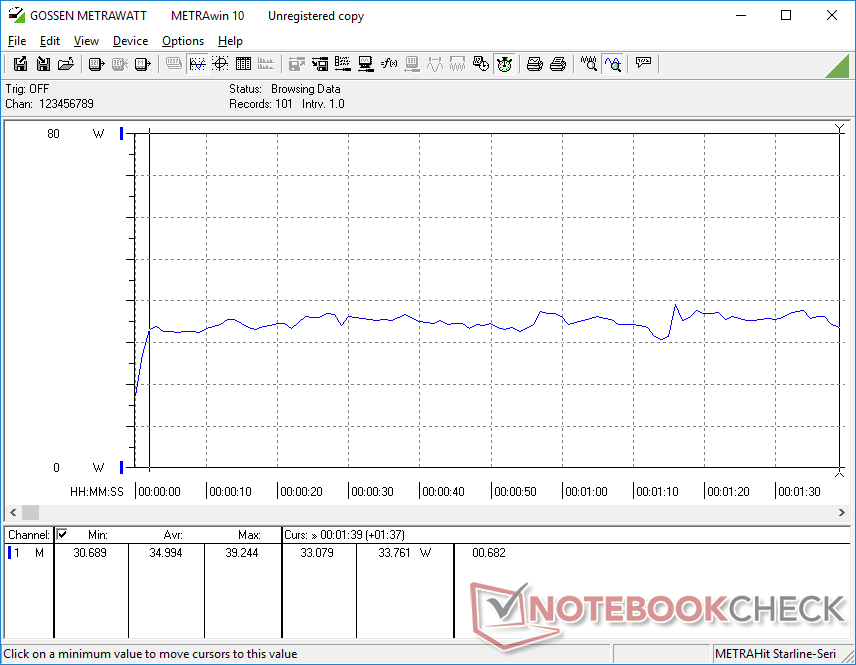
Power Consumption
The 2021 model is more power efficient than the 2018 model in all cases as shown by the table below. Running games would consume about 35 W when compared to 43 W on the older Kaby Lake-R-powered model. Asus' ZenBook 13 UX325 demands about the same as our 2021 unit but it offers significantly faster graphics integrated Iris graphics performance.
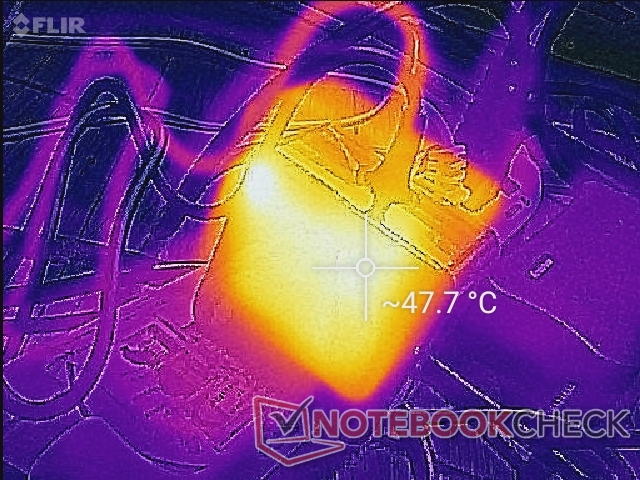
We're able to measure a maximum draw of 47.6 W from the small (~5.3 x 5.3 x 2.7 cm) 45 W AC adapter. This rate falls over time due to the limited Turbo Boost potential of the system.
| Off / Standby | |
| Idle | |
| Load |
|
Key:
min: | |
| Asus VivoBook S13 S333JA-DS51 i5-1035G1, UHD Graphics G1 (Ice Lake 32 EU), Intel SSD 660p SSDPEKNW512G8, IPS, 1920x1080, 13.3" | Asus VivoBook S13 S330UA-EY034T i5-8550U, UHD Graphics 620, Kingston RBU-SNS8180DS3512GJ, IPS LED, 1920x1080, 13.3" | Lenovo IdeaPad S540-13ARE-82DL000YGE R5 4600U, Vega 6, WDC PC SN730 SDBPNTY-256G, IPS, 2560x1600, 13.3" | Dell XPS 13 9310 Core i7 FHD i7-1165G7, Iris Xe G7 96EUs, Micron 2300 512GB MTFDHBA512TDV, IPS, 1920x1200, 13.4" | HP Pavilion 13-bb0015cl i7-1165G7, Iris Xe G7 96EUs, Samsung PM991 MZVLQ512HALU, IPS, 3840x2160, 13.3" | Asus ZenBook 13 UX325JA i7-1065G7, Iris Plus Graphics G7 (Ice Lake 64 EU), Intel SSD 660p 1TB SSDPEKNW010T8, IPS, 1920x1080, 13.3" | |
|---|---|---|---|---|---|---|
| Power Consumption | -24% | -36% | -18% | -63% | -6% | |
| Idle Minimum * (Watt) | 2.8 | 2.8 -0% | 3.9 -39% | 4.6 -64% | 2.4 14% | |
| Idle Average * (Watt) | 4.8 | 5 -4% | 5.9 -23% | 10.6 -121% | 4.6 4% | |
| Idle Maximum * (Watt) | 5.4 | 8.3 -54% | 9.4 -74% | 6.3 -17% | 11.4 -111% | 9 -67% |
| Load Average * (Watt) | 35 | 42.8 -22% | 37.6 -7% | 39.7 -13% | 43.2 -23% | 36 -3% |
| Load Maximum * (Watt) | 47.6 | 65.8 -38% | 60.7 -28% | 47.5 -0% | 46 3% | 36 24% |
| Witcher 3 ultra * (Watt) | 34.8 | 39.9 | 27 |
* ... smaller is better
Battery Life
Asus has upped the battery capacity from 42 Wh on the older S330 to 50 Wh on the newer S333 and runtimes have improved as a result. We've recorded just under 10 hours of real-world WLAN use when on the Balanced power profile to be almost 1.5 hours longer than on the S330.
Charge rate, however, is slow. Recharging the battery from empty to full takes about 2.5 hours compared to 1.5 hours on most Ultrabooks.
| Asus VivoBook S13 S333JA-DS51 i5-1035G1, UHD Graphics G1 (Ice Lake 32 EU), 50 Wh | Asus VivoBook S13 S330UA-EY034T i5-8550U, UHD Graphics 620, 42 Wh | Lenovo IdeaPad S540-13ARE-82DL000YGE R5 4600U, Vega 6, 56 Wh | Dell XPS 13 9310 Core i7 FHD i7-1165G7, Iris Xe G7 96EUs, 52 Wh | HP Pavilion 13-bb0015cl i7-1165G7, Iris Xe G7 96EUs, 43 Wh | Asus ZenBook 13 UX325JA i7-1065G7, Iris Plus Graphics G7 (Ice Lake 64 EU), 67 Wh | |
|---|---|---|---|---|---|---|
| Battery runtime | -13% | -13% | 31% | -48% | 35% | |
| Reader / Idle (h) | 26.5 | 21 -21% | 30 13% | 10.8 -59% | 26.6 0% | |
| WiFi v1.3 (h) | 9.7 | 8.4 -13% | 11 13% | 11 13% | 4.5 -54% | 13.8 42% |
| Load (h) | 1.9 | 1.3 -32% | 3.2 68% | 1.3 -32% | 3.1 63% |
Pros
Cons
Verdict
The most surprising aspects of the VivoBook S13 S333 are its full sRGB color coverage and strong visual design relative to its <$700 USD asking price. They're not quite up there with a ZenBook, Dell XPS, or HP Spectre, but they're pretty close for hundreds of dollars less. Users who want to balance display quality, chassis quality, and processor performance without breaking the bank will find a lot to like here. We especially recommend finding the S333EA SKU instead of the S333JA if possible because the S333EA includes both Thunderbolt support and faster Iris Xe graphics for improved longevity.
Great bang for the buck. The S333JA is lacking in graphics and some connectivity options which the S333EA directly addresses.
Some limitations to keep in mind are the non-upgradeable RAM, slow MicroSD reader, weak clickpad, and relatively high running temperatures. Users who like to do a lot of picture editing will certainly want to invest in higher RAM and graphics options than our reviewed configuration. VivoBook laptops are on sale quite often, however, and so even the higher-end options won't cost all that much.
Price and availability
Asus VivoBook S13 S333JA-DS51
- 04/12/2021 v7 (old)
Allen Ngo
Price comparison
