Asus TUF Dash F15 Laptop: Ampere with one foot on the brake
Unsurprisingly, various TUF Dash F15 SKUs are going to be available. That is of course once Nvidia’s Ampere chips become available in the first place. Its quad-core processor is based on Intel’s brand-new Tiger Lake generation, and the three choices available include the Core i5-11300H (max 4.4 GHz), the Core i7-11370H (max 4.8 GHz), and the Core i7-11375H (max 5.0 GHz). The selection of GPUs will include a GeForce RTX 3060 Laptop and GeForce RTX 3070 Laptop.
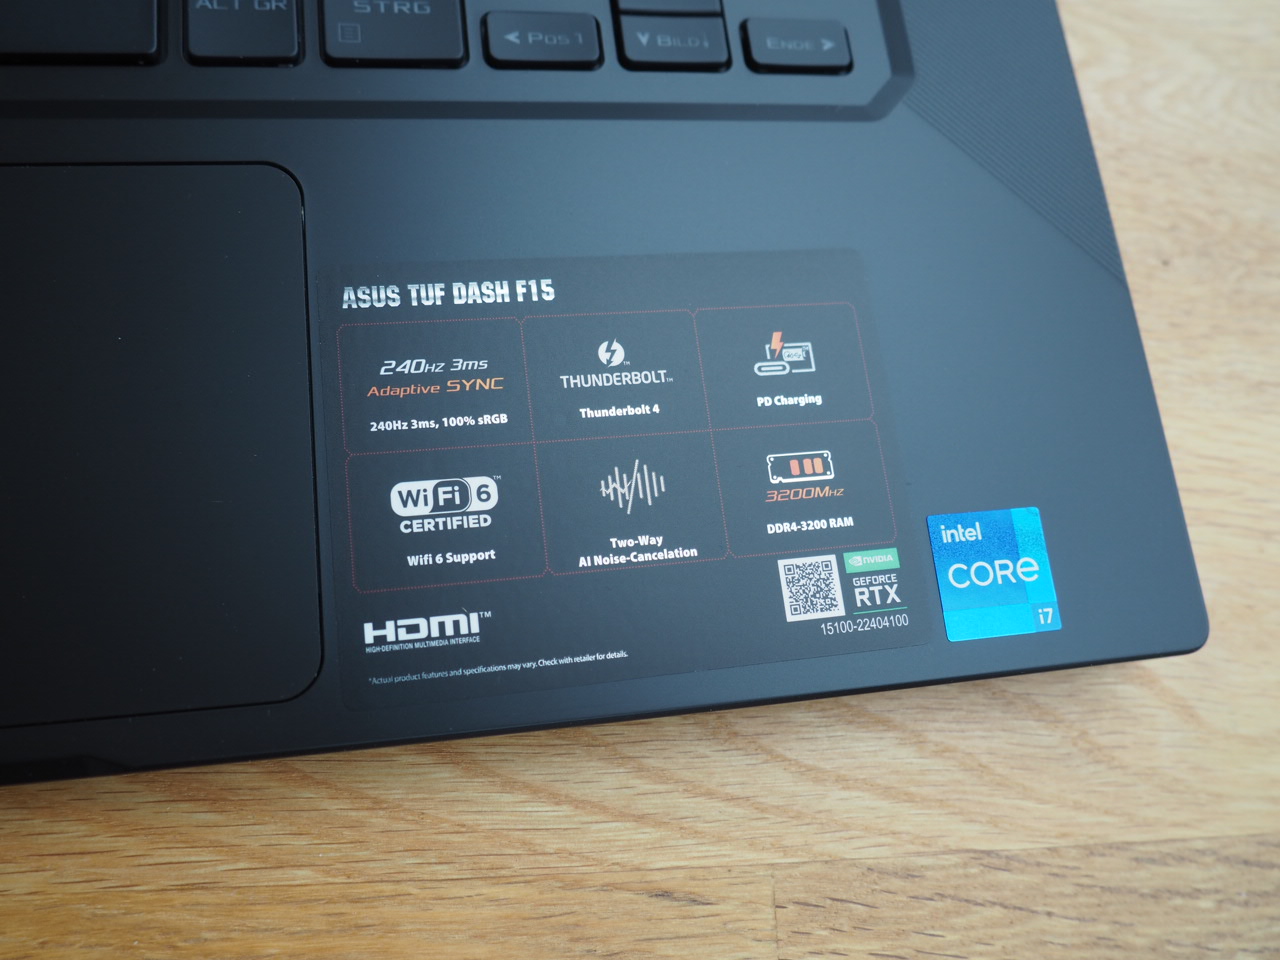
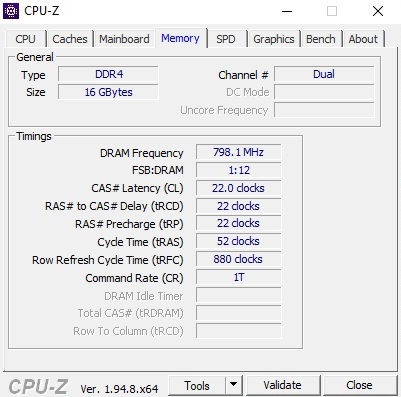
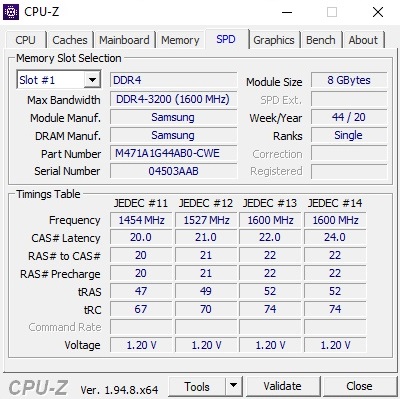
Three different 15-inch displays will be available, one with a resolution of 2560 x 1440 and a refresh rate of 165 Hz and two with a resolution of 1920 x 1080 and a refresh rate of either 240 or 144 Hz. According to the specs, the 144 Hz panel will offer the narrowest color gamut of the three and should therefore best be avoided. And last but not least up to 16 GB of RAM, part of which is soldered onto the motherboard, and up to 1 TB of SSD storage space will be available as well.
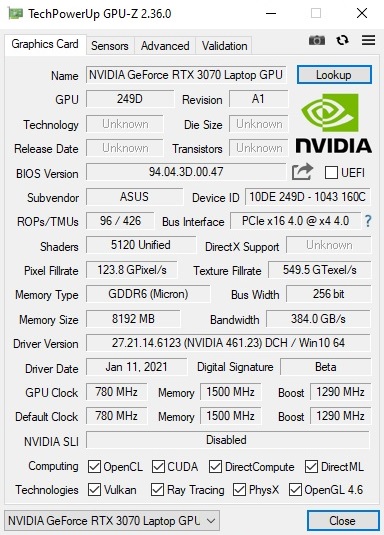
Our review unit came equipped with a Core i7-11370H, a GeForce RTX 3070 Laptop, the 240 Hz display, 16 GB of RAM, and a 1 TB SSD. This particular configuration will set you back more than 2,000 Euros (US prices not yet available), which is a lot considering that the TUF-series used to be the Asus’s entry-level series of gaming laptops. However, we should note that case quality improved significantly over the course of its lifetime and is no longer made exclusively out of plastic.
Its main competitors are other 15-inch gaming notebooks with energy-efficient high-end GPUs, such as the MSI GS66 Stealth 10SFS, Aorus 15G XB, Razer Blade 15 (2020), and Gigabyte Aero 15 OLED XB, all of which are equipped with an RTX 2070 Super Max-Q. See the table below for more details on our comparison group.
Potential Competitors in Comparison
Rating | Date | Model | Weight | Height | Size | Resolution | Price |
|---|---|---|---|---|---|---|---|
| 82.4 % v7 (old) | 02 / 2021 | Asus TUF Dash F15 FX516PR i7-11370H, GeForce RTX 3070 Laptop GPU | 2 kg | 20 mm | 15.60" | 1920x1080 | |
| 83.8 % v7 (old) | 02 / 2021 | Asus ROG Zephyrus G15 GA503Q R9 5900HS, GeForce RTX 3080 Laptop GPU | 2 kg | 20 mm | 15.60" | 2560x1440 | |
| 82.8 % v7 (old) | 05 / 2020 | MSI GS66 Stealth 10SFS i9-10980HK, GeForce RTX 2070 Super Max-Q | 2.2 kg | 20 mm | 15.60" | 1920x1080 | |
| 86.5 % v7 (old) | 08 / 2020 | Aorus 15G XB i7-10875H, GeForce RTX 2070 Super Max-Q | 2.3 kg | 25 mm | 15.60" | 1920x1080 | |
| 86.9 % v7 (old) | 08 / 2020 | Razer Blade 15 RTX 2070 Super Max-Q i7-10875H, GeForce RTX 2070 Super Max-Q | 2.1 kg | 17.8 mm | 15.60" | 1920x1080 | |
| 85.8 % v7 (old) | 05 / 2020 | Gigabyte Aero 15 OLED XB-8DE51B0SP i7-10875H, GeForce RTX 2070 Super Max-Q | 2.2 kg | 20 mm | 15.60" | 3840x2160 |
Case
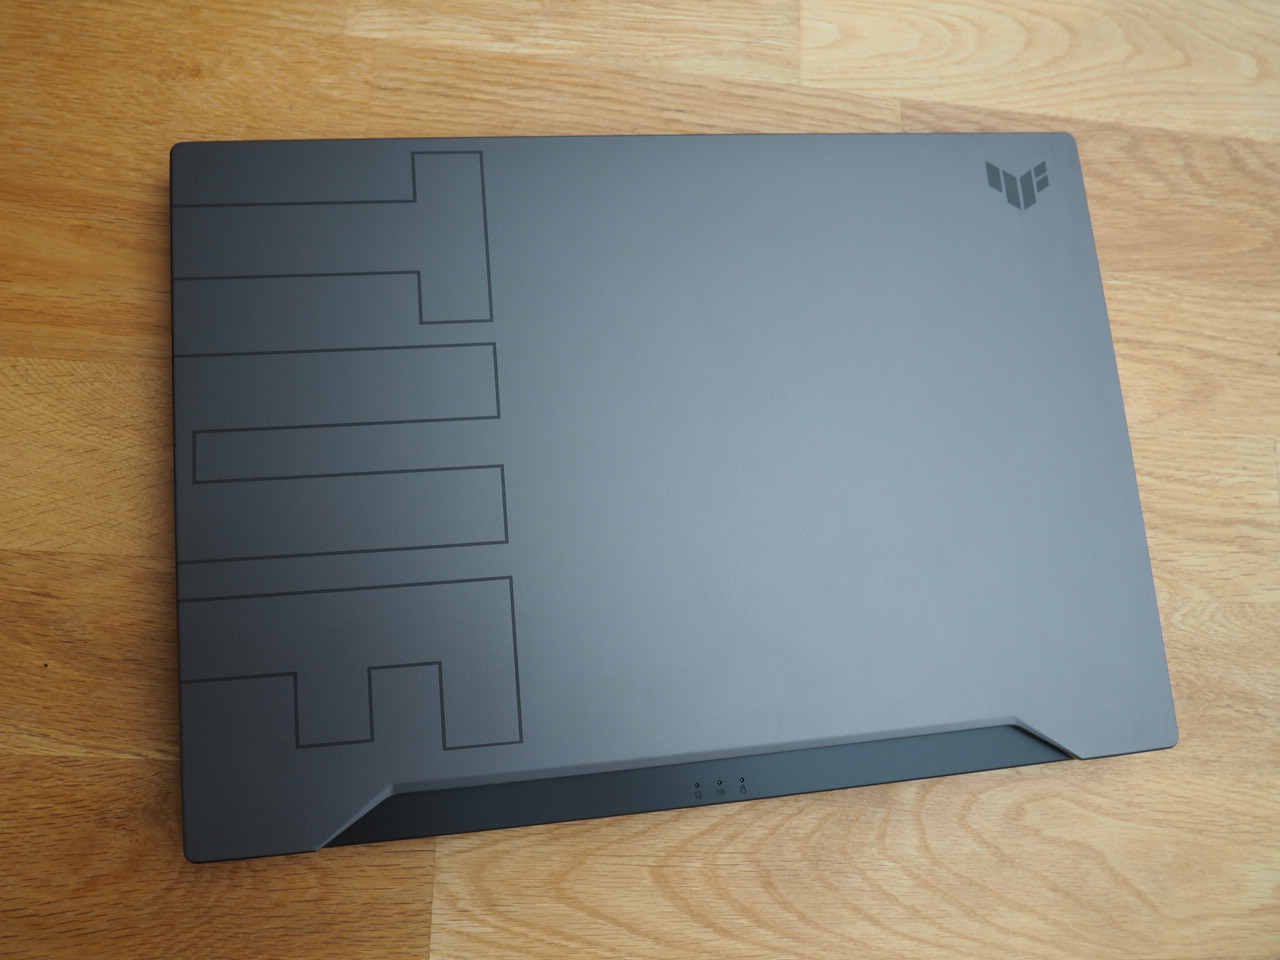
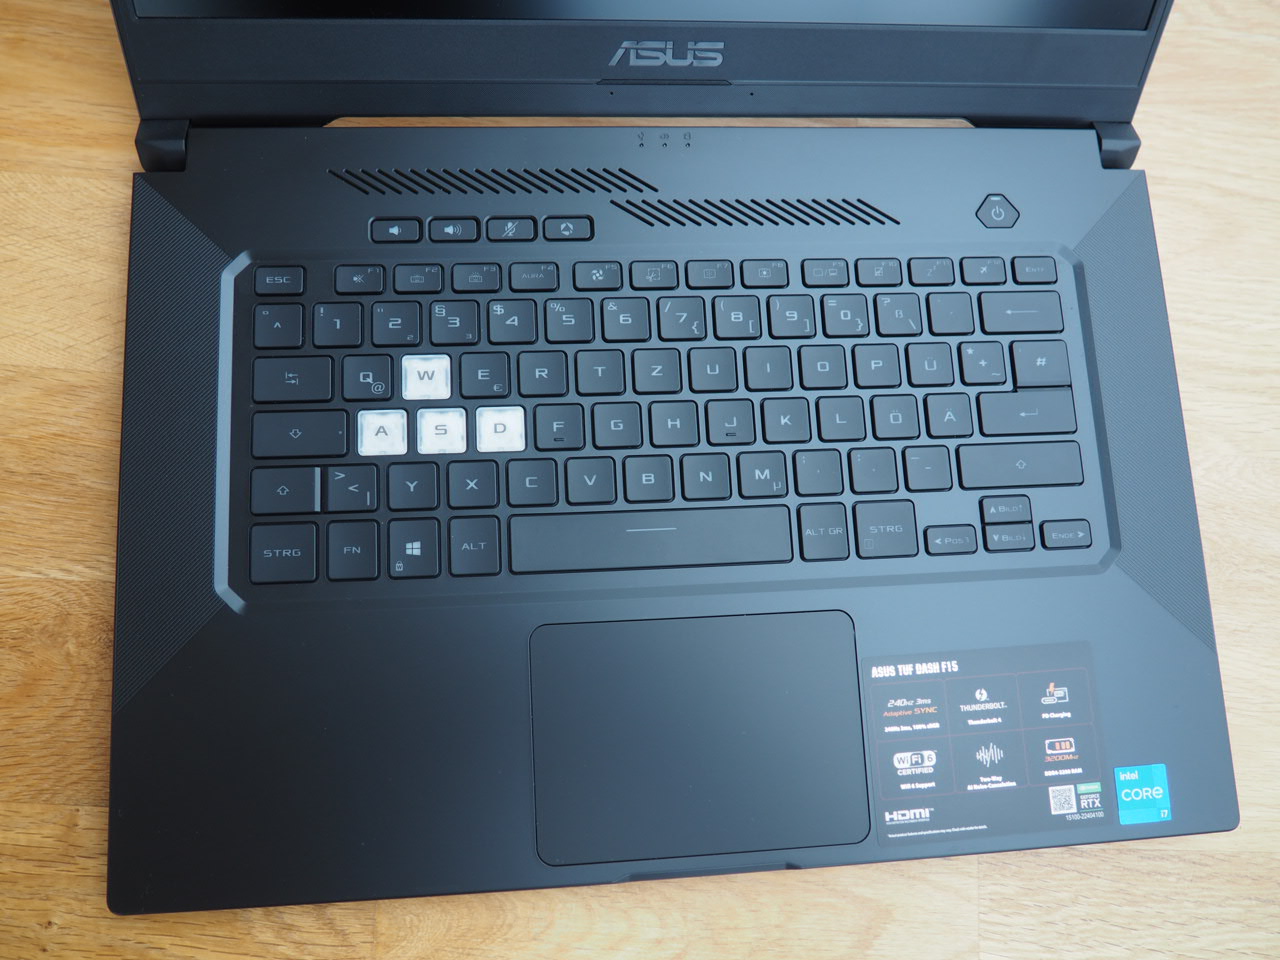
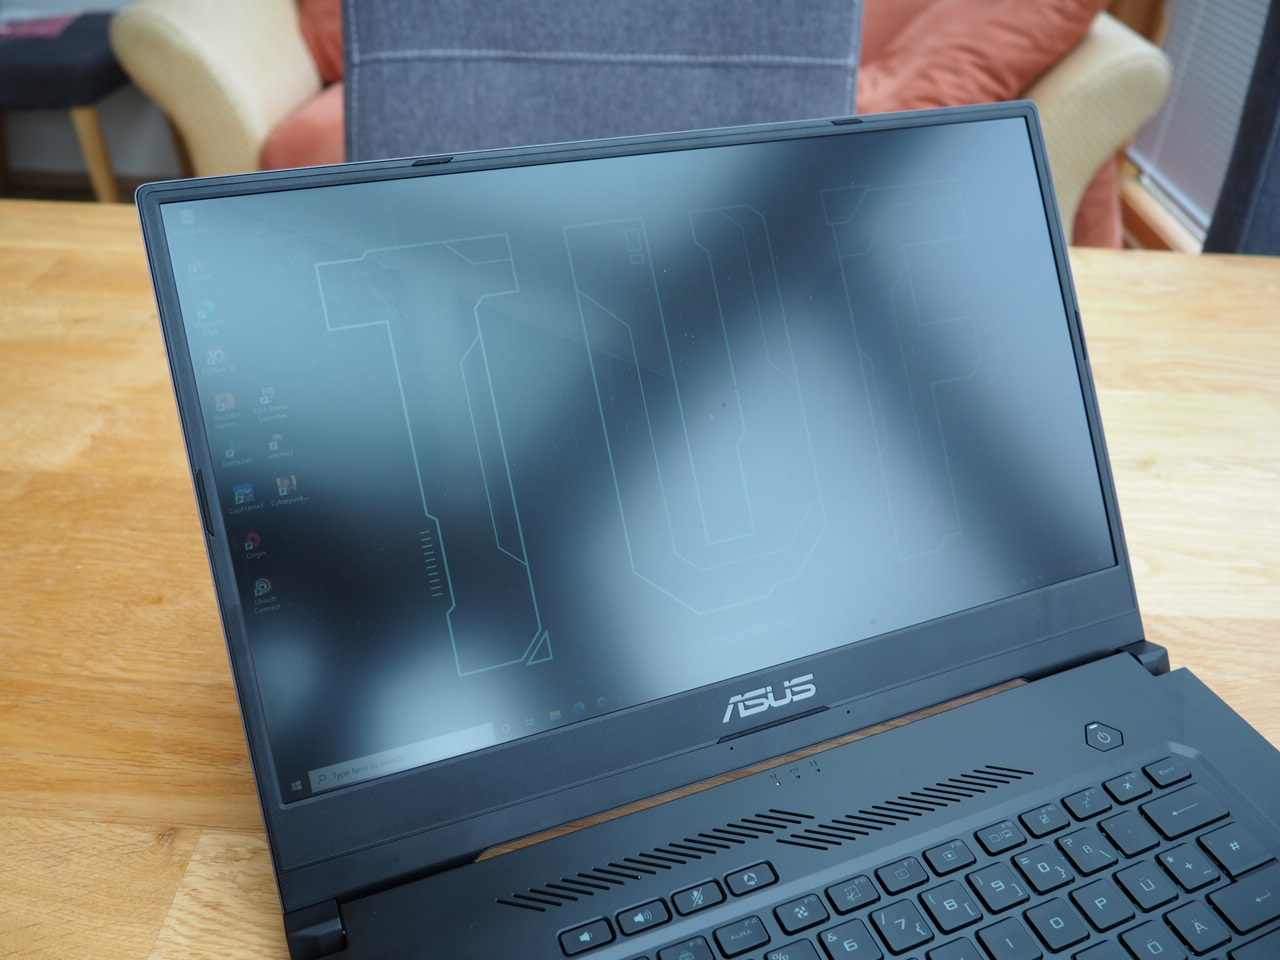
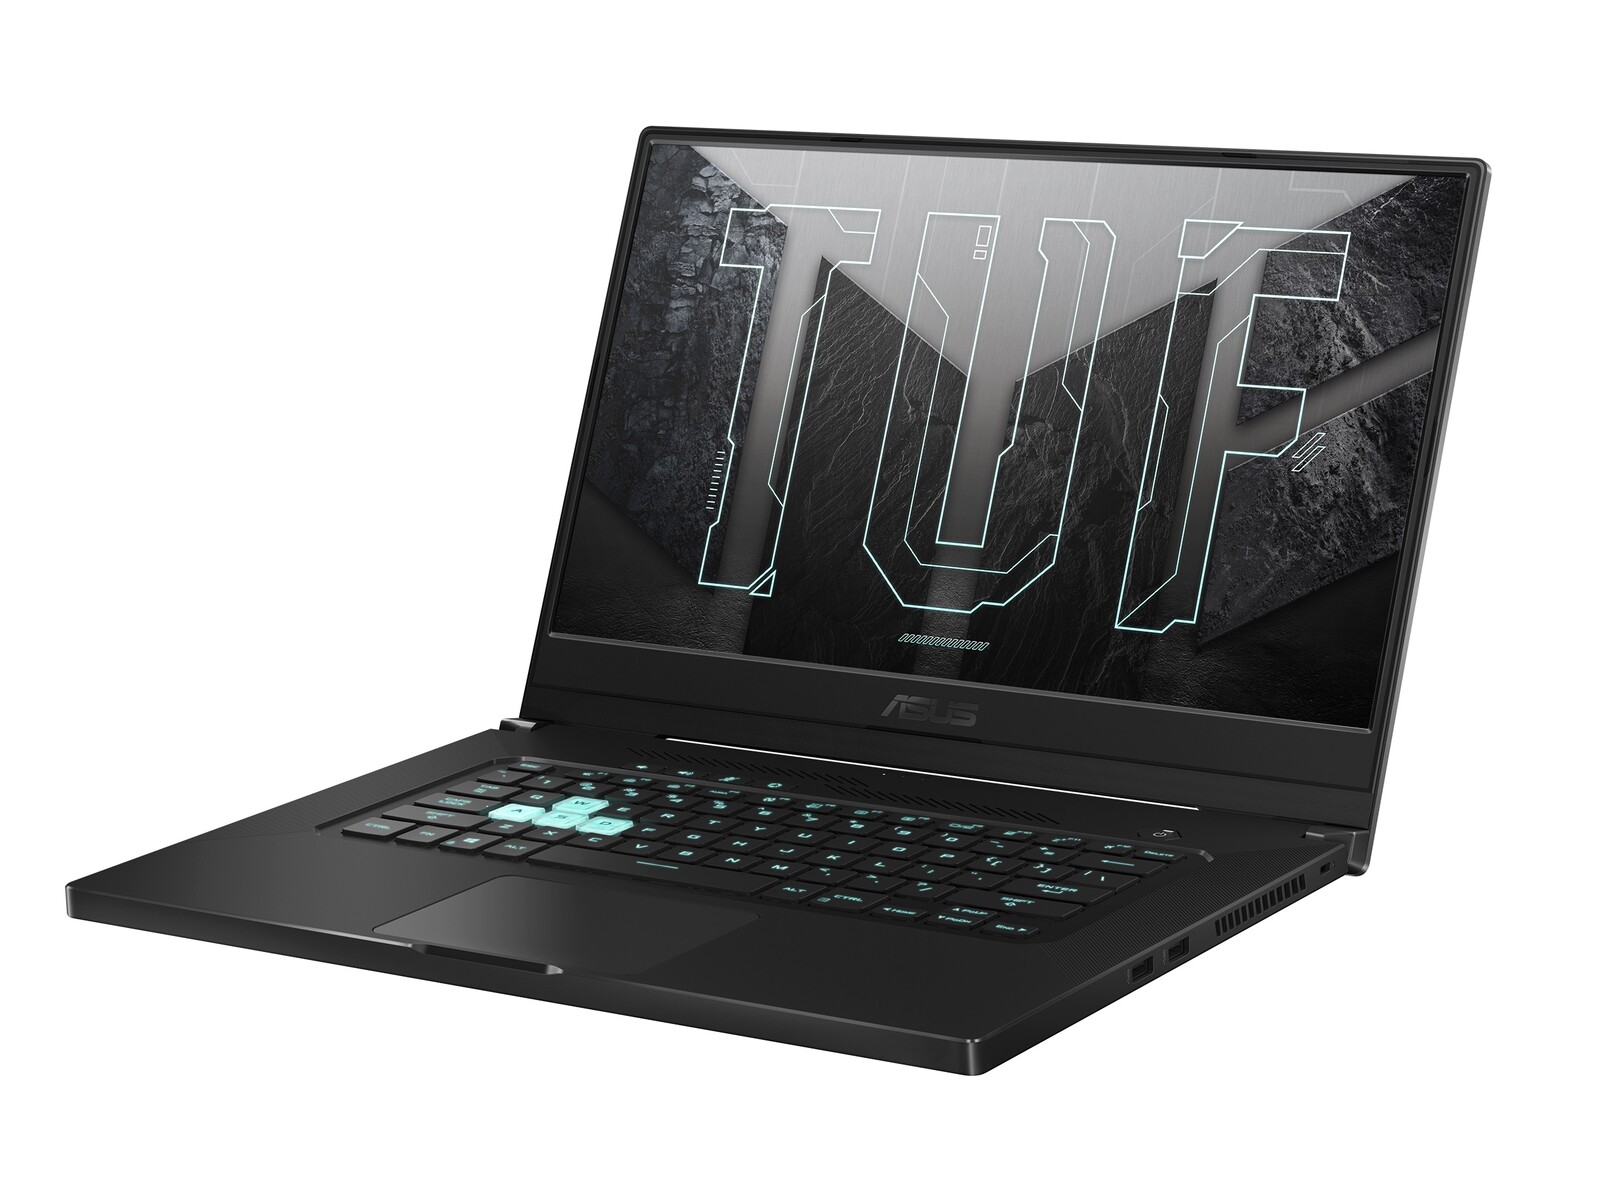
While many gaming notebooks are rather unobtrusive and restrained in their overall design, save for maybe some keyboard backlight extravaganza, the Asus Dash F15 is clearly designed to appeal to extroverts instead. Its striking design and, most importantly, the ginormous TUF logo on the display lid are clear indicators for its gaming heritage and prowess. With that said it’s important to note that its predecessors were even more playful. Our review unit was clad in Eclipse Gray. A much more distinct and eye-catching color choice is Moonlight White, which will be an option for this series. Take a look at the ROG Zephyrus G15 to get a glimpse of what’s to come.
Quality was improved leaps and bounds compared to its predecessors, see for example the metal display lid. However, there is still some room for improvement. Asus deserves particular praise for the device’s superb build quality as we found no inconsistencies or ill-fitted parts on our review unit whatsoever.
Another benefit is the Dash F15’s compact case design. At just 19.9 mm it is agreeably flat and in line with its competitors. Combined with its low weight of just 2.0 kg (4.4 lbs) this 15-inch laptop is definitely a hot candidate for our thin and light gaming laptop top list.
The hinges are solid and firm and managed to hold the display in place without any major teetering, albeit their maximum opening angle is fairly limited (compare that to the Zephyrus G15’s full 180 degrees). Case rigidity is mostly solid save for a not particularly sturdy and thus somewhat wobbly display lid.
Connectivity
Ports
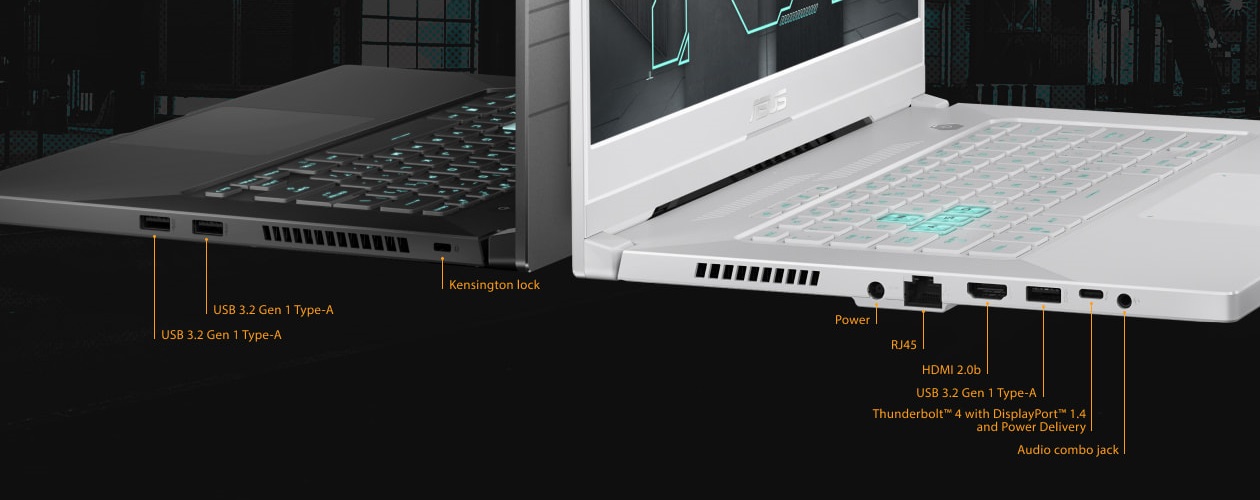
The selection of ports offered by the Asus TUF Dash F15 is up to date. Unlike the Zephyrus G15 that lacks Thunderbolt connectivity due to its AMD processor the more affordable sibling received a single Thunderbolt 4 port with USB 4.0 Type-C, DisplayPort 1.4a, and 100 W Power Delivery capabilities. It also features an HDMI 2.0 port, three USB 3.2 Gen 1 Type-A ports, an audio jack, a Kensington lock, and even an RJ45 ethernet port seldom to be found on laptops this thin these days.
Given that most ports are located at the front on the left-hand side this notebook is made primarily for right-handed users (re: use of an external mouse). Unfortunately, the device lacks a card reader and, more importantly, a webcam. Given the times we are in we honestly fail to grasp what Asus was thinking.
Communication
Wireless communications are handled by Intel’s Wi-Fi 6 AX201 modem. As the name suggests this module supports Bluetooth 5 as well as 802.11 a/b/g/n/ac/ax Wi-Fi. When benchmarked at a distance of 1 m away from our Netgear Nighthawk AX12 reference router the Dash F15 performed adequately overall, although its transmit performance was rather poor and only good enough for last place.
Accessories
Included in the box is a not particularly large 200 W 500 g (1.1 lbs) power supply.
Maintenance
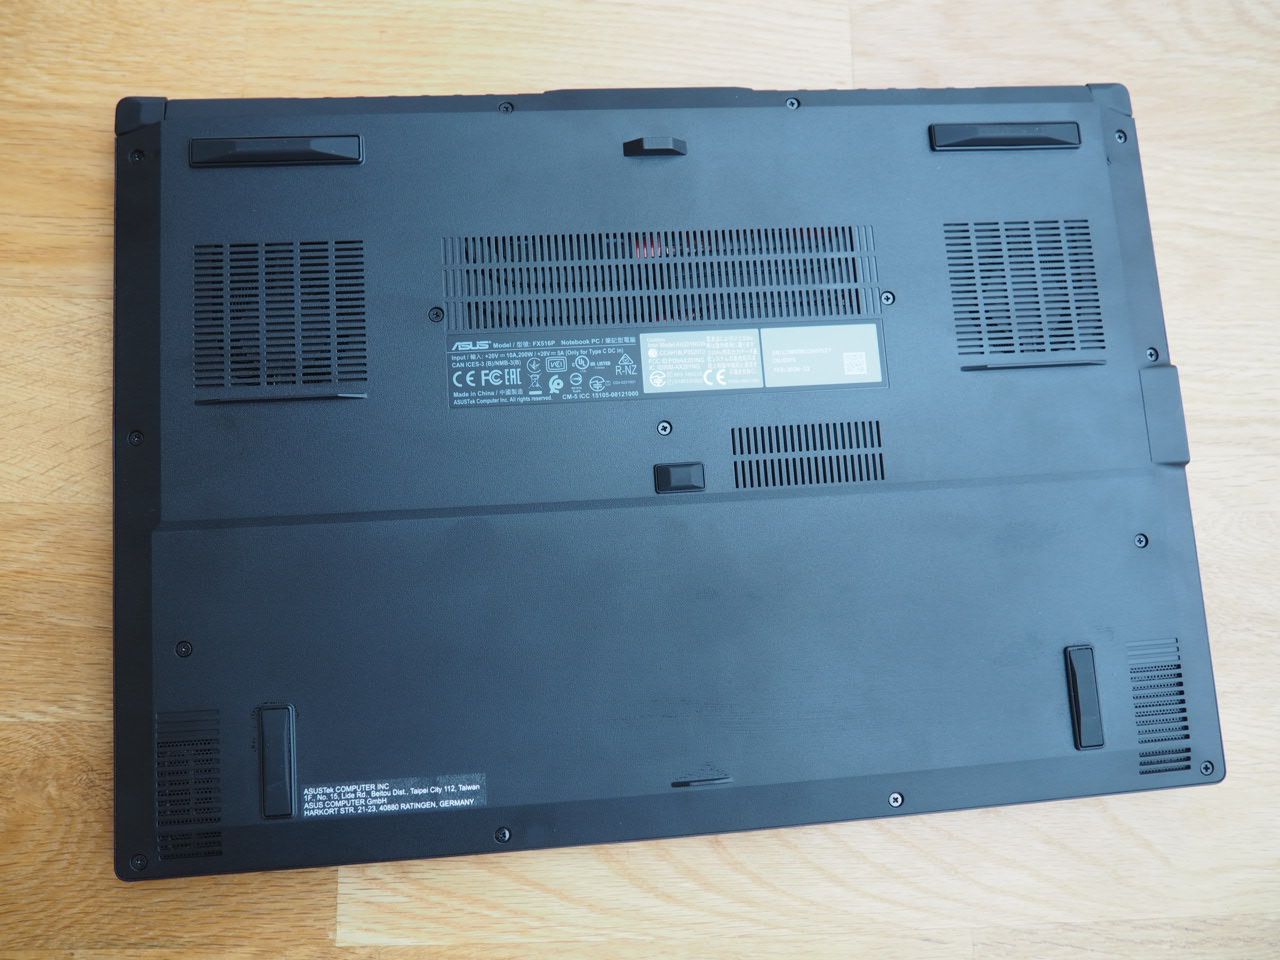
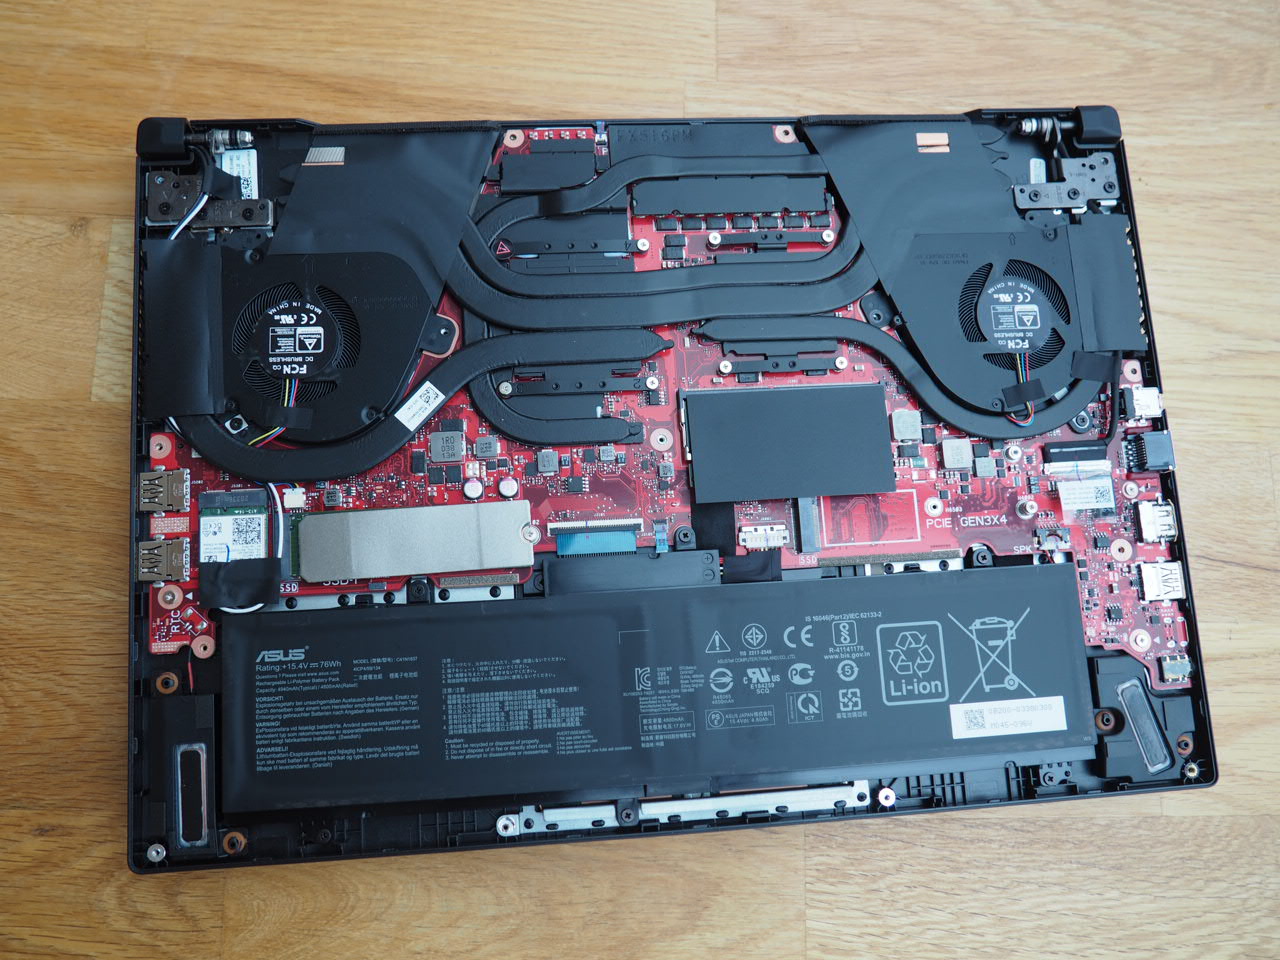
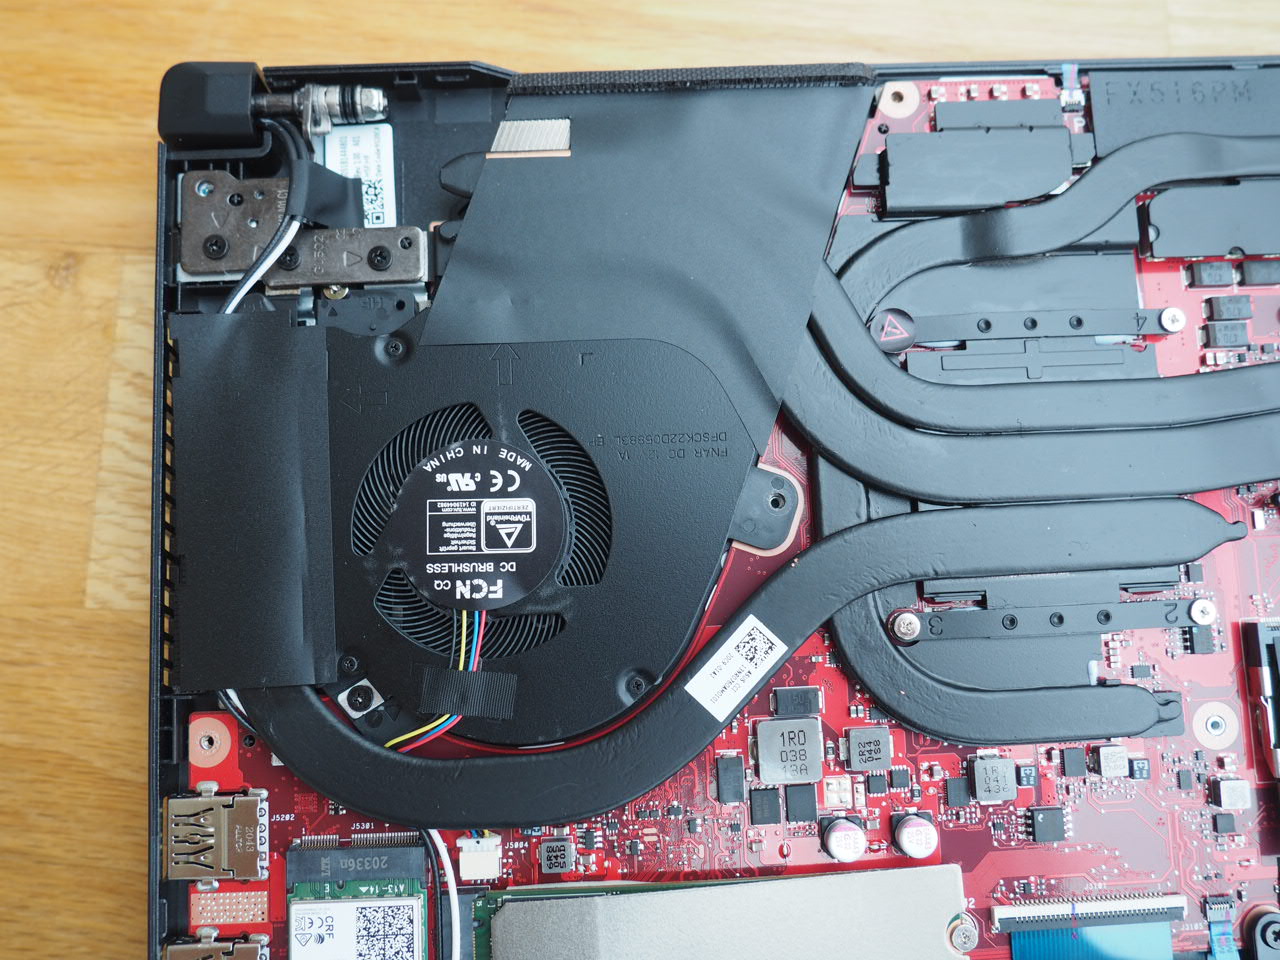
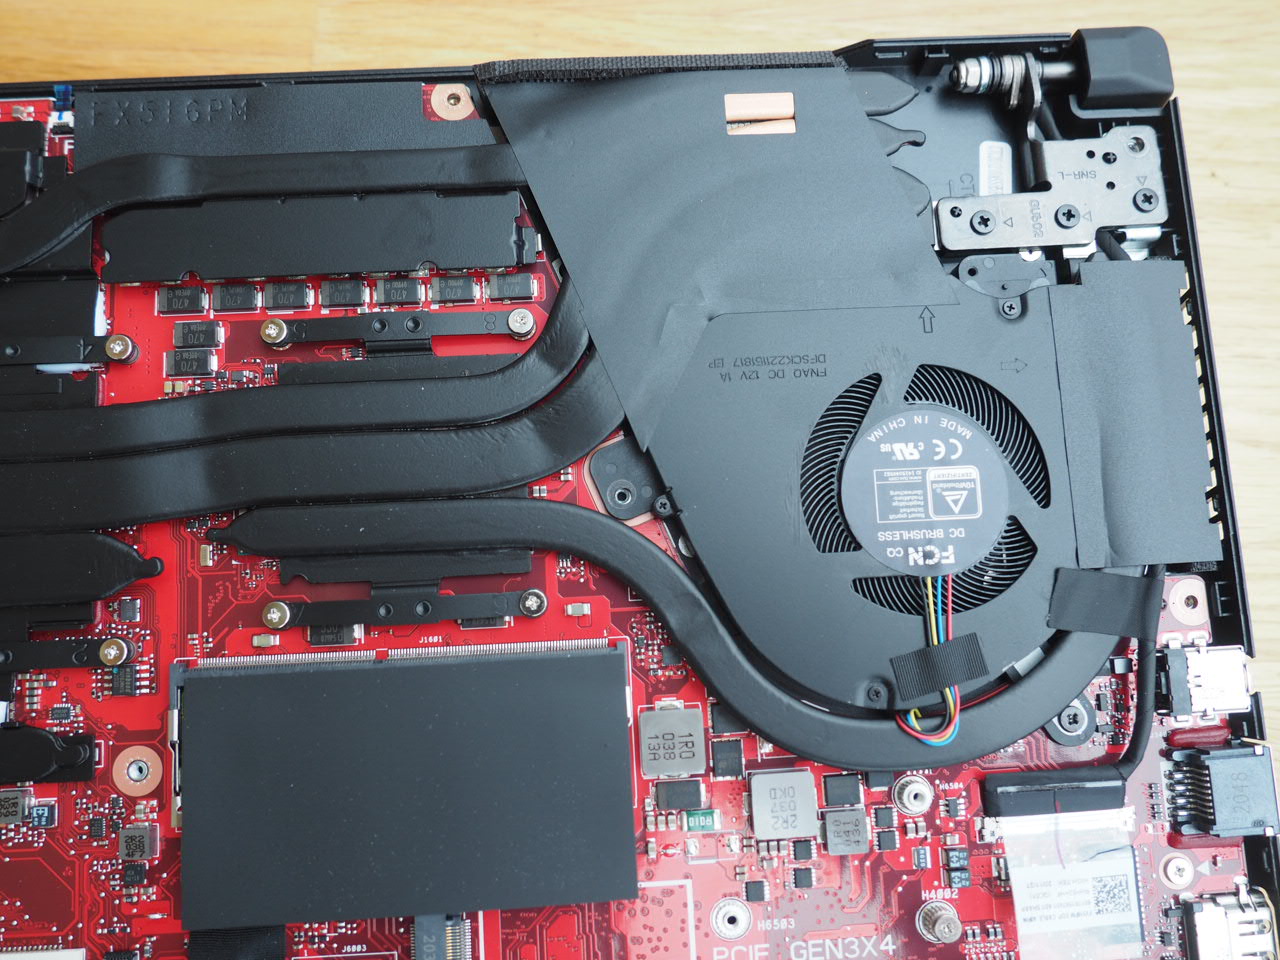
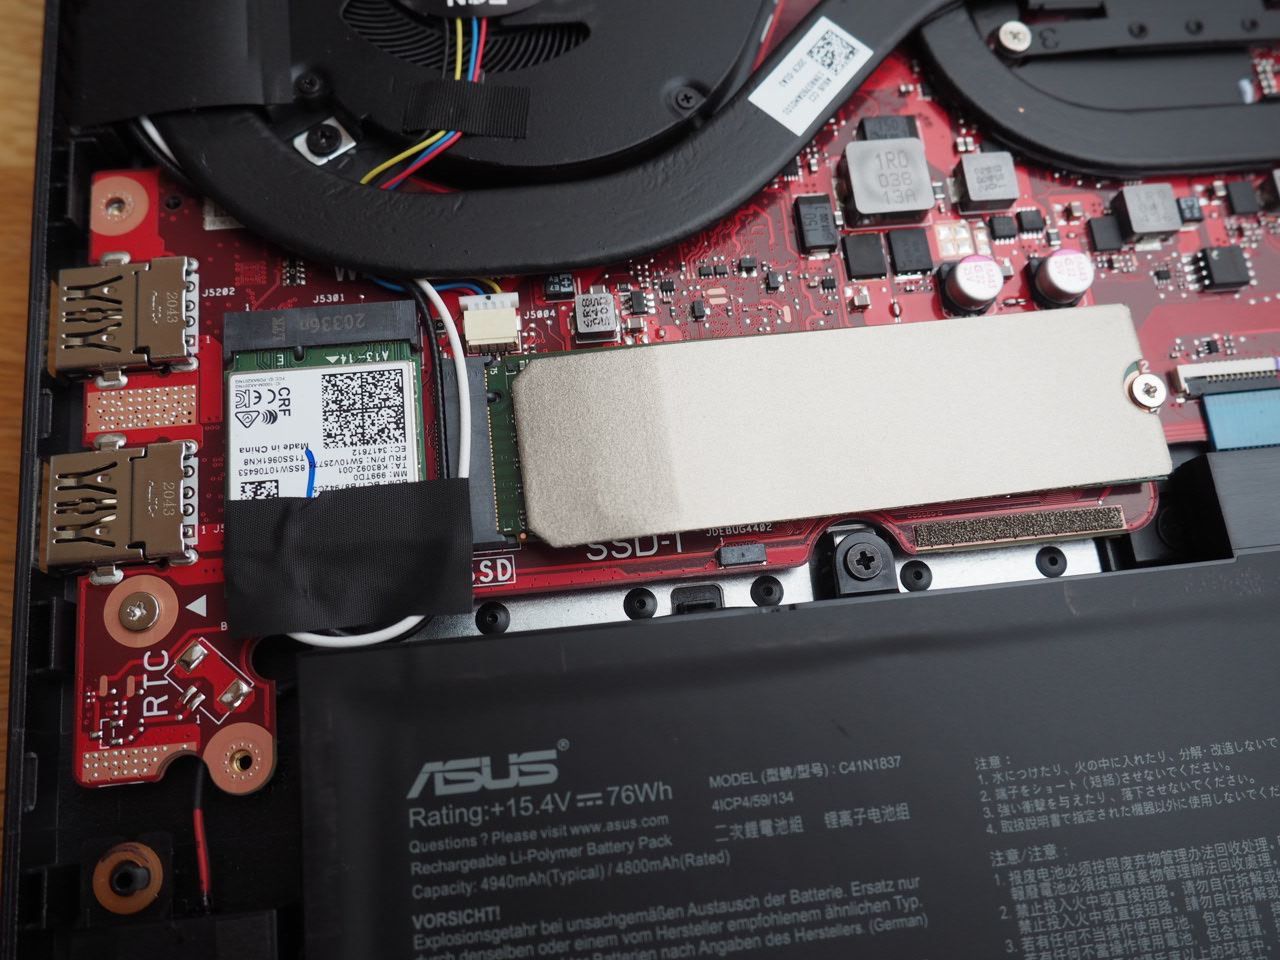
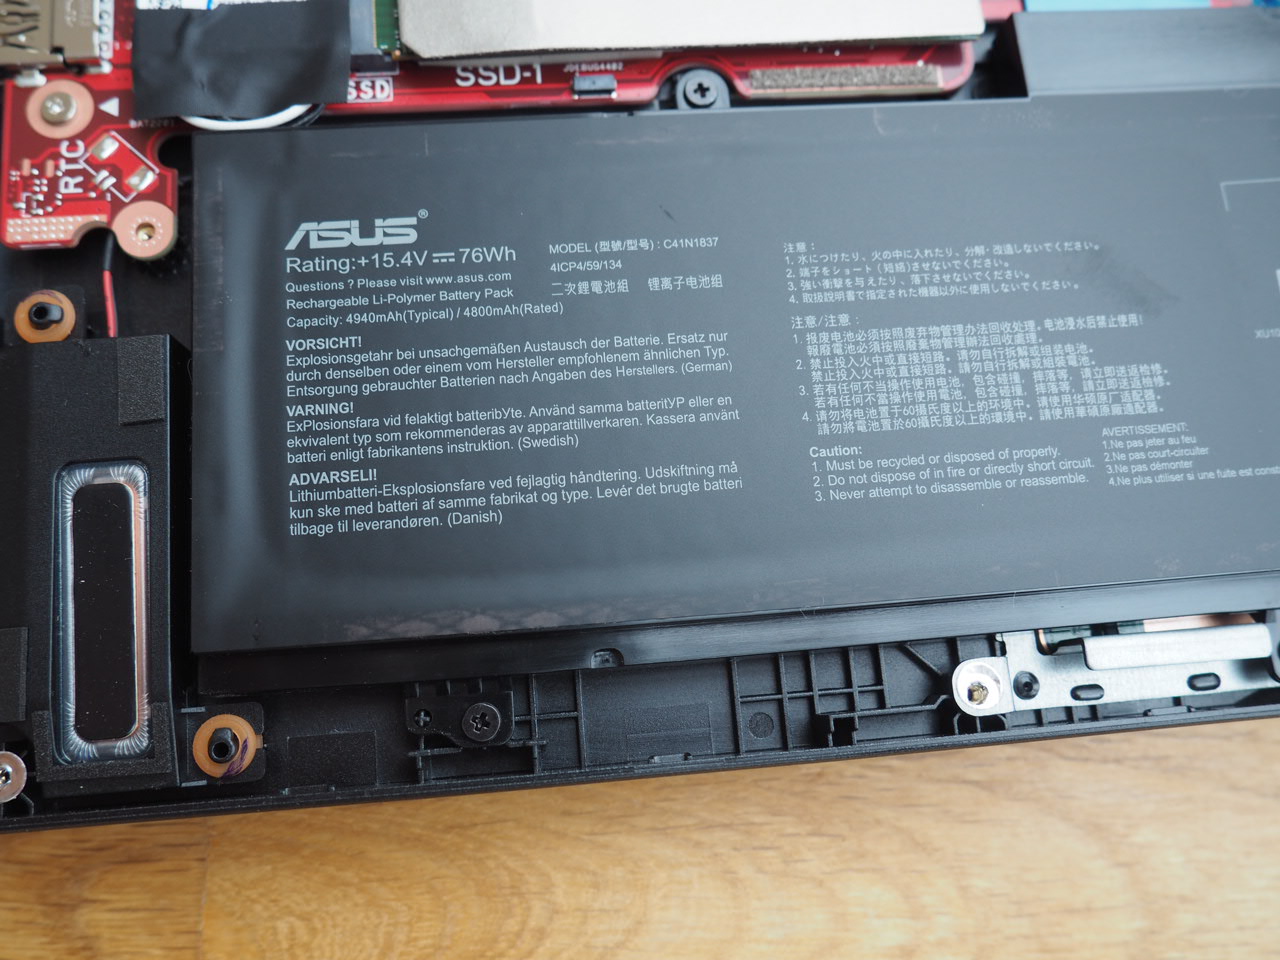
Maintenance options can be considered acceptable overall. While removing the bottom cover requires undoing a total of 15 Phillips screws it can then be easily disassembled once this arduous task has been completed. As you can see on the photos below you get access to the battery, the Wi-Fi modem, a single RAM slot, two M.2 slots, and the cooling system consisting of two fans connected by numerous intertwining heat pipes.
Warranty
Warranty depends on country of purchase. European customers get 24 months while US customers are limited to just 12 months.
Input Devices
Keyboard
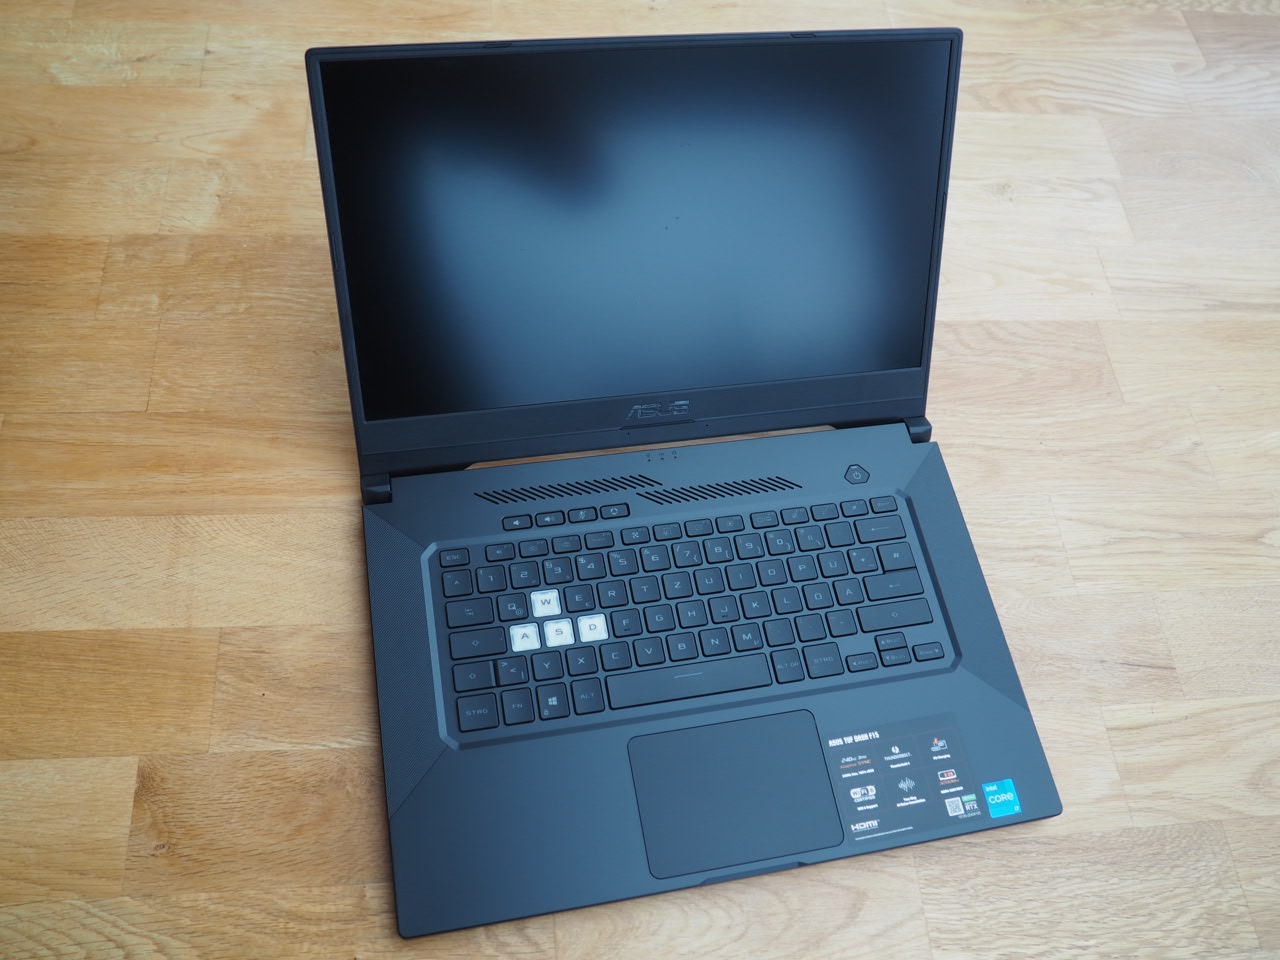
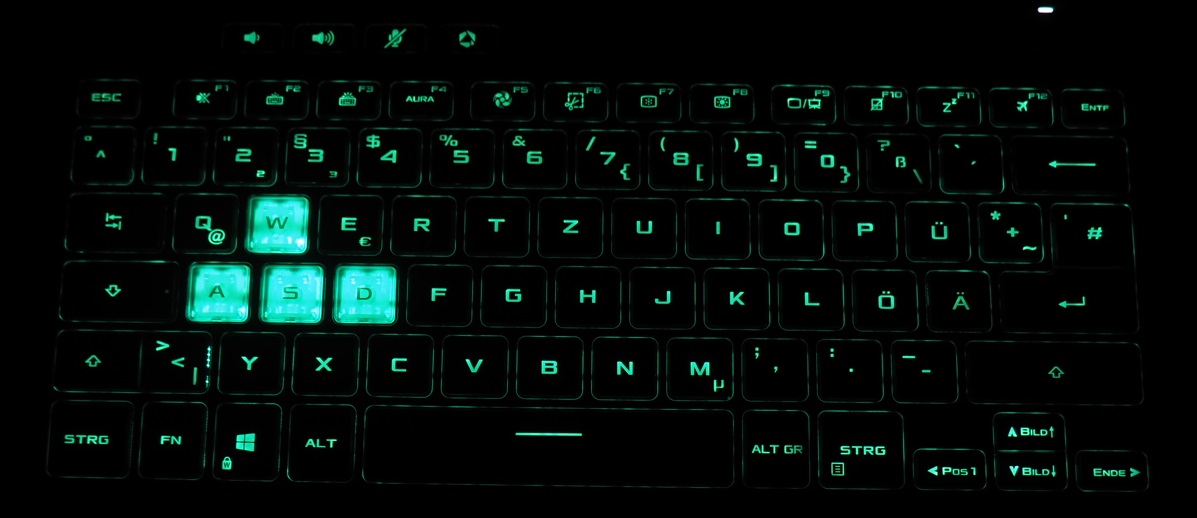
Apart from its backlight (turquoise instead of white) and its translucent WASD keys the keyboard is identical to that of the Zephyrus G15, including all of its respective pros and cons. While accentuation point and keystroke made for a nice compromise between soft and hard that we enjoyed very much the keyboard layout itself is not particularly sensible, at least on the German model we had in review. Take for example the single-spaced return key or the missing Insert and Print keys. The missing numpad will certainly be a point of contention, much unlike the fact that the Dash F15’s arrow keys are simply too tiny to be used as controls for computer games
Touchpad
The touchpad worked well overall. Its smooth surface offered practically no resistance to our fingertips and its surface was adequately large. Since it is of the clickpad variety without dedicated buttons both left and right click are embedded into the surface itself. Gestures are obviously supported as well, such as for example two-finger zoom or two-finger scrolling, although the latter was not as smooth as expected here and there. Overall precision was immaculate.
Display
Our review unit was equipped with a 240 Hz FHD panel. All things considered the screen was adequate, although its maximum brightness of just 275 nits is not bright enough for outdoor usage and therefore restricts its users to stay indoors.
| |||||||||||||||||||||||||
Brightness Distribution: 91 %
Center on Battery: 286 cd/m²
Contrast: 1144:1 (Black: 0.25 cd/m²)
ΔE ColorChecker Calman: 2.43 | ∀{0.5-29.43 Ø4.71}
calibrated: 0.83
ΔE Greyscale Calman: 3.5 | ∀{0.09-98 Ø4.96}
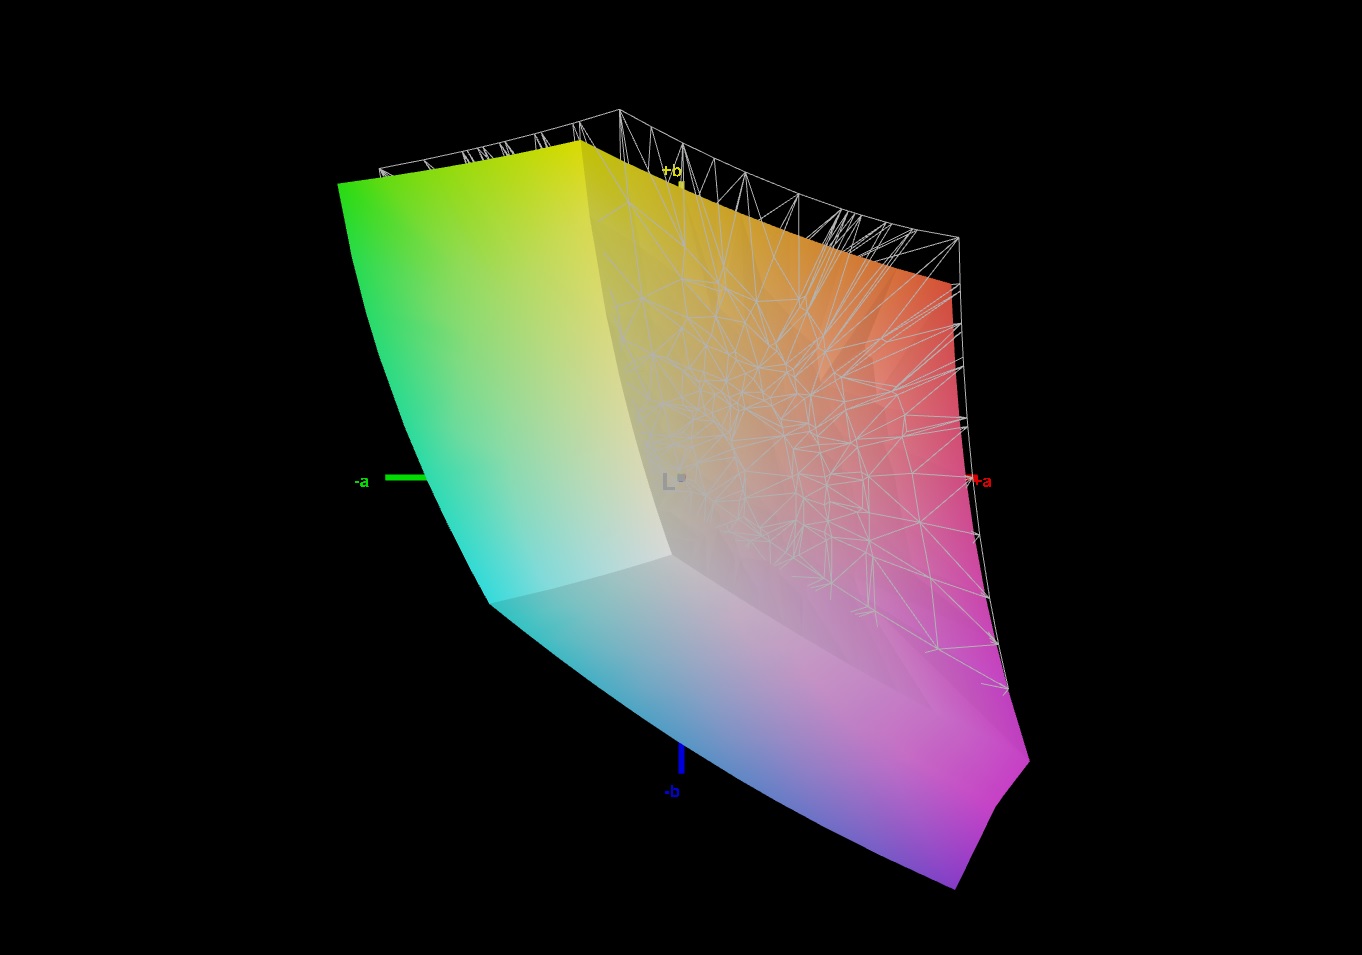
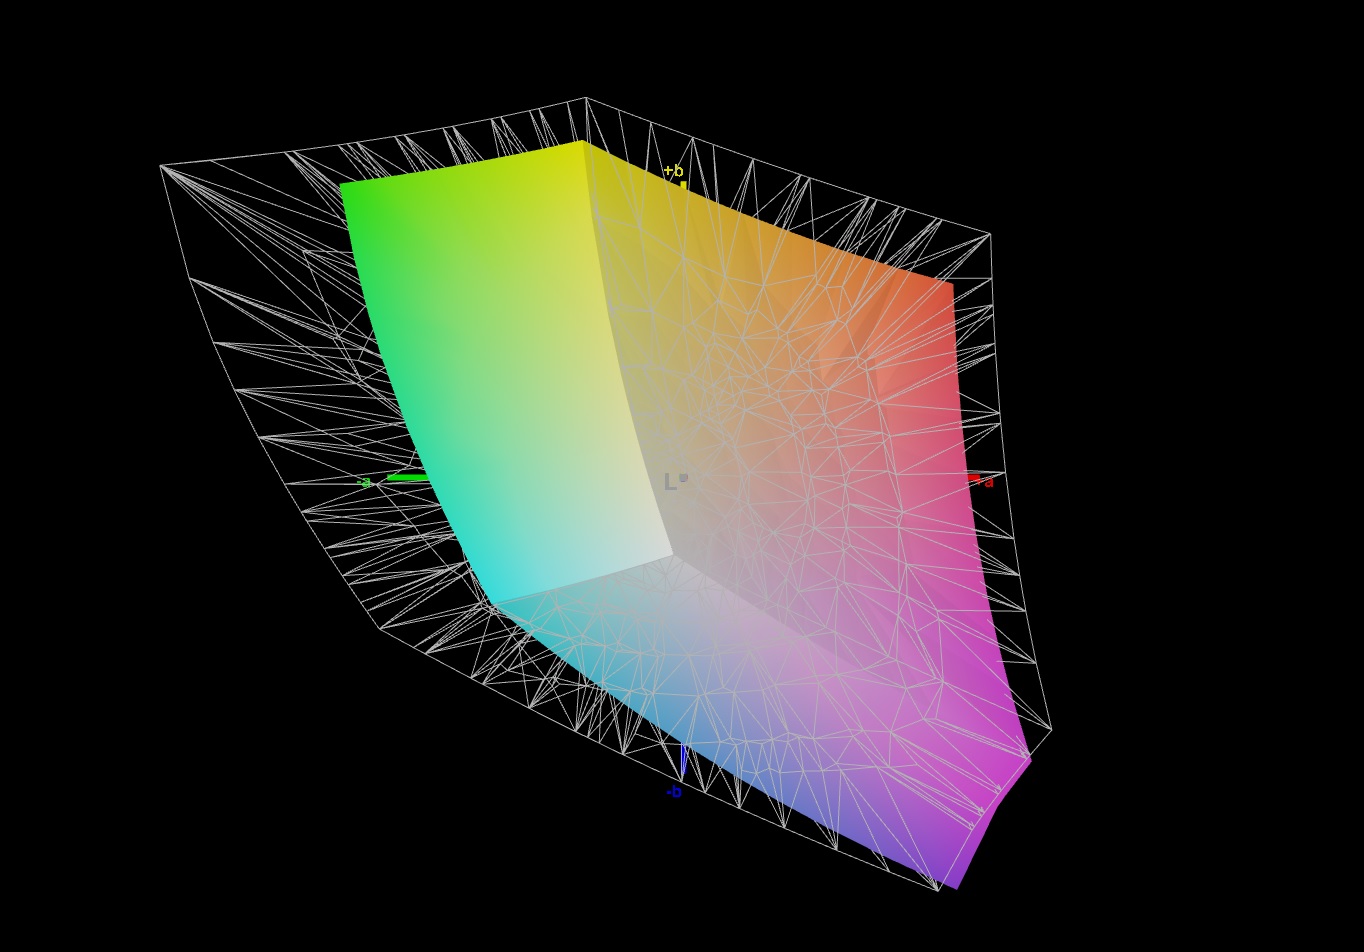
91% sRGB (Argyll 1.6.3 3D)
68% AdobeRGB 1998 (Argyll 1.6.3 3D)
67.9% AdobeRGB 1998 (Argyll 3D)
98.1% sRGB (Argyll 3D)
66.9% Display P3 (Argyll 3D)
Gamma: 2.32
CCT: 7145 K
| Asus TUF Dash F15 FX516PR LQ156M1JW26 (SHP1532), IPS, 1920x1080, 15.6" | Asus ROG Zephyrus G15 GA503Q CMN N156KME-GNA (CMN152A), IPS-Level, 2560x1440, 15.6" | MSI GS66 Stealth 10SFS AUO B156HAN12.0 (AUO328E), IPS, 1920x1080, 15.6" | Aorus 15G XB Sharp LQ156M1JW03, IGZO, 1920x1080, 15.6" | Razer Blade 15 RTX 2070 Super Max-Q AU Optronics B156HAN12.0, IPS, 1920x1080, 15.6" | Gigabyte Aero 15 OLED XB-8DE51B0SP Samsung SDCA029, OLED, 3840x2160, 15.6" | |
|---|---|---|---|---|---|---|
| Display | 25% | 3% | 0% | 3% | 32% | |
| Display P3 Coverage (%) | 66.9 | 97.3 45% | 69.5 4% | 67.2 0% | 69.4 4% | 99.9 49% |
| sRGB Coverage (%) | 98.1 | 99.9 2% | 99.6 2% | 97.8 0% | 98.8 1% | 100 2% |
| AdobeRGB 1998 Coverage (%) | 67.9 | 86.2 27% | 70.8 4% | 68 0% | 70.5 4% | 98.2 45% |
| Response Times | 8% | -7% | -23% | 47% | 82% | |
| Response Time Grey 50% / Grey 80% * (ms) | 12 ? | 8.8 ? 27% | 14 ? -17% | 16 ? -33% | 3.2 ? 73% | 2.2 ? 82% |
| Response Time Black / White * (ms) | 10 ? | 11.2 ? -12% | 9.6 ? 4% | 11.2 ? -12% | 8 ? 20% | 1.8 ? 82% |
| PWM Frequency (Hz) | 23580 ? | 23580 ? | 60 ? | |||
| Screen | -27% | -1% | 7% | -14% | 2% | |
| Brightness middle (cd/m²) | 286 | 327 14% | 316 10% | 264 -8% | 345.4 21% | 385 35% |
| Brightness (cd/m²) | 275 | 309 12% | 311 13% | 248 -10% | 342 24% | 390 42% |
| Brightness Distribution (%) | 91 | 89 -2% | 92 1% | 89 -2% | 90 -1% | 93 2% |
| Black Level * (cd/m²) | 0.25 | 0.33 -32% | 0.21 16% | 0.3 -20% | 0.34 -36% | |
| Contrast (:1) | 1144 | 991 -13% | 1505 32% | 880 -23% | 1016 -11% | |
| Colorchecker dE 2000 * | 2.43 | 4.49 -85% | 3.03 -25% | 1.21 50% | 3.18 -31% | 2.46 -1% |
| Colorchecker dE 2000 max. * | 6.33 | 8.42 -33% | 7.32 -16% | 3.07 52% | 6.57 -4% | 4.01 37% |
| Colorchecker dE 2000 calibrated * | 0.83 | 2.27 -173% | 1.1 -33% | 0.92 -11% | 1.77 -113% | 2.6 -213% |
| Greyscale dE 2000 * | 3.5 | 4.2 -20% | 3.9 -11% | 1.6 54% | 3.8 -9% | 1.39 60% |
| Gamma | 2.32 95% | 2.173 101% | 2.42 91% | 2.192 100% | 2.15 102% | 2.31 95% |
| CCT | 7145 91% | 7014 93% | 7439 87% | 6340 103% | 7109 91% | 6395 102% |
| Color Space (Percent of AdobeRGB 1998) (%) | 68 | 86 26% | 65 -4% | 68 0% | 64.3 -5% | 98 44% |
| Color Space (Percent of sRGB) (%) | 91 | 99 9% | 100 10% | 90 -1% | 99 9% | 100 10% |
| Total Average (Program / Settings) | 2% /
-13% | -2% /
-1% | -5% /
2% | 12% /
-3% | 39% /
20% |
* ... smaller is better
Gamers, on the other hand, will love this panel. Its high refresh rate and relatively low response times (between 10-12 ms according to our tests) ensure a very smooth experience practically free of tearing. Its viewing angles are very good, as is its high sRGB color gamut of 91 %.
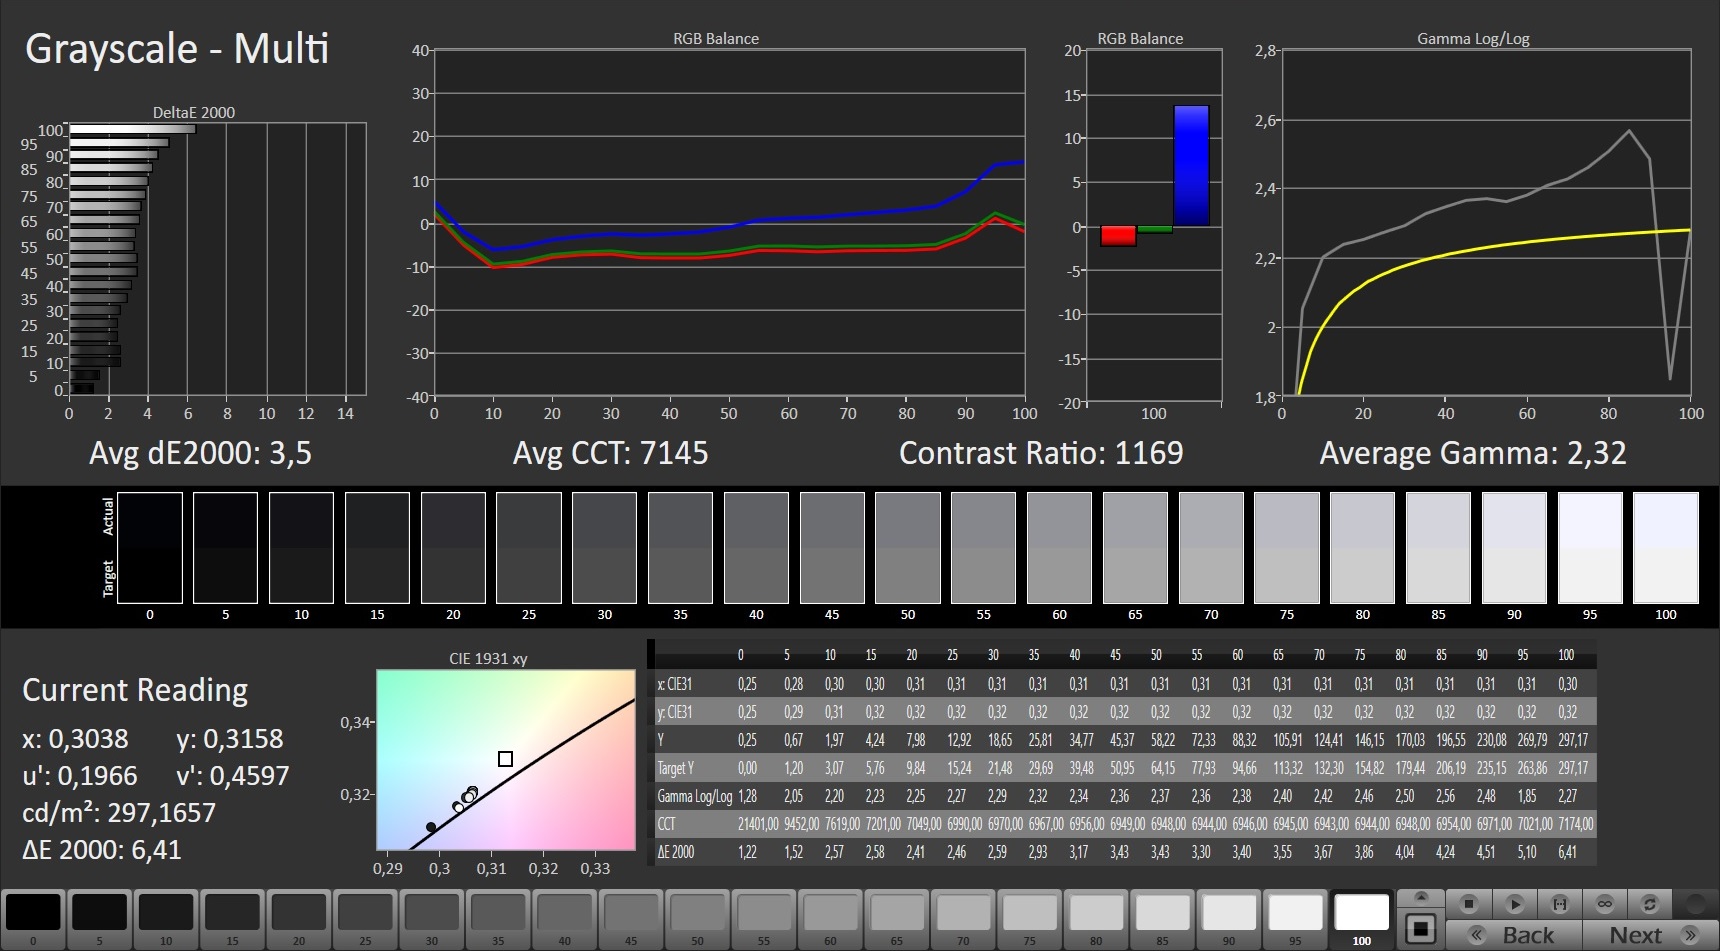
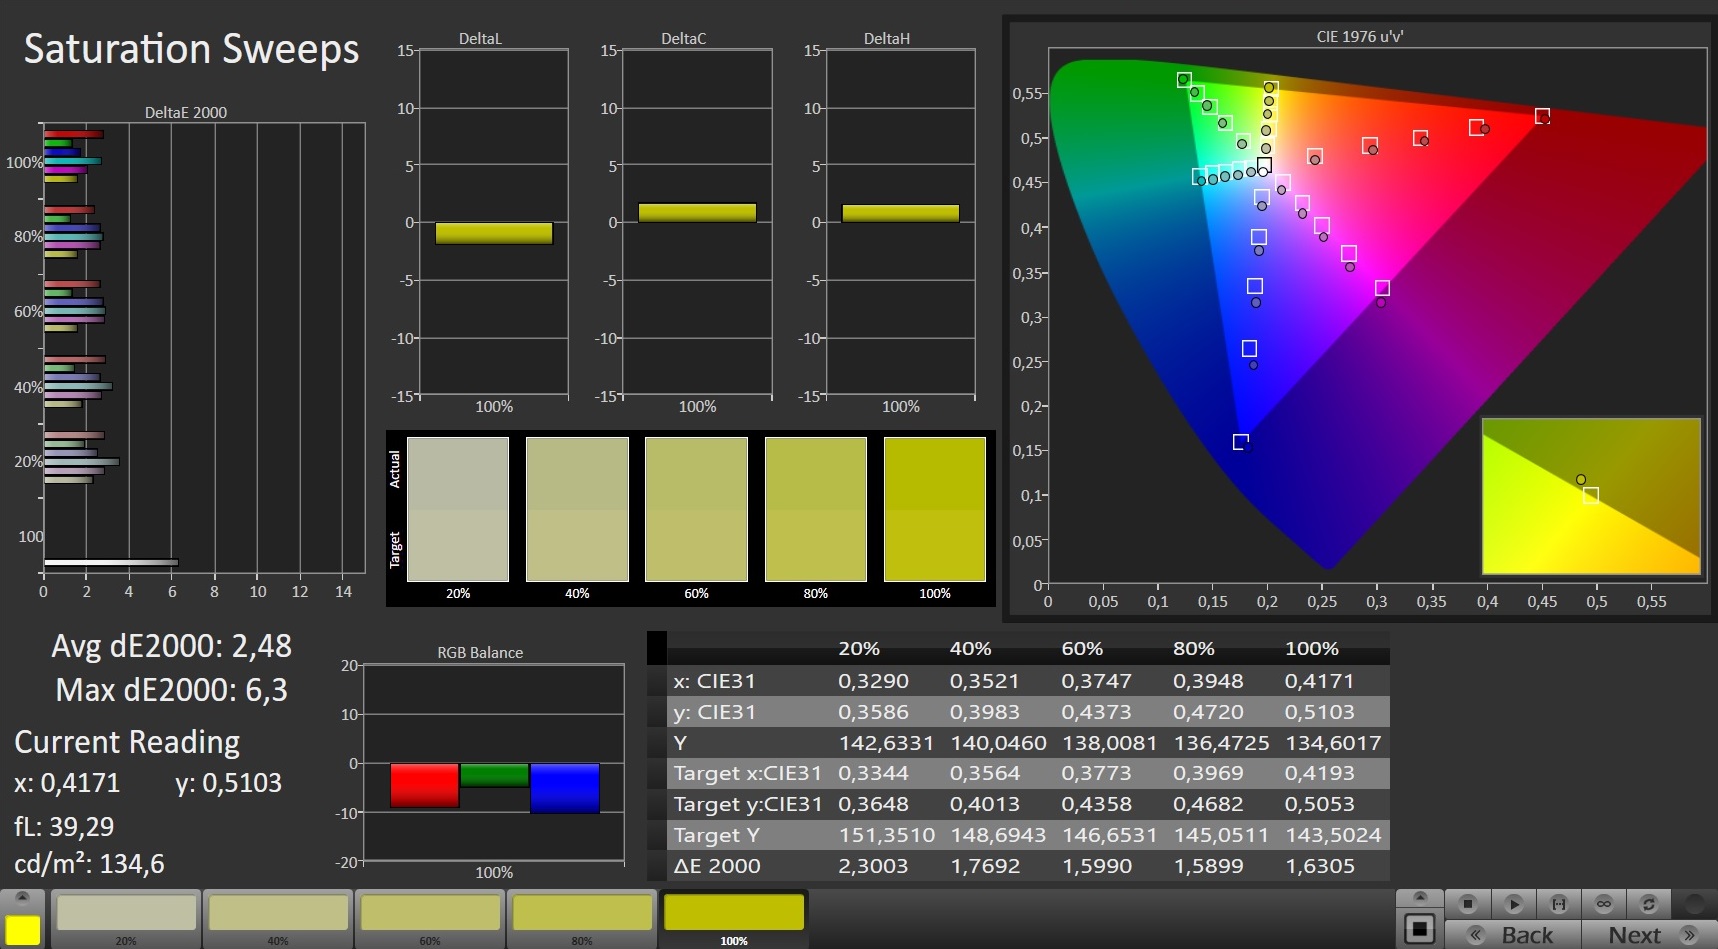
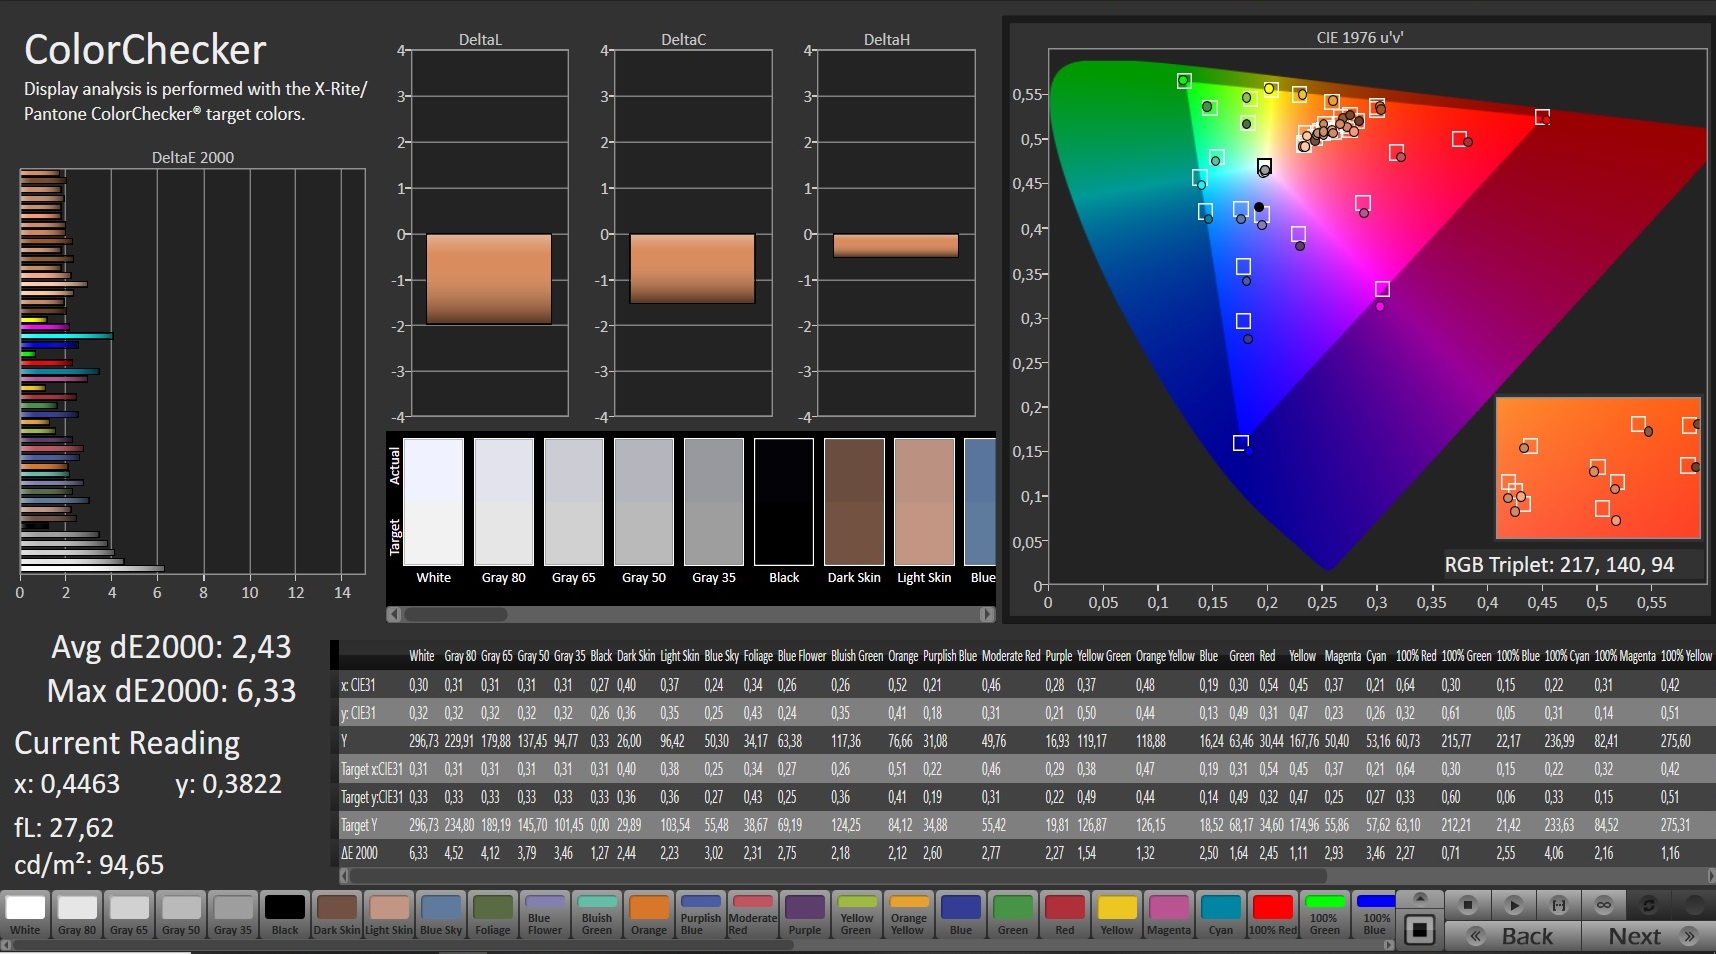
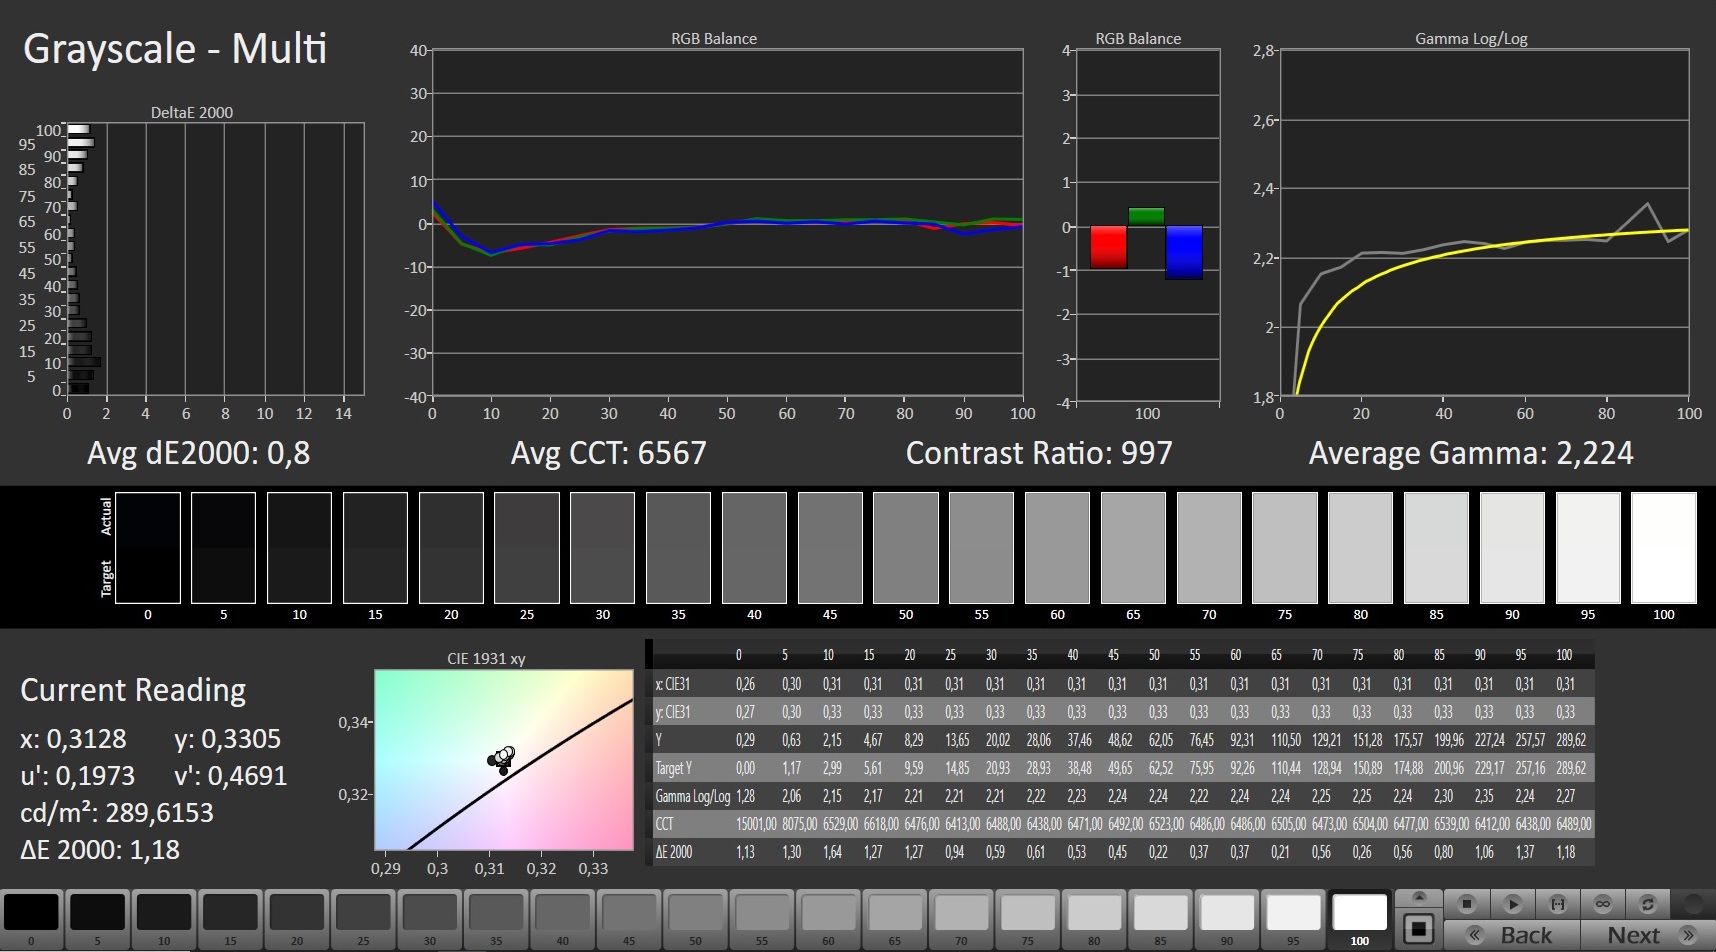
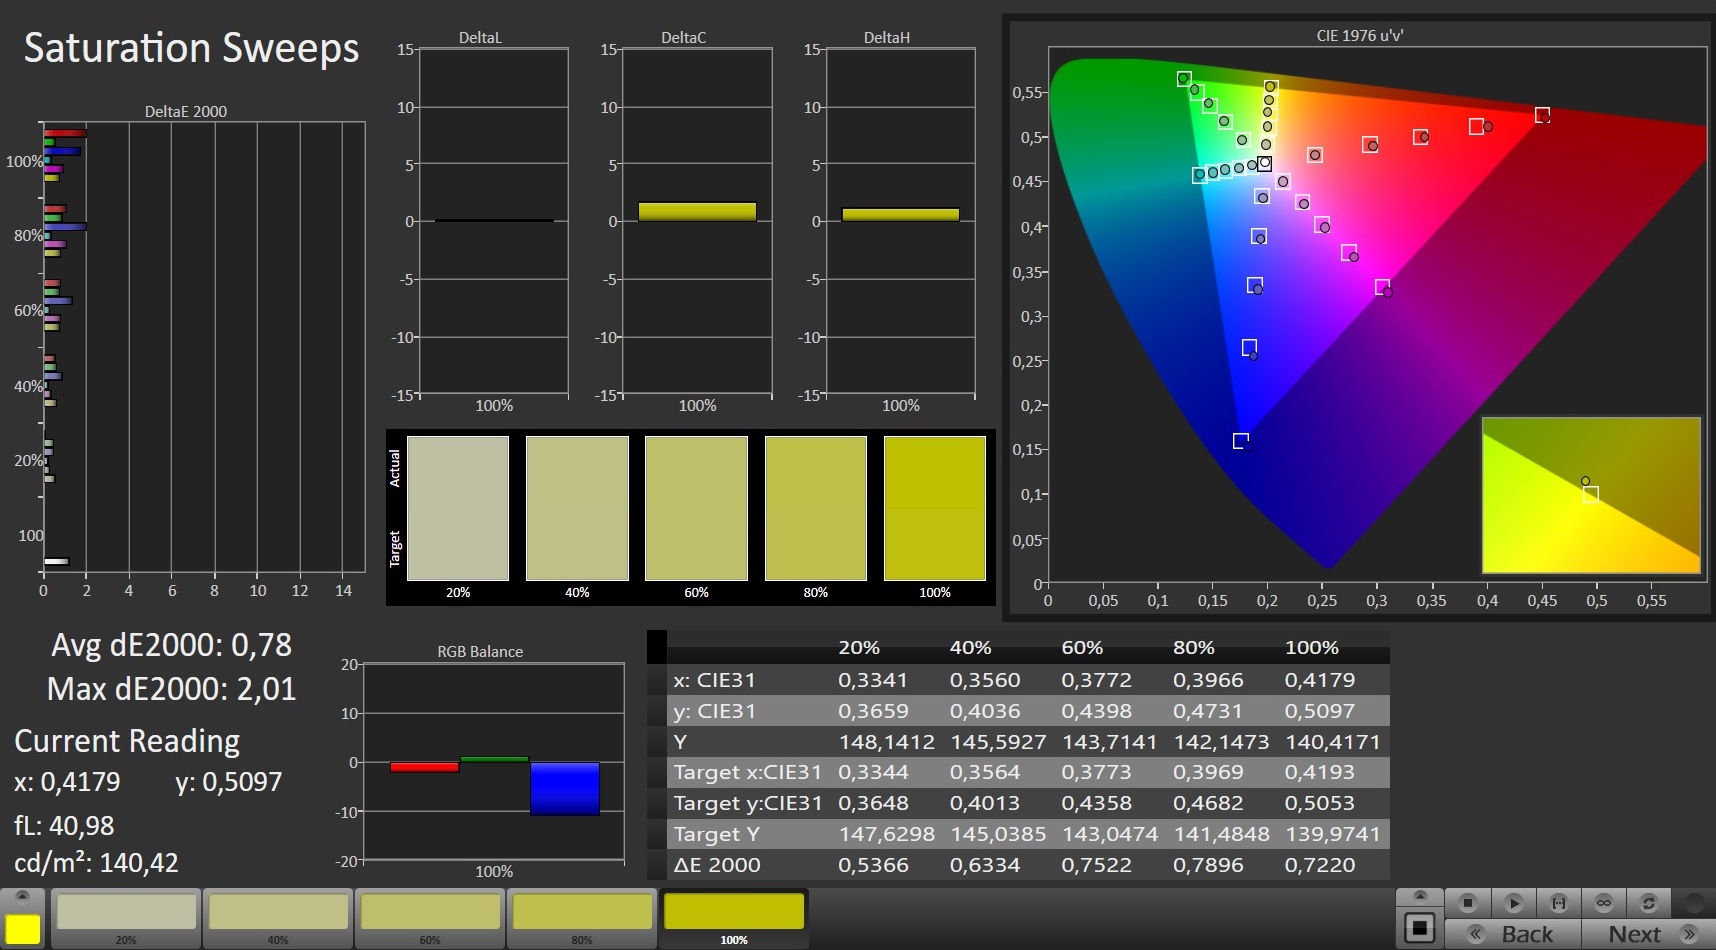
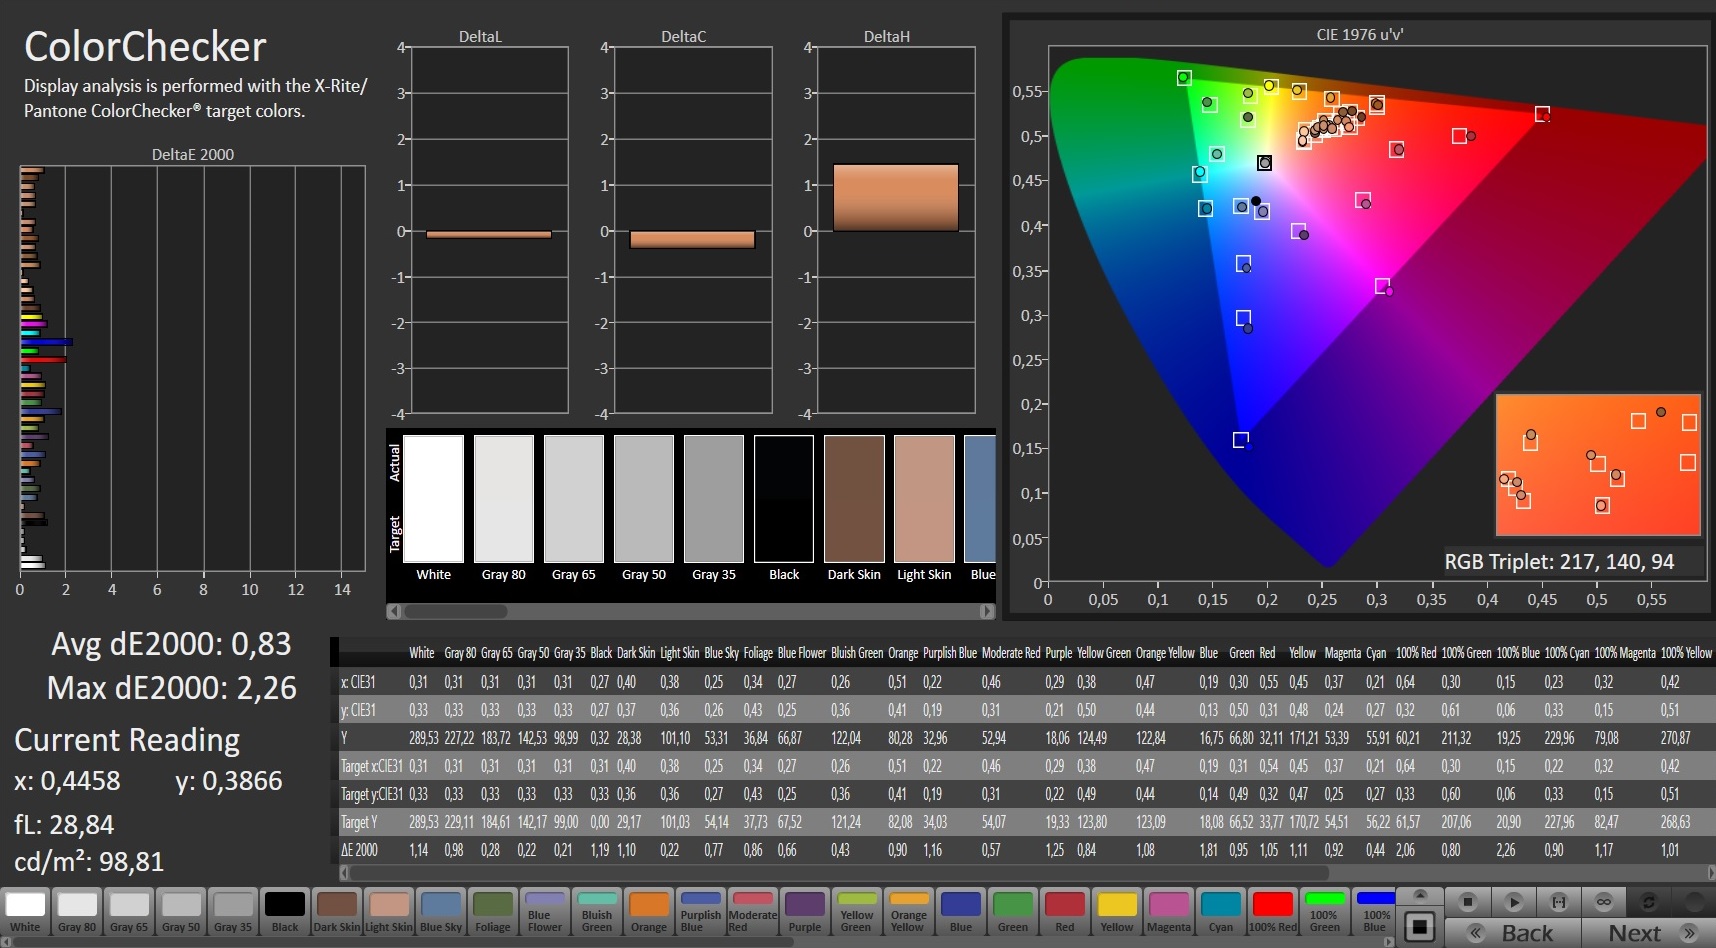
Color accuracy was not half bad either, see above CalMAN screenshots, as was the display’s contrast ratio of more than 1,100:1 ensuring a very vibrant picture.
Even though the display showed some flickering at brightness levels of 31 % and below its frequency of 23 kHz was so high that even sensitive users should not encounter any issues whatsoever.

Display Response Times
| ↔ Response Time Black to White | ||
|---|---|---|
| 10 ms ... rise ↗ and fall ↘ combined | ↗ 5.6 ms rise | 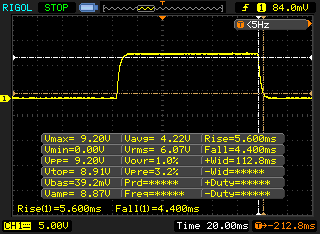 |
| ↘ 4.4 ms fall | ||
| The screen shows good response rates in our tests, but may be too slow for competitive gamers. In comparison, all tested devices range from 0.1 (minimum) to 240 (maximum) ms. » 27 % of all devices are better. This means that the measured response time is better than the average of all tested devices (19.8 ms). | ||
| ↔ Response Time 50% Grey to 80% Grey | ||
| 12 ms ... rise ↗ and fall ↘ combined | ↗ 6.8 ms rise | 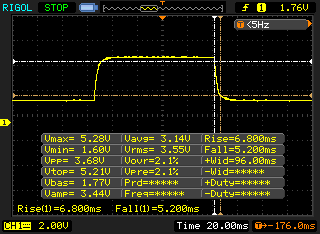 |
| ↘ 5.2 ms fall | ||
| The screen shows good response rates in our tests, but may be too slow for competitive gamers. In comparison, all tested devices range from 0.165 (minimum) to 636 (maximum) ms. » 25 % of all devices are better. This means that the measured response time is better than the average of all tested devices (30.9 ms). | ||
Screen Flickering / PWM (Pulse-Width Modulation)
| Screen flickering / PWM detected | 23580 Hz | ≤ 30 % brightness setting | 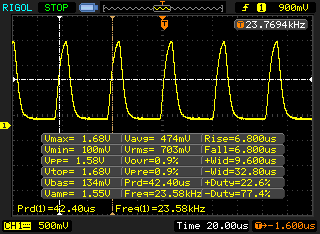 |
The display backlight flickers at 23580 Hz (worst case, e.g., utilizing PWM) Flickering detected at a brightness setting of 30 % and below. There should be no flickering or PWM above this brightness setting. The frequency of 23580 Hz is quite high, so most users sensitive to PWM should not notice any flickering. In comparison: 52 % of all tested devices do not use PWM to dim the display. If PWM was detected, an average of 7744 (minimum: 5 - maximum: 343500) Hz was measured. | |||
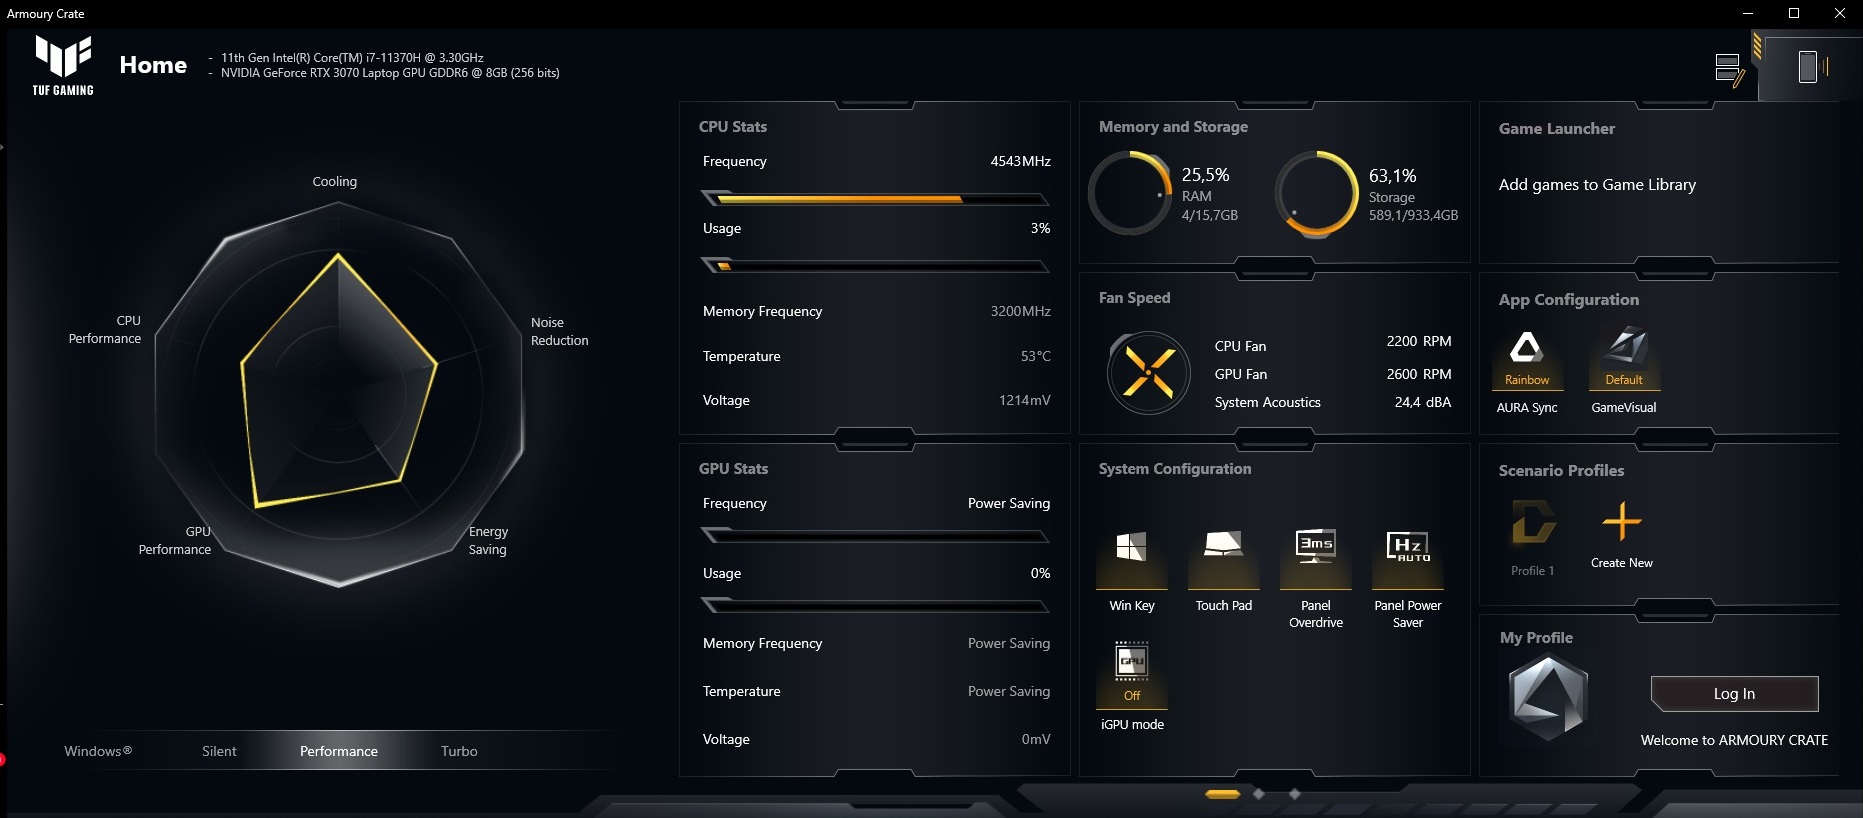
Test Conditions
Using the preinstalled Armoury Crate software users can adjust system performance in various ways. We enabled the Performance profile to run our benchmarks, which should offer a decent balance between performance, power consumption, and temperature as well as noise emissions. Whether or not our theory held true will be revealed later on.
Performance
The Asus TUF Dash F15 FX516P is a high-end 15-inch gaming notebook. Our review unit was well-equipped for years to come as long as you refrain from connecting it to high-resolution displays (WQHD/UHD). Its processor, on the other hand, might become the primary bottleneck sooner or later due to its low core count.
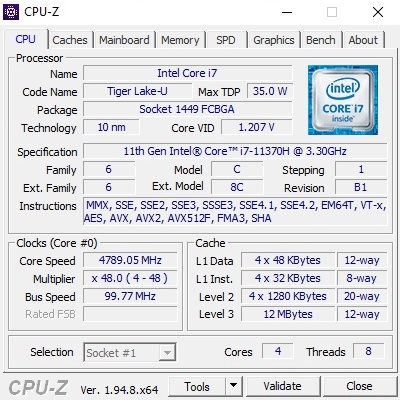
Processor
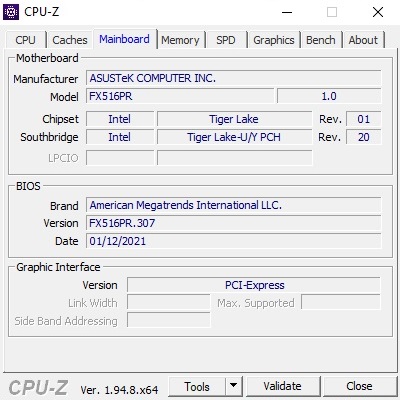
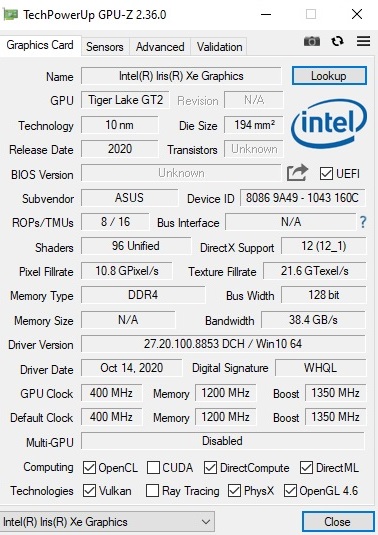
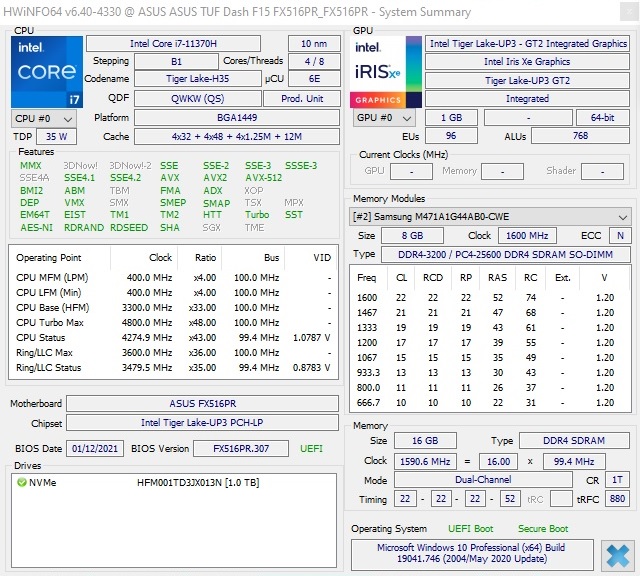
After many years of not being able to compete with AMD in regard to manufacturing processes Intel’s Tiger Lake finally caught up with its main Ryzen competitors again as it is manufactured in a more up to date 10 nm instead of the previous 14 nm process. This should in theory improve energy efficiency. Unfortunately, there were no six or eight-core Tiger Lake notebook CPUs available at the time of writing, and mobile Tiger Lake was thus limited to quad-core CPUs only.
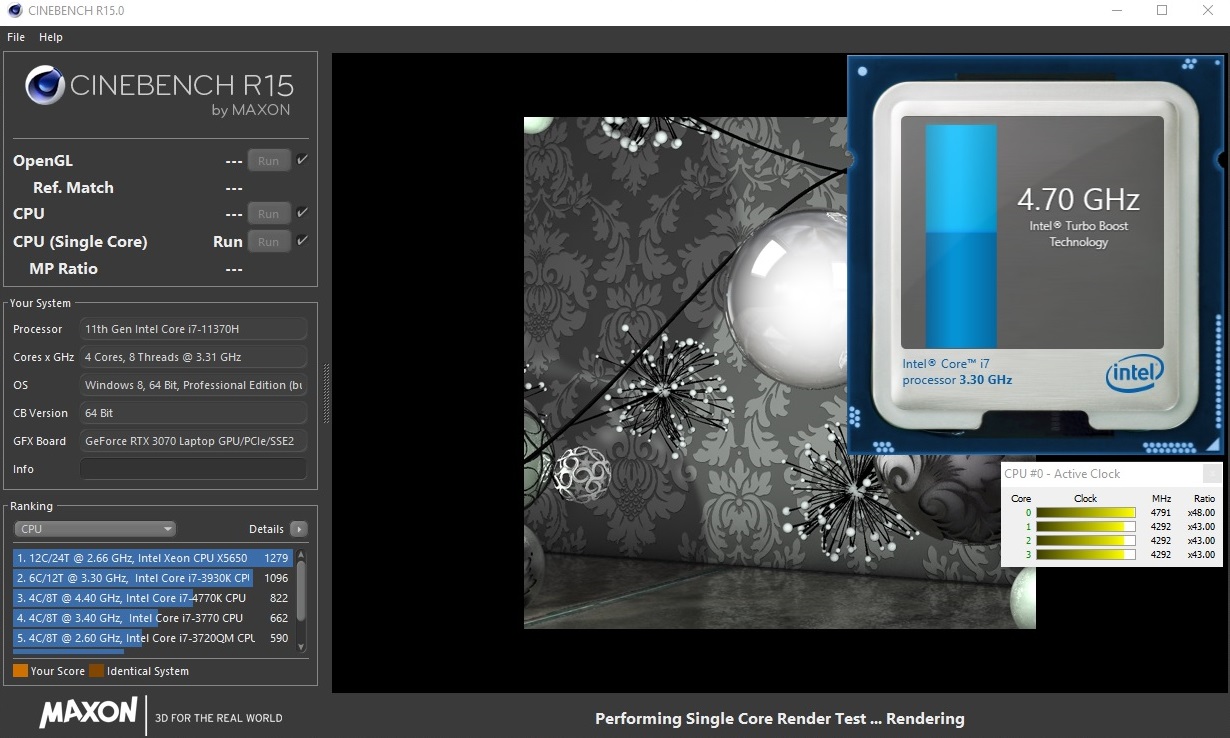
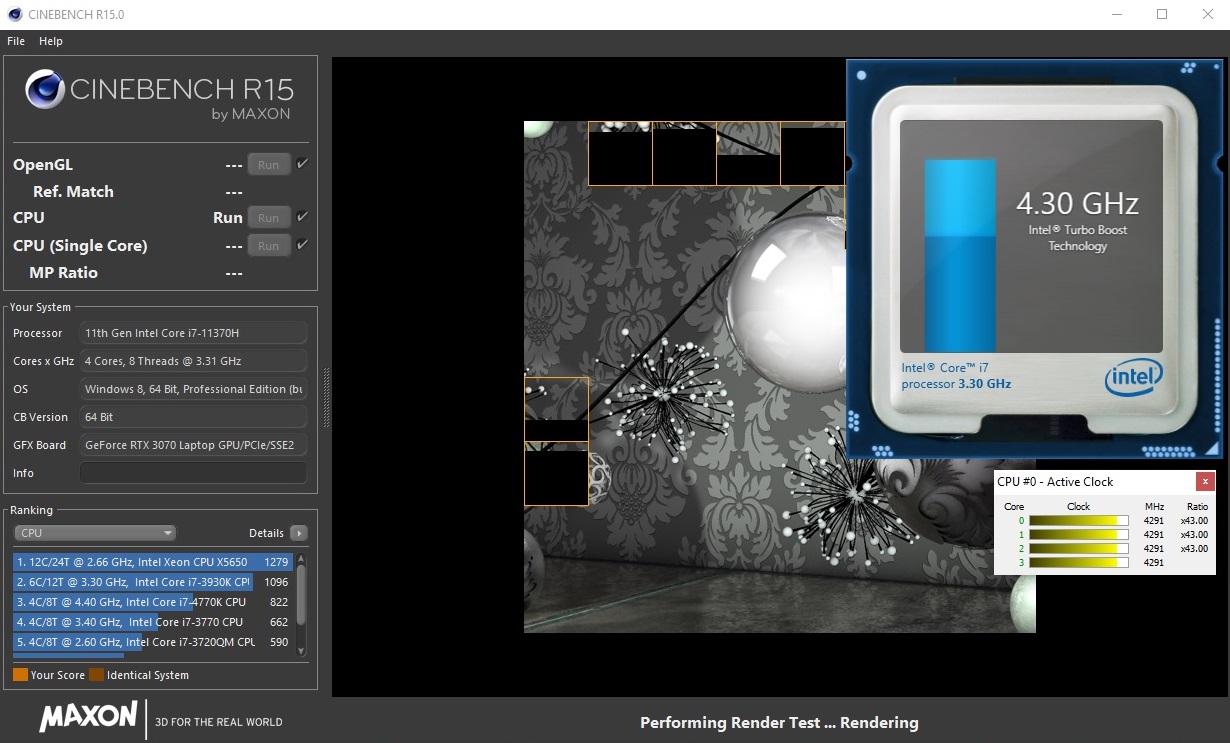
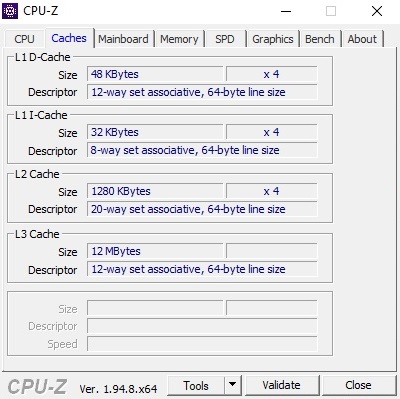
Our review unit’s Core i7-11370H comes with 8 MB of L3 cache and a TDP of up to 35 W. It can process up to 8 threads simultaneously thanks to Hyper-threading and can turbo boost up to 4.8 GHz, as already mentioned in the beginning of this article. With load on all four cores, it is still capable of up to a very decent 4.3 GHz. When subjected to our Cinebench loop the Dash F15 showed a relatively consistent sustained performance, at least after the first few iterations.
Despite its excellent single-core performance that turned out to be significantly higher than on previous Comet Lake generations in some cases our Core i7-11370H unsurprisingly failed to keep up with hexa and octa-core CPUs. It was outperformed by the Core i7-10875H commonly used in gaming notebooks, the less common Core i9-10980HK, and obviously also the 35 W Ryzen 9 5900HS that can be found in the Zephyrus G15. From a price-performance perspective a Ryzen 5 4600H or similar would have been a much better fit for the Dash F15.
* ... smaller is better
System Performance
Due to its low core count of just 4 overall system performance as determined by our system performance benchmarks was fairly low. In PCMark 10 the Asus TUF Dash F15 scored a meagre 6,088 points and landed in second to last place.
| PCMark 10 Score | 6088 points | |
Help | ||
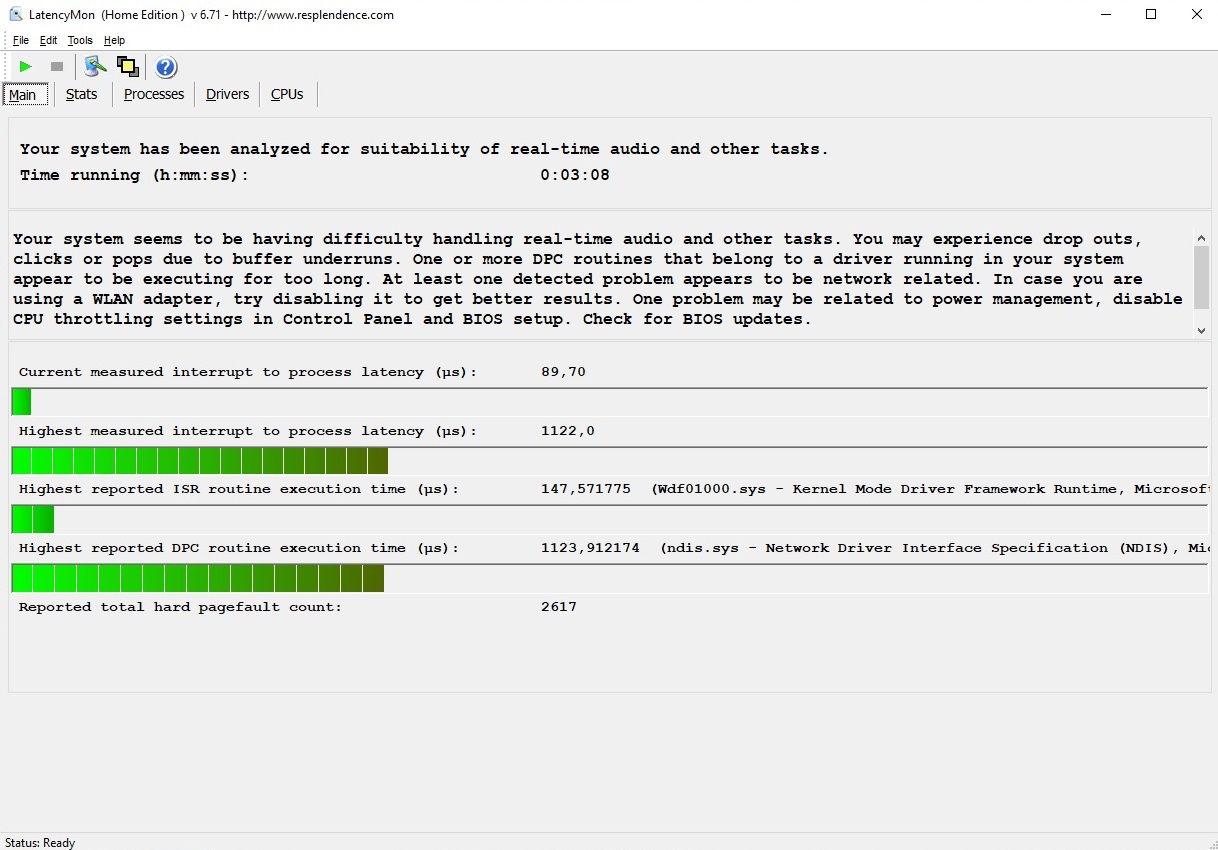
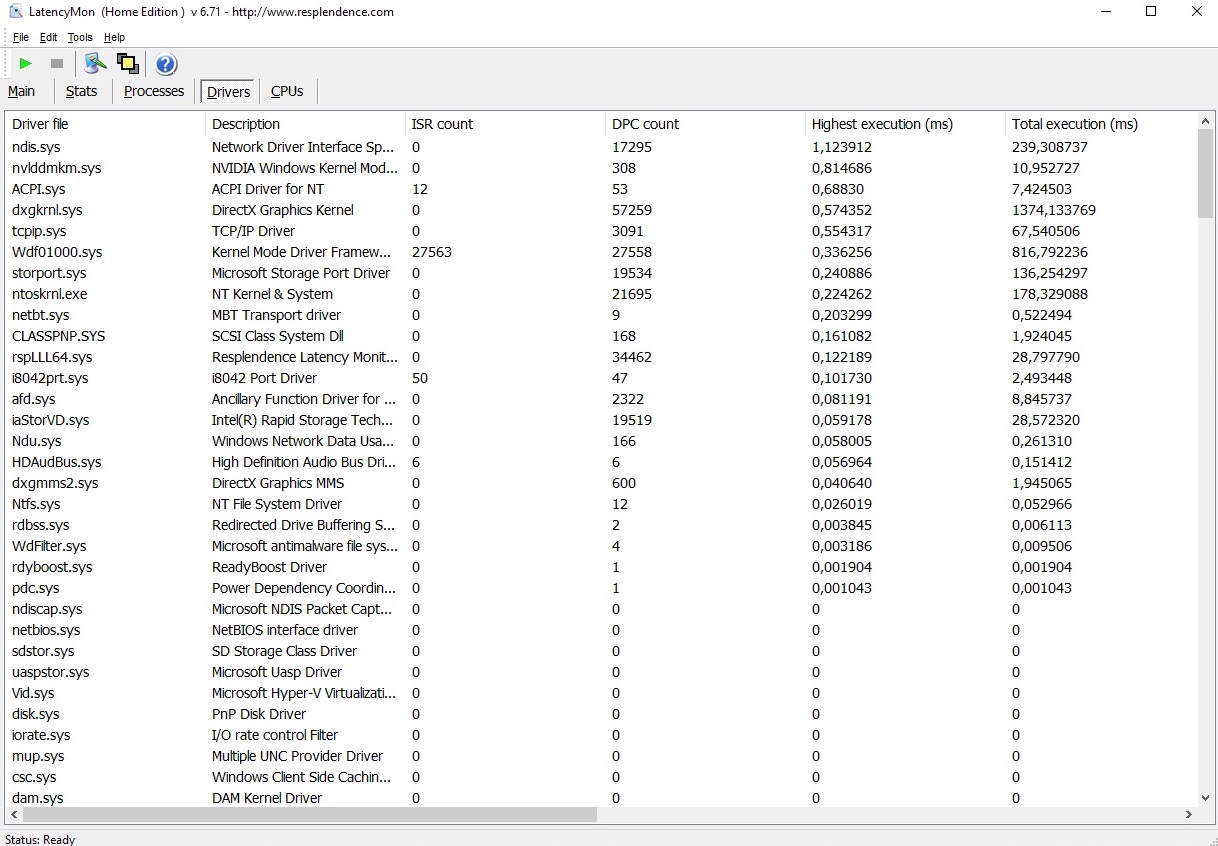
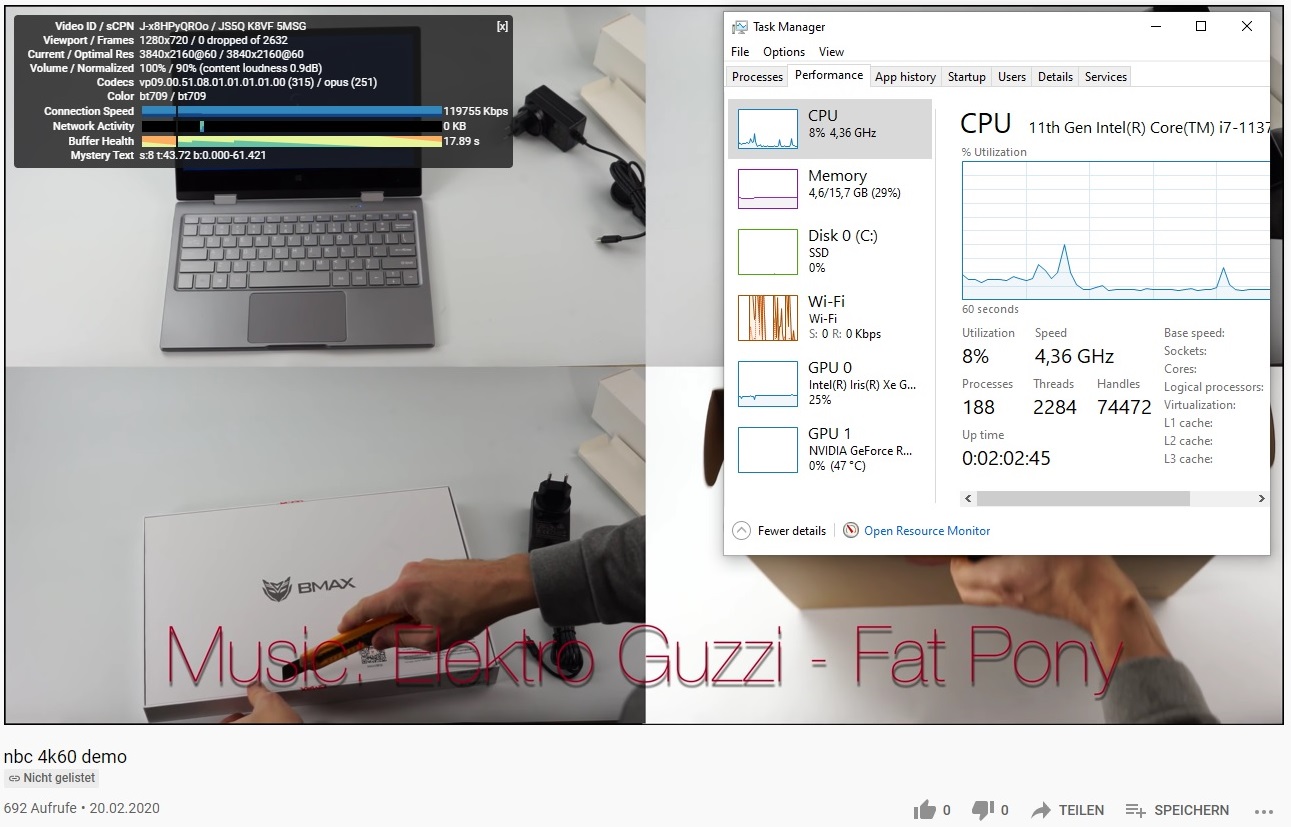
DPC Latencies
Despite the fact that the Dash F15 showed the second-best latencies of all devices in our comparison group the 15-inch laptop might still wreak havoc on some real-time applications according to LatencyMon. This, however, would most likely not be an issue for most users and only affect a very specific subgroup.
| DPC Latencies / LatencyMon - interrupt to process latency (max), Web, Youtube, Prime95 | |
| Aorus 15G XB | |
| MSI GS66 Stealth 10SFS | |
| Gigabyte Aero 15 OLED XB-8DE51B0SP | |
| Razer Blade 15 RTX 2070 Super Max-Q | |
| Asus TUF Dash F15 FX516PR | |
| Asus ROG Zephyrus G15 GA503Q | |
* ... smaller is better
Storage Devices
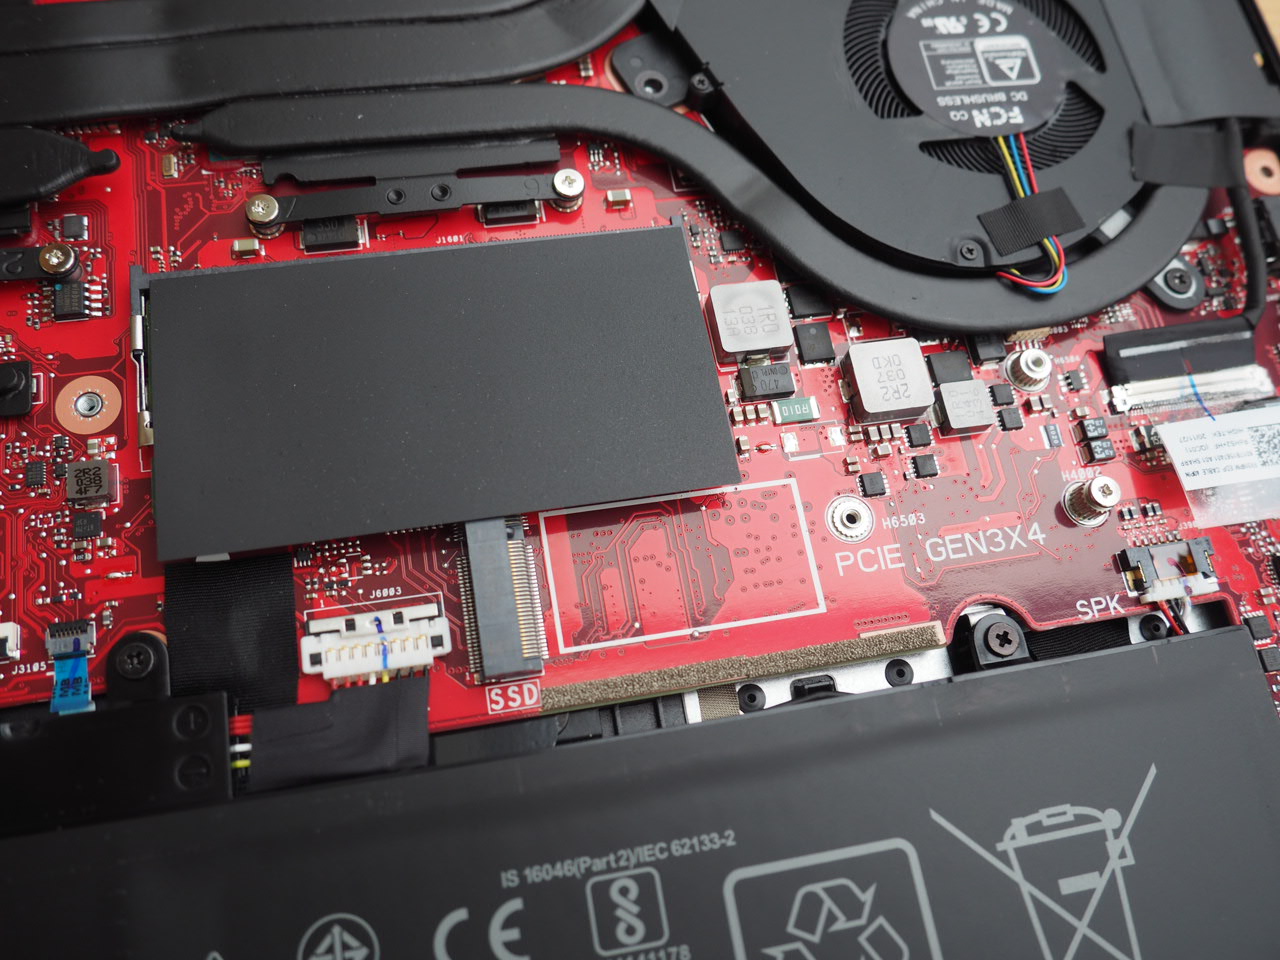
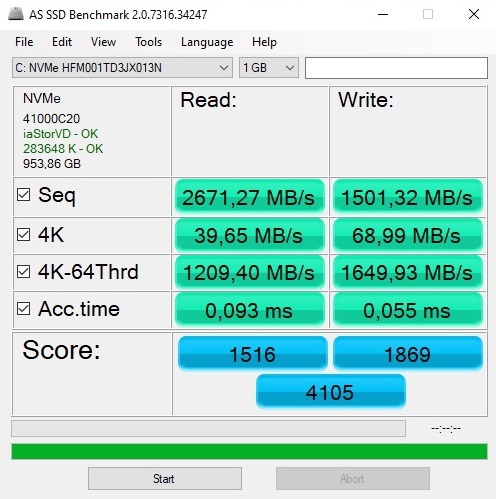
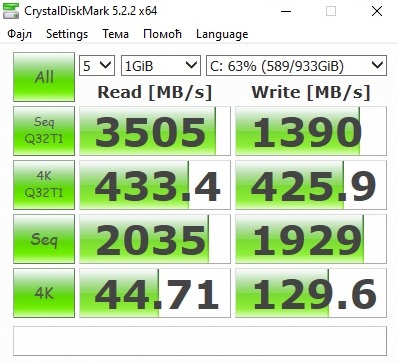
Asus’s storage device of choice is a 1 TB SK Hynix NVMe SSD. Interestingly enough the exact same SSD performed up to 30 % faster in the Zephyrus G15. Nevertheless, the Dash F15 ran smooth and fast (boot times, application launch times, file transfers, etc.) overall. If you need more storage space, you have the option to install a secondary M.2 SSD.
| Asus TUF Dash F15 FX516PR SK Hynix HFM001TD3JX013N | Asus ROG Zephyrus G15 GA503Q SK Hynix HFM001TD3JX013N | MSI GS66 Stealth 10SFS Samsung SSD PM981 MZVLB1T0HALR | Aorus 15G XB Samsung SSD PM981a MZVLB512HBJQ | Razer Blade 15 RTX 2070 Super Max-Q Samsung SSD PM981a MZVLB512HBJQ | Gigabyte Aero 15 OLED XB-8DE51B0SP Intel Optane Memory H10 with Solid State Storage 32GB + 512GB HBRPEKNX0202A(L/H) | |
|---|---|---|---|---|---|---|
| CrystalDiskMark 5.2 / 6 | 31% | 13% | 19% | 24% | 13% | |
| Write 4K (MB/s) | 129.6 | 156.4 21% | 131.3 1% | 121.6 -6% | 139.8 8% | 127.4 -2% |
| Read 4K (MB/s) | 44.71 | 66.7 49% | 45.84 3% | 44.37 -1% | 48.62 9% | 147.5 230% |
| Write Seq (MB/s) | 1929 | 2318 20% | 2370 23% | 2617 36% | 2260 17% | 485.9 -75% |
| Read Seq (MB/s) | 2035 | 2151 6% | 1509 -26% | 1297 -36% | 2135 5% | 1352 -34% |
| Write 4K Q32T1 (MB/s) | 425.9 | 525 23% | 481.5 13% | 499 17% | 499.3 17% | 476.5 12% |
| Read 4K Q32T1 (MB/s) | 433.4 | 452.1 4% | 560 29% | 557 29% | 552 27% | 531 23% |
| Write Seq Q32T1 (MB/s) | 1390 | 3055 120% | 2392 72% | 2978 114% | 2960 113% | 1061 -24% |
| Read Seq Q32T1 (MB/s) | 3505 | 3607 3% | 3232 -8% | 3360 -4% | 3269 -7% | 2552 -27% |
| AS SSD | 31% | 22% | 24% | 12% | -15% | |
| Seq Read (MB/s) | 2671 | 2950 10% | 1065 -60% | 1795 -33% | 1957 -27% | 1200 -55% |
| Seq Write (MB/s) | 1501 | 1600 7% | 2360 57% | 2724 81% | 2092 39% | 836 -44% |
| 4K Read (MB/s) | 39.65 | 53.6 35% | 48.09 21% | 49.67 25% | 50.2 27% | 65.8 66% |
| 4K Write (MB/s) | 69 | 126.8 84% | 110.7 60% | 109.3 58% | 96.5 40% | 103.8 50% |
| 4K-64 Read (MB/s) | 1209 | 1429 18% | 1635 35% | 1284 6% | 1594 32% | 789 -35% |
| 4K-64 Write (MB/s) | 1650 | 2177 32% | 1829 11% | 1962 19% | 2005 22% | 929 -44% |
| Access Time Read * (ms) | 0.093 | 0.064 31% | 0.071 24% | 0.063 32% | 0.057 39% | 0.103 -11% |
| Access Time Write * (ms) | 0.055 | 0.029 47% | 0.034 38% | 0.034 38% | 0.112 -104% | 0.045 18% |
| Score Read (Points) | 1516 | 1778 17% | 1790 18% | 1513 0% | 1840 21% | 975 -36% |
| Score Write (Points) | 1869 | 2464 32% | 2176 16% | 2344 25% | 2310 24% | 1117 -40% |
| Score Total (Points) | 4105 | 5090 24% | 4950 21% | 4685 14% | 5103 24% | 2594 -37% |
| Total Average (Program / Settings) | 31% /
31% | 18% /
18% | 22% /
22% | 18% /
17% | -1% /
-3% |
* ... smaller is better

Sustained Read: DiskSpd Read Loop, Queue Depth 8
GPU Performance
As we already explained in our RTX 3070 Laptop and RTX 3080 Laptop performance test article Nvidia no longer uses the Max-Q moniker with their current Ampere generation of GPUs. Instead, OEMs can more or less freely configure TDP to their liking within certain thresholds. For the RTX 3070 Laptop these are 80 W on the low and 125 W on the high end, plus Dynamic Boost. Compare that to the RTX 3070 desktop GPU’s 220 W.
| 3DMark Cloud Gate Standard Score | 29530 points | |
| 3DMark Fire Strike Score | 16769 points | |
| 3DMark Time Spy Score | 7358 points | |
Help | ||
For the Dash F15, Asus chose the most energy efficient but also slowest configuration, as can be seen among others in our synthetic GPU benchmarks. In the Fire Strike, Time Spy, and Port Royal benchmark it performed practically identical to an RTX 2070 Super Max-Q GPU. Quite frankly, we would have expected more of a brand-new generation of GPUs. A prime example of what this GPU is capable of can be found in the XMG Neo 17, for which Schenker chose to configure its RTX 3070 Laptop at the upper level of the TDP threshold resulting in an up to 40 % higher performance when compared to the Dash F15. Keep in mind that a higher TDP usually also results in increased noise emissions.
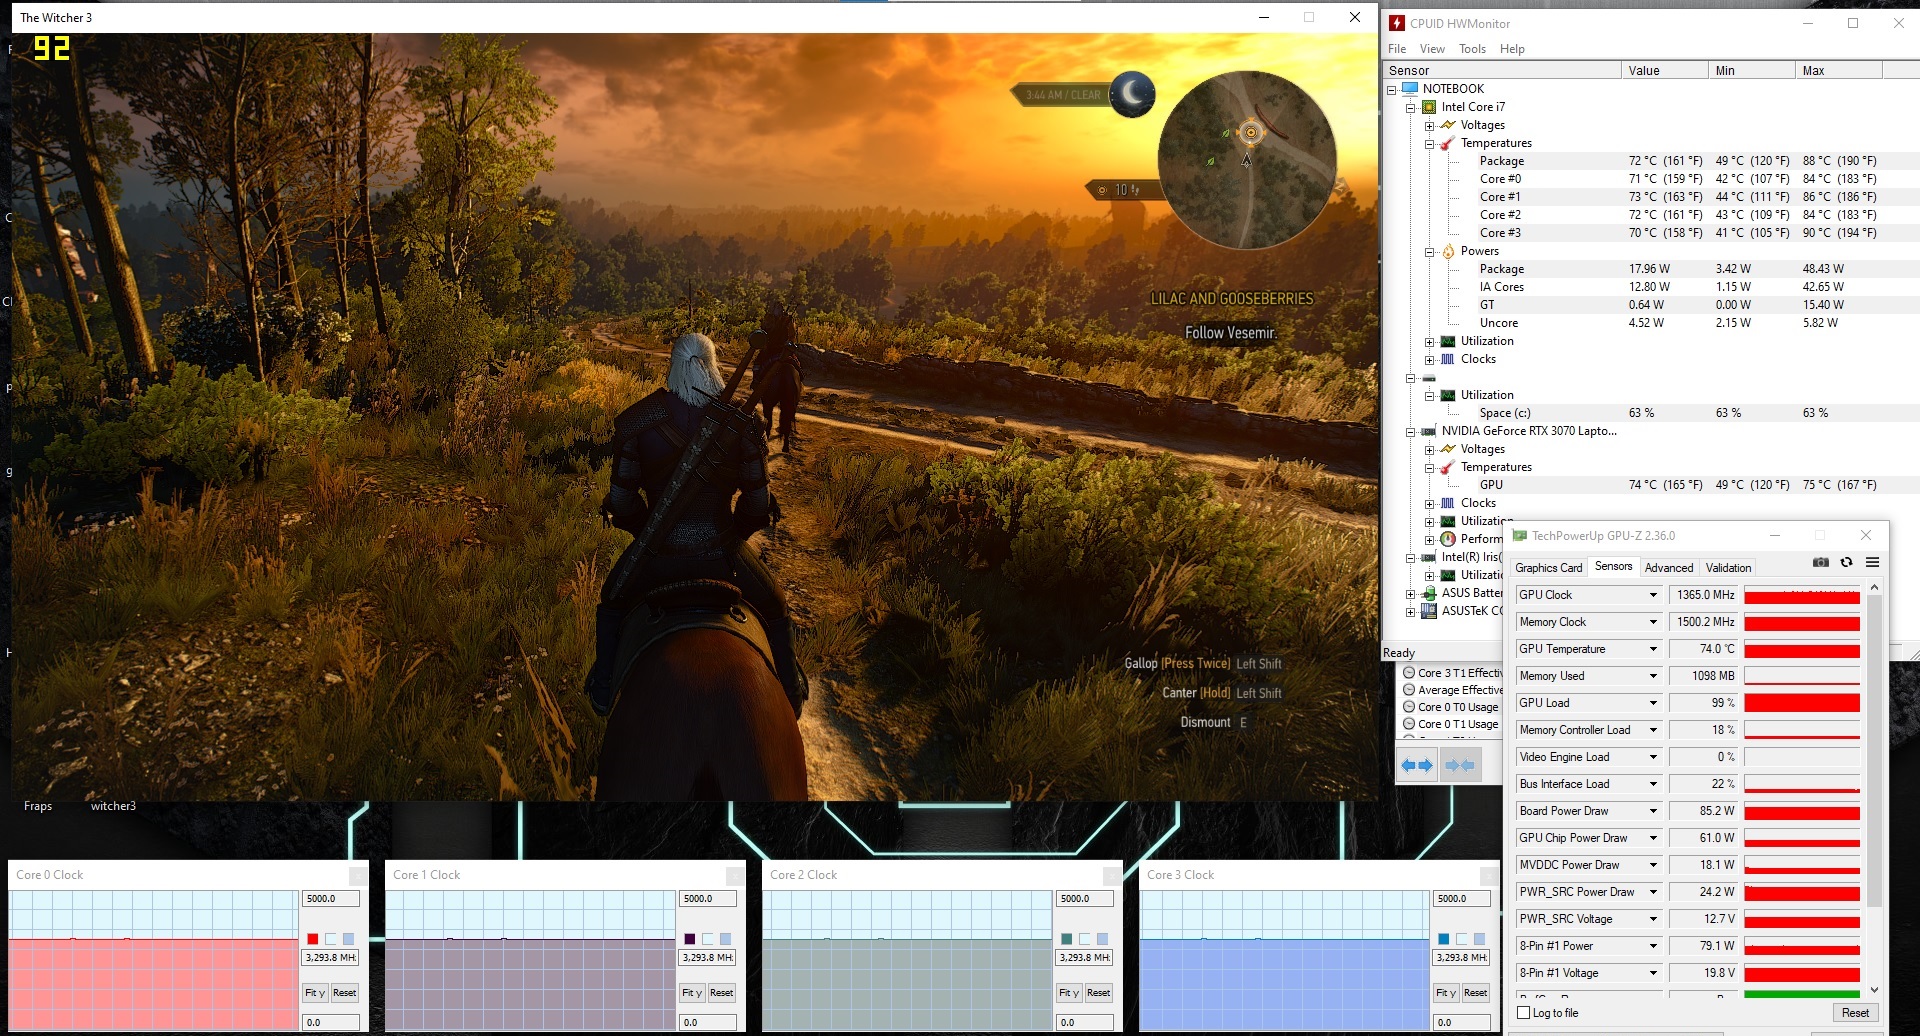
We run Witcher 3 3 in a 60-minute loop in FHD resolution and Ultra settings to determine long-term sustained load capabilities. As you can see below the resulting frame rate was fairly consistent overall.
Gaming Performance
Even at just 80 W TDP the RTX 3070 Laptop was fast enough to run almost all games smoothly at the panel’s native FHD resolution in maximum details. Only extremely demanding titles, such as Watch Dogs Legion, Cyberpunk 2077, Crysis Remastered, or Red Dead Redemption 2 will fail to run with more than 60 FPS.
| The Witcher 3 | |
| 1920x1080 Ultra Graphics & Postprocessing (HBAO+) | |
| Average of class Gaming (104.7 - 240, n=7, last 2 years) | |
| Average NVIDIA GeForce RTX 3070 Laptop GPU (34.9 - 109, n=52) | |
| Asus ROG Zephyrus G15 GA503Q | |
| Gigabyte Aero 15 OLED XB-8DE51B0SP | |
| Asus TUF Dash F15 FX516PR | |
| Aorus 15G XB | |
| Razer Blade 15 RTX 2070 Super Max-Q | |
| MSI GS66 Stealth 10SFS | |
| 3840x2160 High Graphics & Postprocessing (Nvidia HairWorks Off) | |
| Average of class Gaming (114 - 170.9, n=4, last 2 years) | |
| Asus ROG Zephyrus G15 GA503Q | |
| Average NVIDIA GeForce RTX 3070 Laptop GPU (40.3 - 71.9, n=9) | |
| Gigabyte Aero 15 OLED XB-8DE51B0SP | |
| Asus TUF Dash F15 FX516PR | |
| low | med. | high | ultra | QHD | 4K | |
|---|---|---|---|---|---|---|
| GTA V (2015) | 164 | 153 | 111 | 72.6 | ||
| The Witcher 3 (2015) | 126 | 76.7 | 51 | |||
| Dota 2 Reborn (2015) | 127 | 116 | 107 | 103 | ||
| X-Plane 11.11 (2018) | 89.1 | 73.4 | 63.3 | |||
| Shadow of the Tomb Raider (2018) | 88 | 86 | 65 | 36 | ||
| Battlefield V (2018) | 106 | 100 | 80.5 | 49.4 | ||
| Apex Legends (2019) | 143 | 141 | 103 | 58.8 | ||
| Far Cry New Dawn (2019) | 80 | 70 | 62 | 42 | ||
| Metro Exodus (2019) | 69.4 | 57.1 | 45.3 | 27.7 | ||
| The Division 2 (2019) | 85 | 68 | 48 | 26 | ||
| Anno 1800 (2019) | 73.9 | 39.8 | 34.2 | 21.8 | ||
| Rage 2 (2019) | 102 | 99.7 | 65.3 | 32.7 | ||
| Control (2019) | 69.6 | 45.2 | 22.3 | |||
| Borderlands 3 (2019) | 78.2 | 65.4 | 47.2 | 25.7 | ||
| GRID 2019 (2019) | 83.2 | 63.7 | 55.6 | 38.1 | ||
| Need for Speed Heat (2019) | 66.1 | 64.8 | 54.8 | 32.1 | ||
| Star Wars Jedi Fallen Order (2019) | 71.5 | 69.1 | 60.1 | 35 | ||
| Red Dead Redemption 2 (2019) | 67.2 | 46.3 | 37.5 | 24.3 | ||
| Hunt Showdown (2020) | 98.4 | 62.3 | 30.9 | |||
| Doom Eternal (2020) | 152 | 149 | 118 | 64 | ||
| Gears Tactics (2020) | 110 | 85.2 | 62.2 | 32.5 | ||
| F1 2020 (2020) | 118 | 97 | 74 | 45 | ||
| Death Stranding (2020) | 73.8 | 73.4 | 70.7 | 43.7 | ||
| Horizon Zero Dawn (2020) | 88 | 70 | 56 | 34 | ||
| Crysis Remastered (2020) | 63.1 | 47.2 | 37.3 | 23.9 | ||
| Serious Sam 4 (2020) | 74.3 | 66.4 | 55.9 | |||
| Mafia Definitive Edition (2020) | 77.6 | 57.9 | 31.4 | |||
| Star Wars Squadrons (2020) | 180 | 167 | 129 | 70.5 | ||
| FIFA 21 (2020) | 148 | 144 | 114 | 67.5 | ||
| Watch Dogs Legion (2020) | 68 | 55 | 42 | 25 | ||
| Dirt 5 (2020) | 76.5 | 50 | 33.3 | |||
| Assassin´s Creed Valhalla (2020) | 63 | 56 | 44 | 27 | ||
| Call of Duty Black Ops Cold War (2020) | 82 | 73.5 | 53.7 | 29.8 | ||
| Yakuza Like a Dragon (2020) | 90.2 | 84.3 | 59.2 | 31 | ||
| Immortals Fenyx Rising (2020) | 73 | 70 | 57 | 38 | ||
| Cyberpunk 2077 1.0 (2020) | 57.9 | 50 | 32 | 15.5 |
Emissions
Noise Emissions
Despite its low core count and its GPU’s low TDP the TUF Dash F15 can get very loud under load. Even though the fans will only produce a sound pressure level of up to 41 dB(A) when subjected to 3D load, they jump up to a very loud and annoying 48-54 dB(A) regularly. Idle performance on the other hand was impeccable, and they produced at most 30 dB(A) of sound pressure if they happened to be running at all.
Noise level
| Idle |
| 25 / 30 / 35 dB(A) |
| Load |
| 53 / 54 dB(A) |
 | ||
30 dB silent 40 dB(A) audible 50 dB(A) loud |
||
min: | ||
| Asus TUF Dash F15 FX516PR i7-11370H, GeForce RTX 3070 Laptop GPU | Asus ROG Zephyrus G15 GA503Q R9 5900HS, GeForce RTX 3080 Laptop GPU | MSI GS66 Stealth 10SFS i9-10980HK, GeForce RTX 2070 Super Max-Q | Aorus 15G XB i7-10875H, GeForce RTX 2070 Super Max-Q | Razer Blade 15 RTX 2070 Super Max-Q i7-10875H, GeForce RTX 2070 Super Max-Q | Gigabyte Aero 15 OLED XB-8DE51B0SP i7-10875H, GeForce RTX 2070 Super Max-Q | |
|---|---|---|---|---|---|---|
| Noise | 4% | -11% | -7% | 3% | -13% | |
| off / environment * (dB) | 24 | 25 -4% | 30 -25% | 25 -4% | 27 -13% | 30 -25% |
| Idle Minimum * (dB) | 25 | 26 -4% | 32 -28% | 32 -28% | 27 -8% | 34 -36% |
| Idle Average * (dB) | 30 | 27 10% | 34 -13% | 34 -13% | 27 10% | 36 -20% |
| Idle Maximum * (dB) | 35 | 31 11% | 39 -11% | 38 -9% | 27 23% | 41 -17% |
| Load Average * (dB) | 53 | 49 8% | 53 -0% | 48 9% | 44.7 16% | 48 9% |
| Witcher 3 ultra * (dB) | 48 | 49 -2% | 48 -0% | 50 -4% | 51.2 -7% | 48 -0% |
| Load Maximum * (dB) | 54 | 51 6% | 53 2% | 54 -0% | 54 -0% | 54 -0% |
* ... smaller is better
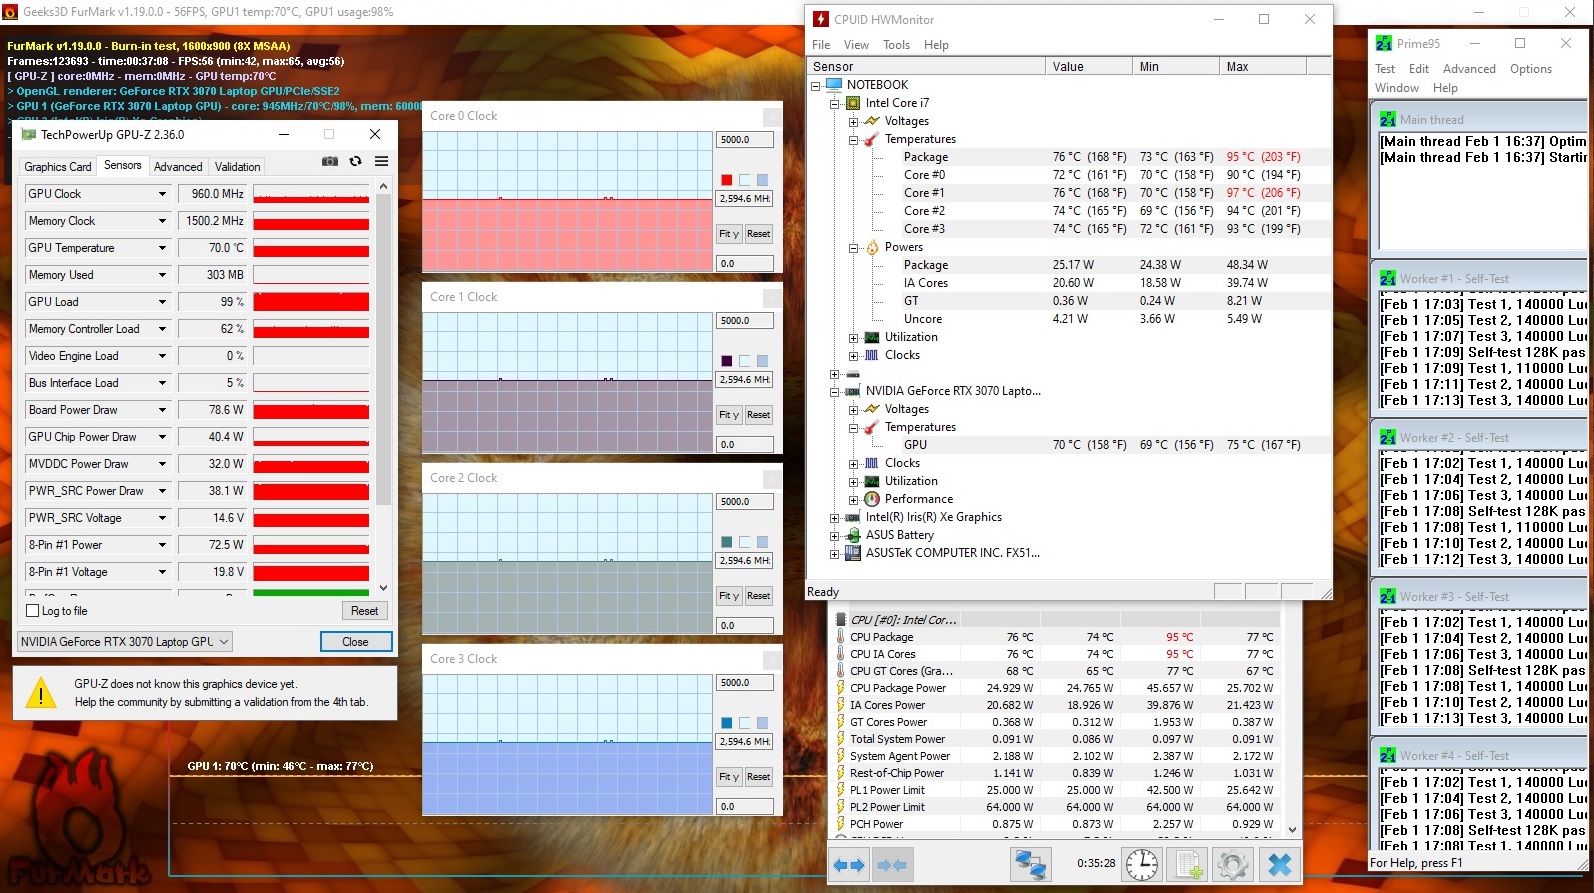
Temperature
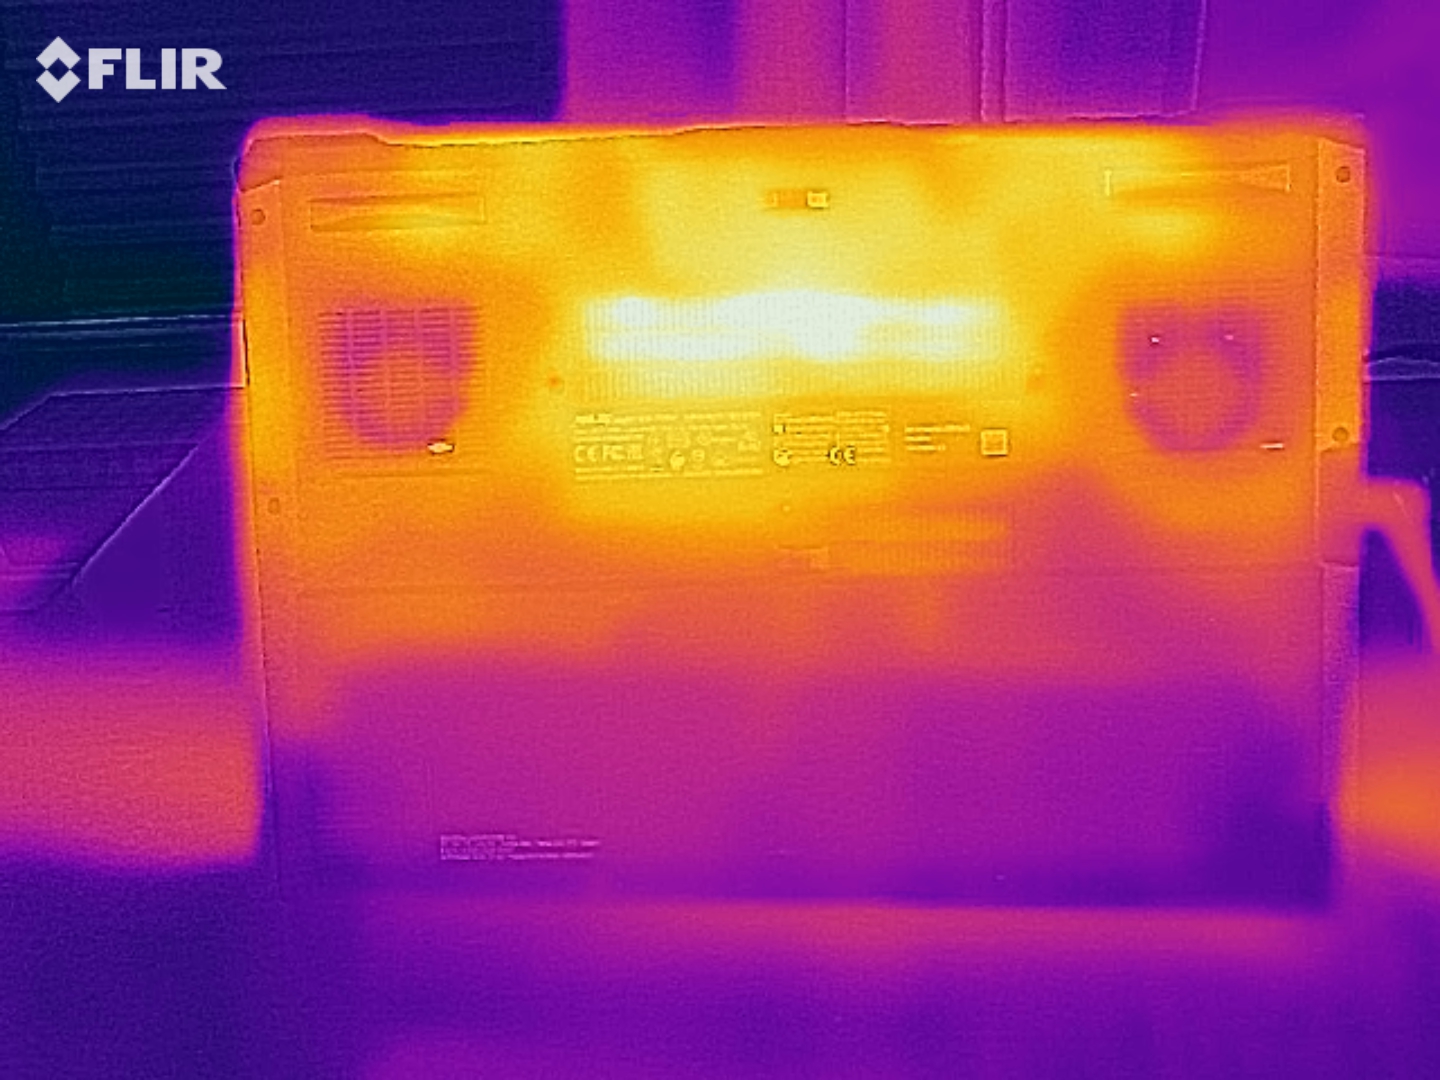
Just like noise emissions heat emissions are also in line with its competitors. When subjected to our stress test running Prime95 and FurMark the device warmed up to around 55 °C at the top and 56 °C at the bottom. Please note that peak temperatures were even higher during our Witcher 3 test due to higher clock speeds. Internal temperatures were kept in check by the cooling system and peaked at 70 °C and 80 °C for GPU and CPU after 60 minutes of full load, respectively.
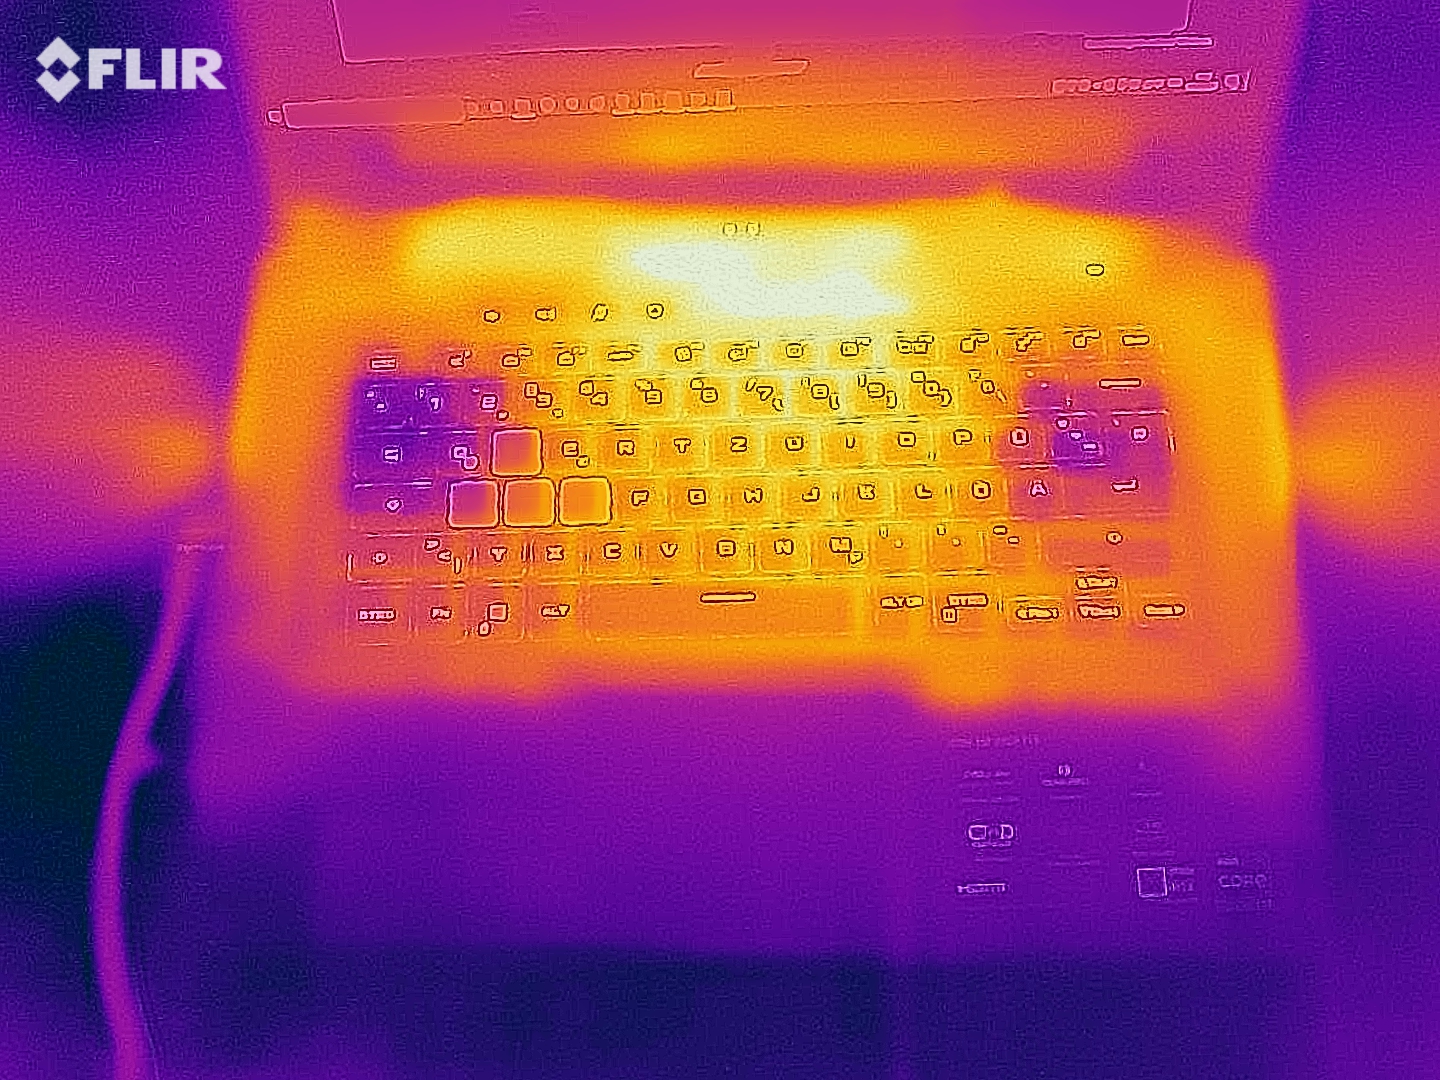
(-) The maximum temperature on the upper side is 55 °C / 131 F, compared to the average of 40.4 °C / 105 F, ranging from 21.2 to 68.8 °C for the class Gaming.
(-) The bottom heats up to a maximum of 56 °C / 133 F, compared to the average of 43.2 °C / 110 F
(+) In idle usage, the average temperature for the upper side is 27.2 °C / 81 F, compared to the device average of 33.9 °C / 93 F.
(-) Playing The Witcher 3, the average temperature for the upper side is 47.2 °C / 117 F, compared to the device average of 33.9 °C / 93 F.
(±) The palmrests and touchpad can get very hot to the touch with a maximum of 38 °C / 100.4 F.
(-) The average temperature of the palmrest area of similar devices was 28.8 °C / 83.8 F (-9.2 °C / -16.6 F).
| Asus TUF Dash F15 FX516PR i7-11370H, GeForce RTX 3070 Laptop GPU | Asus ROG Zephyrus G15 GA503Q R9 5900HS, GeForce RTX 3080 Laptop GPU | MSI GS66 Stealth 10SFS i9-10980HK, GeForce RTX 2070 Super Max-Q | Aorus 15G XB i7-10875H, GeForce RTX 2070 Super Max-Q | Razer Blade 15 RTX 2070 Super Max-Q i7-10875H, GeForce RTX 2070 Super Max-Q | Gigabyte Aero 15 OLED XB-8DE51B0SP i7-10875H, GeForce RTX 2070 Super Max-Q | |
|---|---|---|---|---|---|---|
| Heat | 0% | 5% | 6% | -10% | 5% | |
| Maximum Upper Side * (°C) | 55 | 51 7% | 53 4% | 44 20% | 50 9% | 49 11% |
| Maximum Bottom * (°C) | 56 | 56 -0% | 55 2% | 63 -13% | 52.2 7% | 61 -9% |
| Idle Upper Side * (°C) | 29 | 29 -0% | 28 3% | 27 7% | 37.2 -28% | 27 7% |
| Idle Bottom * (°C) | 32 | 34 -6% | 29 9% | 29 9% | 41.4 -29% | 29 9% |
* ... smaller is better
Speakers
Even though the speakers were not quite as good as on the Zephyrus G15 and suffered from slightly weaker lows and highs they still performed adequately overall. Nevertheless, a headset or a pair of external speakers will give you a much better and more immersed audio experience.
Asus TUF Dash F15 FX516PR audio analysis
(±) | speaker loudness is average but good (81 dB)
Bass 100 - 315 Hz
(±) | reduced bass - on average 13.8% lower than median
(±) | linearity of bass is average (8.6% delta to prev. frequency)
Mids 400 - 2000 Hz
(+) | balanced mids - only 3.4% away from median
(+) | mids are linear (5.5% delta to prev. frequency)
Highs 2 - 16 kHz
(±) | higher highs - on average 7.1% higher than median
(±) | linearity of highs is average (11.8% delta to prev. frequency)
Overall 100 - 16.000 Hz
(±) | linearity of overall sound is average (15.4% difference to median)
Compared to same class
» 34% of all tested devices in this class were better, 7% similar, 59% worse
» The best had a delta of 6%, average was 18%, worst was 132%
Compared to all devices tested
» 23% of all tested devices were better, 4% similar, 73% worse
» The best had a delta of 4%, average was 23%, worst was 134%
Asus ROG Zephyrus G15 GA503Q audio analysis
(±) | speaker loudness is average but good (78 dB)
Bass 100 - 315 Hz
(+) | good bass - only 4% away from median
(+) | bass is linear (6.5% delta to prev. frequency)
Mids 400 - 2000 Hz
(+) | balanced mids - only 4.5% away from median
(+) | mids are linear (2.1% delta to prev. frequency)
Highs 2 - 16 kHz
(+) | balanced highs - only 3.5% away from median
(+) | highs are linear (5.7% delta to prev. frequency)
Overall 100 - 16.000 Hz
(+) | overall sound is linear (11.2% difference to median)
Compared to same class
» 8% of all tested devices in this class were better, 4% similar, 88% worse
» The best had a delta of 6%, average was 18%, worst was 132%
Compared to all devices tested
» 7% of all tested devices were better, 2% similar, 91% worse
» The best had a delta of 4%, average was 23%, worst was 134%
Energy Management
Power Consumption
Power consumption was relatively low and better than on its competitors, courtesy of the Dash F15’s low CPU core count. At 9 to 16 W when idle and 107 to 162 W under load its power consumption to performance ratio was acceptable and remained below the power supply’s rated load capacity.
| Off / Standby | |
| Idle | |
| Load |
|
Key:
min: | |
| Asus TUF Dash F15 FX516PR i7-11370H, GeForce RTX 3070 Laptop GPU | Asus ROG Zephyrus G15 GA503Q R9 5900HS, GeForce RTX 3080 Laptop GPU | MSI GS66 Stealth 10SFS i9-10980HK, GeForce RTX 2070 Super Max-Q | Aorus 15G XB i7-10875H, GeForce RTX 2070 Super Max-Q | Razer Blade 15 RTX 2070 Super Max-Q i7-10875H, GeForce RTX 2070 Super Max-Q | Gigabyte Aero 15 OLED XB-8DE51B0SP i7-10875H, GeForce RTX 2070 Super Max-Q | |
|---|---|---|---|---|---|---|
| Power Consumption | -7% | -39% | -55% | -61% | -69% | |
| Idle Minimum * (Watt) | 9 | 10 -11% | 13 -44% | 16 -78% | 14.3 -59% | 18 -100% |
| Idle Average * (Watt) | 11 | 12 -9% | 16 -45% | 20 -82% | 22.3 -103% | 21 -91% |
| Idle Maximum * (Watt) | 16 | 17 -6% | 27 -69% | 30 -88% | 36.9 -131% | 38 -138% |
| Load Average * (Watt) | 107 | 108 -1% | 109 -2% | 102 5% | 118.4 -11% | 113 -6% |
| Witcher 3 ultra * (Watt) | 121 | 123 -2% | 155 -28% | 156 -29% | 153.7 -27% | 149 -23% |
| Load Maximum * (Watt) | 162 | 182 -12% | 236 -46% | 256 -58% | 220.8 -36% | 256 -58% |
* ... smaller is better
Battery Life
The Dash F15’s highlight is its long battery life. Thanks to among others Nvidia Optimus graphics switching the 15-inch device lasted for a good 16 hours in our idle test – a great result for a gaming laptop. It also performed very well when subjected to our real-world Wi-Fi test simulating typical web browsing load at a normalized brightness and lasted for an impressive 9 hours. Again, excellent for a gaming notebook.
| Asus TUF Dash F15 FX516PR i7-11370H, GeForce RTX 3070 Laptop GPU, 76 Wh | Asus ROG Zephyrus G15 GA503Q R9 5900HS, GeForce RTX 3080 Laptop GPU, 90 Wh | MSI GS66 Stealth 10SFS i9-10980HK, GeForce RTX 2070 Super Max-Q, 99.99 Wh | Aorus 15G XB i7-10875H, GeForce RTX 2070 Super Max-Q, 94 Wh | Razer Blade 15 RTX 2070 Super Max-Q i7-10875H, GeForce RTX 2070 Super Max-Q, 80 Wh | Gigabyte Aero 15 OLED XB-8DE51B0SP i7-10875H, GeForce RTX 2070 Super Max-Q, 94.2 Wh | |
|---|---|---|---|---|---|---|
| Battery runtime | -11% | -40% | -31% | -31% | -40% | |
| Reader / Idle (h) | 16 | 12.1 -24% | 8.4 -47% | 9.7 -39% | 8.6 -46% | |
| WiFi v1.3 (h) | 9.1 | 9.4 3% | 6.1 -33% | 7 -23% | 6.3 -31% | 6.1 -33% |
| Load (h) | 1.5 | 1.7 | 2.5 | 2.8 | ||
| H.264 (h) | 7.7 |
Pros
Cons
Verdict
Without a doubt, the Asus TUF Dash F15 FX516P has its pros.
In addition to its fast albeit slightly dim 240 Hz display its benefits also include a very long battery life capable of outshining even most office notebooks.
We also like the fact that it comes with USB 4 and Thunderbolt support with 100 W Power Delivery charging.
However, graphics performance will be a sore point, and we would sincerely advise you not to expect too much. As mentioned above Asus configured the RTX 3070 Laptop at the lowest possible TDP threshold thereby hampering its performance potential massively. In addition, a CPU with just four cores at the Dash F15’s price point is no longer state-of-the-art in 2021. An affordable AMD hexa-core CPU would have been a much better fit.
Asus should also consider improving temperature and noise emissions under 3D load, and we would also like to add a webcam to our wish list for the Dash F15’s successor.
Price and Availability
Our review unit was listed at 1,999 Euros in Germany, although we expect availability to be very limited in the months to come. Asus has not yet officially announced prices for the US.
Asus TUF Dash F15 FX516PR
- 02/02/2021 v7 (old)
Florian Glaser
Price comparison

