Reviews for the Intel Core i9-10980HK processor
Alienware m15 R4 laptop in review: Now also with a mechanical keyboard
How does the Alienware m15 R4 perform with the fastest laptop graphics card that's currently on the market? Is the upgrade from an RTX 3070 to an RTX 3080 worth...
Intel Core i9-10980HK | NVIDIA GeForce RTX 3080 Laptop GPU | 15.60" | 2.4 kgAlienware m17 R4 laptop review: Burning up into the atmosphere
The Alienware m17 R4 is the latest addition to Alienware's m17 lineup. Compared to the m17 R3, there's a brand new RTX 3000 graphics card, but the CPU is identi...
Intel Core i9-10980HK | NVIDIA GeForce RTX 3080 Laptop GPU | 17.30" | 3 kgAlienware m15 R4 gaming laptop in review: Lots of power, short battery life
Dell equips the Alienware m15 with Nvidia's new RTX 3000 GPUs in the R4 version. In our test configuration, the GeForce RTX 3070 shows what it can do at maximum...
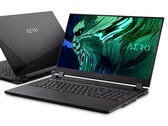
Intel Core i9-10980HK | NVIDIA GeForce RTX 3070 Laptop GPU | 15.60" | 2.3 kgGigabyte Aero 17 HDR YC Laptop in review: Debut for Nvidia Ampere
Judging solely by the exterior of the Aero 17 HDR, you would think that not much has changed. But the device features a new GPU under its hood. We tested the be...
Intel Core i9-10980HK | NVIDIA GeForce RTX 3080 Laptop GPU | 17.30" | 2.8 kgLenovo Legion 7 15IMH05 (Legion 7i) Laptop Review: Top performance and display
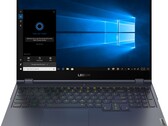
With a GeForce RTX 2080 Super, an Intel Core i9-10980HK, and a 240-Hz display, the Legion 7 is clearly targeted toward gamers that don't want to make any compro...
Intel Core i9-10980HK | NVIDIA GeForce RTX 2080 Super Max-Q | 15.60" | 2.4 kgAlienware m17 R3 P45E: NVIDIA GeForce RTX 2080 Super Mobile, 17.30", 3 kg
Review » Good-bye, Max-Q: Dell Alienware m17 R3 GeForce RTX 2080 Super Laptop Review
MSI WS66 10TMT-207US: NVIDIA Quadro RTX 5000 Max-Q, 15.60", 2.3 kg
Review » MSI WS66 10TMT Workstation Laptop Review: Faster Than The Razer Blade 15 Studio Edition
Asus ROG Zephyrus Duo 15 GX550LXS: NVIDIA GeForce RTX 2080 Super Max-Q, 15.60", 2.5 kg
Review » Asus ROG Zephyrus Duo 15 GX550LXS in Review: Unique Gaming Laptop with Lots of Performance Below the Hood
Asus ROG Strix Scar 15 G532LWS: NVIDIA GeForce RTX 2070 Super Mobile, 15.60", 2.4 kg
Review » Asus ROG Strix Scar 15 G532LWS Laptop Review: GeForce Supercharged
MSI GE66 Raider 10SFS: NVIDIA GeForce RTX 2070 Super Mobile, 15.60", 2.4 kg
Review » MSI GE66 Raider 10SFS Laptop Review: Premiere for the RTX 2070 Super
Asus Strix Scar 17 G732LXS: NVIDIA GeForce RTX 2080 Super Mobile, 17.30", 2.9 kg
Review » Asus ROG Strix Scar 17 G732LXS laptop review: Frontier runner
MSI GS66 Stealth 10SFS: NVIDIA GeForce RTX 2070 Super Max-Q, 15.60", 2.2 kg
Review » MSI GS66 Stealth 10SFS Laptop Review: Visually subdued, acoustically conspicuous
MSI GE66 Raider 10UG-270ES: NVIDIA GeForce RTX 3070 Laptop GPU, 15.60", 2.4 kg
External Review » MSI GE66 Raider 10UG-270ES
MSI GE66 Raider 10UG-269Es: NVIDIA GeForce RTX 3070 Laptop GPU, 15.60", 2.4 kg
External Review » MSI GE66 Raider 10UG-269Es
Alienware m15 R4 RTX 3080: NVIDIA GeForce RTX 3080 Laptop GPU, 15.60", 2.4 kg
External Review » Alienware m15 R4 RTX 3080
Asus ZenBook Pro Duo UX582LR-H2002R: NVIDIA GeForce RTX 3070 Laptop GPU, 15.60", 2.5 kg
External Review » Asus ZenBook Pro Duo UX582LR-H2002R
Lenovo Legion 7 15IMH05-81YT001VGE: NVIDIA GeForce RTX 2080 Super Max-Q, 15.60", 2.4 kg
External Review » Lenovo Legion 7 15IMH05-81YT001VGE
MSI GE76 Raider 10UH-200NL: NVIDIA GeForce RTX 3080 Laptop GPU, 17.30", 2.9 kg
External Review » MSI GE76 Raider 10UH-200NL
Alienware m17 R4: NVIDIA GeForce RTX 3080 Laptop GPU, 17.30", 3 kg
External Review » Alienware m17 R4
MSI GE66 Raider 10UH: NVIDIA GeForce RTX 3080 Laptop GPU, 15.60", 2.4 kg
External Review » MSI GE66 Raider 10UH
Acer Predator Helios 700 PH717-72-93RL: NVIDIA GeForce RTX 2080 Super Mobile, 17.30", 4.5 kg
External Review » Acer Predator Helios 700 PH717-72-93RL
MSI GE76 Dragon Tiamat 10UH: NVIDIA GeForce RTX 3080 Laptop GPU, 17.30", 2.9 kg
External Review » MSI GE76 Dragon Tiamat 10UH
Alienware m15 R4: NVIDIA GeForce RTX 3070 Laptop GPU, 15.60", 2.3 kg
External Review » Alienware m15 R4
Asus ROG Zephyrus Duo 15 GX550LWS-HC180T: NVIDIA GeForce RTX 2080 Super Mobile, 15.60", 2.4 kg
External Review » Asus ROG Zephyrus Duo 15 GX550LWS-HC180T
Gigabyte Aero 15 OLED YC: NVIDIA GeForce RTX 3080 Laptop GPU, 15.60", 2 kg
External Review » Gigabyte Aero 15 OLED YC
MSI GS75 10SGS-084NL: NVIDIA GeForce RTX 2080 Super Mobile, 17.30", 2.4 kg
External Review » MSI GS75 10SGS-084NL
MSI GS66 10SGS-084NL: NVIDIA GeForce RTX 2080 Super Max-Q, 15.60", 2.1 kg
External Review » MSI GS66 10SGS-084NL
Gigabyte Aero 17 HDR YC: NVIDIA GeForce RTX 3080 Laptop GPU, 17.30", 2.8 kg
External Review » Gigabyte Aero 17 HDR YC
MSI WS66 10TMT-207US: NVIDIA Quadro RTX 5000 Max-Q, 15.60", 2.3 kg
External Review » MSI WS66 10TMT-207US
MSI GS66 Stealth 10UH: NVIDIA GeForce RTX 3080 Laptop GPU, 15.60", 2.1 kg
External Review » MSI GS66 Stealth 10UH
Asus ROG Zephyrus Duo 15 GX550LXS-HC060T: NVIDIA GeForce RTX 2080 Super Max-Q, 15.60", 2.4 kg
External Review » Asus ROG Zephyrus Duo 15 GX550LXS-HC060T
MSI GE66 Raider 10SFS: NVIDIA GeForce RTX 2070 Super Mobile, 15.60", 2.4 kg
External Review » MSI GE66 Raider 10SFS
MSI GE66 Raider 10SGS-062RU: NVIDIA GeForce RTX 2080 Super Max-Q, 15.60", 2.4 kg
External Review » MSI GE66 Raider 10SGS-062RU
Medion Erazer Beast X10, i9-10980HK RTX 2080 Super: NVIDIA GeForce RTX 2080 Super Mobile, 17.30", 2.3 kg
External Review » Medion Erazer Beast X10, i9-10980HK RTX 2080 Super
MSI GE66 Raider 10SFS-054ES: NVIDIA GeForce RTX 2070 Super Mobile, 15.60", 2.4 kg
External Review » MSI GE66 Raider 10SFS-054ES
Acer Predator Helios 700 PH717-72-98YP: NVIDIA GeForce RTX 2080 Super Mobile, 17.30", 4.5 kg
External Review » Acer Predator Helios 700 PH717-72-98YP
Asus Strix Scar 15 G532LWS: NVIDIA GeForce RTX 2070 Super Mobile, 15.60", 2.6 kg
External Review » Asus Strix Scar 15 G532LWS
Alienware m15 R3, 10980HK RTX 2080 Super Max Q: NVIDIA GeForce RTX 2080 Super Max-Q, 15.60", 2.5 kg
External Review » Alienware m15 R3, 10980HK RTX 2080 Super Max Q
MSI GS66 Stealth 10SFS: NVIDIA GeForce RTX 2070 Super Max-Q, 15.60", 2.2 kg
External Review » MSI GS66 Stealth 10SFS
Asus Strix Scar 17 G732LXS: NVIDIA GeForce RTX 2080 Super Mobile, 17.30", 2.9 kg
External Review » Asus Strix Scar 17 G732LXS
Aorus 17X YB-9DE2152MP: NVIDIA GeForce RTX 2080 Super Mobile, 17.30", 3.8 kg
External Review » Aorus 17X YB-9DE2152MP
Asus Strix Scar 17 G732LXS-XS99: NVIDIA GeForce RTX 2080 Super Max-Q, 17.30", 2.9 kg
External Review » Asus Strix Scar 17 G732LXS-XS99
MSI GE66 10SGS-074: NVIDIA GeForce RTX 2080 Super Max-Q, 15.60", 2.3 kg
External Review » MSI GE66 10SGS-074
Aorus 17X YB-9UK2452MP: NVIDIA GeForce RTX 2080 Super Max-Q, 17.30", 3.8 kg
External Review » Aorus 17X YB-9UK2452MP
MSI GS66 10SGS-205: NVIDIA GeForce RTX 2080 Super Max-Q, 15.60", 2.1 kg
External Review » MSI GS66 10SGS-205
Asus ROG Strix Scar 15 G532LWS: NVIDIA GeForce RTX 2070 Super Mobile, 15.60", 2.4 kg
External Review » Asus ROG Strix Scar 15 G532LWS
MSI GS75 10SFS-225 Stealth: NVIDIA GeForce RTX 2070 Super Max-Q, 17.30", 2.4 kg
External Review » MSI GS75 10SFS-225 Stealth
Asus ROG Zephyrus Duo 15 GX550LXS: NVIDIA GeForce RTX 2080 Super Max-Q, 15.60", 2.5 kg
External Review » Asus ROG Zephyrus Duo 15 GX550LXS
Alienware m17 R3 i9, RTX 2080: NVIDIA GeForce RTX 2080 Super Mobile, 17.30", 3 kg
External Review » Alienware m17 R3 i9, RTX 2080
MSI GE66 10SFS-072 Raider: NVIDIA GeForce RTX 2070 Super Mobile, 15.60", 2.3 kg
External Review » MSI GE66 10SFS-072 Raider
Asus Strix Scar 17 G732LXS-HG104T: NVIDIA GeForce RTX 2080 Super Mobile, 17.30", 2.9 kg
External Review » Asus Strix Scar 17 G732LXS-HG104T
Asus Zephyrus Duo 15 GX550LXS-HC029R: NVIDIA GeForce RTX 2080 Super Mobile, 15.60", 2.4 kg
External Review » Asus Zephyrus Duo 15 GX550LXS-HC029R
Lenovo Legion 7i: NVIDIA GeForce RTX 2080 Super Max-Q, 15.60", 2.2 kg
External Review » Lenovo Legion 7i
MSI GE66 Raider 10SFS: NVIDIA GeForce RTX 2070 Super Mobile, 15.60", 2.4 kg
Article » Staying secure in the new normal: How AMD Ryzen Pro processors ensure 24x7 protection for your critical data
Article » MSI laptops are the ideal Holiday season gifts for the avid gamer or content producer in your life
Alienware m17 R4: NVIDIA GeForce RTX 3080 Laptop GPU, 17.30", 3 kg
» The new Alienware m17 R4 suffers under its fast hardware
Alienware m15 R4: NVIDIA GeForce RTX 3070 Laptop GPU, 15.60", 2.3 kg
» Alienware m15 R4: Out with the old, in with the new
Gigabyte Aero 17 HDR YC: NVIDIA GeForce RTX 3080 Laptop GPU, 17.30", 2.8 kg
» Gigabyte Aero 17 HDR YC: Great display for creative minds
Lenovo Legion 7 15IMH05-81YT001VGE: NVIDIA GeForce RTX 2080 Super Max-Q, 15.60", 2.4 kg
» The Lenovo Legion 7 is equipped with a breathtaking 240-Hz display
Alienware m17 R3 P45E: NVIDIA GeForce RTX 2080 Super Mobile, 17.30", 3 kg
» Alienware m17 R3 runs the Core i9-10980HK faster than anyone else, but be prepared for super hot 95 C temperatures
MSI WS66 10TMT-207US: NVIDIA Quadro RTX 5000 Max-Q, 15.60", 2.3 kg
» Core i9-powered MSI WS66 workstation is super sleek, super fast and super loud
Asus ROG Zephyrus Duo 15 GX550LXS: NVIDIA GeForce RTX 2080 Super Max-Q, 15.60", 2.5 kg
» Asus' high-tech Zephyrus Duo 15 GX550LXS comes with many accessories
Asus ROG Strix Scar 15 G532LWS: NVIDIA GeForce RTX 2070 Super Mobile, 15.60", 2.4 kg
» MSI GE66 Raider vs. Asus ROG Strix Scar G532: Nothing but the facts
MSI GE66 Raider 10SFS: NVIDIA GeForce RTX 2070 Super Mobile, 15.60", 2.4 kg
» MSI GE66 Raider: light show and monster battery
Asus Strix Scar 17 G732LXS: NVIDIA GeForce RTX 2080 Super Mobile, 17.30", 2.9 kg
» Asus ROG Strix Scar 17: Not only visually striking
MSI GS66 Stealth 10SFS: NVIDIA GeForce RTX 2070 Super Max-Q, 15.60", 2.2 kg
» MSI GS66: Quite loud for a Stealth notebook
Alienware m15 R4 RTX 3080: NVIDIA GeForce RTX 3080 Laptop GPU, 15.60", 2.4 kg
» Does a gaming laptop need good battery life? Dell doesn't think so, judging by the Alienware m15 R4