Reviews for the AMD Ryzen 9 5900HS processor
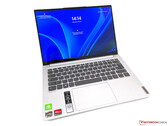
Lenovo Yoga Slim 7 Pro 14 OLED review: A subnotebook with a lot of CPU power
Optionally, Lenovo also offers its compact 14-inch Yoga Slim 7 Pro subnotebook with an OLED display and dedicated GeForce MX450. At the same time, you also don't have to make do without a very powerful AMD Ryzen 9 processor in this configuration.
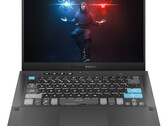
AMD Ryzen 9 5900HS, NVIDIA GeForce MX450, 14", 1.4 kgAsus Zephyrus G14 GA401Q review: Alan Walker Special Edition 14-inch gaming laptop
The Zephyrus G14 is a compact gaming device that was unrivaled for a long time. In order to distance itself from the competition, Asus takes a different approach with the Zephyrus G14 by presenting the device as an "Alan Walker Special Edition" with nice design features that make the device visually eye-catching.
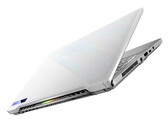
AMD Ryzen 9 5900HS, NVIDIA GeForce RTX 3050 Ti Laptop GPU, 14", 1.7 kgAsus Zephyrus G14 GA401QM Laptop Review: AMD Still Rules The 14-inch Gaming Space
The Zephyrus G14 was the only game in town when it launched early last year, but times have changed. Some aspects of the system still hold up well while others are already starting to age when compared to the new 14-inch Razer Blade 14.
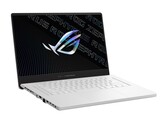
AMD Ryzen 9 5900HS, NVIDIA GeForce RTX 3060 Laptop GPU, 14", 1.7 kgAsus ROG Zephyrus G15 laptop review: Eye-catcher
The Zephyrus G15 might look like a stylish all-rounder laptop at first glance. However, there's powerful high-end hardware from AMD and Nvidia under the hood. We have tested the 15-inch gaming device extensively.
AMD Ryzen 9 5900HS, NVIDIA GeForce RTX 3080 Laptop GPU, 15.6", 2 kgAsus ROG Zephyrus G15 GA503QE: NVIDIA GeForce RTX 3050 Ti Laptop GPU, 15.60", 1.9 kg
External Review » Asus ROG Zephyrus G15 GA503QE
Lenovo Yoga Slim 7 Pro 14 OLED Ryzen 9: NVIDIA GeForce MX450, 14.00", 1.4 kg
External Review » Lenovo Yoga Slim 7 Pro 14 OLED Ryzen 9
Asus ROG Zephyrus G14 GA401QE-HZ047: NVIDIA GeForce RTX 3050 Ti Laptop GPU, 14.00", 1.6 kg
External Review » Asus ROG Zephyrus G14 GA401QE-HZ047
Lenovo Yoga Slim 7 Pro 14ARH5-82NK001PSB: NVIDIA GeForce MX450, 14.00", 1.3 kg
External Review » Lenovo Yoga Slim 7 Pro 14ARH5-82NK001PSB
Asus ROG Zephyrus G14 GA401QM-K2030T: NVIDIA GeForce RTX 3060 Laptop GPU, 14.00", 1.6 kg
External Review » Asus ROG Zephyrus G14 GA401QM-K2030T
Asus ROG Zephyrus G14 GA401QM-HZ109T: NVIDIA GeForce RTX 3060 Laptop GPU, 14.00", 1.7 kg
External Review » Asus ROG Zephyrus G14 GA401QM-HZ109T
Asus Zephyrus G14 GA401QEC: NVIDIA GeForce RTX 3050 Ti Laptop GPU, 14.00", 1.7 kg
External Review » Asus Zephyrus G14 GA401Q - Alan Walker Special Edition
Asus ROG Flow X13 GV301QE-K6149T: NVIDIA GeForce RTX 3050 Ti Laptop GPU, 13.40", 1.3 kg
External Review » Asus ROG Flow X13 GV301QE-K6149T
Asus ROG Flow X13 GV301QH-K6200T: NVIDIA GeForce GTX 1650 Ti Max-Q, 13.40", 1.3 kg
External Review » Asus ROG Flow X13 GV301QH-K6200T
Asus ROG Zephyrus G15 GA503QM: NVIDIA GeForce RTX 3060 Laptop GPU, 15.60", 1.9 kg
External Review » Asus ROG Zephyrus G15 GA503QM
Asus Zephyrus G14 GA401QM-K2023T-BE: NVIDIA GeForce RTX 3060 Laptop GPU, 14.00", 1.6 kg
External Review » Asus Zephyrus G14 GA401QM-K2023T-BE
Asus ROG Zephyrus G15 GA503QR: NVIDIA GeForce RTX 3070 Laptop GPU, 15.60", 1.9 kg
External Review » Asus Zephyrus G15 GA503QR
Asus Zephyrus G14 GA401QM: NVIDIA GeForce RTX 3060 Laptop GPU, 14.00", 1.7 kg
External Review » Asus Zephyrus G14 GA401QM
Asus ROG Zephyrus G15 GA503Q: NVIDIA GeForce RTX 3080 Laptop GPU, 15.60", 2 kg
External Review » Asus ROG Zephyrus G15 GA503Q
Asus ROG Zephyrus G15 GA503QS: NVIDIA GeForce RTX 3080 Laptop GPU, 15.60", 1.9 kg
External Review » Asus Zephyrus G15 GA503QS
Lenovo Yoga Slim 7 Pro 14 OLED Ryzen 9: NVIDIA GeForce MX450, 14.00", 1.4 kg
» Intel's Alder Lake is slower than AMD's Cezanne Zen 3 at 45W TDP
Asus Zephyrus G14 GA401QM: NVIDIA GeForce RTX 3060 Laptop GPU, 14.00", 1.7 kg
» Specs on specs: the ultimate Asus Zephyrus G14 vs. Razer Blade 14 comparison table
Asus ROG Zephyrus G15 GA503Q: NVIDIA GeForce RTX 3080 Laptop GPU, 15.60", 2 kg
» Sexy Beast: Asus ROG Zephyrus G15