Reviews for the Intel Core i5-1335U processor
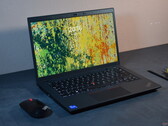
Lenovo ThinkPad L14 Gen 4 Intel Review: Not up to par anymore
Before testing the newest models of the ThinkPad L series, we take a look back. The Lenovo ThinkPad L14 Gen 4 Intel has many worthwhile attributes for office workers, but falters in a few important disciplines compared to more modern competitors - with the screen as an important example.
Intel Core i5-1335U, Iris Xe G7 80EUs, 14", 1.6 kgHP EliteBook x360 830 G10 Laptop Review: Metal convertible with non-reflective touchscreen
Convertible laptops are not the bulk of the market, but for users who need the pen and touch, they are indispensable. The HP EliteBook x360 830 G10 goes for the business side of the market, going head to head with the likes of the Lenovo ThinkPad X13 Yoga Gen 4.
Intel Core i5-1335U, Iris Xe G7 80EUs, 13.3", 1.3 kgAcer TravelMate P4 laptop review: Understatement is for the bosses
Inconspicuous emissions, visual understatement, quiet keys, a large ClickPad, and hardware that can be upgraded: Acer's 14-inch laptop can compete with Windows notebooks at the level of the HP ProBook, Lenovo ThinkPad, and Dell Latitude. But in contrast to those, it avoids standing out at all costs.
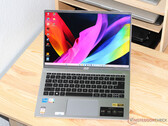
Intel Core i5-1335U, Iris Xe G7 80EUs, 14", 1.5 kgAcer Swift Go 14 (2023) review: The 14-inch laptop with a 2.9k OLED panel for US$800
The Swift Go 14 boasts a low weight (1.3 kg), an aluminum case and an OLED screen (2,880 x 1,800 pixels, 90 Hz) with a work-friendly 16:10 aspect ratio. Furthermore, the laptop features two USB 4 ports, a QHD webcam and an attractive price (US$800).
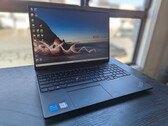
Intel Core i5-1335U, Iris Xe G7 80EUs, 14", 1.3 kgLenovo ThinkPad E16 G1 Intel review: Core i5 is neck-to-neck with AMD Ryzen 7
If you're not excited about spending thousands of dollars on a fancy ThinkPad X1 Carbon, then the more down-to-Earth ThinkPad E16 G1 might be worthwhile. Just make sure to choose the correct display, battery, and CPU option.
Intel Core i5-1335U, Iris Xe G7 80EUs, 16", 1.8 kgLenovo ThinkPad X13 Yoga G4 21F20017GE: Intel Iris Xe Graphics G7 80EUs, 13.30", 1.3 kg
Review » Lenovo ThinkPad X13 Yoga G4 Laptop Review: Convertible with long battery life and weak performance
Lenovo ThinkPad T14 G4 21HD0043GE: Intel Iris Xe Graphics G7 80EUs, 14.00", 1.4 kg
Review » Lenovo ThinkPad T14 G4 Intel Laptop Review: Raptor Lake update for the T series
HP EliteBook 1040 G10 818N7EA: Intel Iris Xe Graphics G7 80EUs, 14.00", 1.3 kg
Review » HP EliteBook 1040 G10 laptop review - HP's response to the ThinkPad X1 Carbon
Lenovo IdeaPad Flex 5 14IRU8: Intel Iris Xe Graphics G7 80EUs, 14.00", 1.6 kg
Review » Lenovo IdeaPad Flex 5i 14IRU8 review: Affordable 14-inch convertible with Thunderbolt 4
Acer Aspire 5 Spin 14: Intel Iris Xe Graphics G7 80EUs, 14.00", 1.6 kg
Review » Acer Aspire 5 Spin 14 review: The 2-in-1 laptop with an active stylus
Samsung Galaxy Book3 15, Core i5-1335U: Intel Iris Xe Graphics G7 80EUs, 15.60", 1.5 kg
Review » Samsung Galaxy Book3 review: The Intel Core i5-1335U celebrates a solid premiere
Lenovo Thinkpad E14 G5, i5-1335U: Intel Iris Xe Graphics G7 80EUs, 14.00", 1.5 kg
External Review » Lenovo Thinkpad E14 G5, i5-1335U
MSI Modern 14 F13MG: Intel Iris Xe Graphics G7 80EUs, 14.00", 1.5 kg
External Review » MSI Modern 14 F13MG
Asus Chromebook Plus CX3402CVA : Intel Iris Xe Graphics G7 80EUs, 14.00", 1.5 kg
External Review » Asus Chromebook Plus CX3402CVA
Acer TravelMate P4 TMP414-53-58XQ: Intel Iris Xe Graphics G7 80EUs, 14.00", 1.5 kg
External Review » Acer TravelMate P4 TMP414-53-58XQ
Asus ExpertBook B1 B1503CVA: Intel Iris Xe Graphics G7 80EUs, 15.60", 1.7 kg
External Review » Asus ExpertBook B1 B1503CVA
MSI Modern 15 F13MG: Intel Iris Xe Graphics G7 80EUs, 15.60", 1.7 kg
External Review » MSI Modern 15 F13MG
Dell Latitude 3550: Intel Iris Xe Graphics G7 80EUs, 15.60", 1.8 kg
External Review » Dell Latitude 3550
Acer Swift Go 14 SFG14-71: Intel Iris Xe Graphics G7 80EUs, 14.00", 1.3 kg
External Review » Acer Swift Go 14 SFG14-71
Acer Aspire 5 A514-56M, i5-1335U: Intel Iris Xe Graphics G7 80EUs, 14.00", 1.7 kg
External Review » Acer Aspire 5 A514-56M, i5-1335U
Asus ExpertBook B1 B1502CVA: Intel Iris Xe Graphics G7 80EUs, 15.60", 1.7 kg
External Review » Asus ExpertBook B1 B1502CVA
Acer Swift Go 16 SFG16-71, i5-1335U: Intel Iris Xe Graphics G7 80EUs, 16.00", 1.6 kg
External Review » Acer Swift Go 16 SFG16-71, i5-1335U
Acer Chromebook Plus 515 CB515-2H, i5-1335U: Intel Iris Xe Graphics G7 80EUs, 15.60", 1.7 kg
External Review » Acer Chromebook Plus 515 CB515-2H, i5-1335U
Dell Latitude 13 5340: Intel Iris Xe Graphics G7 80EUs, 13.30", 1.2 kg
External Review » Dell Latitude 13 5340
Acer TravelMate P6 TMP614-53, i5-1335U: Intel Iris Xe Graphics G7 80EUs, 14.00", 1.1 kg
External Review » Acer TravelMate P6 TMP614-53, i5-1335U
Lenovo ThinkBook 16 G6 IRL: Intel Iris Xe Graphics G7 80EUs, 16.00", 1.7 kg
External Review » Lenovo ThinkBook 16 G6 IRL
Lenovo ThinkPad T16 G2, i5-1335U: Intel Iris Xe Graphics G7 80EUs, 16.00", 1.7 kg
External Review » Lenovo ThinkPad T16 G2, i5-1335U
HP 470 G10: Intel Iris Xe Graphics G7 80EUs, 17.30", 2.1 kg
External Review » HP 470 G10
Lenovo ThinkPad L13 G4: Intel Iris Xe Graphics G7 80EUs, 13.30", 1.3 kg
External Review » Lenovo ThinkPad L13 G4
HP Pavilion 15-eg3000ng: Intel Iris Xe Graphics G7 80EUs, 15.60", 1.7 kg
External Review » HP Pavilion 15-eg3000ng
HP EliteBook 640 G10: Intel Iris Xe Graphics G7 80EUs, 14.00", 1.4 kg
External Review » HP EliteBook 640 G10
Acer TravelMate P4 TMP413-51: Intel Iris Xe Graphics G7 80EUs, 13.30", 1.4 kg
External Review » Acer TravelMate P4 TMP413-51
HP Pavilion SE 14-ep0000: Intel Iris Xe Graphics G7 80EUs, 14.00", 2.3 kg
External Review » HP Pavilion SE 14-ep0000
HP 240 G10: Intel Iris Xe Graphics G7 80EUs, 14.00", 1.4 kg
External Review » HP 240 G10
HP EliteBook 650 G10: Intel Iris Xe Graphics G7 80EUs, 15.60", 1.8 kg
External Review » HP EliteBook 650 G10
Acer TravelMate P2 TMP216-51: Intel Iris Xe Graphics G7 80EUs, 16.00", 1.9 kg
External Review » Acer TravelMate P2 TMP216-51
Lenovo IdeaPad Duet 5 12IRU8: Intel Iris Xe Graphics G7 80EUs, 12.40", 0.7 kg
External Review » Lenovo IdeaPad Duet 5 12IRU8
HP 250 G10: Intel Iris Xe Graphics G7 80EUs, 15.60", 1.5 kg
External Review » HP 250 G10
HP Pavilion 15-eg3000: Intel Iris Xe Graphics G7 80EUs, 15.60", 1.7 kg
External Review » HP Pavilion 15-eg3000
HP Spectre x360 14-ef2000: Intel Iris Xe Graphics G7 80EUs, 13.50", 1.4 kg
External Review » HP Spectre x360 14-ef2000
Asus Vivobook 14 X1404VA: Intel Iris Xe Graphics G7 80EUs, 14.00", 1.4 kg
External Review » Asus Vivobook 14 X1404VA
HP Envy Move: Intel Iris Xe Graphics G7 80EUs, 23.80", 4.1 kg
External Review » HP Envy Move
Lenovo ThinkPad E16 G1 Core i5-1335U: Intel Iris Xe Graphics G7 80EUs, 16.00", 1.8 kg
External Review » Lenovo ThinkPad E16 G1 Core i5-1335U
HP 14-ee0000: Intel Iris Xe Graphics G7 80EUs, 14.00", 1.4 kg
External Review » HP 14-ee0000
Lenovo ThinkPad T14 G4 21HD0043GE: Intel Iris Xe Graphics G7 80EUs, 14.00", 1.4 kg
External Review » Lenovo ThinkPad T14 G4 21HD0043GE
Asus Vivobook 17 F1704: Intel Iris Xe Graphics G7 96EUs, 17.30", 2.1 kg
External Review » Asus Vivobook 17 F1704
Dell Vostro 14 3430: Intel Iris Xe Graphics G7 80EUs, 14.00", 1.4 kg
External Review » Dell Vostro 14 3430
Dell Inspiron 15 3530: Intel Iris Xe Graphics G7 80EUs, 15.60", 1.7 kg
External Review » Dell Inspiron 15 3530
Asus VivoBook 16 X1605VA: Intel Iris Xe Graphics G7 80EUs, 16.00", 1.9 kg
External Review » Asus VivoBook 16 X1605VA
Acer Swift Go 14 SFG14-71, i5-1335U: Intel Iris Xe Graphics G7 80EUs, 14.00", 1.3 kg
External Review » Acer Swift Go 14 SFG14-71, i5-1335U
Acer Aspire Vero AV15-53P-59MT: Intel Iris Xe Graphics G7 80EUs, 15.60", 1.7 kg
External Review » Acer Aspire Vero AV15-53P-59MT
Lenovo ThinkPad X13 Yoga G4 21F20017GE: Intel Iris Xe Graphics G7 80EUs, 13.30", 1.3 kg
External Review » Lenovo ThinkPad X13 Yoga G4 21F20017GE
HP Envy x360 15-fe0000: Intel Iris Xe Graphics G7 80EUs, 15.60", 1.8 kg
External Review » HP Envy x360 15-fe0000
Dell Inspiron 16 7630 2-in-1: Intel Iris Xe Graphics G7 80EUs, 16.00", 2.1 kg
External Review » Dell Inspiron 16 7630 2-in-1
Acer Chromebook Spin 714 CP714-2WN: Intel Iris Xe Graphics G7 80EUs, 14.00", 1.4 kg
External Review » Acer Chromebook Spin 714 CP714-2WN
HP 15s-fd0082ns: Intel Iris Xe Graphics G7 80EUs, 15.60", 1.6 kg
External Review » HP 15s-fd0082ns
HP ProBook 440 G10: Intel Iris Xe Graphics G7 80EUs, 14.00", 1.4 kg
External Review » HP ProBook 440 G10
HP ProBook 450 G10: Intel Iris Xe Graphics G7 80EUs, 15.60", 1.8 kg
External Review » HP ProBook 450 G10
Lenovo ThinkBook 14s Yoga IRU G3: Intel Iris Xe Graphics G7 80EUs, 14.00", 1.5 kg
External Review » Lenovo ThinkBook 14s Yoga IRU G3
Asus Vivobook 15 X1504VA: Intel Iris Xe Graphics G7 80EUs, 15.60", 1.7 kg
External Review » Asus Vivobook 15 X1504VA
Samsung Galaxy Book3 15, Core i5-1335U: Intel Iris Xe Graphics G7 80EUs, 15.60", 1.5 kg
External Review » Samsung Galaxy Book3 15, Core i5-1335U
MSI Modern 14 C13M: Intel Iris Xe Graphics G7 80EUs, 14.00", 1.4 kg
External Review » MSI Modern 14 C13M
Asus ZenBook S13 OLED UX5304, i5-1335U: Intel Iris Xe Graphics G7 80EUs, 13.30", 1.1 kg
External Review » Asus ZenBook S13 OLED UX5304, i5-1335U
Acer Aspire 5 Spin 14: Intel Iris Xe Graphics G7 80EUs, 14.00", 1.6 kg
External Review » Acer Aspire 5 Spin 14
Dell Inspiron 14 5430: Intel Iris Xe Graphics G7 80EUs, 14.00", 1.7 kg
External Review » Dell Inspiron 14 5430
Lenovo IdeaPad Flex 5 14IRU8: Intel Iris Xe Graphics G7 80EUs, 14.00", 1.6 kg
External Review » Lenovo IdeaPad Flex 5 14IRU8
HP Pavilion x360 14-ek1000: Intel Iris Xe Graphics G7 80EUs, 14.00", 1.5 kg
External Review » HP Pavilion x360 14-ek1000
Acer Aspire 5 A515-58: Intel Iris Xe Graphics G7 80EUs, 15.60", 1.8 kg
External Review » Acer Aspire 5 A515-58
Acer Swift Go 14 SFG14-71: Intel Iris Xe Graphics G7 80EUs, 14.00", 1.3 kg
» Acer Swift Go 14 OLED price dips to historic low again as Meteor Lake laptop records 20% discount
Lenovo ThinkPad T14 G4 21HD0043GE: Intel Iris Xe Graphics G7 80EUs, 14.00", 1.4 kg
» ThinkPad T14 Gen 4 laptop drops to $563 in Lenovo's intriguing outlet sale
HP EliteBook x360 830 G10 7L7U1ET: Intel Iris Xe Graphics G7 80EUs, 13.30", 1.3 kg
» EliteBook x360 830 G10: Great convertible for business customers
Lenovo ThinkPad E16 G1 Core i5-1335U: Intel Iris Xe Graphics G7 80EUs, 16.00", 1.8 kg
» Lenovo ThinkPad E16 laptop with AMD Ryzen 5 7530U and 24GB RAM marked down by 45%
Acer Aspire Vero AV15-53P-59MT: Intel Iris Xe Graphics G7 80EUs, 15.60", 1.7 kg
» Acer Aspire Vero 15 review: The sustainable waste-laptop with a QHD webcam surpasses all expectations
Acer Swift Go 14 SFG14-71: Intel Iris Xe Graphics G7 80EUs, 14.00", 1.3 kg
» MacBook Air Acer-style with OLED, USB 4 and a moderate price
Lenovo ThinkPad X13 Yoga G4 21F20017GE: Intel Iris Xe Graphics G7 80EUs, 13.30", 1.3 kg
» Lenovo ThinkPad X13 Yoga G4: ThinkPads should utilize magnesium more
Lenovo ThinkPad T14 G4 21HD0043GE: Intel Iris Xe Graphics G7 80EUs, 14.00", 1.4 kg
» Lenovo ThinkPad T14 Gen 4: Intel version without performance punch
HP EliteBook 1040 G10 818N7EA: Intel Iris Xe Graphics G7 80EUs, 14.00", 1.3 kg
» HP's EliteBook 1040 G10 shows weaknesses in the display and fan management