Acer TravelMate P4 laptop review: Understatement is for the bosses

For several years, Acer's TravelMate series has been struggling against the fan clubs of the Dell Latitudes, against the good reputation of the Lenovo ThinkPads, and against the business aura of the HP ProBooks. It isn't easy to get a foot in the door in the segment of mainstream business laptops, and this can best be done using large bulk sales to businesses.
We've been accompanying the TravelMates in their struggles for years. They didn't do a bad job, and with the TravelMate P6 TMP614P we even had a candidate that achieved 88% in our lab, which corresponds to "very good." But the same was never the case for the P4 models, and the previous TravelMate P4 achieved 86%. The result was that our recommendations always went to the ThinkPads that often offered the better price-performance ratio and continue to dominate the Top 10.
Will this also be the case here, or will Acer be able to hold its ground with the 2024 TravelMate P4? At between 900 and 1,000 Euros (~$979-1,087), the 14-inch laptop falls into the midrange, so it has to compete against ProBooks, simply equipped Latitudes, and Lenovo's E series ThinkPads. While the equipment isn't the best with the Raptor Lake Core i5, 512 GB, and 8 GB of RAM, it should attract some price-conscious buyers. In addition, Acer has completely revamped the input devices and positions of the connections compared to the TravelMate P4 TMP414-51-59MR predecessor. Will this be enough, though?
Possible Competitors in Comparison
Rating | Date | Model | Weight | Height | Size | Resolution | Price |
|---|---|---|---|---|---|---|---|
| 85.9 % v7 (old) | 01 / 2024 | Acer TravelMate P4 TMP414-53-58XQ i5-1335U, Iris Xe G7 80EUs | 1.5 kg | 22 mm | 14.00" | 1920x1200 | |
| 90.3 % v7 (old) | 07 / 2023 | Dell Latitude 7440 i5-1345U, Iris Xe G7 80EUs | 1.2 kg | 17.95 mm | 14.00" | 2560x1600 | |
| 88.3 % v7 (old) | 08 / 2023 | Lenovo ThinkPad E14 G5-21JSS05C00 R7 7730U, Vega 8 | 1.4 kg | 18 mm | 14.00" | 2240x1400 | |
| 86 % v7 (old) | 10 / 2023 | Lenovo ThinkPad E14 G5 i7-1355U i7-1355U, Iris Xe G7 96EUs | 1.5 kg | 17.99 mm | 14.00" | 1920x1200 | |
| 85.3 % v7 (old) | 03 / 2023 | HP ProBook 440 G9-5Y3Z3EA i7-1255U, Iris Xe G7 96EUs | 1.4 kg | 20.4 mm | 14.00" | 1920x1080 | |
| 84.6 % v7 (old) | 10 / 2023 | HP ProBook 445 G10 R5 7530U, Vega 7 | 1.3 kg | 20 mm | 14.00" | 1920x1080 | |
| 82.1 % v7 (old) | 06 / 2023 | Fujitsu LifeBook E5412A E542AMHAAMDE R5 PRO 5675U, Vega 7 | 1.4 kg | 19.9 mm | 14.00" | 1920x1080 |
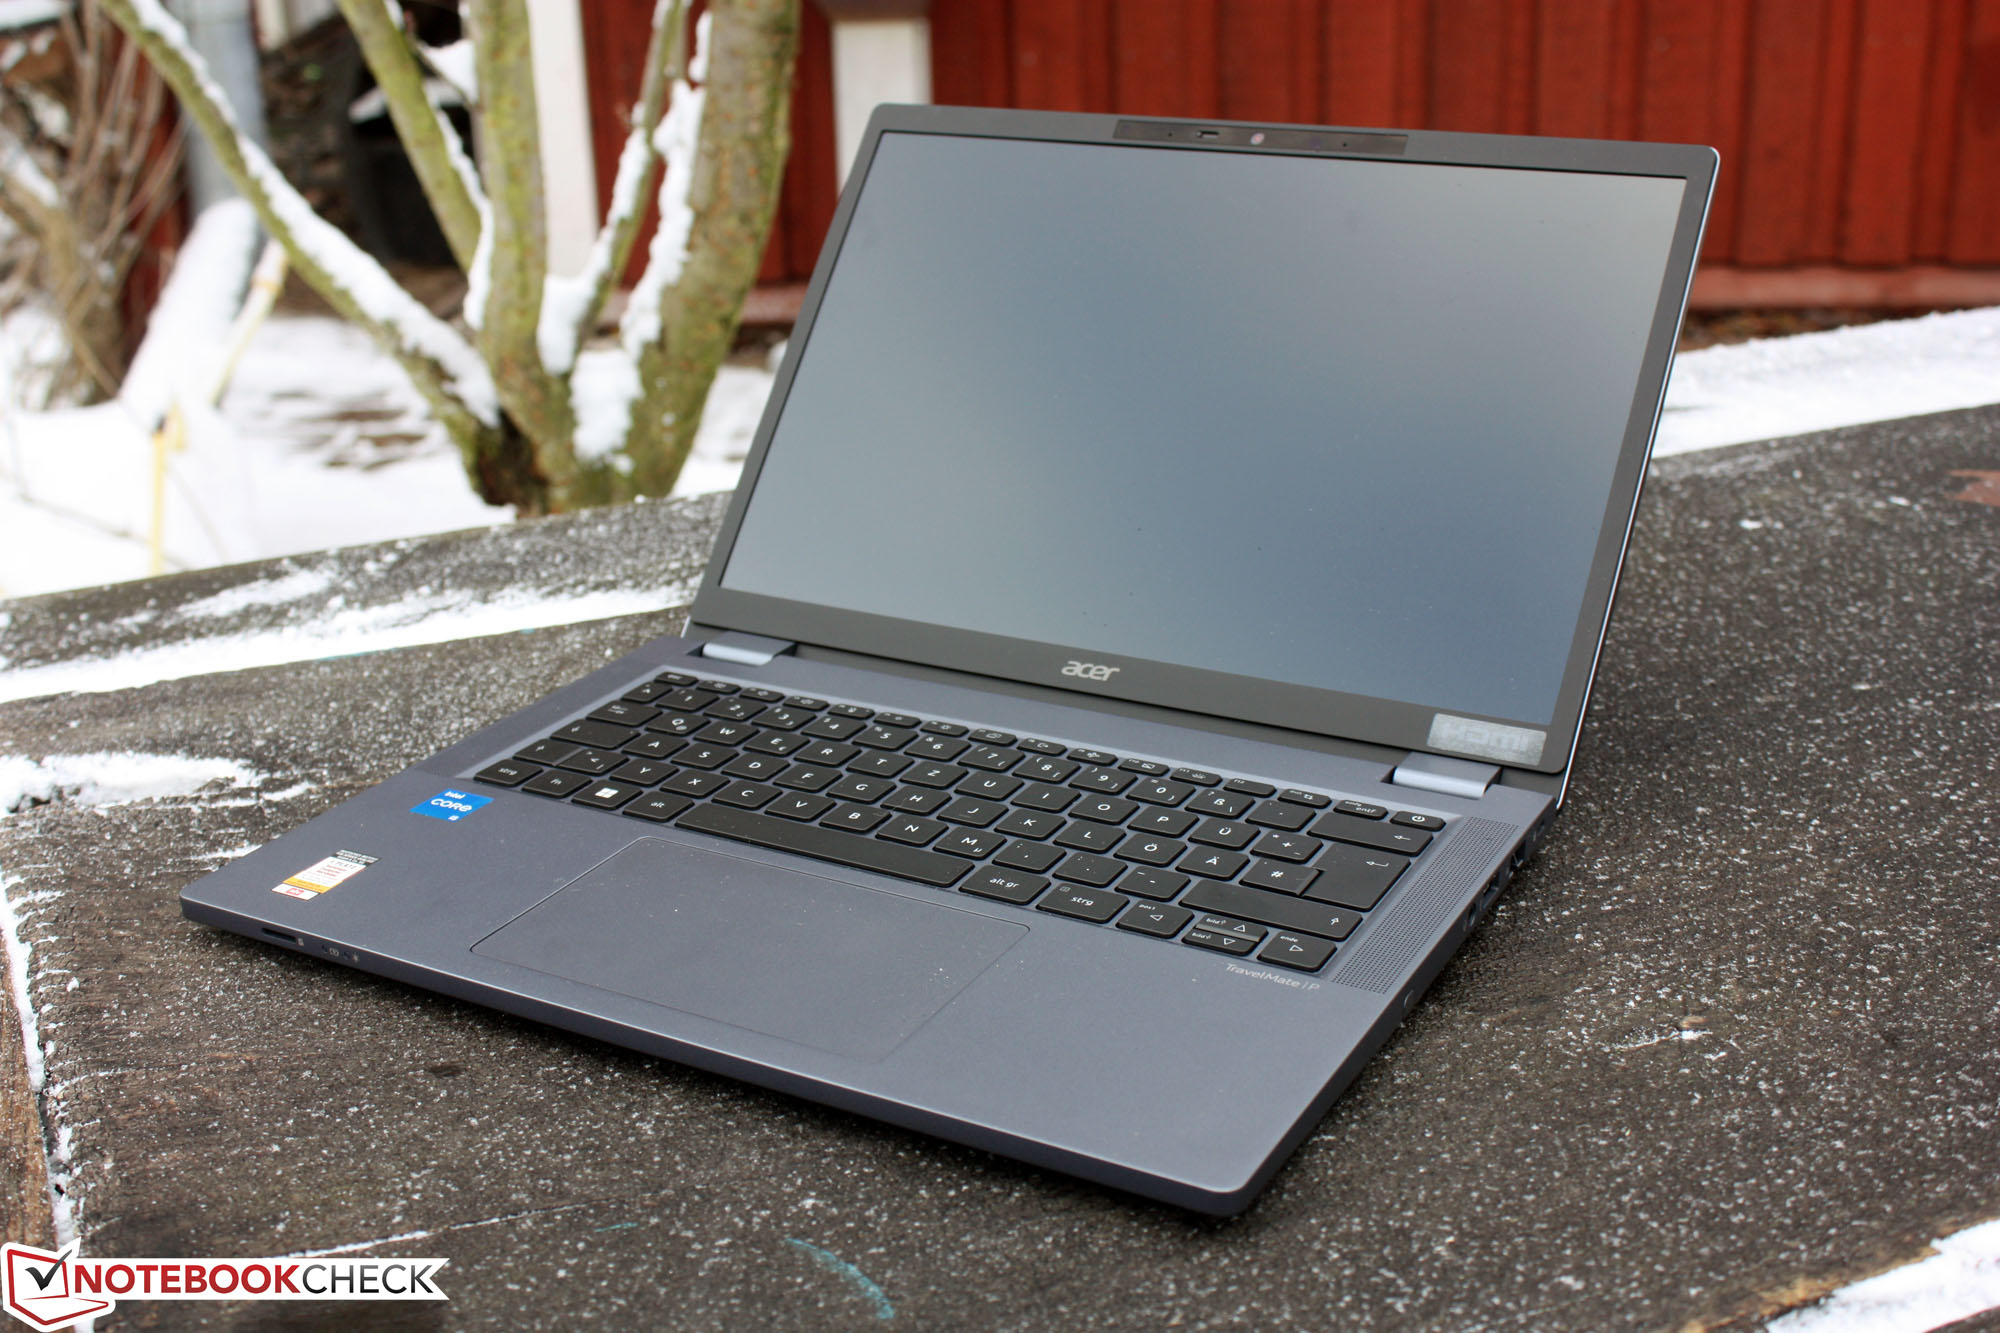
Case
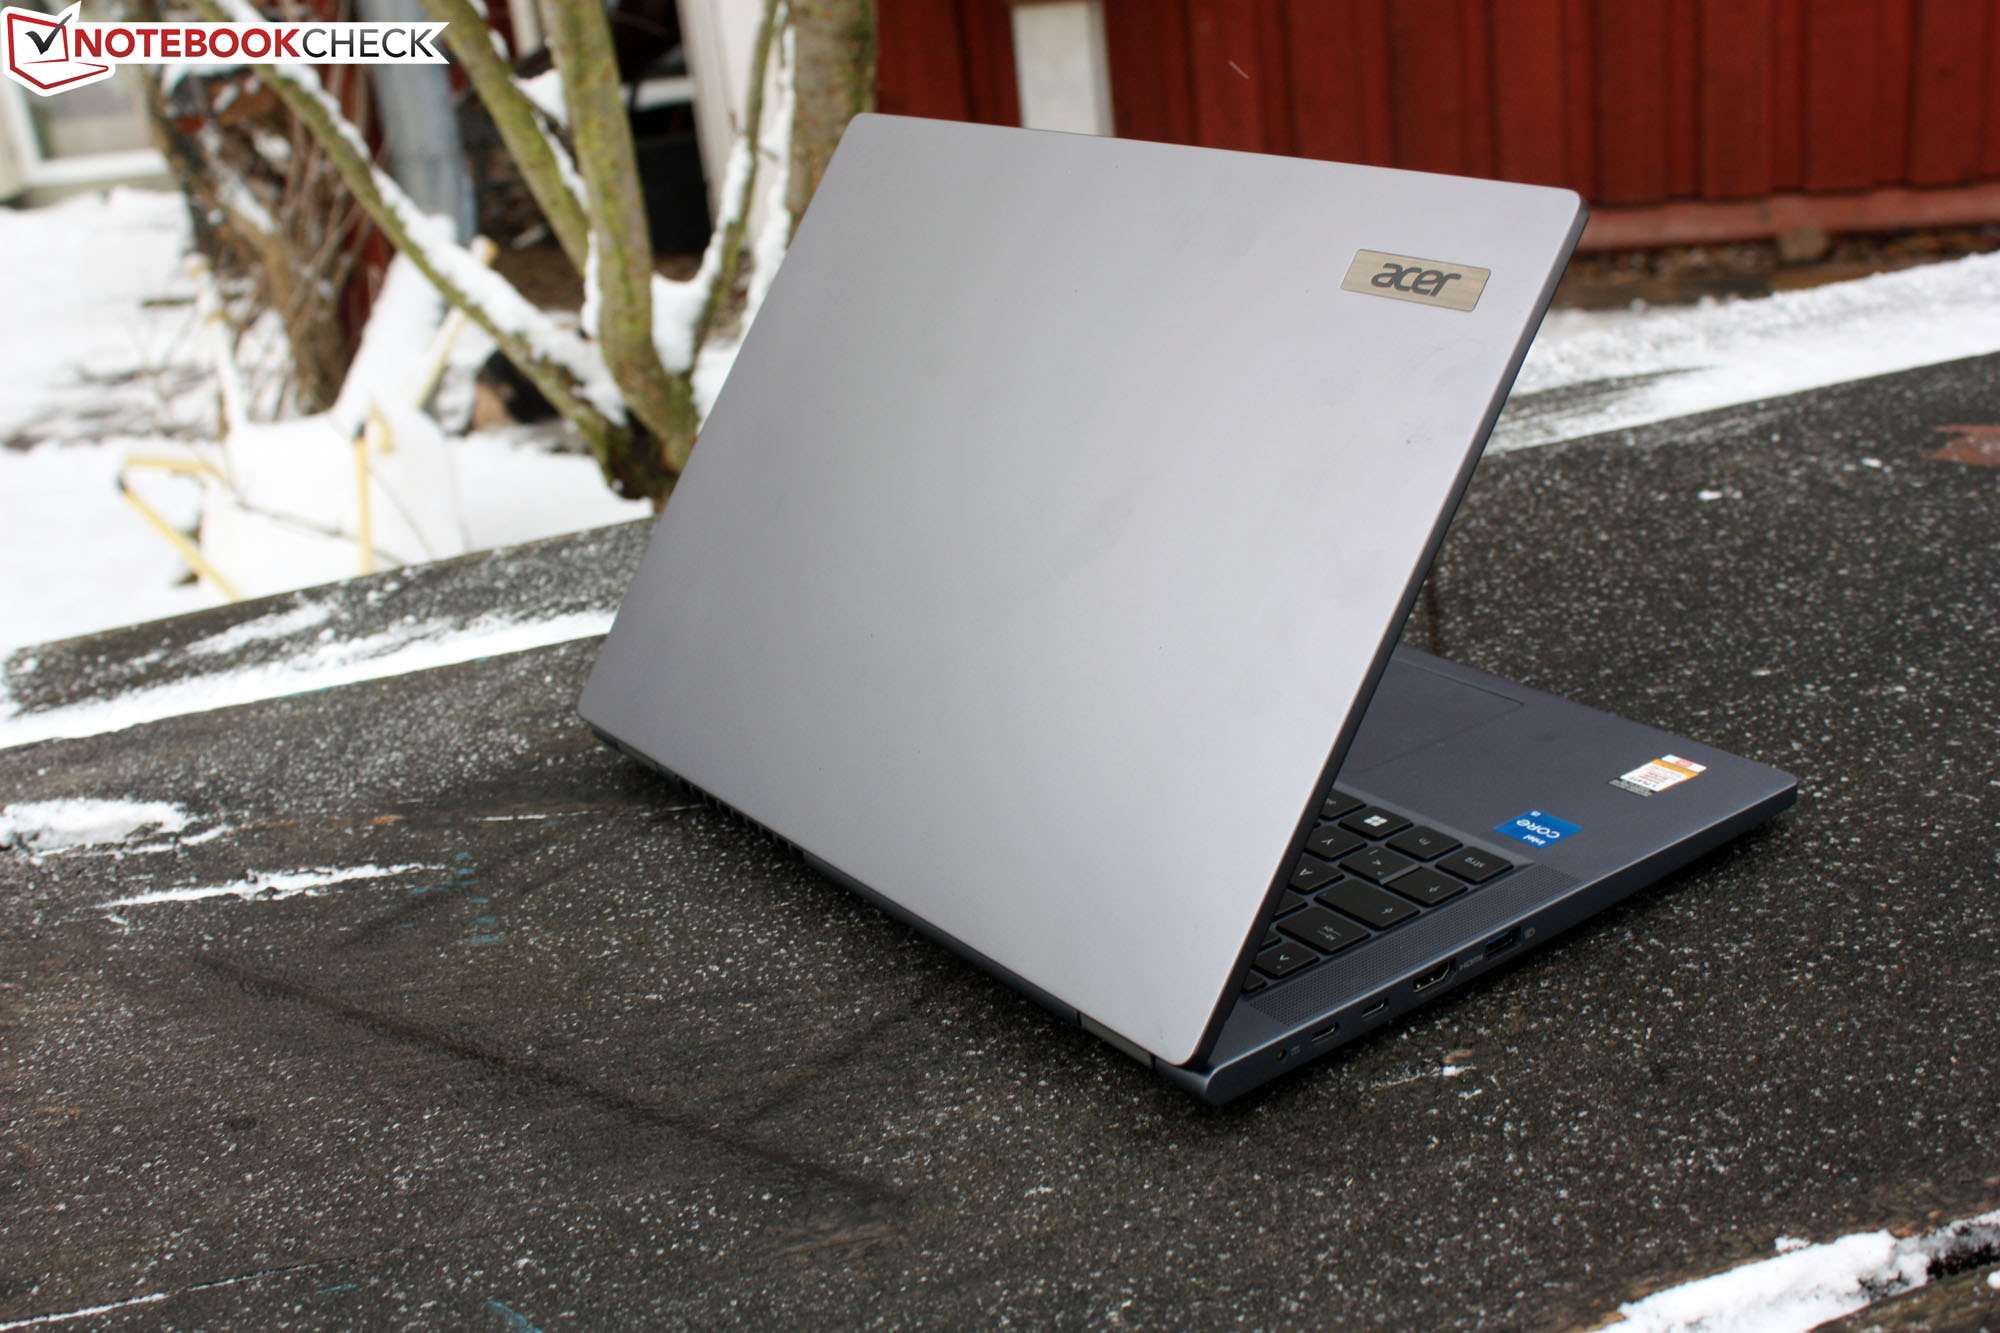
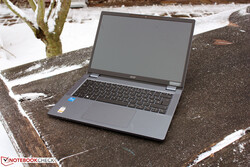
The simple, mouse-gray case can be considered the embodiment of inconspicuousness. Those who are traveling with the TravelMate will definitely not draw any attention. But this is fine, since as a back-office laptop, it needs qualities other than decorative chrome strips. The angular 14-inch case offers a good but not excellent robustness. The palm rest and keyboard area don't have any give at all, even when applying some pressure. The 16:10 form factor of the display results in a deep palm rest that also offers plenty of space for large hands to feel comfortable. The hinges keep the display tightly in place, so it doesn't move when carrying the laptop around. The display lid can be opened to a full 180 degrees.
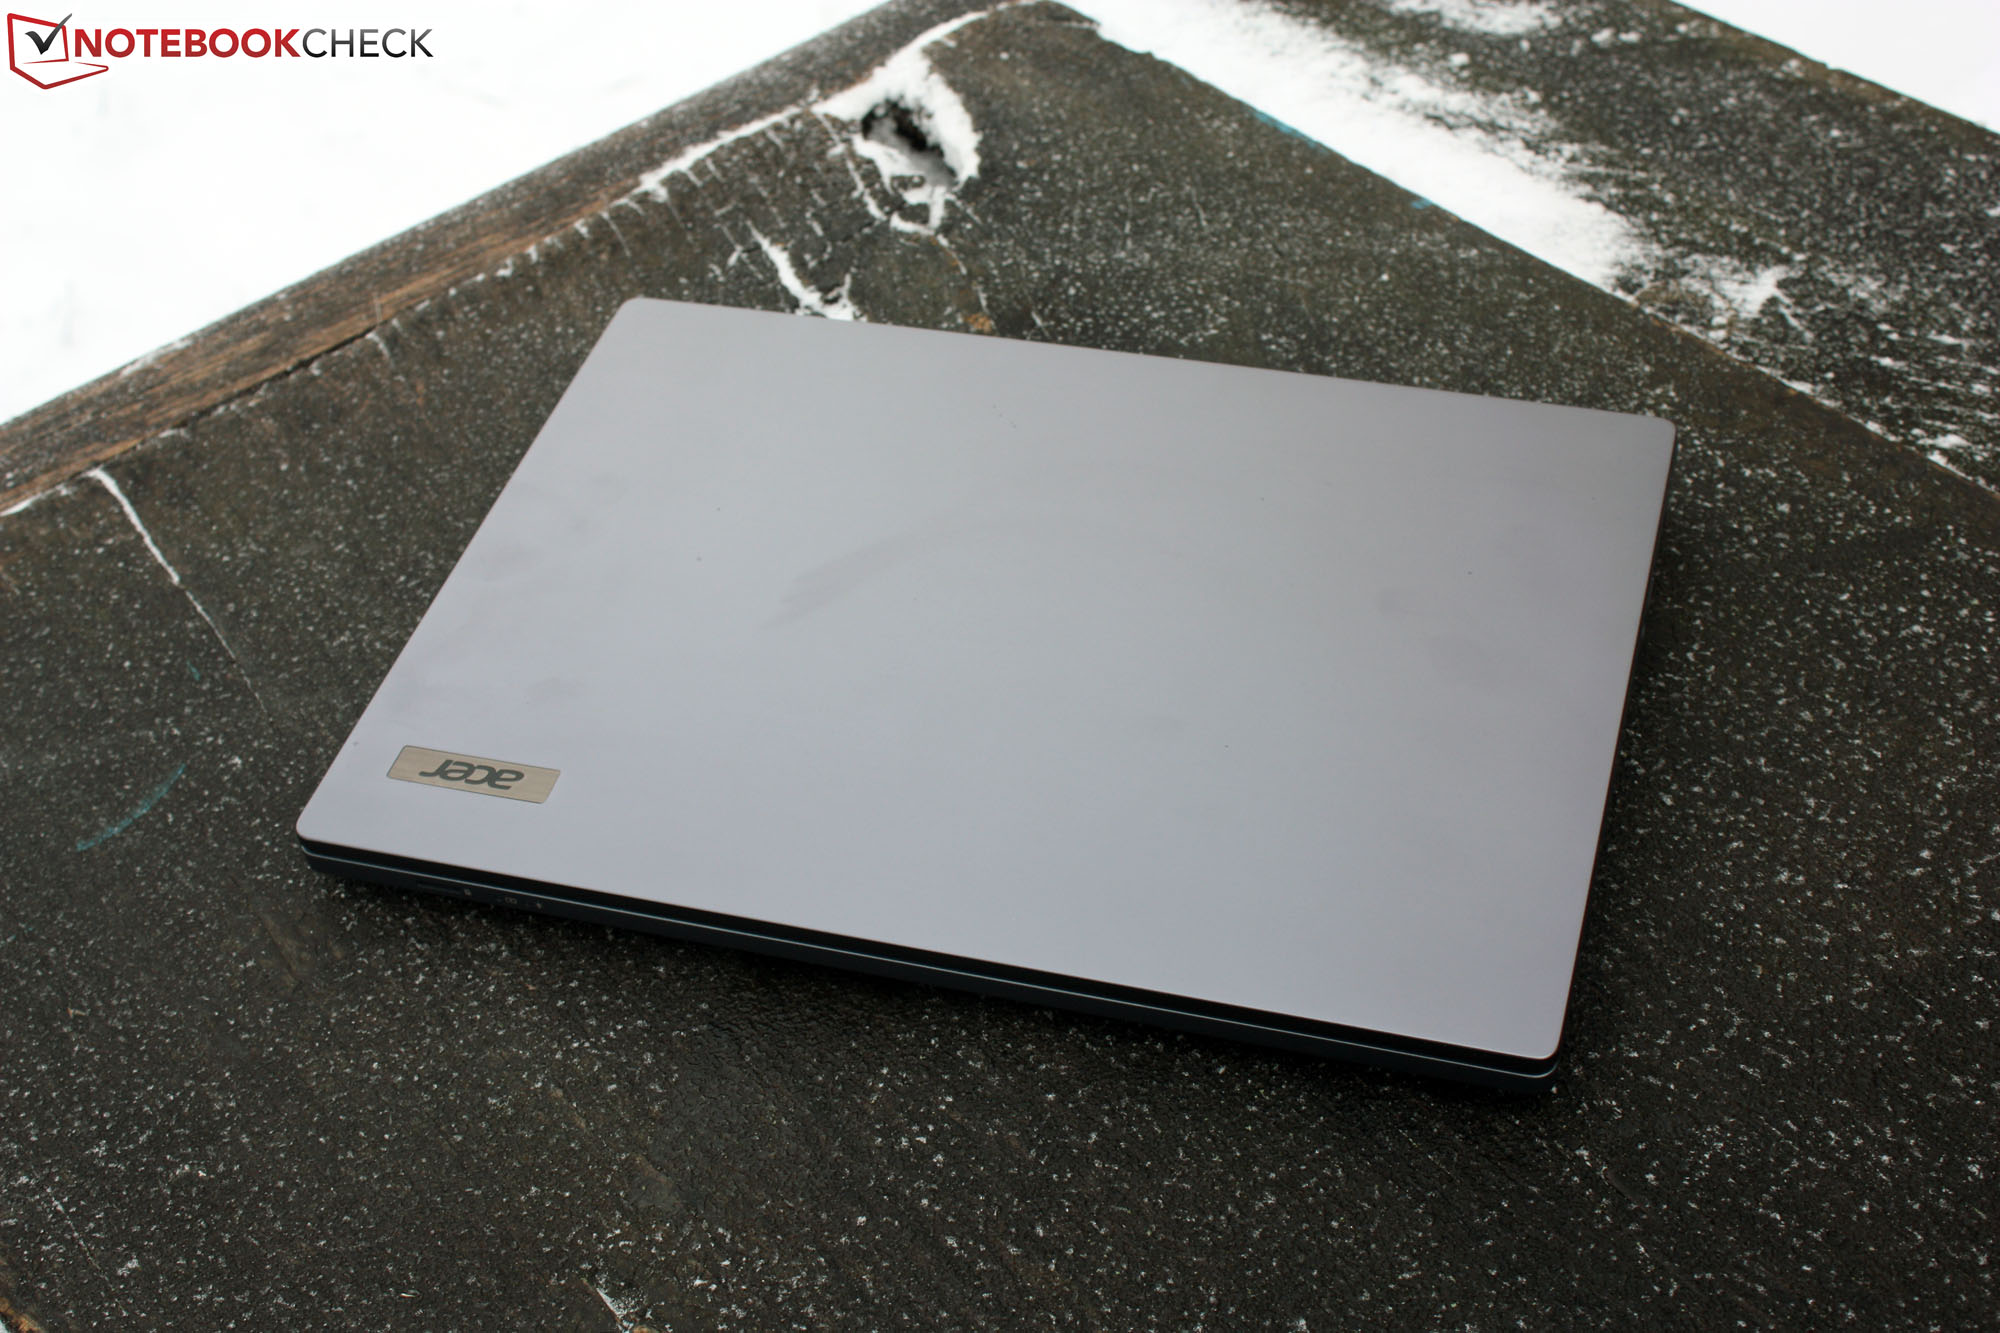

The 14-inch laptop is 1 cm wider and deeper than a DIN A4 paper, with a width of 31.9 cm (12.6 in). Both of the ThinkPads are slightly more compact, having smaller display bezels with the same display diagonal, which saves a few millimeters in terms of width and depth. Even though midrange office laptops don't try to be as slim as possible, the thickness isn't the same for all of them: At 22 mm (~0.87 in) in the back and 19 mm (~0.75 in) in front, our Acer test unit is thicker than the ThinkPad, ProBook, LifeBook, and Latitude. These values are always specified without the feet, and adding their height, the TravelMate even reaches 27 mm (~1.06 in) in the back and 21 mm (~0.83 in) in front.
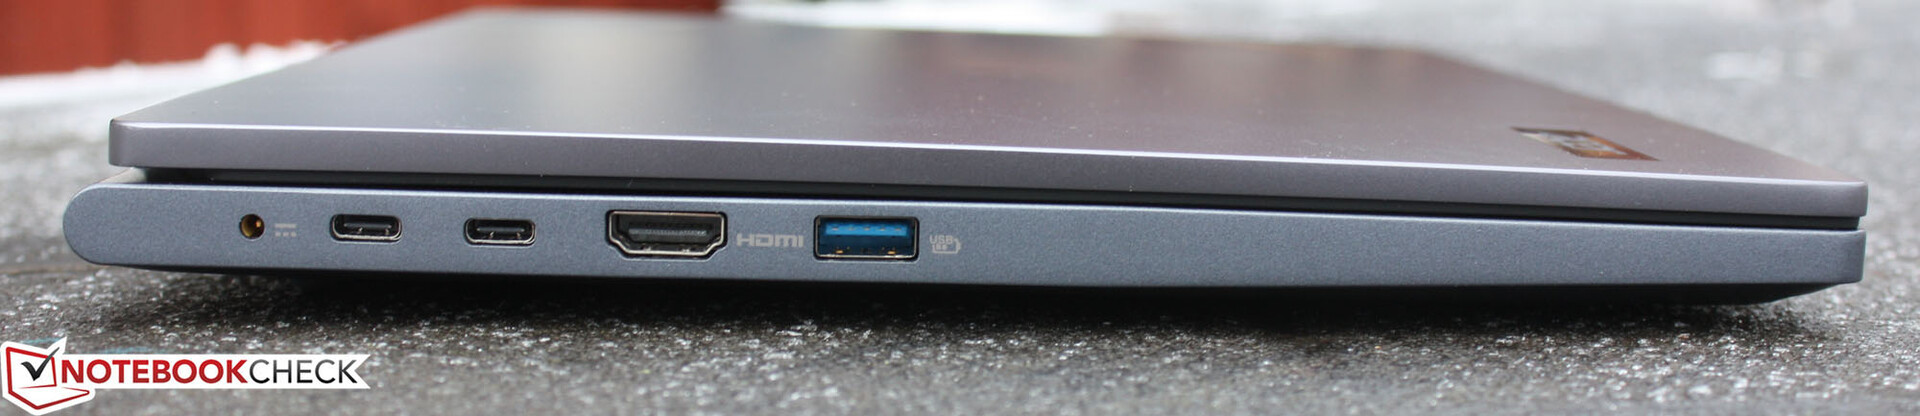
Equipment
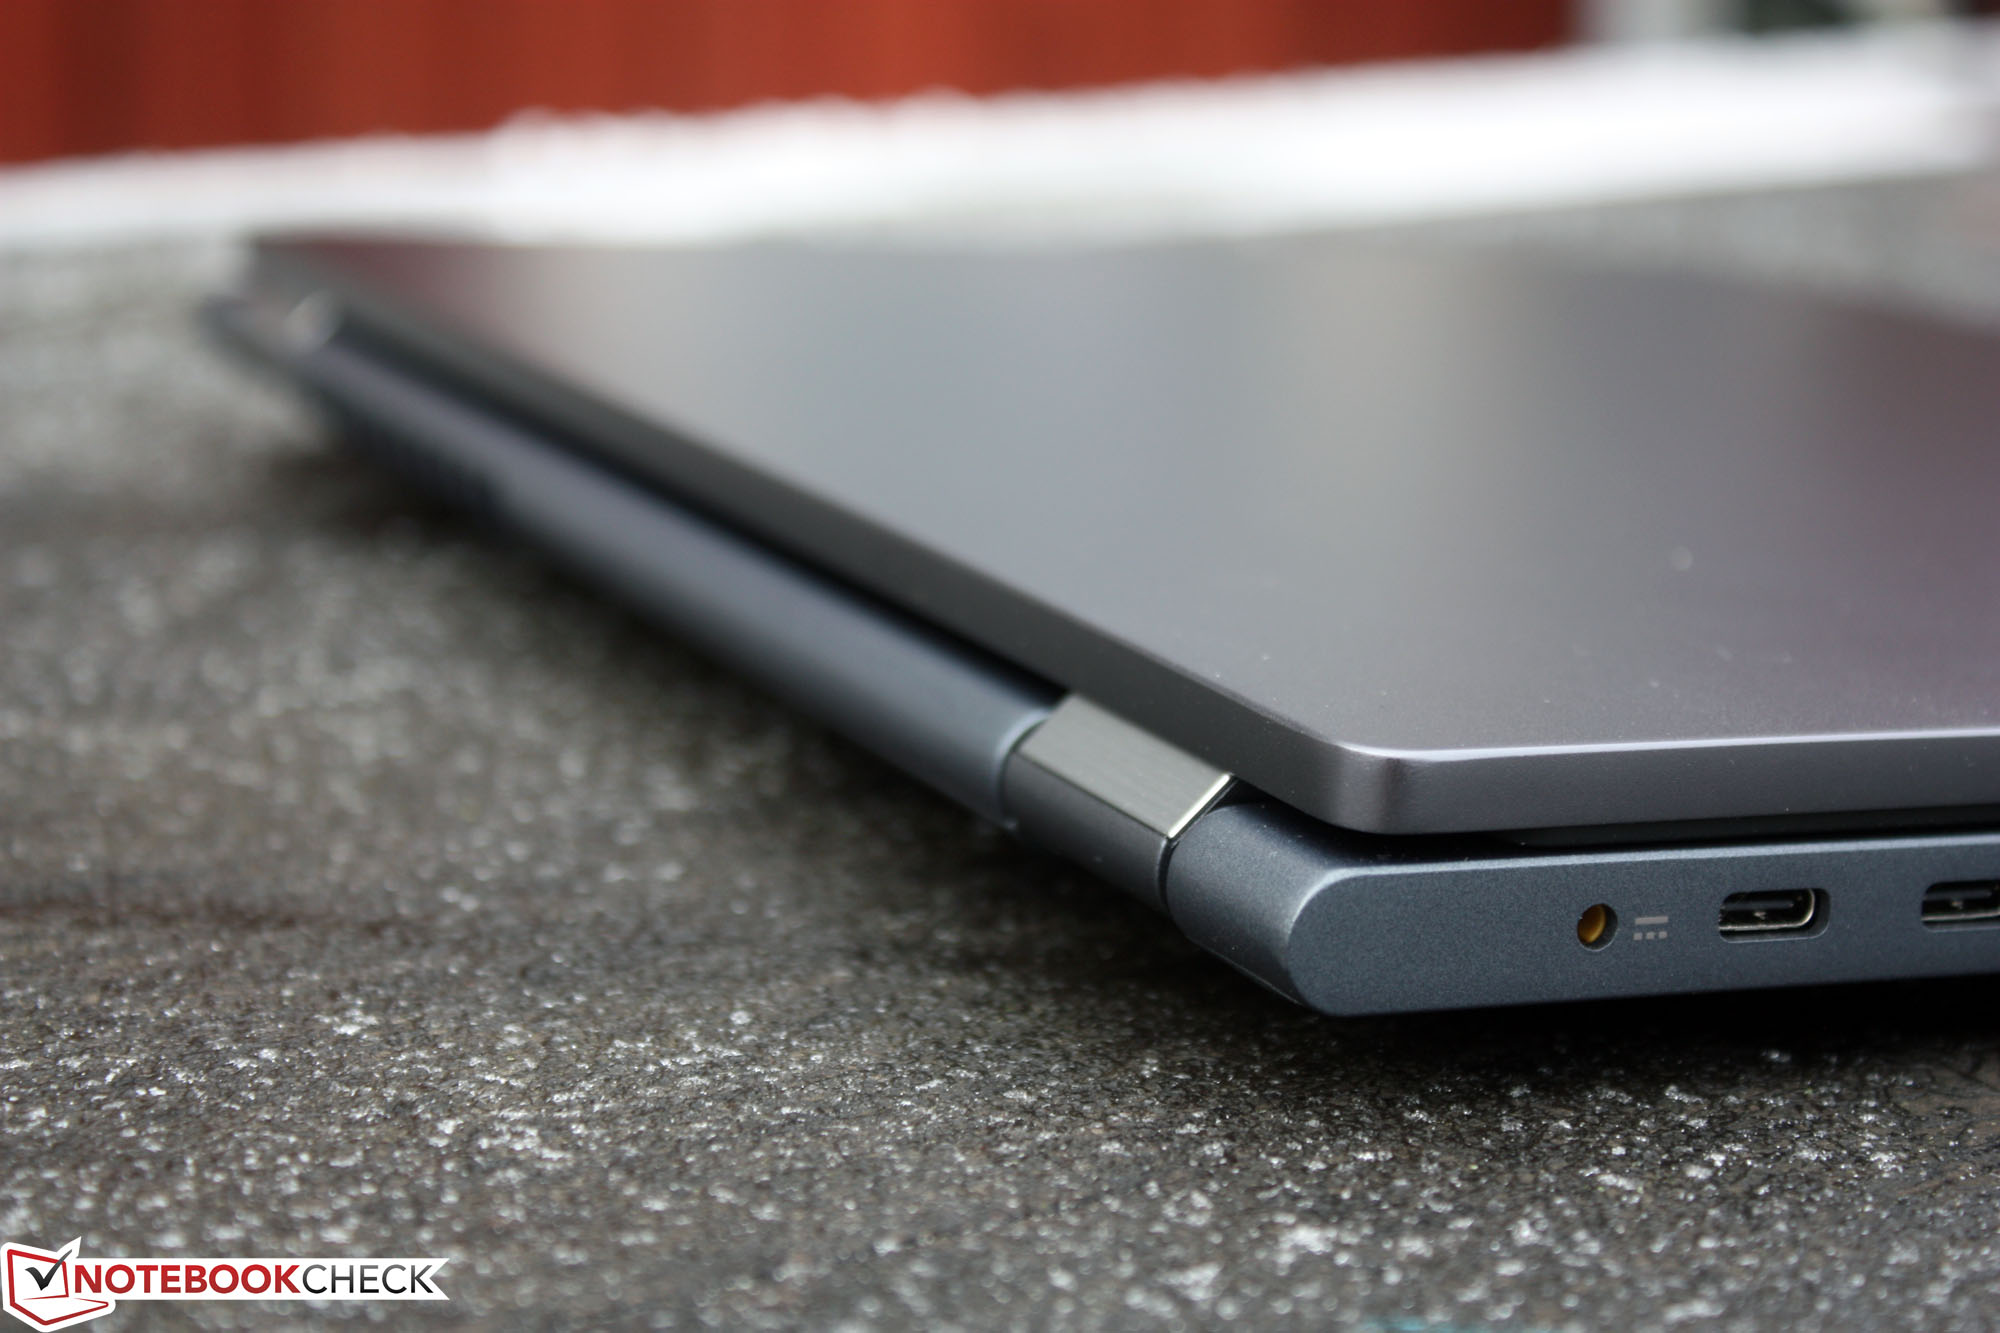
Acer offers two Thunderbolt connections in form of USB Type-C ports, also including USB 3.2 with 50 Mbit. This will allow you to use affordable Type-C docks as well as powerful Thunderbolt docks. The Thunderbolt ports support Power Delivery and are also able to output DisplayPort signals. Together with the HDMI port, the laptop offers up to three video outputs. The card reader is placed in the front of the laptop, which is rare.

SD Card Reader
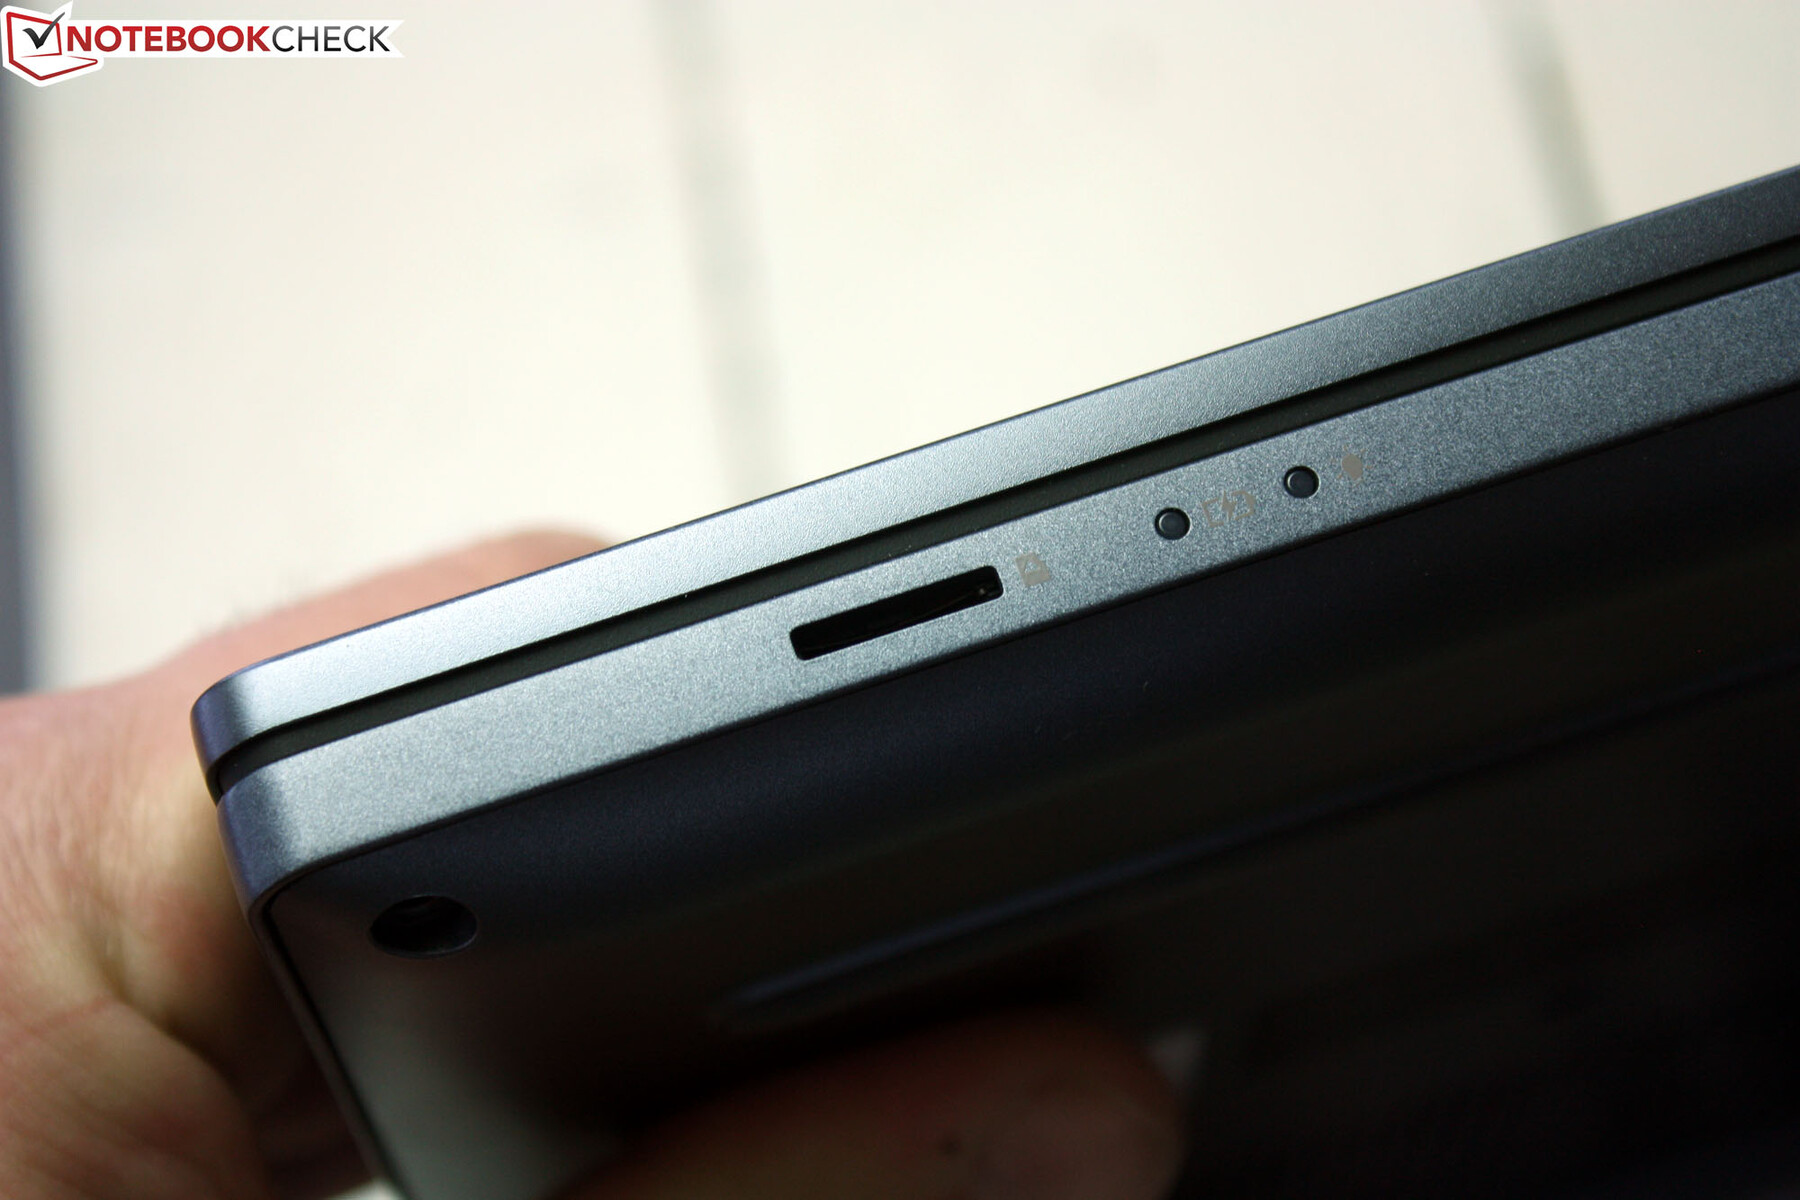
We test the card reader with our AV-PRO 128-GB V60 microSD reference card. Its bad result represents the lowest of our measurements.
| SD Card Reader | |
| average JPG Copy Test (av. of 3 runs) | |
| Apple MacBook Pro 16 2023 M3 Max (Angelbird AV Pro V60) | |
| Lenovo ThinkPad P1 G6 21FV001KUS (Toshiba Exceria Pro SDXC 64 GB UHS-II) | |
| Lenovo ThinkBook 16 G6 ABP (Angelbird AV Pro V60) | |
| Average of class Subnotebook (23.7 - 188, n=9, last 2 years) | |
| Fujitsu LifeBook E5412A E542AMHAAMDE (AV Pro V60) | |
| Lenovo ThinkPad P16 G2 21FA000FGE | |
| Acer TravelMate P4 TMP414-53-58XQ (AV Pro SD microSD 128 GB V60) | |
| maximum AS SSD Seq Read Test (1GB) | |
| Apple MacBook Pro 16 2023 M3 Max (Angelbird AV Pro V60) | |
| Average of class Subnotebook (24.9 - 195, n=8, last 2 years) | |
| Lenovo ThinkPad P1 G6 21FV001KUS (Toshiba Exceria Pro SDXC 64 GB UHS-II) | |
| Fujitsu LifeBook E5412A E542AMHAAMDE (AV Pro V60) | |
| Lenovo ThinkBook 16 G6 ABP (Angelbird AV Pro V60) | |
| Lenovo ThinkPad P16 G2 21FA000FGE | |
| Acer TravelMate P4 TMP414-53-58XQ (AV Pro SD microSD 128 GB V60) | |
Communication
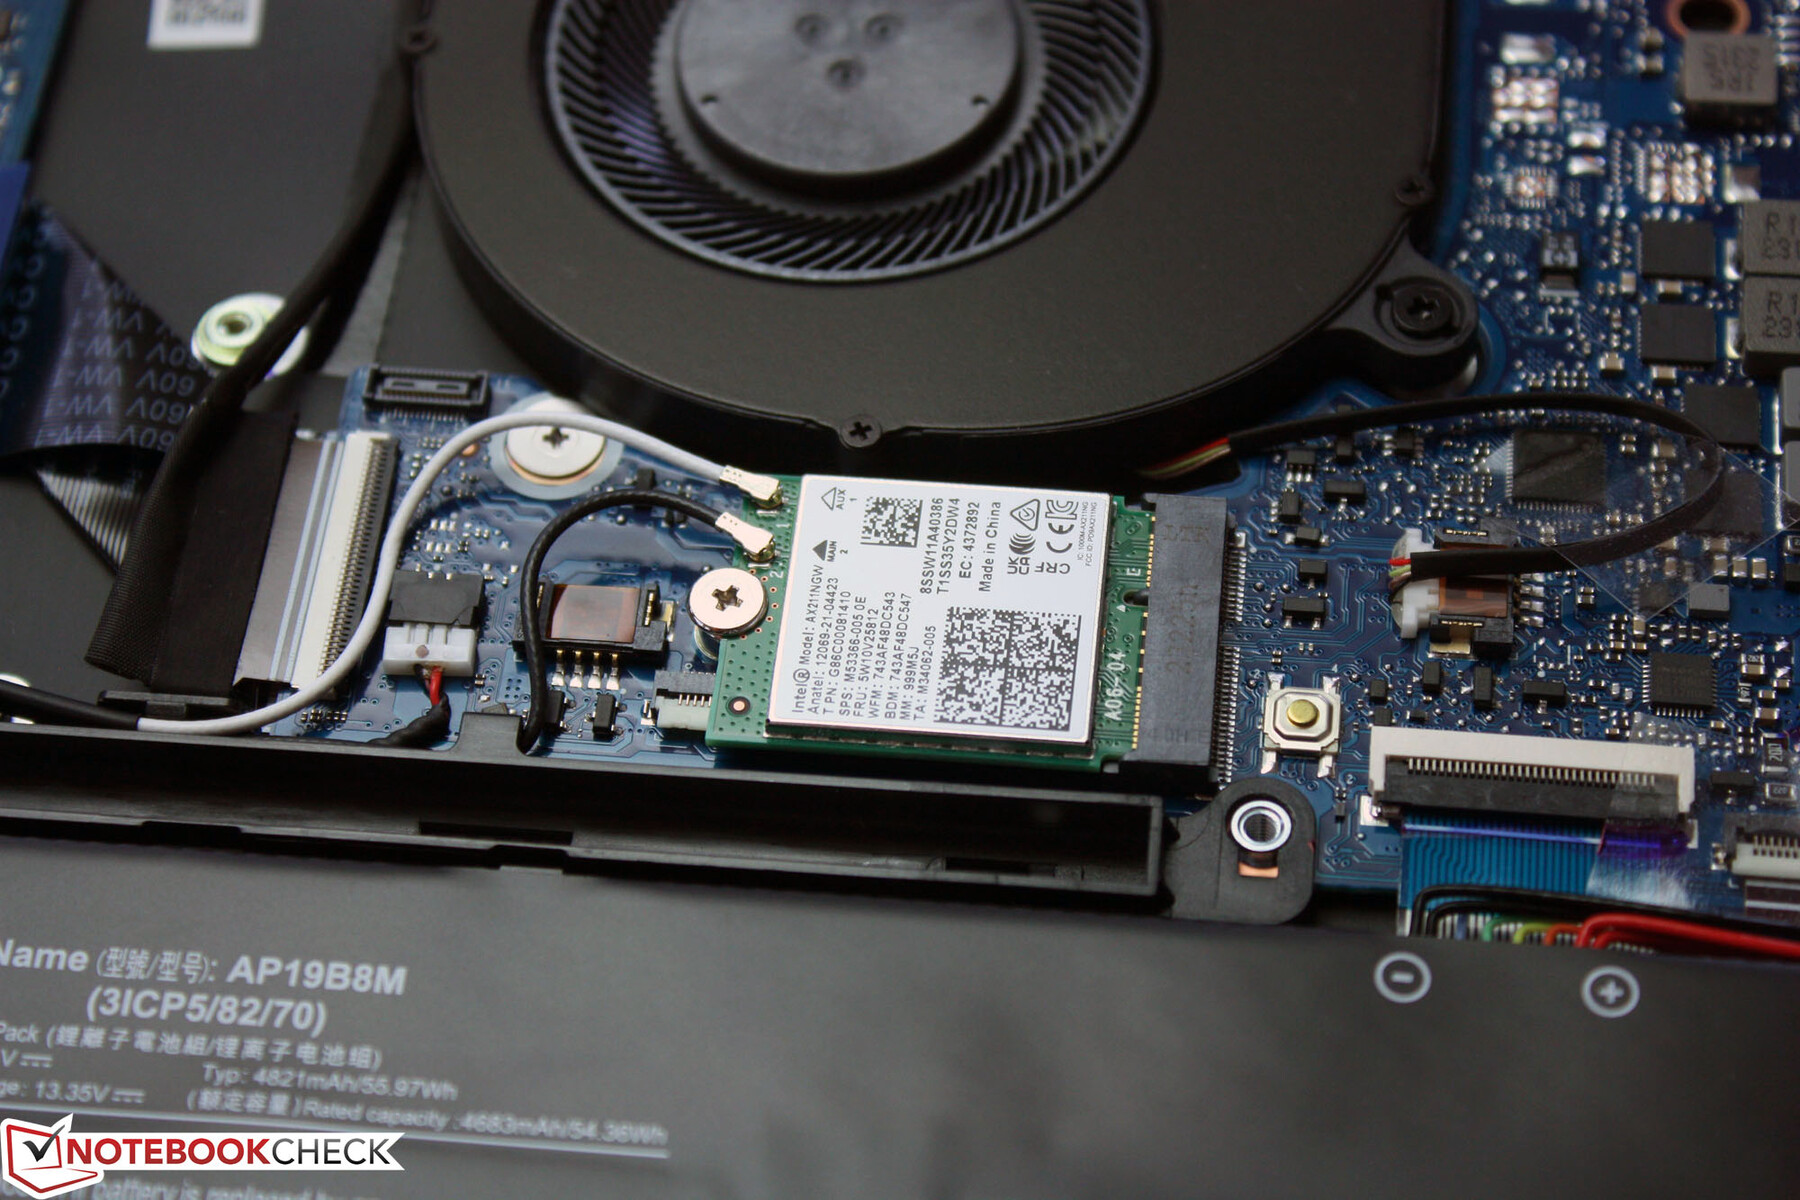
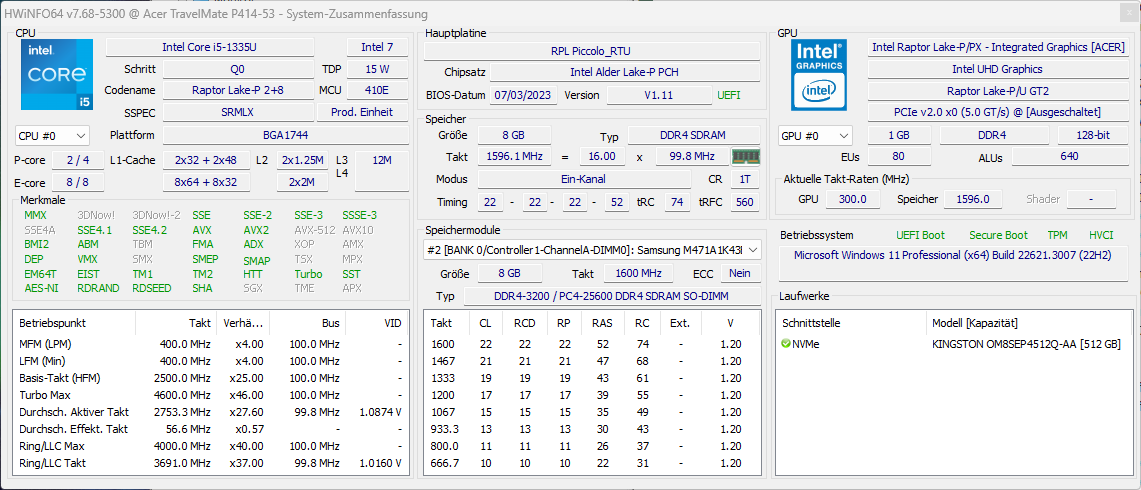
The communication module is an M.2-2230 card on the mainboard. The Intel Wi-Fi 6 AX211 also includes support for Bluetooth 5.3. According to the manufacturer, the chip should be particularly powerful in dense WLAN surroundings with dozens of routers and hundreds of connected devices, for example by offering reduced latencies. Bluetooth 5.3 supports low energy audio signals. The TravelMate passes our test (with surrounding Wi-Fi noises deactivated) with flying colors, playing in the top league. As required for a business laptop, the TravelMate also includes a wired Ethernet connection. The Realtek Gigabit NIC has a typical fold-out port.
Webcam
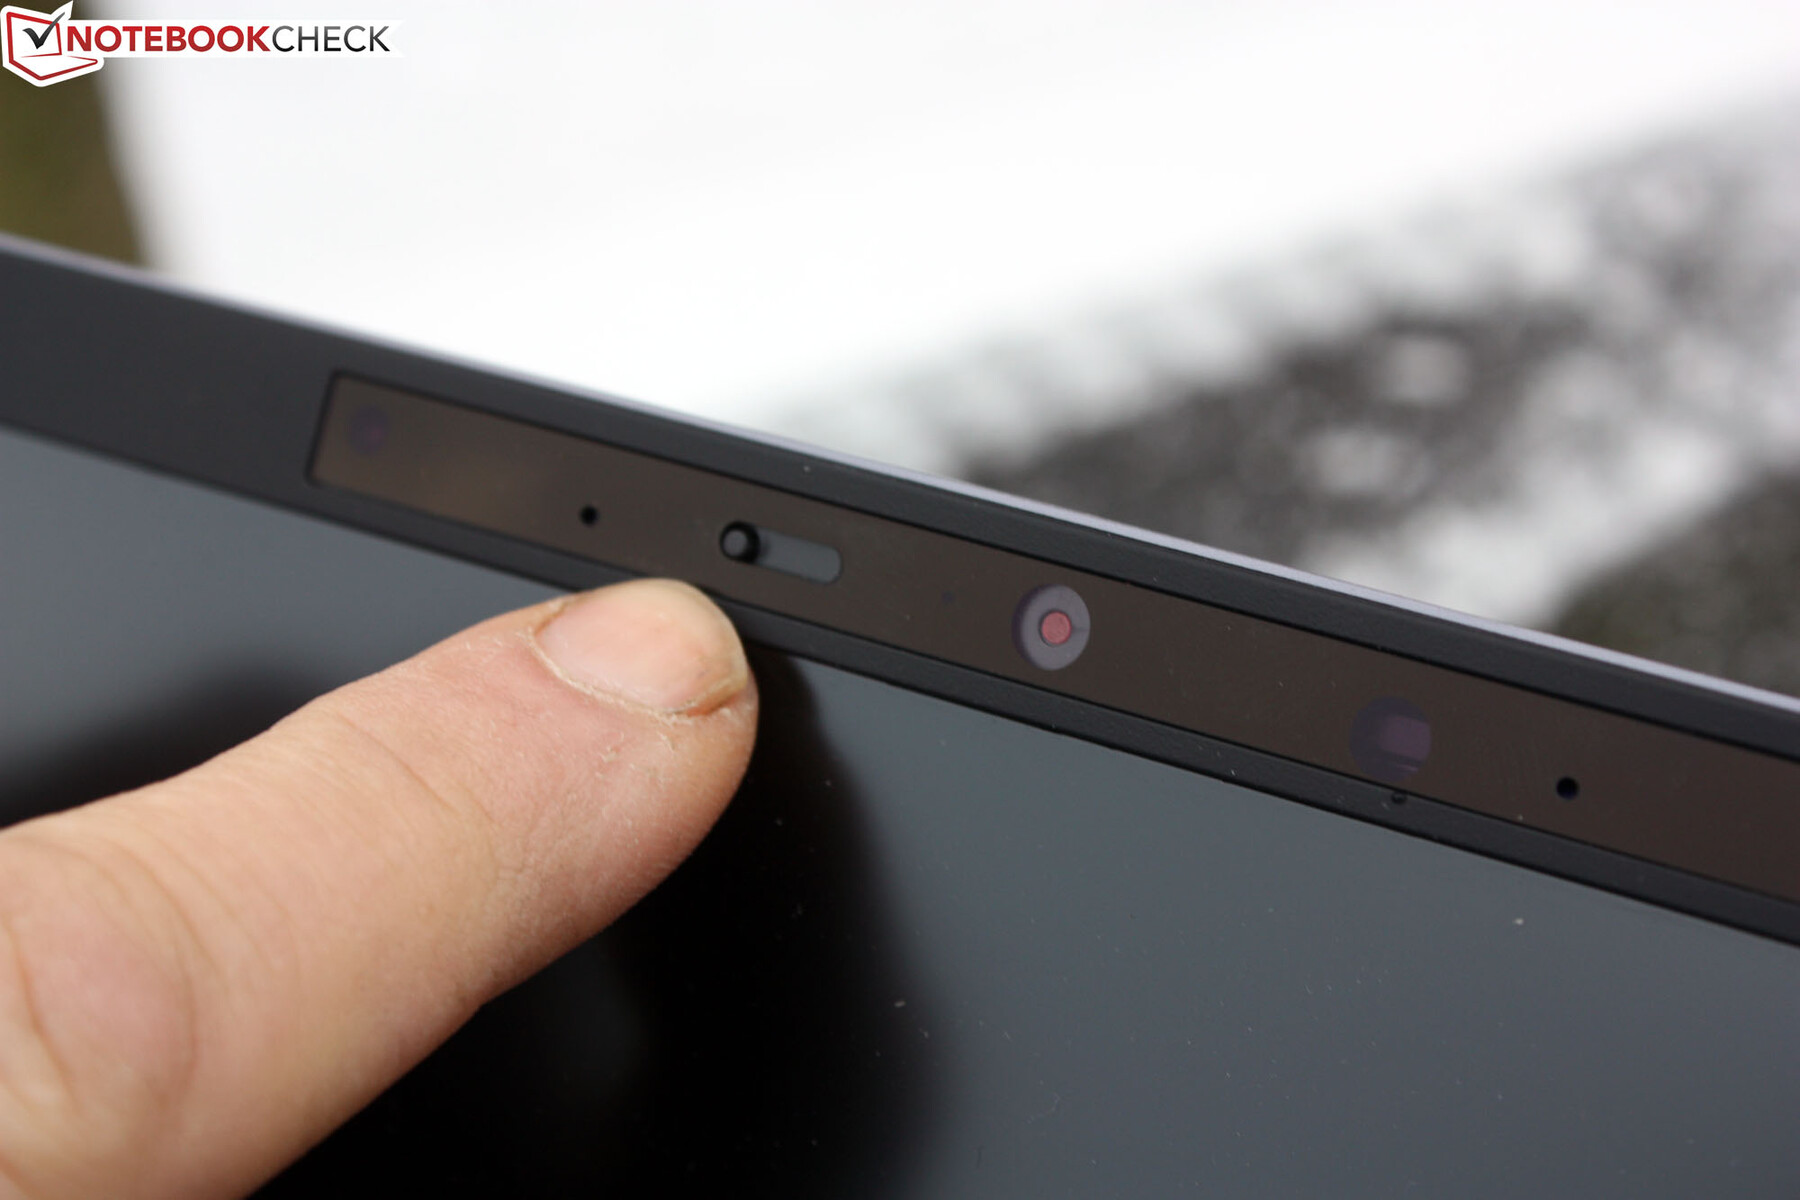
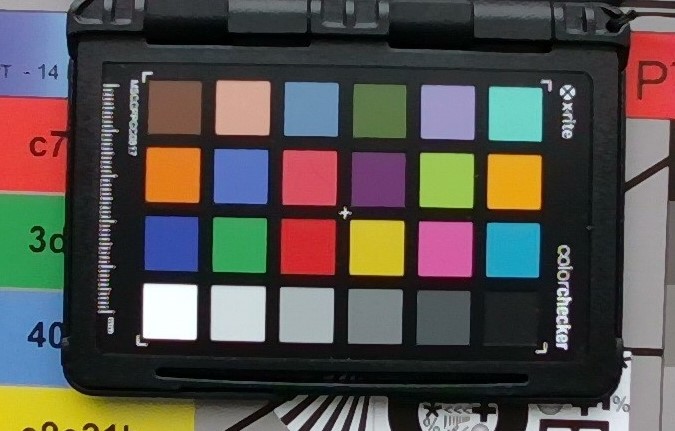
Careful users can lock the 720p camera with a manual shutter. The camera delivers acceptable colors, but only in daylight or good lighting conditions.


Security
The fingerprint reader is integrated into the power key, with the Kensington Lock in close proximity.
Accessories
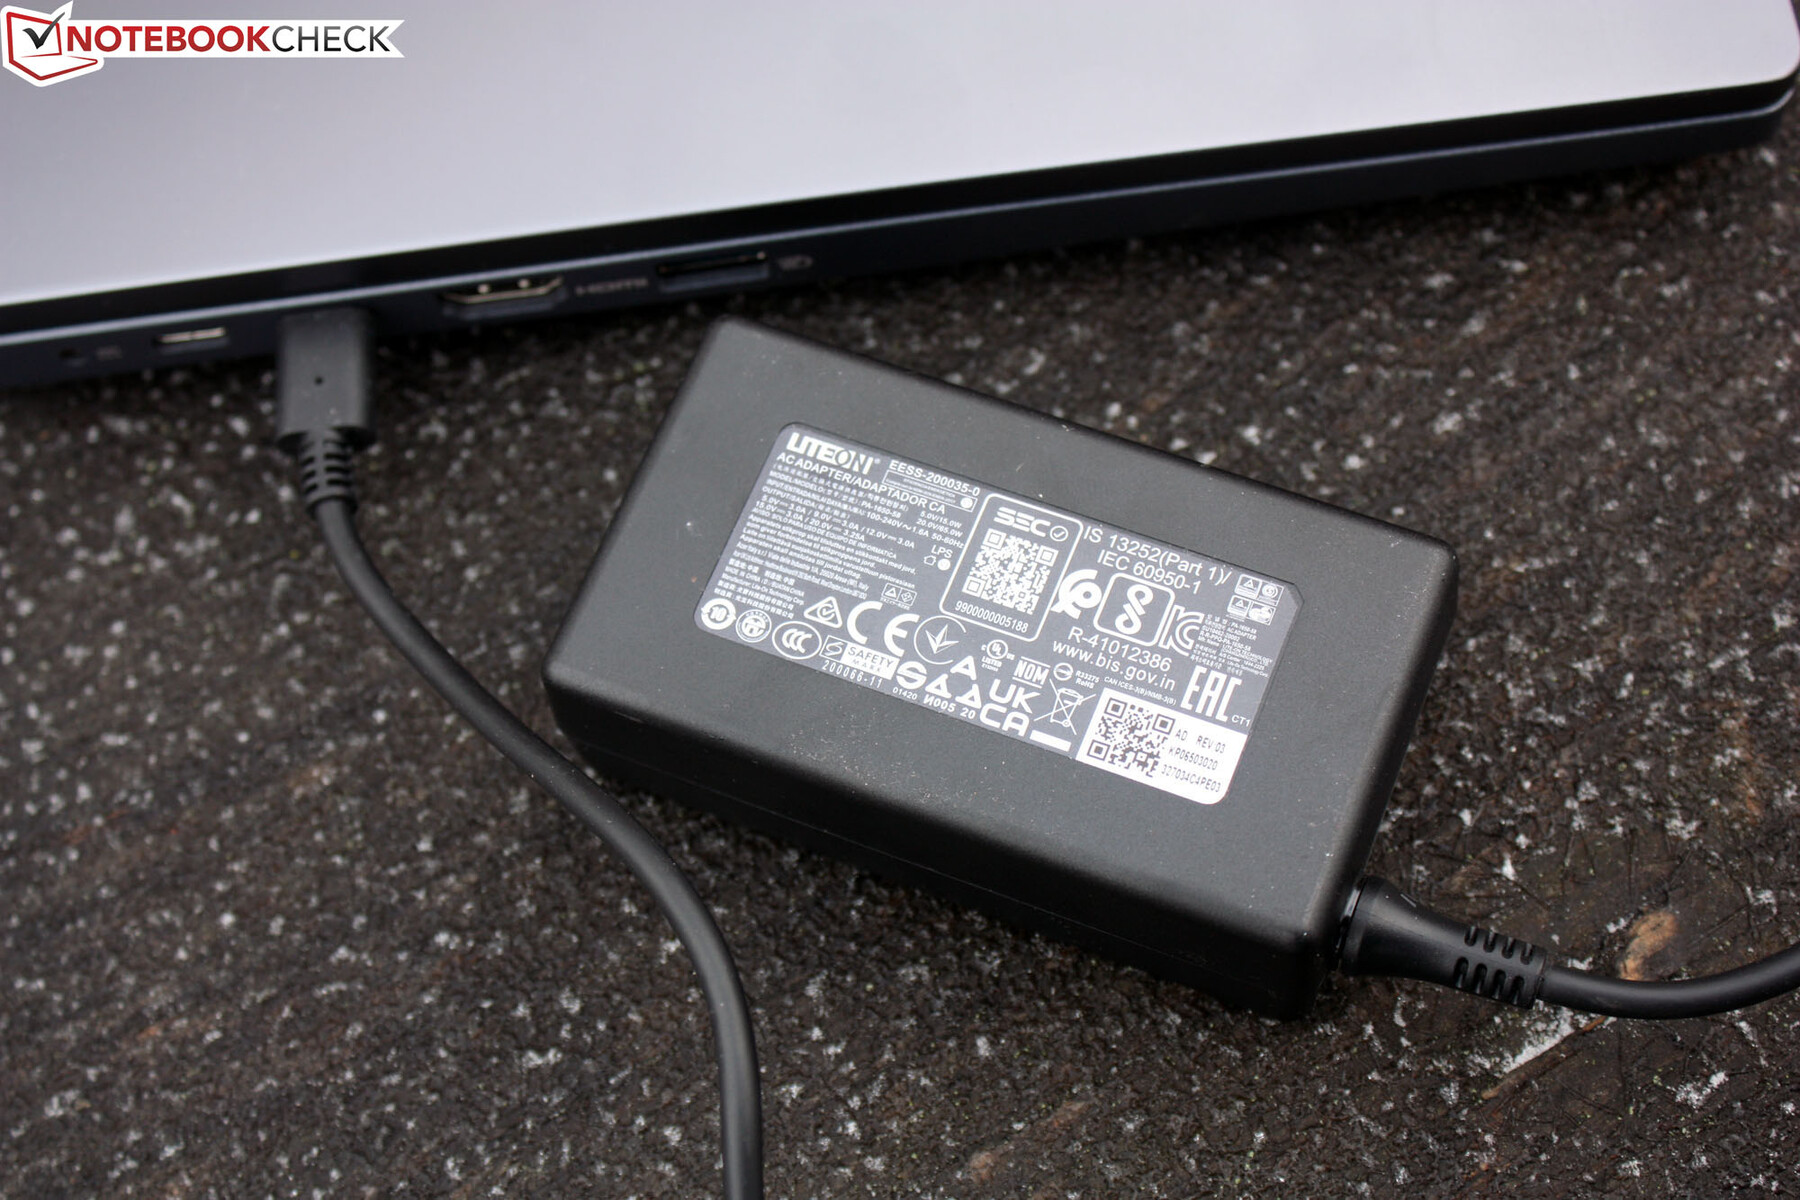
The TravelMate can be charged and operated using a proprietary Acer charger with a mini power plug. But what is included and surely the better choice is a 65-Watt USB-C charger that can then also be used for other devices. While you can also charge the Acer with a weaker USB-C charger, the charging process will then take longer and under load (with short PL1 consumption bursts of 55 Watts!), it will also draw power from the battery.
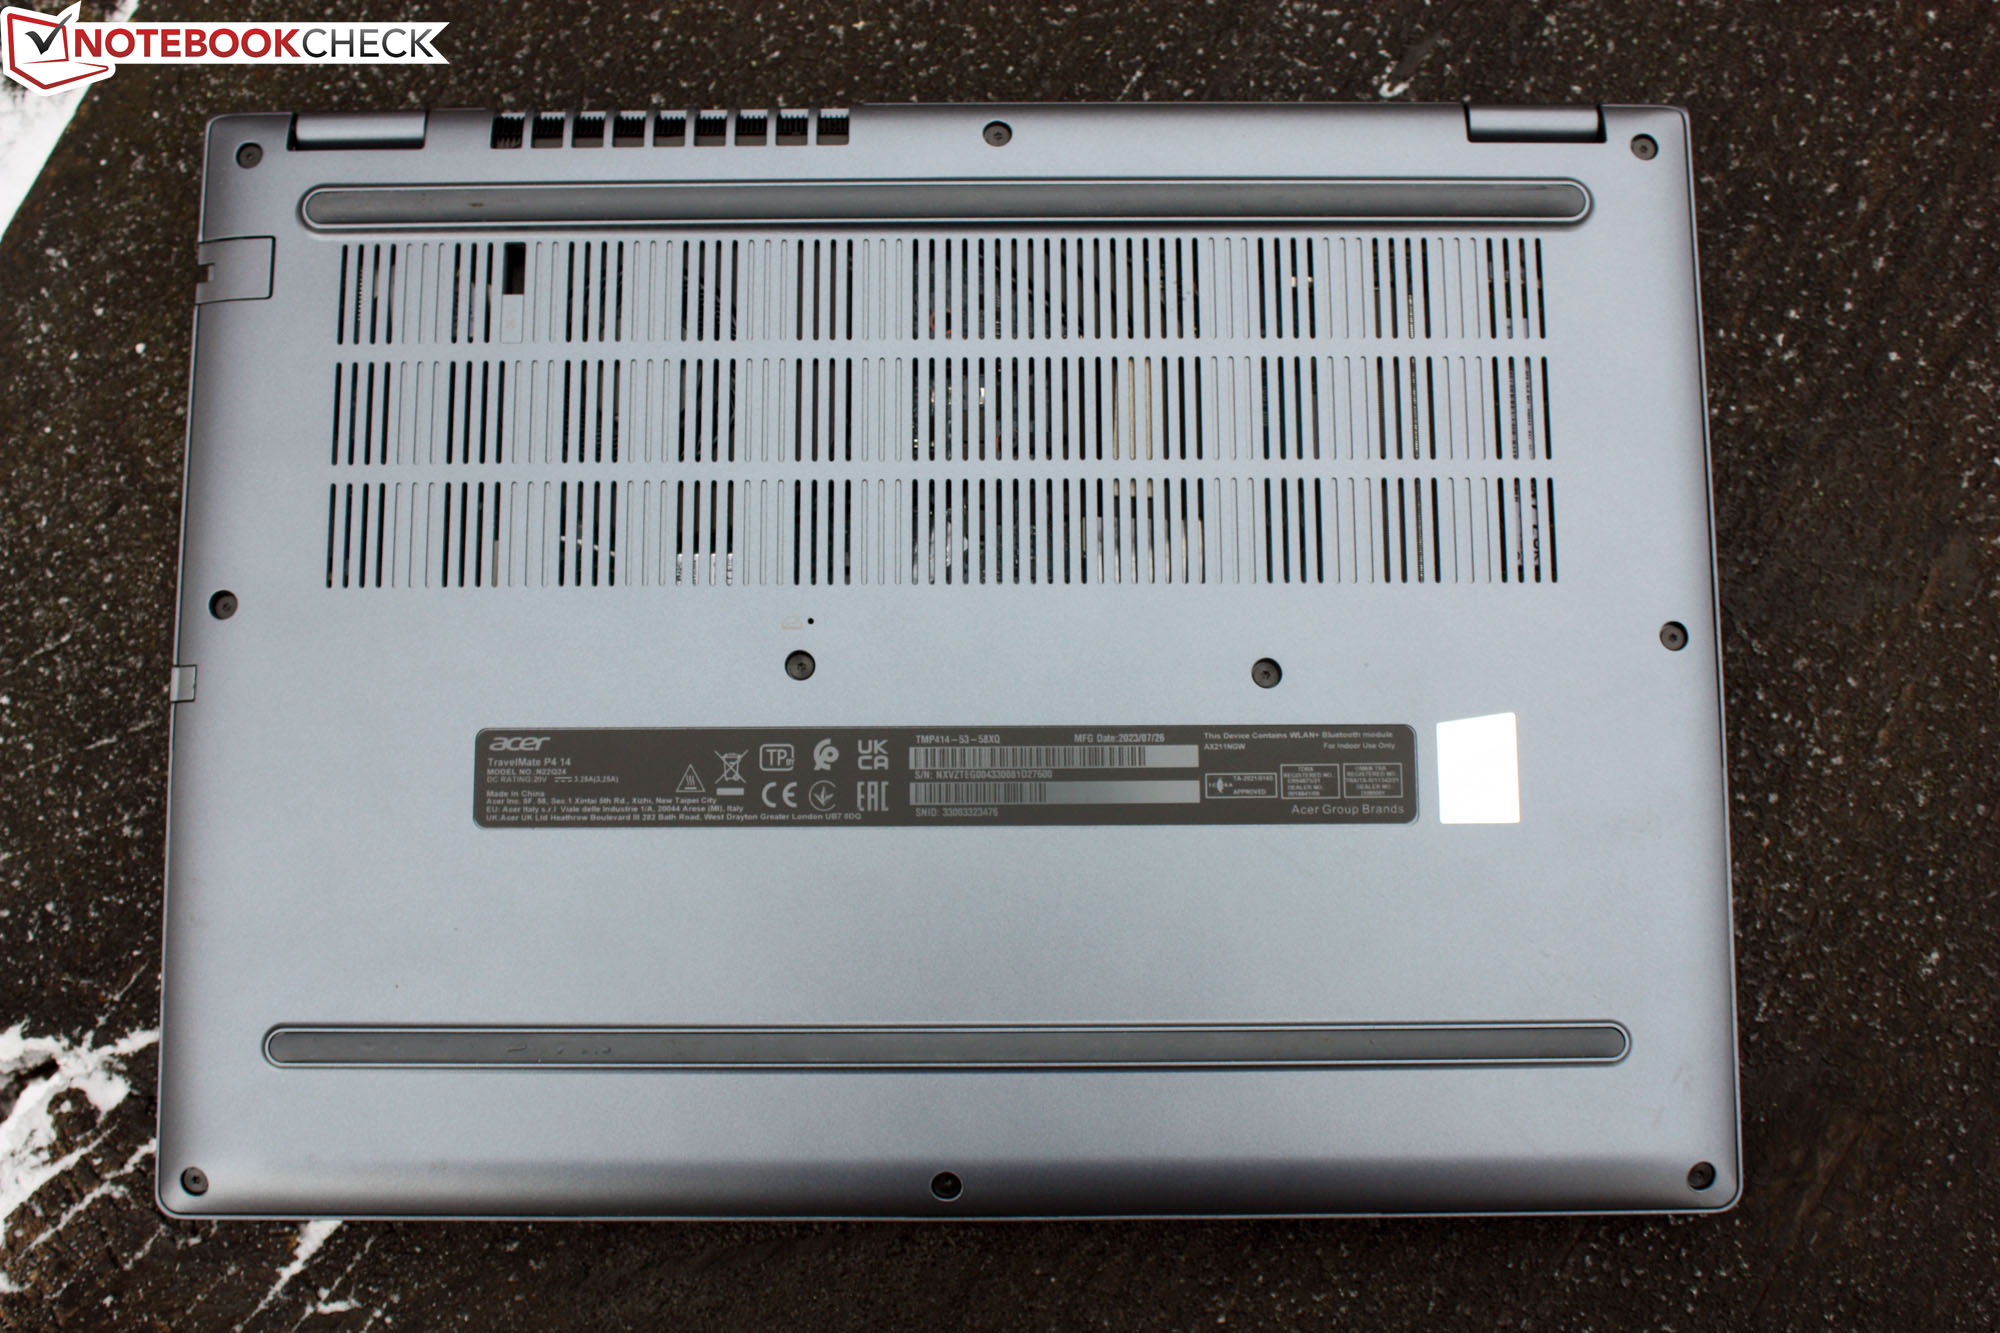
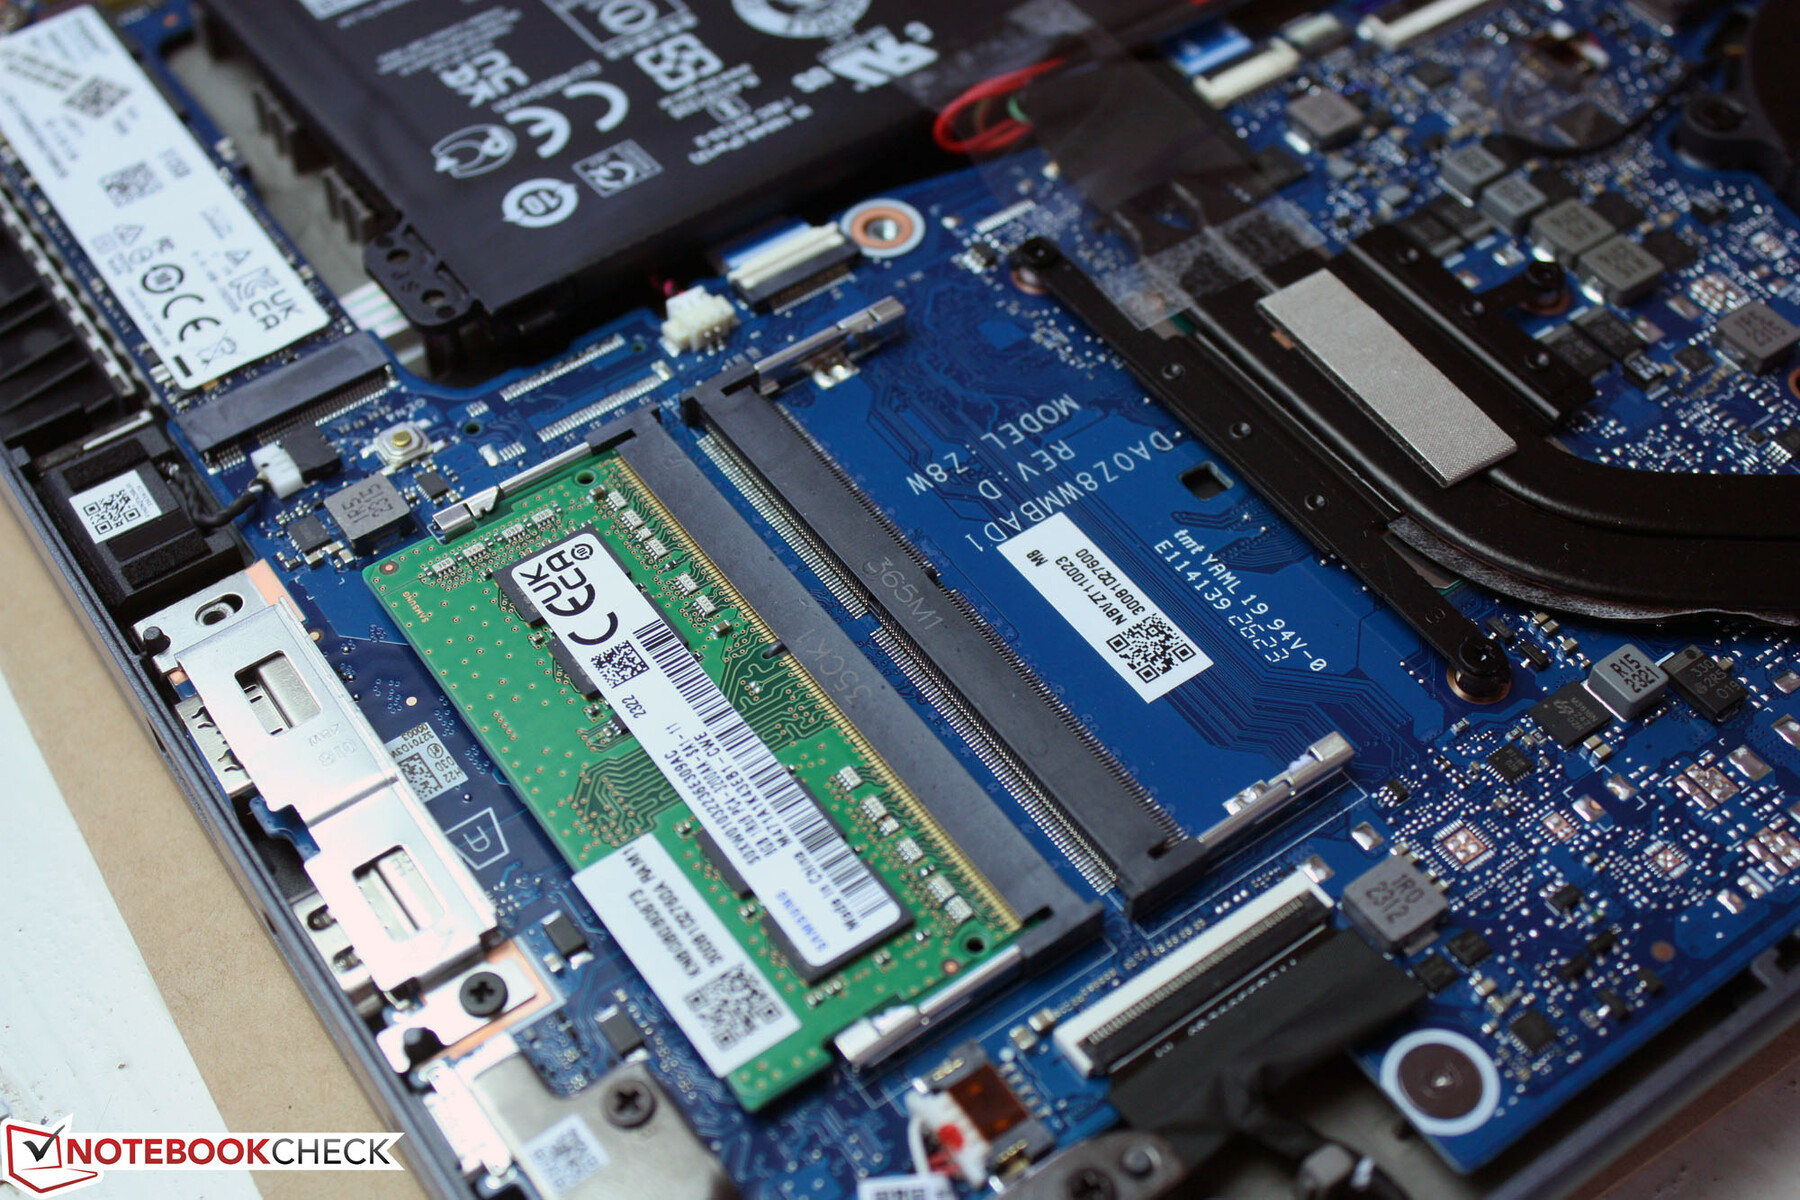
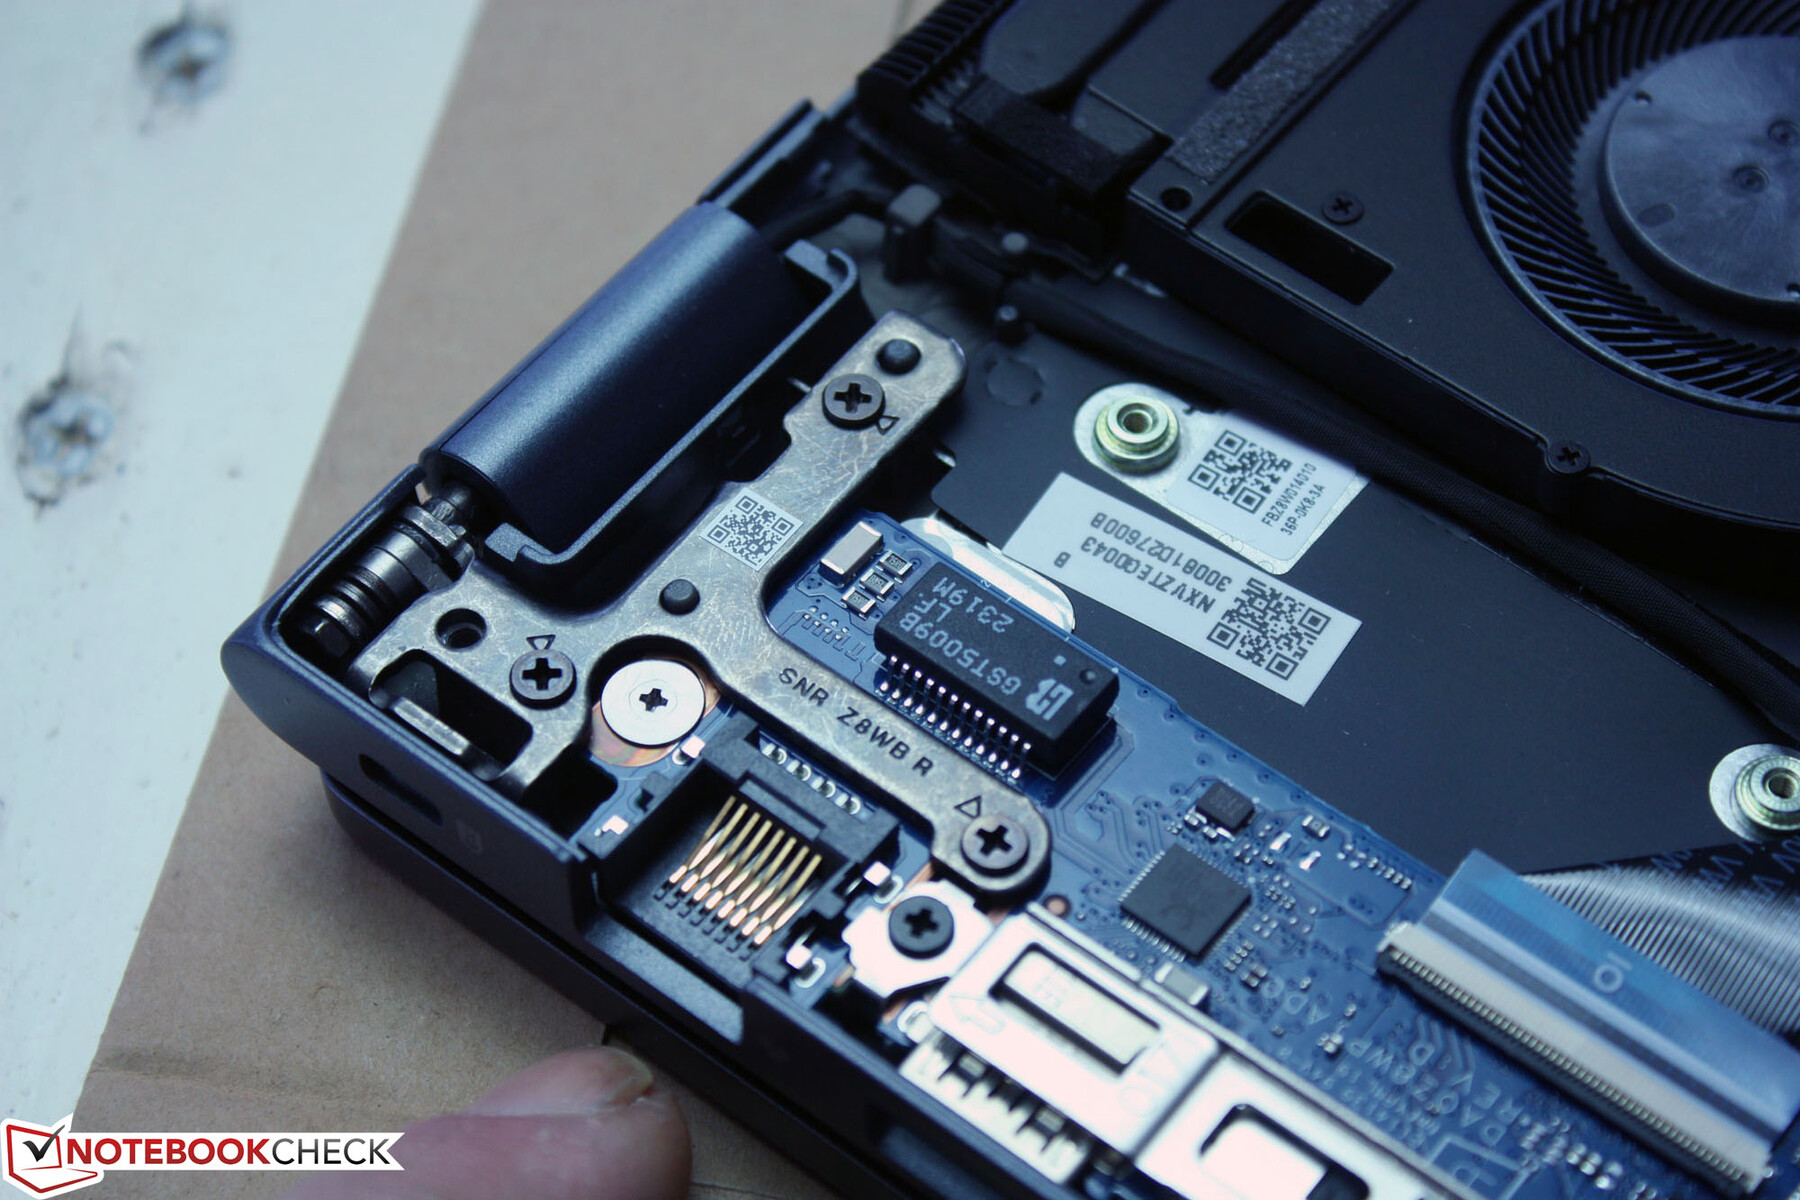
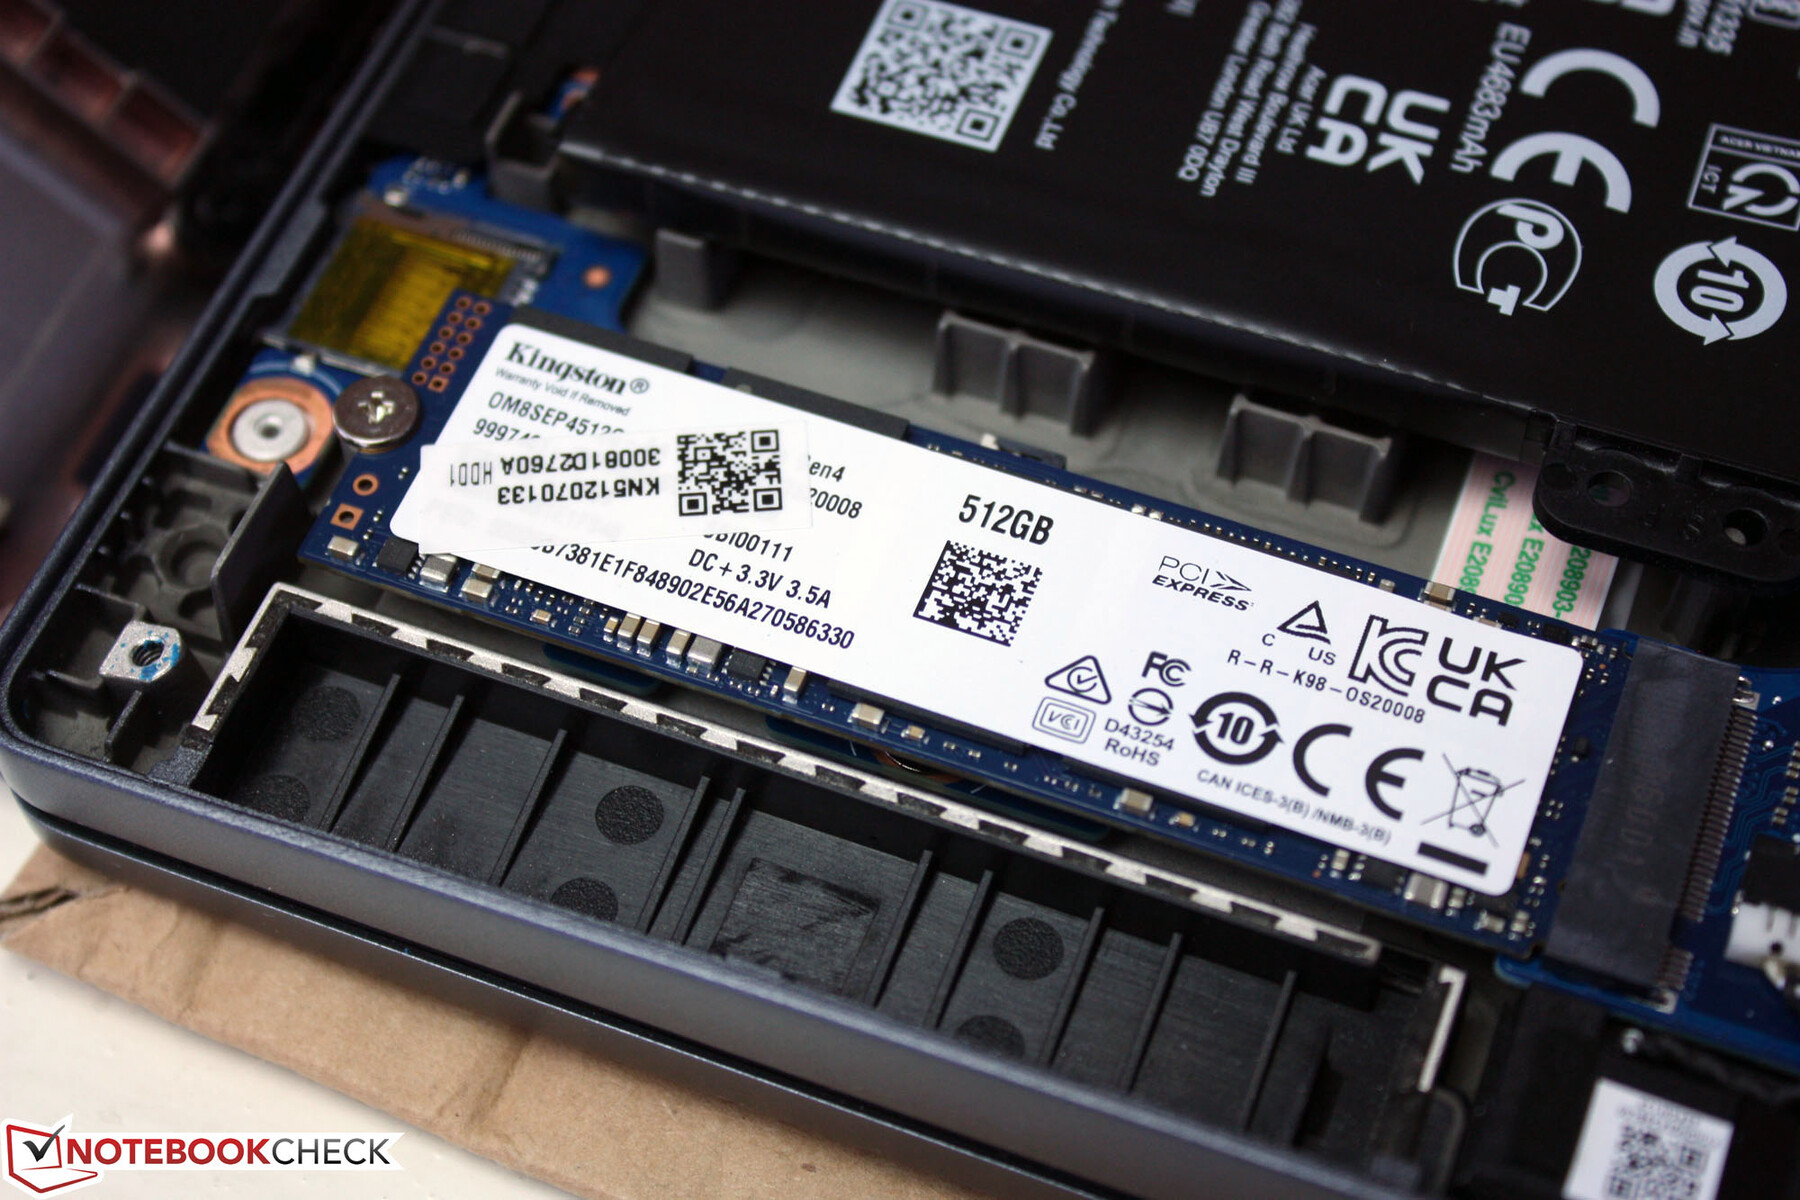
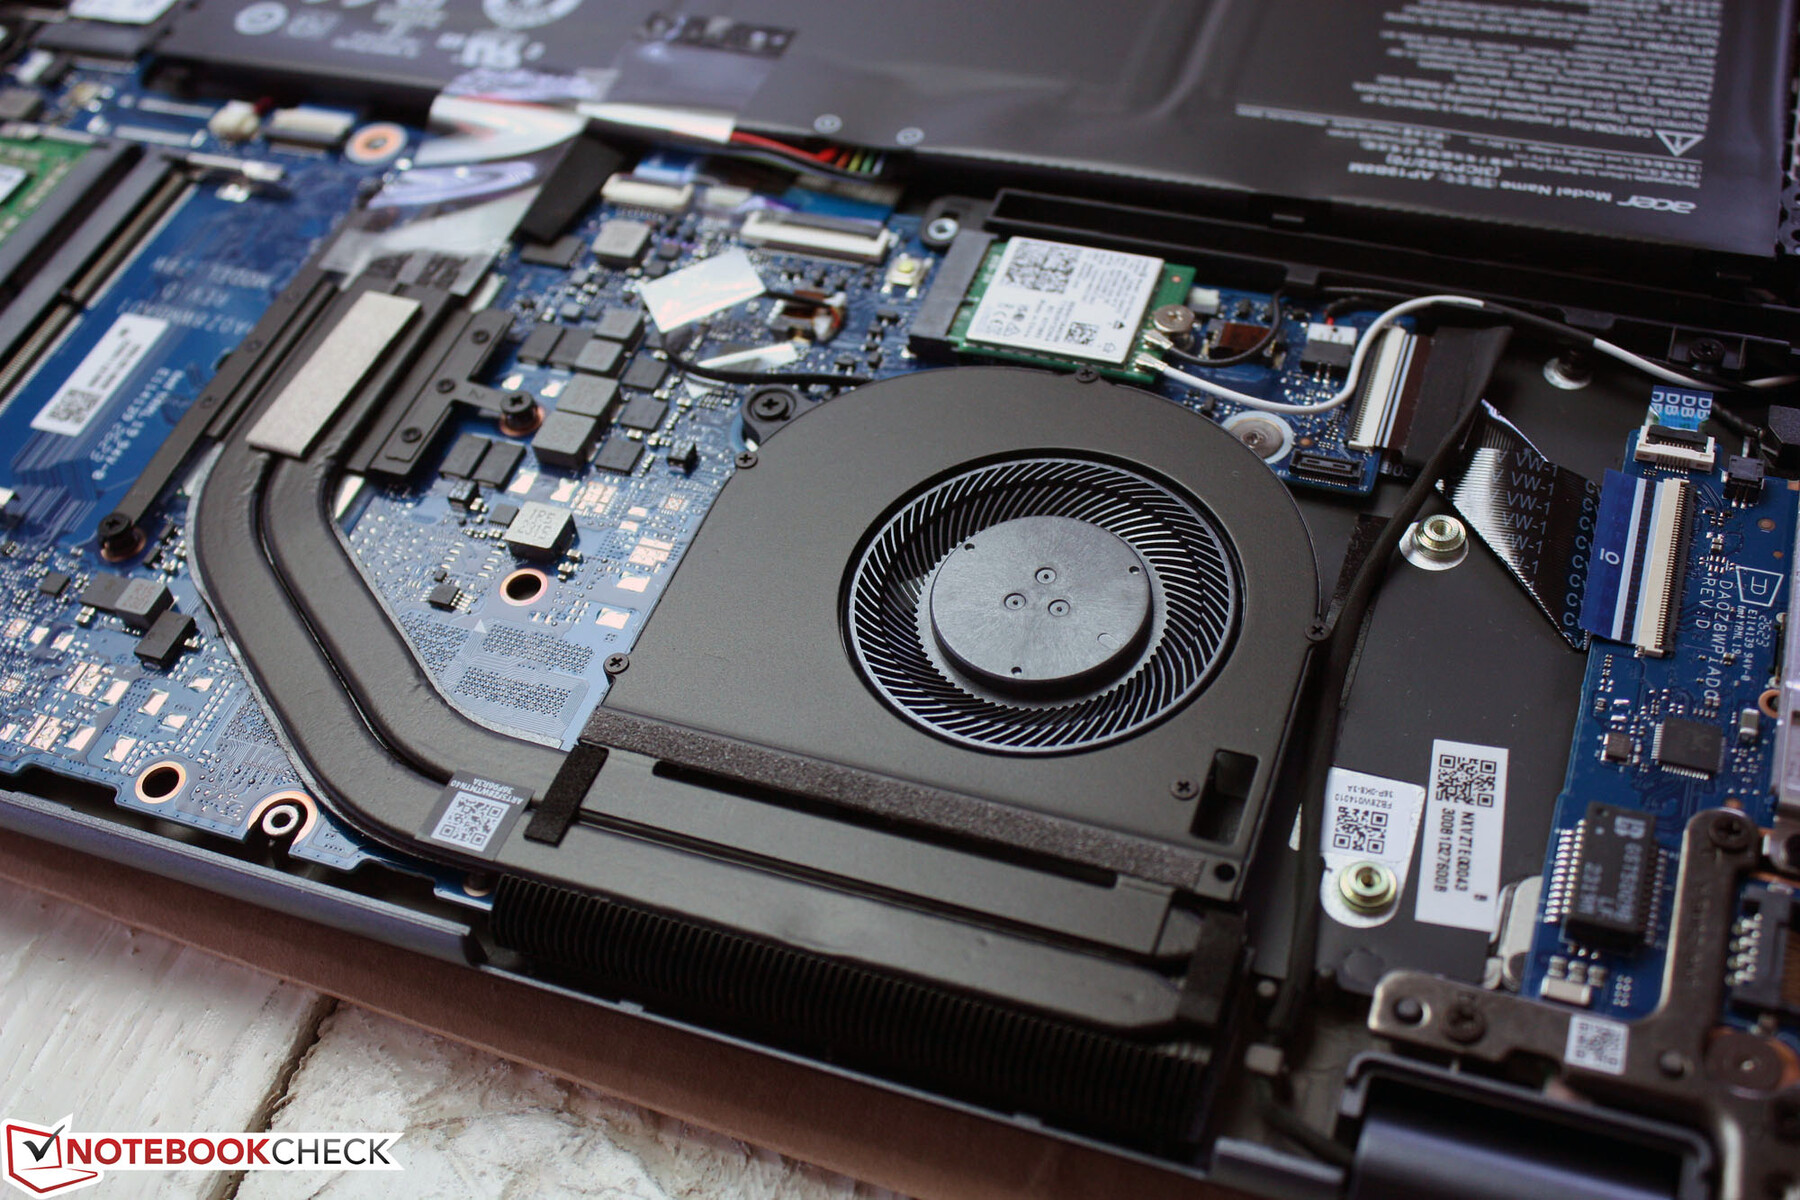
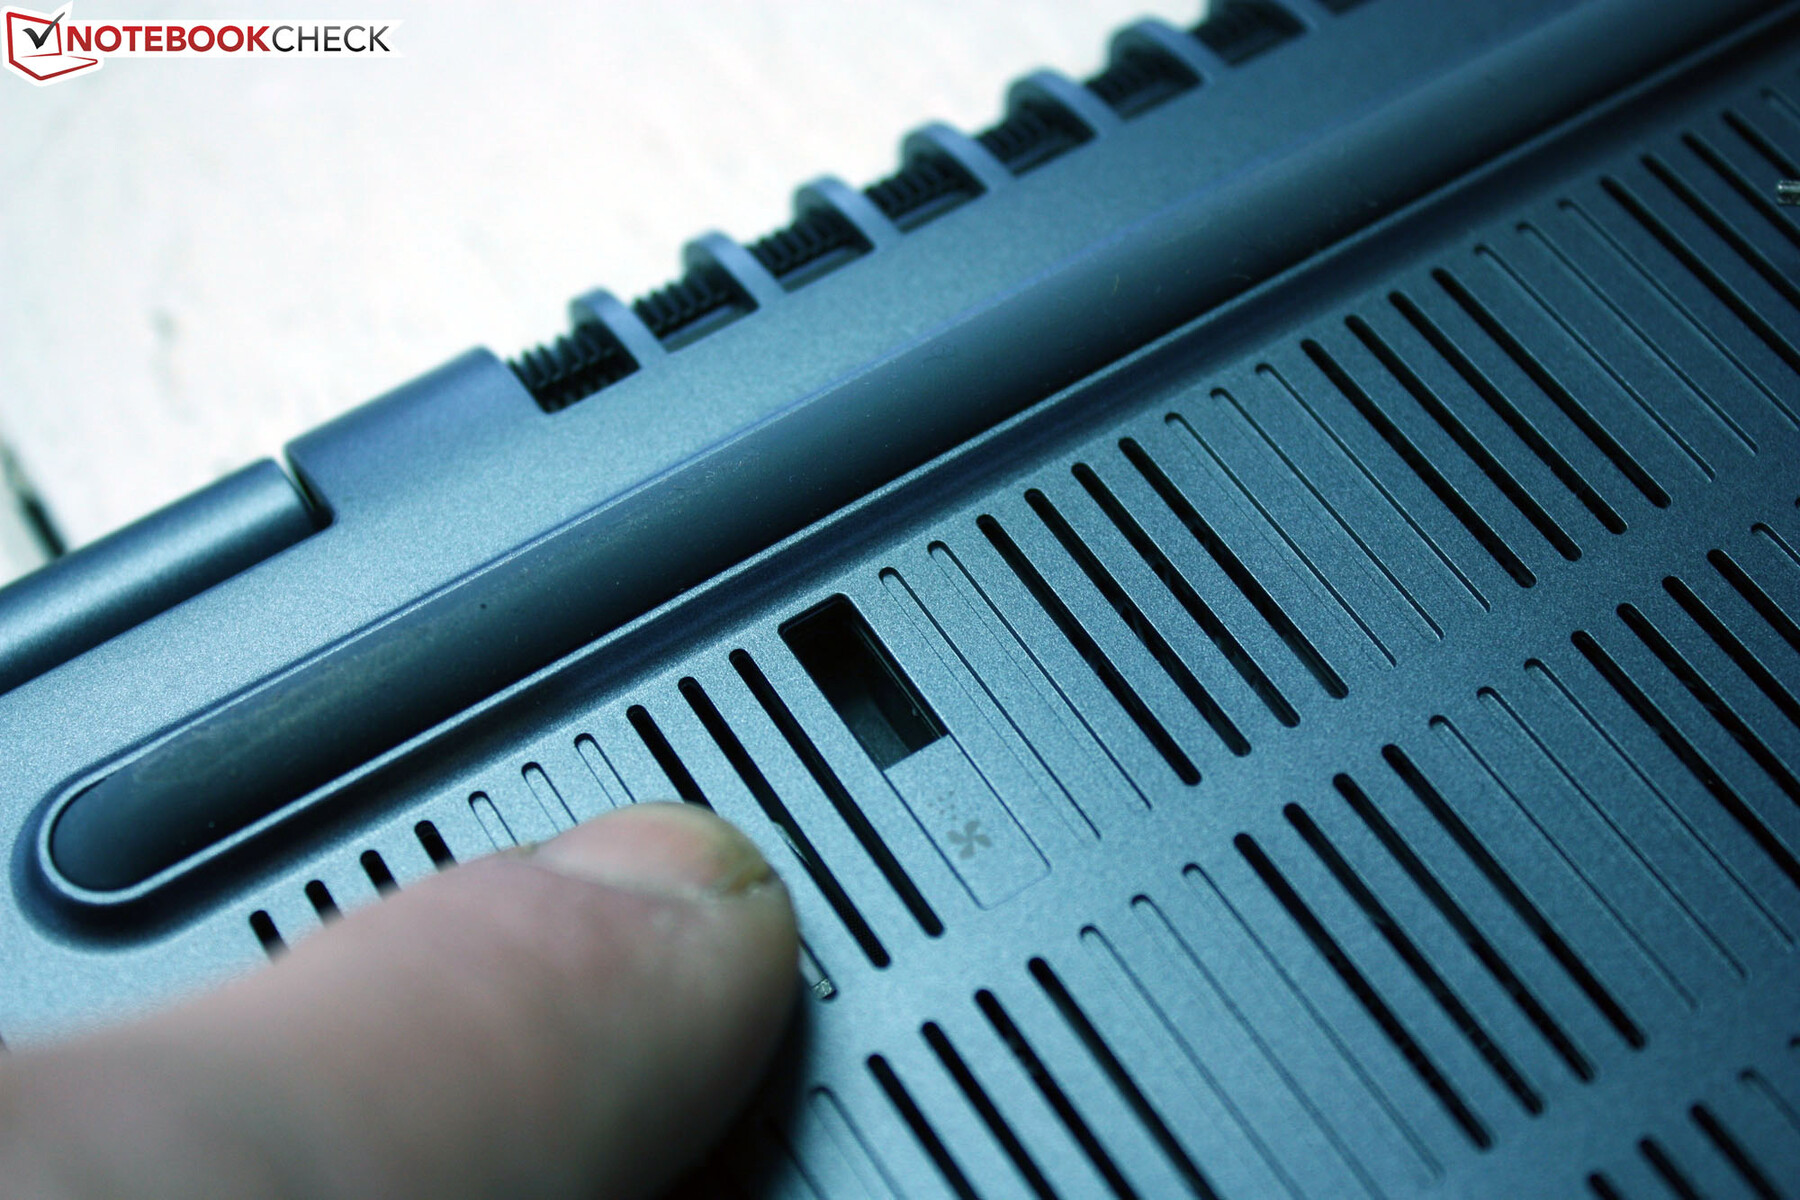
Maintenance
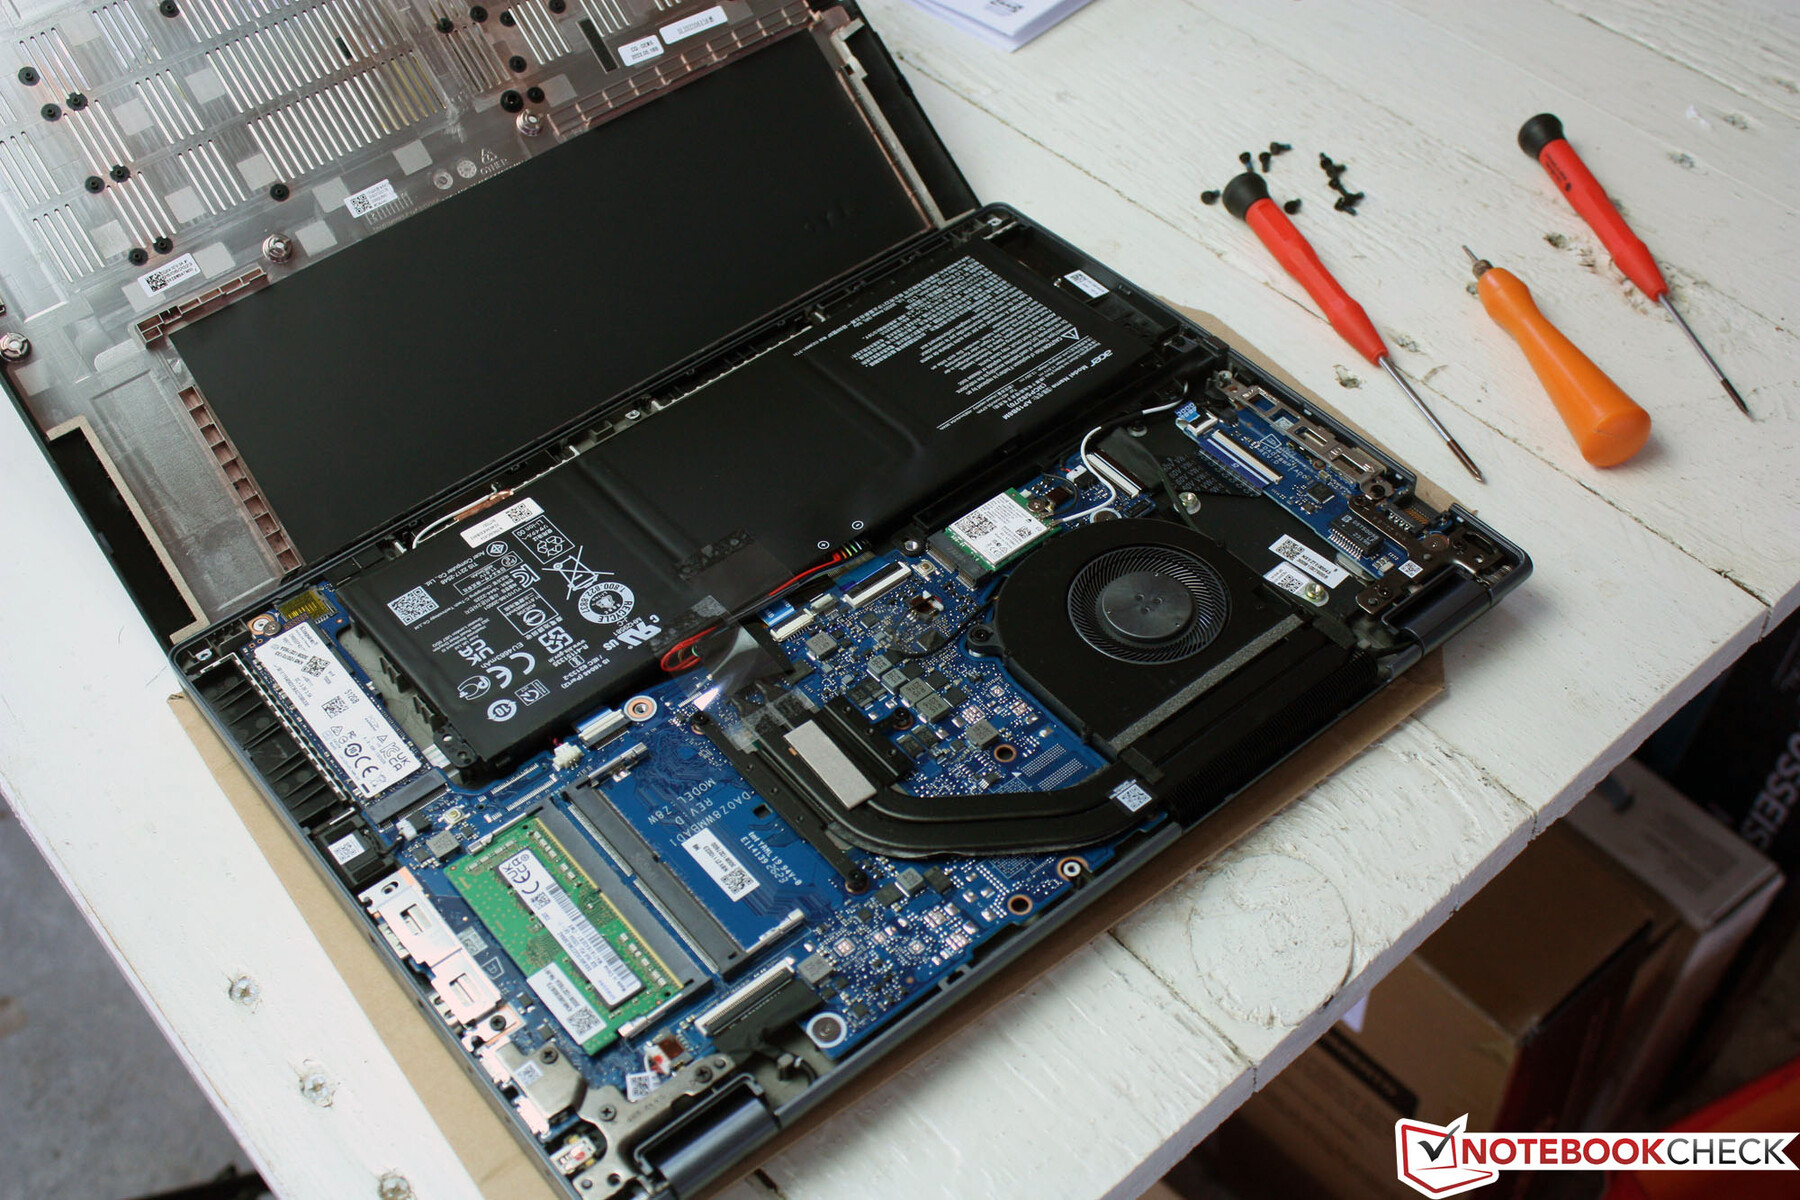
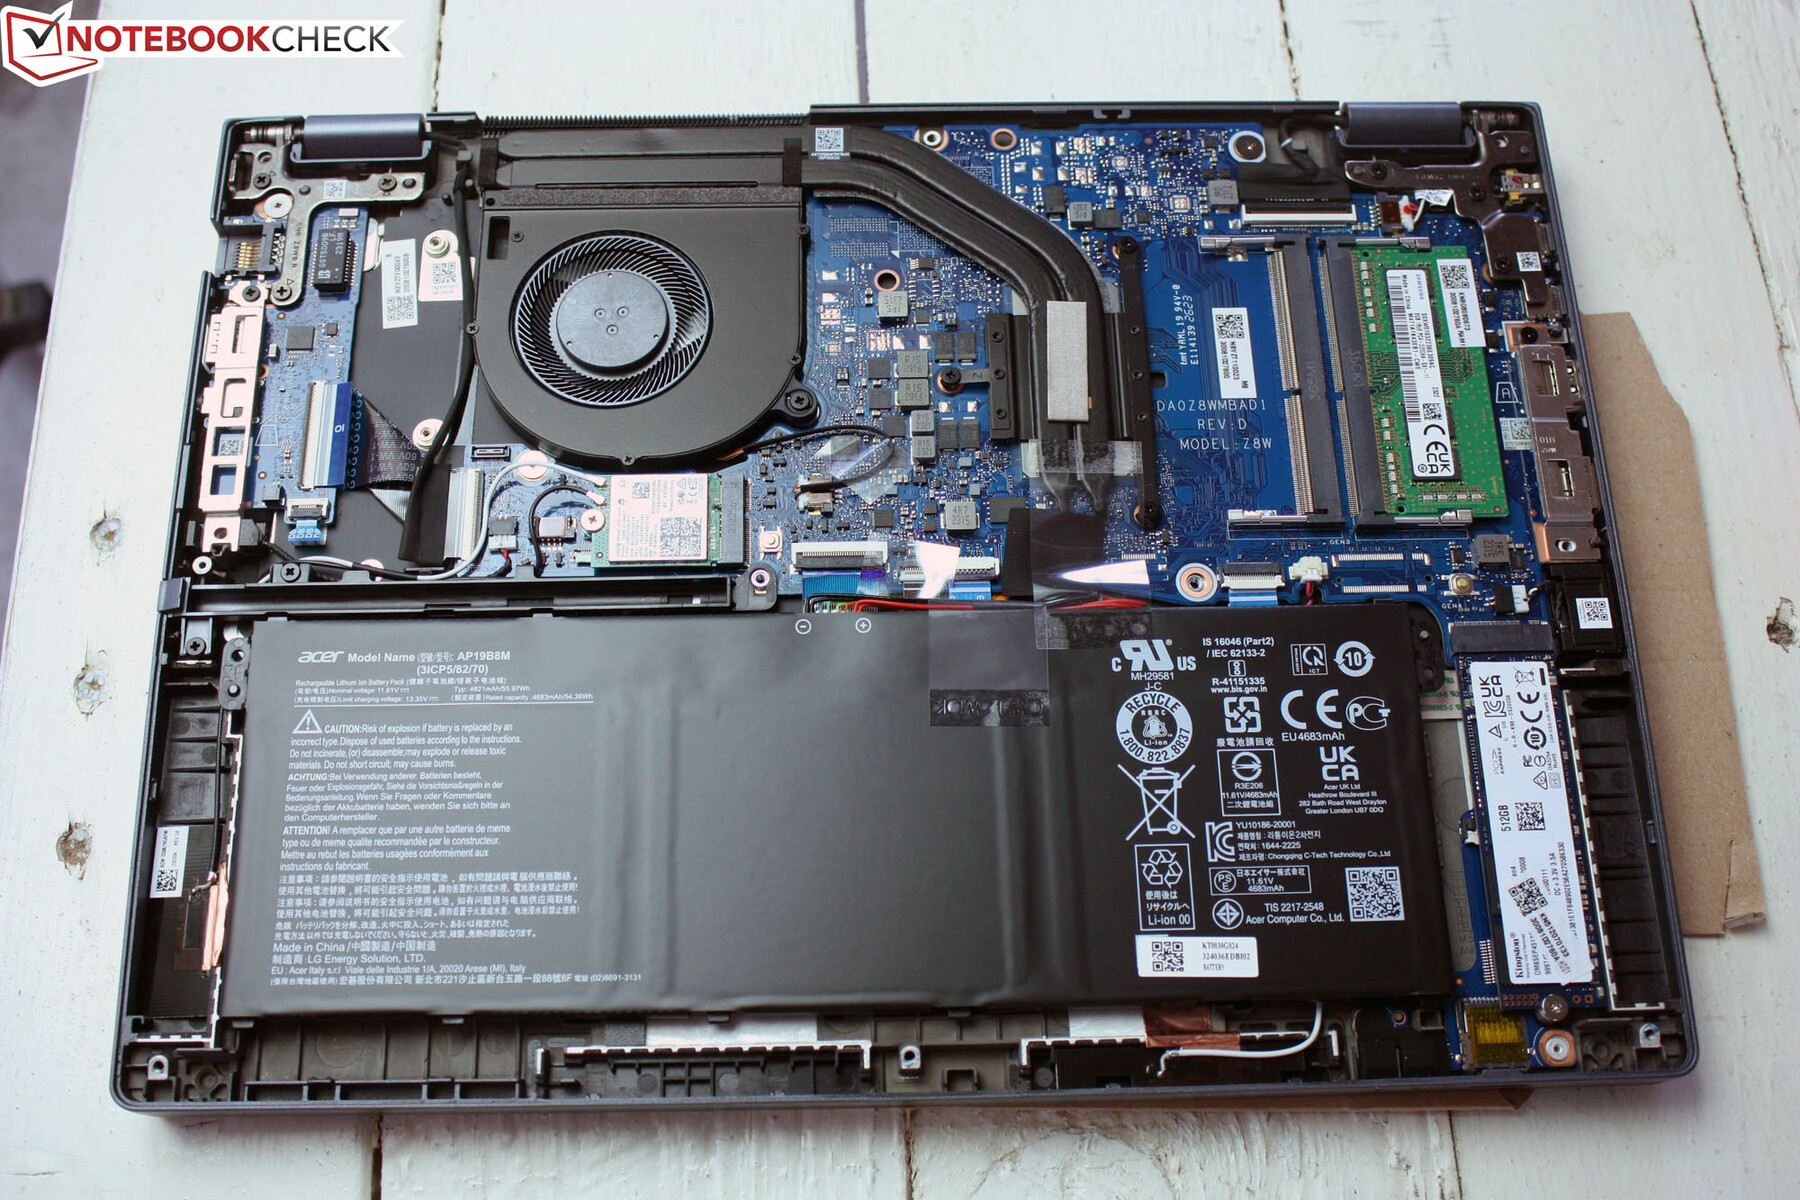
The TravelMate strikes a very good figure in the subject of maintenance and upgrades. In case the cooling ribs of the heat pipe are dirty, there is an opening for blowing in pressurized air. The bottom cover can be removed quickly and easily using a small Torx screwdriver. After removing the screws, the cover can be lifted without using any other tools. You then get access to two RAM slots, one of which is occupied with 8 GB. The battery is screwed in, and the SSD is in a slot as an M.2-2280 module. The is no second M.2 SSD slot.
Warranty
Acer offers a 3-year warranty for its TravelMates in Germany. The warranty period can differ in other countries.
Input Devices
We wrote this review on the TravelMate P4 and were able to work efficiently with the input devices, without needing any period of familiarization with the keyboard. Compared to the predecessor, Acer has enlarged the ClickPad significantly.
Keyboard
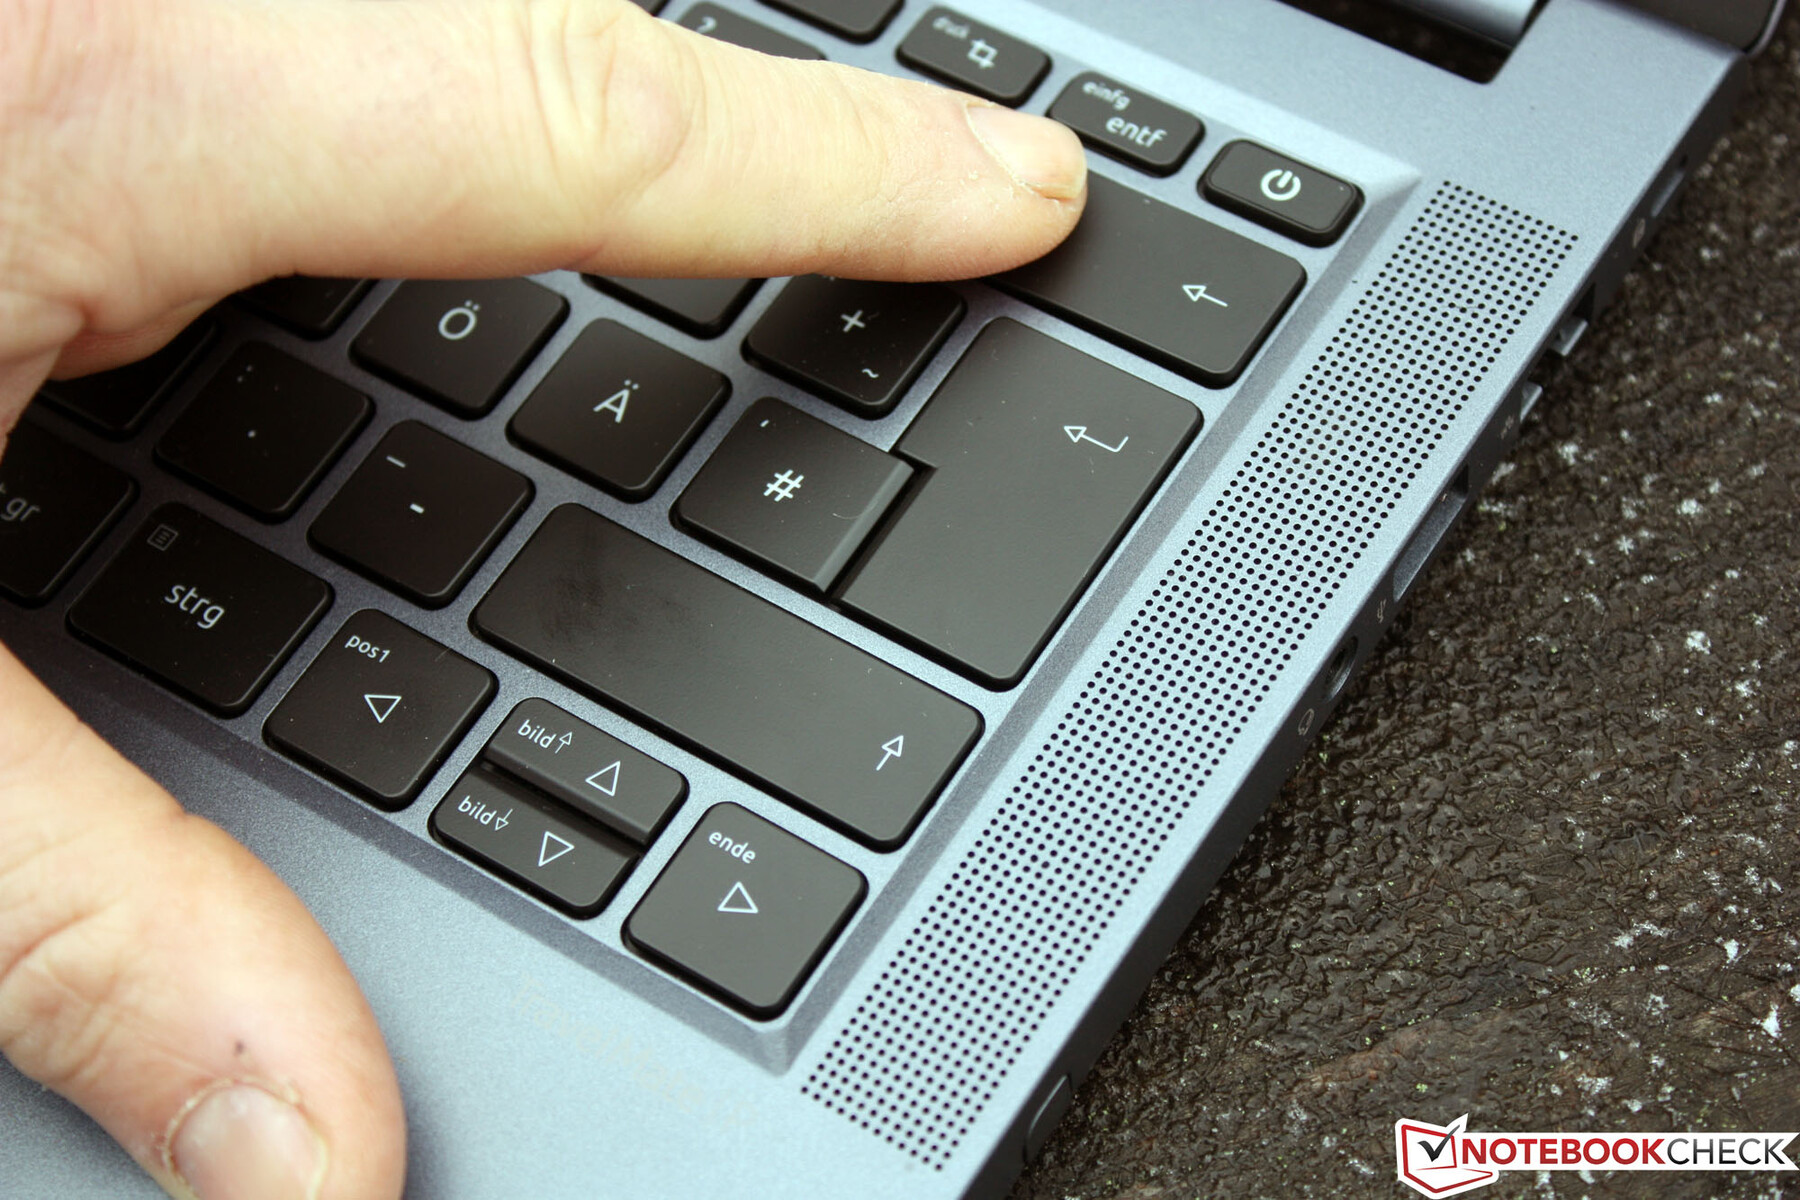
Acer uses a chiclet rubber dome keyboard that can be illuminated in two steps. It now offers a good distance between the keys. Their crisp pressure point in combination with the tight key stroke creates a pleasant typing experience, and the keyboard doesn't have any give in any place. While typing isn't completely silent, it comes close. The keys have a discretely matted surface that allows sliding the fingers. The F and J keys are marked for touch typists as usual. The keys don't include a secondary level assignment for the number block that isn't there anymore. Even though the up/down keys are smaller, they are still easily usable. A positive point is the Fn assignment of the arrow keys with Home, End, PgUp, and PgDn.
While some might not like the inclusion of the on/off button at the top right of the keyboard, the manufacturer made an effort to prevent accidental triggering: The button has a special frame and almost no stroke, so you have to press hard to trigger it.

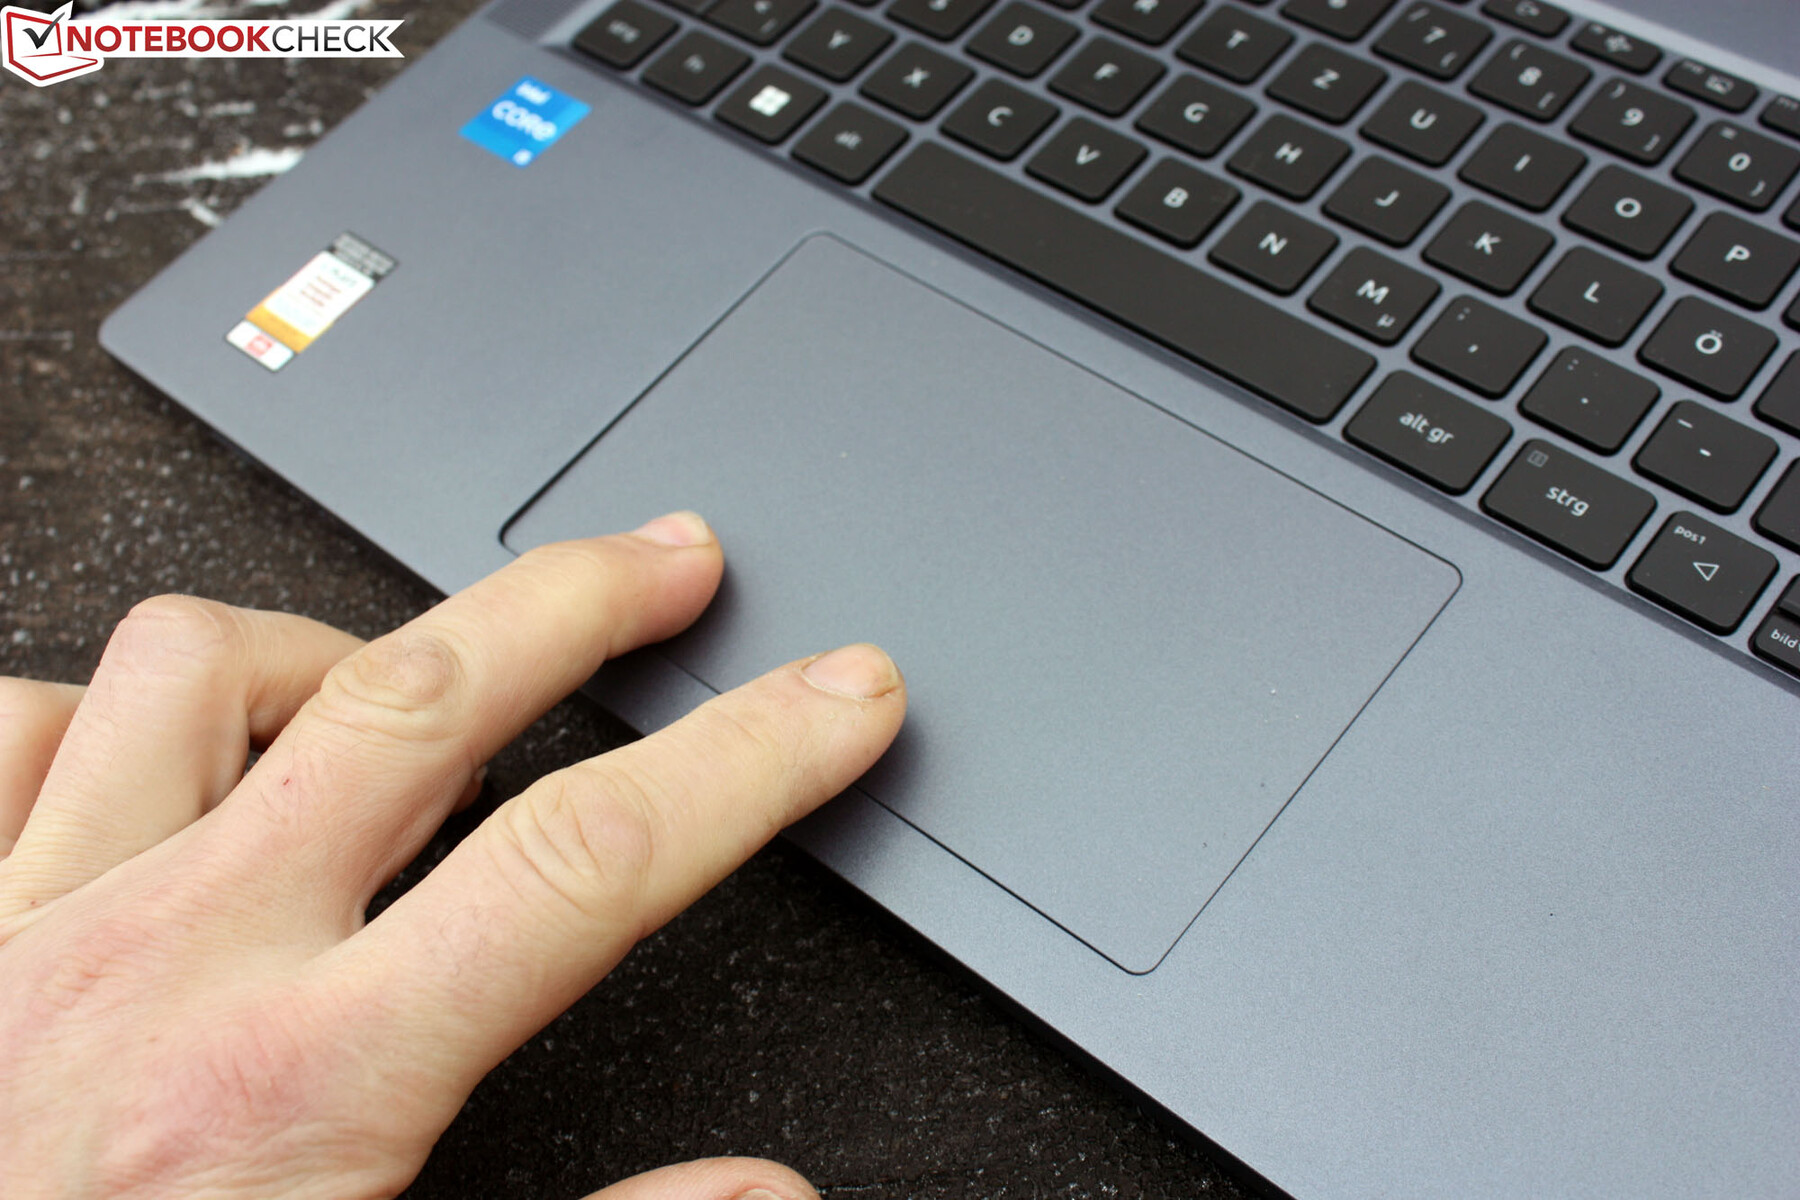
Touchpad
The ClickPad measures 14.5 cm (~5.7 in) in the diagonal and is placed exactly in the center. We never felt that we had to deactivate it while typing, although you can still do this using an Fn key. The stroke is short, and we can really only press on the bottom half of the area since it would take too much force above. The clicking noise is unobtrusive, since it is quiet and dull. Due to the short stroke, the pressure point doesn't feel clear enough. All multitouch gestures are supported. The pad surface is smoother than the surrounding palm rests, also allowing fingers to find their way by touch only.
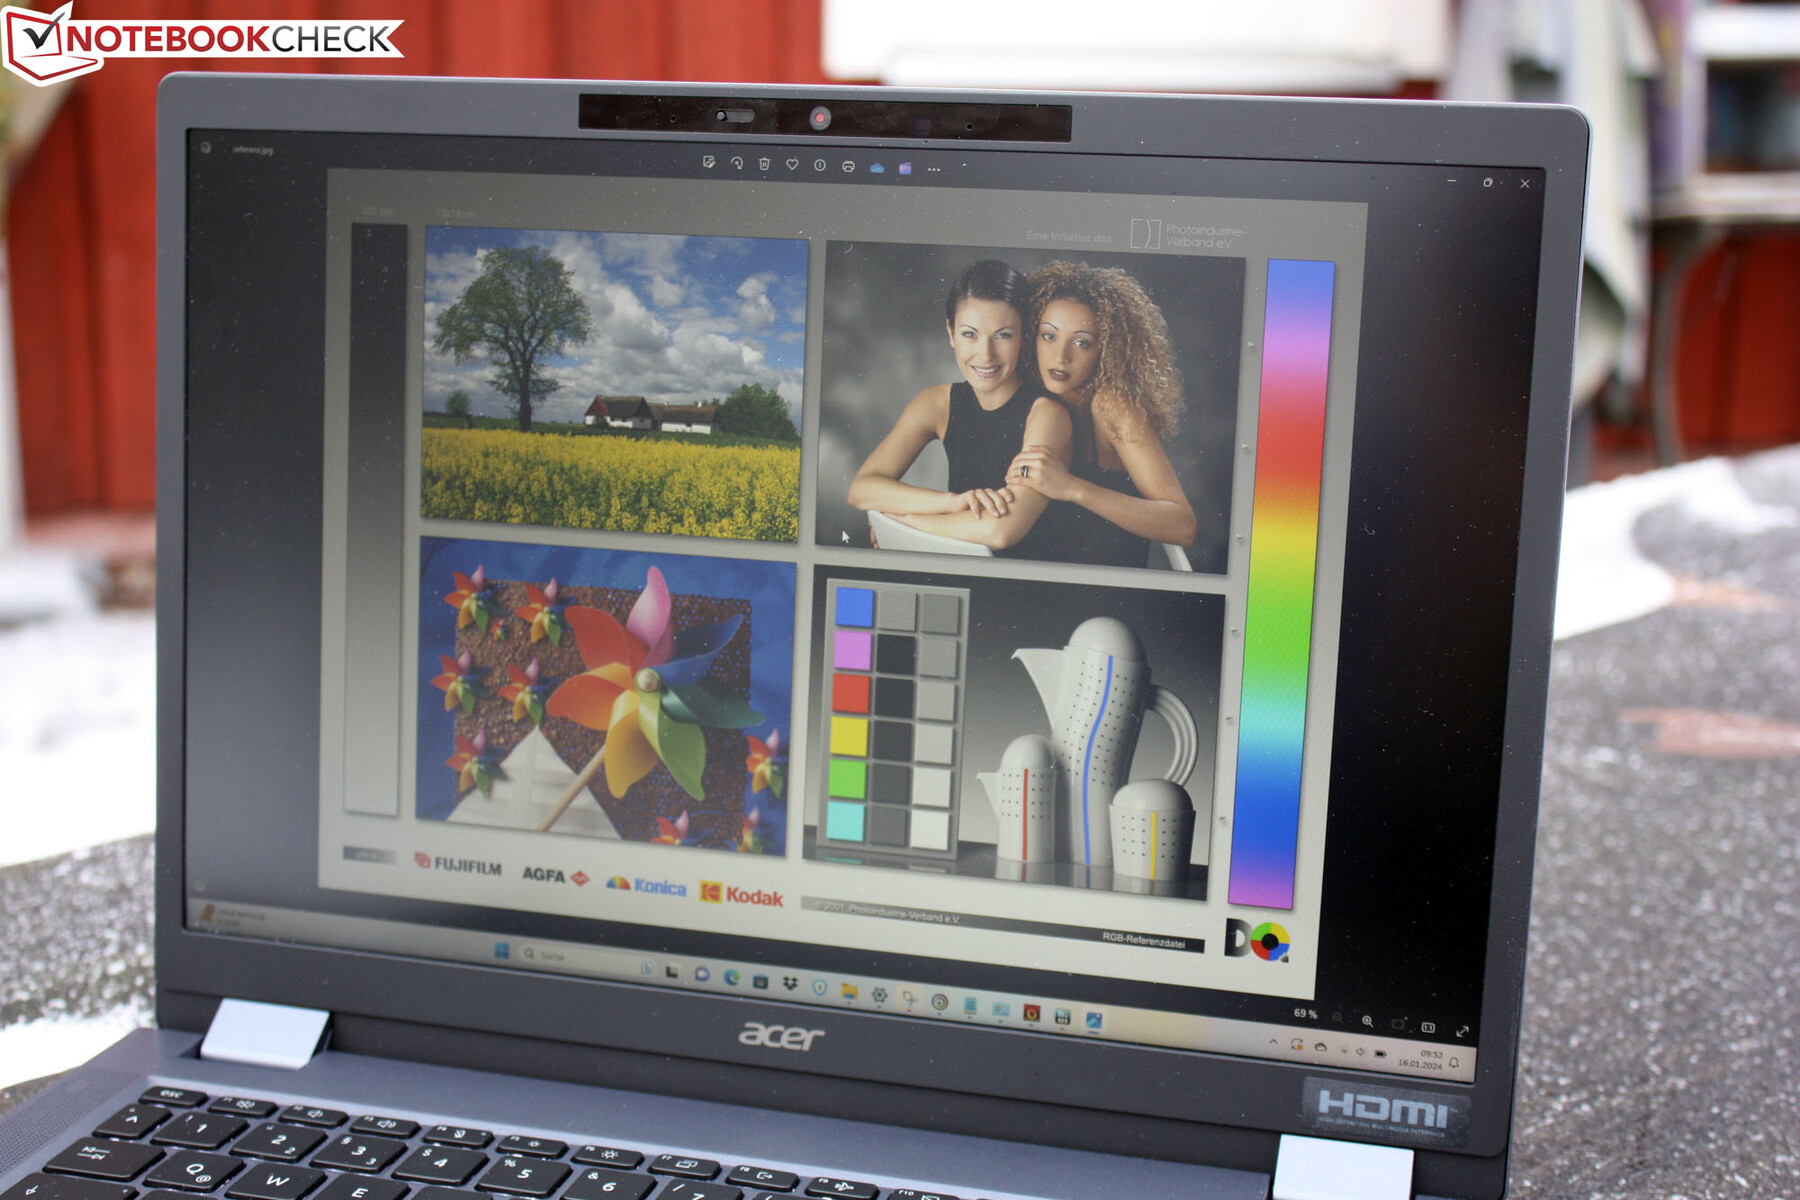
Display
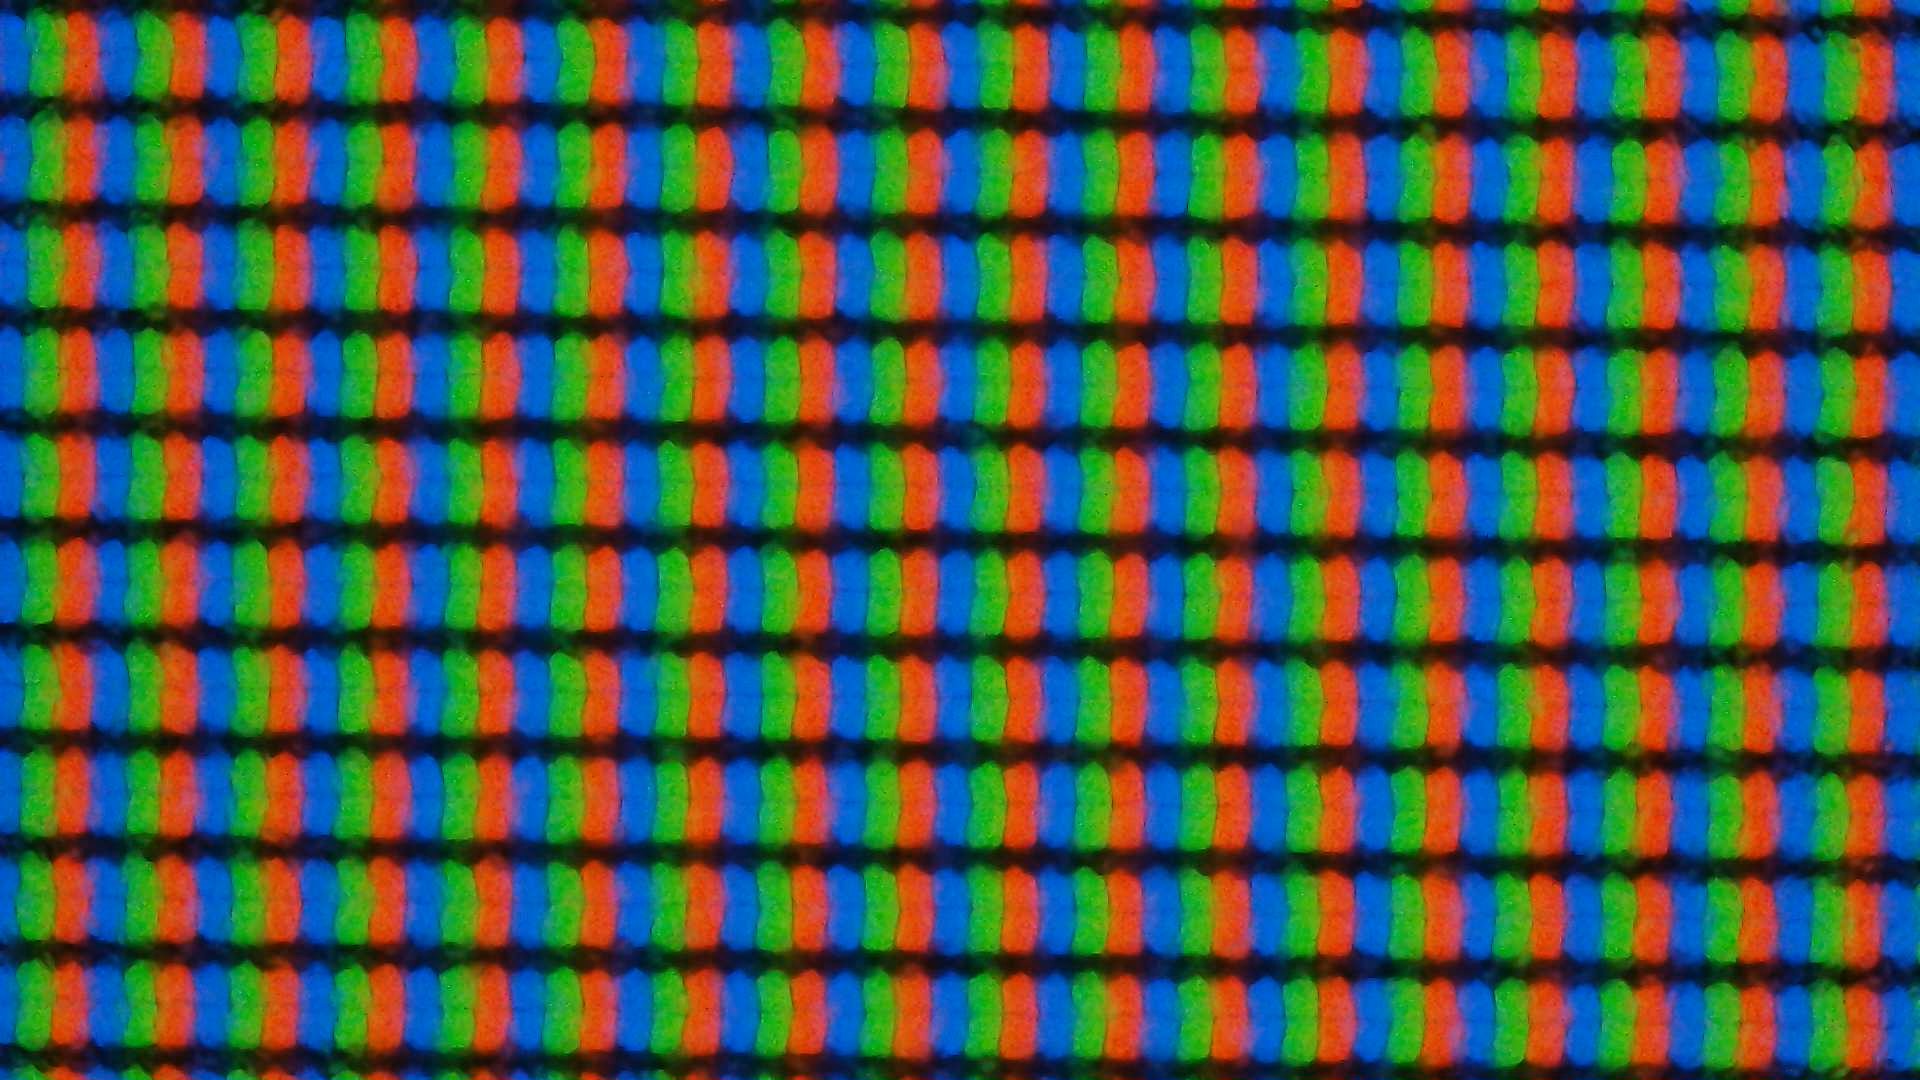
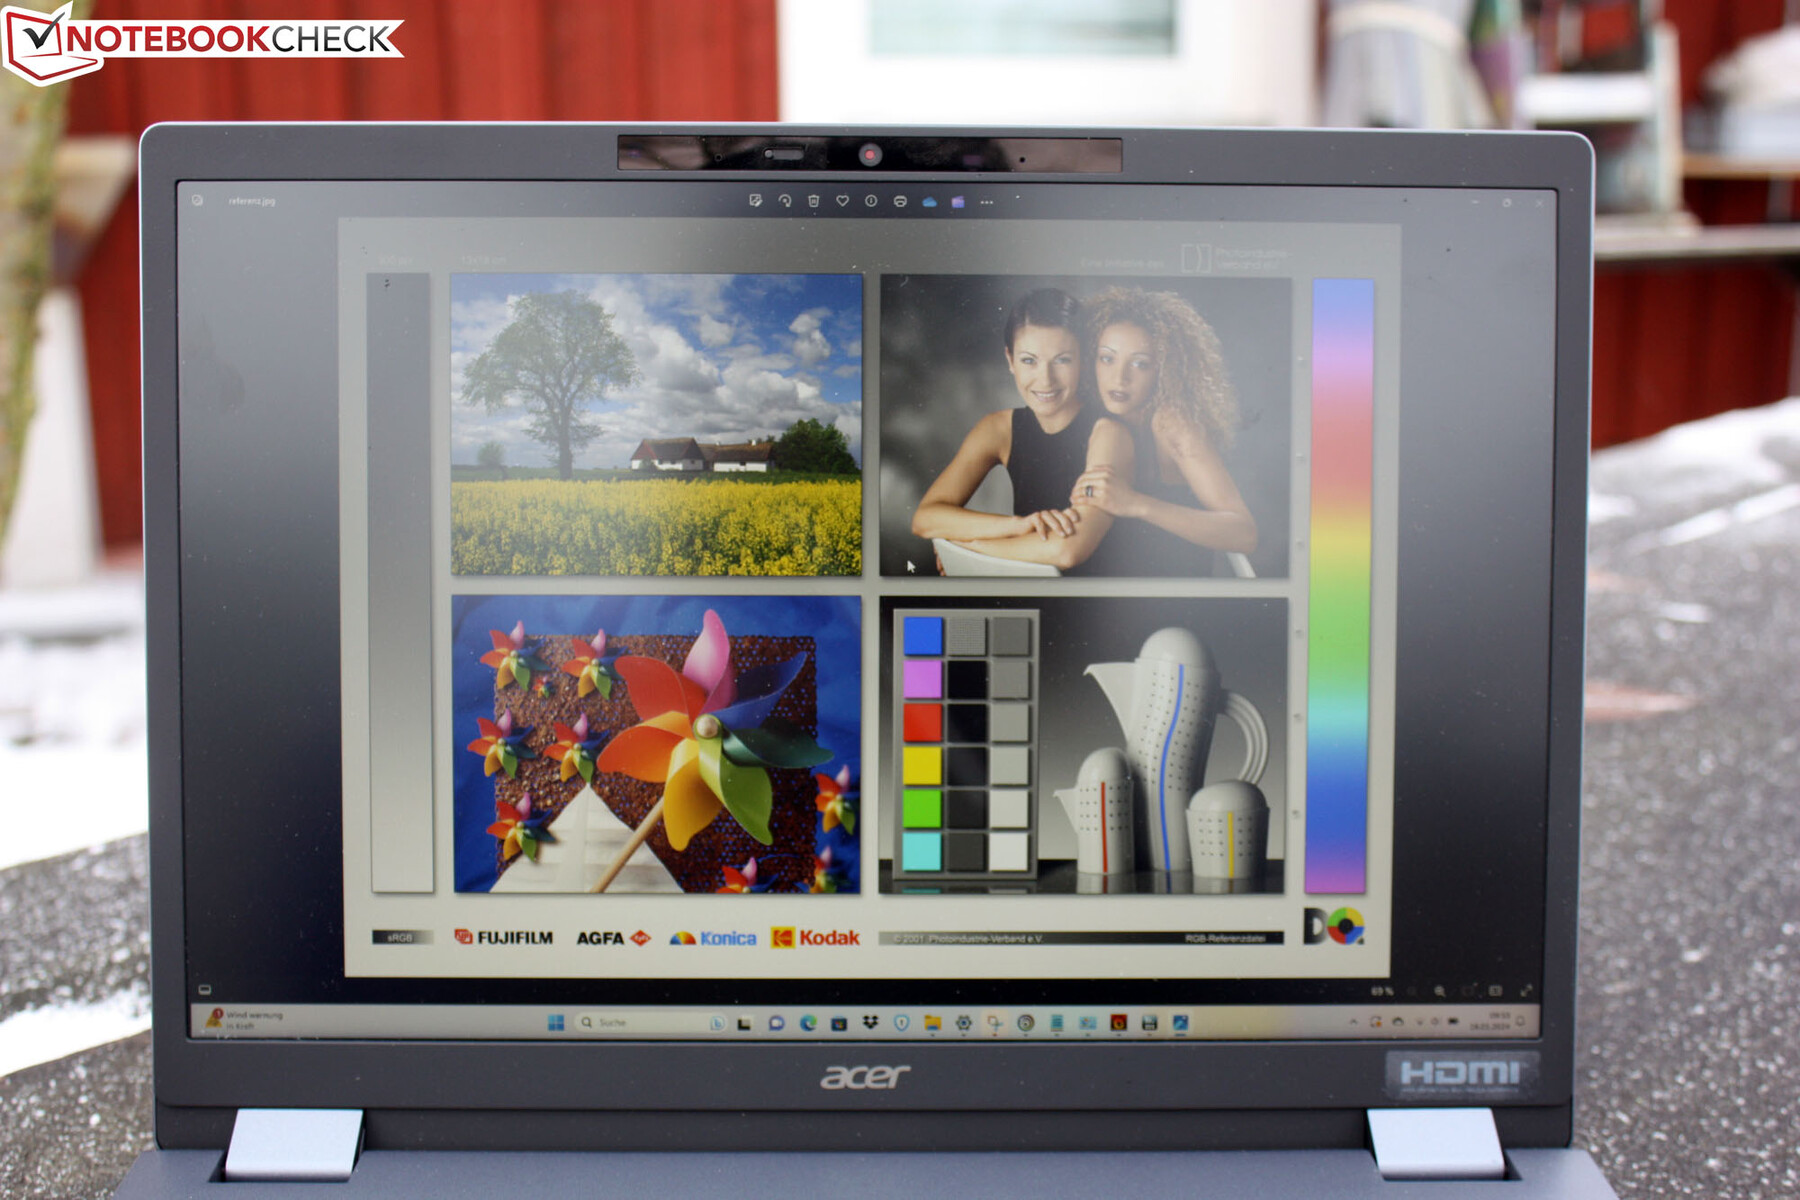
The 14-inch laptop uses a non-reflective BOE IPS panel with a resolution of 1,920 x 1,200 pixels. This is the 16:10 format instead of 16:9 (1,920 x 1,080), which offers more height with the same width when working on Excel sheets or documents, for example. Two Windows can be placed comfortably side-by-side. Some of the competitors offer a higher resolution in the same price segment, such as 2,240 x 1,400 with the ThinkPad E14 G5-21JSS05C00. Even though this would allow fitting four smaller Windows on the screen, the writing would be too small for the eyes of many users. We continue to think that Full HD is an appropriate resolution for 14 inches, and more isn't needed for office usage.
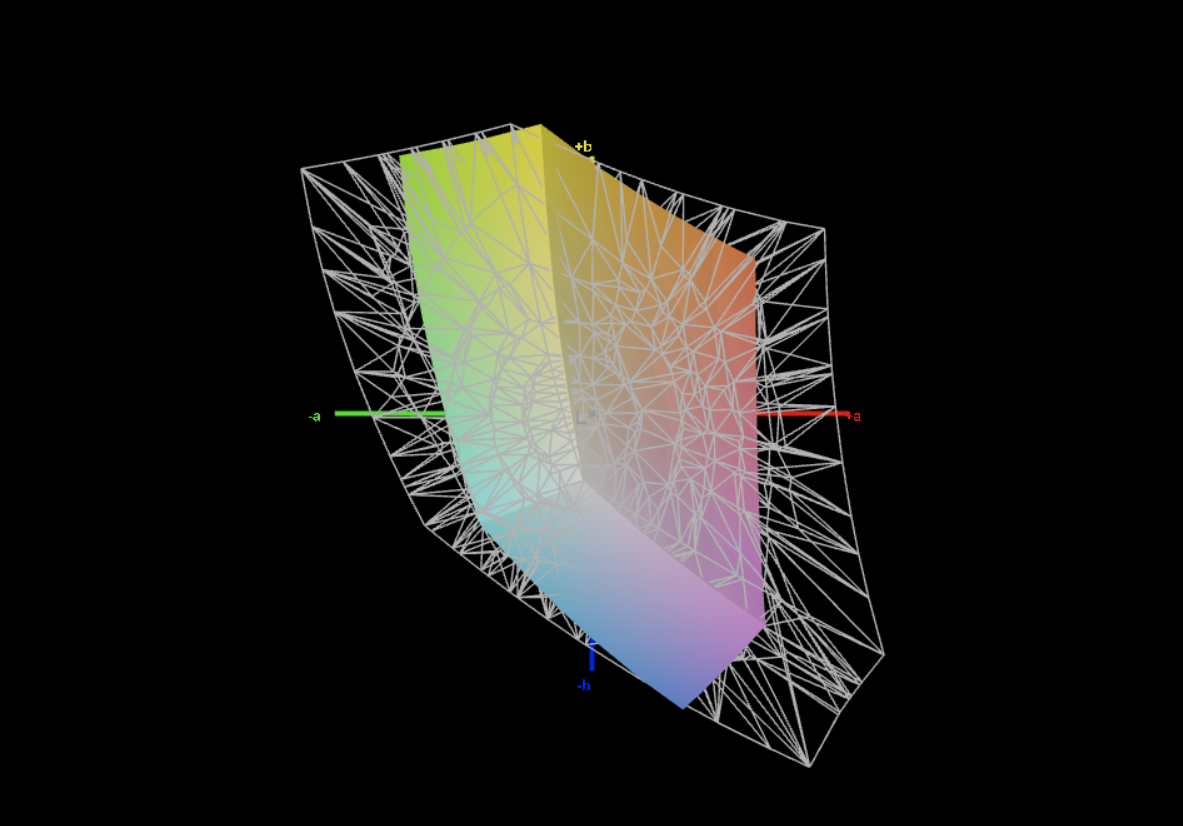
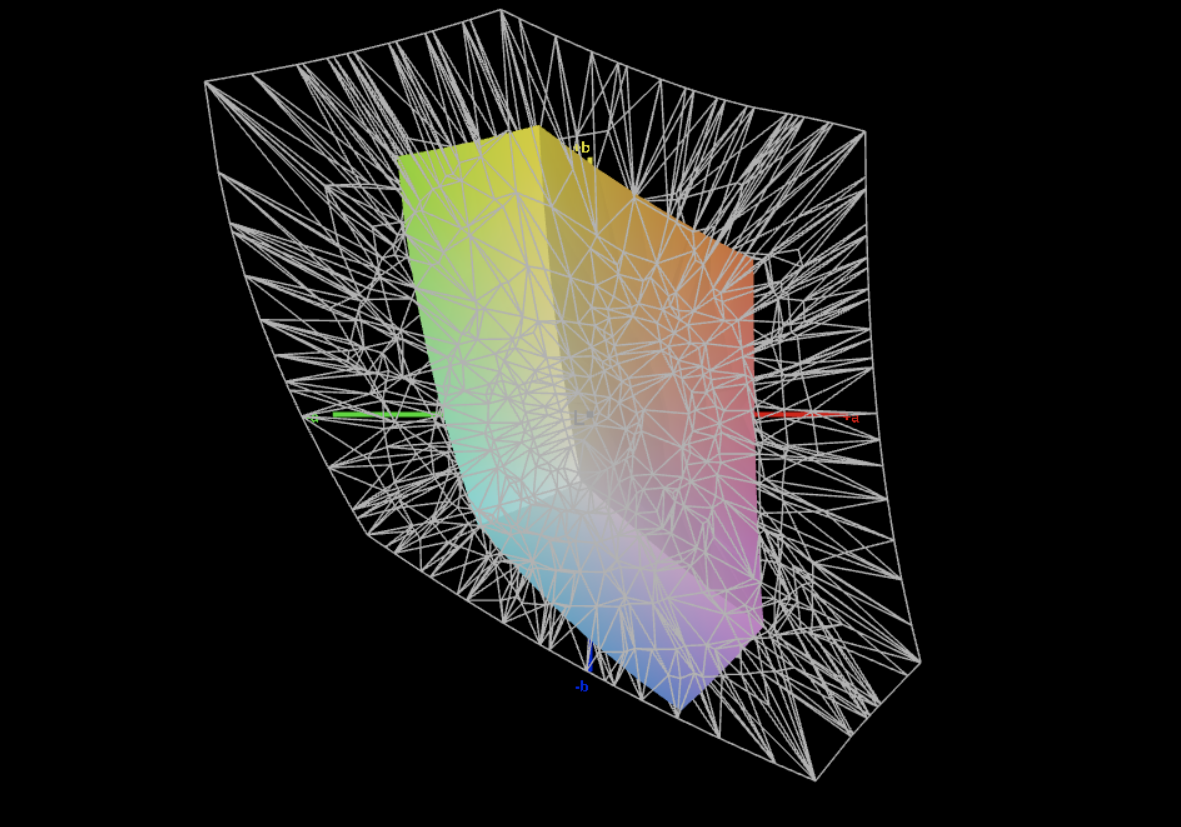
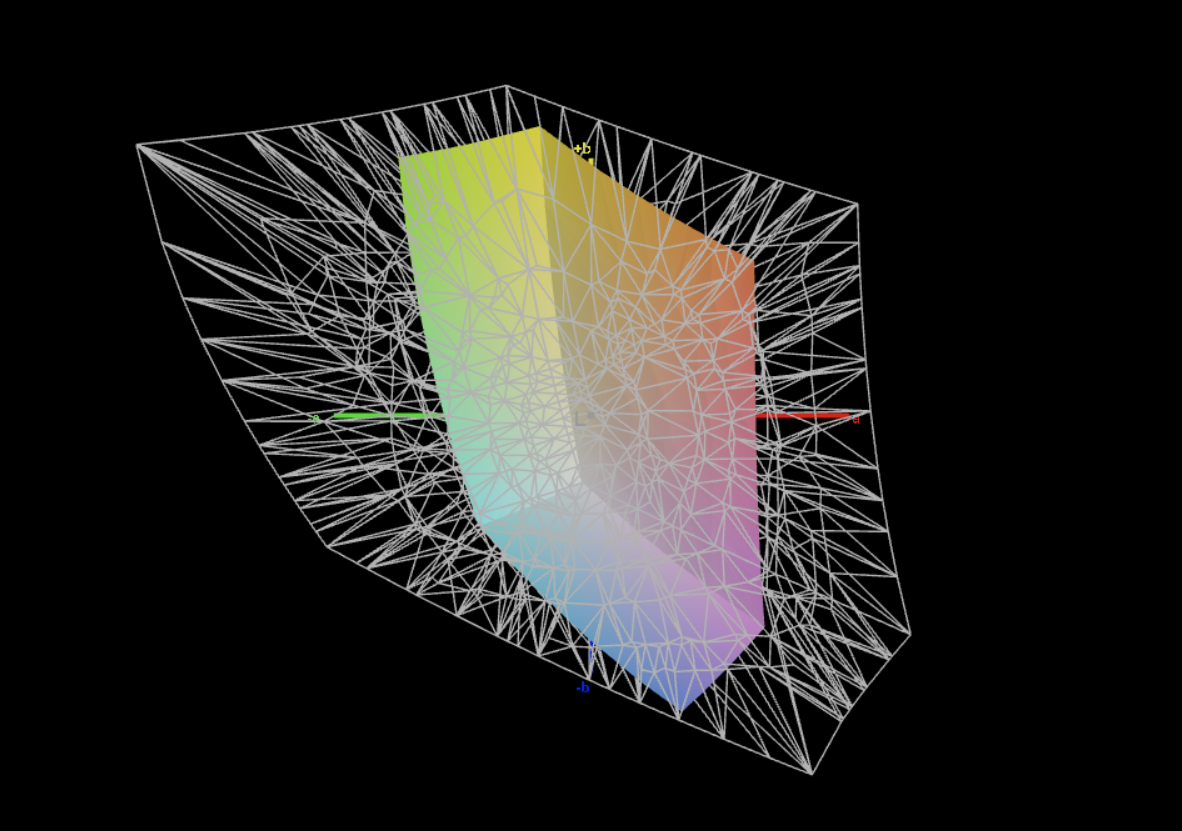
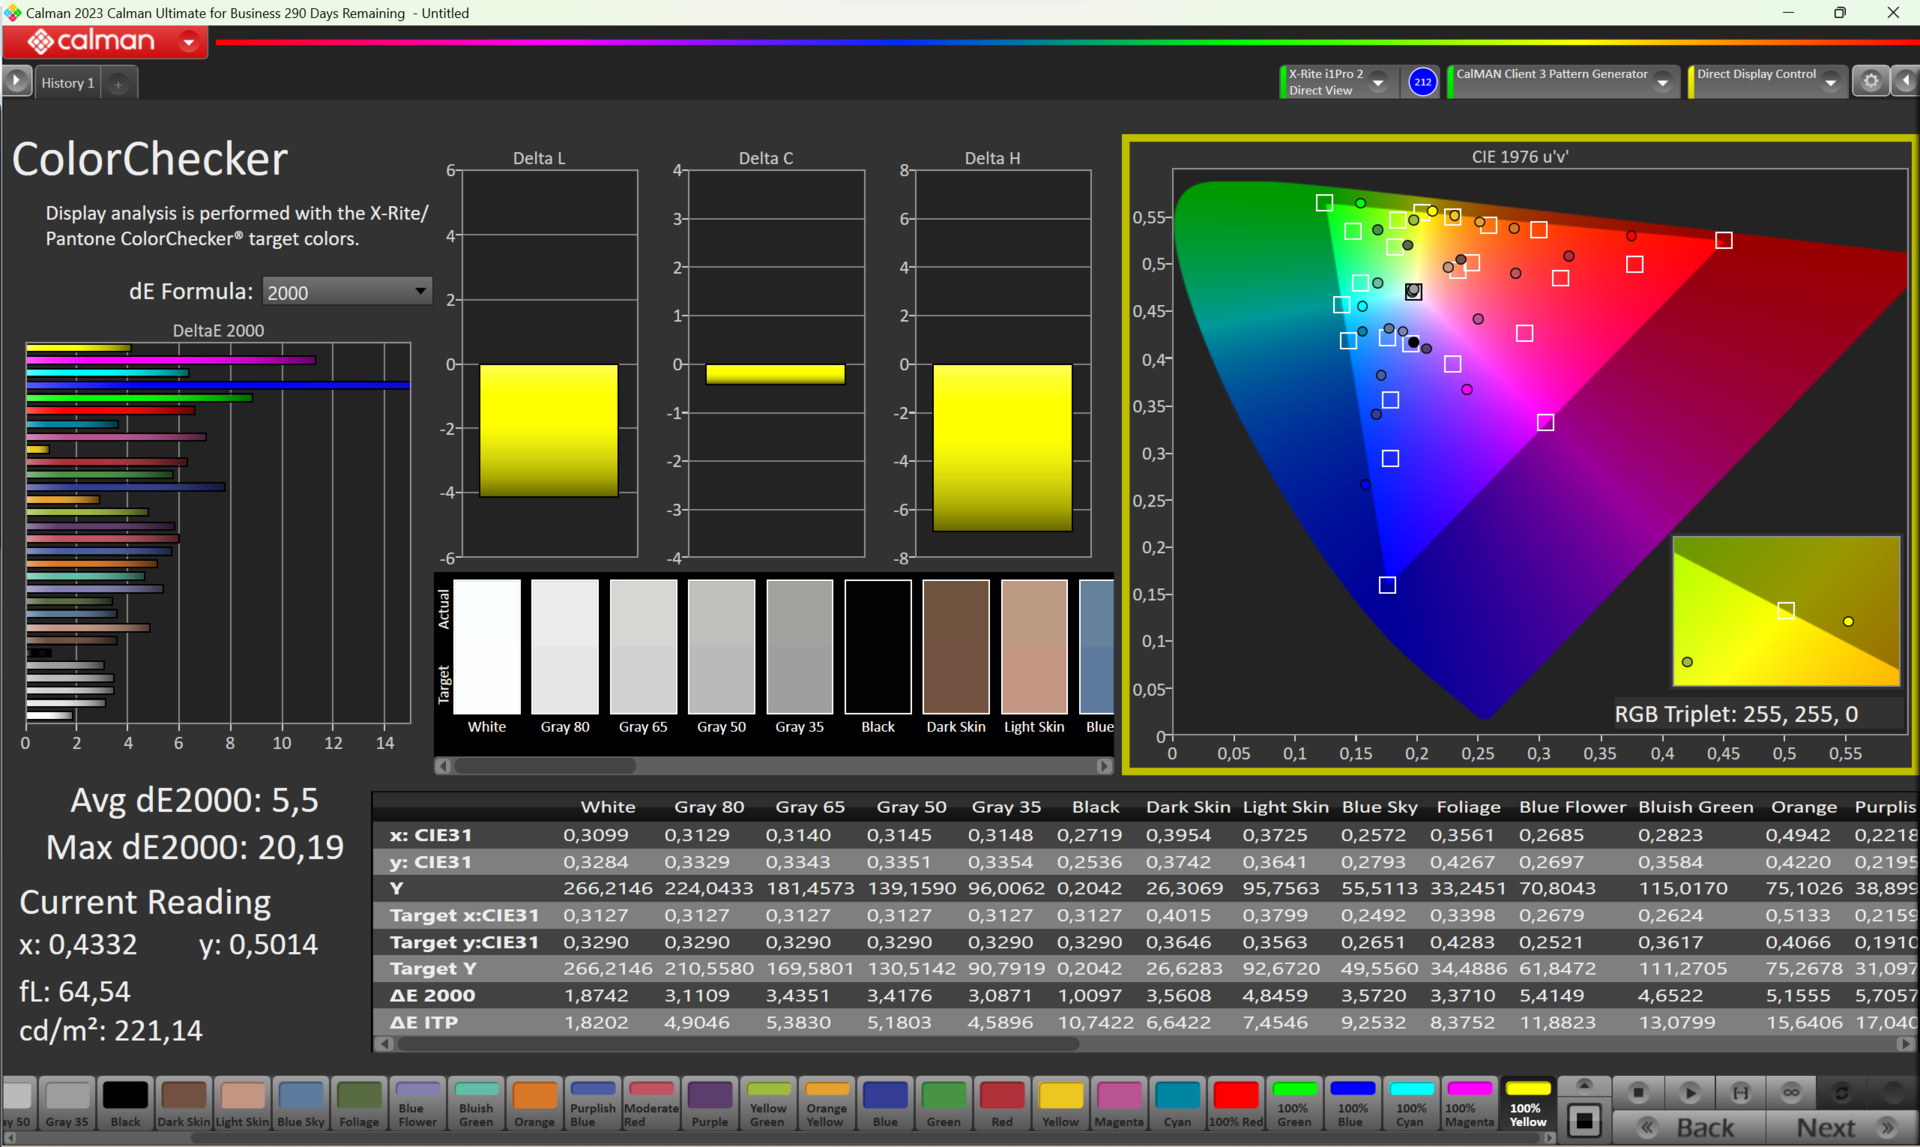
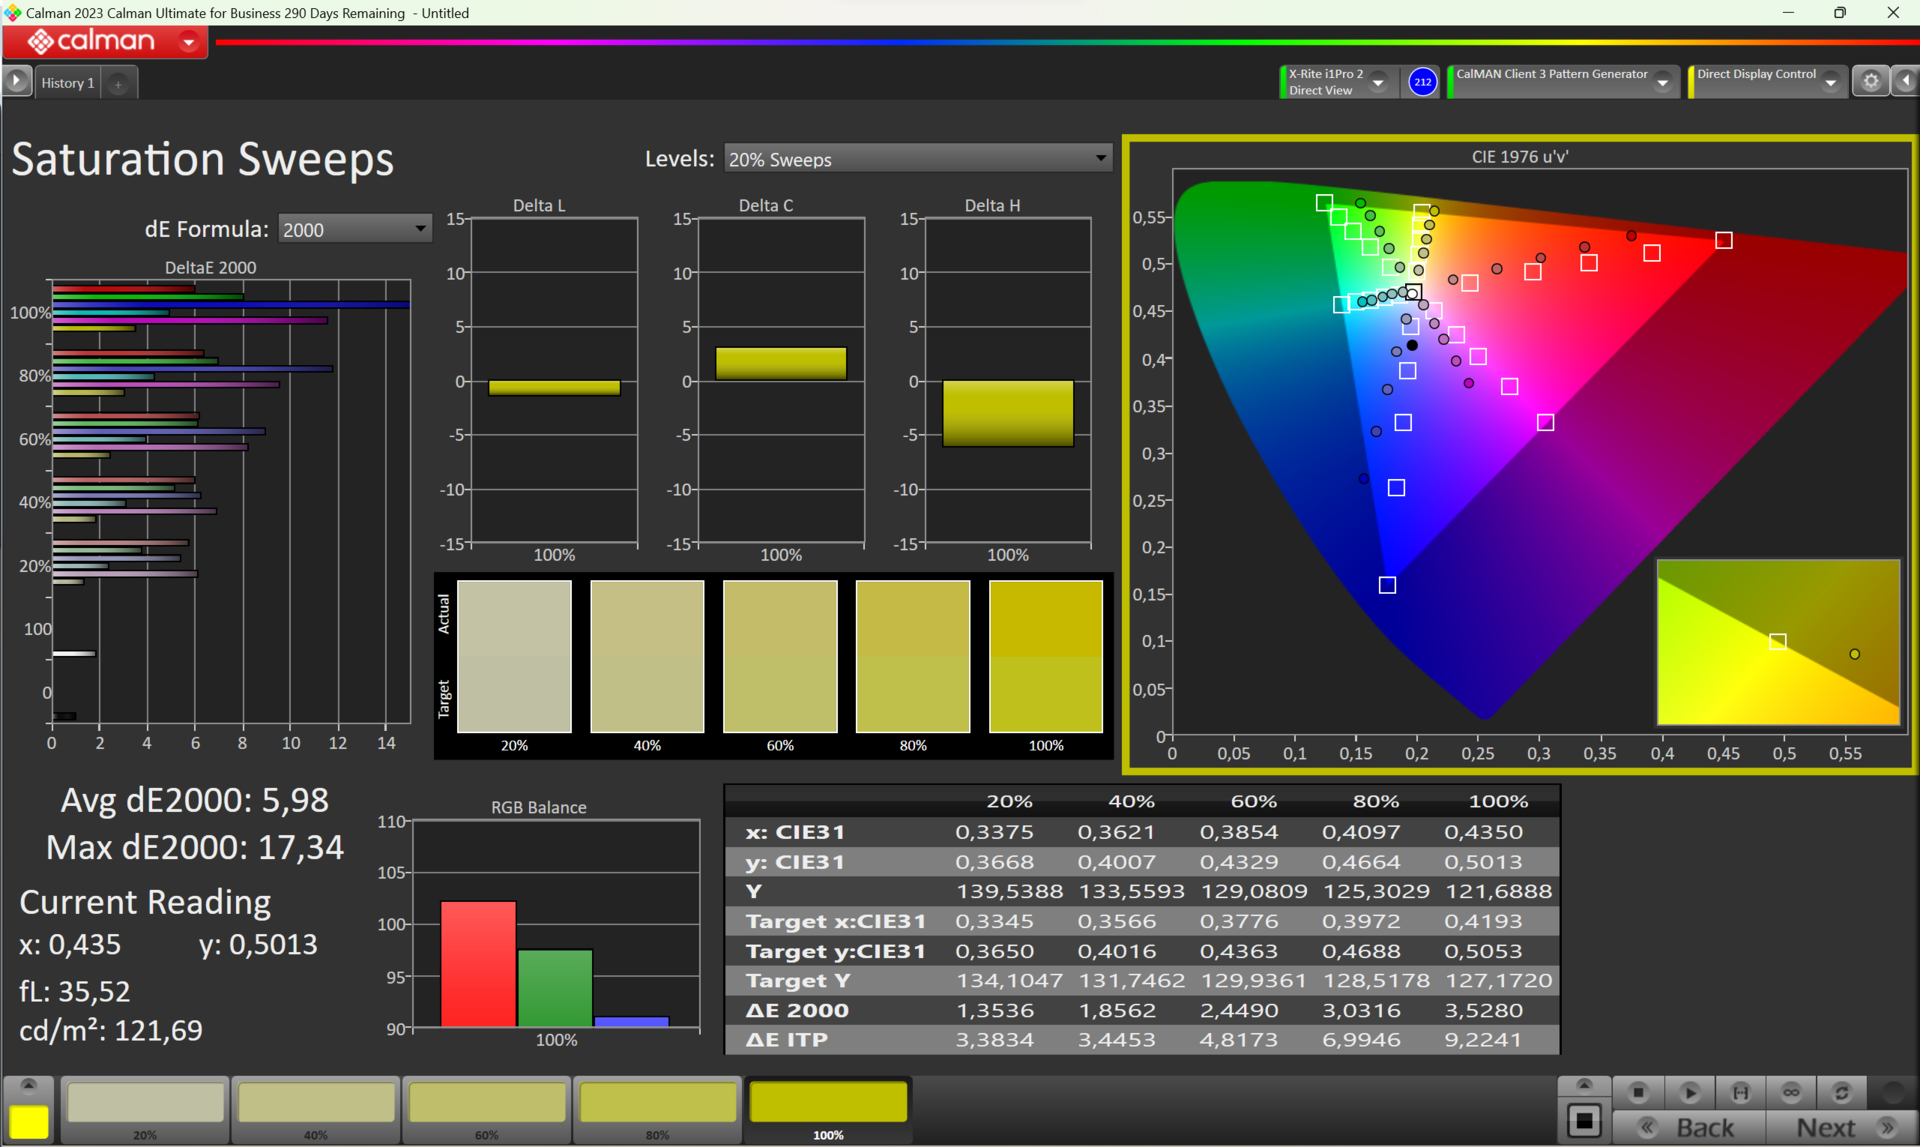
The weakness of the panel lies in its low color space coverage (59% sRGB). Unaffected by this, we get a crisp image in the office with the high contrast having a positive effect. Due to the matte surface, the colors aren't vibrant but rather pale, but this is more eye-friendly for its designed purpose. PWM isn't used for brightness regulation, which brings some relief to sensitive users. While the response times are slow, they are completely acceptable for an office laptop.
| |||||||||||||||||||||||||
Brightness Distribution: 91 %
Center on Battery: 213 cd/m²
Contrast: 1406:1 (Black: 0.18 cd/m²)
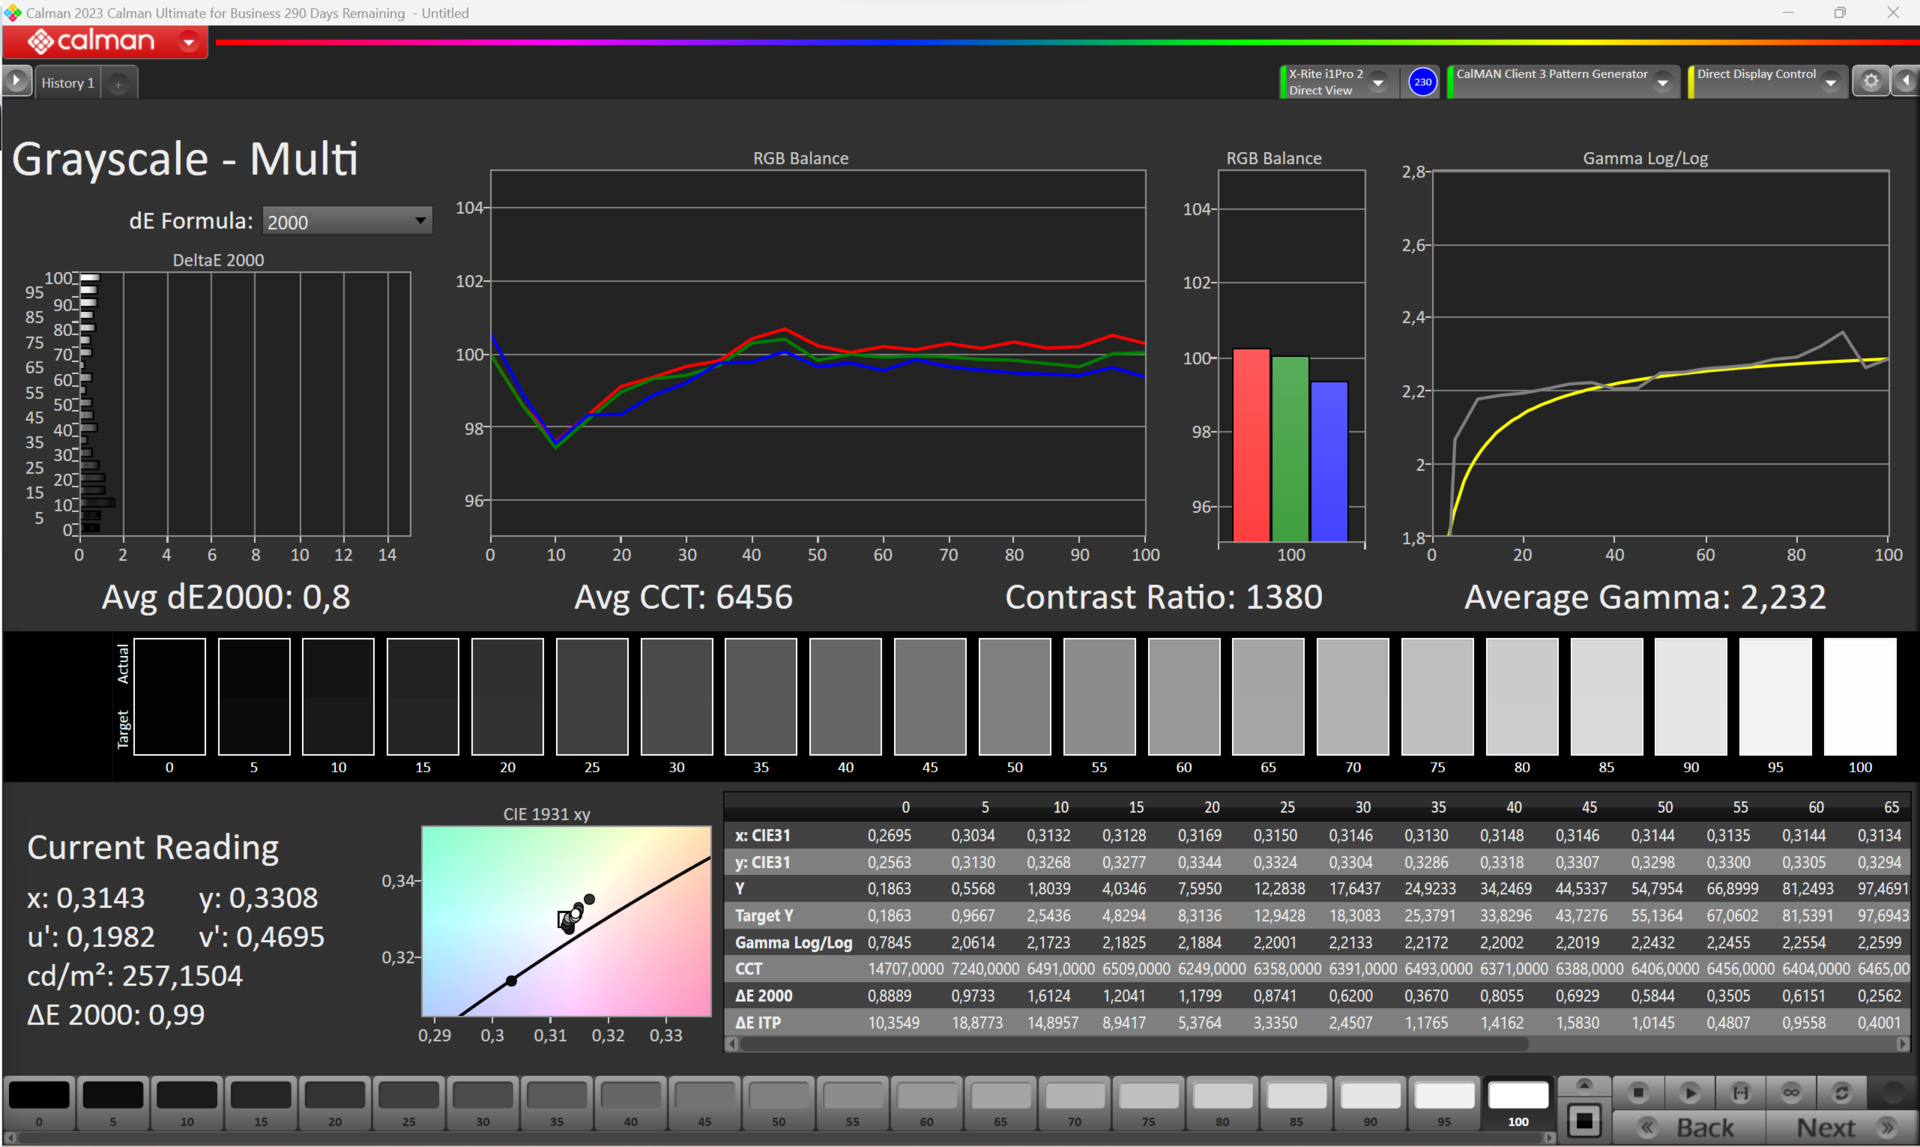
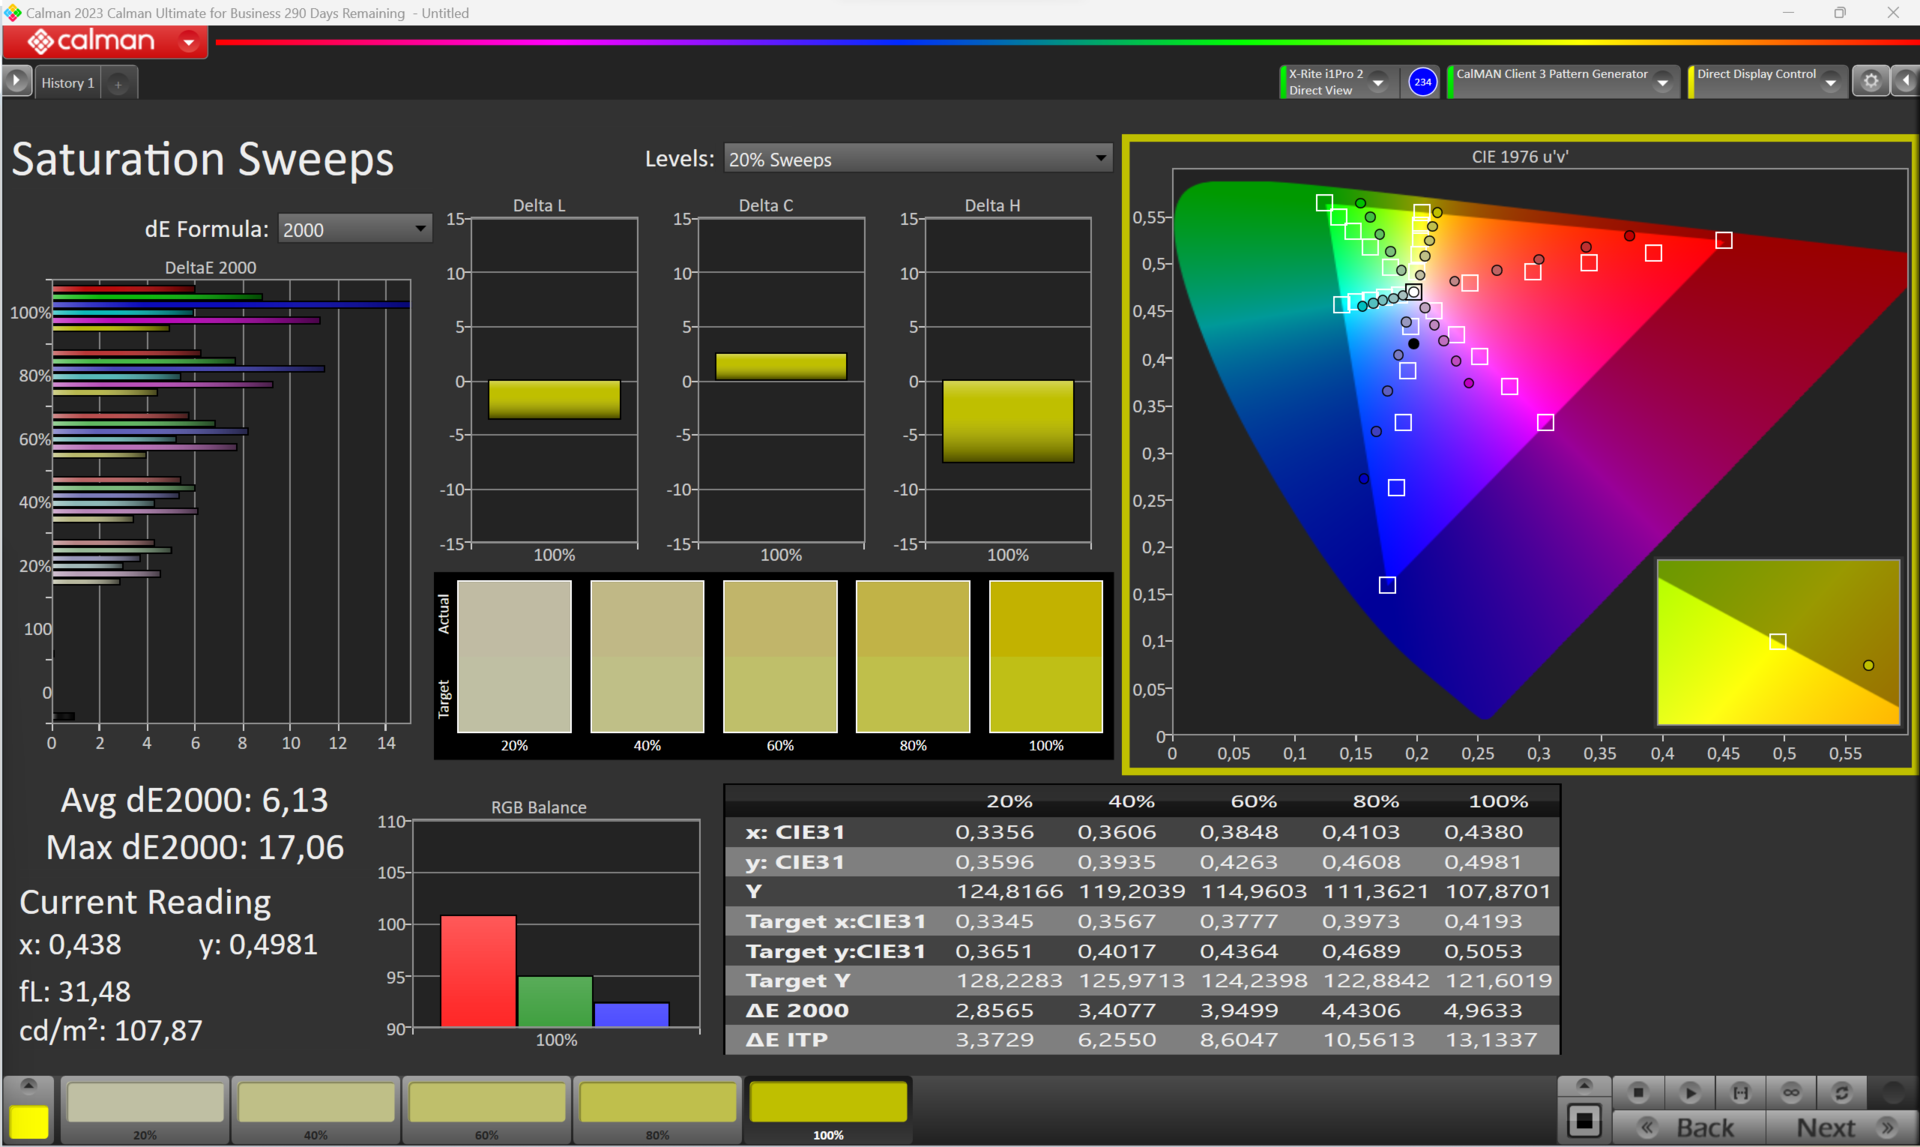
ΔE ColorChecker Calman: 5.5 | ∀{0.5-29.43 Ø4.72}
calibrated: 4.99
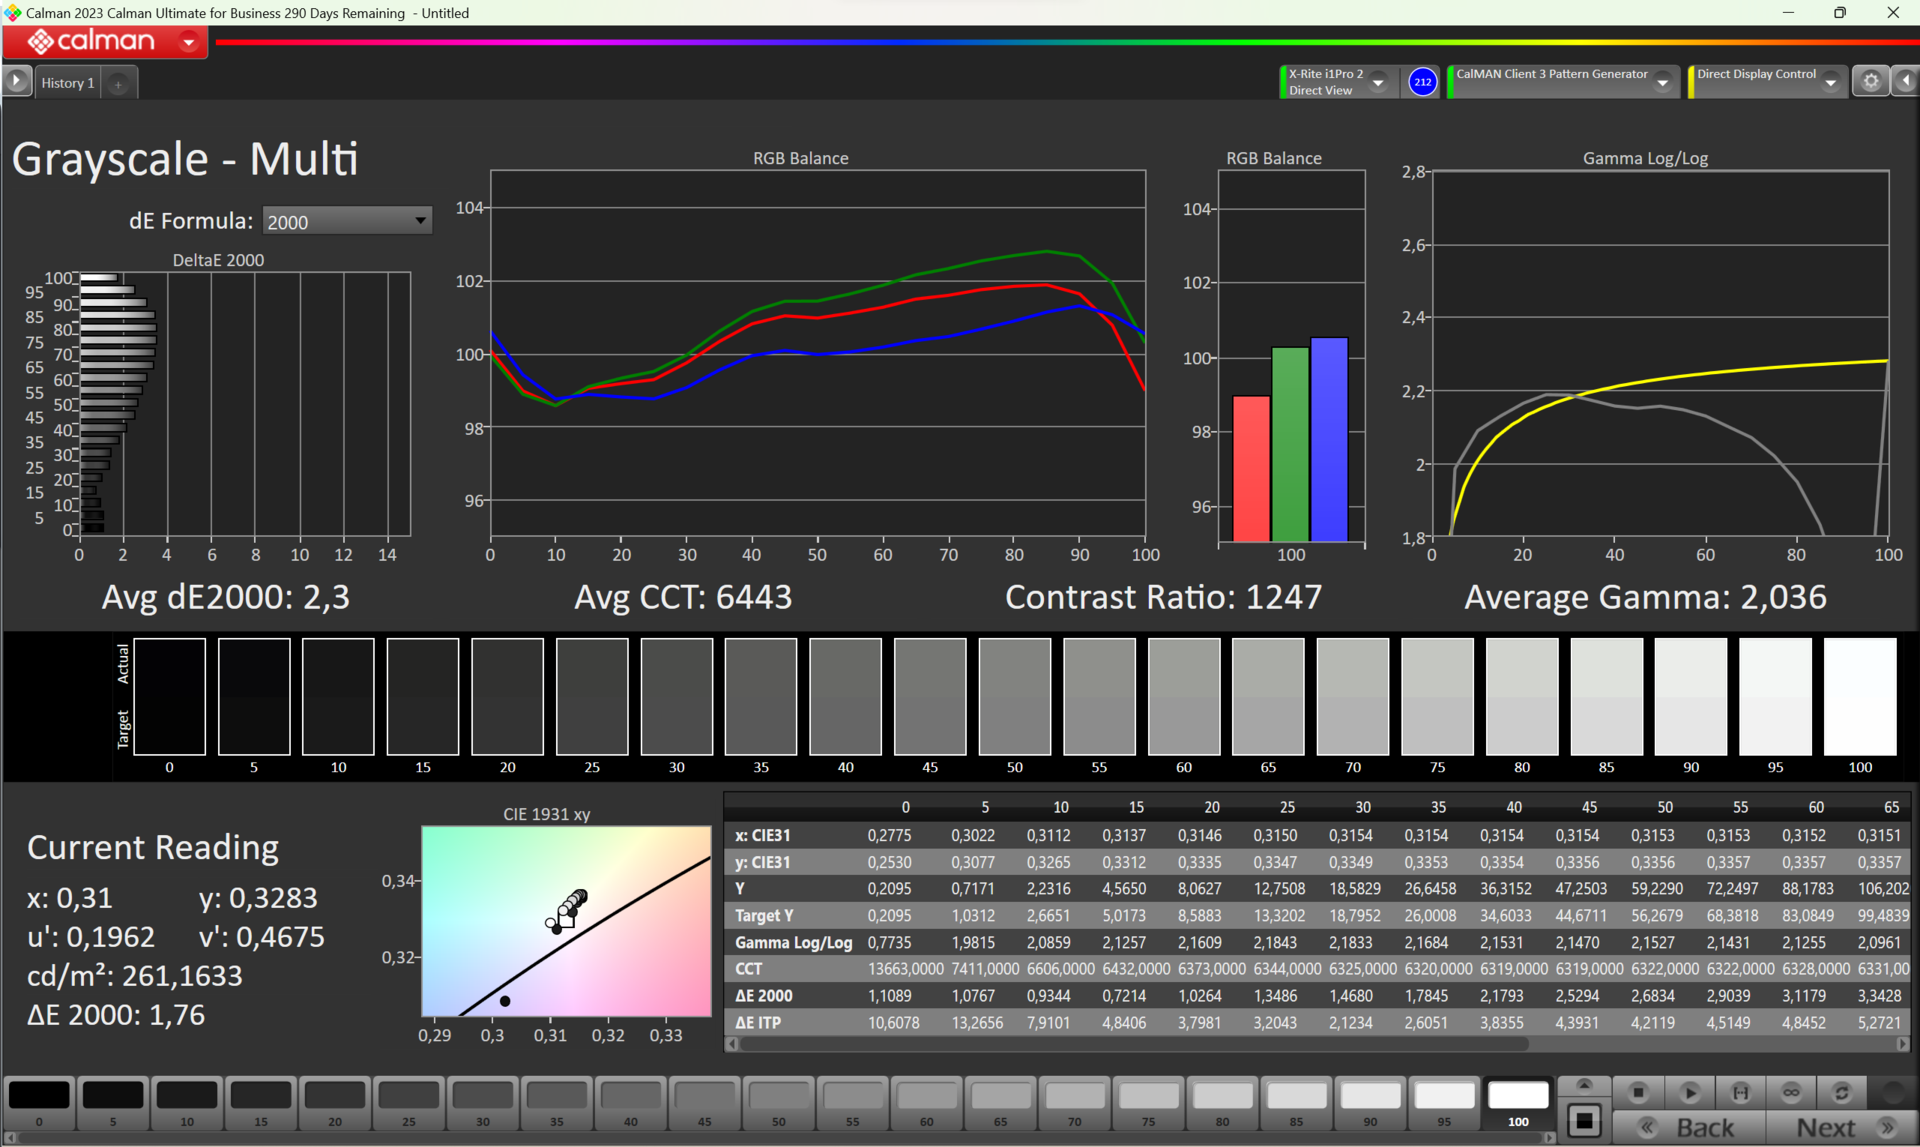
ΔE Greyscale Calman: 2.3 | ∀{0.09-98 Ø4.97}
41.3% AdobeRGB 1998 (Argyll 3D)
58.8% sRGB (Argyll 3D)
39.98% Display P3 (Argyll 3D)
Gamma: 2.036
CCT: 6443 K
| Acer TravelMate P4 TMP414-53-58XQ BOE NV140WUM-N41, IPS, 1920x1200, 14" | Dell Latitude 7440 AU Optronics B140QAX, IPS, 2560x1600, 14" | Lenovo ThinkPad E14 G5-21JSS05C00 M140NWHE R1, IPS, 2240x1400, 14" | Lenovo ThinkPad E14 G5 i7-1355U R140NW4D R5, IPS, 1920x1200, 14" | HP ProBook 440 G9-5Y3Z3EA AUO559C, , 1920x1080, 14" | HP ProBook 445 G10 AUO2FA6, IPS, 1920x1080, 14" | |
|---|---|---|---|---|---|---|
| Display | 81% | 70% | 6% | -7% | 68% | |
| Display P3 Coverage (%) | 39.98 | 75.4 89% | 69.3 73% | 41.9 5% | 37 -7% | 68.4 71% |
| sRGB Coverage (%) | 58.8 | 99.9 70% | 97.6 66% | 63 7% | 55.5 -6% | 95.2 62% |
| AdobeRGB 1998 Coverage (%) | 41.3 | 76.2 85% | 70.4 70% | 43.3 5% | 38.2 -8% | 70.6 71% |
| Response Times | -95% | -25% | -13% | -27% | -68% | |
| Response Time Grey 50% / Grey 80% * (ms) | 22.8 ? | 56 ? -146% | 36.3 ? -59% | 30.7 ? -35% | 42 ? -84% | 53.4 ? -134% |
| Response Time Black / White * (ms) | 21.5 ? | 30.8 ? -43% | 19.5 ? 9% | 19.6 ? 9% | 15 ? 30% | 21.8 ? -1% |
| PWM Frequency (Hz) | ||||||
| Screen | 18% | 34% | -1% | -43% | 35% | |
| Brightness middle (cd/m²) | 253 | 517.3 104% | 362 43% | 352.3 39% | 255 1% | 501 98% |
| Brightness (cd/m²) | 238 | 488 105% | 354 49% | 344 45% | 233 -2% | 464 95% |
| Brightness Distribution (%) | 91 | 88 -3% | 91 0% | 86 -5% | 86 -5% | 87 -4% |
| Black Level * (cd/m²) | 0.18 | 0.34 -89% | 0.18 -0% | 0.27 -50% | 0.26 -44% | |
| Contrast (:1) | 1406 | 1521 8% | 2011 43% | 1305 -7% | 1927 37% | |
| Colorchecker dE 2000 * | 5.5 | 3.3 40% | 2.6 53% | 4.99 9% | 8.41 -53% | 2.64 52% |
| Colorchecker dE 2000 max. * | 20.19 | 7.81 61% | 3.7 82% | 14.84 26% | 13.51 33% | 5.06 75% |
| Colorchecker dE 2000 calibrated * | 4.99 | 1.02 80% | 1.1 78% | 1.87 63% | 1.57 69% | |
| Greyscale dE 2000 * | 2.3 | 5.6 -143% | 3.3 -43% | 5.3 -130% | 7.6 -230% | 3.8 -65% |
| Gamma | 2.036 108% | 2.37 93% | 2.28 96% | 2.2 100% | 3.12 71% | 2.103 105% |
| CCT | 6443 101% | 6804 96% | 6761 96% | 7682 85% | 6233 104% | 6562 99% |
| Total Average (Program / Settings) | 1% /
16% | 26% /
33% | -3% /
-1% | -26% /
-30% | 12% /
27% |
* ... smaller is better
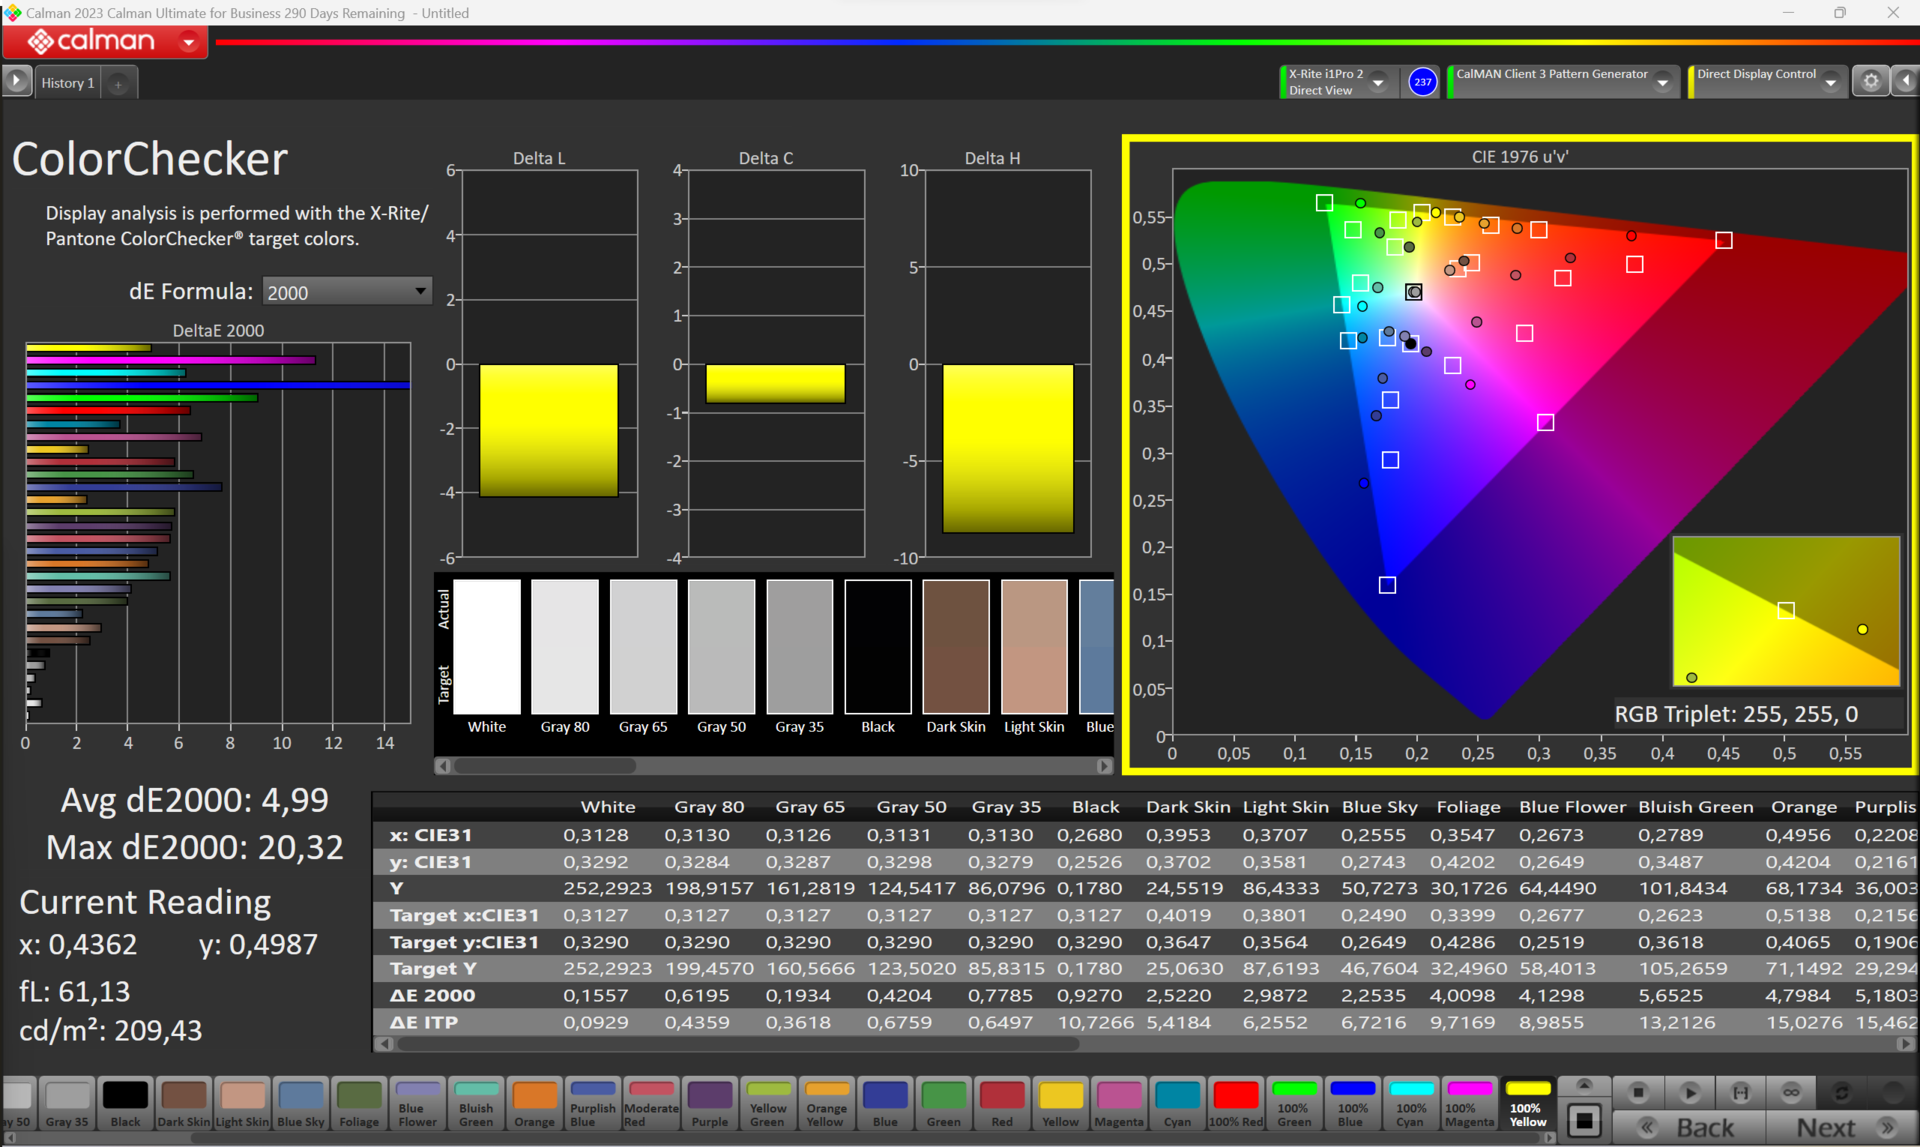
An additional calibration isn't worthwhile, since the DeltaE of the Grayscale is only reduced from 2.3 to 0.8. While this is still an improvement, most of the time our eyes are unable to perceive any difference from the original with deviations below 3.0. The ColorChecker DeltaE is reduced marginally from 5.5 to 5.0, which is far from the magical 3.0. This panel is not suited for professional image processing, as is shown by the Calman color calibration tool.
Display Response Times
| ↔ Response Time Black to White | ||
|---|---|---|
| 21.5 ms ... rise ↗ and fall ↘ combined | ↗ 11 ms rise |  |
| ↘ 10.5 ms fall | ||
| The screen shows good response rates in our tests, but may be too slow for competitive gamers. In comparison, all tested devices range from 0.1 (minimum) to 240 (maximum) ms. » 48 % of all devices are better. This means that the measured response time is similar to the average of all tested devices (19.8 ms). | ||
| ↔ Response Time 50% Grey to 80% Grey | ||
| 22.8 ms ... rise ↗ and fall ↘ combined | ↗ 9.7 ms rise |  |
| ↘ 13.1 ms fall | ||
| The screen shows good response rates in our tests, but may be too slow for competitive gamers. In comparison, all tested devices range from 0.165 (minimum) to 636 (maximum) ms. » 34 % of all devices are better. This means that the measured response time is better than the average of all tested devices (31 ms). | ||
Screen Flickering / PWM (Pulse-Width Modulation)
| Screen flickering / PWM not detected |  | ||
In comparison: 52 % of all tested devices do not use PWM to dim the display. If PWM was detected, an average of 7753 (minimum: 5 - maximum: 343500) Hz was measured. | |||
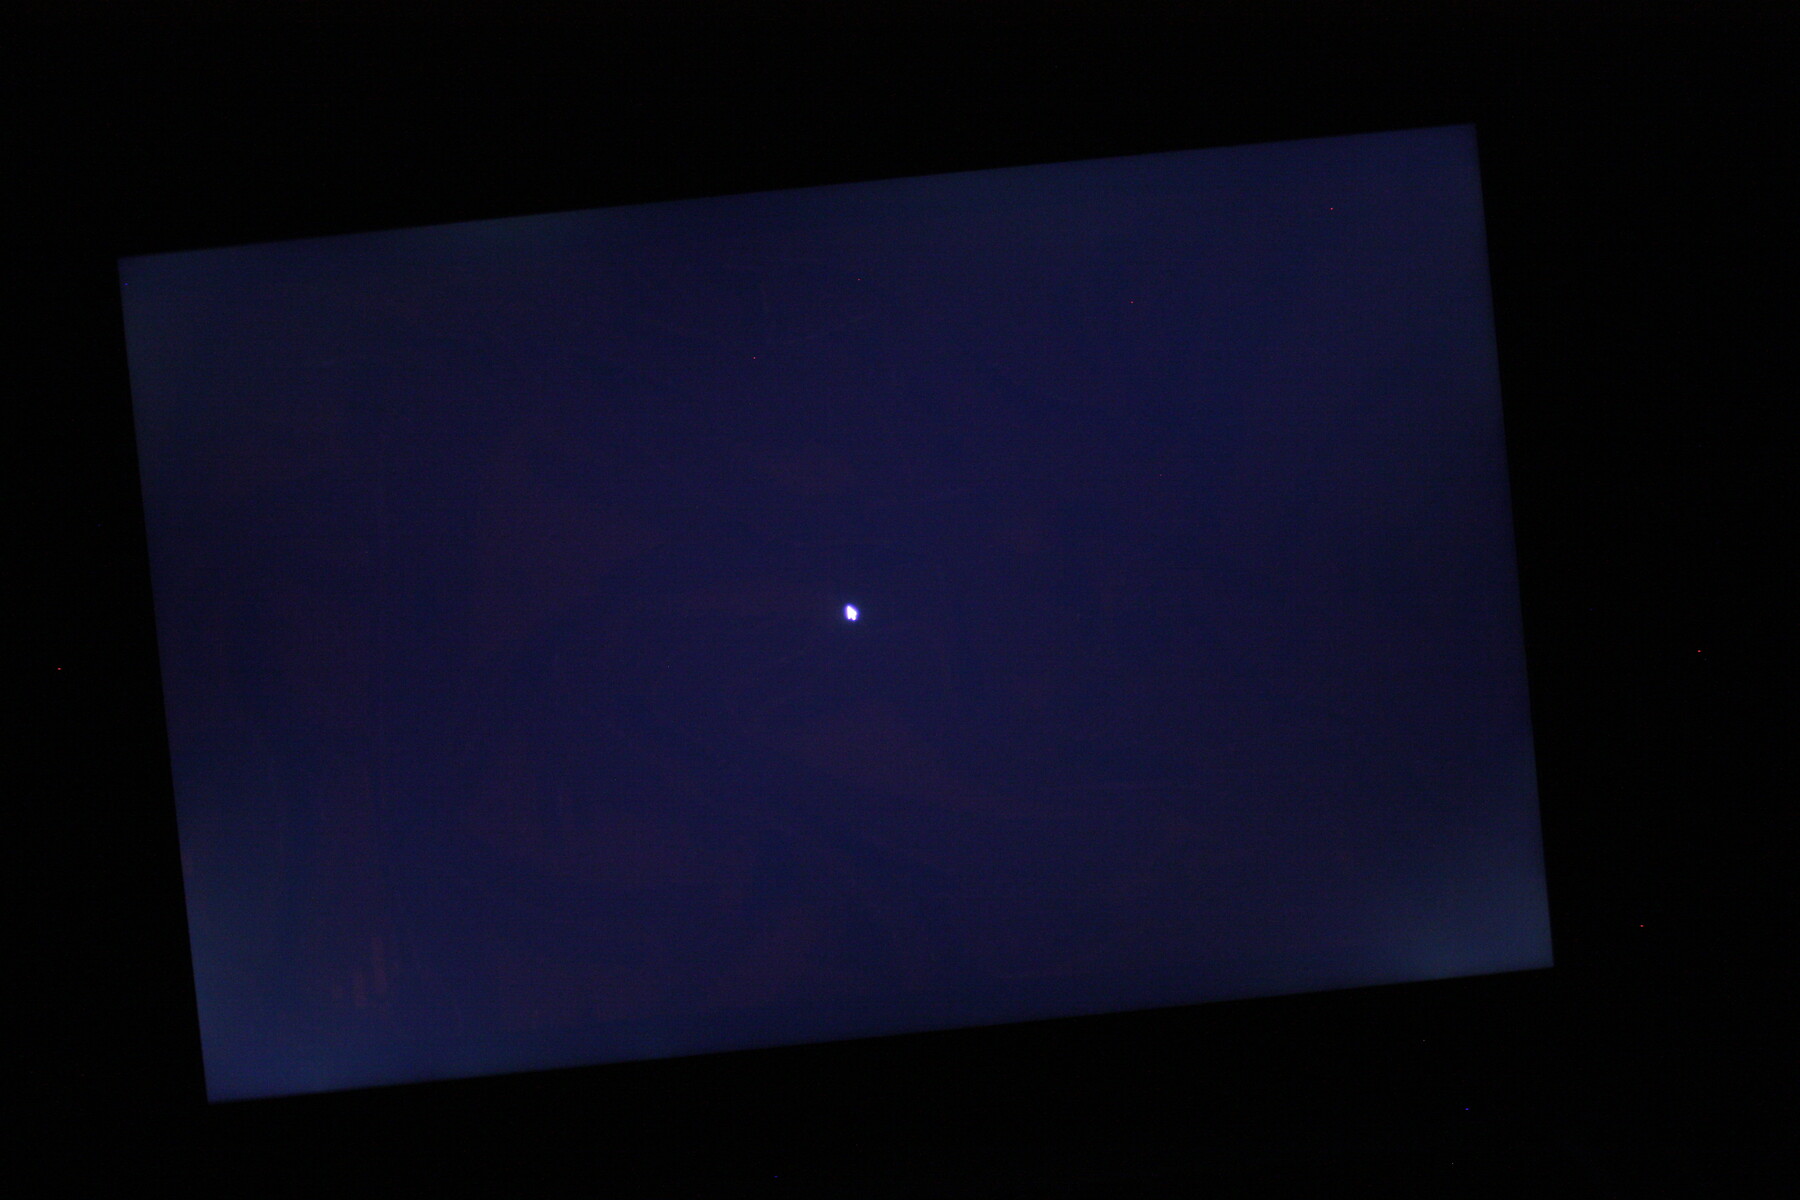
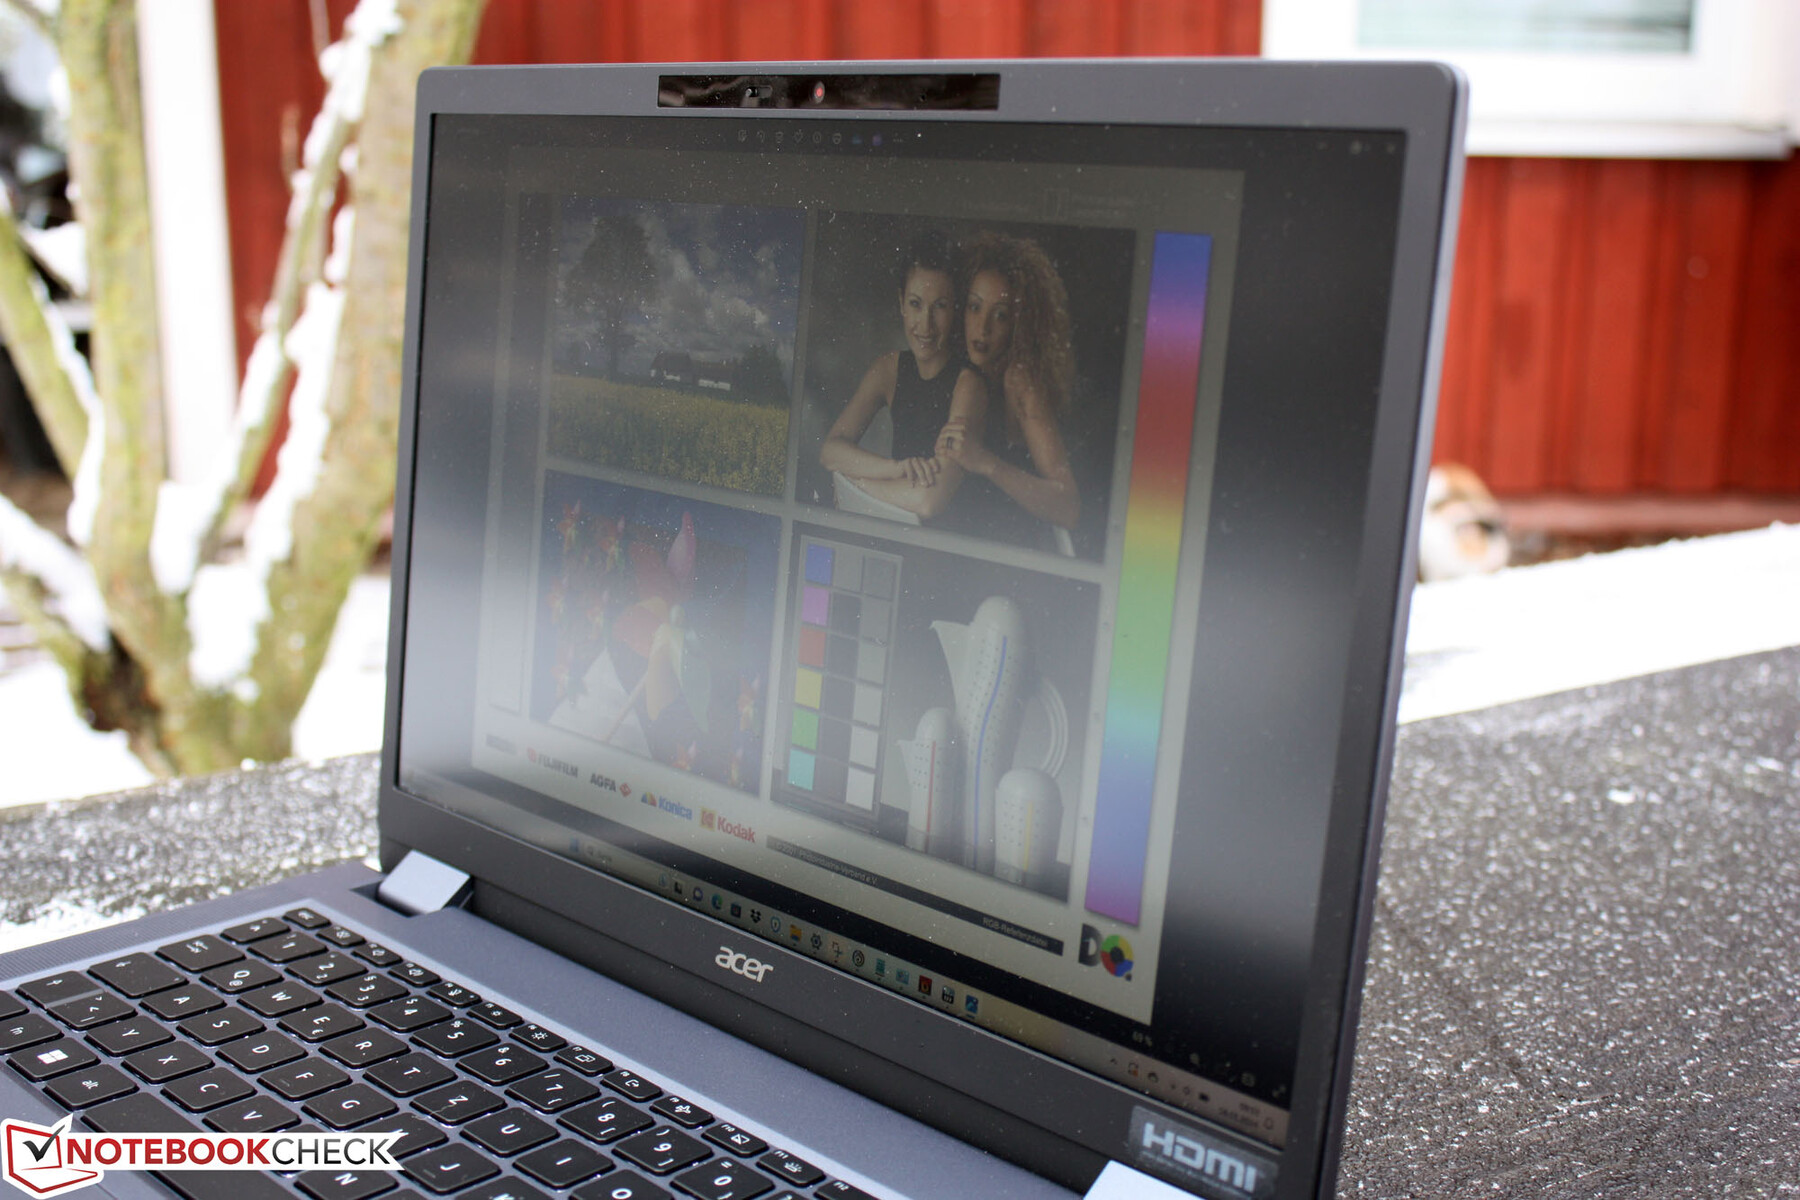
In daily operation, the largest weakness lies in the low maximum brightness of 253 cd/m² (center). This is sufficient indoors, but in summer on the balcony or in the park, it will make working more difficult. The reduction of the maximum brightness to 213 cd/m² (center) in battery operation isn't helping here either. We notice some clouding in the bottom left and right corners, but only with a black image.
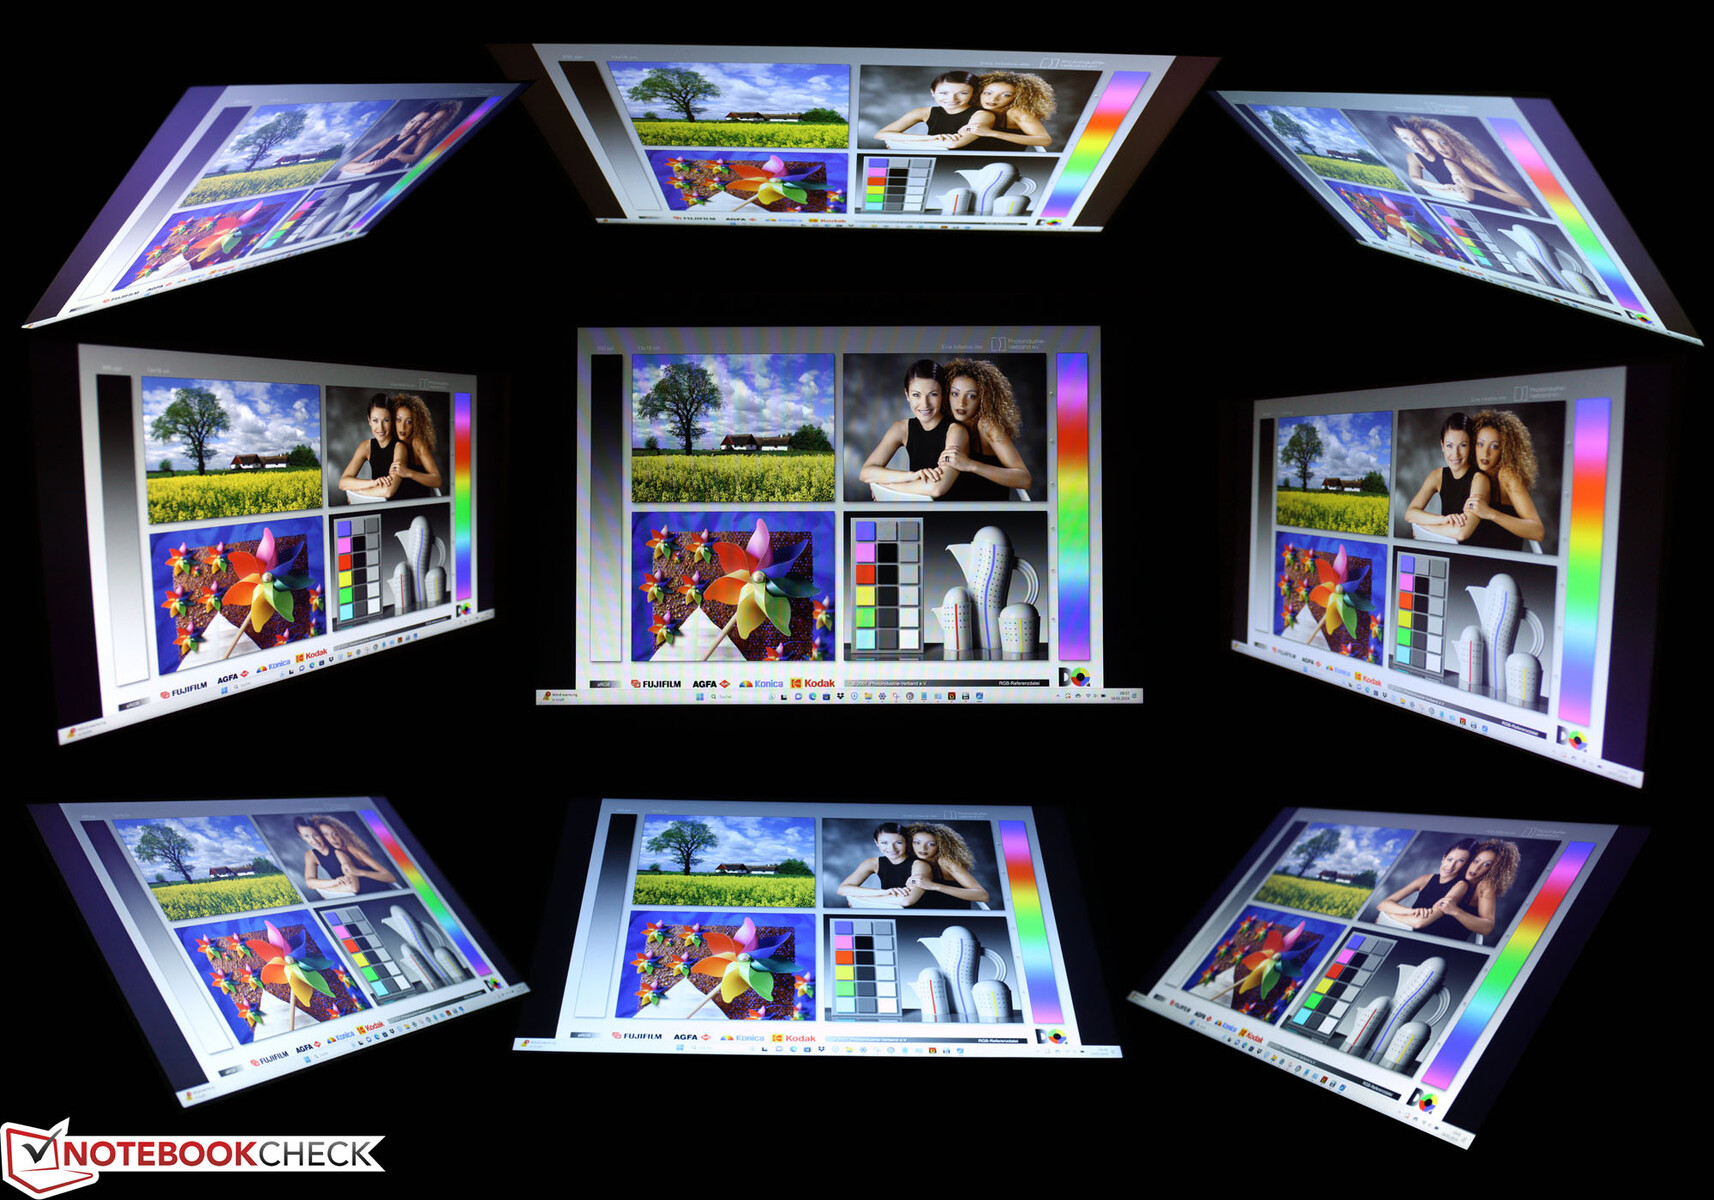
Looking at the display from the side, it gets significantly darker - but this has nothing to do with a privacy measure preventing others from looking at your screen. The writing is still clearly readable, though.
Performance
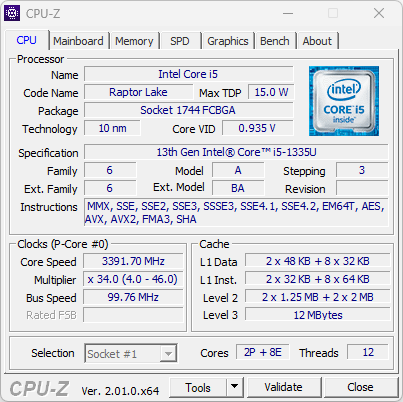
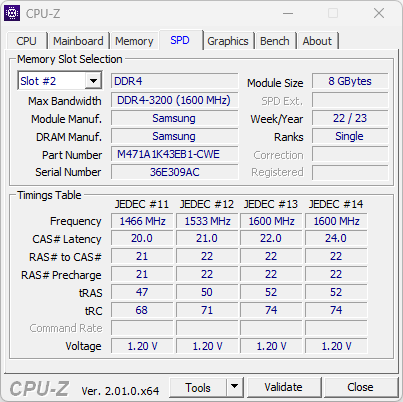
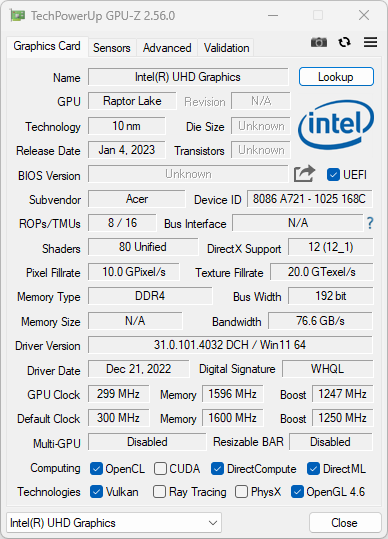
The i5-1335U processor was introduced in January of 2023 and targets a scalable performance development with two Performance cores and eight Efficiency cores. A long battery life with low power consumption is more important than constant performance on all cores here, so this appears to be exactly the right SoC for the back-office with hours of sitting idle. The SoC is accompanied by a 512 GB SSD from Kingston, with 433 GB of that still available to the user. The working memory is provided by an 8-GB module that can be easily expanded with a second one. The maximum expansion is 2x 16 GB.
Test Conditions
We ran the Performance tests using the "Best Performance" Windows mode.
Processor
The R15 constant load test evaluates how the SoC behaves under continuous maximum load. Is it able to constantly maintain high points in the benchmark? The answer is no, since the Intel Core i5-1335U starts at a below-average level and then remains there. While the peak performance of this SoC could reach 1,547 points, the TravelMate only reaches 1,238 points. The i5-1345U sibling SoC starts higher at 1,541 points but then slides down to 1,310 points on average. In conclusion, the Acer laptop doesn't reach the full potential of the chip, and the performance of the P cores remains unused.
Why is that? 4.6 GHz, the maximum of the two P cores isn't even reached at the beginning of the benchmark, with the log viewer showing 4.3 GHz only in the first two runs. The average of the P cores in the loop lies at 3.58 GHz. The E cores run at 3.3 GHz also only at the beginning, before their average drops down to 2.45 GHz.
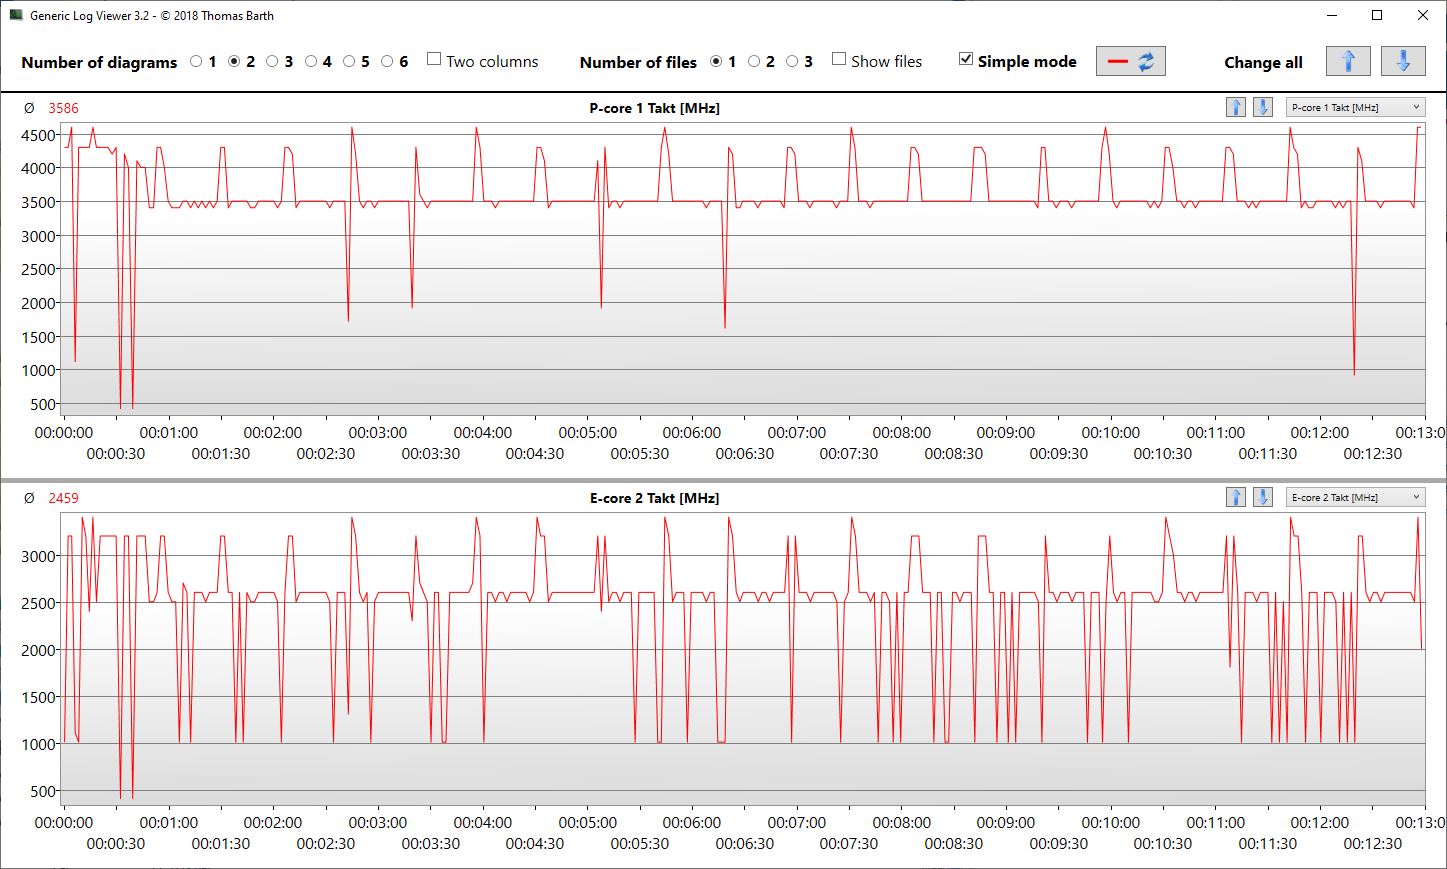
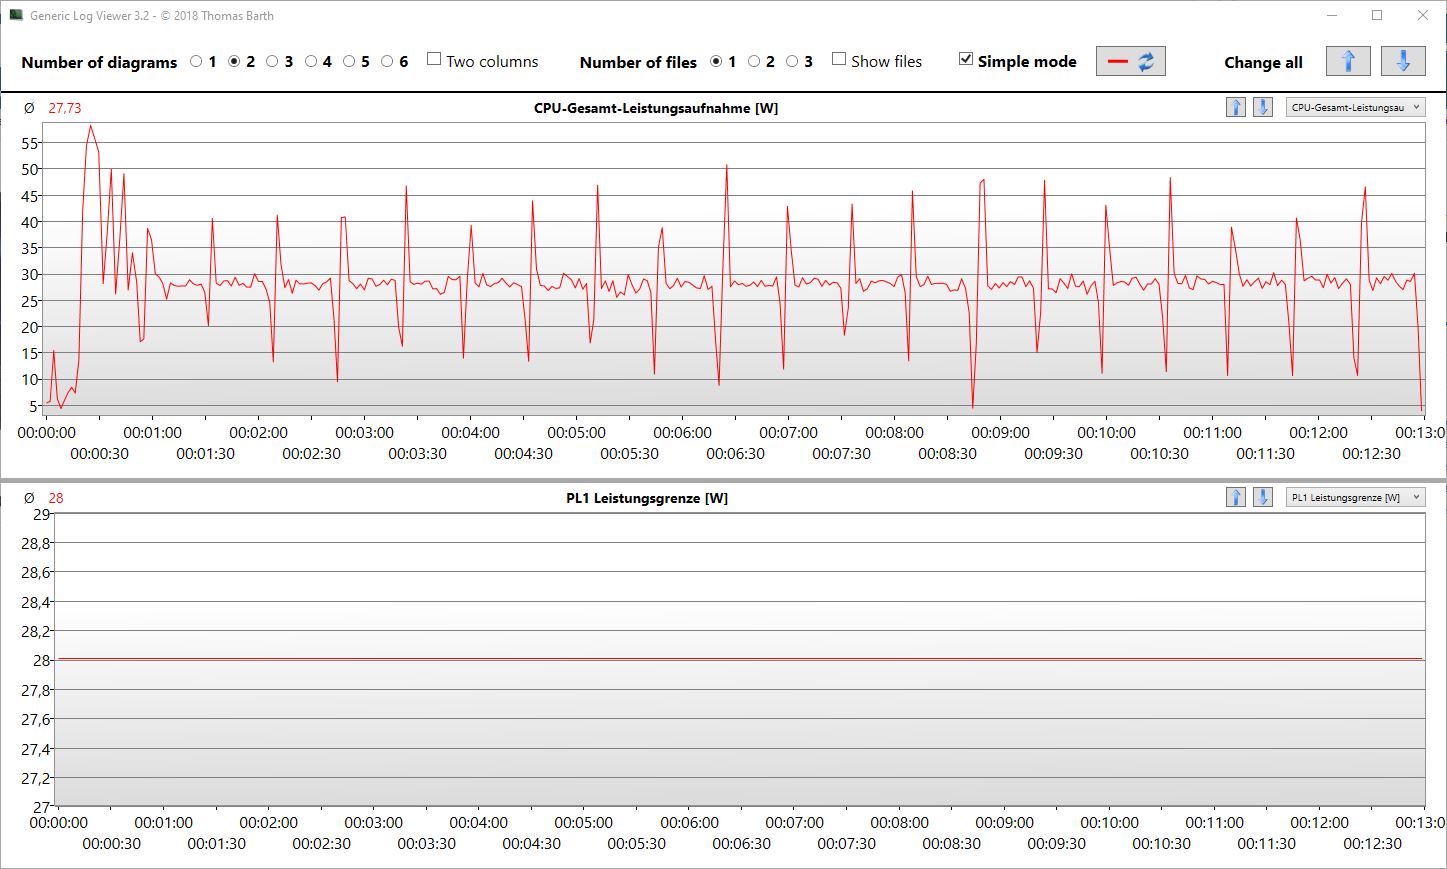
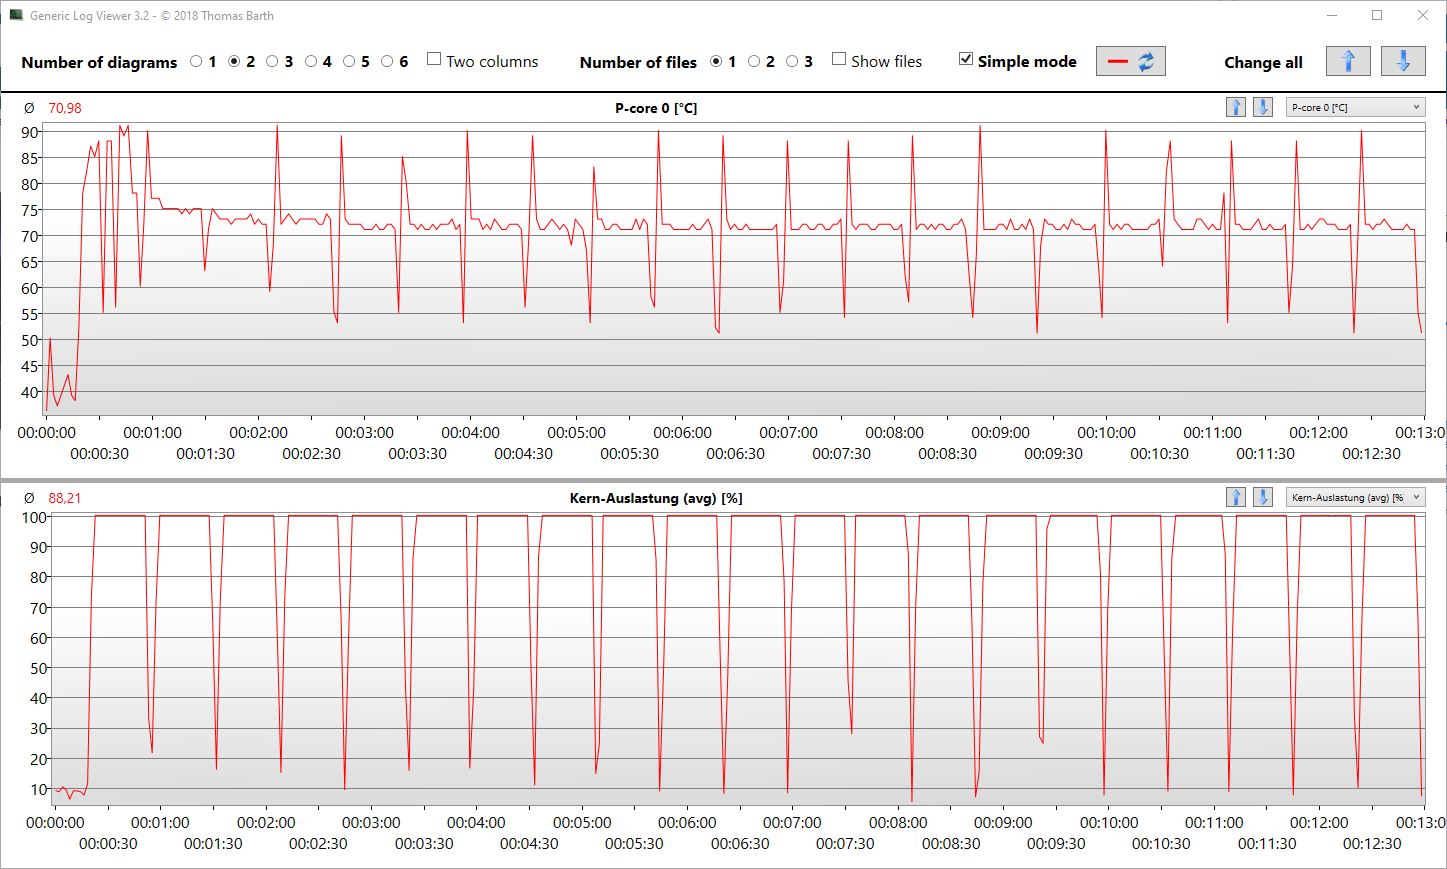
Acer has adjusted to temperature limits to get lower surface temperatures here, and as soon as 90 ºC (194 ºF) are only barely touched, the speed is throttled significantly. In the SoC power consumption, we can clearly see 55 watts (briefly) and 28 watts (long term) as markers.
But this doesn't make the Acer TravelMate P4 a bad office laptop. On the other hand, those who need the best possible peak and constant performance for their applications will be better served with a Dell Latitude 7440 or Lenovo ThinkPad E14 G5.
Cinebench R15 Multi Constant Load Test
Cinebench R23: Multi Core | Single Core
Cinebench R20: CPU (Multi Core) | CPU (Single Core)
Cinebench R15: CPU Multi 64Bit | CPU Single 64Bit
Blender: v2.79 BMW27 CPU
7-Zip 18.03: 7z b 4 | 7z b 4 -mmt1
Geekbench 5.5: Multi-Core | Single-Core
HWBOT x265 Benchmark v2.2: 4k Preset
LibreOffice : 20 Documents To PDF
R Benchmark 2.5: Overall mean
| CPU Performance rating | |
| Average of class Subnotebook | |
| Lenovo ThinkPad E14 G5-21JSS05C00 | |
| Dell Latitude 7440 | |
| Acer TravelMate P4 TMP414-53-58XQ | |
| Average Intel Core i5-1335U | |
| HP ProBook 445 G10 | |
| HP ProBook 440 G9-5Y3Z3EA | |
| Lenovo ThinkPad E14 G5 i7-1355U | |
| Fujitsu LifeBook E5412A E542AMHAAMDE | |
| Cinebench R23 / Multi Core | |
| Average of class Subnotebook (1555 - 21812, n=59, last 2 years) | |
| Lenovo ThinkPad E14 G5-21JSS05C00 | |
| Dell Latitude 7440 | |
| Acer TravelMate P4 TMP414-53-58XQ | |
| Acer TravelMate P4 TMP414-53-58XQ | |
| Average Intel Core i5-1335U (6957 - 9438, n=12) | |
| Lenovo ThinkPad E14 G5 i7-1355U | |
| HP ProBook 445 G10 | |
| HP ProBook 440 G9-5Y3Z3EA | |
| Fujitsu LifeBook E5412A E542AMHAAMDE | |
| Cinebench R23 / Single Core | |
| Lenovo ThinkPad E14 G5 i7-1355U | |
| Dell Latitude 7440 | |
| Average of class Subnotebook (358 - 2213, n=60, last 2 years) | |
| Acer TravelMate P4 TMP414-53-58XQ | |
| Acer TravelMate P4 TMP414-53-58XQ | |
| HP ProBook 440 G9-5Y3Z3EA | |
| Average Intel Core i5-1335U (1532 - 1733, n=12) | |
| Lenovo ThinkPad E14 G5-21JSS05C00 | |
| HP ProBook 445 G10 | |
| Fujitsu LifeBook E5412A E542AMHAAMDE | |
| Cinebench R20 / CPU (Multi Core) | |
| Average of class Subnotebook (579 - 8541, n=56, last 2 years) | |
| Lenovo ThinkPad E14 G5-21JSS05C00 | |
| Dell Latitude 7440 | |
| Acer TravelMate P4 TMP414-53-58XQ | |
| Average Intel Core i5-1335U (2602 - 3849, n=11) | |
| HP ProBook 445 G10 | |
| Lenovo ThinkPad E14 G5 i7-1355U | |
| HP ProBook 440 G9-5Y3Z3EA | |
| Fujitsu LifeBook E5412A E542AMHAAMDE | |
| Cinebench R20 / CPU (Single Core) | |
| Lenovo ThinkPad E14 G5 i7-1355U | |
| Average of class Subnotebook (128 - 832, n=56, last 2 years) | |
| Dell Latitude 7440 | |
| HP ProBook 440 G9-5Y3Z3EA | |
| Acer TravelMate P4 TMP414-53-58XQ | |
| Average Intel Core i5-1335U (593 - 663, n=11) | |
| Lenovo ThinkPad E14 G5-21JSS05C00 | |
| HP ProBook 445 G10 | |
| Fujitsu LifeBook E5412A E542AMHAAMDE | |
| Cinebench R15 / CPU Multi 64Bit | |
| Average of class Subnotebook (327 - 3345, n=56, last 2 years) | |
| Lenovo ThinkPad E14 G5-21JSS05C00 | |
| Dell Latitude 7440 | |
| Lenovo ThinkPad E14 G5 i7-1355U | |
| Average Intel Core i5-1335U (1109 - 1547, n=11) | |
| HP ProBook 440 G9-5Y3Z3EA | |
| HP ProBook 445 G10 | |
| Fujitsu LifeBook E5412A E542AMHAAMDE | |
| Acer TravelMate P4 TMP414-53-58XQ | |
| Cinebench R15 / CPU Single 64Bit | |
| Average of class Subnotebook (72.4 - 322, n=56, last 2 years) | |
| Lenovo ThinkPad E14 G5 i7-1355U | |
| Dell Latitude 7440 | |
| Acer TravelMate P4 TMP414-53-58XQ | |
| HP ProBook 440 G9-5Y3Z3EA | |
| HP ProBook 440 G9-5Y3Z3EA | |
| Average Intel Core i5-1335U (222 - 248, n=11) | |
| HP ProBook 445 G10 | |
| Lenovo ThinkPad E14 G5-21JSS05C00 | |
| Fujitsu LifeBook E5412A E542AMHAAMDE | |
| Blender / v2.79 BMW27 CPU | |
| Lenovo ThinkPad E14 G5 i7-1355U | |
| Average Intel Core i5-1335U (340 - 786, n=12) | |
| HP ProBook 440 G9-5Y3Z3EA | |
| Fujitsu LifeBook E5412A E542AMHAAMDE | |
| HP ProBook 445 G10 | |
| Average of class Subnotebook (159 - 2271, n=57, last 2 years) | |
| Acer TravelMate P4 TMP414-53-58XQ | |
| Dell Latitude 7440 | |
| Lenovo ThinkPad E14 G5-21JSS05C00 | |
| 7-Zip 18.03 / 7z b 4 | |
| Lenovo ThinkPad E14 G5-21JSS05C00 | |
| Average of class Subnotebook (11668 - 77867, n=56, last 2 years) | |
| Dell Latitude 7440 | |
| HP ProBook 445 G10 | |
| Fujitsu LifeBook E5412A E542AMHAAMDE | |
| Acer TravelMate P4 TMP414-53-58XQ | |
| Average Intel Core i5-1335U (25012 - 38513, n=11) | |
| Lenovo ThinkPad E14 G5 i7-1355U | |
| HP ProBook 440 G9-5Y3Z3EA | |
| 7-Zip 18.03 / 7z b 4 -mmt1 | |
| Lenovo ThinkPad E14 G5 i7-1355U | |
| Acer TravelMate P4 TMP414-53-58XQ | |
| Average of class Subnotebook (2643 - 6699, n=58, last 2 years) | |
| HP ProBook 445 G10 | |
| Lenovo ThinkPad E14 G5-21JSS05C00 | |
| Dell Latitude 7440 | |
| HP ProBook 440 G9-5Y3Z3EA | |
| Average Intel Core i5-1335U (4872 - 5545, n=11) | |
| Fujitsu LifeBook E5412A E542AMHAAMDE | |
| Geekbench 5.5 / Multi-Core | |
| Average of class Subnotebook (2557 - 17218, n=47, last 2 years) | |
| Dell Latitude 7440 | |
| Lenovo ThinkPad E14 G5 i7-1355U | |
| Average Intel Core i5-1335U (5459 - 8618, n=11) | |
| Lenovo ThinkPad E14 G5-21JSS05C00 | |
| Acer TravelMate P4 TMP414-53-58XQ | |
| HP ProBook 440 G9-5Y3Z3EA | |
| Fujitsu LifeBook E5412A E542AMHAAMDE | |
| HP ProBook 445 G10 | |
| Geekbench 5.5 / Single-Core | |
| Average of class Subnotebook (726 - 2224, n=47, last 2 years) | |
| Lenovo ThinkPad E14 G5 i7-1355U | |
| Dell Latitude 7440 | |
| Average Intel Core i5-1335U (1506 - 1700, n=11) | |
| Acer TravelMate P4 TMP414-53-58XQ | |
| HP ProBook 440 G9-5Y3Z3EA | |
| Lenovo ThinkPad E14 G5-21JSS05C00 | |
| HP ProBook 445 G10 | |
| Fujitsu LifeBook E5412A E542AMHAAMDE | |
| HWBOT x265 Benchmark v2.2 / 4k Preset | |
| Average of class Subnotebook (0.97 - 25.1, n=56, last 2 years) | |
| Lenovo ThinkPad E14 G5-21JSS05C00 | |
| Dell Latitude 7440 | |
| Fujitsu LifeBook E5412A E542AMHAAMDE | |
| HP ProBook 445 G10 | |
| Acer TravelMate P4 TMP414-53-58XQ | |
| Average Intel Core i5-1335U (6.55 - 10.7, n=11) | |
| HP ProBook 440 G9-5Y3Z3EA | |
| Lenovo ThinkPad E14 G5 i7-1355U | |
| LibreOffice / 20 Documents To PDF | |
| Lenovo ThinkPad E14 G5 i7-1355U | |
| Fujitsu LifeBook E5412A E542AMHAAMDE | |
| Average of class Subnotebook (39.9 - 220, n=55, last 2 years) | |
| Acer TravelMate P4 TMP414-53-58XQ | |
| HP ProBook 445 G10 | |
| HP ProBook 440 G9-5Y3Z3EA | |
| Average Intel Core i5-1335U (45 - 58.7, n=11) | |
| Lenovo ThinkPad E14 G5-21JSS05C00 | |
| Dell Latitude 7440 | |
| R Benchmark 2.5 / Overall mean | |
| Lenovo ThinkPad E14 G5 i7-1355U | |
| Fujitsu LifeBook E5412A E542AMHAAMDE | |
| HP ProBook 445 G10 | |
| Average of class Subnotebook (0.4024 - 1.456, n=57, last 2 years) | |
| Lenovo ThinkPad E14 G5-21JSS05C00 | |
| Acer TravelMate P4 TMP414-53-58XQ | |
| HP ProBook 440 G9-5Y3Z3EA | |
| Average Intel Core i5-1335U (0.4892 - 0.524, n=10) | |
| Dell Latitude 7440 | |
* ... smaller is better
AIDA64: FP32 Ray-Trace | FPU Julia | CPU SHA3 | CPU Queen | FPU SinJulia | FPU Mandel | CPU AES | CPU ZLib | FP64 Ray-Trace | CPU PhotoWorxx
| Performance rating | |
| Average of class Subnotebook | |
| Lenovo ThinkPad E14 G5-21JSS05C00 | |
| Dell Latitude 7440 | |
| HP ProBook 445 G10 | |
| Fujitsu LifeBook E5412A E542AMHAAMDE | |
| Acer TravelMate P4 TMP414-53-58XQ | |
| Average Intel Core i5-1335U | |
| Lenovo ThinkPad E14 G5 i7-1355U | |
| HP ProBook 440 G9-5Y3Z3EA | |
| AIDA64 / FP32 Ray-Trace | |
| Average of class Subnotebook (1135 - 32888, n=57, last 2 years) | |
| Lenovo ThinkPad E14 G5-21JSS05C00 | |
| HP ProBook 445 G10 | |
| Fujitsu LifeBook E5412A E542AMHAAMDE | |
| Dell Latitude 7440 | |
| Acer TravelMate P4 TMP414-53-58XQ | |
| Average Intel Core i5-1335U (5661 - 7809, n=11) | |
| HP ProBook 440 G9-5Y3Z3EA | |
| Lenovo ThinkPad E14 G5 i7-1355U | |
| AIDA64 / FPU Julia | |
| Lenovo ThinkPad E14 G5-21JSS05C00 | |
| Average of class Subnotebook (5218 - 123315, n=57, last 2 years) | |
| HP ProBook 445 G10 | |
| Fujitsu LifeBook E5412A E542AMHAAMDE | |
| Dell Latitude 7440 | |
| Acer TravelMate P4 TMP414-53-58XQ | |
| Average Intel Core i5-1335U (29483 - 43636, n=11) | |
| HP ProBook 440 G9-5Y3Z3EA | |
| Lenovo ThinkPad E14 G5 i7-1355U | |
| AIDA64 / CPU SHA3 | |
| Average of class Subnotebook (444 - 5287, n=57, last 2 years) | |
| Lenovo ThinkPad E14 G5-21JSS05C00 | |
| Dell Latitude 7440 | |
| Acer TravelMate P4 TMP414-53-58XQ | |
| HP ProBook 445 G10 | |
| Fujitsu LifeBook E5412A E542AMHAAMDE | |
| Average Intel Core i5-1335U (1515 - 2278, n=11) | |
| HP ProBook 440 G9-5Y3Z3EA | |
| Lenovo ThinkPad E14 G5 i7-1355U | |
| AIDA64 / CPU Queen | |
| Lenovo ThinkPad E14 G5-21JSS05C00 | |
| HP ProBook 445 G10 | |
| Fujitsu LifeBook E5412A E542AMHAAMDE | |
| Lenovo ThinkPad E14 G5 i7-1355U | |
| HP ProBook 440 G9-5Y3Z3EA | |
| Dell Latitude 7440 | |
| Average of class Subnotebook (10579 - 95002, n=49, last 2 years) | |
| Acer TravelMate P4 TMP414-53-58XQ | |
| Average Intel Core i5-1335U (53839 - 60992, n=11) | |
| AIDA64 / FPU SinJulia | |
| Lenovo ThinkPad E14 G5-21JSS05C00 | |
| HP ProBook 445 G10 | |
| Fujitsu LifeBook E5412A E542AMHAAMDE | |
| Average of class Subnotebook (744 - 18418, n=57, last 2 years) | |
| Dell Latitude 7440 | |
| Acer TravelMate P4 TMP414-53-58XQ | |
| Lenovo ThinkPad E14 G5 i7-1355U | |
| Average Intel Core i5-1335U (3873 - 5008, n=11) | |
| HP ProBook 440 G9-5Y3Z3EA | |
| AIDA64 / FPU Mandel | |
| Lenovo ThinkPad E14 G5-21JSS05C00 | |
| Average of class Subnotebook (3341 - 65433, n=57, last 2 years) | |
| HP ProBook 445 G10 | |
| Fujitsu LifeBook E5412A E542AMHAAMDE | |
| Dell Latitude 7440 | |
| Acer TravelMate P4 TMP414-53-58XQ | |
| Average Intel Core i5-1335U (14376 - 20553, n=11) | |
| HP ProBook 440 G9-5Y3Z3EA | |
| Lenovo ThinkPad E14 G5 i7-1355U | |
| AIDA64 / CPU AES | |
| Average of class Subnotebook (638 - 96917, n=57, last 2 years) | |
| Lenovo ThinkPad E14 G5-21JSS05C00 | |
| Dell Latitude 7440 | |
| Acer TravelMate P4 TMP414-53-58XQ | |
| Average Intel Core i5-1335U (31154 - 65997, n=11) | |
| Lenovo ThinkPad E14 G5 i7-1355U | |
| HP ProBook 440 G9-5Y3Z3EA | |
| HP ProBook 445 G10 | |
| Fujitsu LifeBook E5412A E542AMHAAMDE | |
| AIDA64 / CPU ZLib | |
| Average of class Subnotebook (164.9 - 1379, n=57, last 2 years) | |
| Lenovo ThinkPad E14 G5-21JSS05C00 | |
| Dell Latitude 7440 | |
| Acer TravelMate P4 TMP414-53-58XQ | |
| Average Intel Core i5-1335U (378 - 676, n=11) | |
| Lenovo ThinkPad E14 G5 i7-1355U | |
| HP ProBook 445 G10 | |
| Fujitsu LifeBook E5412A E542AMHAAMDE | |
| HP ProBook 440 G9-5Y3Z3EA | |
| AIDA64 / FP64 Ray-Trace | |
| Average of class Subnotebook (610 - 17495, n=57, last 2 years) | |
| Lenovo ThinkPad E14 G5-21JSS05C00 | |
| HP ProBook 445 G10 | |
| Fujitsu LifeBook E5412A E542AMHAAMDE | |
| Dell Latitude 7440 | |
| Acer TravelMate P4 TMP414-53-58XQ | |
| HP ProBook 440 G9-5Y3Z3EA | |
| Average Intel Core i5-1335U (2878 - 4214, n=11) | |
| Lenovo ThinkPad E14 G5 i7-1355U | |
| AIDA64 / CPU PhotoWorxx | |
| Average of class Subnotebook (6569 - 85600, n=57, last 2 years) | |
| Dell Latitude 7440 | |
| Average Intel Core i5-1335U (13584 - 41123, n=11) | |
| Lenovo ThinkPad E14 G5 i7-1355U | |
| Acer TravelMate P4 TMP414-53-58XQ | |
| Fujitsu LifeBook E5412A E542AMHAAMDE | |
| HP ProBook 440 G9-5Y3Z3EA | |
| Lenovo ThinkPad E14 G5-21JSS05C00 | |
| HP ProBook 445 G10 | |
System Performance
The PCMark 10 and Crossmark benchmarks evaluate the application performance of a laptop, testing the combination of SSD storage, RAM, iGPU, and processor. Our TravelMate P4 places at the very bottom here, even performing below the average of subnotebooks. However, it is doubtful whether the differences are noticeable in practice with Word, Excel, and browser applications, since even the top performer in PCMark 10, the Lenovo ThinkPad E14 G5, only has an 8% advantage (13% in Crossmark).
CrossMark: Overall | Productivity | Creativity | Responsiveness
Mozilla Kraken 1.1: Total
| PCMark 10 / Score | |
| Average of class Subnotebook (4920 - 9939, n=44, last 2 years) | |
| Lenovo ThinkPad E14 G5-21JSS05C00 | |
| Lenovo ThinkPad E14 G5 i7-1355U | |
| HP ProBook 445 G10 | |
| Fujitsu LifeBook E5412A E542AMHAAMDE | |
| Dell Latitude 7440 | |
| Acer TravelMate P4 TMP414-53-58XQ | |
| HP ProBook 440 G9-5Y3Z3EA | |
| Average Intel Core i5-1335U, Intel Iris Xe Graphics G7 80EUs (5068 - 5600, n=11) | |
| PCMark 10 / Essentials | |
| Lenovo ThinkPad E14 G5 i7-1355U | |
| Dell Latitude 7440 | |
| Acer TravelMate P4 TMP414-53-58XQ | |
| Lenovo ThinkPad E14 G5-21JSS05C00 | |
| Average Intel Core i5-1335U, Intel Iris Xe Graphics G7 80EUs (9828 - 11912, n=11) | |
| HP ProBook 445 G10 | |
| Average of class Subnotebook (8552 - 11646, n=44, last 2 years) | |
| HP ProBook 440 G9-5Y3Z3EA | |
| Fujitsu LifeBook E5412A E542AMHAAMDE | |
| PCMark 10 / Productivity | |
| Average of class Subnotebook (5435 - 16606, n=44, last 2 years) | |
| HP ProBook 445 G10 | |
| Lenovo ThinkPad E14 G5-21JSS05C00 | |
| Fujitsu LifeBook E5412A E542AMHAAMDE | |
| Lenovo ThinkPad E14 G5 i7-1355U | |
| Acer TravelMate P4 TMP414-53-58XQ | |
| HP ProBook 440 G9-5Y3Z3EA | |
| Dell Latitude 7440 | |
| Average Intel Core i5-1335U, Intel Iris Xe Graphics G7 80EUs (6196 - 7261, n=11) | |
| PCMark 10 / Digital Content Creation | |
| Average of class Subnotebook (5722 - 13779, n=44, last 2 years) | |
| Lenovo ThinkPad E14 G5 i7-1355U | |
| Lenovo ThinkPad E14 G5-21JSS05C00 | |
| Dell Latitude 7440 | |
| HP ProBook 440 G9-5Y3Z3EA | |
| Acer TravelMate P4 TMP414-53-58XQ | |
| Average Intel Core i5-1335U, Intel Iris Xe Graphics G7 80EUs (5361 - 6164, n=11) | |
| Fujitsu LifeBook E5412A E542AMHAAMDE | |
| HP ProBook 445 G10 | |
| CrossMark / Overall | |
| Average of class Subnotebook (365 - 2356, n=59, last 2 years) | |
| Lenovo ThinkPad E14 G5 i7-1355U | |
| Average Intel Core i5-1335U, Intel Iris Xe Graphics G7 80EUs (1339 - 1599, n=11) | |
| Acer TravelMate P4 TMP414-53-58XQ | |
| HP ProBook 440 G9-5Y3Z3EA | |
| Lenovo ThinkPad E14 G5-21JSS05C00 | |
| Fujitsu LifeBook E5412A E542AMHAAMDE | |
| CrossMark / Productivity | |
| Average of class Subnotebook (364 - 2277, n=59, last 2 years) | |
| Lenovo ThinkPad E14 G5 i7-1355U | |
| Average Intel Core i5-1335U, Intel Iris Xe Graphics G7 80EUs (1337 - 1638, n=11) | |
| Acer TravelMate P4 TMP414-53-58XQ | |
| HP ProBook 440 G9-5Y3Z3EA | |
| Lenovo ThinkPad E14 G5-21JSS05C00 | |
| Fujitsu LifeBook E5412A E542AMHAAMDE | |
| CrossMark / Creativity | |
| Average of class Subnotebook (372 - 2743, n=59, last 2 years) | |
| Lenovo ThinkPad E14 G5 i7-1355U | |
| Average Intel Core i5-1335U, Intel Iris Xe Graphics G7 80EUs (1315 - 1620, n=11) | |
| HP ProBook 440 G9-5Y3Z3EA | |
| Lenovo ThinkPad E14 G5-21JSS05C00 | |
| Acer TravelMate P4 TMP414-53-58XQ | |
| Fujitsu LifeBook E5412A E542AMHAAMDE | |
| CrossMark / Responsiveness | |
| Average of class Subnotebook (312 - 1854, n=59, last 2 years) | |
| Lenovo ThinkPad E14 G5 i7-1355U | |
| Average Intel Core i5-1335U, Intel Iris Xe Graphics G7 80EUs (1023 - 1868, n=11) | |
| Acer TravelMate P4 TMP414-53-58XQ | |
| HP ProBook 440 G9-5Y3Z3EA | |
| Lenovo ThinkPad E14 G5-21JSS05C00 | |
| Fujitsu LifeBook E5412A E542AMHAAMDE | |
| Mozilla Kraken 1.1 / Total | |
| Lenovo ThinkPad E14 G5 i7-1355U | |
| Average Intel Core i5-1335U, Intel Iris Xe Graphics G7 80EUs (545 - 1914, n=12) | |
| Fujitsu LifeBook E5412A E542AMHAAMDE | |
| HP ProBook 440 G9-5Y3Z3EA | |
| Lenovo ThinkPad E14 G5-21JSS05C00 | |
| Acer TravelMate P4 TMP414-53-58XQ | |
| Dell Latitude 7440 | |
| Average of class Subnotebook (234 - 1104, n=60, last 2 years) | |
* ... smaller is better
| PCMark 10 Score | 5486 points | |
Help | ||
| AIDA64 / Memory Copy | |
| Average of class Subnotebook (14554 - 131023, n=57, last 2 years) | |
| Dell Latitude 7440 | |
| Average Intel Core i5-1335U (22417 - 60884, n=11) | |
| Lenovo ThinkPad E14 G5 i7-1355U | |
| Lenovo ThinkPad E14 G5-21JSS05C00 | |
| Fujitsu LifeBook E5412A E542AMHAAMDE | |
| HP ProBook 440 G9-5Y3Z3EA | |
| Acer TravelMate P4 TMP414-53-58XQ | |
| HP ProBook 445 G10 | |
| AIDA64 / Memory Read | |
| Average of class Subnotebook (15948 - 127174, n=57, last 2 years) | |
| Dell Latitude 7440 | |
| Average Intel Core i5-1335U (23104 - 61555, n=11) | |
| Fujitsu LifeBook E5412A E542AMHAAMDE | |
| Lenovo ThinkPad E14 G5-21JSS05C00 | |
| Lenovo ThinkPad E14 G5 i7-1355U | |
| HP ProBook 445 G10 | |
| Acer TravelMate P4 TMP414-53-58XQ | |
| HP ProBook 440 G9-5Y3Z3EA | |
| AIDA64 / Memory Write | |
| Average of class Subnotebook (15709 - 135141, n=57, last 2 years) | |
| Dell Latitude 7440 | |
| Average Intel Core i5-1335U (22936 - 72584, n=11) | |
| Lenovo ThinkPad E14 G5 i7-1355U | |
| Fujitsu LifeBook E5412A E542AMHAAMDE | |
| Lenovo ThinkPad E14 G5-21JSS05C00 | |
| HP ProBook 445 G10 | |
| Acer TravelMate P4 TMP414-53-58XQ | |
| HP ProBook 440 G9-5Y3Z3EA | |
| AIDA64 / Memory Latency | |
| Dell Latitude 7440 | |
| Fujitsu LifeBook E5412A E542AMHAAMDE | |
| Average of class Subnotebook (6.1 - 159.9, n=55, last 2 years) | |
| Average Intel Core i5-1335U (78.6 - 112.8, n=11) | |
| Lenovo ThinkPad E14 G5-21JSS05C00 | |
| HP ProBook 445 G10 | |
| Lenovo ThinkPad E14 G5 i7-1355U | |
| HP ProBook 440 G9-5Y3Z3EA | |
| Acer TravelMate P4 TMP414-53-58XQ | |
* ... smaller is better
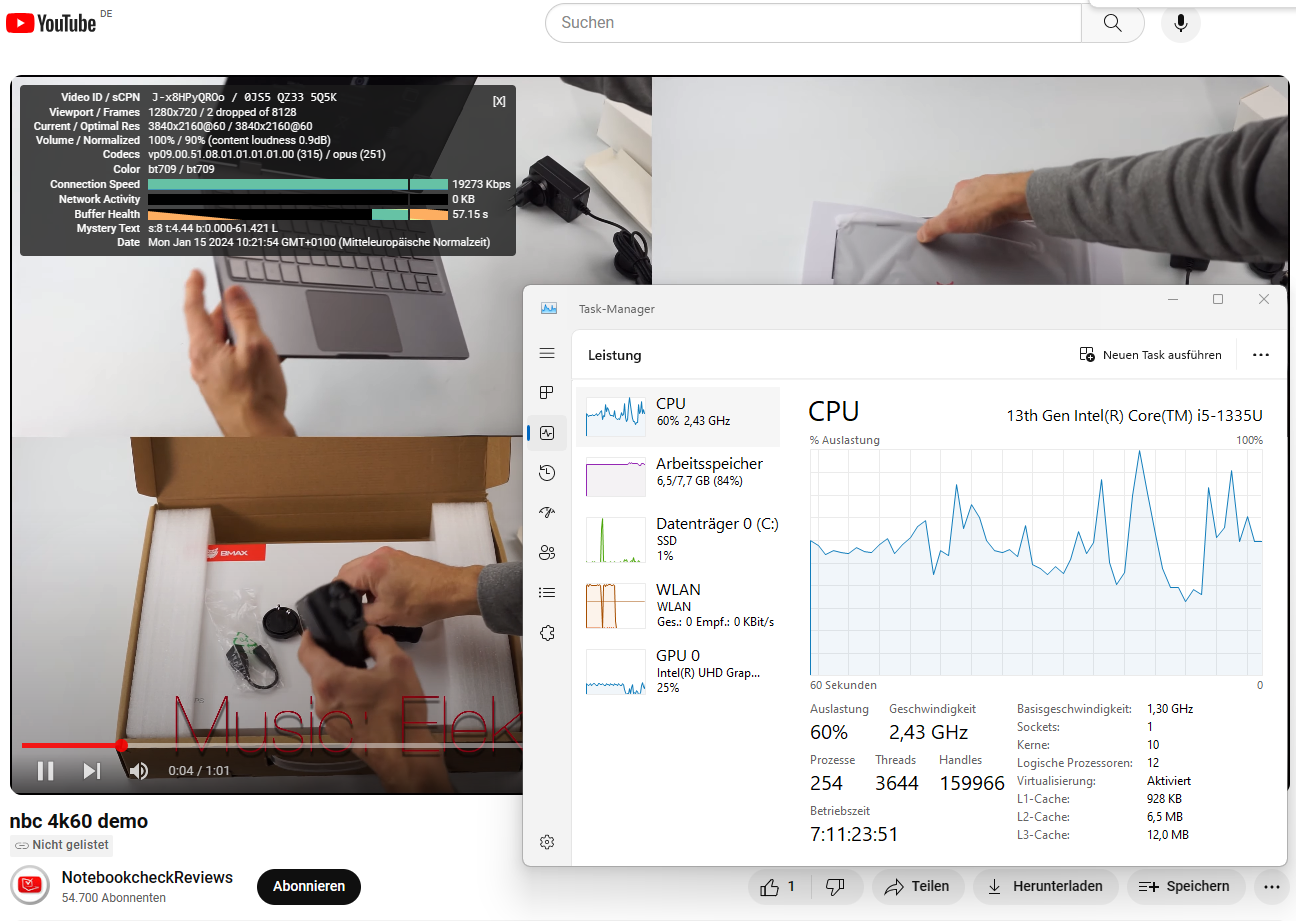
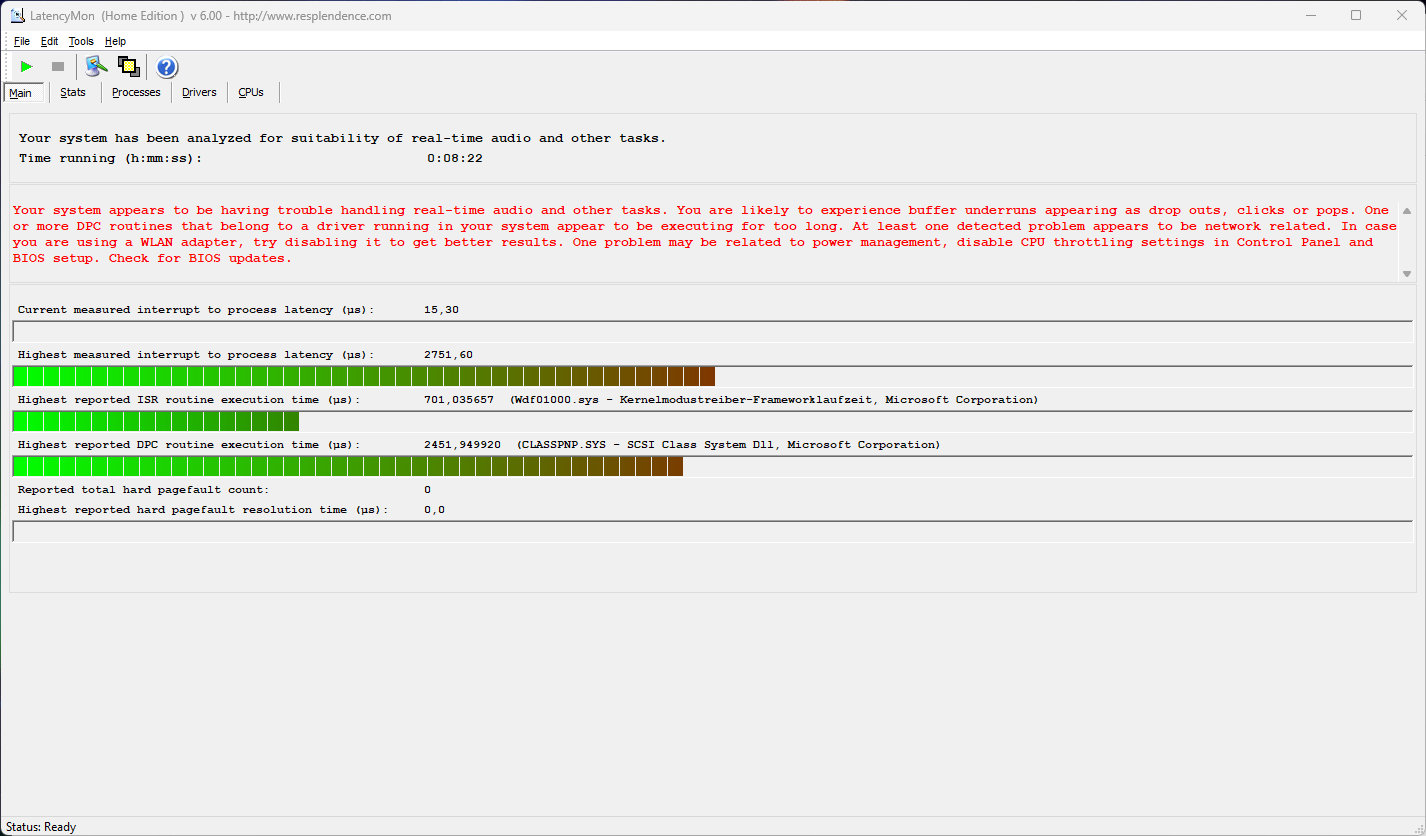
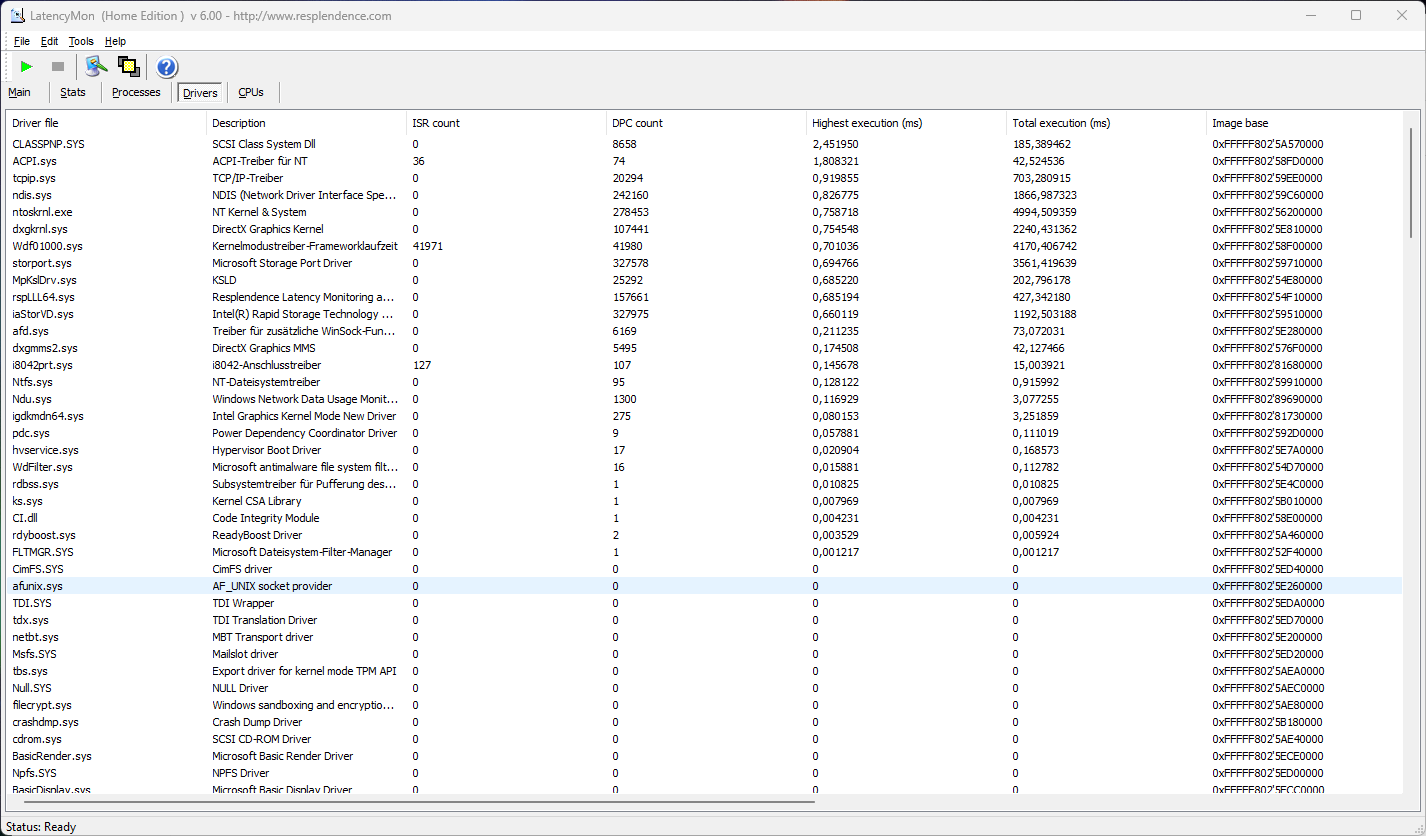
DPC Latencies
Latencies are delays, resulting from the time the system needs to handle driver tasks. They concern the cooperation between various devices such as the audio, touchpad, SSD, card reader, or storage controller. If we measure high latencies, they are the expressions - or snapshots in time - of suboptimal or faulty device drivers. Updates, including those of the BIOS, can remedy latencies. During audio production, a high DPC latency can lead to stutters or delays in the audio. The TravelMate shows fairly high latencies when we open large websites and play 4K YouTube videos, followed by placing stress on the CPU.
| DPC Latencies / LatencyMon - interrupt to process latency (max), Web, Youtube, Prime95 | |
| Acer TravelMate P4 TMP414-53-58XQ | |
| HP ProBook 440 G9-5Y3Z3EA | |
| Fujitsu LifeBook E5412A E542AMHAAMDE | |
| HP ProBook 445 G10 | |
| Lenovo ThinkPad E14 G5-21JSS05C00 | |
| Lenovo ThinkPad E14 G5 i7-1355U | |
| Dell Latitude 7440 | |
* ... smaller is better
Storage Solution
The Kingston SSD is unable to stand up against the wide field of competitors with the Samsung and Western Digital storage and remains confined to the lower middle of the field. As is often the case, the constant performance drops significantly over time. This is the same with other models, but the starting level of the Kingston is also lower than that of the WD PC SN740 in the ThinkPad E14 G5, for example.

* ... smaller is better
Disk Throttling: DiskSpd Read Loop, Queue Depth 8
Graphics Card
The integrated Intel-Xe graphics unit with humble 80 EUs is among the smallest and least powerful iGPU that can currently be found in laptops. But this doesn't make it bad per se, since it doesn't have to do more than supporting decoding tasks when playing YouTube videos or browser games.
| 3DMark 11 Performance | 5149 points | |
| 3DMark Cloud Gate Standard Score | 16881 points | |
| 3DMark Fire Strike Score | 2655 points | |
| 3DMark Time Spy Score | 1139 points | |
Help | ||
* ... smaller is better
Gaming Performance
Since it isn't meant for gaming, the Intel Xe falls short in all the older test games as expected. The same is even more so the case with more current games from 2023 such as Total War Pharao, which is only playable in the Low preset and Full HD resolution. The 3D performance doesn't drop in battery operation, and there is no need for any concerns with browser games.
| Performance rating - Percent | |
| Average of class Subnotebook | |
| Dell Latitude 7440 -2! | |
| Lenovo ThinkPad E14 G5-21JSS05C00 -3! | |
| Lenovo ThinkPad E14 G5 i7-1355U -2! | |
| Fujitsu LifeBook E5412A E542AMHAAMDE -2! | |
| HP EliteBook 845 G9 6F6H9EA -2! | |
| Acer TravelMate P4 TMP414-53-58XQ | |
| HP ProBook 440 G9-5Y3Z3EA -6! | |
| HP ProBook 445 G10 -2! | |
| Total War Pharaoh | |
| 1920x1080 Medium Preset | |
| Average of class Subnotebook (36.4 - 113, n=10, last 2 years) | |
| Acer TravelMate P4 TMP414-53-58XQ | |
| 1920x1080 Low Preset | |
| Average of class Subnotebook (46.1 - 159.5, n=11, last 2 years) | |
| Acer TravelMate P4 TMP414-53-58XQ | |
The test of The Witcher 3 runs at a very low level (8-9 fps). While the competitors with an AMD Vega iGPU perform slightly better, they are also still far from delivering any playable values. We added one of the currently most powerful integrated graphics cards that can be found in business laptops (HP EliteBook 845 G9 6F6H9EA) to the overall rating: Instead of 70 points in the performance rating, the AMD Radeon 660M also only gets 67 points. In summary, such an AMD iGPU can make a difference in some individual games, but it won't necessarily perform better on average than the Intel Xe.
The Witcher 3 FPS Chart
| low | med. | high | ultra | |
|---|---|---|---|---|
| GTA V (2015) | 86 | 70 | 13.8 | |
| The Witcher 3 (2015) | 49.9 | 33.4 | 11.2 | 8.5 |
| Dota 2 Reborn (2015) | 98.6 | 70.2 | 37.6 | 34.7 |
| Assassin´s Creed Origins (2017) | 32 | 17 | 11 | |
| Final Fantasy XV Benchmark (2018) | 42 | 22 | 14 | |
| X-Plane 11.11 (2018) | 42.6 | 29.8 | 26.3 | |
| Far Cry 5 (2018) | 41 | 20 | 17 | |
| Strange Brigade (2018) | 48.8 | 19.4 | 17.7 | |
| Total War Pharaoh (2023) | 29.8 | 23.2 | 16.2 |
Emissions
Noise Emissions
The single fan accomplishes its job without producing any noise: with a bit of surrounding noise from people or other everyday noises in the office, this is hardly audible. But in Balanced mode, the fan doesn't ever remain completely silent, and ten browser tabs will keep it running constantly even at only 3-7% CPU load. In "Best Power Savings" mode, the fan turns off occasionally, but will then rev up again after only a short time. We prefer to have it running constantly. Under load, the fan revs up to 36 or 48 dB(A), but this only happens during longer copy processes or constant computing tasks. The ear-deafening 48 dB(A) are more of a theoretical possibility resulting from our stress test scenario.
Noise level
| Idle |
| 25.5 / 25.5 / 30.5 dB(A) |
| Load |
| 36.29 / 48.34 dB(A) |
 | ||
30 dB silent 40 dB(A) audible 50 dB(A) loud |
||
min: | ||
| Acer TravelMate P4 TMP414-53-58XQ Iris Xe G7 80EUs, i5-1335U, Kingston OM8SEP4512Q-AA | Dell Latitude 7440 Iris Xe G7 80EUs, i5-1345U, Samsung MZ9L4512HBLU-00BMV | Lenovo ThinkPad E14 G5-21JSS05C00 Vega 8, R7 7730U, WD PC SN740 SDDPNQD-1T00 | Lenovo ThinkPad E14 G5 i7-1355U Iris Xe G7 96EUs, i7-1355U, WD PC SN740 512GB SDDQMQD-512G | HP ProBook 440 G9-5Y3Z3EA Iris Xe G7 96EUs, i7-1255U, Samsung PM991 MZVLQ512HBLU | HP ProBook 445 G10 Vega 7, R5 7530U, Kioxia BG5 KBG50ZNS512G | Fujitsu LifeBook E5412A E542AMHAAMDE Vega 7, R5 PRO 5675U, WDC PC SN530 SDBQNPZ-512G | |
|---|---|---|---|---|---|---|---|
| Noise | 18% | 9% | 11% | 6% | 10% | 9% | |
| off / environment * (dB) | 25.5 | 22.8 11% | 24.4 4% | 23.2 9% | 27 -6% | 24 6% | 23.6 7% |
| Idle Minimum * (dB) | 25.5 | 22.8 11% | 24.4 4% | 23.2 9% | 27 -6% | 24 6% | 23.6 7% |
| Idle Average * (dB) | 25.5 | 22.8 11% | 24.4 4% | 23.2 9% | 27 -6% | 25 2% | 23.6 7% |
| Idle Maximum * (dB) | 30.5 | 22.8 25% | 25.7 16% | 23.2 24% | 27 11% | 28 8% | 28.7 6% |
| Load Average * (dB) | 36.29 | 26.3 28% | 31.8 12% | 36 1% | 31.5 13% | 33 9% | 36.3 -0% |
| Load Maximum * (dB) | 48.34 | 38.3 21% | 41.2 15% | 41 15% | 34.9 28% | 36 26% | 36.3 25% |
| Witcher 3 ultra * (dB) | 30 | 36.7 | 38.5 | 36 | 36.3 |
* ... smaller is better
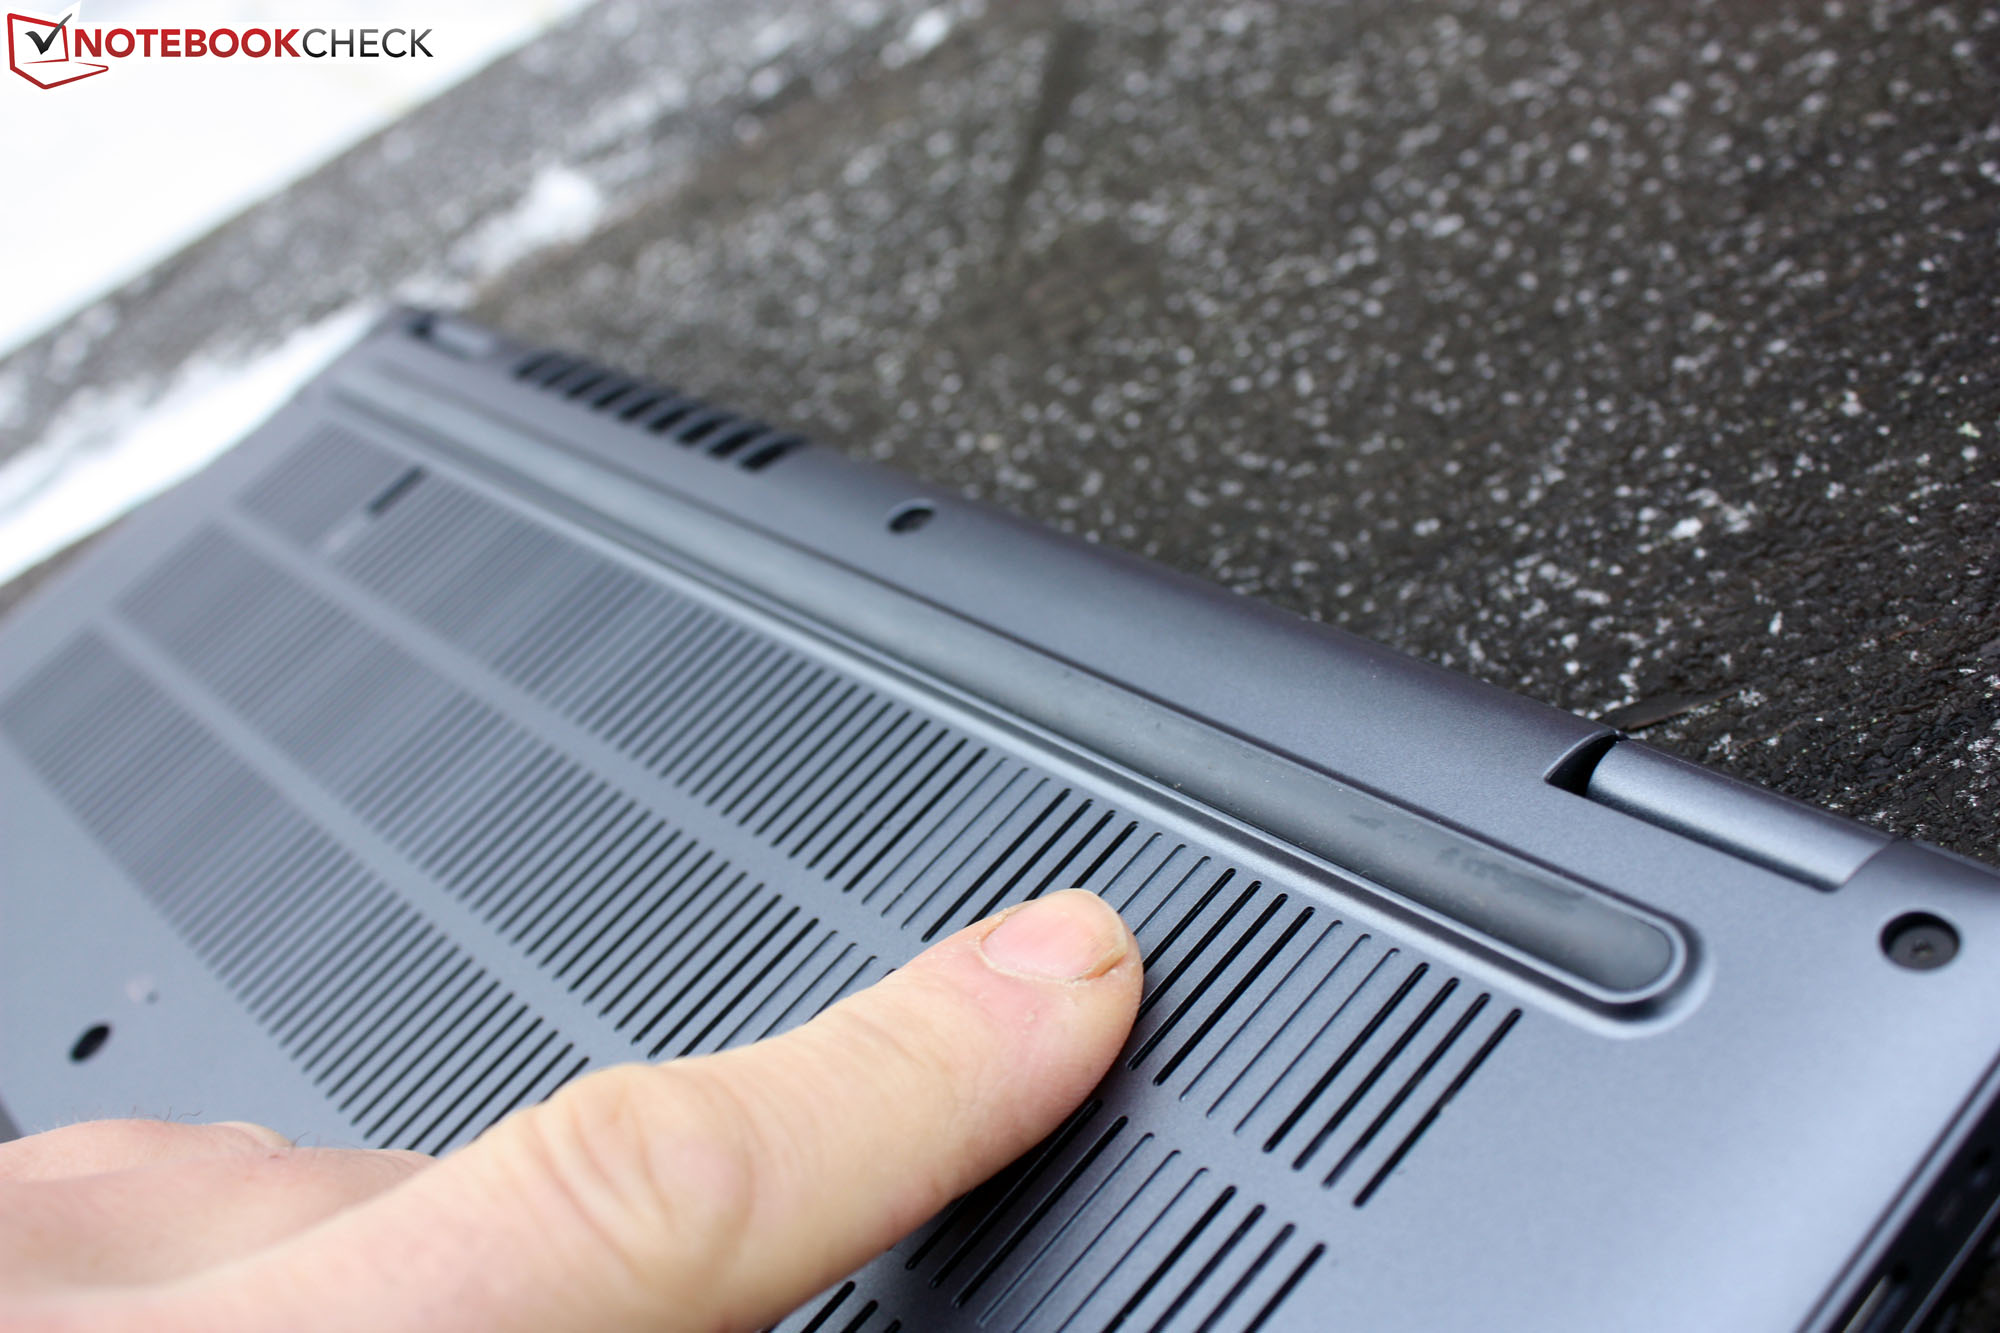
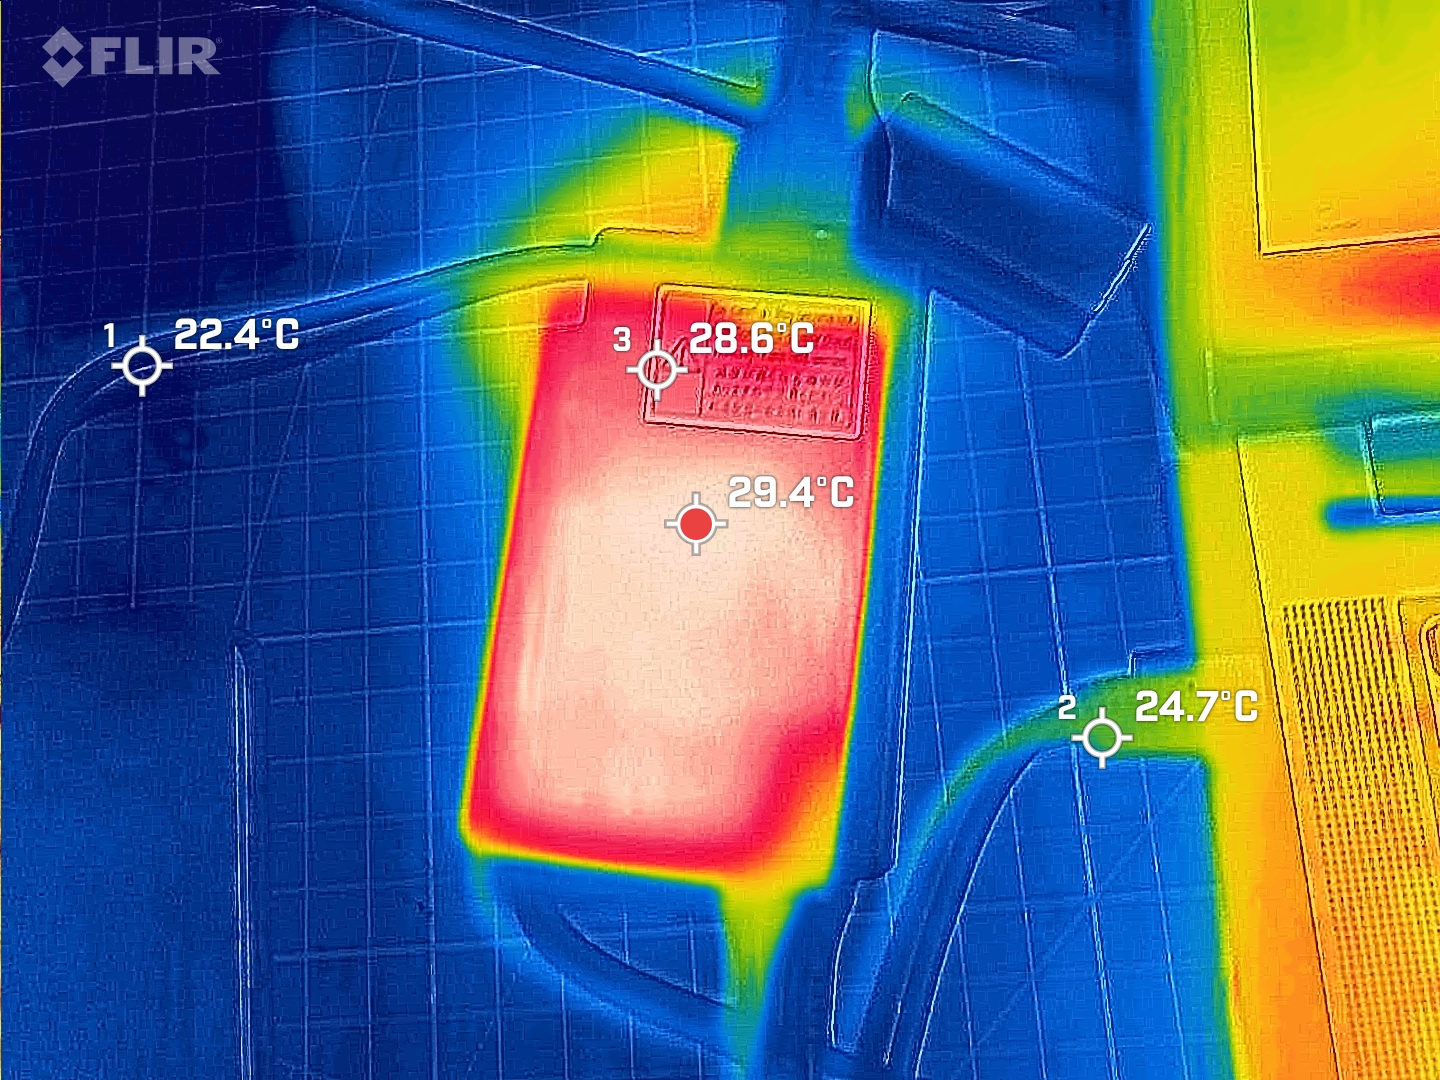
Temperatures
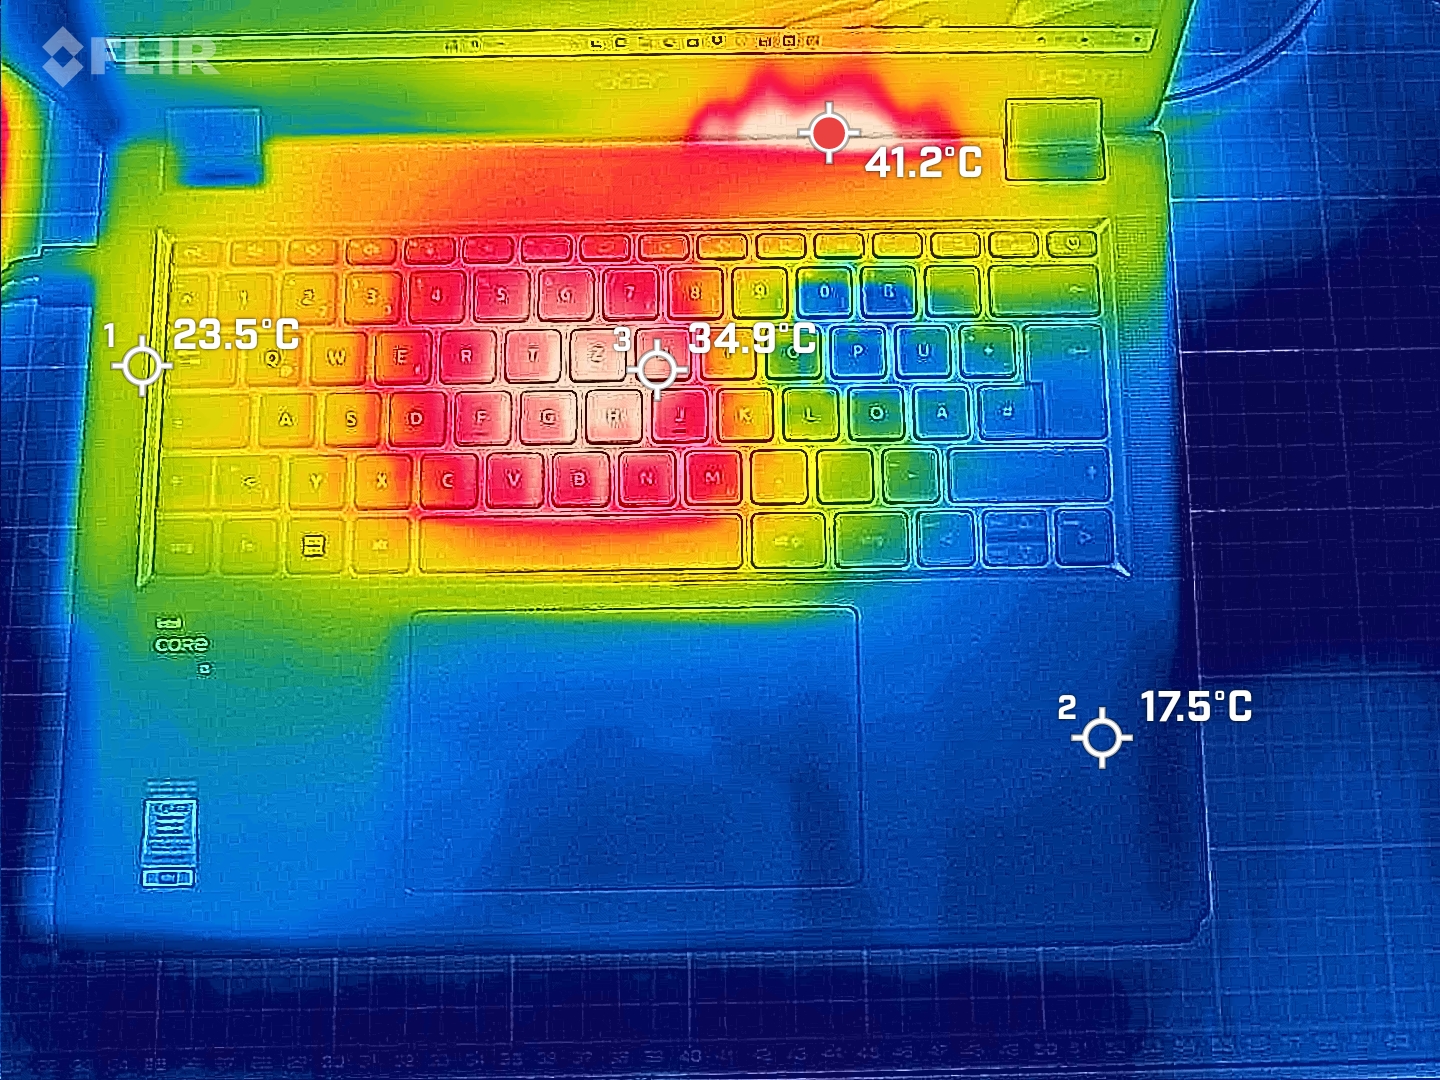
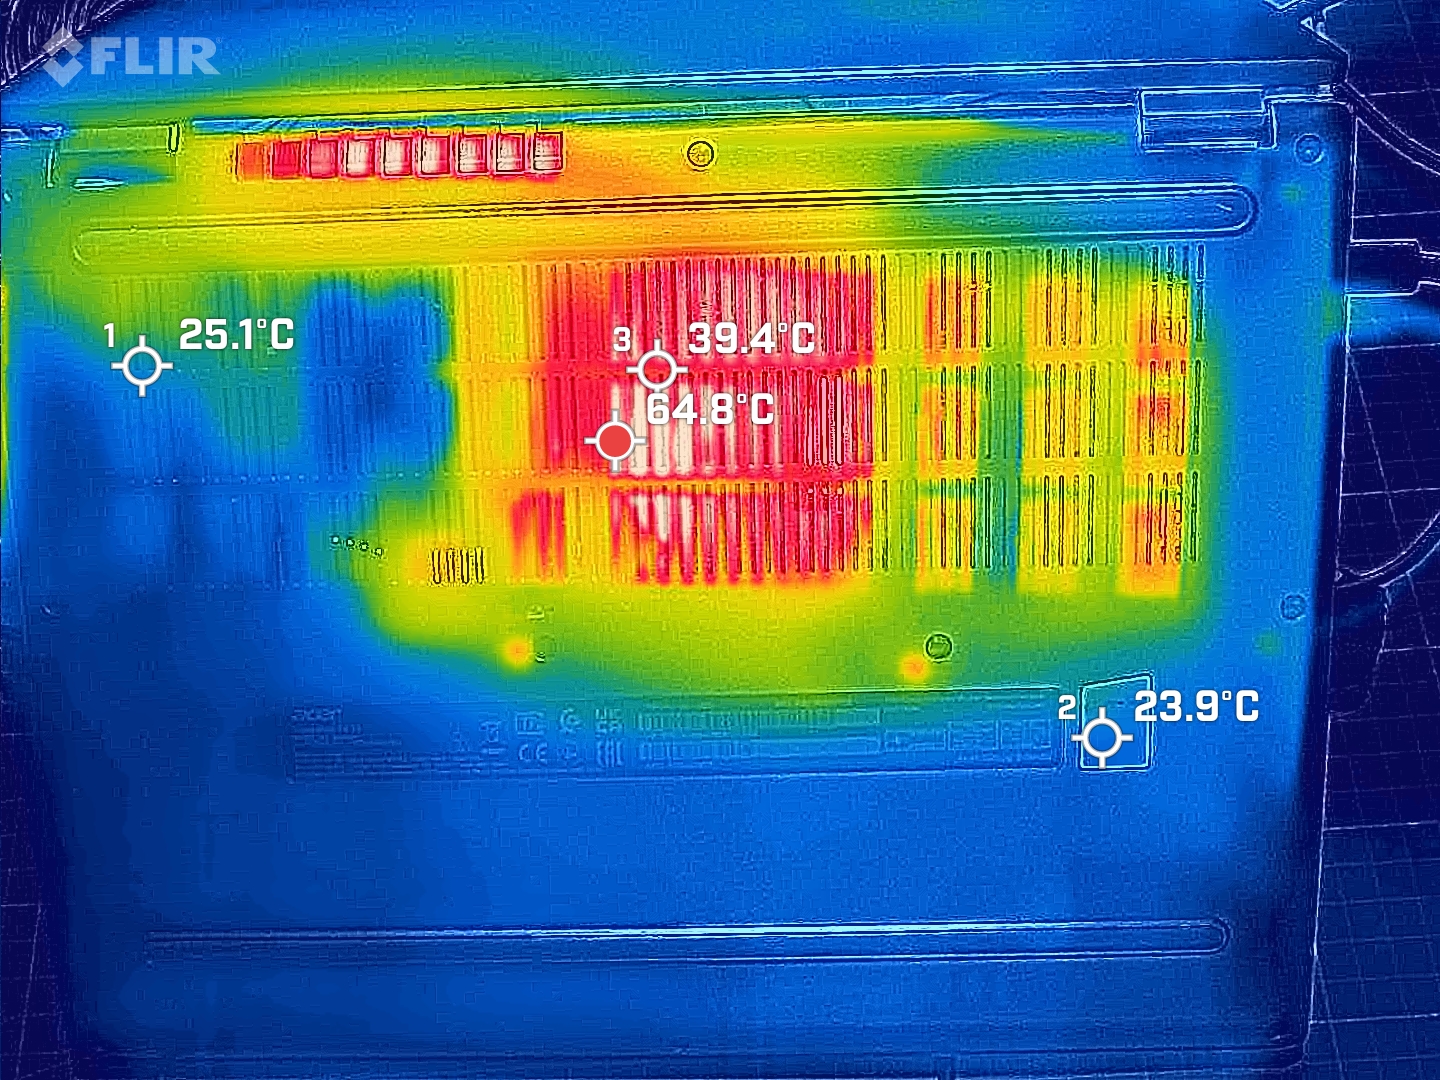
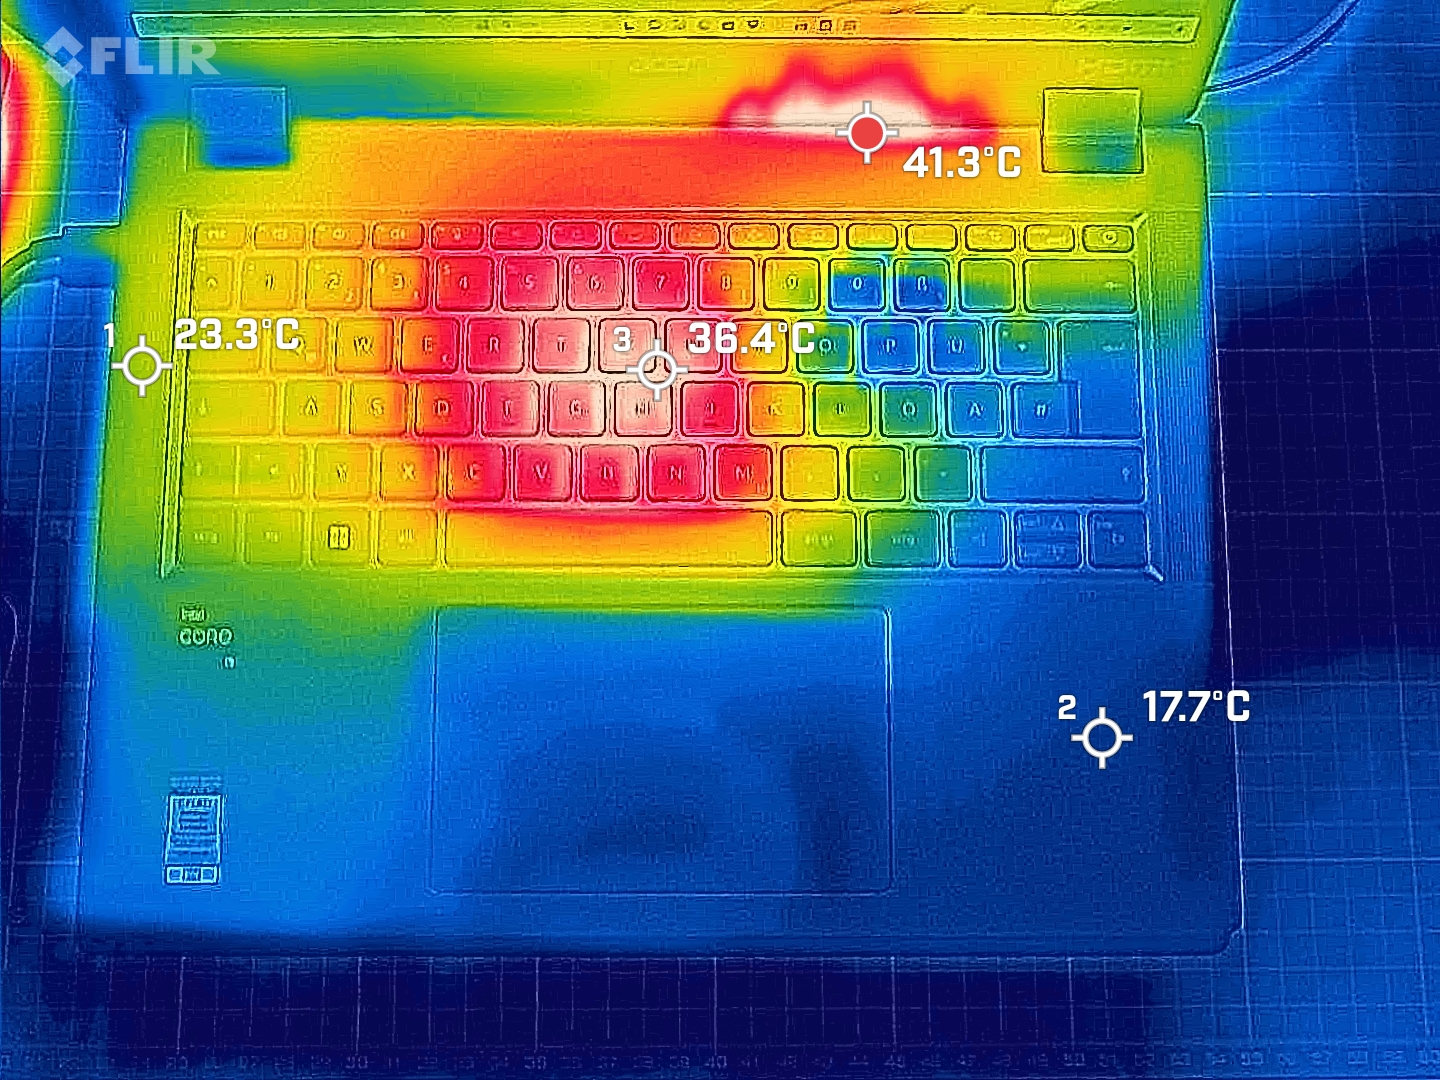
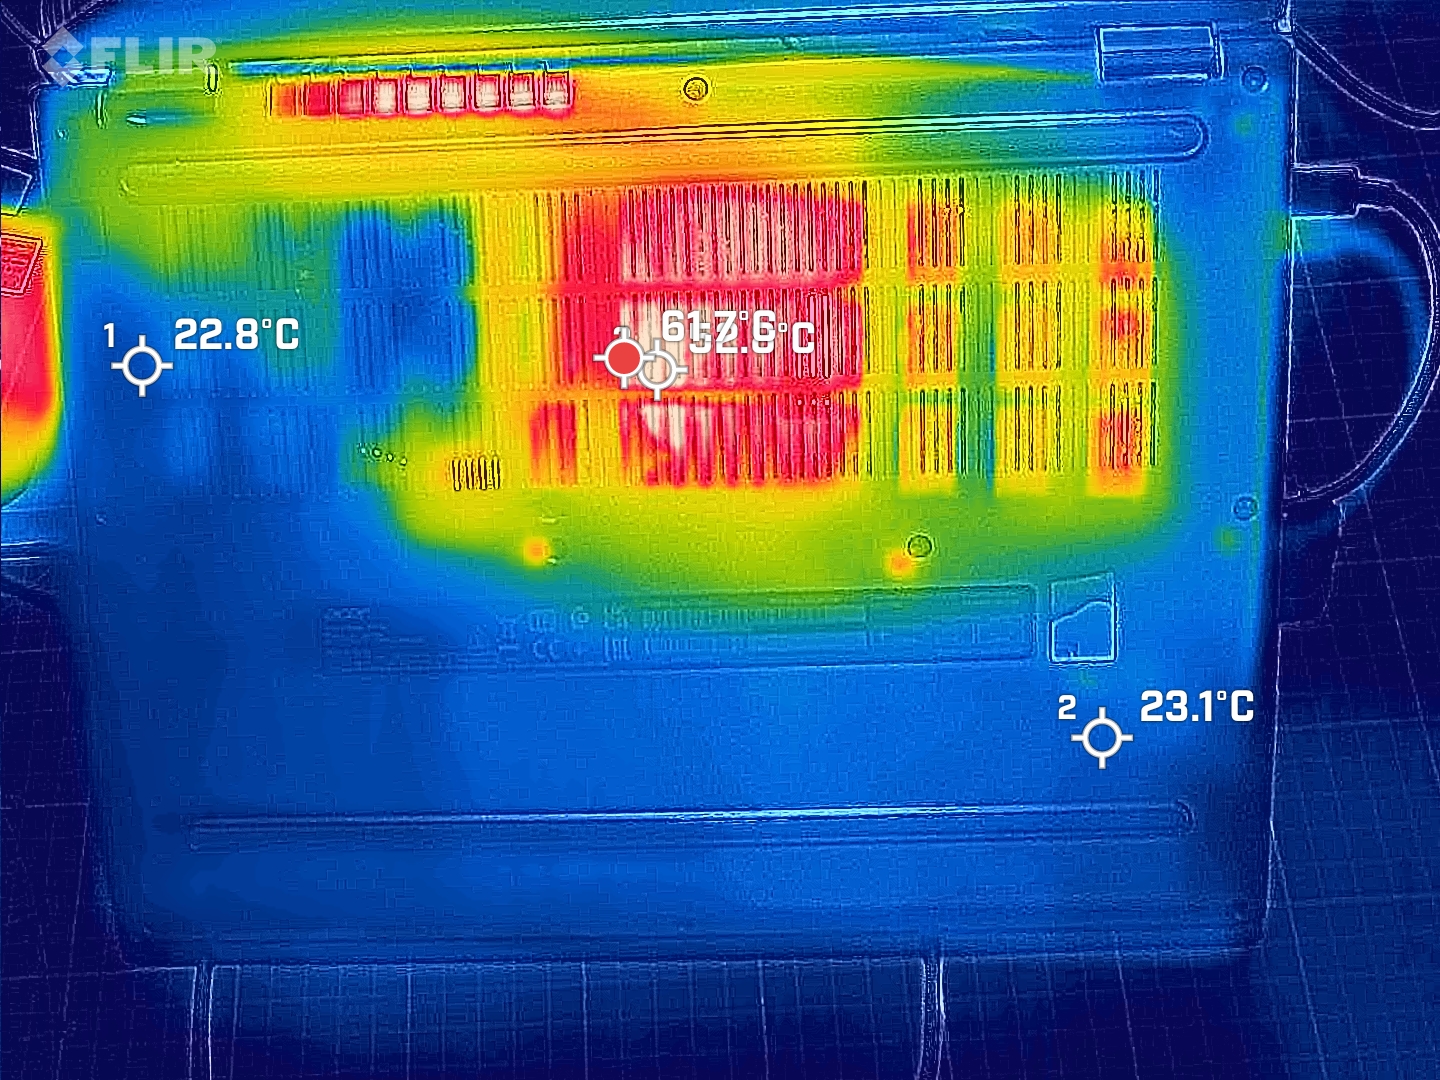
The laptop is elevated by a long rubber strip that raises the back slightly higher than the front. This doesn't serve to provide more writing comfort but improves the cooling, and air is drawn towards the heat pipe through the bottom as well as the keyboard.
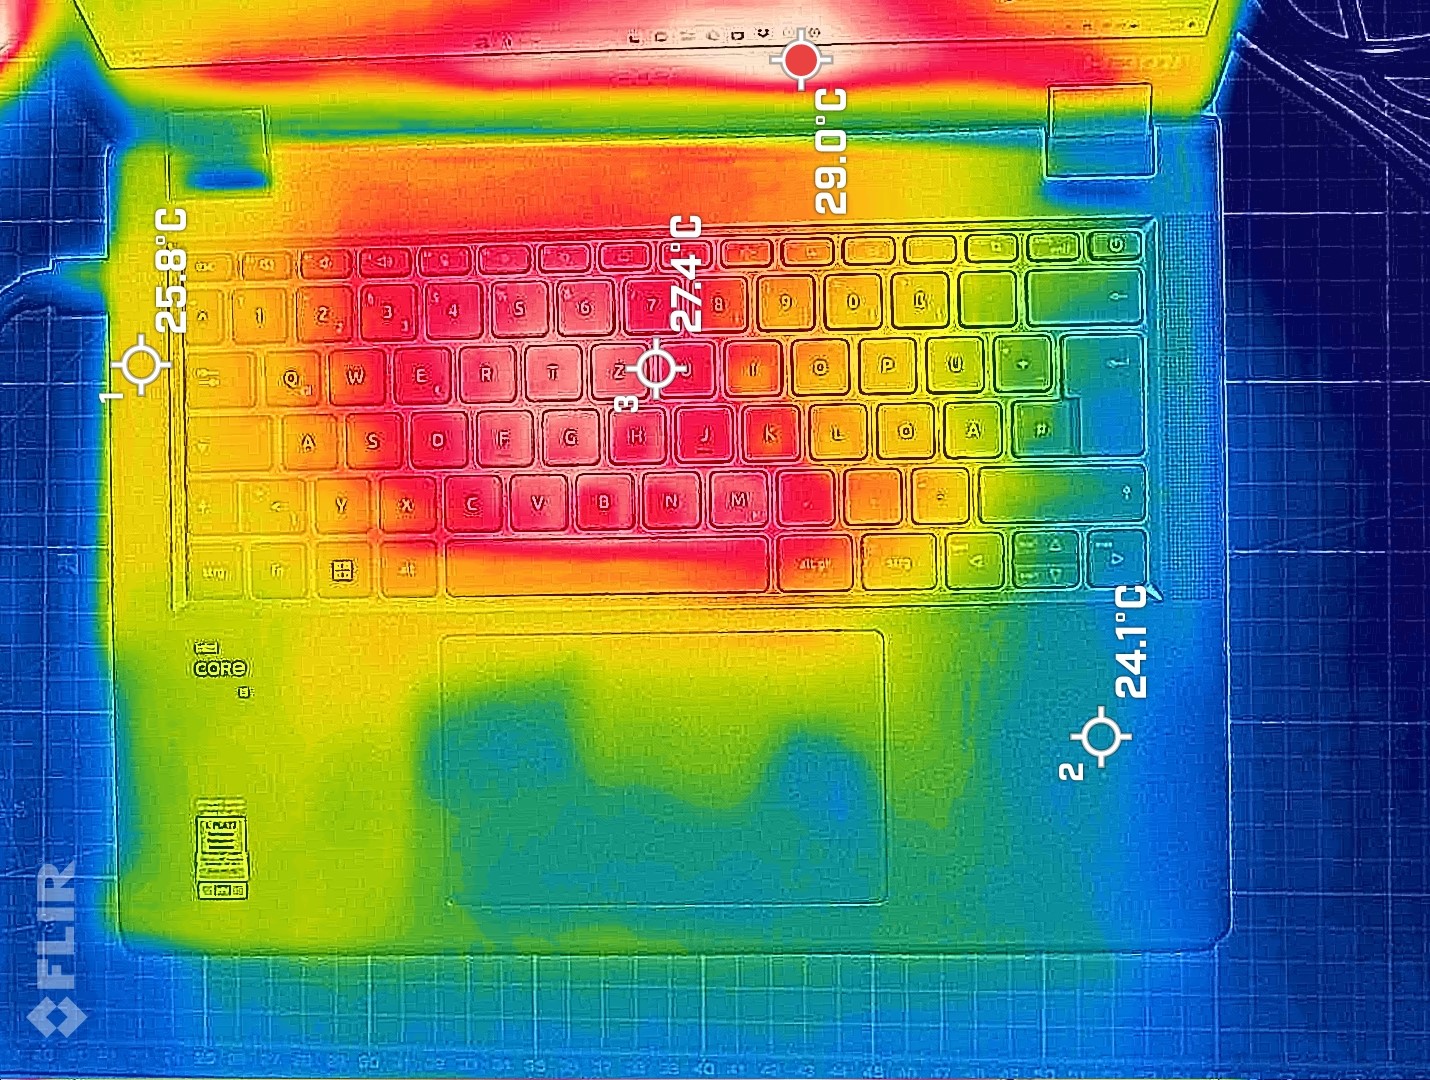
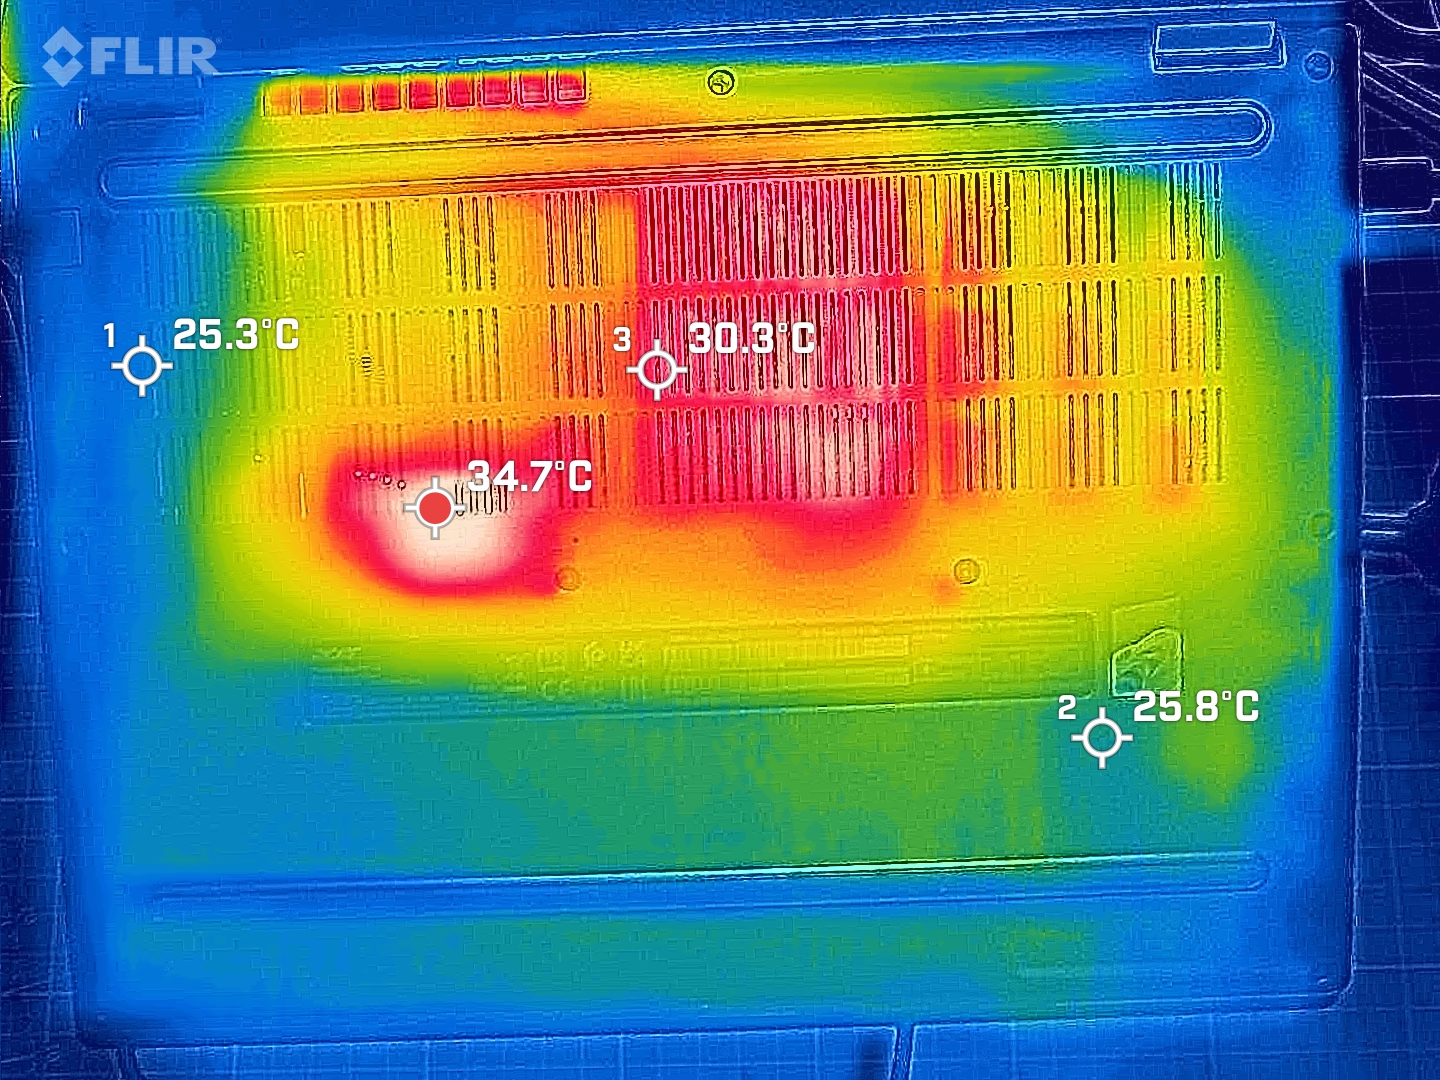
The almost constantly running fan has a positive effect: While typing this review, the temperature remains at 35 ºC (95 ºF) in the keyboard area above the SoC and at 28 ºC (82 ºF) in the areas to the right and below. Under load, the center warms up significantly, but the surrounding areas don't - or only moderately. A look at the competitors shows some large differences - to the advantage of the TravelMate. A Thinkpad E14 (AMD version) can heat up to 55 ºC (131 ºF) during the stress test, since its higher performance also has its costs.
(+) The maximum temperature on the upper side is 35.8 °C / 96 F, compared to the average of 35.9 °C / 97 F, ranging from 21.4 to 59 °C for the class Subnotebook.
(±) The bottom heats up to a maximum of 41.5 °C / 107 F, compared to the average of 39.2 °C / 103 F
(+) In idle usage, the average temperature for the upper side is 25.1 °C / 77 F, compared to the device average of 30.8 °C / 87 F.
(+) The palmrests and touchpad are cooler than skin temperature with a maximum of 22.2 °C / 72 F and are therefore cool to the touch.
(+) The average temperature of the palmrest area of similar devices was 28.2 °C / 82.8 F (+6 °C / 10.8 F).
| Acer TravelMate P4 TMP414-53-58XQ Intel Core i5-1335U, Intel Iris Xe Graphics G7 80EUs | Lenovo ThinkPad E14 G5-21JSS05C00 AMD Ryzen 7 7730U, AMD Radeon RX Vega 8 (Ryzen 4000/5000) | Lenovo ThinkPad E14 G5 i7-1355U Intel Core i7-1355U, Intel Iris Xe Graphics G7 96EUs | HP ProBook 440 G9-5Y3Z3EA Intel Core i7-1255U, Intel Iris Xe Graphics G7 96EUs | HP ProBook 445 G10 AMD Ryzen 5 7530U, AMD Radeon RX Vega 7 | |
|---|---|---|---|---|---|
| Heat | -1% | -7% | 12% | -1% | |
| Maximum Upper Side * (°C) | 35.8 | 42.6 -19% | 45.4 -27% | 38.9 -9% | 43 -20% |
| Maximum Bottom * (°C) | 41.5 | 55.3 -33% | 50.8 -22% | 37.4 10% | 51 -23% |
| Idle Upper Side * (°C) | 35 | 25.8 26% | 30.2 14% | 26.7 24% | 27 23% |
| Idle Bottom * (°C) | 35.7 | 27.4 23% | 33.4 6% | 27.8 22% | 30 16% |
* ... smaller is better
Stress Test
The TravelMate P4 runs through our classical stress test with an initially high power consumption of 50 watts. After a minute, it is already throttled down to 28 watts and then remains at that level for the rest of the test. The P cores labor briefly at 4.4 GHz but are then throttled to 3.3 GHz. After 4 minutes, they range between 2.4 and 3.0 GHz. During this scenario, we measured the maximum temperatures mentioned above.
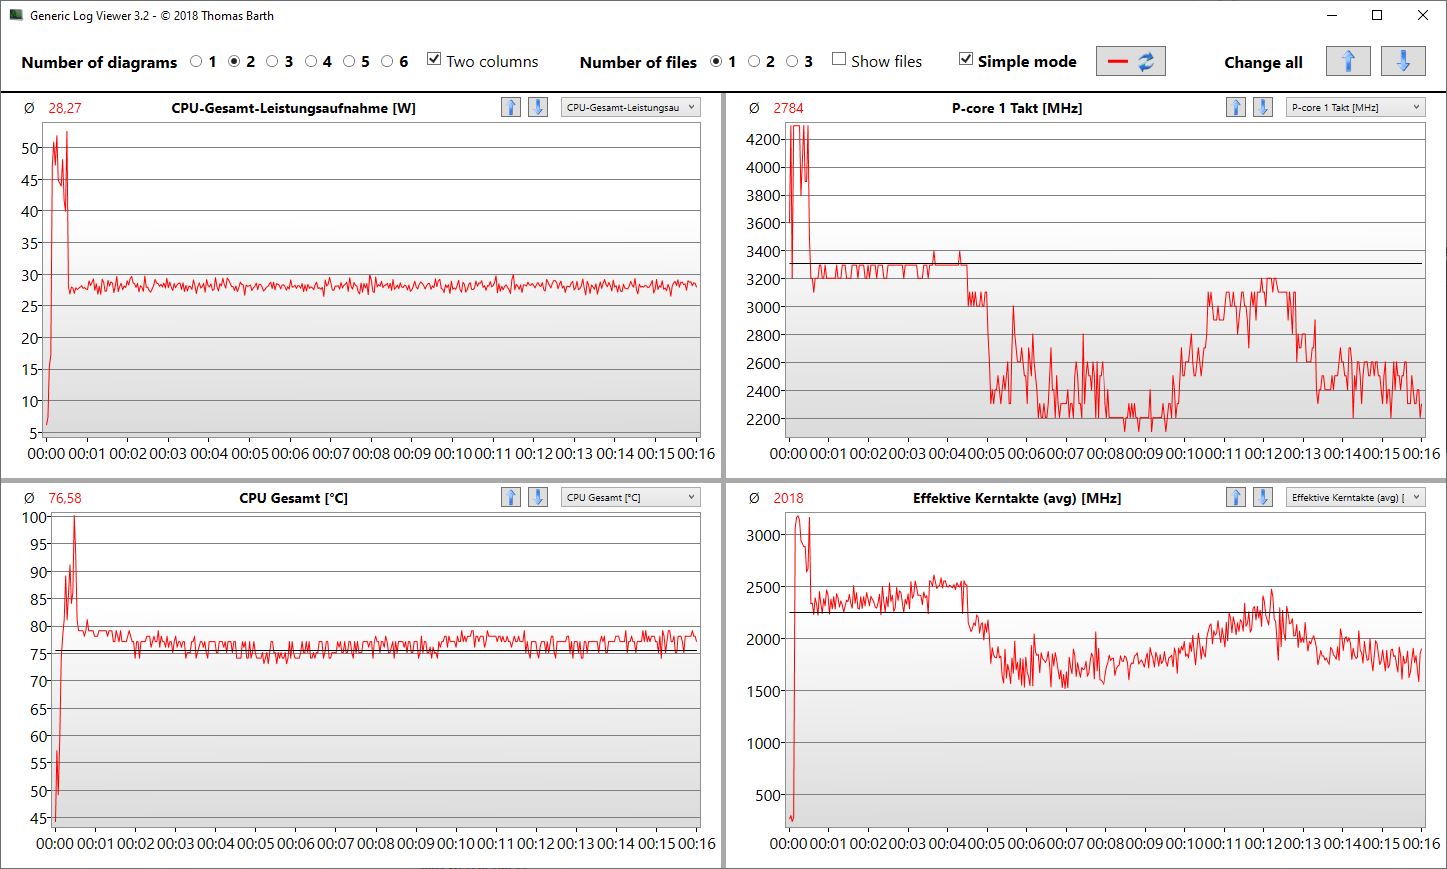
| CPU Clock (GHz) | GPU Clock (MHz) | Average CPU Temperature (°C) | Average GPU Temperature (°C) | |
| System Idle | 0.7 | 300 | 41 | 41 |
| Prime95, Stress | 4.4 | 300 | 60 | 60 |
| Prime95 + FurMark, Stress | 4.3 | 1,100 | 76 | 76 |
| The Witcher 3, Stress | 3.7 | 1,150 | 78 | 78 |
Speakers
The stereo speakers are placed on the left and right sides of the keyboard, avoiding dampened sounds when the laptop is placed on a blanket or on your lap. Many laptops have their speakers placed on the bottom instead. The sound still leaves something to be desired, especially since lower frequencies - not to mention bass - are completely missing. The mids are overemphasized, and the maximum volume is only moderate. The dual-array microphone records our voice very clearly (with AI noise suppression active), but this is only the case right in front of the laptop up to a meter distance (which will minimize the background noises). The Realtek Audio Console allows you to adjust the characteristics, switching between a personal or conference call, for example. In sum, the TravelMate provides excellent conditions for making team calls, but fails when playing music or movies.
Acer TravelMate P4 TMP414-53-58XQ audio analysis
(±) | speaker loudness is average but good (79.3 dB)
Bass 100 - 315 Hz
(-) | nearly no bass - on average 31.1% lower than median
(±) | linearity of bass is average (13.7% delta to prev. frequency)
Mids 400 - 2000 Hz
(+) | balanced mids - only 4.5% away from median
(+) | mids are linear (6.4% delta to prev. frequency)
Highs 2 - 16 kHz
(+) | balanced highs - only 3.9% away from median
(+) | highs are linear (2.9% delta to prev. frequency)
Overall 100 - 16.000 Hz
(±) | linearity of overall sound is average (23.3% difference to median)
Compared to same class
» 81% of all tested devices in this class were better, 3% similar, 17% worse
» The best had a delta of 5%, average was 18%, worst was 53%
Compared to all devices tested
» 70% of all tested devices were better, 5% similar, 25% worse
» The best had a delta of 4%, average was 23%, worst was 134%
Apple MacBook Pro 16 2021 M1 Pro audio analysis
(+) | speakers can play relatively loud (84.7 dB)
Bass 100 - 315 Hz
(+) | good bass - only 3.8% away from median
(+) | bass is linear (5.2% delta to prev. frequency)
Mids 400 - 2000 Hz
(+) | balanced mids - only 1.3% away from median
(+) | mids are linear (2.1% delta to prev. frequency)
Highs 2 - 16 kHz
(+) | balanced highs - only 1.9% away from median
(+) | highs are linear (2.7% delta to prev. frequency)
Overall 100 - 16.000 Hz
(+) | overall sound is linear (4.6% difference to median)
Compared to same class
» 0% of all tested devices in this class were better, 0% similar, 100% worse
» The best had a delta of 5%, average was 17%, worst was 45%
Compared to all devices tested
» 0% of all tested devices were better, 0% similar, 100% worse
» The best had a delta of 4%, average was 23%, worst was 134%
Power Management
Power Consumption
The below-average performance of the Core i5 also has an advantage, which is a low power consumption. 35 watts under maximum load is the result of throttling. In the competitors, this isn't the case to the same degree, and they consume between 57 and 64 watts, with the Intel models placing at the top. We compare the TravelMate's power consumption with external monitor to that of an AMD ThinkPad E14. When performance is demanded, the ThinkPad consumes more power, but it needs slightly less during idle operation.
| Idle | |
| Load |
|
Key:
min: | |
| Acer TravelMate P4 TMP414-53-58XQ i5-1335U, Iris Xe G7 80EUs, Kingston OM8SEP4512Q-AA, IPS, 1920x1200, 14" | Dell Latitude 7440 i5-1345U, Iris Xe G7 80EUs, Samsung MZ9L4512HBLU-00BMV, IPS, 2560x1600, 14" | Lenovo ThinkPad E14 G5-21JSS05C00 R7 7730U, Vega 8, WD PC SN740 SDDPNQD-1T00, IPS, 2240x1400, 14" | Lenovo ThinkPad E14 G5 i7-1355U i7-1355U, Iris Xe G7 96EUs, WD PC SN740 512GB SDDQMQD-512G, IPS, 1920x1200, 14" | HP ProBook 440 G9-5Y3Z3EA i7-1255U, Iris Xe G7 96EUs, Samsung PM991 MZVLQ512HBLU, , 1920x1080, 14" | HP ProBook 445 G10 R5 7530U, Vega 7, Kioxia BG5 KBG50ZNS512G, IPS, 1920x1080, 14" | Average Intel Iris Xe Graphics G7 80EUs | Average of class Subnotebook | |
|---|---|---|---|---|---|---|---|---|
| Power Consumption | -36% | -35% | -36% | -45% | -47% | -47% | -35% | |
| Idle Minimum * (Watt) | 3.4 | 4.5 -32% | 3.3 3% | 3.6 -6% | 5.1 -50% | 7 -106% | 4.49 ? -32% | 3.78 ? -11% |
| Idle Average * (Watt) | 5.4 | 6.5 -20% | 7.6 -41% | 6.9 -28% | 7.4 -37% | 8 -48% | 7.4 ? -37% | 6.57 ? -22% |
| Idle Maximum * (Watt) | 6.4 | 7.3 -14% | 8.9 -39% | 7 -9% | 8.4 -31% | 9 -41% | 9.26 ? -45% | 7.94 ? -24% |
| Witcher 3 ultra * (Watt) | 34.2 | 46.2 -35% | 45.1 -32% | 50.5 -48% | 42.3 -24% | 36.2 -6% | ||
| Load Maximum * (Watt) | 35.16 | 63 -79% | 57.8 -64% | 67 -91% | 64 -82% | 47 -34% | 61.7 ? -75% | 64.4 ? -83% |
| Load Average * (Watt) | 52.5 | 47.3 | 42.3 | 42.6 | 34 | 36.6 ? | 41.9 ? |
* ... smaller is better
Power Consumption The Witcher 3 / Stress Test
Power Consumption With External Monitor
Battery Life
The TravelMate keeps up in the batter life tests, and 8 to 10.5 hours with a 56-Wh battery are good results. With a reduced brightness of 150 cd/m², we reach 10:33 hours, allowing the TravelMate to easily surpass the two ThinkPad E14 models. However, this is still not a top value, as the Dell Latitude 7440 (57 Wh) shows lasting 2:20 hours longer.
The Battery Eater Classic Test results in a minimum runtime of 143 minutes. When we wrote this review on the TravelMate (with a brightness reduced to 1/3, Wi-Fi, and Balanced mode) the 14-inch laptop lasted almost 9 hours.
| Acer TravelMate P4 TMP414-53-58XQ i5-1335U, Iris Xe G7 80EUs, 56 Wh | Dell Latitude 7440 i5-1345U, Iris Xe G7 80EUs, 57 Wh | Lenovo ThinkPad E14 G5-21JSS05C00 R7 7730U, Vega 8, 57 Wh | Lenovo ThinkPad E14 G5 i7-1355U i7-1355U, Iris Xe G7 96EUs, 47 Wh | HP ProBook 440 G9-5Y3Z3EA i7-1255U, Iris Xe G7 96EUs, 42 Wh | HP ProBook 445 G10 R5 7530U, Vega 7, 42 Wh | Fujitsu LifeBook E5412A E542AMHAAMDE R5 PRO 5675U, Vega 7, 60 Wh | Average of class Subnotebook | |
|---|---|---|---|---|---|---|---|---|
| Battery runtime | 18% | -29% | -48% | -46% | -10% | -26% | 7% | |
| WiFi v1.3 (h) | 10.6 | 13 23% | 9.9 -7% | 5.5 -48% | 5.7 -46% | 9.5 -10% | 10.4 -2% | 14 ? 32% |
| Load (h) | 2.4 | 2.7 13% | 1.2 -50% | 1.2 -50% | 1.969 ? -18% | |||
| Reader / Idle (h) | 23.8 | 28.6 ? | ||||||
| H.264 (h) | 10.8 | 8.2 | 15.4 ? |
Pros
Cons
Verdict
The TravelMate P4 turns understatement into a matter for the bosses: an inconspicuous performance, mouse-gray visuals, a simple Full HD display, the lowest heat development, and the quiet sound of the speakers. Those who want to boast with their laptop should definitely avoid the 14-inch laptop from Acer.
Where the boring back-office companion is used, it fulfills its duties to, let's say, 95%.
The small reduction is for the overall weak brightness of the IPS panel that is further decreased in battery operation. This will create some difficulties for a home office in the sun.
We see the strengths of the laptop in a good battery life of 8 to 10.5 hours, together with a robust case that mostly stays cool. The low heat development and power consumption are a result of a Core i5 running below its capacities, but hardly anyone will notice this when working with web applications and Excel spreadsheets. What will then be far more important is practical matters such as being able to clean the fans or upgrade the working memory, for example. In this regard, Acer gives a good example by providing an opening to blow forced air for cleaning the fans, or offering easy removal of the bottom plate.
Acer doesn't forgo a wired Ethernet connection and also includes a fast and very current Wi-Fi chip. A keyboard that immediately allowed us to type at a fast pace, and a large 14-cm ClickPad placed in the center are some new advantages. In addition, Acer has reworked the design. And finally, the two Thunderbolt 4 ports become relevant if you have to use a powerful docking station.
While the display isn't the best, it offers an enlarged workspace for documents and Excel with its 16:10 format.
A keyboard offering good feedback and a large ClickPad on a solid palm rest are important for frequent typists, and we were quickly able to write this review on it, without needing any time for familiarization.
If you are looking for the best price-performance ratio, the Lenovo ThinkPad E14 G5 with an Intel or AMD chip is an option. Particularly the AMD model is the better alternative for power-hungry users, if they need something for around 1,000 Euros (~$1,087). Both the Lenovo ThinkPad E14 G5-21JSS05C00 and Lenovo ThinkPad E14 G5 i7-1355U achieved identical overall ratings, but depending on the configuration, they bring more hardware for the money (in terms of RAM, SSD, or resolution) and are even more upgradable (with a second SSD slot!). The disadvantage of the ThinkPad E is a standard warranty lasting only 12 months.
Price and Availability
We recommend comparing the prices for various configurations. For example, Amazon lists the Acer TravelMate P4 TMP414-51 with similar specs as our test configuration for around $740 and a more powerful 12th gen Core-i7 version with a 1-TB SSD and 16 GB of RAM for ~$1,052.
Acer TravelMate P4 TMP414-53-58XQ
- 01/16/2024 v7 (old)
Sebastian Jentsch
Transparency
The selection of devices to be reviewed is made by our editorial team. The test sample was provided to the author as a loan by the manufacturer or retailer for the purpose of this review. The lender had no influence on this review, nor did the manufacturer receive a copy of this review before publication. There was no obligation to publish this review. As an independent media company, Notebookcheck is not subjected to the authority of manufacturers, retailers or publishers.
This is how Notebookcheck is testing
Every year, Notebookcheck independently reviews hundreds of laptops and smartphones using standardized procedures to ensure that all results are comparable. We have continuously developed our test methods for around 20 years and set industry standards in the process. In our test labs, high-quality measuring equipment is utilized by experienced technicians and editors. These tests involve a multi-stage validation process. Our complex rating system is based on hundreds of well-founded measurements and benchmarks, which maintains objectivity. Further information on our test methods can be found here.
Price comparison

