Lenovo ThinkPad P16 G2 Laptop Review: Improved with 165 Hz screen & Nvidia RTX 2000 Ada
The most powerful Lenovo ThinkPad laptop - that title always goes to the current ThinkPad P series model. Specifically, the classic, thick P series, which used to be P15 G2 and P17 G2 but has since been condensed into the Lenovo ThinkPad P16. The most recent model of this product line is the Lenovo ThinkPad P16 Gen 2, today's review device.
But what even is a classic workstation? Workstation laptops are used for various professional use cases, with CAD being among the most important. The classic workstations put performance above everything else, which means they are on of the few laptop series that did not undergo the "ultrabook" metamorphosis. As such, classic workstations like the Lenovo ThinkPad P16 G2 are both thick and heavy.
Potential Competitors in Comparison
Rating | Date | Model | Weight | Height | Size | Resolution | Price |
|---|---|---|---|---|---|---|---|
| 90.2 % v7 (old) | 03 / 2024 | Lenovo ThinkPad P16 G2 21FA000FGE i7-13700HX, RTX 2000 Ada Generation Laptop | 3 kg | 30.23 mm | 16.00" | 2560x1600 | |
| 88.2 % v7 (old) | 02 / 2023 | Lenovo ThinkPad P16 G1 21D6001DMB i7-12850HX, RTX A2000 Laptop GPU | 3 kg | 30.23 mm | 16.00" | 2560x1600 | |
| 92.3 % v7 (old) | 09 / 2023 | HP ZBook Fury 16 G10 i9-13950HX, RTX 5000 Ada Generation Laptop | 2.6 kg | 28.5 mm | 16.00" | 3840x2400 | |
| 91.7 % v7 (old) | 10 / 2023 | Lenovo ThinkPad P1 G6-21FV000DGE i9-13900H, RTX 2000 Ada Generation Laptop | 1.9 kg | 17.5 mm | 16.00" | 2560x1600 | |
| 88.9 % v7 (old) | 12 / 2023 | HP ZBook Power 15 G10 R7 PRO 7840HS, RTX 2000 Ada Generation Laptop | 2 kg | 22.9 mm | 15.60" | 2560x1440 | |
| 86.2 % v7 (old) | 01 / 2024 | Lenovo ThinkPad P16v G1 AMD R7 PRO 7840HS, RTX A1000 Laptop GPU | 2.3 kg | 24.7 mm | 16.00" | 1920x1200 |
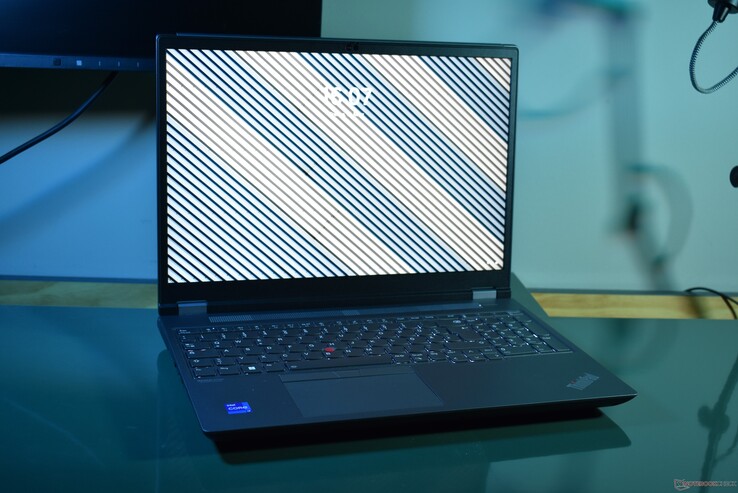
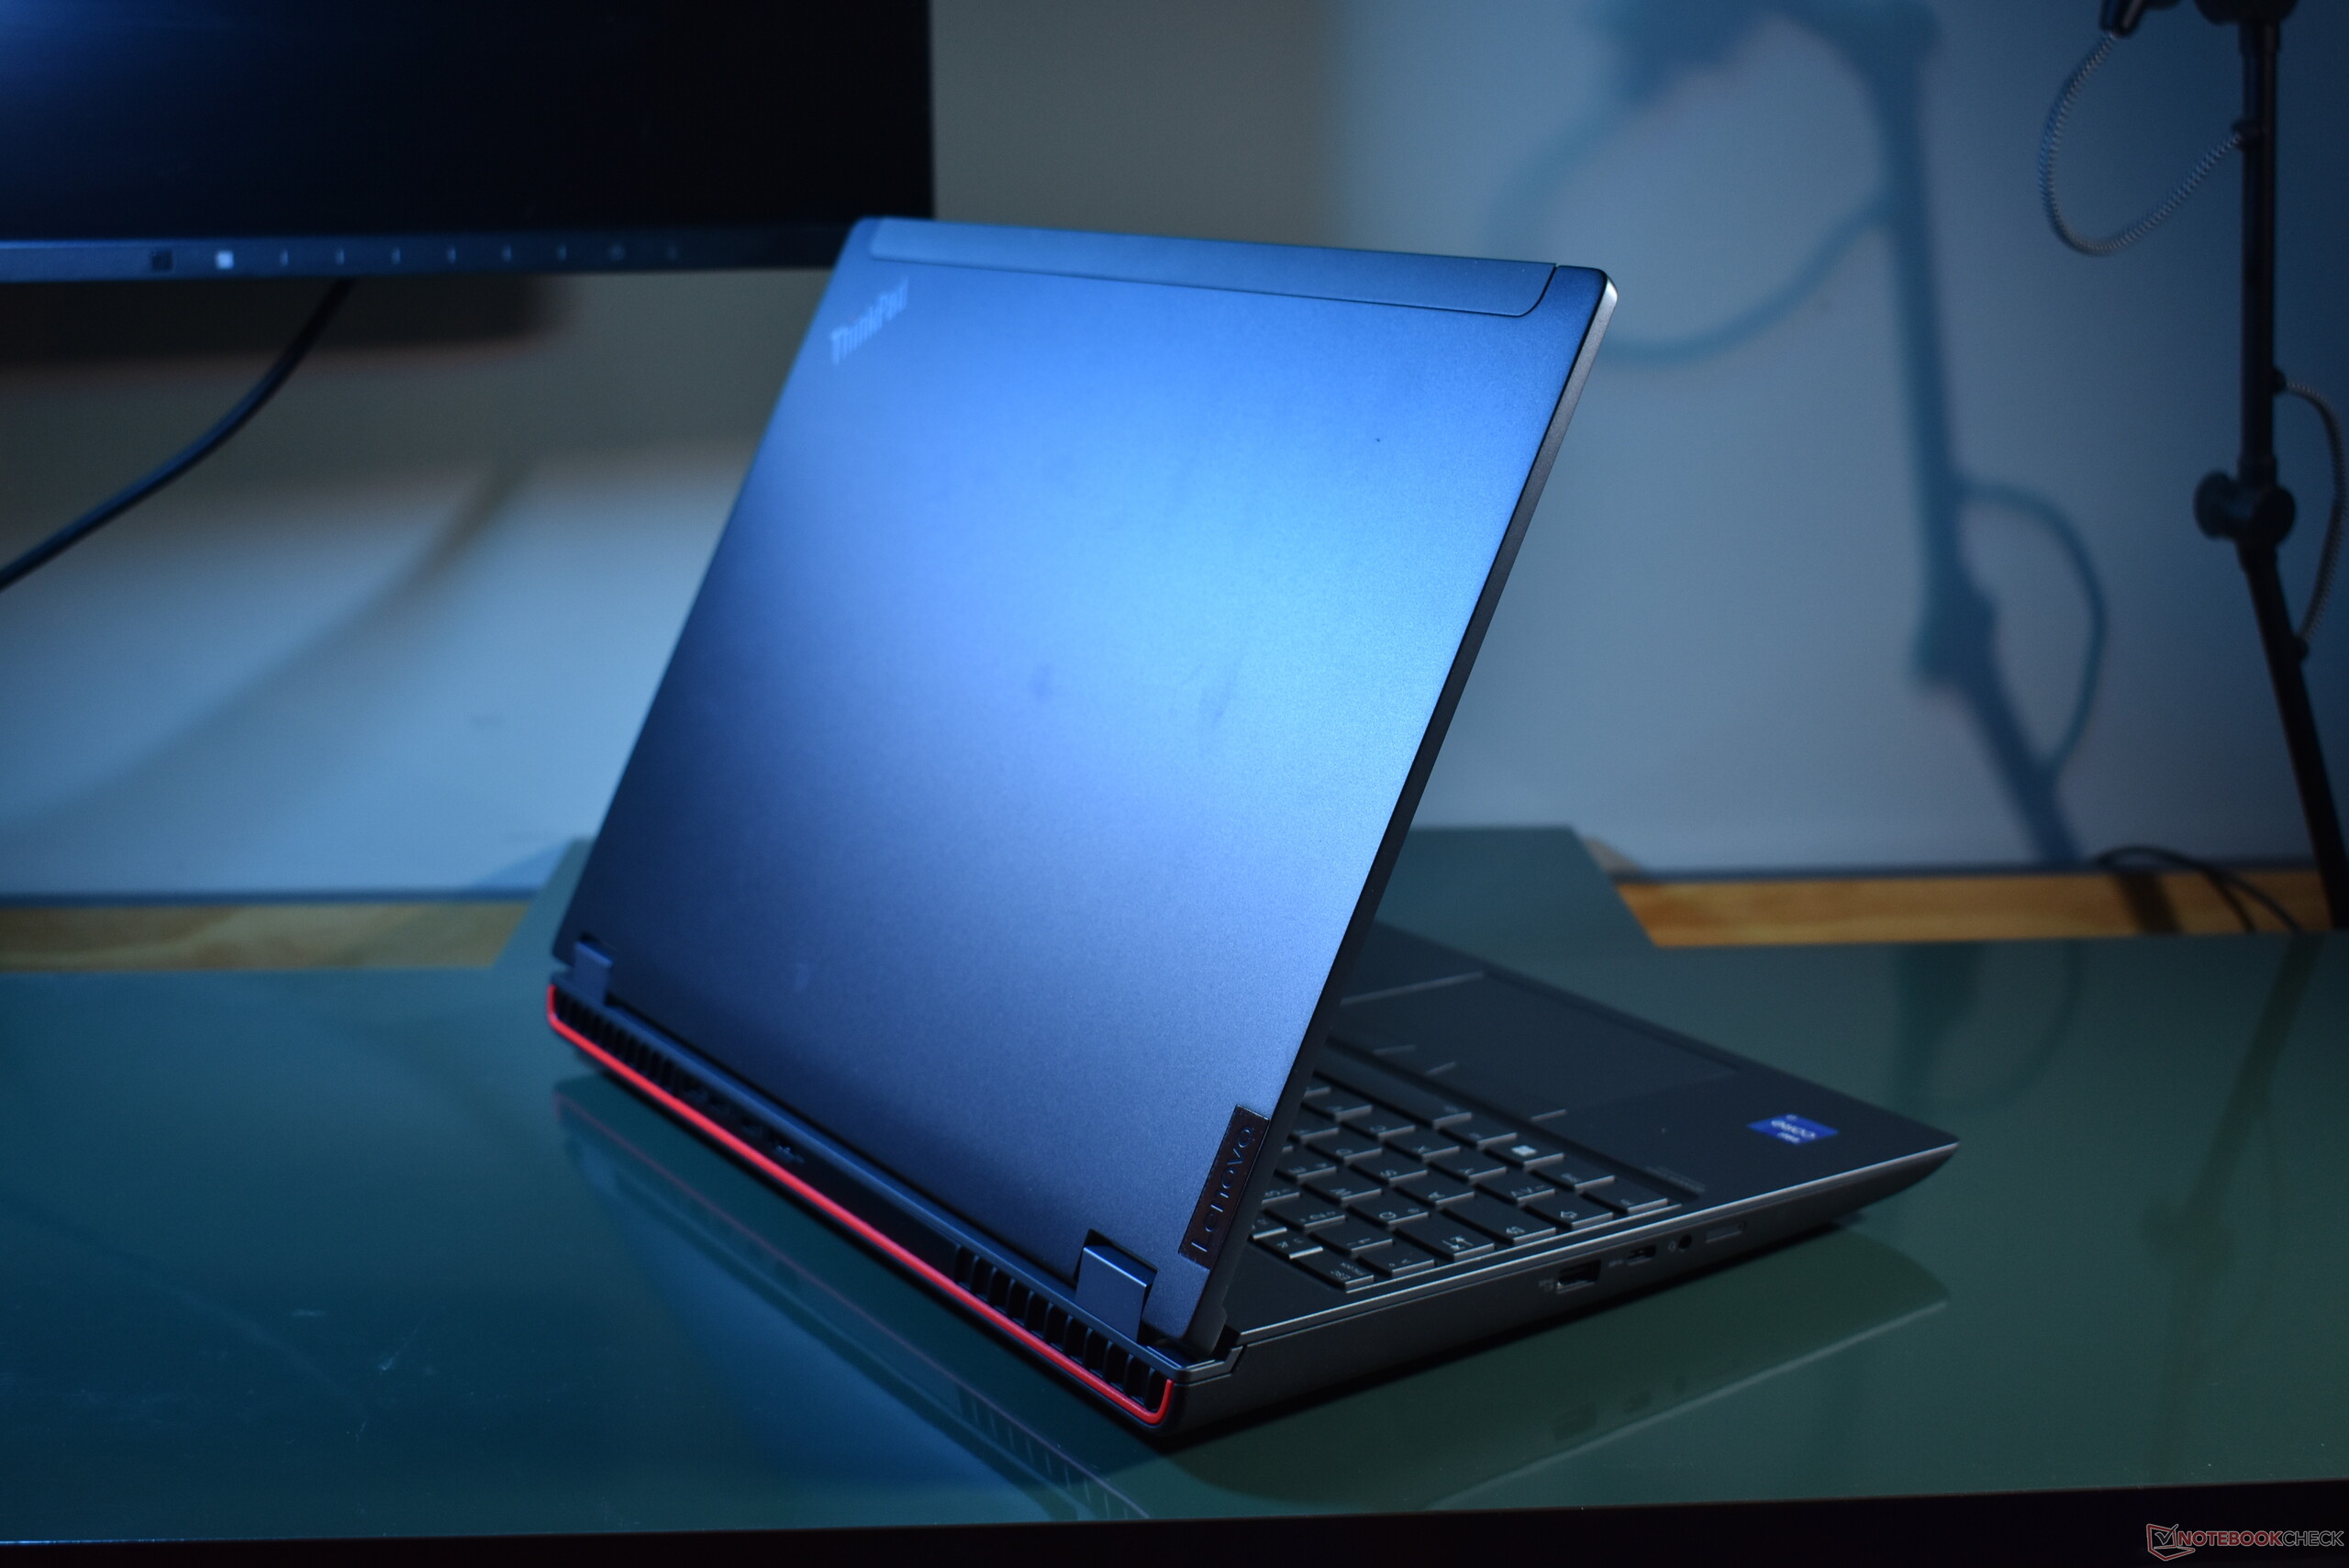
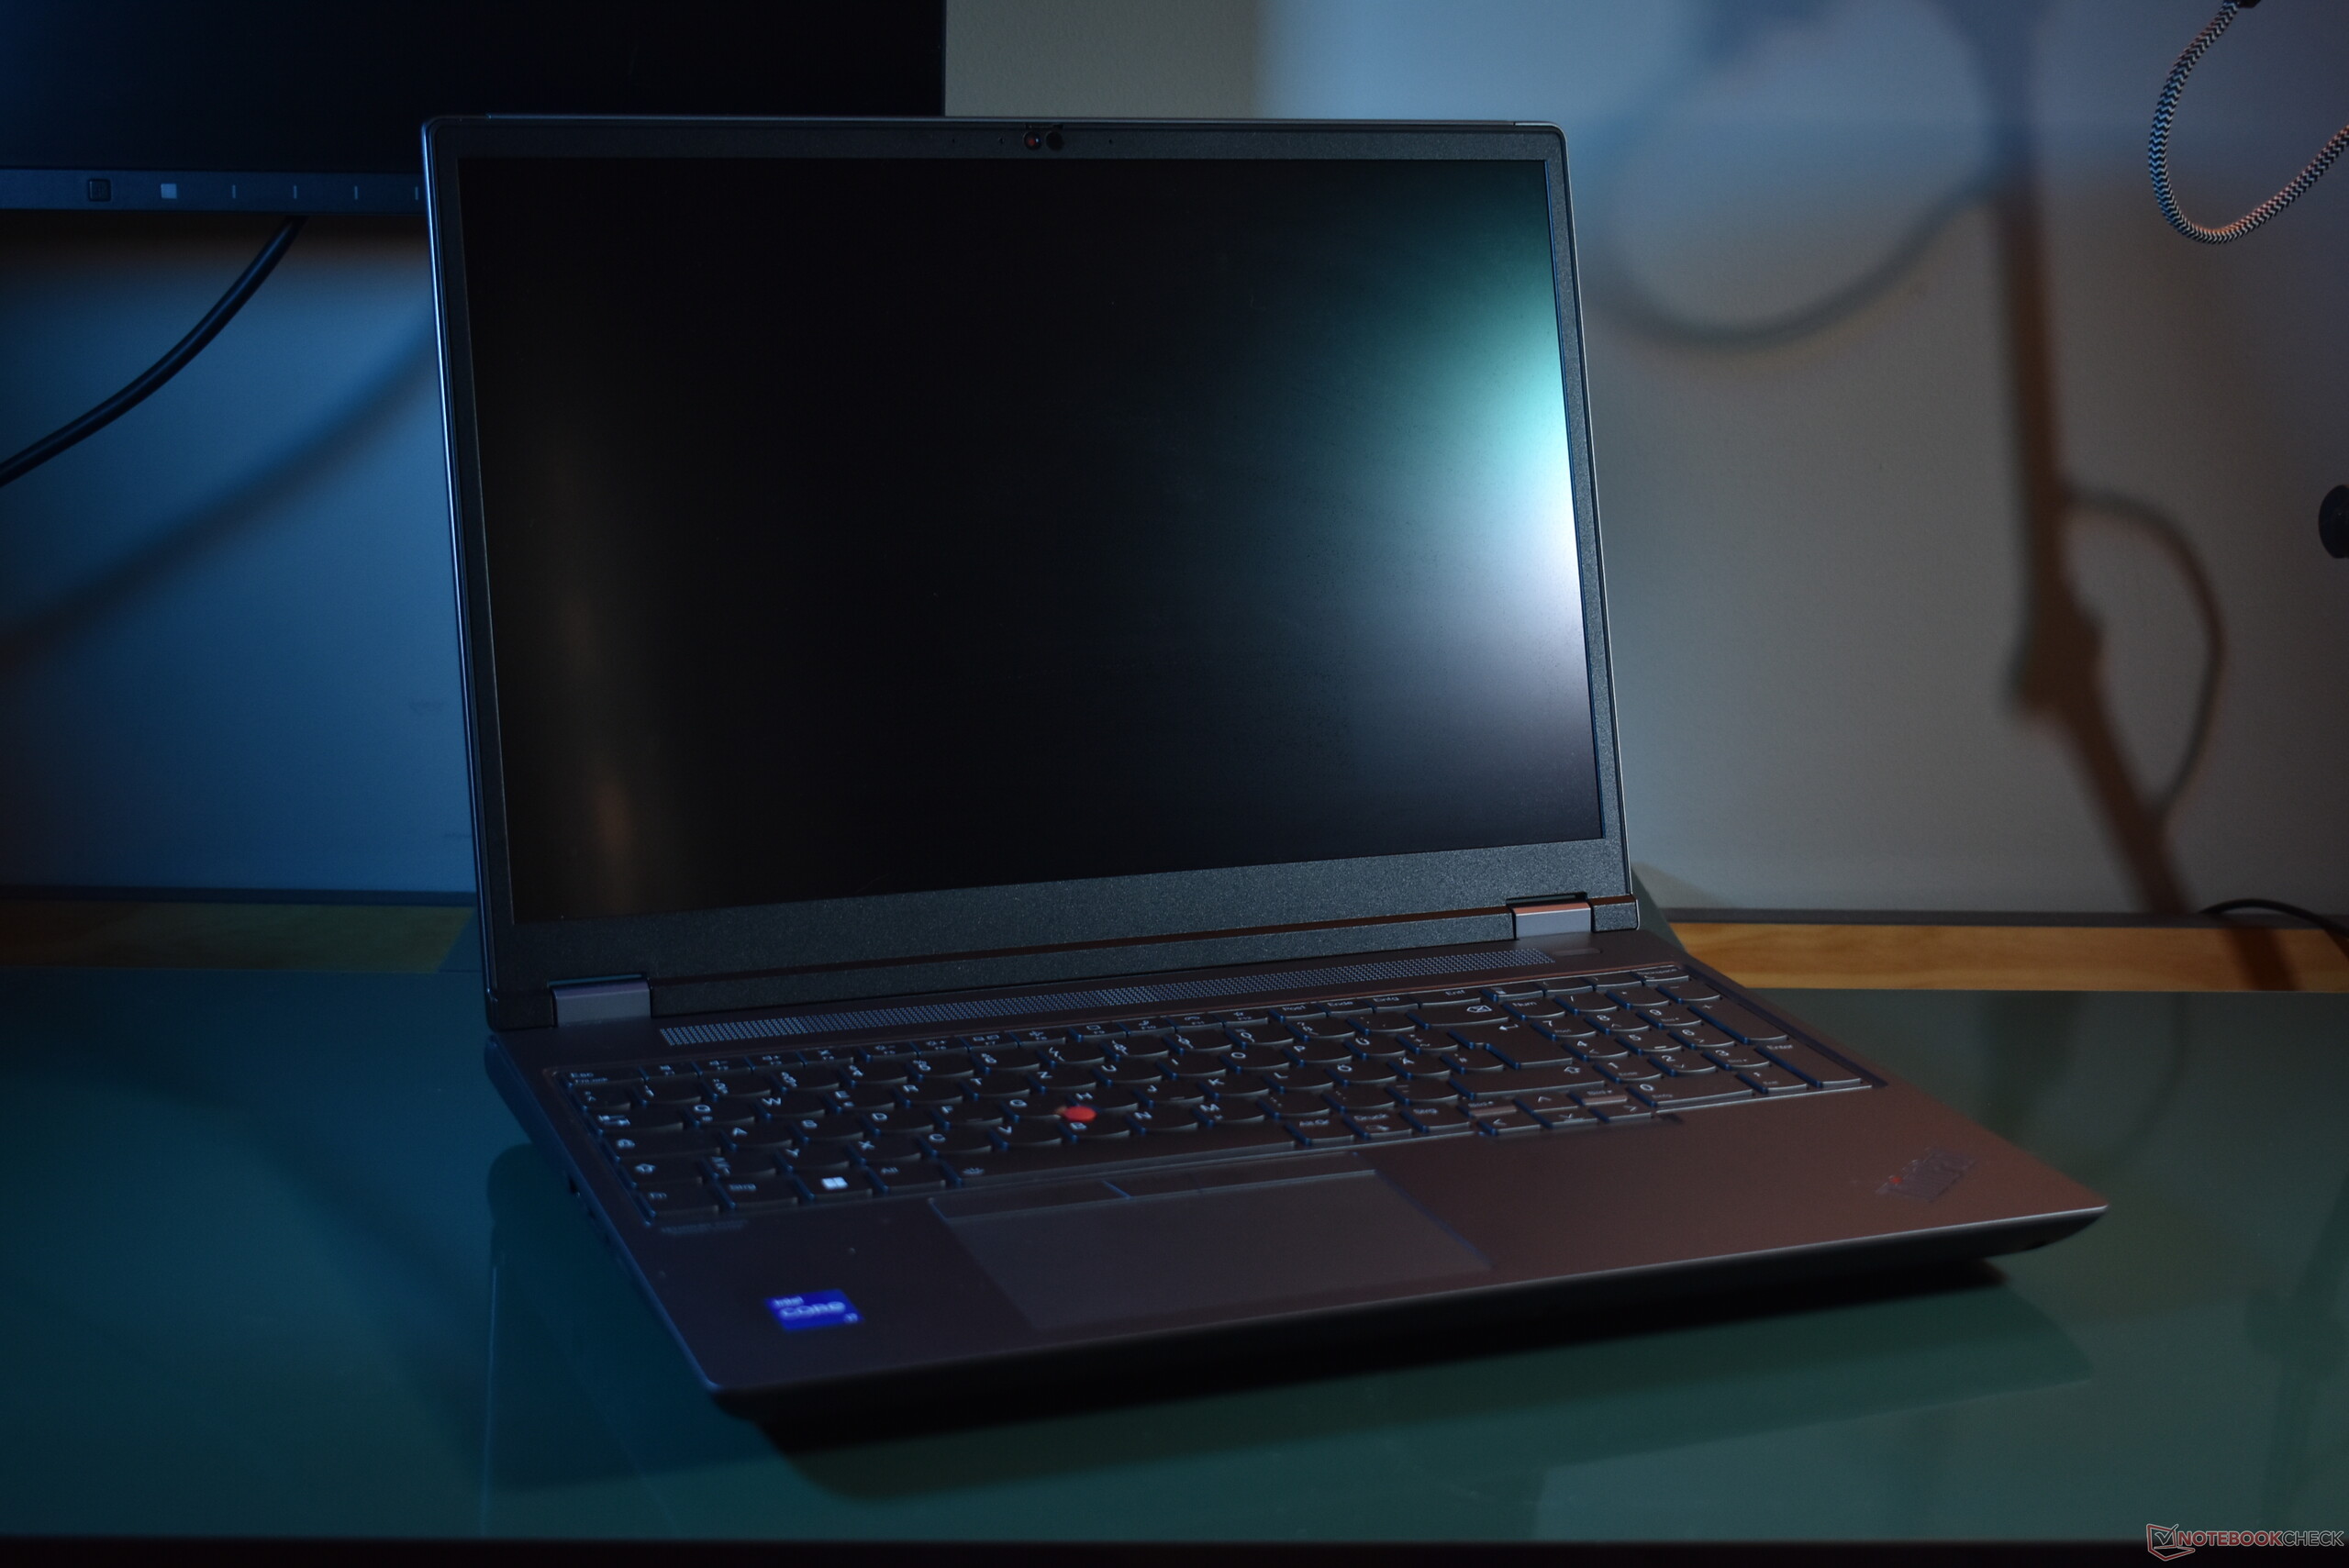
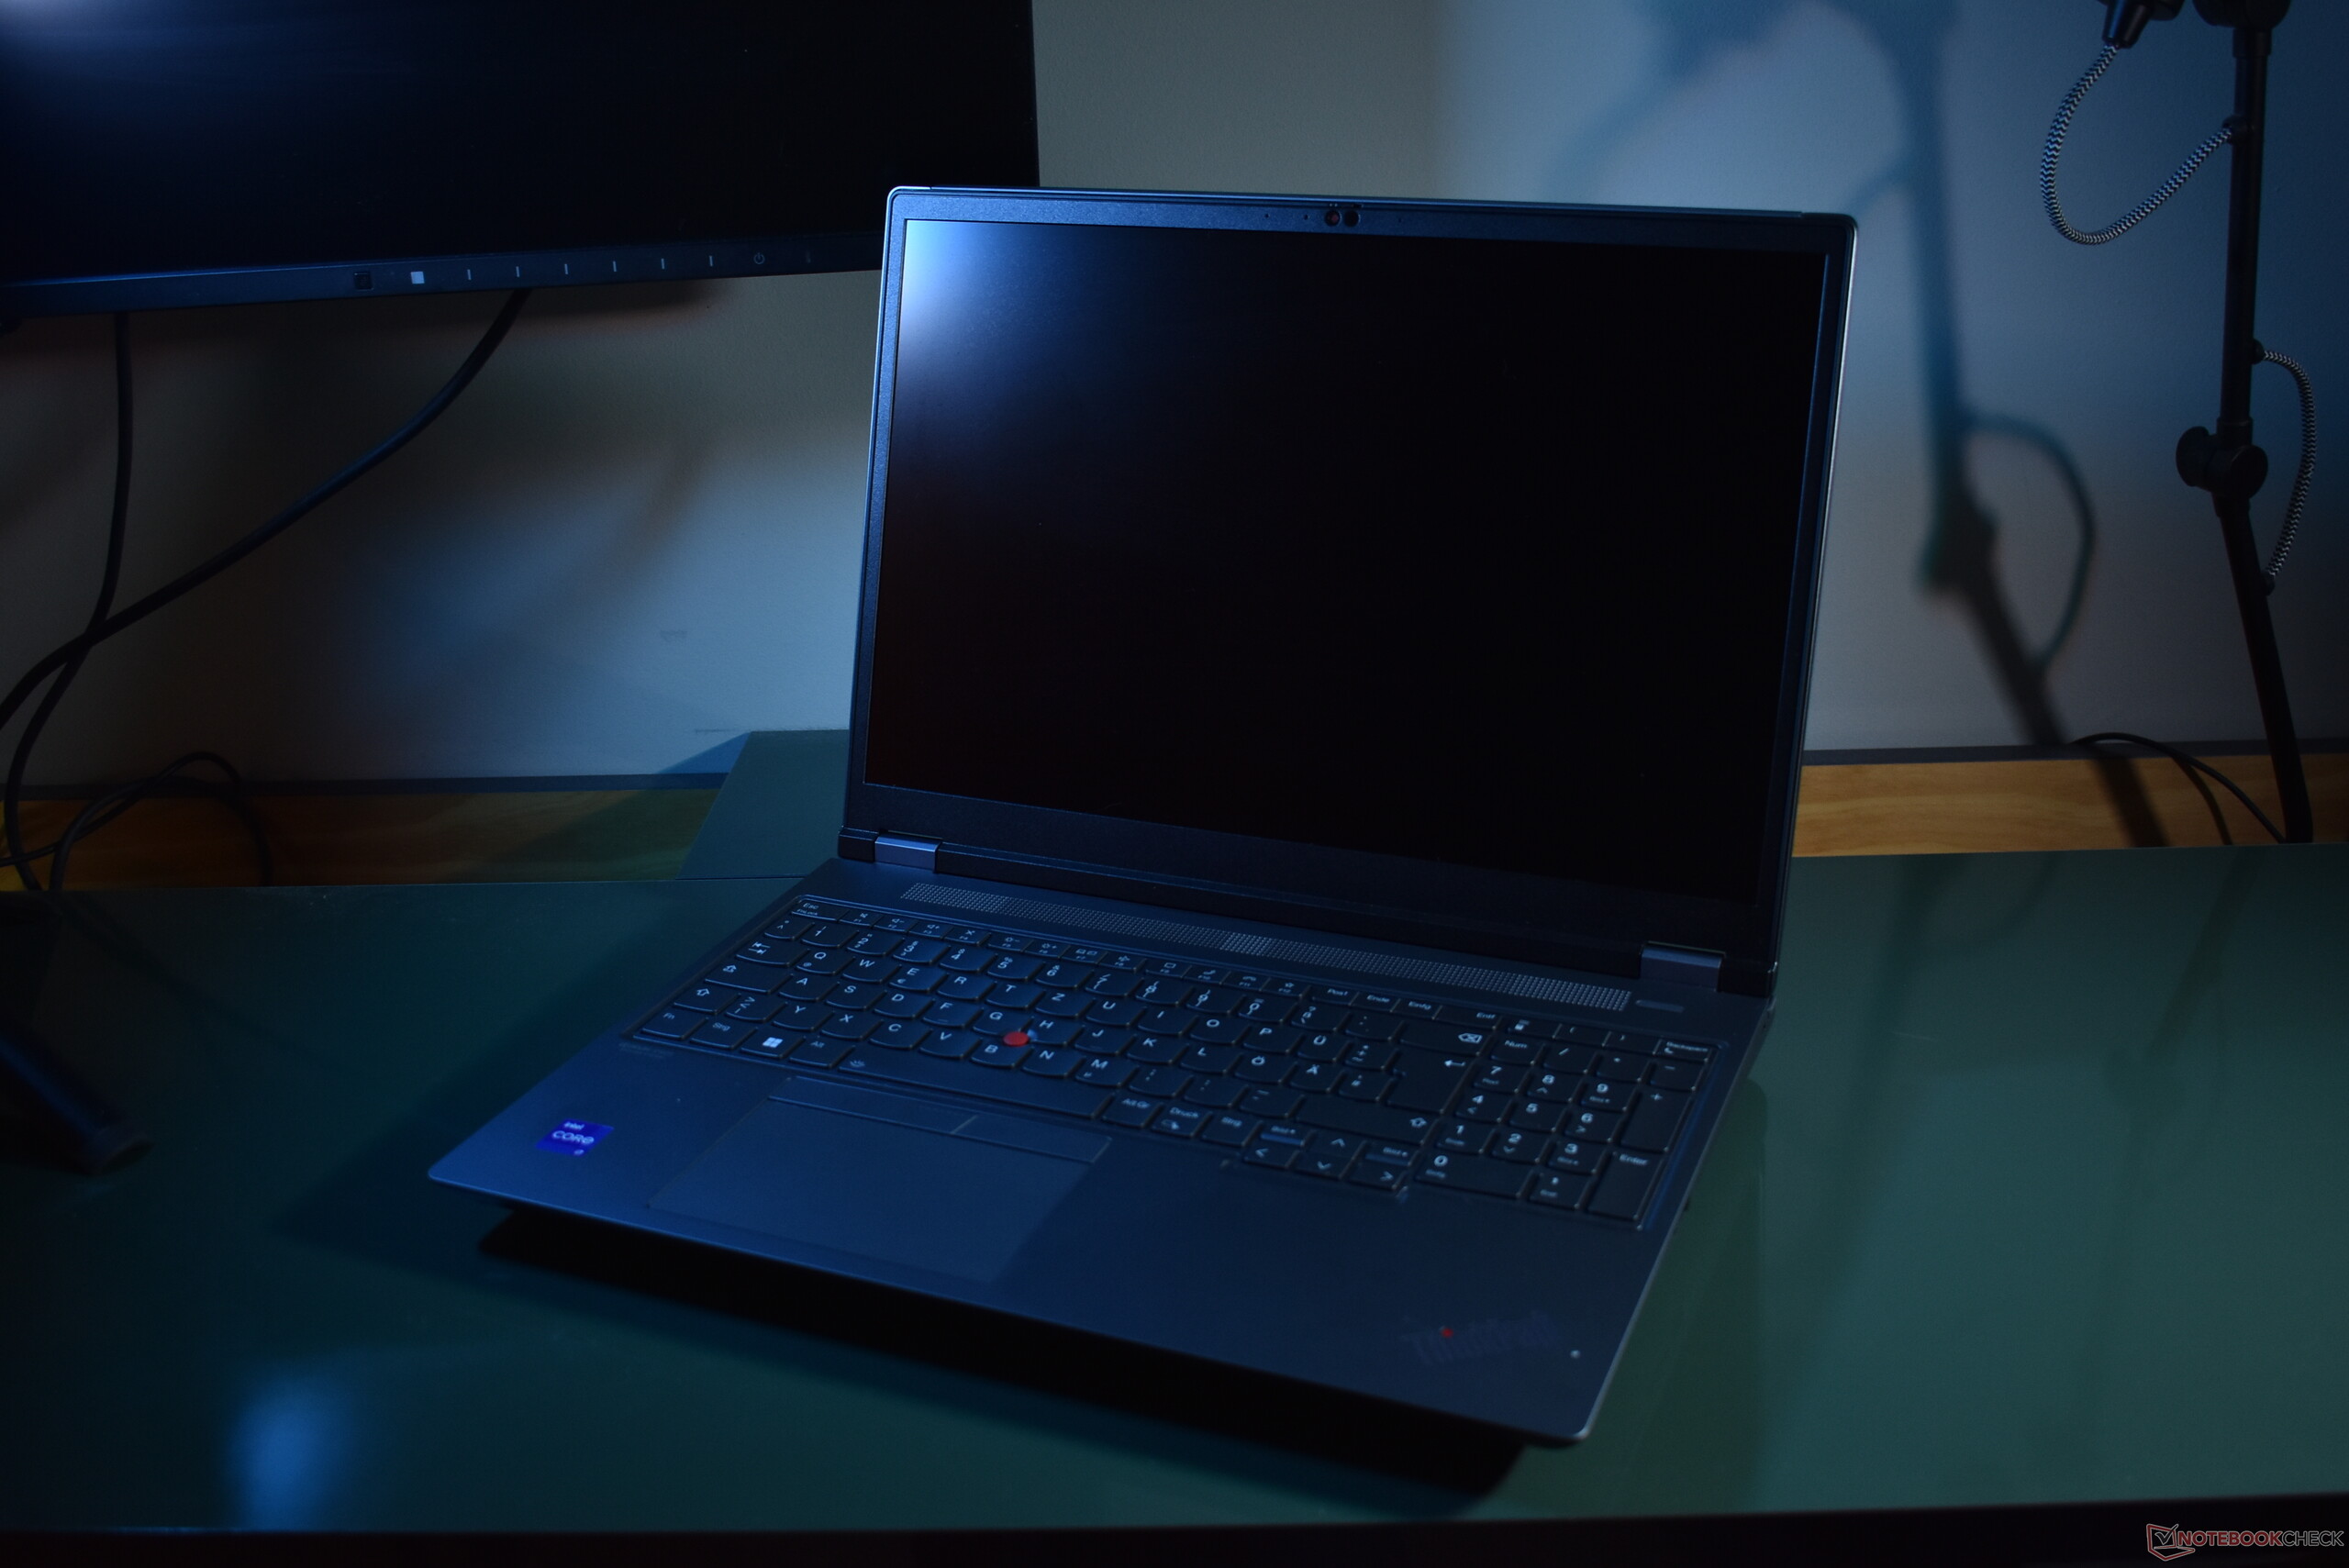
Case: Grey giant with classic construction
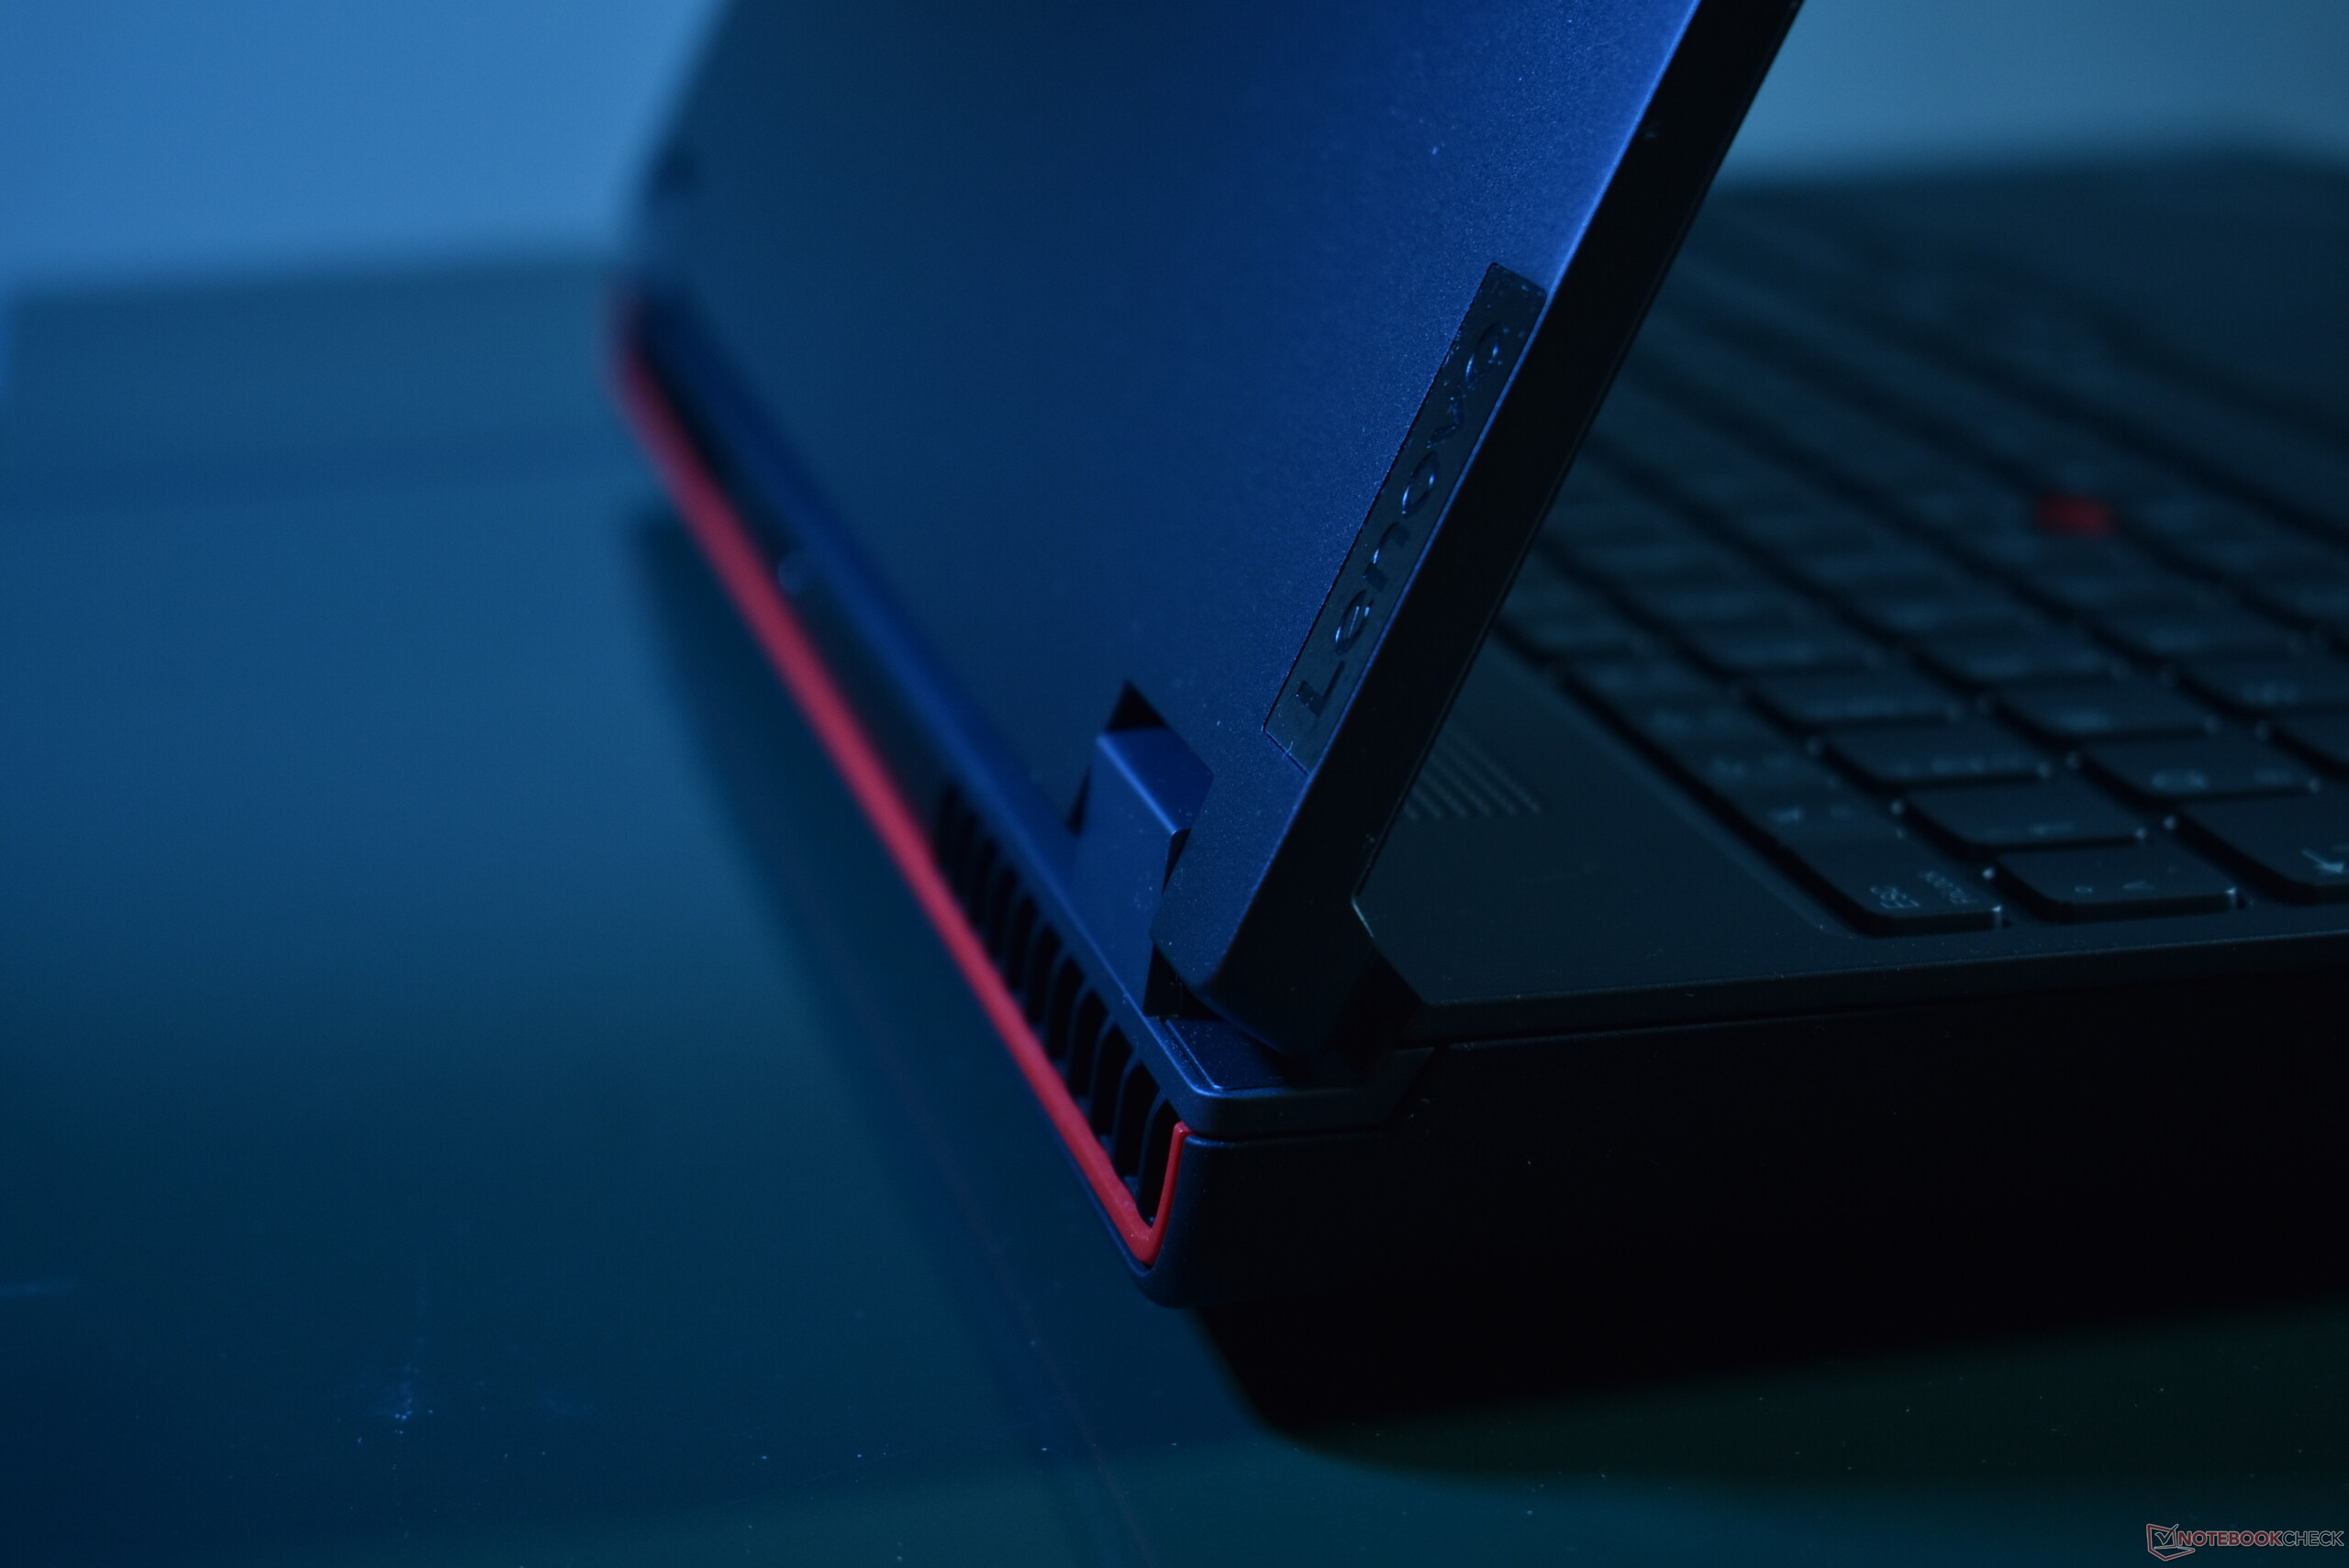
The casing of the Lenovo ThinkPad P16 Gen 2 remains unchanged compared to the first generation of the ThinkPad P16. The thickest current ThinkPad laptop uses a distinct design from most other models, opting for a two-tone colorscheme (Storm Grey screen cover and keyboard deck, black screen bezel and bottom cover) as well as a different form language - the bottom cover is rounded off, not squared like with other ThinkPads. Unlike most modern ThinkPads, this one uses the classic top-base hinge design and sports rather big bezels, even if they are already smaller than they used to be on older P series.
In terms of materials, the Lenovo ThinkPad P16 G2 sticks largely with what has always worked for ThinkPads: Metal and plastics combined. The outer hull of the bottom cover is plastic-made, strengthened with a traditional ThinkPad magnesium structure frame design - the roll cage. The screen cover is aluminum with some additional magnesium strengthening. This device feels extremely robust and is the closest to the classic ThinkPads of old as you can get today in terms of construction. There are almost no weak points and the chassis has little give, with the palmrest area above the smartcard reader on the right side of the palmrest as the only exception.
The hinges are perfect. They prevent wobble, allow for an opening angle of more than 180 degrees and the screen can even be opened with one hand.
Its pretty clear, the Lenovo ThinkPad P16 Gen 2 is the biggest and heaviest workstation in the comparison. The closest fit in specs and positioning, the HP ZBook Fury 16 G10, weighs 400 g less and is slightly smaller and thinner.
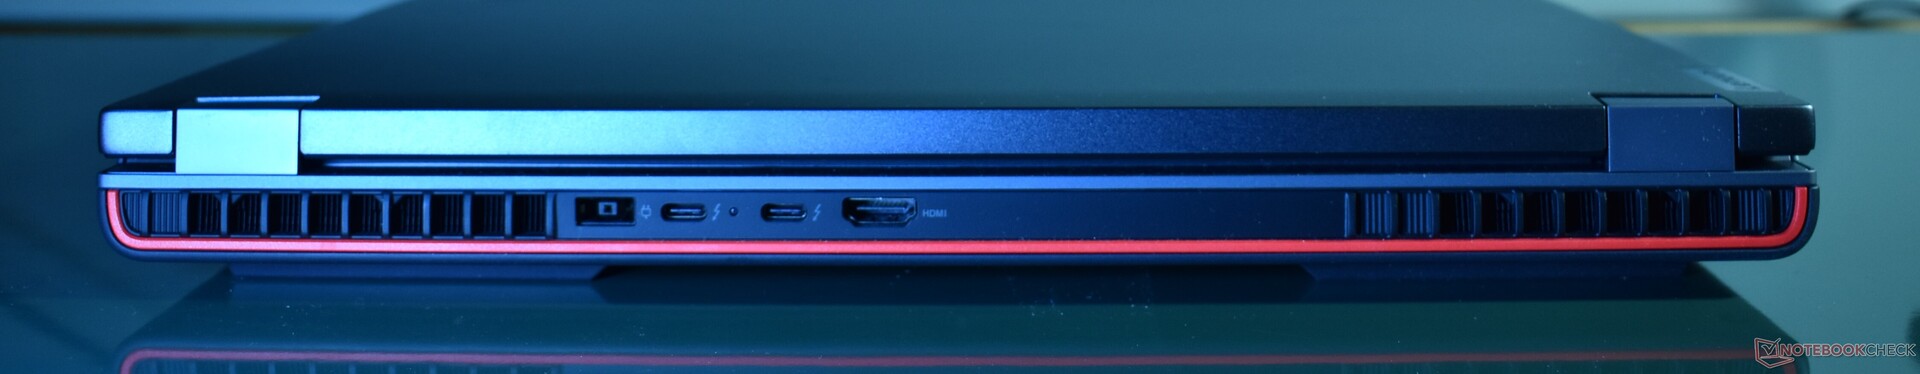
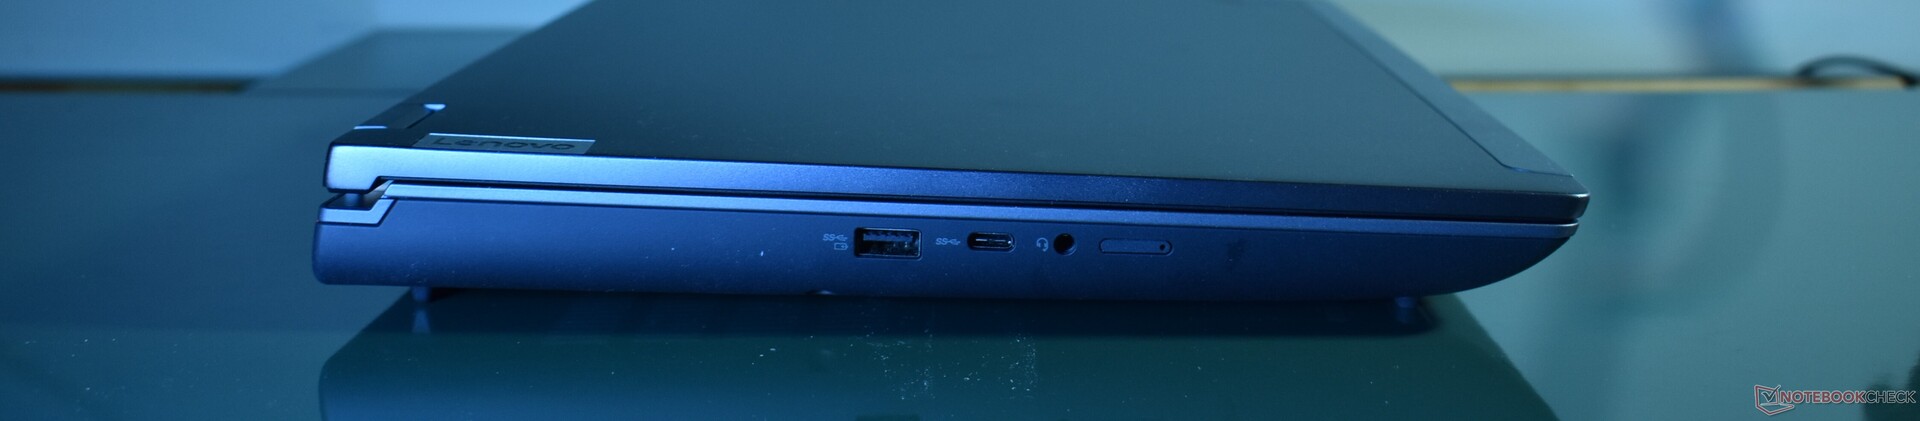
Connectivity: Plenty of ports on ThinkPad P16 G2
Port selection and placement remains identical to the preceding Lenovo ThinkPad P16 G1. Both are very good, with ports on all sides and both legacy ports and three USB C ports, two of which support Thunderbolt 4. One thing that we sorely miss is RJ45-Ethernet, a feature that ThinkPad workstations used to have with the ThinkPad P15 G2 and ThinkPad P17 G2 sporting 2.5 GBit Ethernet.
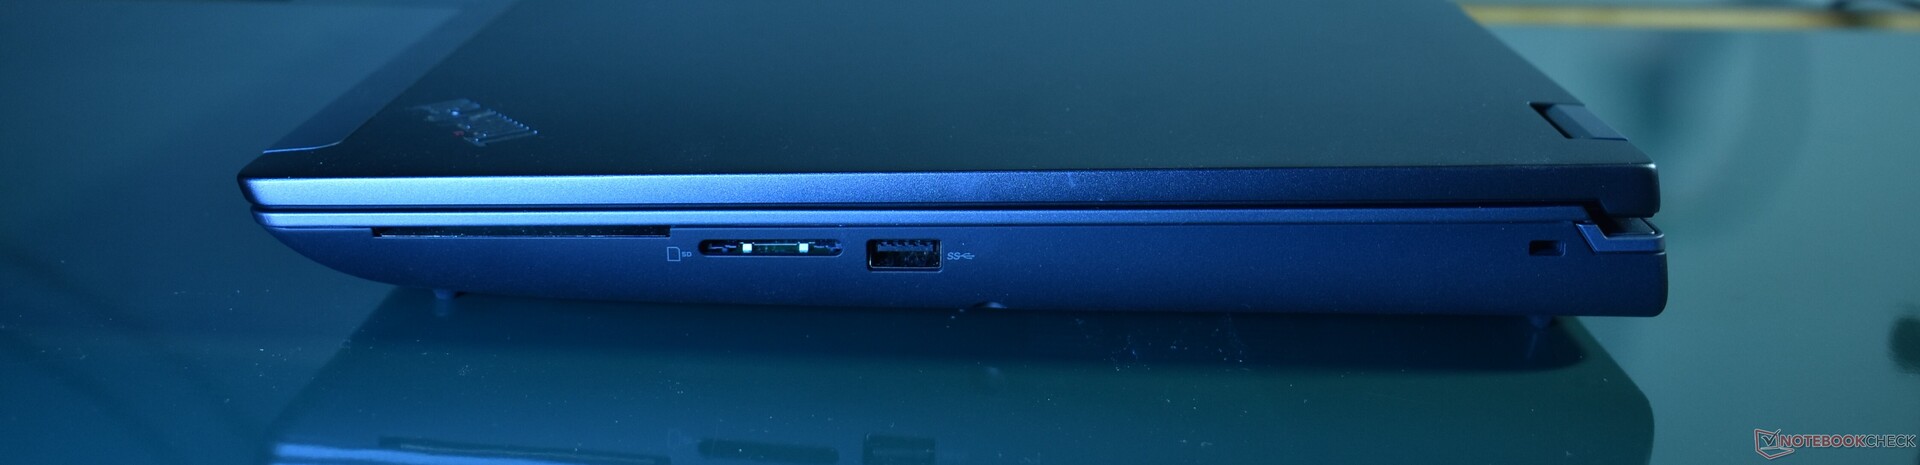
SD Card Reader
The full-sized SD card reader disappoints in our testing with the AV Pro microSD 128 GB V60 reference card. The transfer speeds are average to below average. Also, SD cards stick out.
| SD Card Reader | |
| average JPG Copy Test (av. of 3 runs) | |
| Average of class Workstation (49.6 - 681, n=14, last 2 years) | |
| HP ZBook Fury 16 G10 (Toshiba Exceria Pro SDXC 64 GB UHS-II) | |
| Lenovo ThinkPad P1 G6-21FV000DGE (Angelbird AV Pro V60) | |
| Lenovo ThinkPad P16v G1 AMD (Angelbird AV Pro V60) | |
| Lenovo ThinkPad P16 G1 21D6001DMB (AV Pro V60) | |
| Lenovo ThinkPad P16 G2 21FA000FGE | |
| maximum AS SSD Seq Read Test (1GB) | |
| Average of class Workstation (87.6 - 1455, n=14, last 2 years) | |
| Lenovo ThinkPad P16v G1 AMD (Angelbird AV Pro V60) | |
| HP ZBook Fury 16 G10 (Toshiba Exceria Pro SDXC 64 GB UHS-II) | |
| Lenovo ThinkPad P1 G6-21FV000DGE (Angelbird AV Pro V60) | |
| Lenovo ThinkPad P16 G2 21FA000FGE | |
| Lenovo ThinkPad P16 G1 21D6001DMB (AV Pro V60) | |
Communication
While the Intel AX211 WiFi card with integrated Bluetooth 5.3 delivers great transfer speeds when it comes to downloading data, uploading is much slower. There were no drops in speed and the connection was very stable.
WWAN in the form of 4G/LTE is available for the ThinkPad P16 G2, our review device was not equipped with it. It is however upgradable.
Webcam
The webcam is one area where it is apparent that the ThinkPad P16 Gen 2 is not among the newest ThinkPad designs. This model is limited to a 1080p webcam. The images are OK for video conferencing, but certainly worse than the 5 or 8 MPix cameras on some newer laptop models.


Security
As an enterprise device, the Lenovo ThinkPad P16 G2 has a plethora of security options. For starters, it has a dedicated TPM 2.0 security chip. On the outside, there is a Smartcard reader, which is very useful for big corporations. The ThinkPad workstation has a Kensington lock slot for theft-protection, and a Fingerprint reader as well as a Infrared camera for secure log-in with Windows Hello.
Accessories
Apart from the 170 W charger with the proprietary Slim tip plug, there are no accessories in the box.
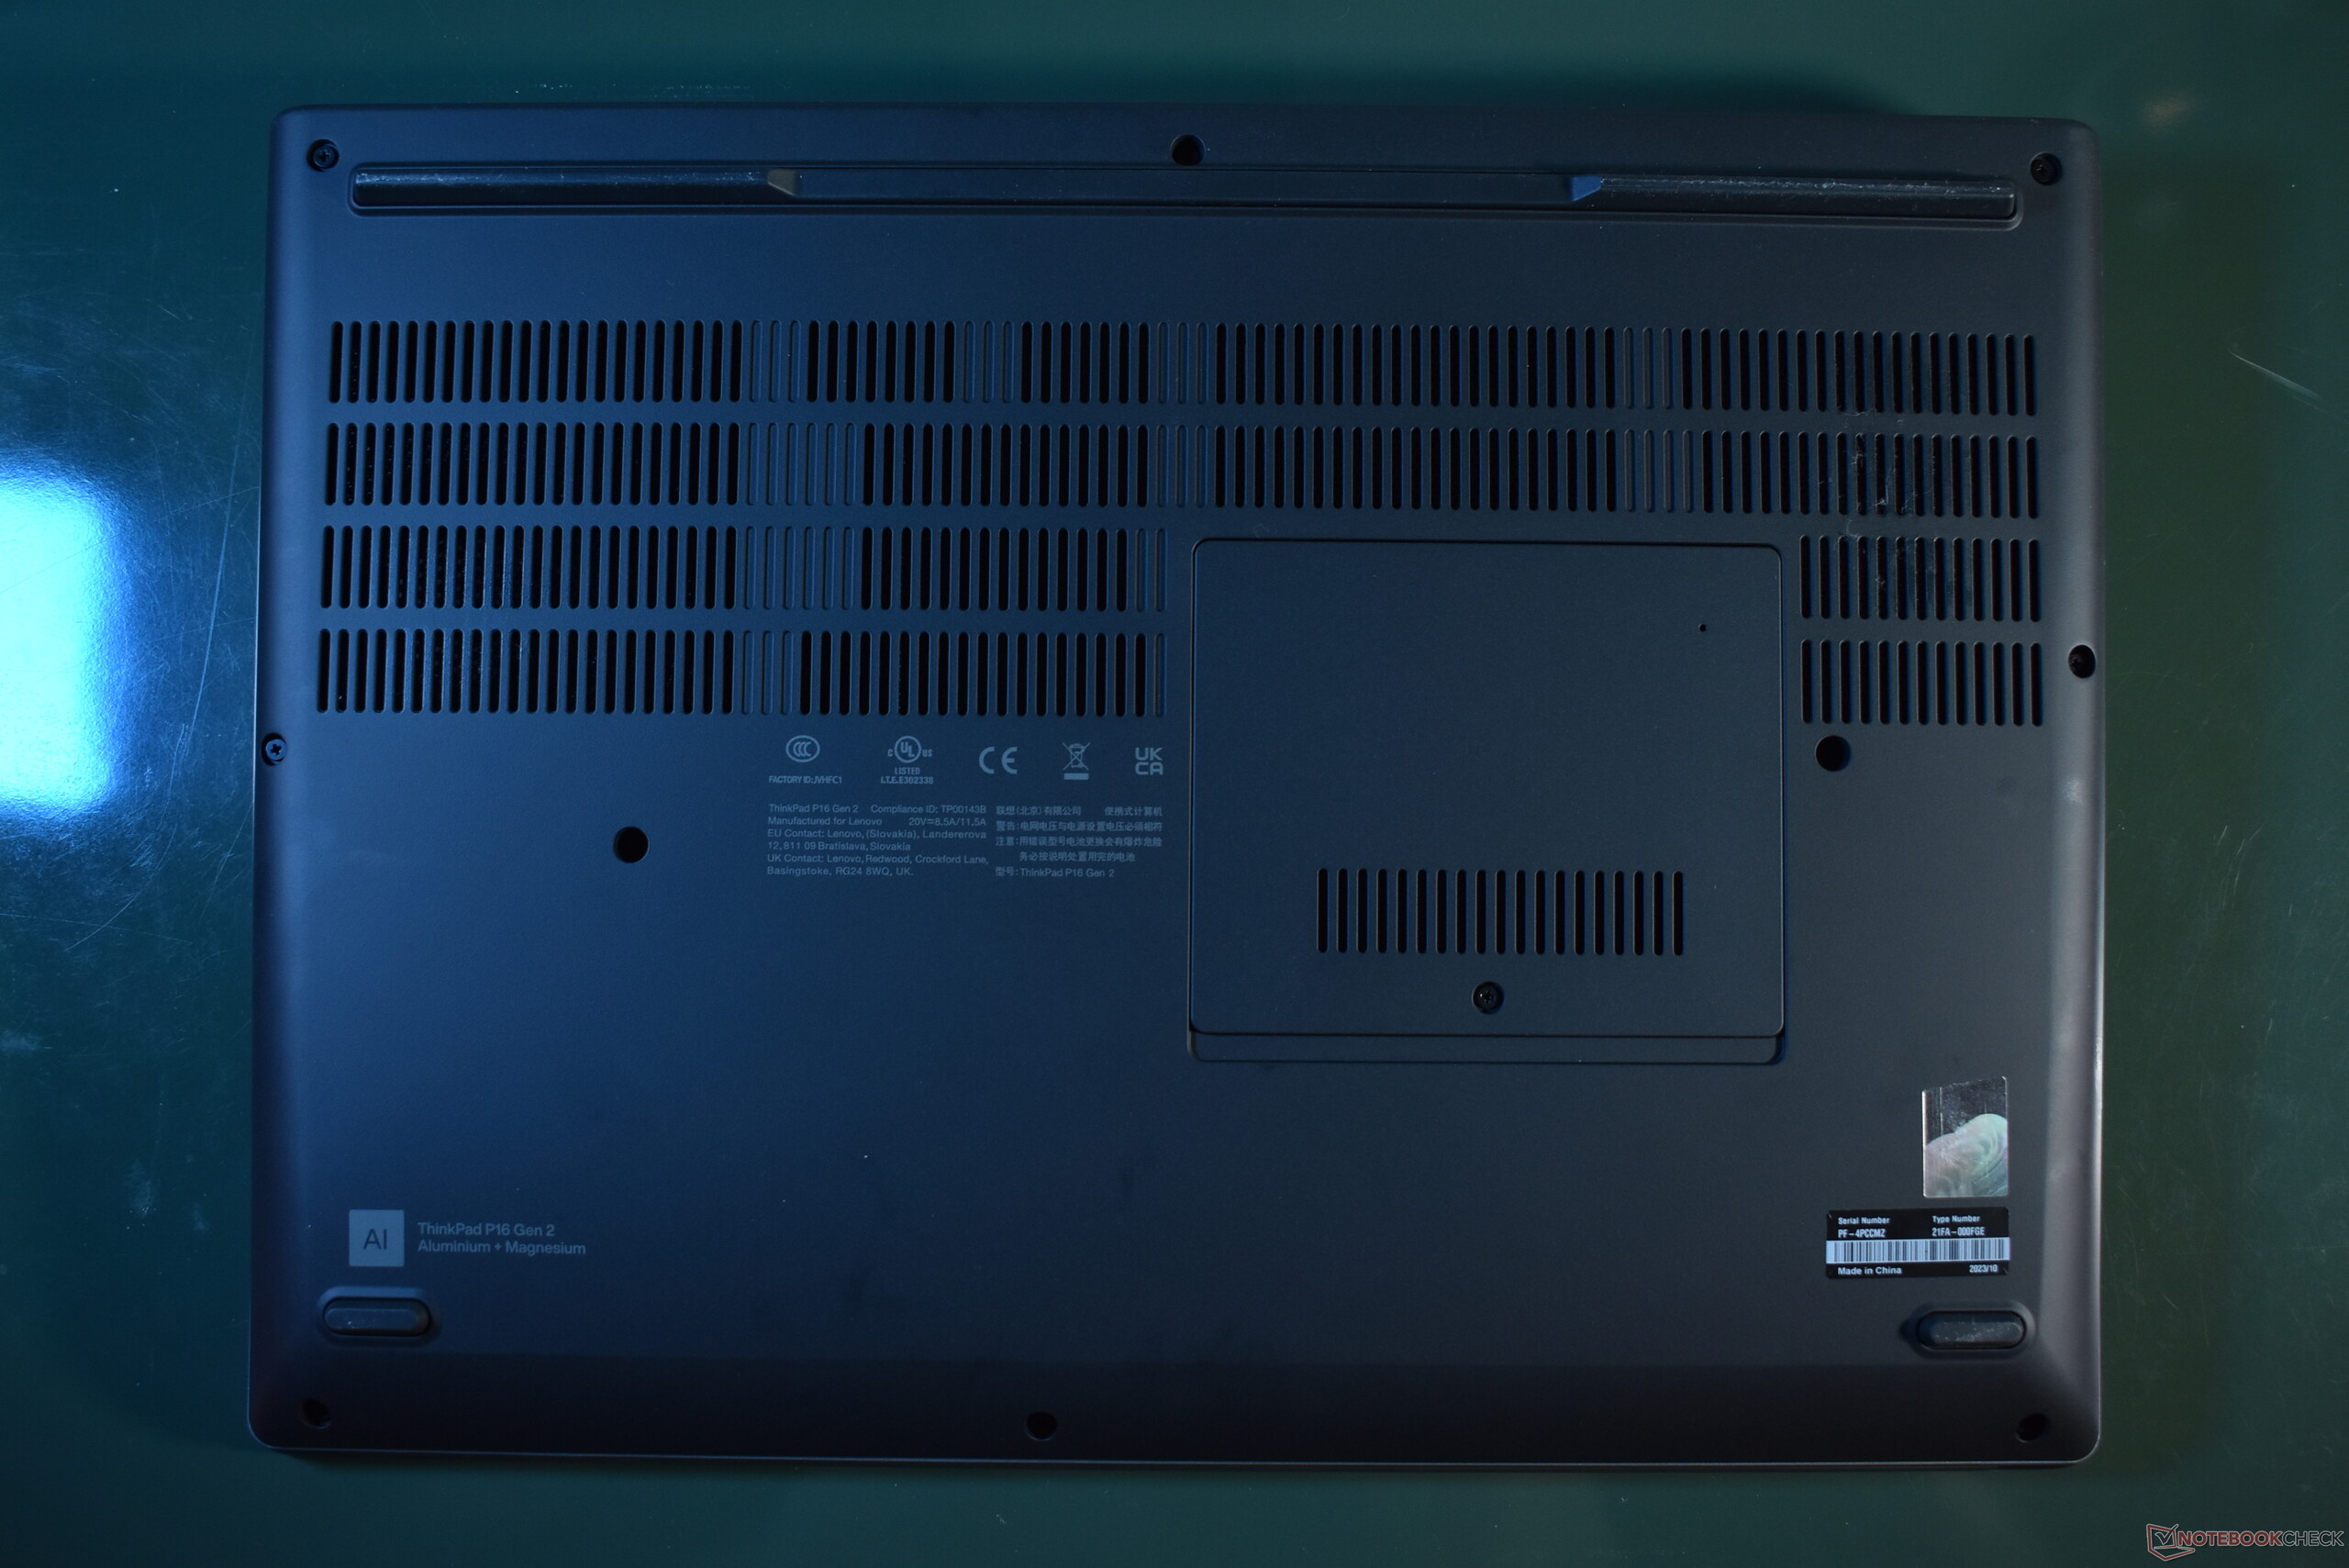
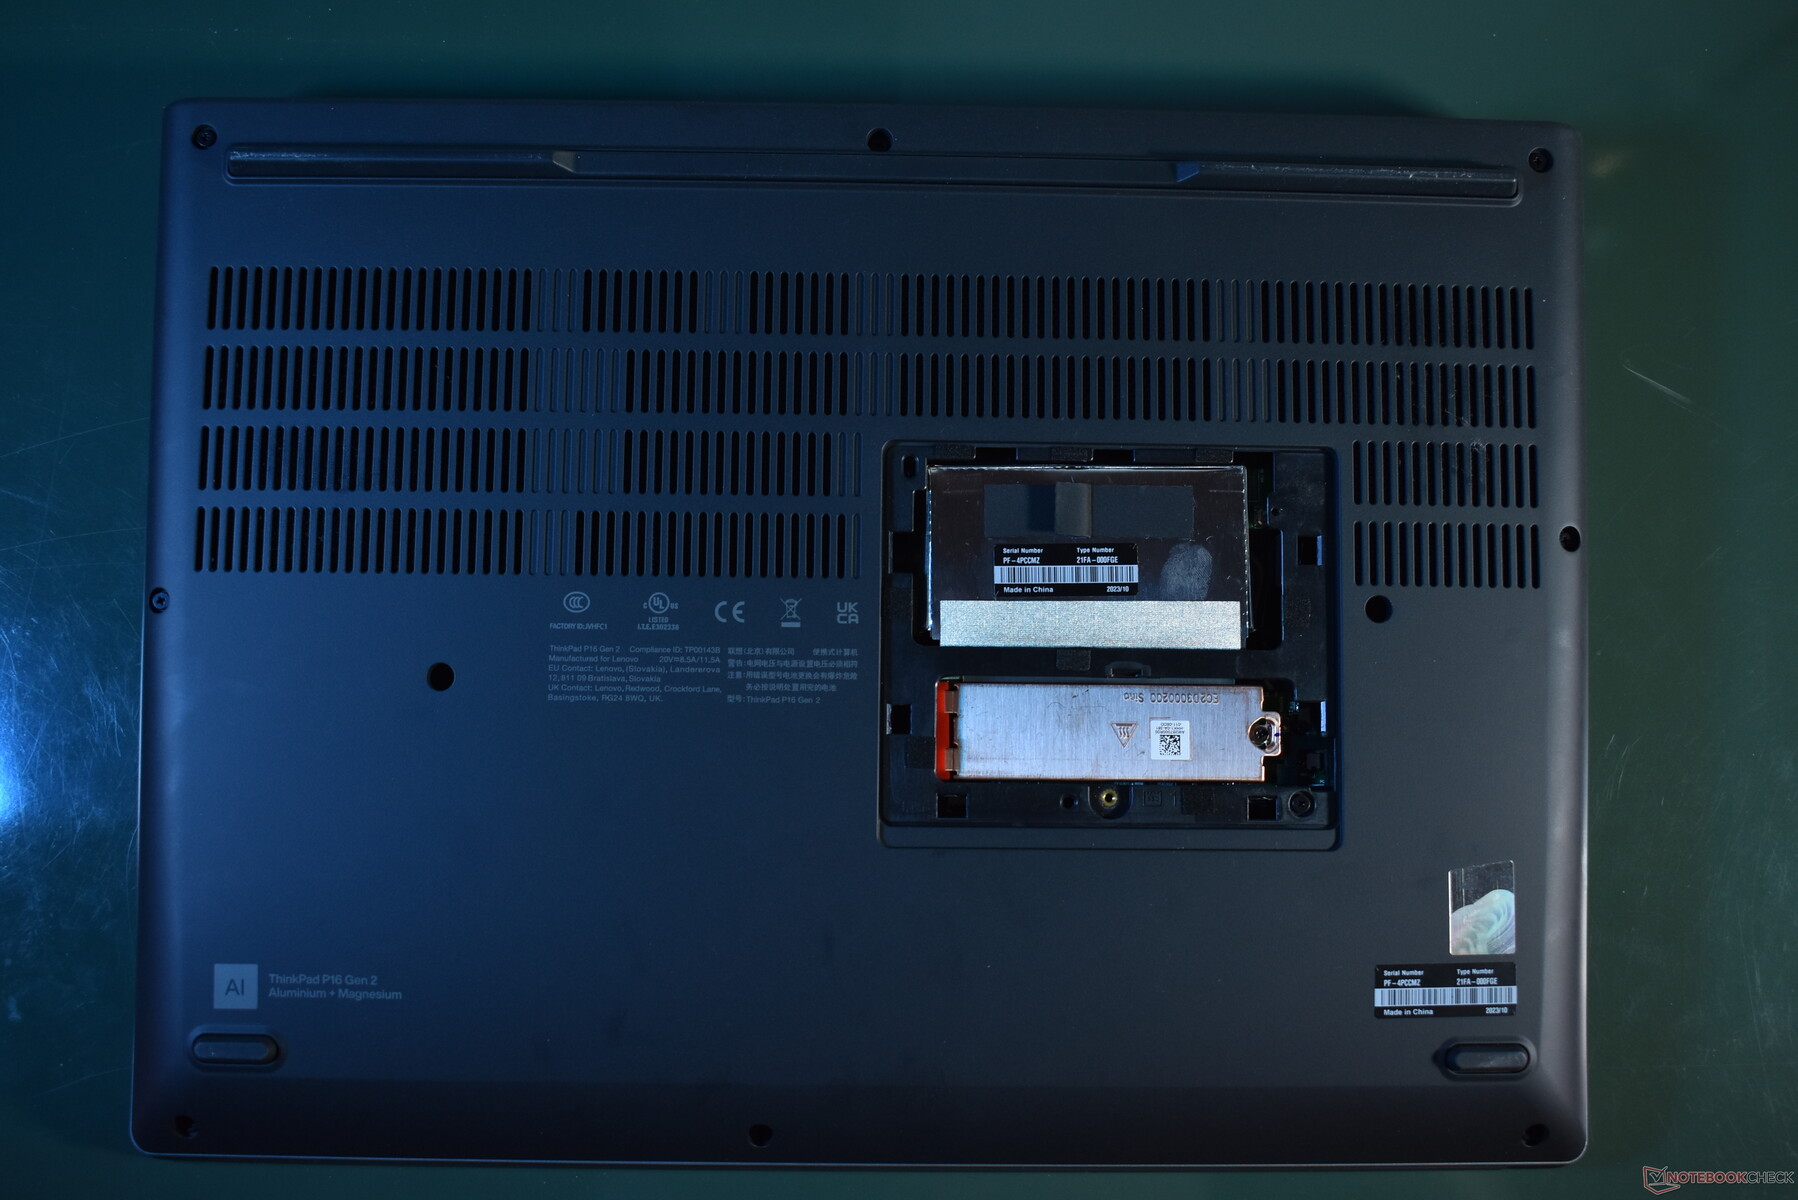
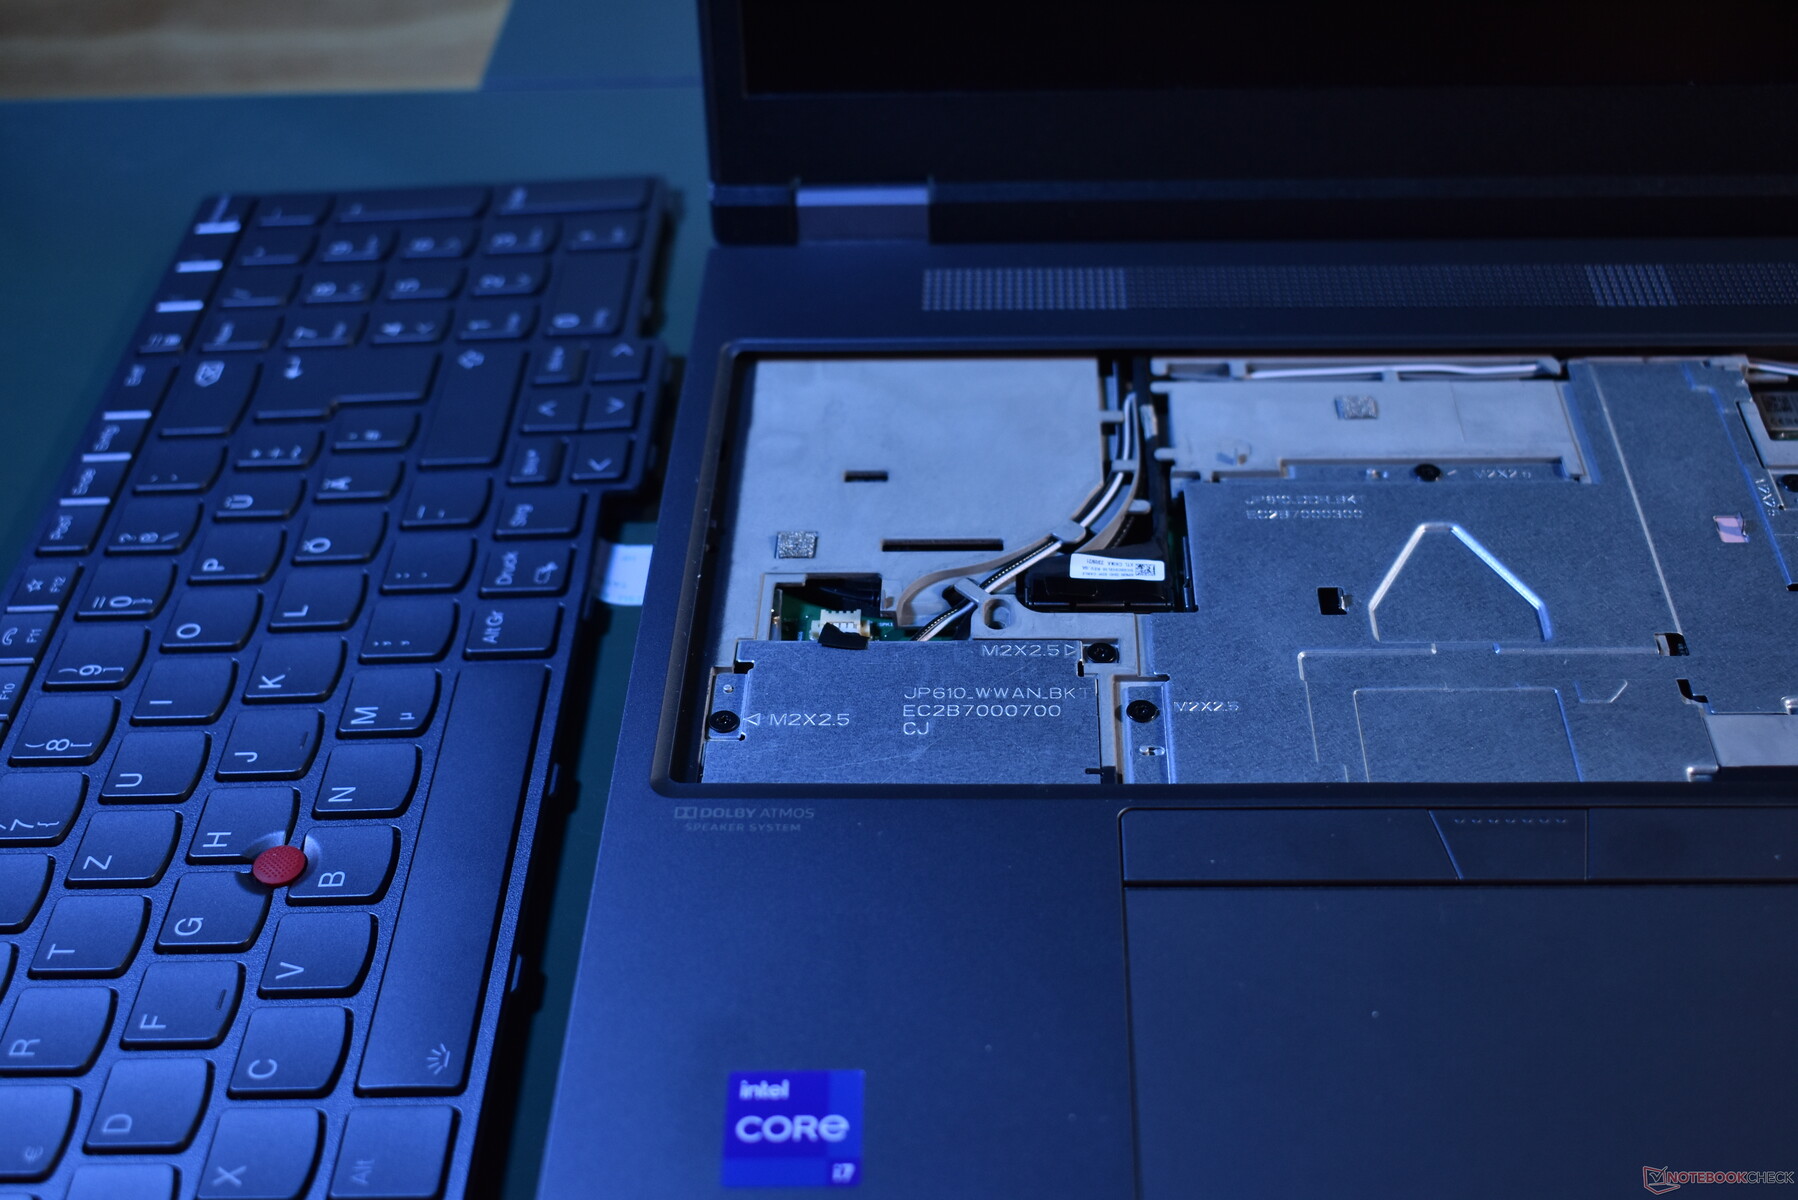
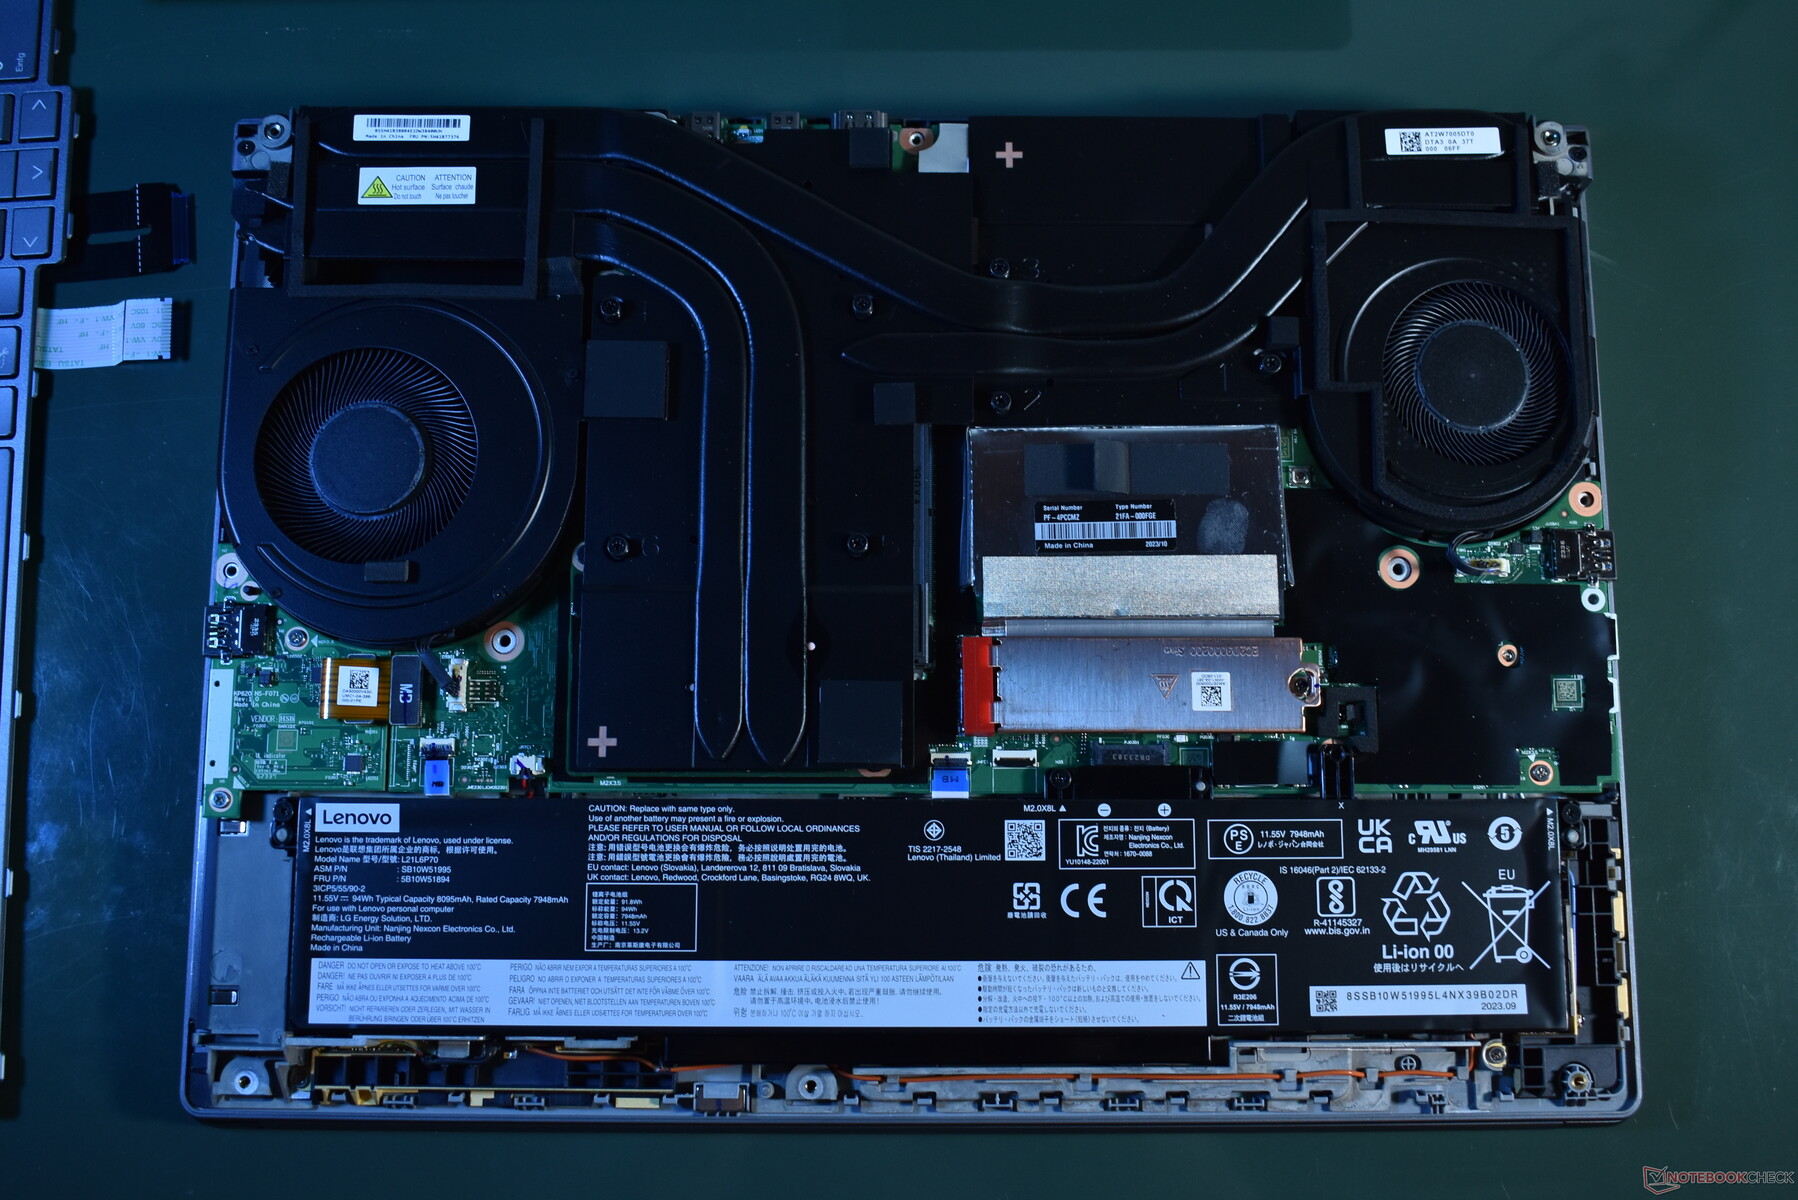
Maintenance
Maintenance works pretty much the same way as it did for the ThinkPad P16 G1: Half of the RAM slots and one of the SSD bays are located beneath the small bottom service door. The rest is beneath the user replaceable keyboard, where the open M.2 slot for the optional WWAN card is also located. Both steps are easy, and a removable keyboard is not something most laptops have these days, even in the workstation sector. Accessing the cooling system and the internal battery is a more involved affair, as the entire bottom cover has to be removed, which is secured by many screws. But this is also doable.
Lenovo provides a repair manual called the Hardware Maintenance Manual to guide the users through the repair process.
Warranty
This German unit of the Lenovo ThinkPad P16 G2 that we review has a warranty of 36 months with included on-site service and Premier support. The battery has a warranty of 12 months. Internationally, this device gets 36 months of warranty, but without on-site and only bring-in service.
Input Devices: Traditional strength of Lenovo's ThinkPad series
Keyboard
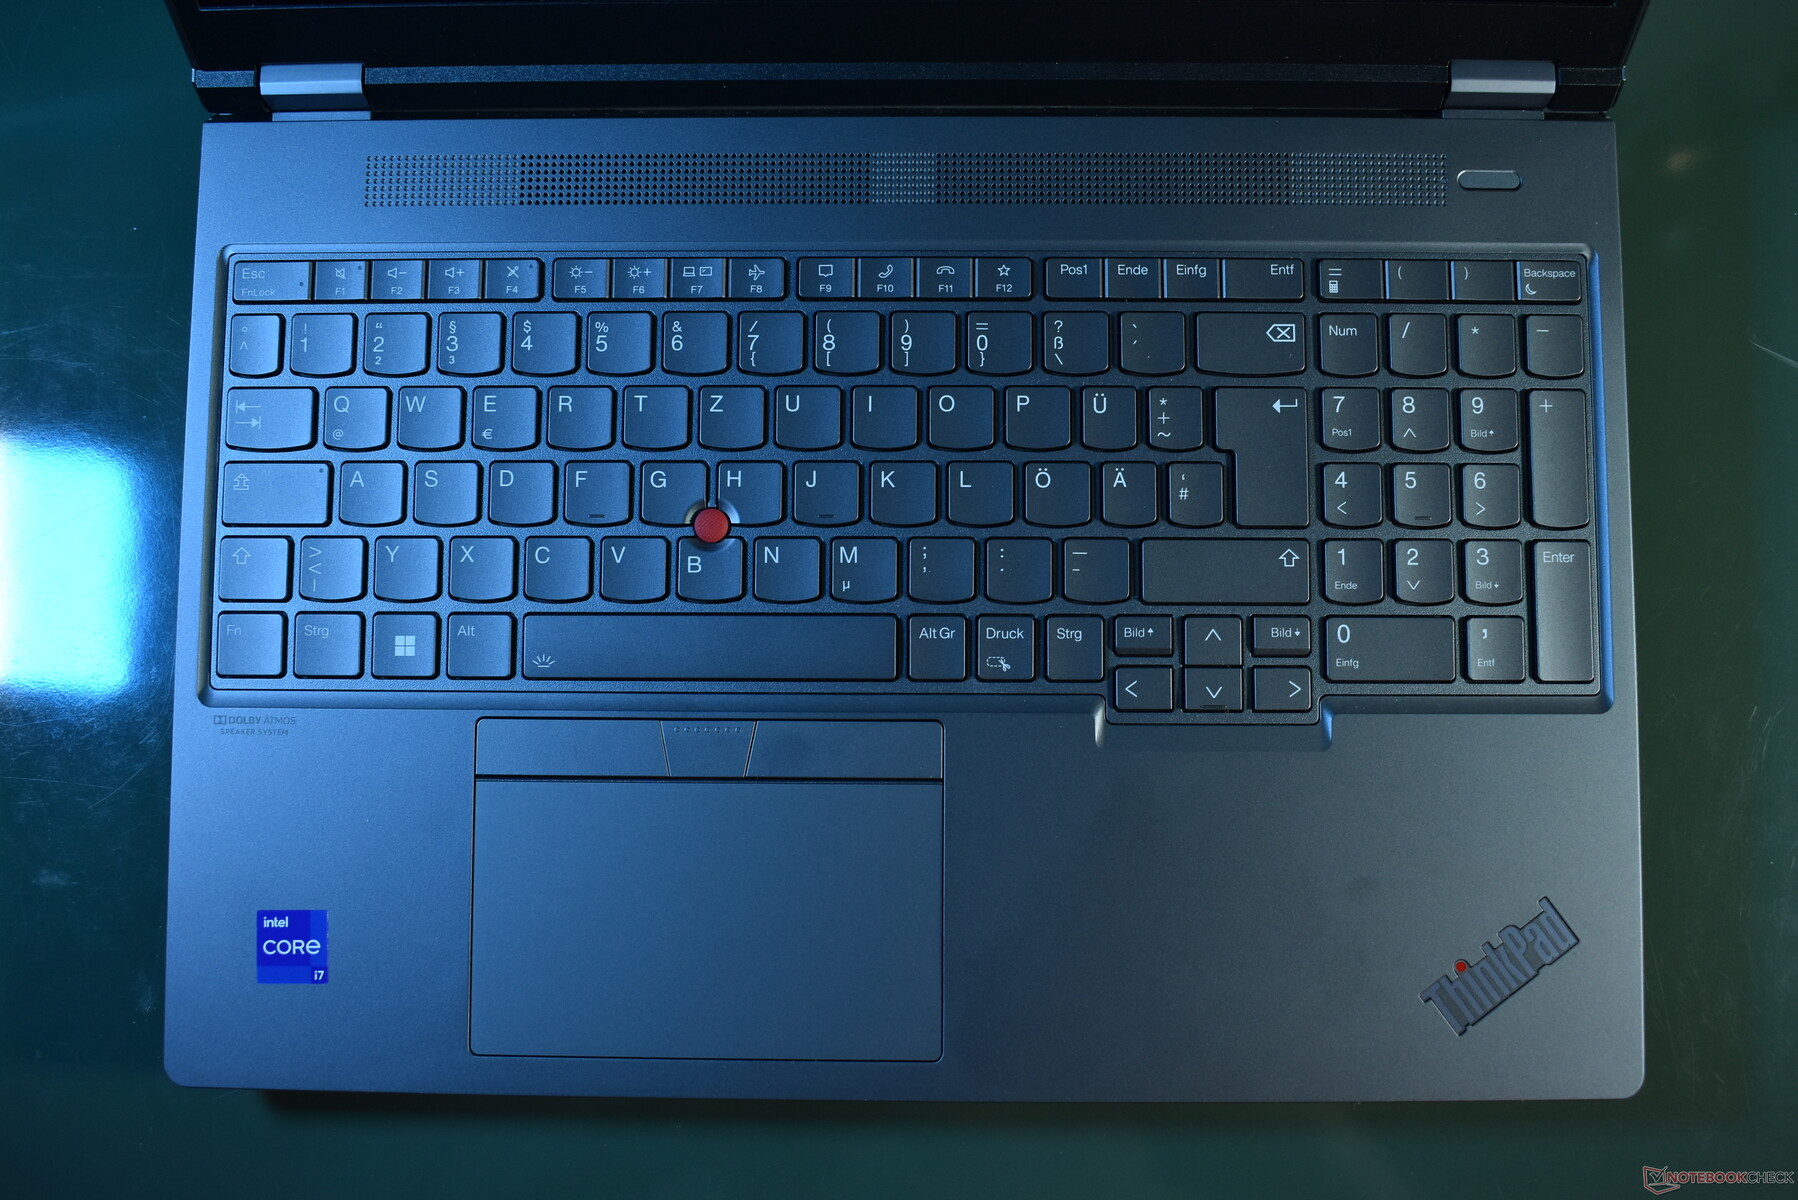
The grey, subtly sculpted ThinkPad keys with 1.5 mm of key travel offer a great typing experience. Typing on this keyboard feels both precise and smooth, while the keyboard also offers a nice resistance. The keys are backlit with two levels of brightness for the blue-white LEDs.
In terms of the keyboard layout, the ThinkPad P16 G2 has the same familiar layout as the other 16 inch ThinkPads. It includes a dedicated numblock at the right side, which does mean that the overall keyboard is shifted to the left. Of course, if you need a numpad, this is a wothwhile sacrifice. As usual with ThinkPad laptops, the layout is very good, with grouped F keys and dedicated navigation buttons.
Touchpad
The smooth plastic touchpad has the same size as on the preceding ThinkPad P16. Its a traditional mechanical clickpad that can only be pressed in the lower half of the touchpad-area. It works well, with the click having a high-quality feel to it and the surface allowing for smooth finger gliding - we do wonder though why Lenovo feels the need to save money by going to a plastic surface instead of higher quality glass. Certainly, on such an expensive machine, this should not be a budget problem for the customers that Lenovo targets.
In addition to the touchpad, the Lenovo ThinkPad P16 Gen 2 of course also sports the red TrackPoint pointing-stick. The staple of the ThinkPad brand can be used to control the mouse and works very precisely and can beat the touchpad in certain tasks - usage with gloves, using the laptop in tight spaces like airplanes or trains as well as simple drag and drop operations. The dedicated, flat TrackPoint buttons above the touchpad are to be used with the pointing stick, with the middle mouse key for scrolling.


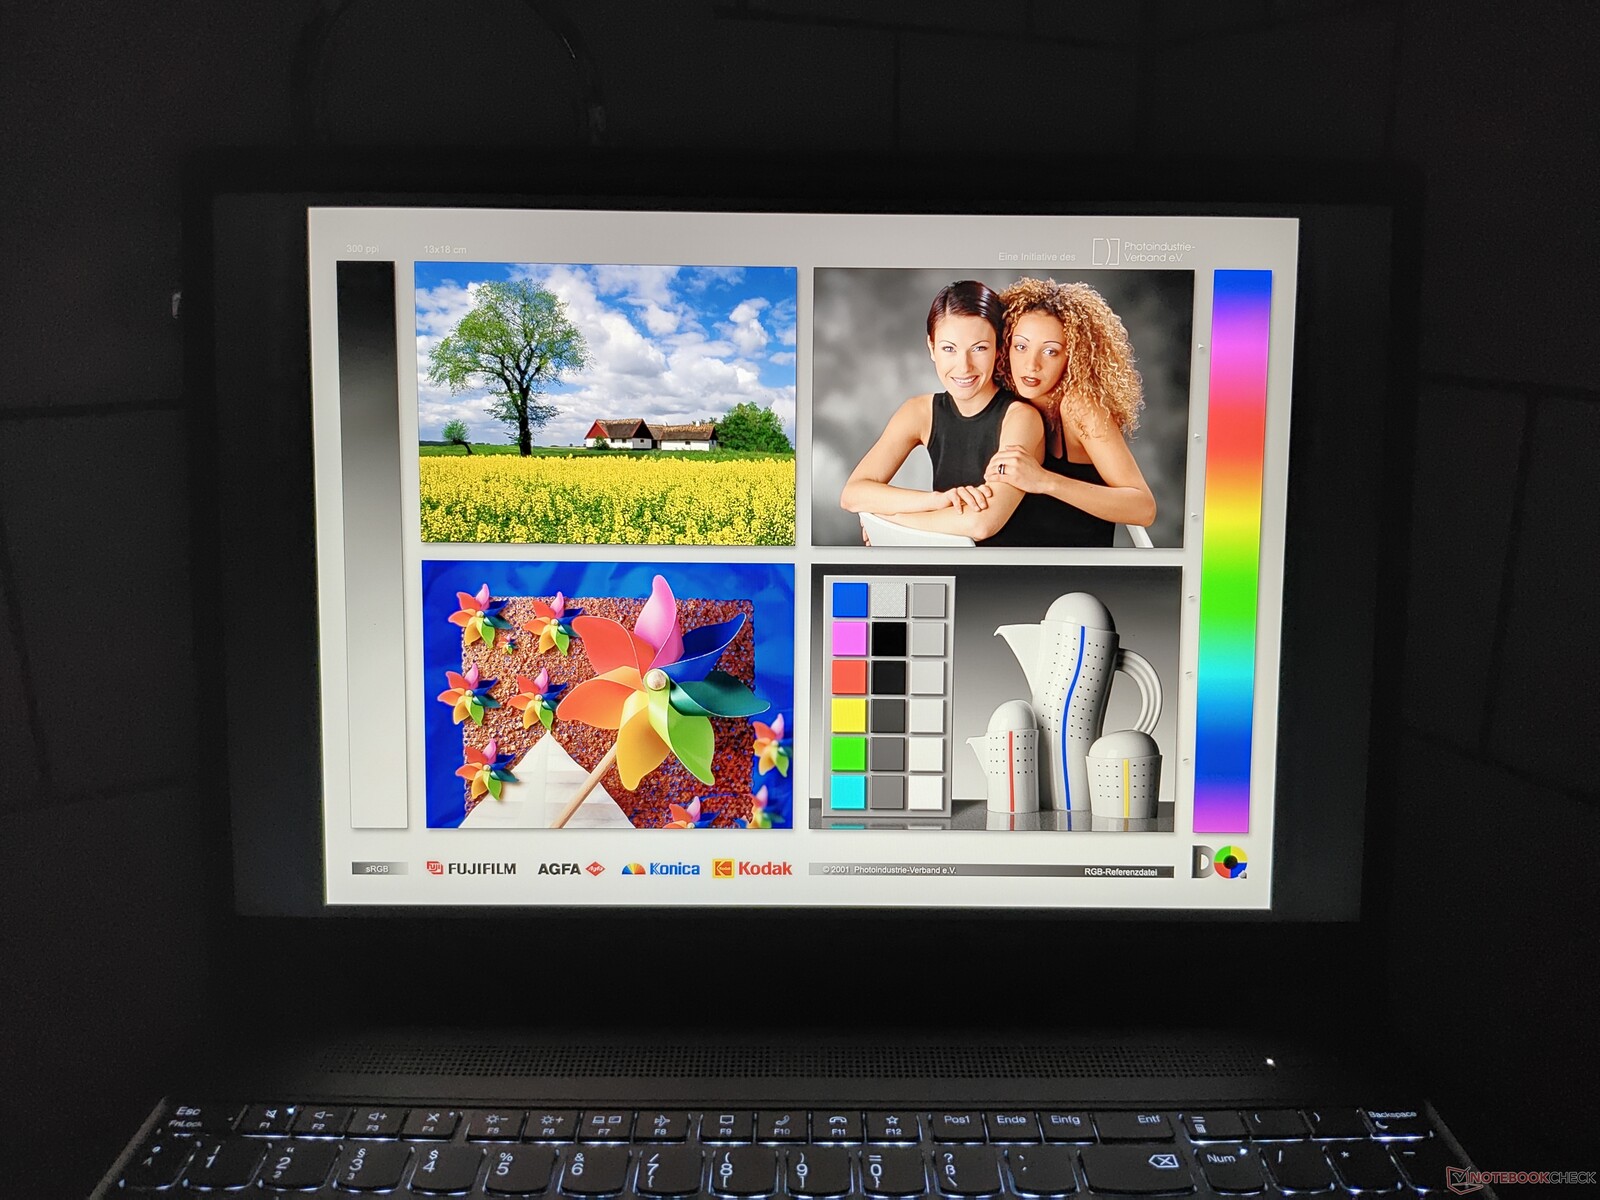
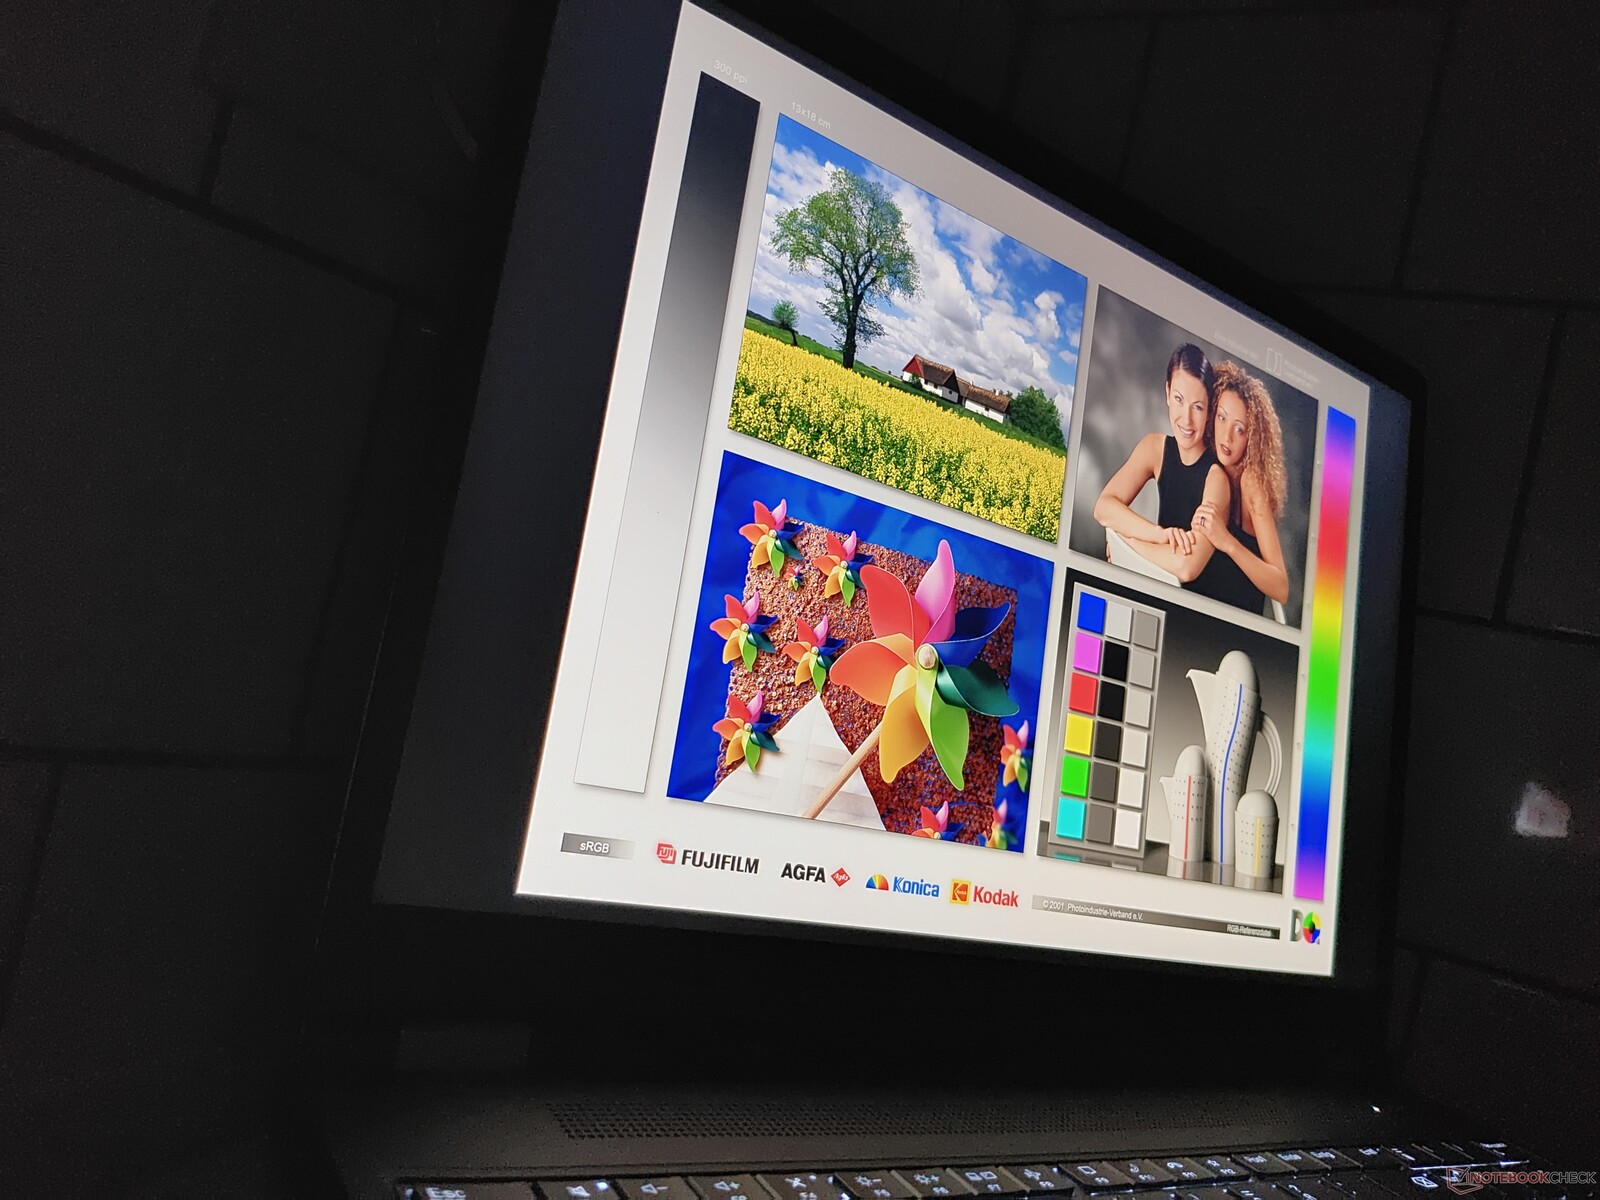
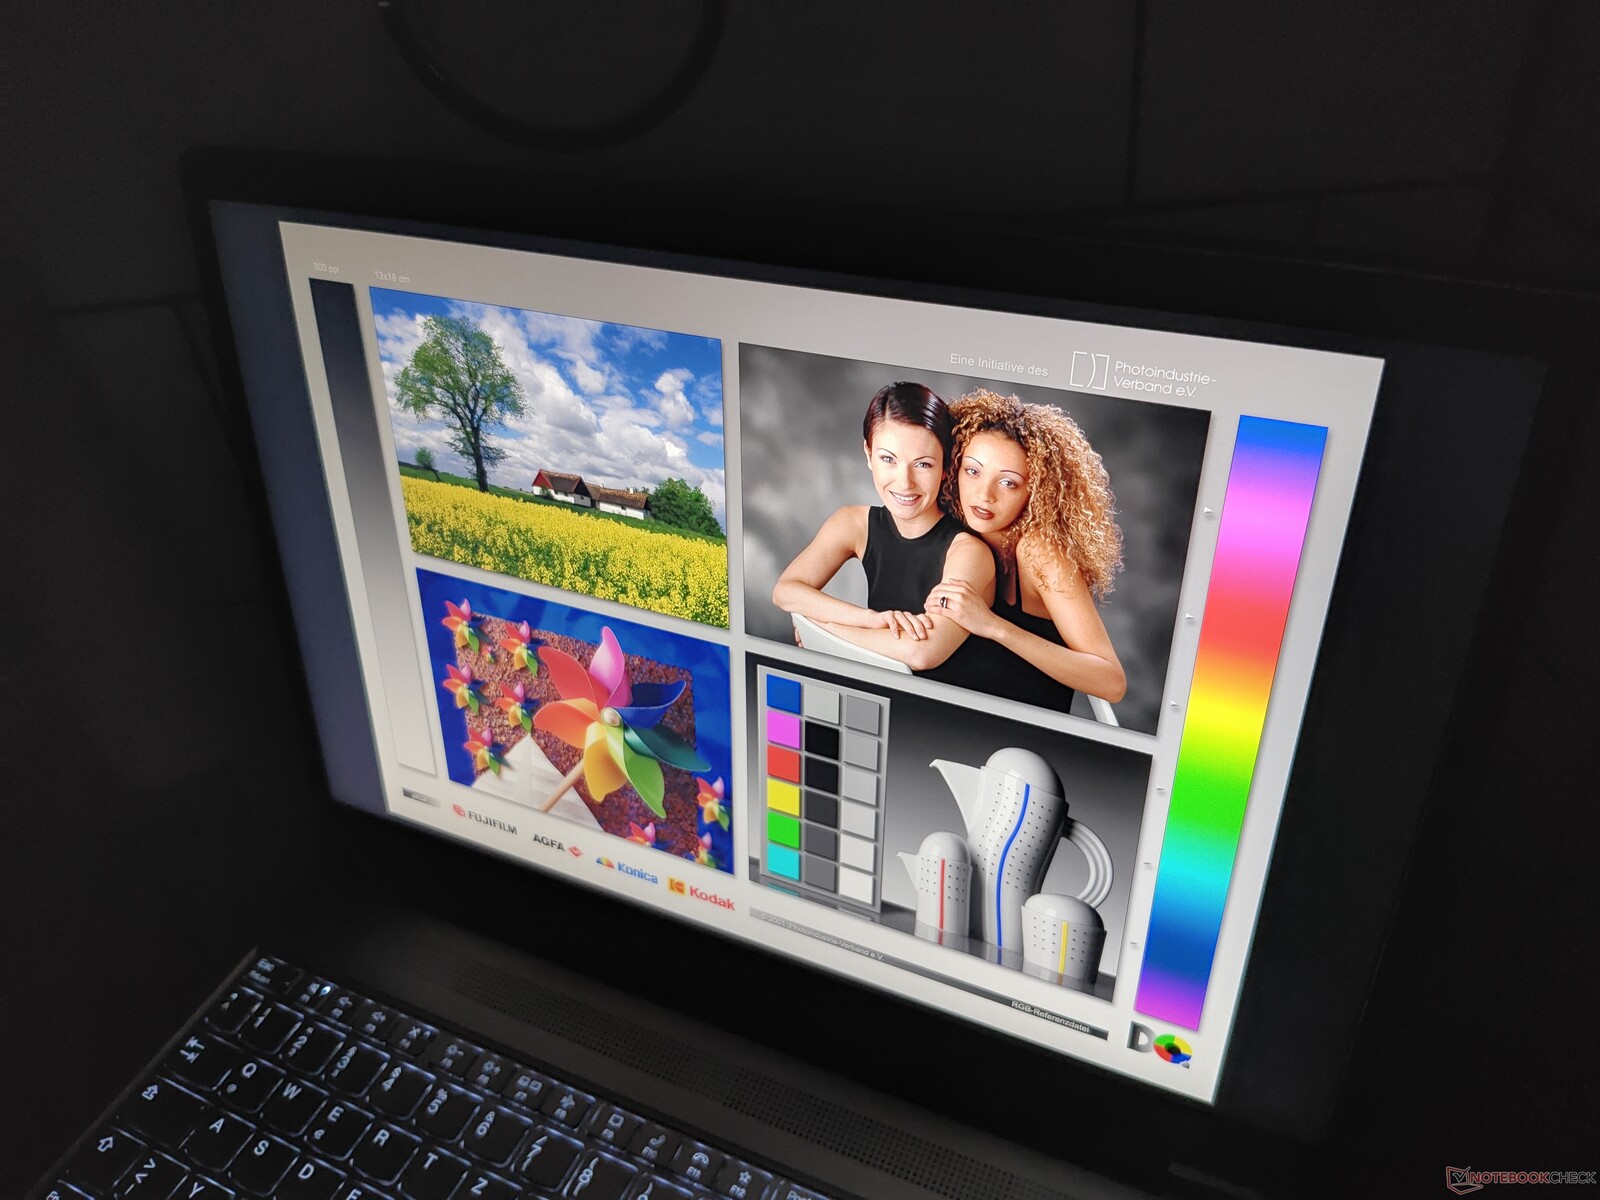
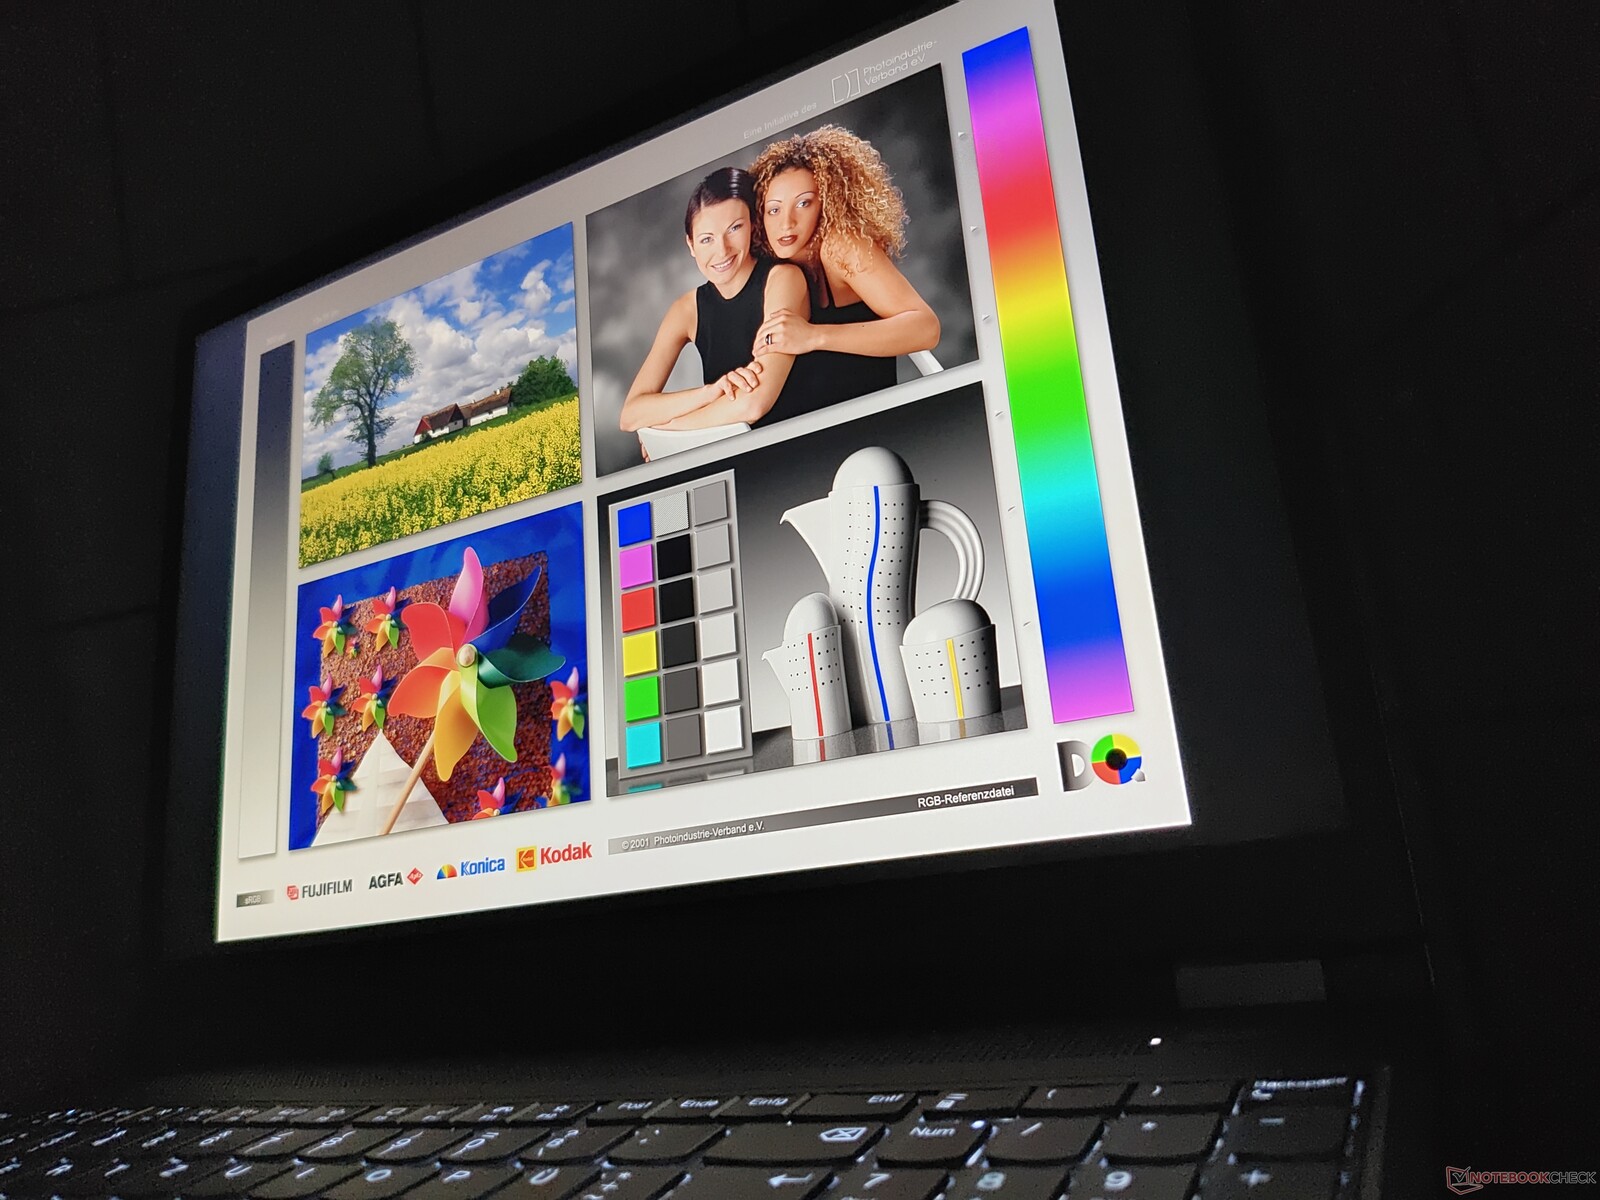
Display: WQXGA screen is now faster
As usual for ThinkPads, Lenovo offers a number of different screen options for the P16 G2. All of them are 16 inch 16:10 panels:
- WUXGA (1,920 x 1,200), IPS, 300 cd/m², 100 % sRGB, matte
- WUXGA (1,920 x 1,200), IPS, 400 cd/m², 100 % sRGB, matte
- 2.5K/WQXGA (2,560 x 1,600), IPS, 500 cd/m², 100 % sRGB, matte, 165 Hz
- 4K/WQUXGA (3,840 x 2,400), IPS, 800 cd/m², 100 % DCI-P3, matte, HDR
- 4K/WQUXGA (3,840 x 2,400), OLED, 400 cd/m², 100 % DCI-P3, semi-glossy, HDR, multi-touch, digitizer pen
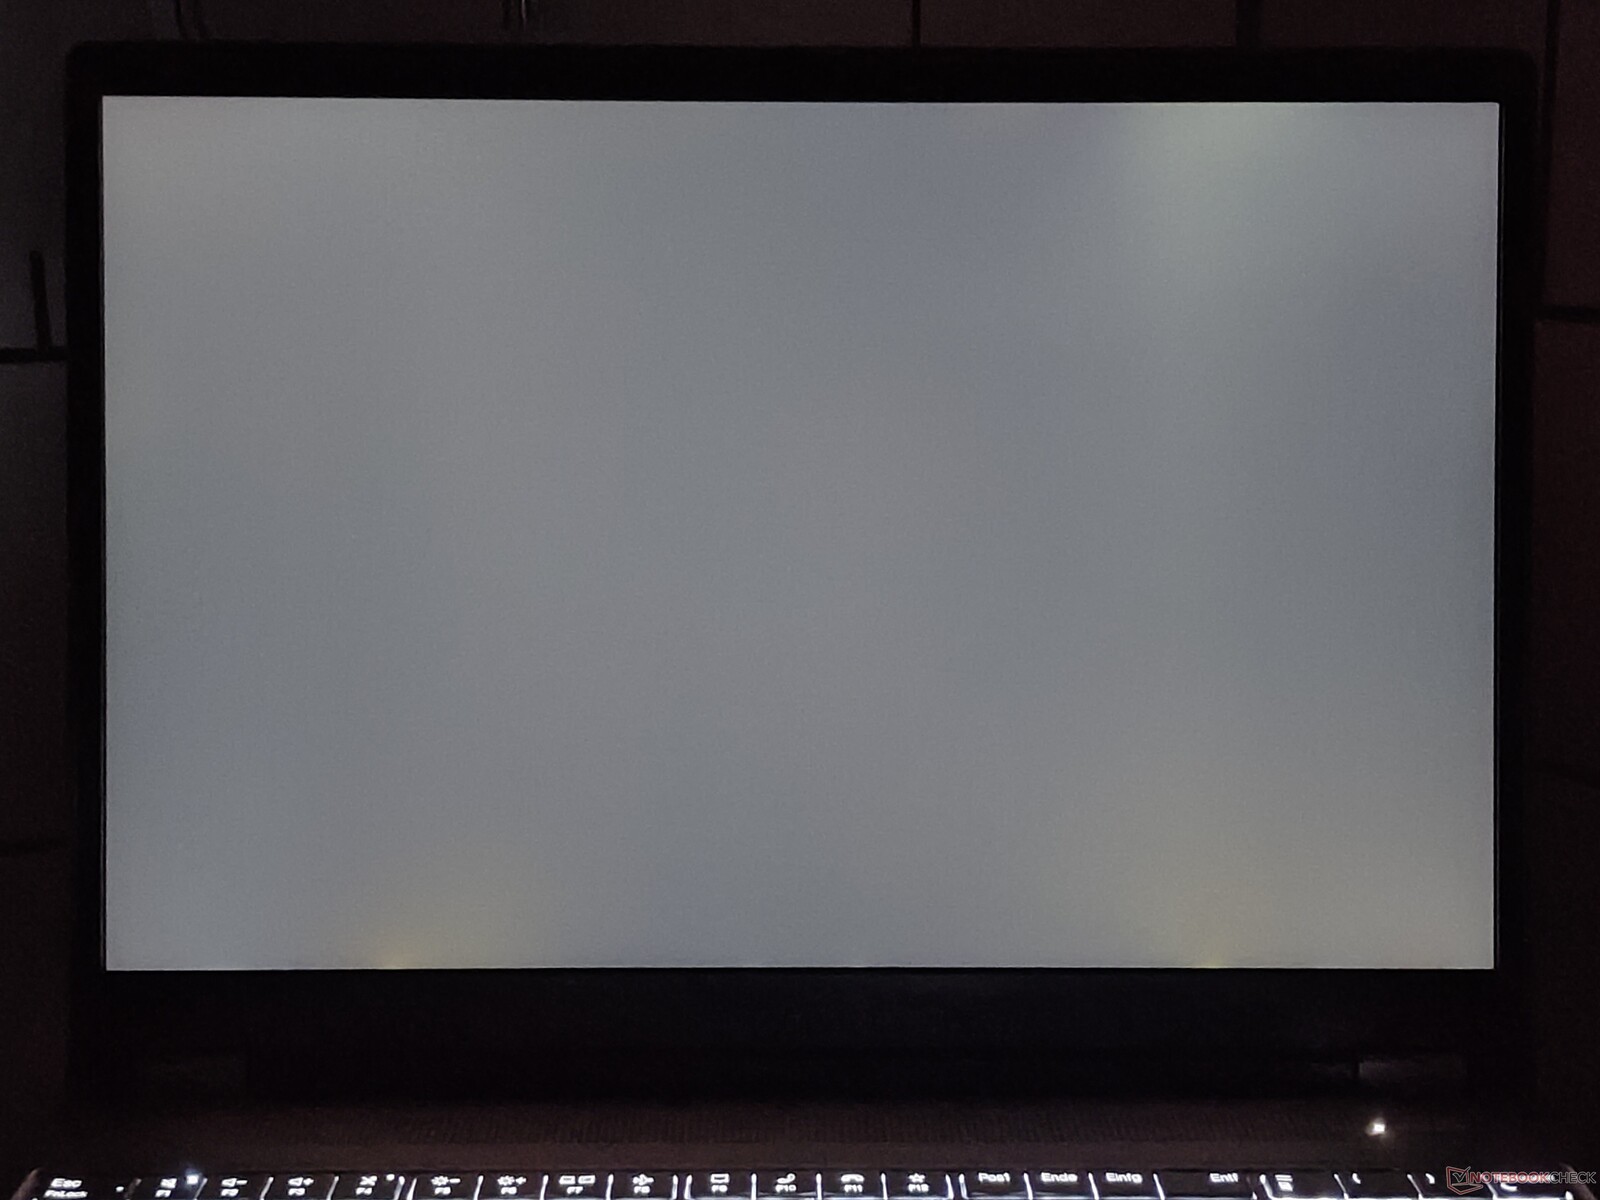
The screen we have in our review device is probably going to be the most popular screen choice for consumers, should they buy the ThinkPad P16 G2 - except for photographers, who may need the the wide color gamut of the 4K screens. The screen delivers the promised 500 cd/m², the average maximum brightness sits at 510 cd/m². This makes the screen competitive even with the WQUXGA screen of the HP ZBook Fury 16 G10. It certainly is much brighter than the WQHD display of the HP ZBook Power 15 G10.
This panel is fairly fast for an IPS screen. While the response times can not compete with OLED screens, they are better than many other IPS panels. Of course, the fast refresh rate of 165 Hz helps. This screen is certainly usable for gaming and other applications that benefit from a fast refresh rate.
| |||||||||||||||||||||||||
Brightness Distribution: 89 %
Center on Battery: 510 cd/m²
Contrast: 1378:1 (Black: 0.37 cd/m²)
ΔE ColorChecker Calman: 2.6 | ∀{0.5-29.43 Ø4.71}
calibrated: 2.3
ΔE Greyscale Calman: 3.6 | ∀{0.09-98 Ø4.96}
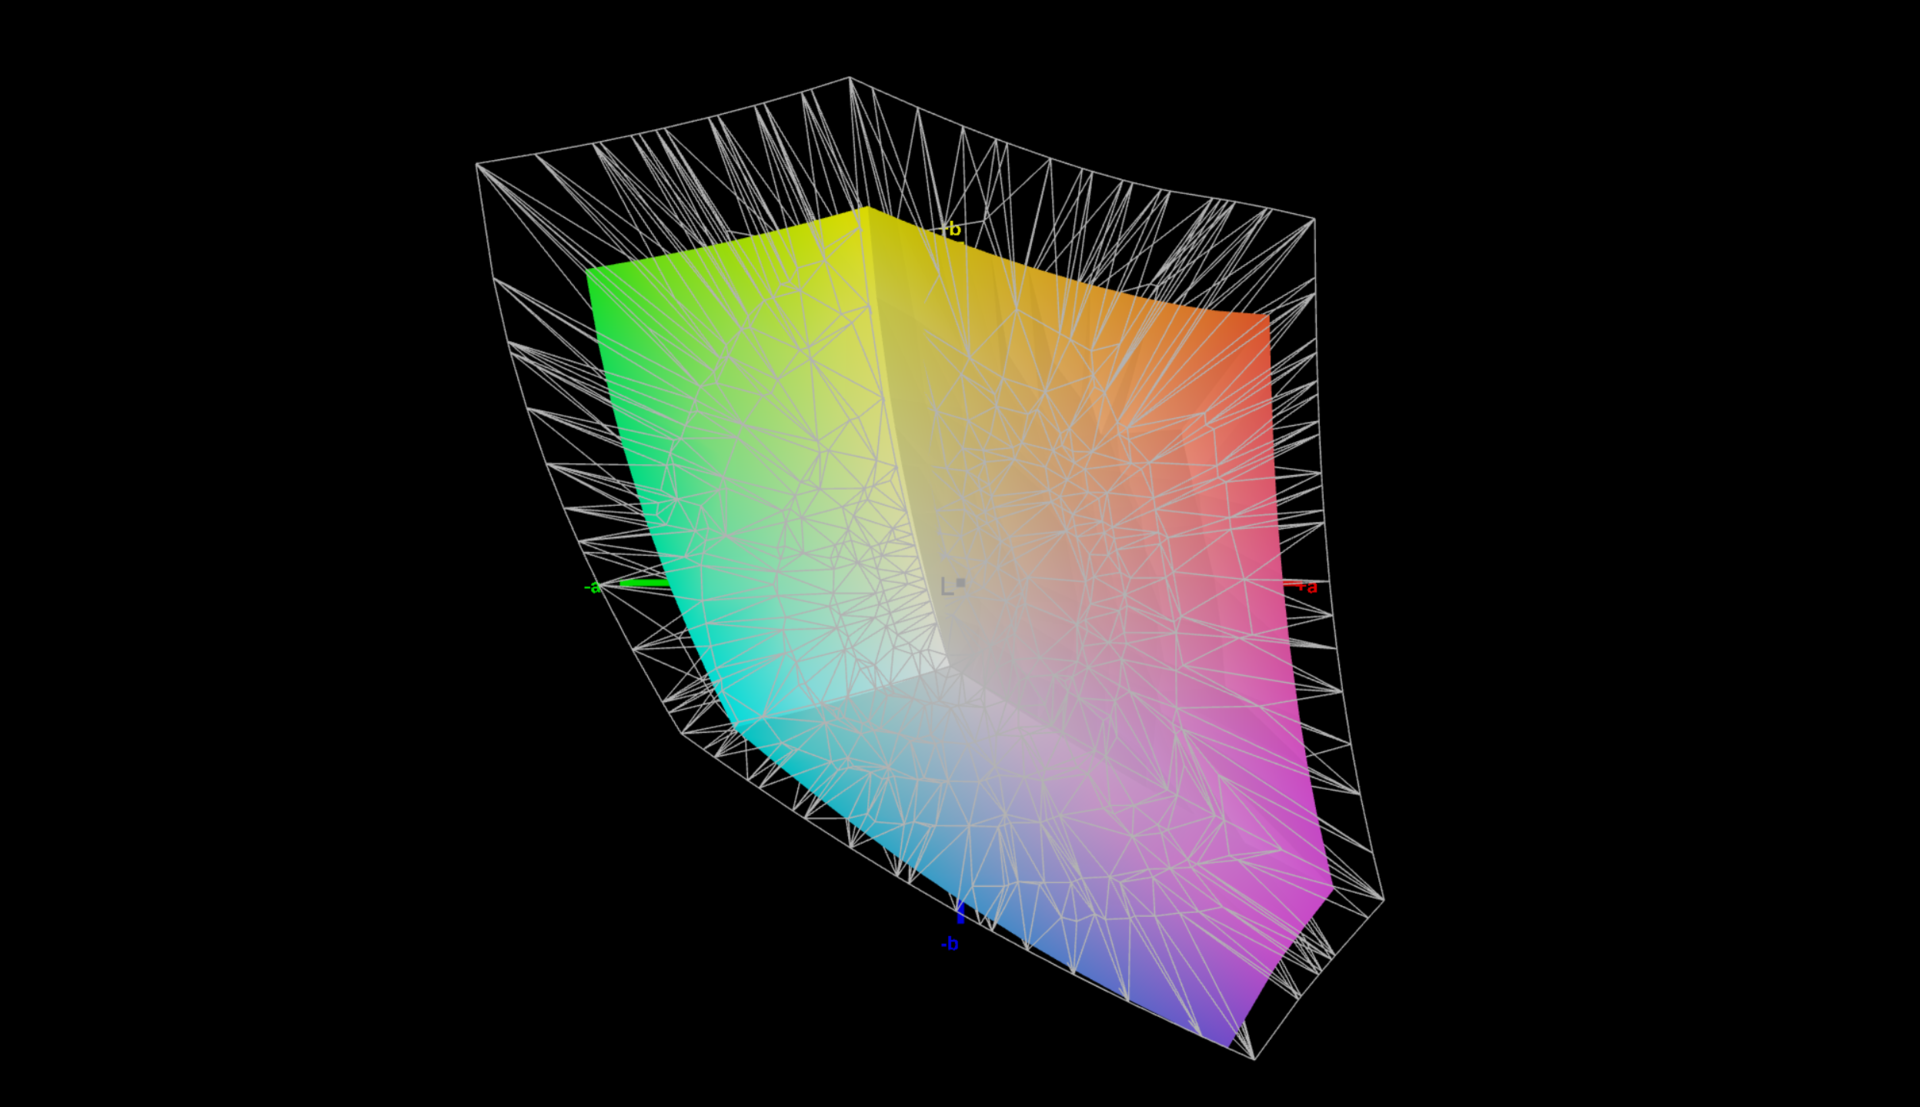
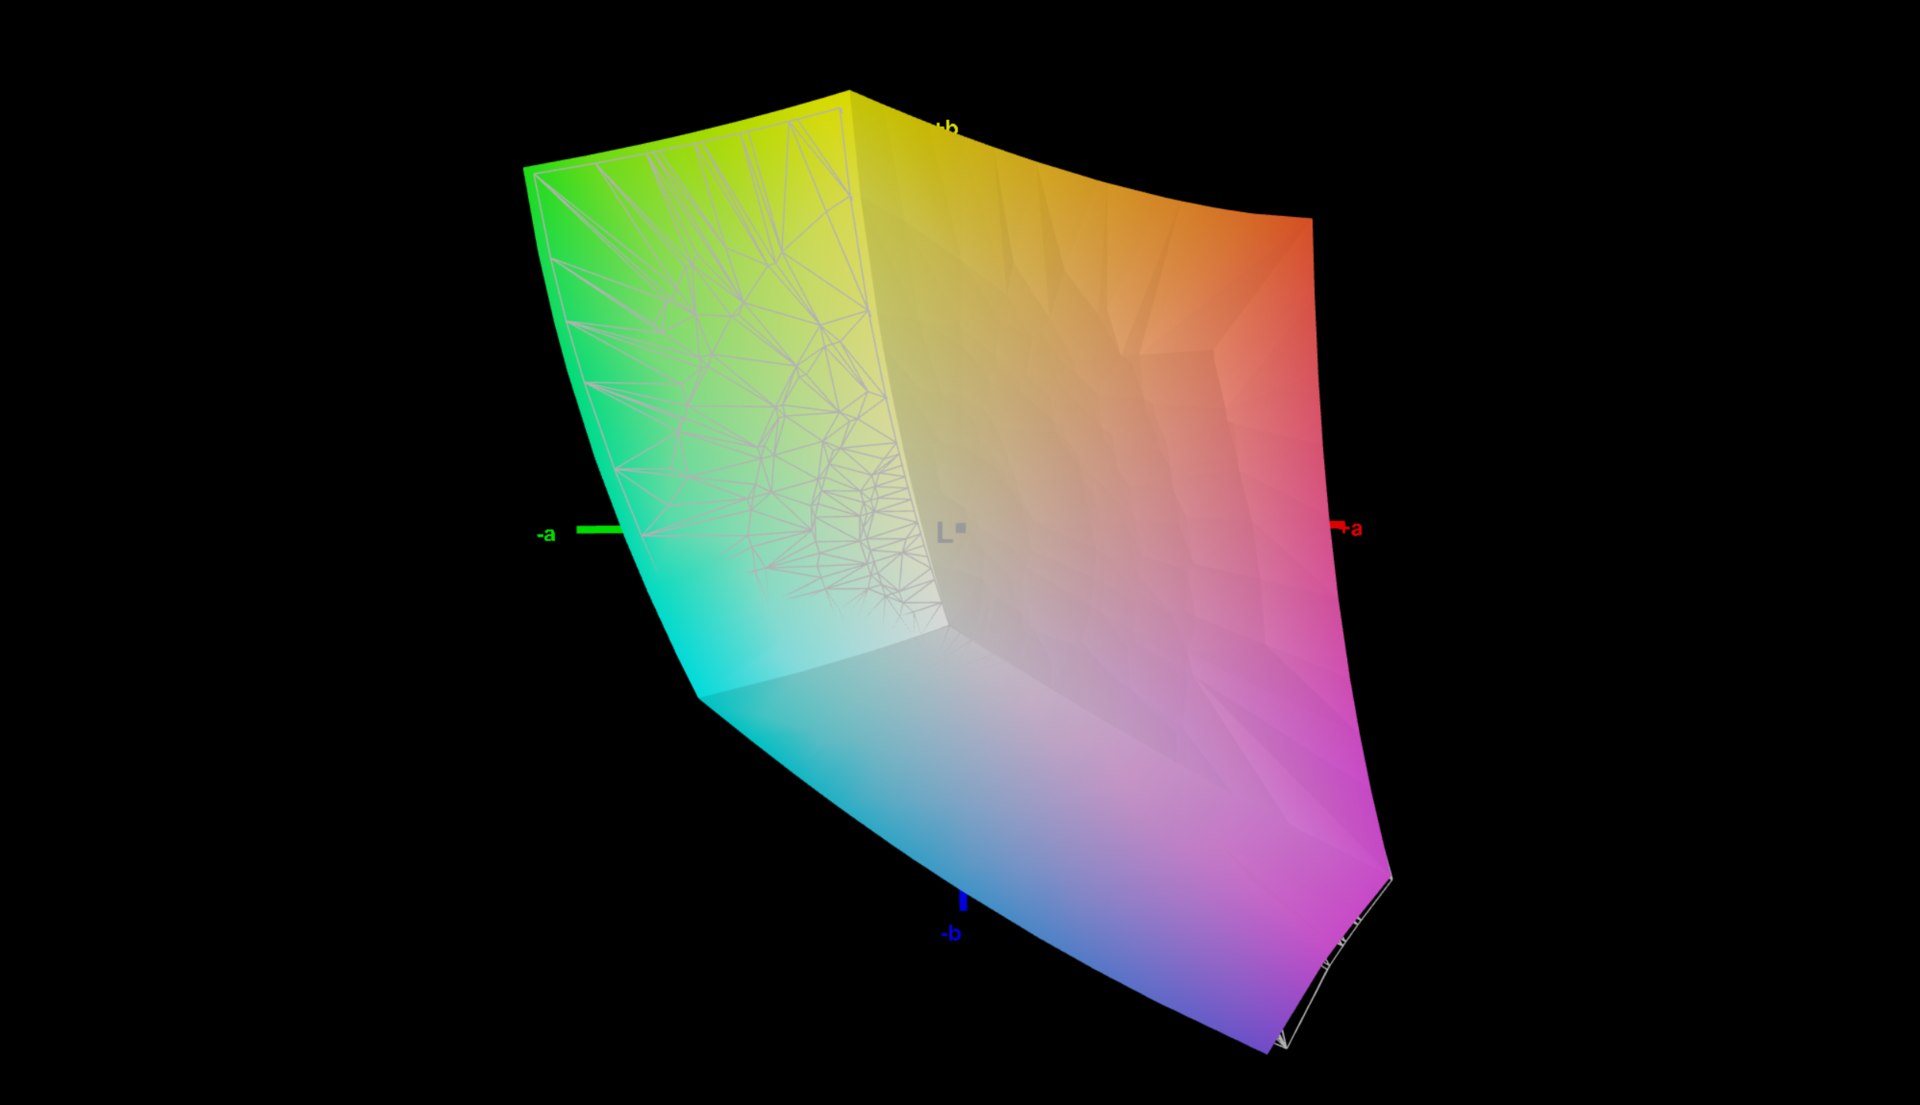
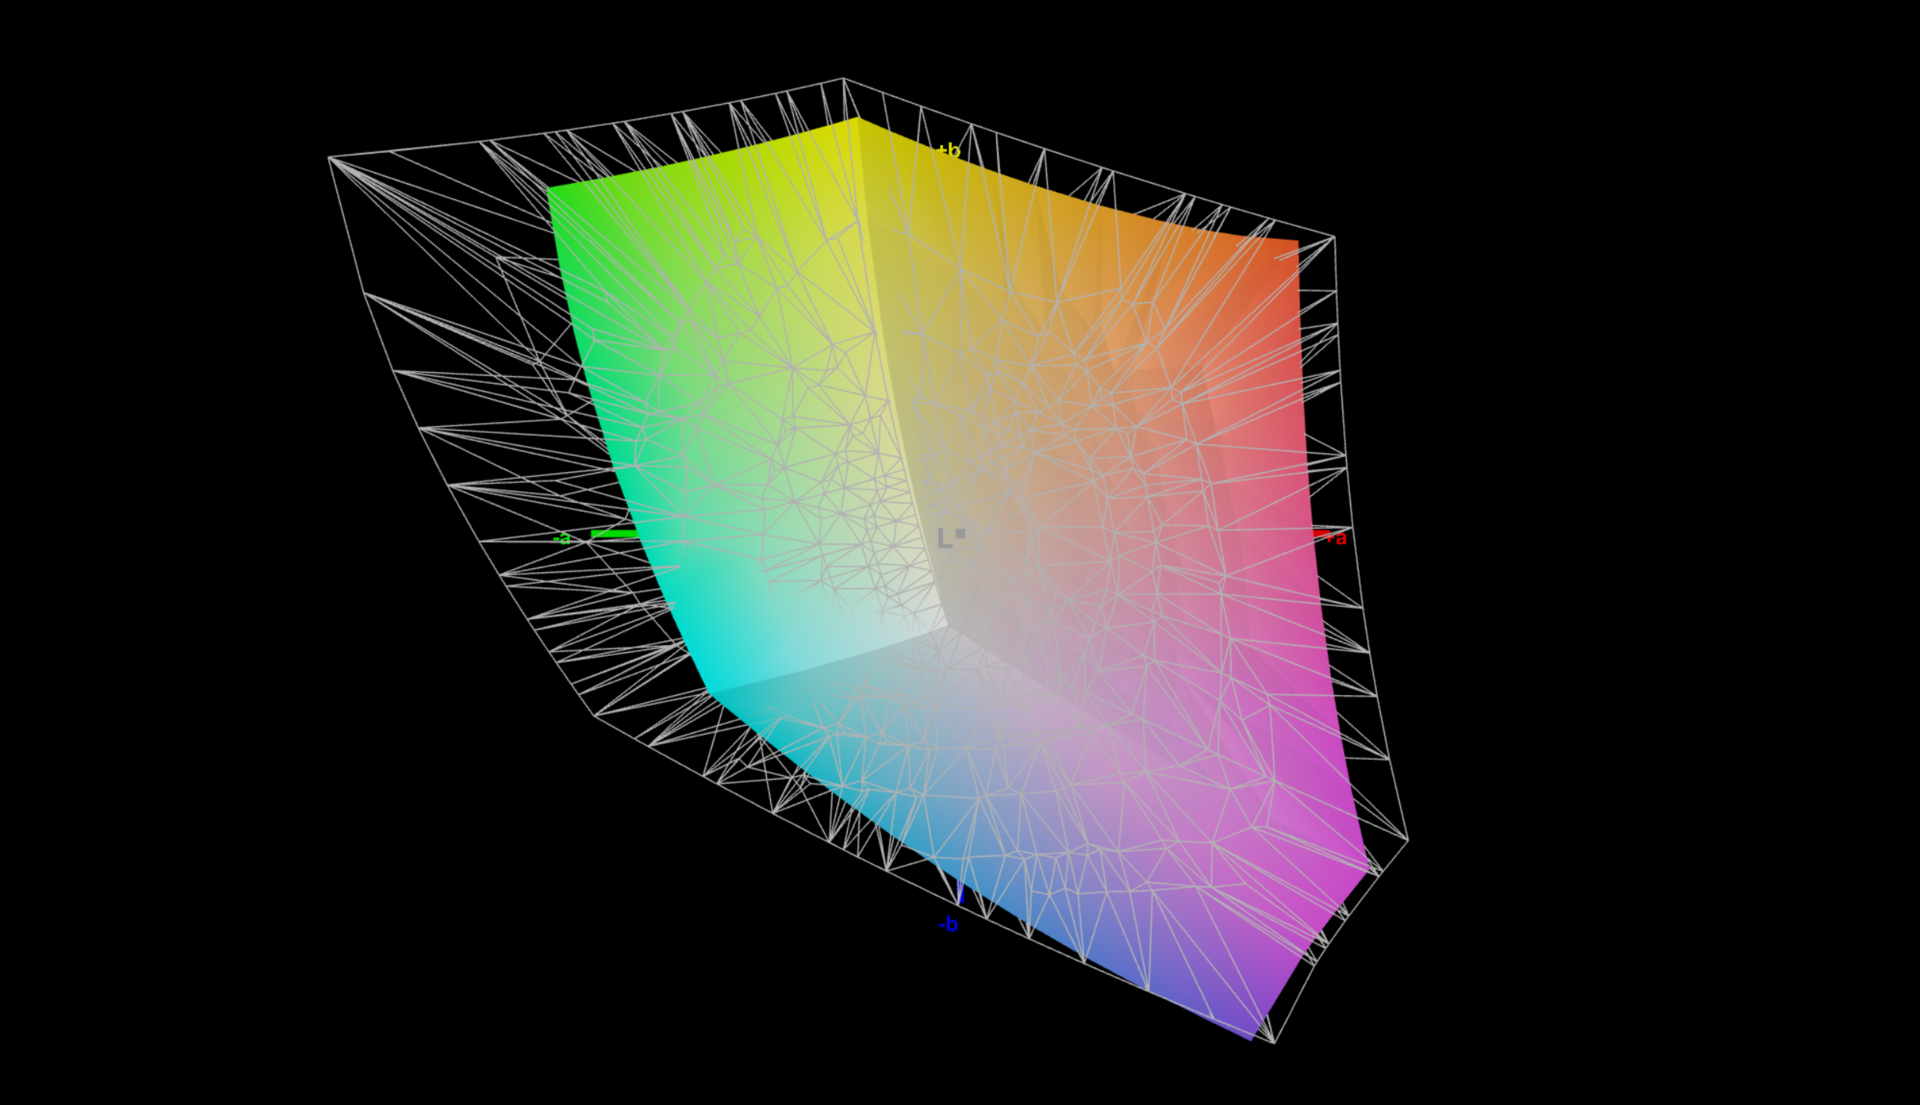
73.2% AdobeRGB 1998 (Argyll 3D)
99.2% sRGB (Argyll 3D)
71% Display P3 (Argyll 3D)
Gamma: 2.26
CCT: 5969 K
| Lenovo ThinkPad P16 G2 21FA000FGE MNG007DA1-9, IPS LED, 2560x1600, 16" | Lenovo ThinkPad P16 G1 21D6001DMB NE160QDM-N63 , IPS LED, 2560x1600, 16" | HP ZBook Fury 16 G10 AUO87A8, IPS, 3840x2400, 16" | Lenovo ThinkPad P1 G6-21FV000DGE NE160QDM-NY1, IPS, 2560x1600, 16" | HP ZBook Power 15 G10 BOE0B6A, IPS, 2560x1440, 15.6" | Lenovo ThinkPad P16v G1 AMD NE160WUM-N64, IPS, 1920x1200, 16" | |
|---|---|---|---|---|---|---|
| Display | 1% | 19% | -3% | -4% | -4% | |
| Display P3 Coverage (%) | 71 | 71.5 1% | 98 38% | 68.1 -4% | 68.2 -4% | 67.8 -5% |
| sRGB Coverage (%) | 99.2 | 100 1% | 99.9 1% | 97.5 -2% | 95.6 -4% | 97.7 -2% |
| AdobeRGB 1998 Coverage (%) | 73.2 | 73.3 0% | 86.2 18% | 70.2 -4% | 70.5 -4% | 69.8 -5% |
| Response Times | -178% | 6% | -1% | -3% | -226% | |
| Response Time Grey 50% / Grey 80% * (ms) | 12.8 ? | 37.7 ? -195% | 11.9 ? 7% | 13.7 ? -7% | 13 ? -2% | 50.6 ? -295% |
| Response Time Black / White * (ms) | 10.1 ? | 26.3 ? -160% | 9.6 ? 5% | 9.6 ? 5% | 10.4 ? -3% | 26 ? -157% |
| PWM Frequency (Hz) | ||||||
| Screen | 9% | 14% | 25% | -17% | 6% | |
| Brightness middle (cd/m²) | 510 | 424 -17% | 514.6 1% | 521 2% | 313.8 -38% | 355 -30% |
| Brightness (cd/m²) | 517 | 398 -23% | 495 -4% | 484 -6% | 302 -42% | 344 -33% |
| Brightness Distribution (%) | 89 | 90 1% | 90 1% | 89 0% | 83 -7% | 92 3% |
| Black Level * (cd/m²) | 0.37 | 0.24 35% | 0.46 -24% | 0.36 3% | 0.29 22% | 0.17 54% |
| Contrast (:1) | 1378 | 1767 28% | 1119 -19% | 1447 5% | 1082 -21% | 2088 52% |
| Colorchecker dE 2000 * | 2.6 | 2.6 -0% | 2.4 8% | 1.2 54% | 3.27 -26% | 2.9 -12% |
| Colorchecker dE 2000 max. * | 5.2 | 4.9 6% | 4.86 7% | 2.5 52% | 7.81 -50% | 5.6 -8% |
| Colorchecker dE 2000 calibrated * | 2.3 | 0.8 65% | 0.4 83% | 1 57% | 0.56 76% | 1 57% |
| Greyscale dE 2000 * | 3.6 | 4.1 -14% | 1 72% | 1.4 61% | 5.9 -64% | 4.7 -31% |
| Gamma | 2.26 97% | 2.13 103% | 2.3 96% | 2.25 98% | 2.18 101% | 2.12 104% |
| CCT | 5969 109% | 7252 90% | 6553 99% | 6682 97% | 6323 103% | 6356 102% |
| Total Average (Program / Settings) | -56% /
-19% | 13% /
14% | 7% /
15% | -8% /
-12% | -75% /
-29% |
* ... smaller is better
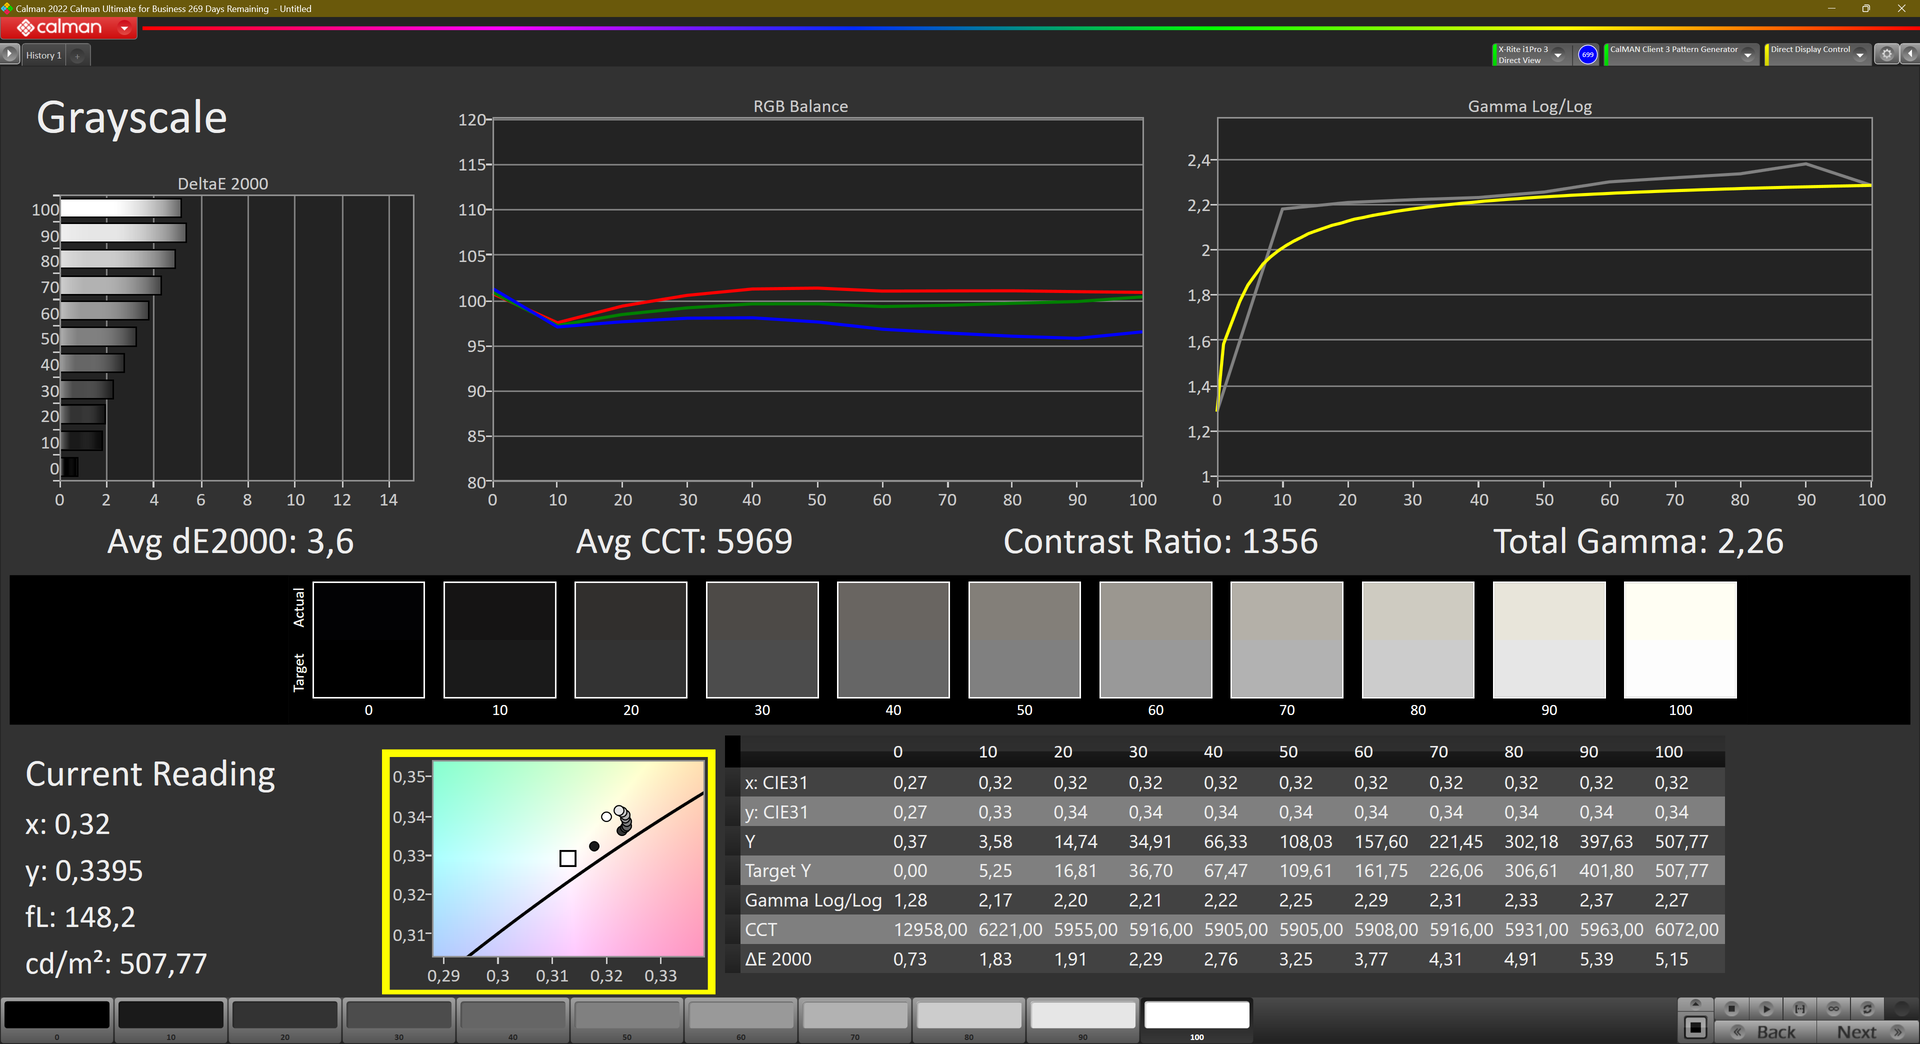
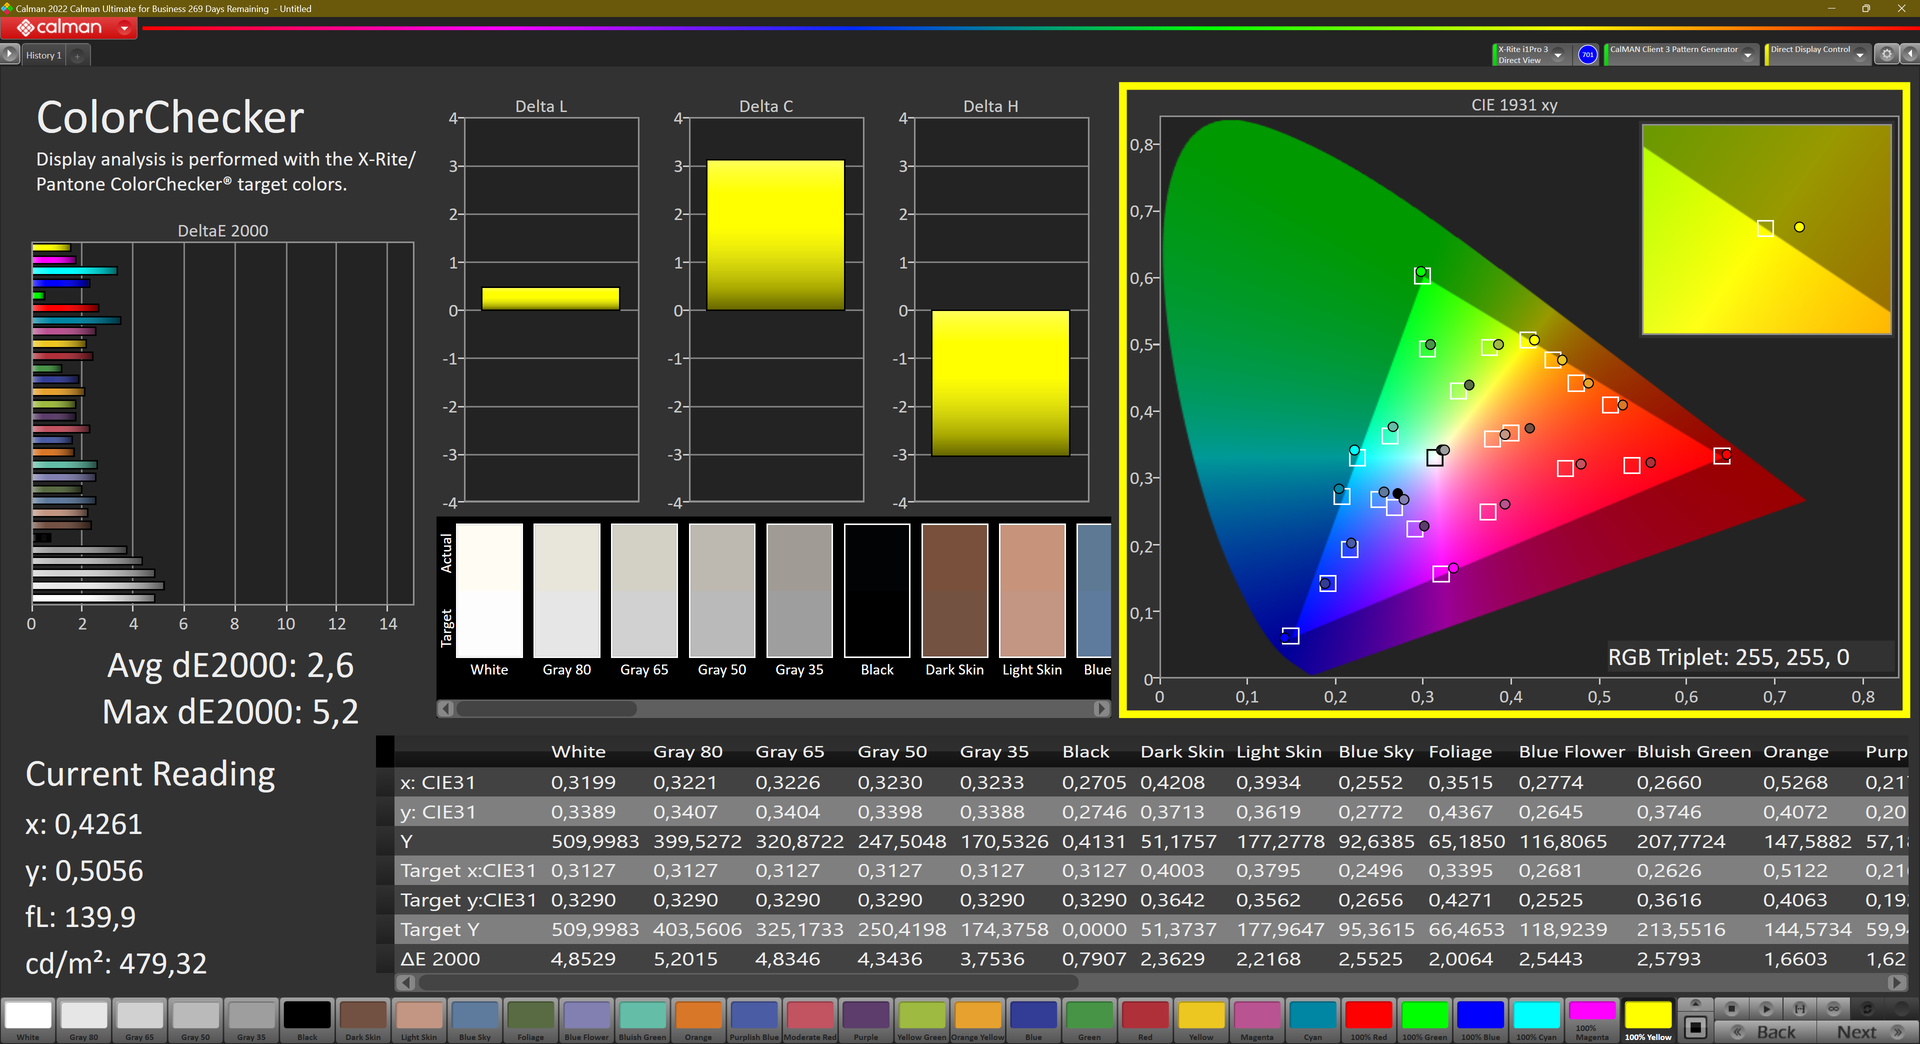
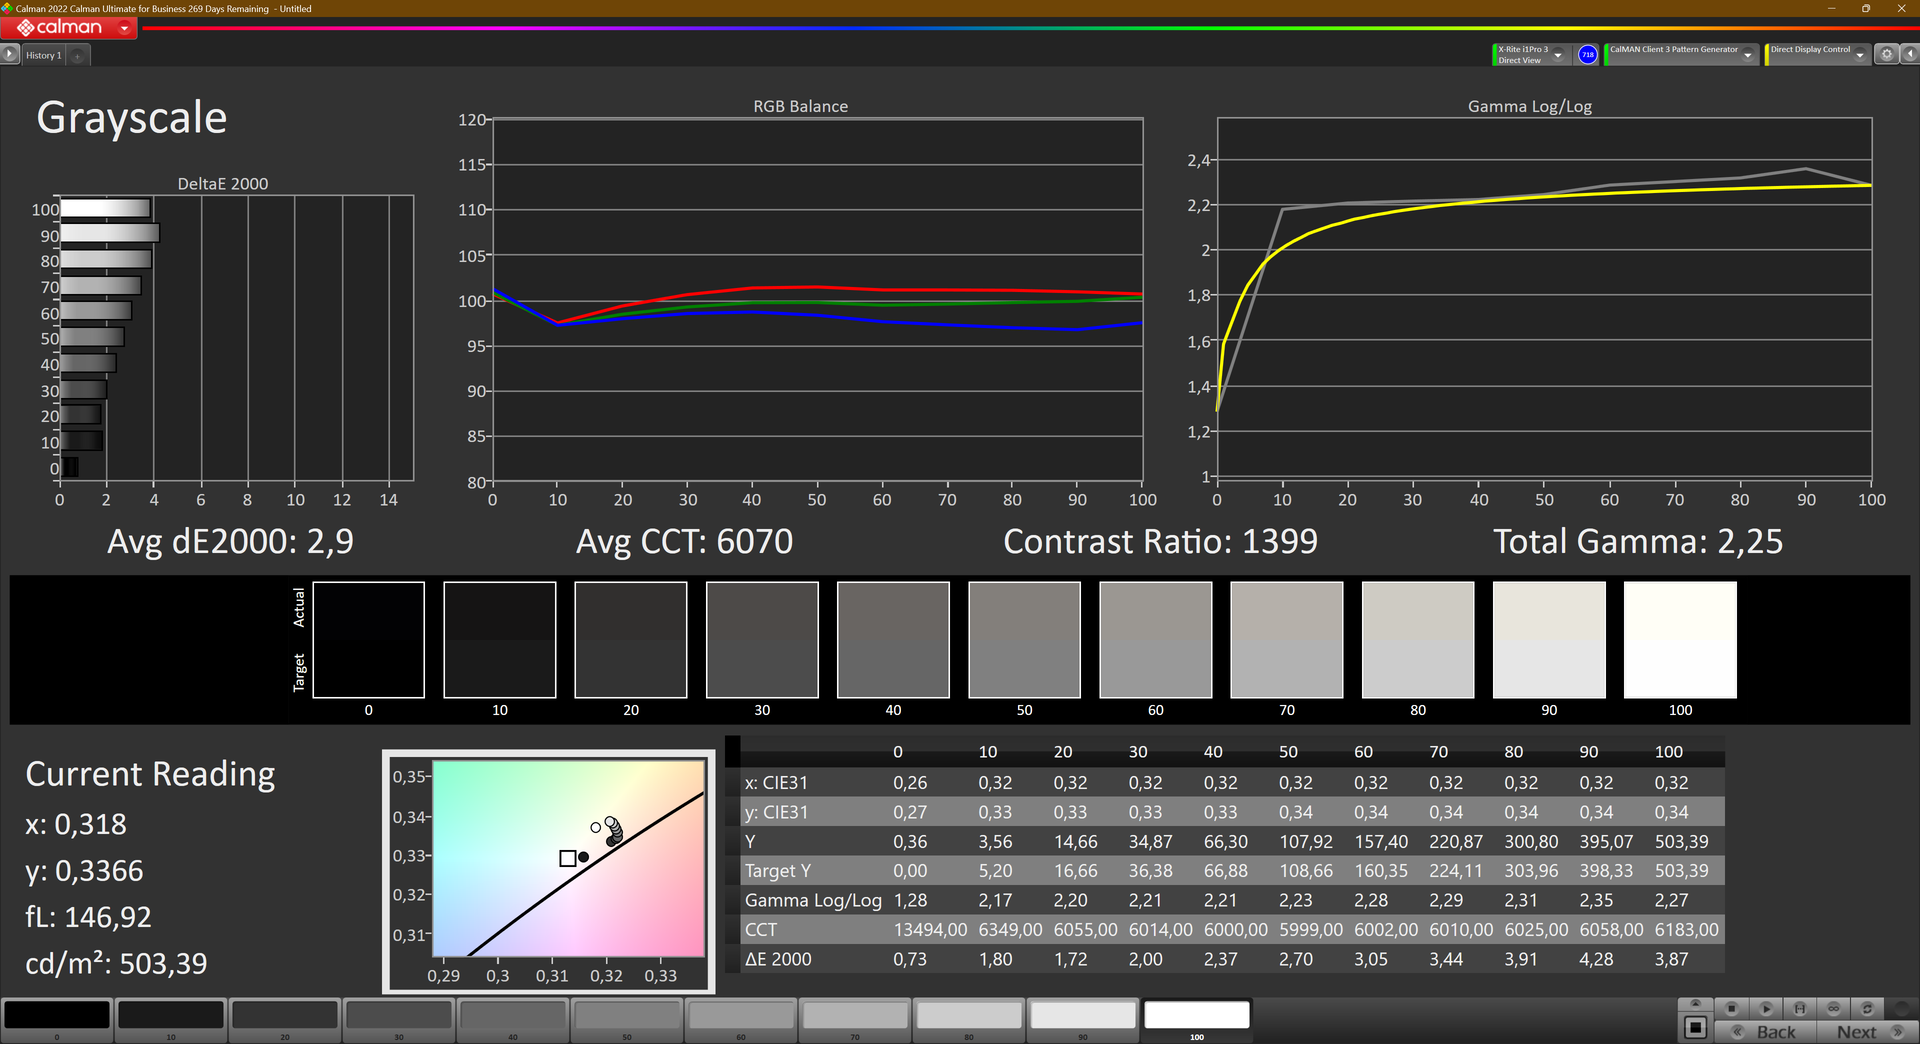
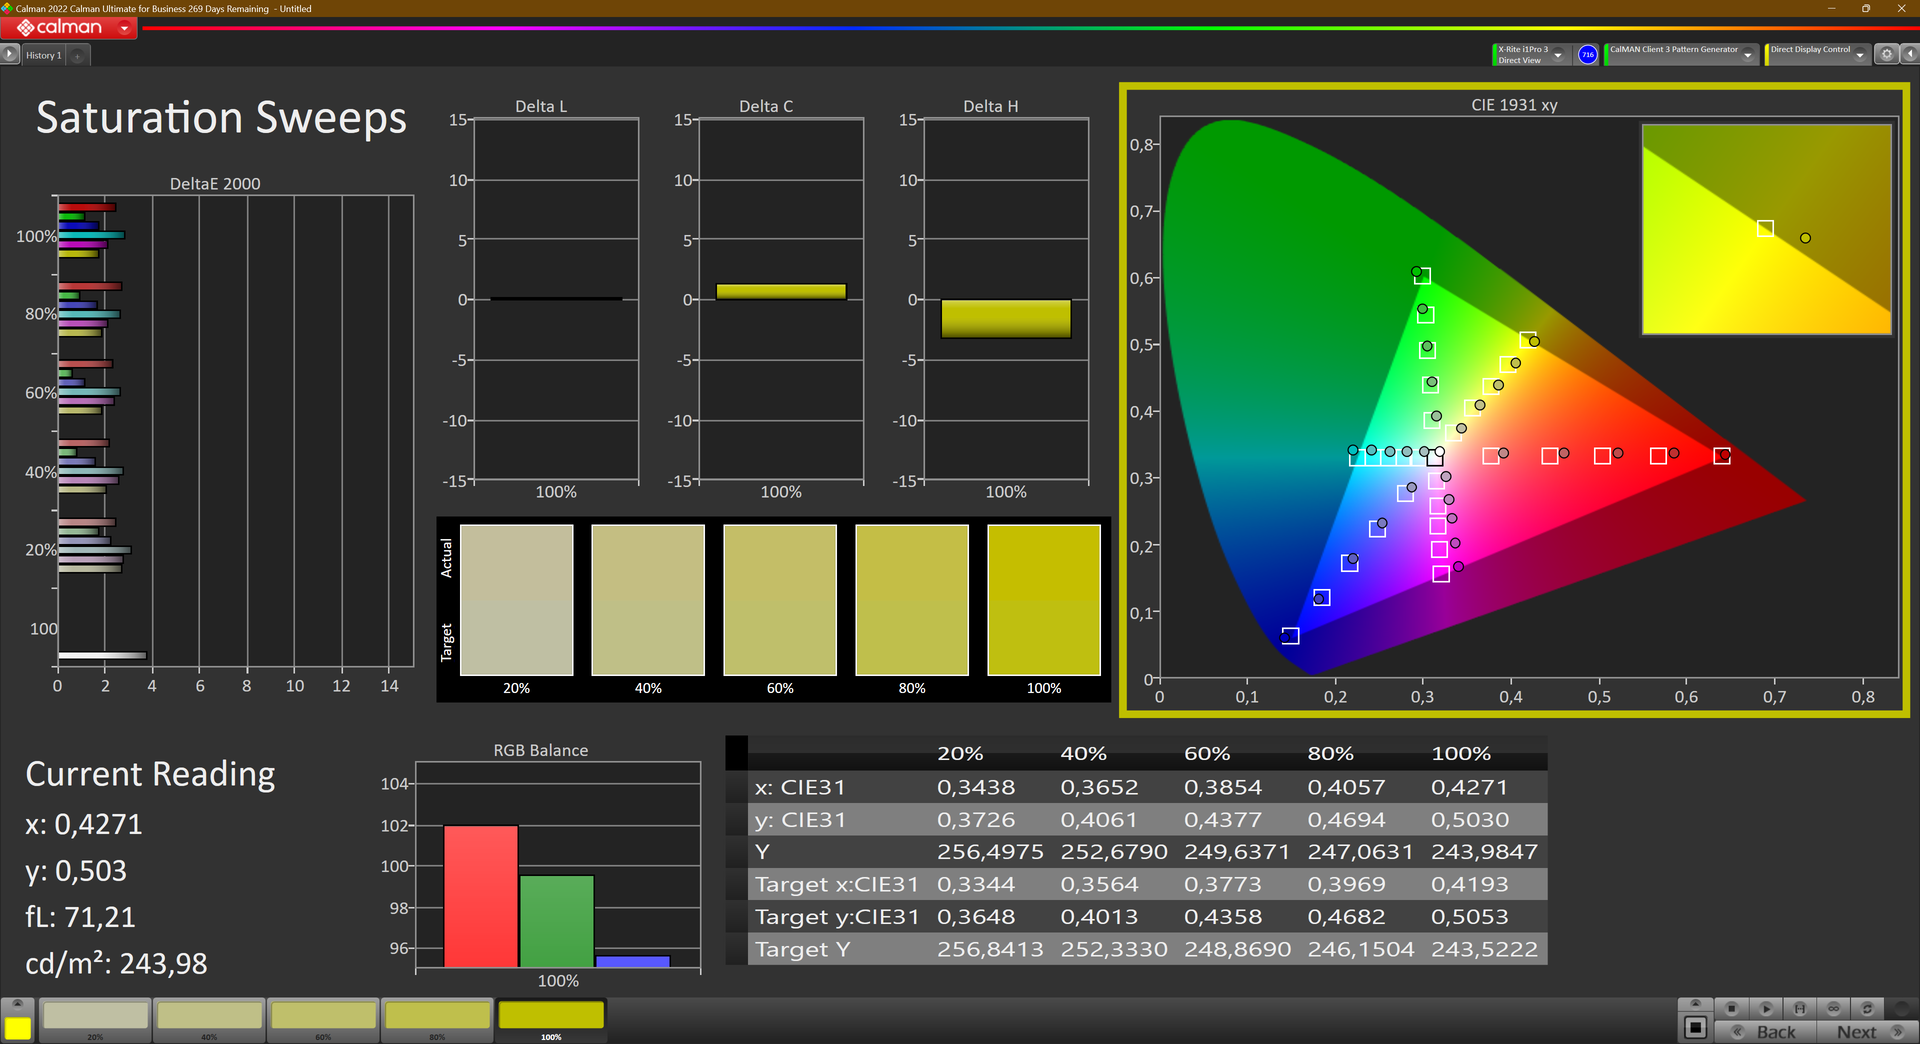
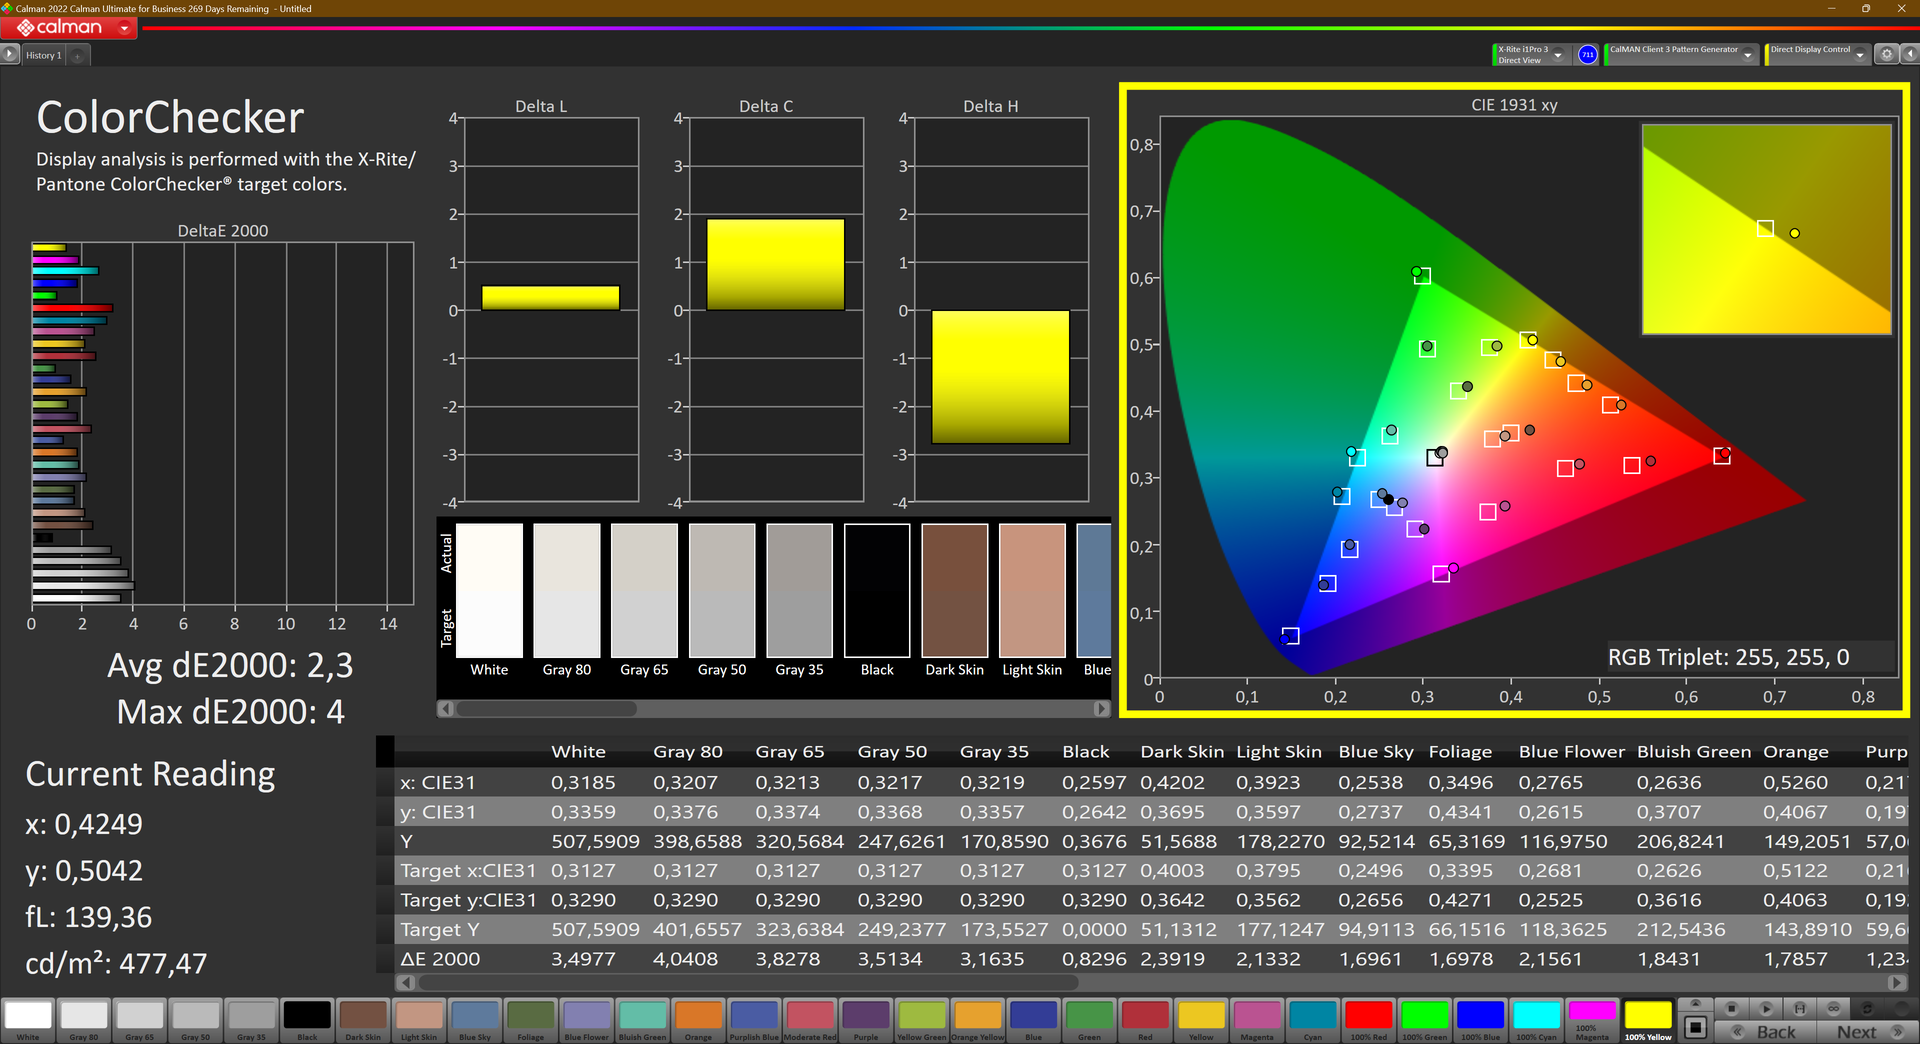
Ex-factory, the display is a bit too warm, which is most visible in the Calman Greyscale measurements. After a calibration with the X-Rite i1Pro 3 and X-Rite i1Profiler, the Colorchecker deltaE value, which describes the average deviation of the colors from the ideal, decreases from 2.6 to 2.3. Not a huge difference, but still a noticeable one. The color profile we created is available for download for free in the grey box above.
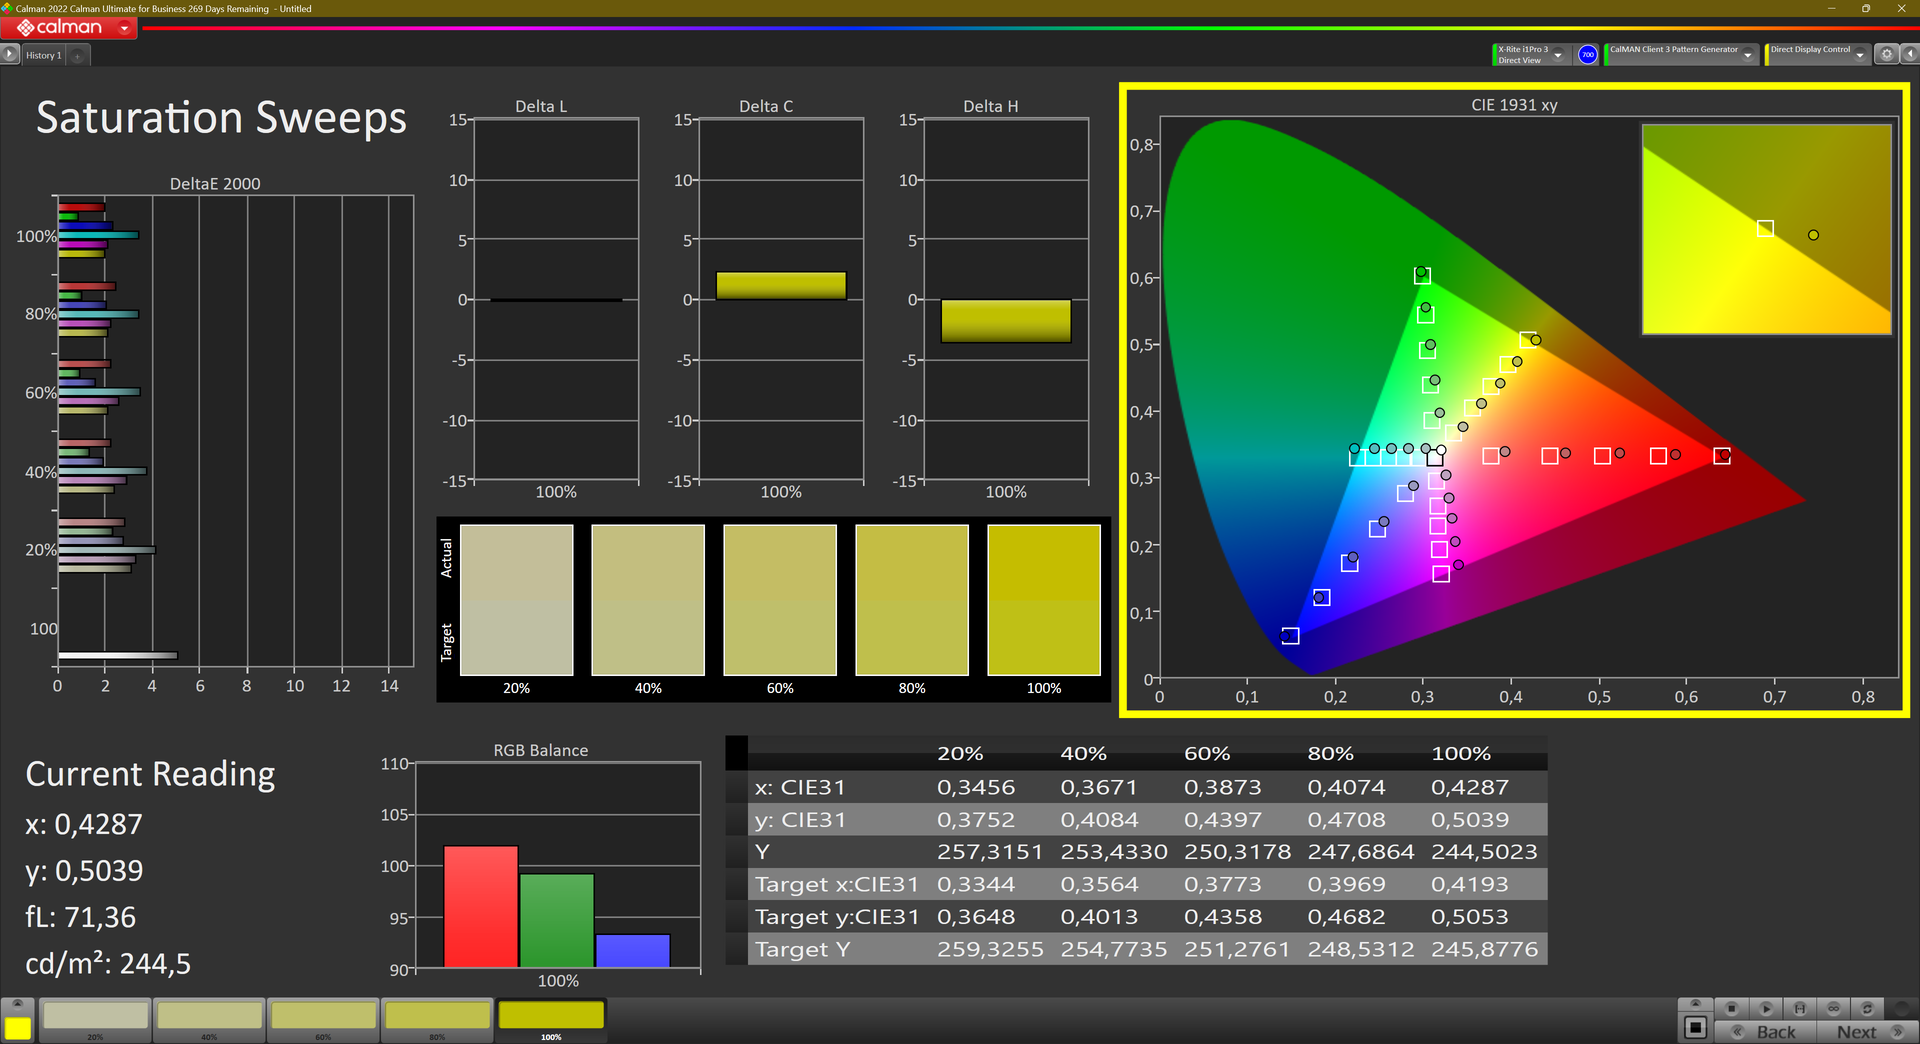
Lenovo says the screen covers 100 % of the sRGB gamut, we measure a 99.2 % coverage. This makes the display usable for simple photo and video editing.
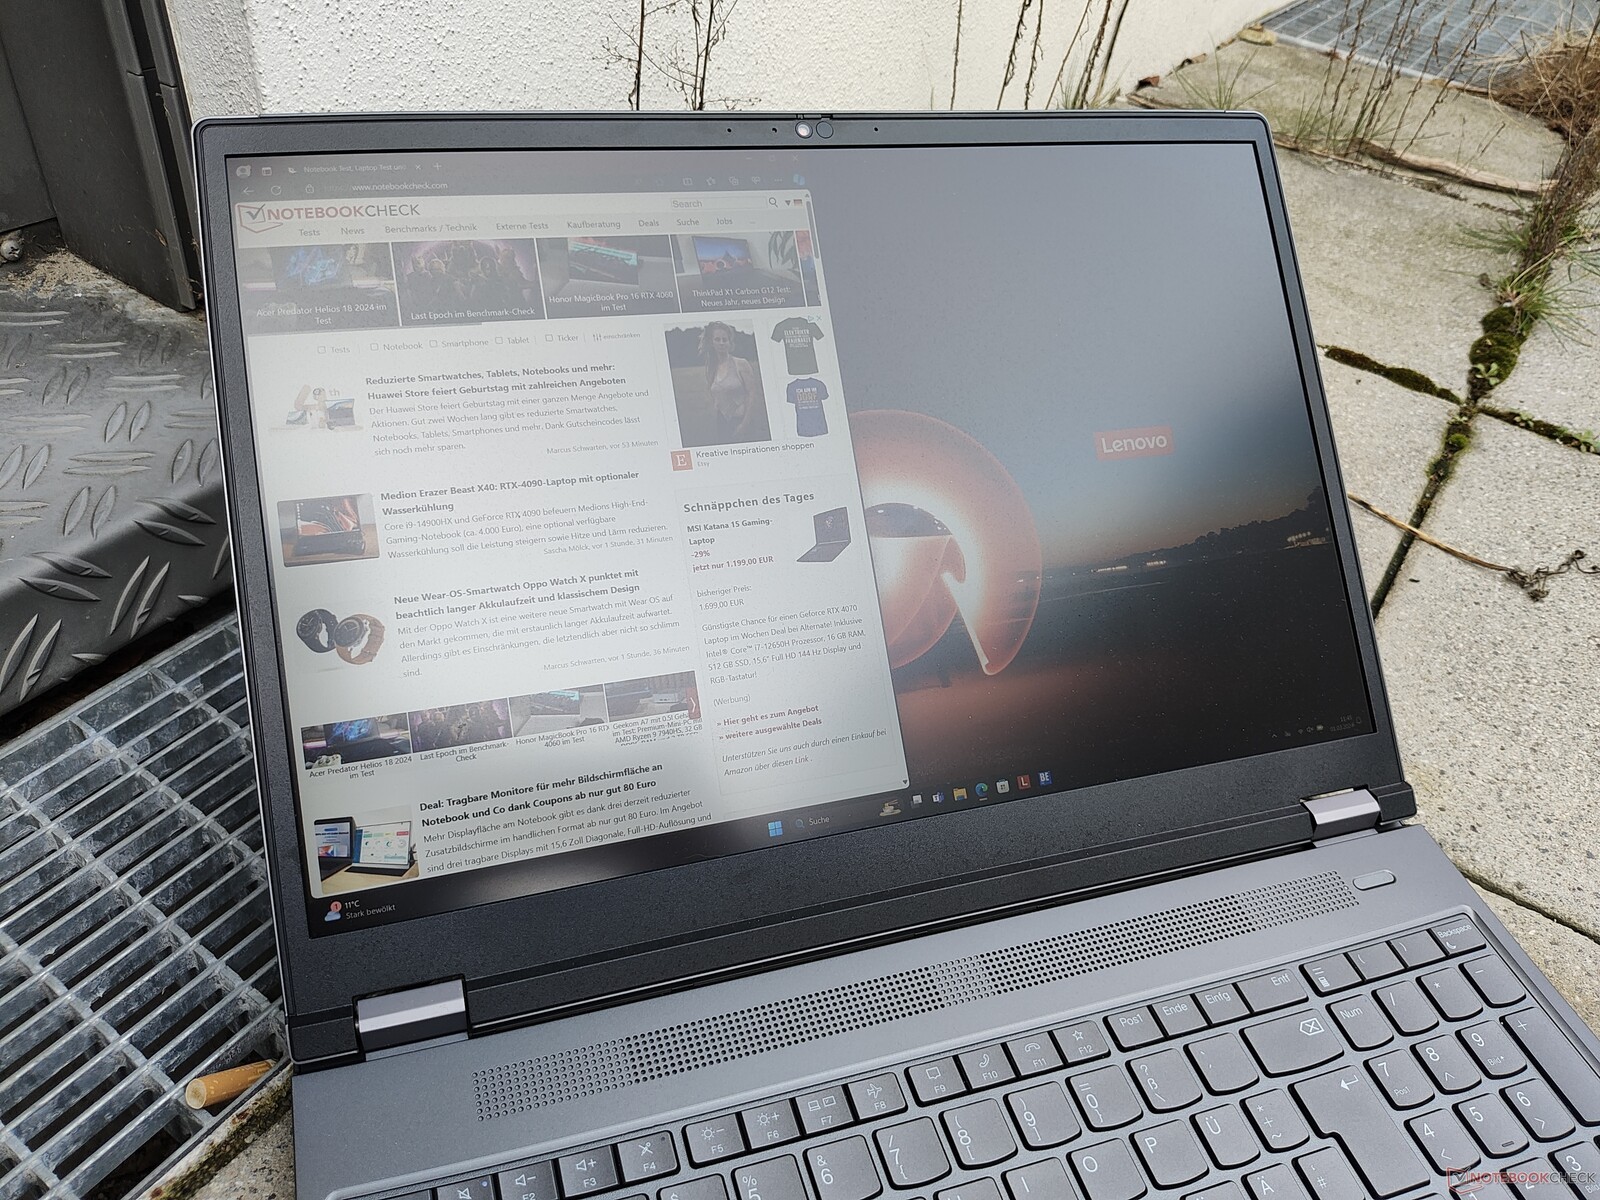
Out of the office, the screen is well usable, thanks to the high bightness of above 500 cd/m² and matte surface.
Display Response Times
| ↔ Response Time Black to White | ||
|---|---|---|
| 10.1 ms ... rise ↗ and fall ↘ combined | ↗ 5.8 ms rise | 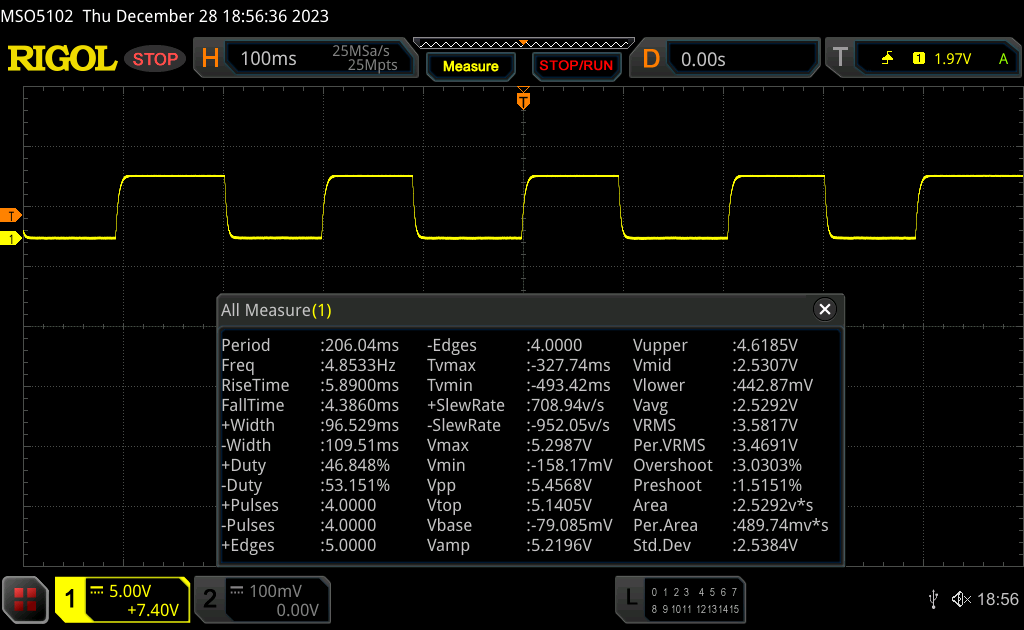 |
| ↘ 4.3 ms fall | ||
| The screen shows good response rates in our tests, but may be too slow for competitive gamers. In comparison, all tested devices range from 0.1 (minimum) to 240 (maximum) ms. » 28 % of all devices are better. This means that the measured response time is better than the average of all tested devices (19.8 ms). | ||
| ↔ Response Time 50% Grey to 80% Grey | ||
| 12.8 ms ... rise ↗ and fall ↘ combined | ↗ 61 ms rise | 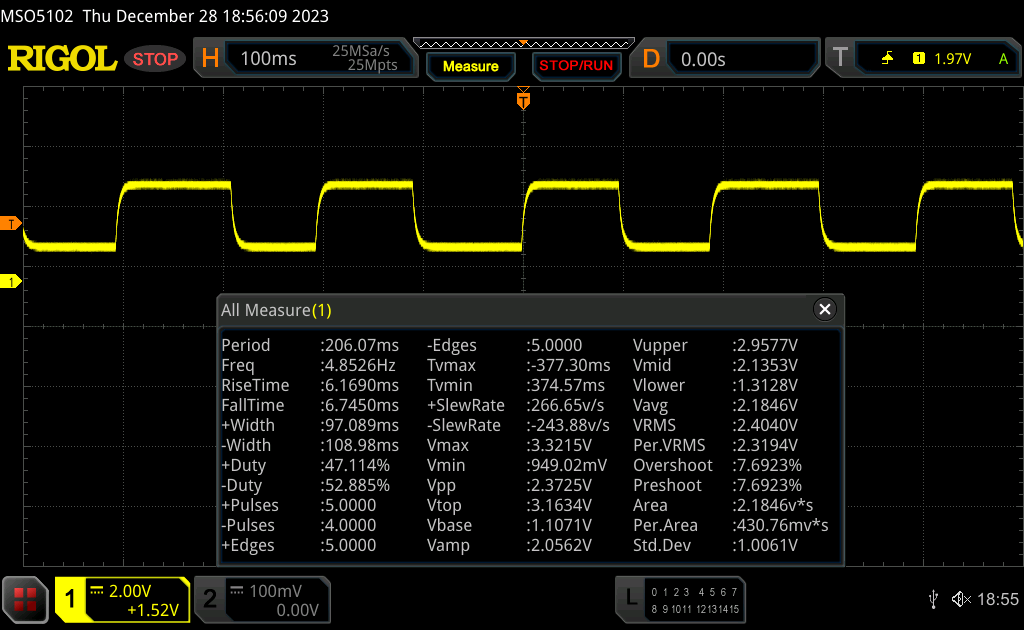 |
| ↘ 6.8 ms fall | ||
| The screen shows good response rates in our tests, but may be too slow for competitive gamers. In comparison, all tested devices range from 0.165 (minimum) to 636 (maximum) ms. » 26 % of all devices are better. This means that the measured response time is better than the average of all tested devices (30.9 ms). | ||
Screen Flickering / PWM (Pulse-Width Modulation)
| Screen flickering / PWM not detected |  | ||
In comparison: 52 % of all tested devices do not use PWM to dim the display. If PWM was detected, an average of 7744 (minimum: 5 - maximum: 343500) Hz was measured. | |||
Performance: Raptor Lake HX and Ada Lovelace makes for strong package
There is a plethora of hardware options for the Lenovo ThinkPad P16 Gen 2. Five Intel Core processors are on offer: the i5-13600HX, the i7-13700HX, the i7-13850HX, the i9-13950HX and the i9-13980HX. There are even more GPU options, as Lenovo puts in either the Nvidia RTX A1000, the RTX 2000 Ada, the RTX 3500 Ada, the RTX 4000 Ada and RTX 5000 Ada. If no dedicated GPU is needed, its is also possible to buy the ThinkPad laptop just with an Intel GPU.
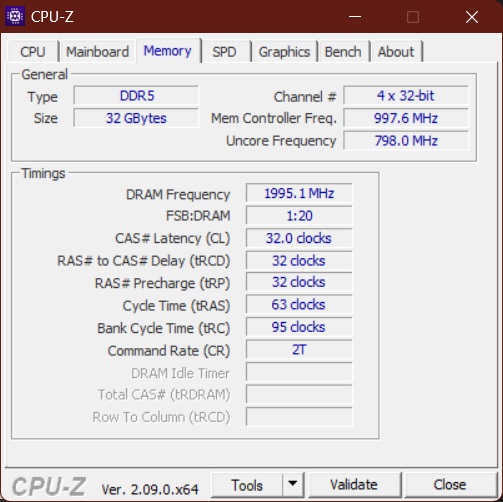
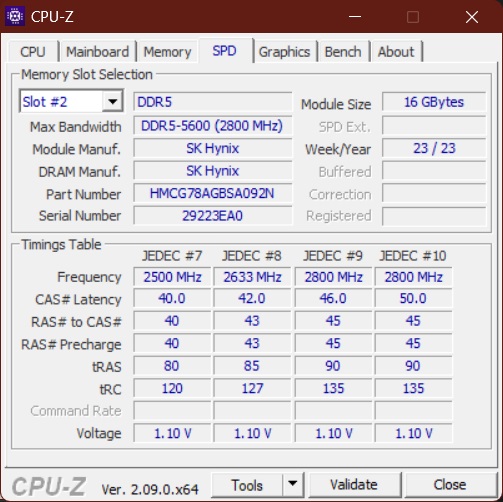
RAM can go up to monstrous 192 GB of DDR5-4000/3600 memory, or up to 128 GB of ECC RAM. This is possible thanks to the four SO-DIMM slots, which can take in 48 GB modules. Lenovo is less generous when it comes to the storage, as there are just two M.2 2280 slots for up to 8 TB. This is half of what the competition in form of the HP ZBook Fury 16 G10 offers.
Testing Conditions
Lenovo uses the integrated Windows power settings to regulate the performance modes of the ThinkPad workstation. There are three different modes that influence the power limits. The power limit 1 (PL1) describes the long term, sustained performance, while the power limit 2 sets the boundary for short term boost performance:
- Best battery life: PL1 30 W / PL2 67 W
- Balanced: PL1 80 W / PL2 100 W
- Best performance: PL1 80 W / PL2 100 W
Processor
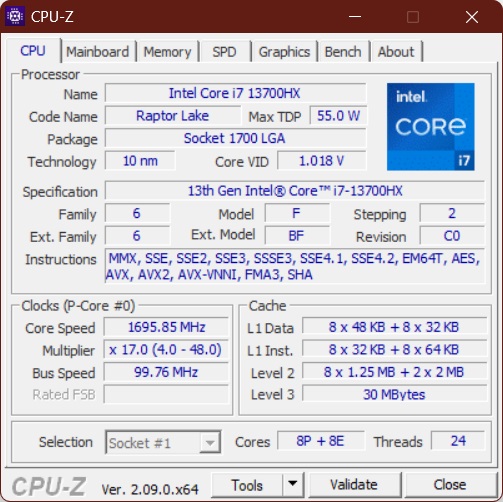
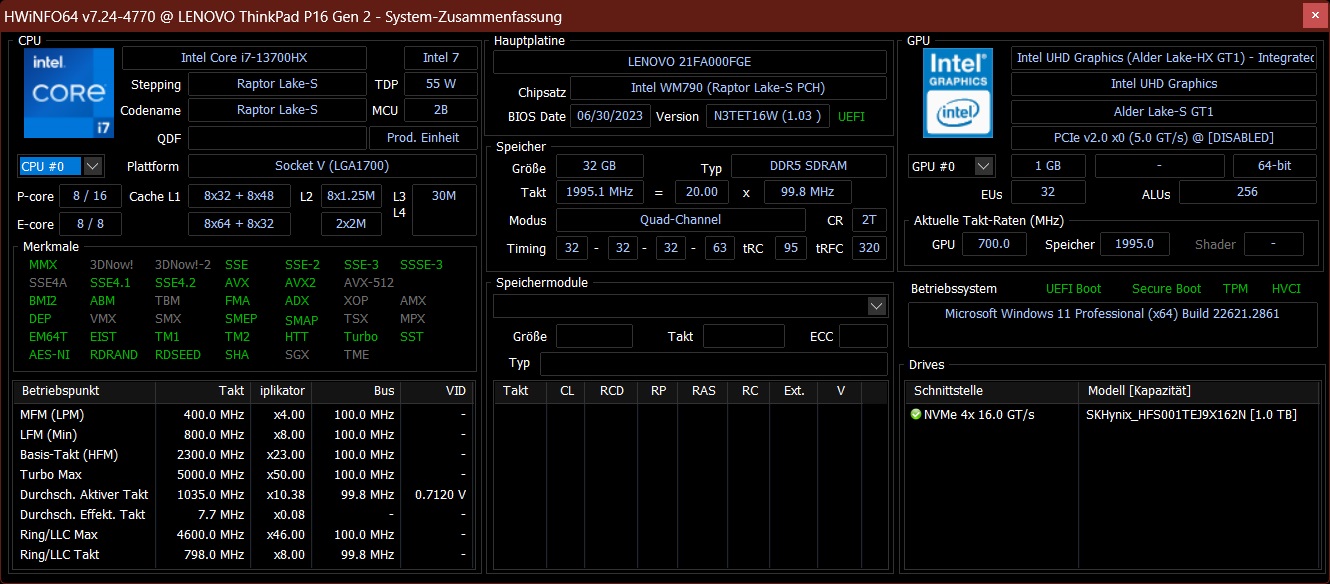
The Intel Core i7-13700HX is the basic i7-CPU of the Raptor-Lake-HX series. It combines eight small E cores (1.5 to 3.7 GHz) with eight big P cores (2.1 to 5 GHz) for a total of 16 cores and 24 threads thanks to hyperthreading on the P cores. This CPU is rated for a typical power consumption of 55 W, as usual for the HX55 series, the most powerful of Intel's laptop CPU series. It does not support ECC RAM. For benchmark comparisons with other processors, we provide our CPU benchmark list.
While the CPU performance of the Lenovo ThinkPad P16 Gen 2 is impressive and roughly 10 percent better compared with the preceding ThinkPad P16 G1, the HP ZBook Fury 16 G10 wins this category overall pretty clearly. However, the ZBook has a Core i9 with eight E cores more, which should account for the difference in multicore performance.
Running on battery, the CPU is limited to 45 W. Running the Cinebench R23 Multicore test without a connected charger results in a score of 11318 points, a performance decrease of roughly 45 percent.
Cinebench R15 Multi Loop
Cinebench R23: Multi Core | Single Core
Cinebench R20: CPU (Multi Core) | CPU (Single Core)
Cinebench R15: CPU Multi 64Bit | CPU Single 64Bit
Blender: v2.79 BMW27 CPU
7-Zip 18.03: 7z b 4 | 7z b 4 -mmt1
Geekbench 5.5: Multi-Core | Single-Core
HWBOT x265 Benchmark v2.2: 4k Preset
LibreOffice : 20 Documents To PDF
R Benchmark 2.5: Overall mean
| CPU Performance rating | |
| HP ZBook Fury 16 G10 | |
| Average of class Workstation | |
| Lenovo ThinkPad P16 G2 21FA000FGE | |
| Average Intel Core i7-13700HX | |
| Lenovo ThinkPad P1 G6-21FV000DGE | |
| Lenovo ThinkPad P16 G1 21D6001DMB | |
| HP ZBook Power 15 G10 | |
| Lenovo ThinkPad P16v G1 AMD | |
| Cinebench R23 / Multi Core | |
| Average of class Workstation (14621 - 38520, n=23, last 2 years) | |
| HP ZBook Fury 16 G10 | |
| Average Intel Core i7-13700HX (15558 - 22598, n=11) | |
| Lenovo ThinkPad P16 G2 21FA000FGE | |
| Lenovo ThinkPad P1 G6-21FV000DGE | |
| Lenovo ThinkPad P16 G1 21D6001DMB | |
| HP ZBook Power 15 G10 | |
| Lenovo ThinkPad P16v G1 AMD | |
| Cinebench R23 / Single Core | |
| HP ZBook Fury 16 G10 | |
| Lenovo ThinkPad P1 G6-21FV000DGE | |
| Average of class Workstation (1712 - 2228, n=23, last 2 years) | |
| Lenovo ThinkPad P16 G2 21FA000FGE | |
| Lenovo ThinkPad P16 G1 21D6001DMB | |
| Average Intel Core i7-13700HX (1666 - 1933, n=11) | |
| HP ZBook Power 15 G10 | |
| Lenovo ThinkPad P16v G1 AMD | |
| Cinebench R20 / CPU (Multi Core) | |
| Average of class Workstation (5760 - 15043, n=23, last 2 years) | |
| HP ZBook Fury 16 G10 | |
| Lenovo ThinkPad P16 G2 21FA000FGE | |
| Average Intel Core i7-13700HX (6160 - 8610, n=11) | |
| Lenovo ThinkPad P1 G6-21FV000DGE | |
| Lenovo ThinkPad P16 G1 21D6001DMB | |
| HP ZBook Power 15 G10 | |
| Lenovo ThinkPad P16v G1 AMD | |
| Cinebench R20 / CPU (Single Core) | |
| HP ZBook Fury 16 G10 | |
| Lenovo ThinkPad P1 G6-21FV000DGE | |
| Average of class Workstation (671 - 857, n=23, last 2 years) | |
| Lenovo ThinkPad P16 G2 21FA000FGE | |
| Lenovo ThinkPad P16 G1 21D6001DMB | |
| Average Intel Core i7-13700HX (644 - 740, n=11) | |
| HP ZBook Power 15 G10 | |
| Lenovo ThinkPad P16v G1 AMD | |
| Cinebench R15 / CPU Multi 64Bit | |
| Average of class Workstation (2489 - 5810, n=23, last 2 years) | |
| HP ZBook Fury 16 G10 | |
| Average Intel Core i7-13700HX (2548 - 3482, n=12) | |
| Lenovo ThinkPad P16 G2 21FA000FGE | |
| Lenovo ThinkPad P16 G1 21D6001DMB | |
| Lenovo ThinkPad P1 G6-21FV000DGE | |
| HP ZBook Power 15 G10 | |
| Lenovo ThinkPad P16v G1 AMD | |
| Cinebench R15 / CPU Single 64Bit | |
| HP ZBook Fury 16 G10 | |
| Average of class Workstation (191.4 - 328, n=23, last 2 years) | |
| Lenovo ThinkPad P1 G6-21FV000DGE | |
| Lenovo ThinkPad P16 G2 21FA000FGE | |
| HP ZBook Power 15 G10 | |
| Lenovo ThinkPad P16 G1 21D6001DMB | |
| Average Intel Core i7-13700HX (243 - 279, n=11) | |
| Lenovo ThinkPad P16v G1 AMD | |
| Blender / v2.79 BMW27 CPU | |
| Lenovo ThinkPad P16v G1 AMD | |
| HP ZBook Power 15 G10 | |
| Lenovo ThinkPad P1 G6-21FV000DGE | |
| Lenovo ThinkPad P16 G1 21D6001DMB | |
| Average Intel Core i7-13700HX (138 - 207, n=10) | |
| Lenovo ThinkPad P16 G2 21FA000FGE | |
| Average of class Workstation (91 - 222, n=23, last 2 years) | |
| HP ZBook Fury 16 G10 | |
| 7-Zip 18.03 / 7z b 4 | |
| HP ZBook Fury 16 G10 | |
| Average of class Workstation (60489 - 116969, n=23, last 2 years) | |
| Lenovo ThinkPad P16 G2 21FA000FGE | |
| Average Intel Core i7-13700HX (58912 - 89294, n=11) | |
| Lenovo ThinkPad P1 G6-21FV000DGE | |
| HP ZBook Power 15 G10 | |
| Lenovo ThinkPad P16 G1 21D6001DMB | |
| Lenovo ThinkPad P16v G1 AMD | |
| 7-Zip 18.03 / 7z b 4 -mmt1 | |
| HP ZBook Fury 16 G10 | |
| Lenovo ThinkPad P1 G6-21FV000DGE | |
| Lenovo ThinkPad P16v G1 AMD | |
| HP ZBook Power 15 G10 | |
| Lenovo ThinkPad P16 G2 21FA000FGE | |
| Average of class Workstation (5126 - 6960, n=23, last 2 years) | |
| Average Intel Core i7-13700HX (5552 - 6409, n=11) | |
| Lenovo ThinkPad P16 G1 21D6001DMB | |
| Geekbench 5.5 / Multi-Core | |
| HP ZBook Fury 16 G10 | |
| Average of class Workstation (11542 - 25554, n=23, last 2 years) | |
| Lenovo ThinkPad P16 G2 21FA000FGE | |
| Average Intel Core i7-13700HX (10156 - 15850, n=12) | |
| Lenovo ThinkPad P16 G1 21D6001DMB | |
| HP ZBook Power 15 G10 | |
| Lenovo ThinkPad P1 G6-21FV000DGE | |
| Lenovo ThinkPad P16v G1 AMD | |
| Geekbench 5.5 / Single-Core | |
| HP ZBook Fury 16 G10 | |
| Average of class Workstation (1783 - 2183, n=23, last 2 years) | |
| Lenovo ThinkPad P1 G6-21FV000DGE | |
| HP ZBook Power 15 G10 | |
| Lenovo ThinkPad P16 G2 21FA000FGE | |
| Lenovo ThinkPad P16v G1 AMD | |
| Average Intel Core i7-13700HX (1666 - 1899, n=12) | |
| Lenovo ThinkPad P16 G1 21D6001DMB | |
| HWBOT x265 Benchmark v2.2 / 4k Preset | |
| Average of class Workstation (17.8 - 40.5, n=23, last 2 years) | |
| HP ZBook Fury 16 G10 | |
| Lenovo ThinkPad P16 G2 21FA000FGE | |
| Average Intel Core i7-13700HX (17.1 - 25.5, n=11) | |
| HP ZBook Power 15 G10 | |
| Lenovo ThinkPad P1 G6-21FV000DGE | |
| Lenovo ThinkPad P16v G1 AMD | |
| Lenovo ThinkPad P16 G1 21D6001DMB | |
| LibreOffice / 20 Documents To PDF | |
| HP ZBook Power 15 G10 | |
| Lenovo ThinkPad P16 G2 21FA000FGE | |
| Average of class Workstation (37.1 - 74.7, n=23, last 2 years) | |
| Lenovo ThinkPad P1 G6-21FV000DGE | |
| Lenovo ThinkPad P16 G1 21D6001DMB | |
| Lenovo ThinkPad P16v G1 AMD | |
| Average Intel Core i7-13700HX (36.5 - 52.9, n=11) | |
| HP ZBook Fury 16 G10 | |
| R Benchmark 2.5 / Overall mean | |
| Average Intel Core i7-13700HX (0.4274 - 0.513, n=11) | |
| Lenovo ThinkPad P16 G1 21D6001DMB | |
| HP ZBook Power 15 G10 | |
| Lenovo ThinkPad P16 G2 21FA000FGE | |
| Lenovo ThinkPad P16v G1 AMD | |
| Average of class Workstation (0.3825 - 0.603, n=23, last 2 years) | |
| Lenovo ThinkPad P1 G6-21FV000DGE | |
| HP ZBook Fury 16 G10 | |
* ... smaller is better
AIDA64: FP32 Ray-Trace | FPU Julia | CPU SHA3 | CPU Queen | FPU SinJulia | FPU Mandel | CPU AES | CPU ZLib | FP64 Ray-Trace | CPU PhotoWorxx
| Performance rating | |
| Average of class Workstation | |
| HP ZBook Power 15 G10 | |
| HP ZBook Fury 16 G10 | |
| Lenovo ThinkPad P16v G1 AMD | |
| Average Intel Core i7-13700HX | |
| Lenovo ThinkPad P16 G2 21FA000FGE | |
| Lenovo ThinkPad P16 G1 21D6001DMB | |
| Lenovo ThinkPad P1 G6-21FV000DGE | |
| AIDA64 / FP32 Ray-Trace | |
| Average of class Workstation (16730 - 61611, n=23, last 2 years) | |
| HP ZBook Power 15 G10 | |
| Lenovo ThinkPad P16v G1 AMD | |
| HP ZBook Fury 16 G10 | |
| Average Intel Core i7-13700HX (14261 - 21999, n=11) | |
| Lenovo ThinkPad P16 G2 21FA000FGE | |
| Lenovo ThinkPad P16 G1 21D6001DMB | |
| Lenovo ThinkPad P1 G6-21FV000DGE | |
| AIDA64 / FPU Julia | |
| Average of class Workstation (89597 - 186971, n=23, last 2 years) | |
| HP ZBook Power 15 G10 | |
| Lenovo ThinkPad P16v G1 AMD | |
| HP ZBook Fury 16 G10 | |
| Average Intel Core i7-13700HX (74636 - 109364, n=11) | |
| Lenovo ThinkPad P16 G2 21FA000FGE | |
| Lenovo ThinkPad P16 G1 21D6001DMB | |
| Lenovo ThinkPad P1 G6-21FV000DGE | |
| AIDA64 / CPU SHA3 | |
| Average of class Workstation (4178 - 8975, n=23, last 2 years) | |
| HP ZBook Fury 16 G10 | |
| HP ZBook Power 15 G10 | |
| Lenovo ThinkPad P16v G1 AMD | |
| Average Intel Core i7-13700HX (3359 - 5053, n=11) | |
| Lenovo ThinkPad P16 G2 21FA000FGE | |
| Lenovo ThinkPad P16 G1 21D6001DMB | |
| Lenovo ThinkPad P1 G6-21FV000DGE | |
| AIDA64 / CPU Queen | |
| HP ZBook Fury 16 G10 | |
| Lenovo ThinkPad P1 G6-21FV000DGE | |
| HP ZBook Power 15 G10 | |
| Average Intel Core i7-13700HX (86532 - 114717, n=11) | |
| Lenovo ThinkPad P16 G2 21FA000FGE | |
| Average of class Workstation (60778 - 144411, n=23, last 2 years) | |
| Lenovo ThinkPad P16v G1 AMD | |
| Lenovo ThinkPad P16 G1 21D6001DMB | |
| AIDA64 / FPU SinJulia | |
| HP ZBook Power 15 G10 | |
| Lenovo ThinkPad P16v G1 AMD | |
| Average of class Workstation (8165 - 29343, n=23, last 2 years) | |
| HP ZBook Fury 16 G10 | |
| Average Intel Core i7-13700HX (9290 - 13519, n=11) | |
| Lenovo ThinkPad P16 G2 21FA000FGE | |
| Lenovo ThinkPad P16 G1 21D6001DMB | |
| Lenovo ThinkPad P1 G6-21FV000DGE | |
| AIDA64 / FPU Mandel | |
| Average of class Workstation (44497 - 98153, n=23, last 2 years) | |
| HP ZBook Power 15 G10 | |
| Lenovo ThinkPad P16v G1 AMD | |
| HP ZBook Fury 16 G10 | |
| Average Intel Core i7-13700HX (35751 - 53484, n=11) | |
| Lenovo ThinkPad P16 G2 21FA000FGE | |
| Lenovo ThinkPad P16 G1 21D6001DMB | |
| Lenovo ThinkPad P1 G6-21FV000DGE | |
| AIDA64 / CPU AES | |
| Average Intel Core i7-13700HX (67846 - 182575, n=11) | |
| Average of class Workstation (73133 - 187841, n=23, last 2 years) | |
| HP ZBook Fury 16 G10 | |
| Lenovo ThinkPad P16 G2 21FA000FGE | |
| HP ZBook Power 15 G10 | |
| Lenovo ThinkPad P16v G1 AMD | |
| Lenovo ThinkPad P16 G1 21D6001DMB | |
| Lenovo ThinkPad P1 G6-21FV000DGE | |
| AIDA64 / CPU ZLib | |
| Average of class Workstation (929 - 2148, n=23, last 2 years) | |
| HP ZBook Fury 16 G10 | |
| Average Intel Core i7-13700HX (981 - 1451, n=11) | |
| Lenovo ThinkPad P16 G2 21FA000FGE | |
| Lenovo ThinkPad P1 G6-21FV000DGE | |
| Lenovo ThinkPad P16 G1 21D6001DMB | |
| HP ZBook Power 15 G10 | |
| Lenovo ThinkPad P16v G1 AMD | |
| AIDA64 / FP64 Ray-Trace | |
| Average of class Workstation (8545 - 32891, n=23, last 2 years) | |
| HP ZBook Power 15 G10 | |
| Lenovo ThinkPad P16v G1 AMD | |
| HP ZBook Fury 16 G10 | |
| Average Intel Core i7-13700HX (7728 - 11837, n=11) | |
| Lenovo ThinkPad P16 G2 21FA000FGE | |
| Lenovo ThinkPad P16 G1 21D6001DMB | |
| Lenovo ThinkPad P1 G6-21FV000DGE | |
| AIDA64 / CPU PhotoWorxx | |
| Average of class Workstation (37151 - 93684, n=23, last 2 years) | |
| HP ZBook Power 15 G10 | |
| HP ZBook Fury 16 G10 | |
| Lenovo ThinkPad P16 G2 21FA000FGE | |
| Average Intel Core i7-13700HX (19678 - 42415, n=11) | |
| Lenovo ThinkPad P16 G1 21D6001DMB | |
| Lenovo ThinkPad P1 G6-21FV000DGE | |
| Lenovo ThinkPad P16v G1 AMD | |
System Performance
A system such as this shows no signs of weakness when it comes to the everyday performance. It always provides a smooth experience, even if the synthetic benchmarks slightly lag behind some of the other workstations.
CrossMark: Overall | Productivity | Creativity | Responsiveness
WebXPRT 3: Overall
WebXPRT 4: Overall
Mozilla Kraken 1.1: Total
| PCMark 10 / Score | |
| Average of class Workstation (6563 - 10409, n=19, last 2 years) | |
| HP ZBook Fury 16 G10 | |
| HP ZBook Power 15 G10 | |
| Lenovo ThinkPad P1 G6-21FV000DGE | |
| Lenovo ThinkPad P16 G2 21FA000FGE | |
| Average Intel Core i7-13700HX, NVIDIA RTX 2000 Ada Generation Laptop (n=1) | |
| Lenovo ThinkPad P16v G1 AMD | |
| Lenovo ThinkPad P16 G1 21D6001DMB | |
| PCMark 10 / Essentials | |
| Lenovo ThinkPad P1 G6-21FV000DGE | |
| HP ZBook Fury 16 G10 | |
| Lenovo ThinkPad P16 G2 21FA000FGE | |
| Average Intel Core i7-13700HX, NVIDIA RTX 2000 Ada Generation Laptop (n=1) | |
| HP ZBook Power 15 G10 | |
| Average of class Workstation (9622 - 11157, n=19, last 2 years) | |
| Lenovo ThinkPad P16v G1 AMD | |
| Lenovo ThinkPad P16 G1 21D6001DMB | |
| PCMark 10 / Productivity | |
| Average of class Workstation (8789 - 20616, n=19, last 2 years) | |
| Lenovo ThinkPad P1 G6-21FV000DGE | |
| Lenovo ThinkPad P16v G1 AMD | |
| HP ZBook Power 15 G10 | |
| Lenovo ThinkPad P16 G2 21FA000FGE | |
| Average Intel Core i7-13700HX, NVIDIA RTX 2000 Ada Generation Laptop (n=1) | |
| Lenovo ThinkPad P16 G1 21D6001DMB | |
| HP ZBook Fury 16 G10 | |
| PCMark 10 / Digital Content Creation | |
| HP ZBook Fury 16 G10 | |
| Average of class Workstation (8108 - 15631, n=19, last 2 years) | |
| HP ZBook Power 15 G10 | |
| Lenovo ThinkPad P1 G6-21FV000DGE | |
| Lenovo ThinkPad P16 G2 21FA000FGE | |
| Average Intel Core i7-13700HX, NVIDIA RTX 2000 Ada Generation Laptop (n=1) | |
| Lenovo ThinkPad P16v G1 AMD | |
| Lenovo ThinkPad P16 G1 21D6001DMB | |
| CrossMark / Overall | |
| Average of class Workstation (1307 - 2267, n=22, last 2 years) | |
| HP ZBook Fury 16 G10 | |
| Lenovo ThinkPad P1 G6-21FV000DGE | |
| Lenovo ThinkPad P16 G2 21FA000FGE | |
| Average Intel Core i7-13700HX, NVIDIA RTX 2000 Ada Generation Laptop (n=1) | |
| Lenovo ThinkPad P16 G1 21D6001DMB | |
| HP ZBook Power 15 G10 | |
| Lenovo ThinkPad P16v G1 AMD | |
| CrossMark / Productivity | |
| HP ZBook Fury 16 G10 | |
| Lenovo ThinkPad P1 G6-21FV000DGE | |
| Average of class Workstation (1130 - 2122, n=22, last 2 years) | |
| Lenovo ThinkPad P16 G2 21FA000FGE | |
| Average Intel Core i7-13700HX, NVIDIA RTX 2000 Ada Generation Laptop (n=1) | |
| Lenovo ThinkPad P16 G1 21D6001DMB | |
| HP ZBook Power 15 G10 | |
| Lenovo ThinkPad P16v G1 AMD | |
| CrossMark / Creativity | |
| Average of class Workstation (1657 - 2725, n=22, last 2 years) | |
| Lenovo ThinkPad P16 G2 21FA000FGE | |
| Average Intel Core i7-13700HX, NVIDIA RTX 2000 Ada Generation Laptop (n=1) | |
| HP ZBook Fury 16 G10 | |
| Lenovo ThinkPad P1 G6-21FV000DGE | |
| Lenovo ThinkPad P16 G1 21D6001DMB | |
| HP ZBook Power 15 G10 | |
| Lenovo ThinkPad P16v G1 AMD | |
| CrossMark / Responsiveness | |
| HP ZBook Fury 16 G10 | |
| Average of class Workstation (993 - 2096, n=22, last 2 years) | |
| Lenovo ThinkPad P1 G6-21FV000DGE | |
| Lenovo ThinkPad P16 G2 21FA000FGE | |
| Average Intel Core i7-13700HX, NVIDIA RTX 2000 Ada Generation Laptop (n=1) | |
| Lenovo ThinkPad P16 G1 21D6001DMB | |
| Lenovo ThinkPad P16v G1 AMD | |
| HP ZBook Power 15 G10 | |
| WebXPRT 3 / Overall | |
| Lenovo ThinkPad P16v G1 AMD | |
| HP ZBook Fury 16 G10 | |
| Lenovo ThinkPad P16 G2 21FA000FGE | |
| Average Intel Core i7-13700HX, NVIDIA RTX 2000 Ada Generation Laptop (n=1) | |
| Lenovo ThinkPad P1 G6-21FV000DGE | |
| Average of class Workstation (260 - 360, n=23, last 2 years) | |
| HP ZBook Power 15 G10 | |
| Lenovo ThinkPad P16 G1 21D6001DMB | |
| WebXPRT 4 / Overall | |
| Lenovo ThinkPad P1 G6-21FV000DGE | |
| HP ZBook Fury 16 G10 | |
| Average of class Workstation (189.2 - 326, n=23, last 2 years) | |
| Lenovo ThinkPad P16v G1 AMD | |
| HP ZBook Power 15 G10 | |
| Lenovo ThinkPad P16 G1 21D6001DMB | |
| Mozilla Kraken 1.1 / Total | |
| HP ZBook Power 15 G10 | |
| Lenovo ThinkPad P16v G1 AMD | |
| Lenovo ThinkPad P16 G1 21D6001DMB | |
| Lenovo ThinkPad P16 G2 21FA000FGE | |
| Average Intel Core i7-13700HX, NVIDIA RTX 2000 Ada Generation Laptop (n=1) | |
| Lenovo ThinkPad P1 G6-21FV000DGE | |
| Average of class Workstation (411 - 538, n=23, last 2 years) | |
| HP ZBook Fury 16 G10 | |
* ... smaller is better
| PCMark 10 Score | 7154 points | |
Help | ||
| AIDA64 / Memory Copy | |
| Average of class Workstation (56003 - 164795, n=23, last 2 years) | |
| HP ZBook Power 15 G10 | |
| HP ZBook Fury 16 G10 | |
| Lenovo ThinkPad P16 G2 21FA000FGE | |
| Average Intel Core i7-13700HX (36125 - 63990, n=11) | |
| Lenovo ThinkPad P16 G1 21D6001DMB | |
| Lenovo ThinkPad P1 G6-21FV000DGE | |
| Lenovo ThinkPad P16v G1 AMD | |
| AIDA64 / Memory Read | |
| Average of class Workstation (55795 - 121563, n=23, last 2 years) | |
| HP ZBook Fury 16 G10 | |
| HP ZBook Power 15 G10 | |
| Average Intel Core i7-13700HX (36510 - 69729, n=11) | |
| Lenovo ThinkPad P16 G1 21D6001DMB | |
| Lenovo ThinkPad P16 G2 21FA000FGE | |
| Lenovo ThinkPad P1 G6-21FV000DGE | |
| Lenovo ThinkPad P16v G1 AMD | |
| AIDA64 / Memory Write | |
| Average of class Workstation (55663 - 214520, n=23, last 2 years) | |
| HP ZBook Power 15 G10 | |
| HP ZBook Fury 16 G10 | |
| Average Intel Core i7-13700HX (33598 - 85675, n=11) | |
| Lenovo ThinkPad P16 G2 21FA000FGE | |
| Lenovo ThinkPad P16 G1 21D6001DMB | |
| Lenovo ThinkPad P16v G1 AMD | |
| Lenovo ThinkPad P1 G6-21FV000DGE | |
| AIDA64 / Memory Latency | |
| Average of class Workstation (84.5 - 165.2, n=23, last 2 years) | |
| Lenovo ThinkPad P16v G1 AMD | |
| HP ZBook Power 15 G10 | |
| HP ZBook Fury 16 G10 | |
| Lenovo ThinkPad P16 G2 21FA000FGE | |
| Lenovo ThinkPad P16 G1 21D6001DMB | |
| Average Intel Core i7-13700HX (81.5 - 97.9, n=11) | |
| Lenovo ThinkPad P1 G6-21FV000DGE | |
* ... smaller is better
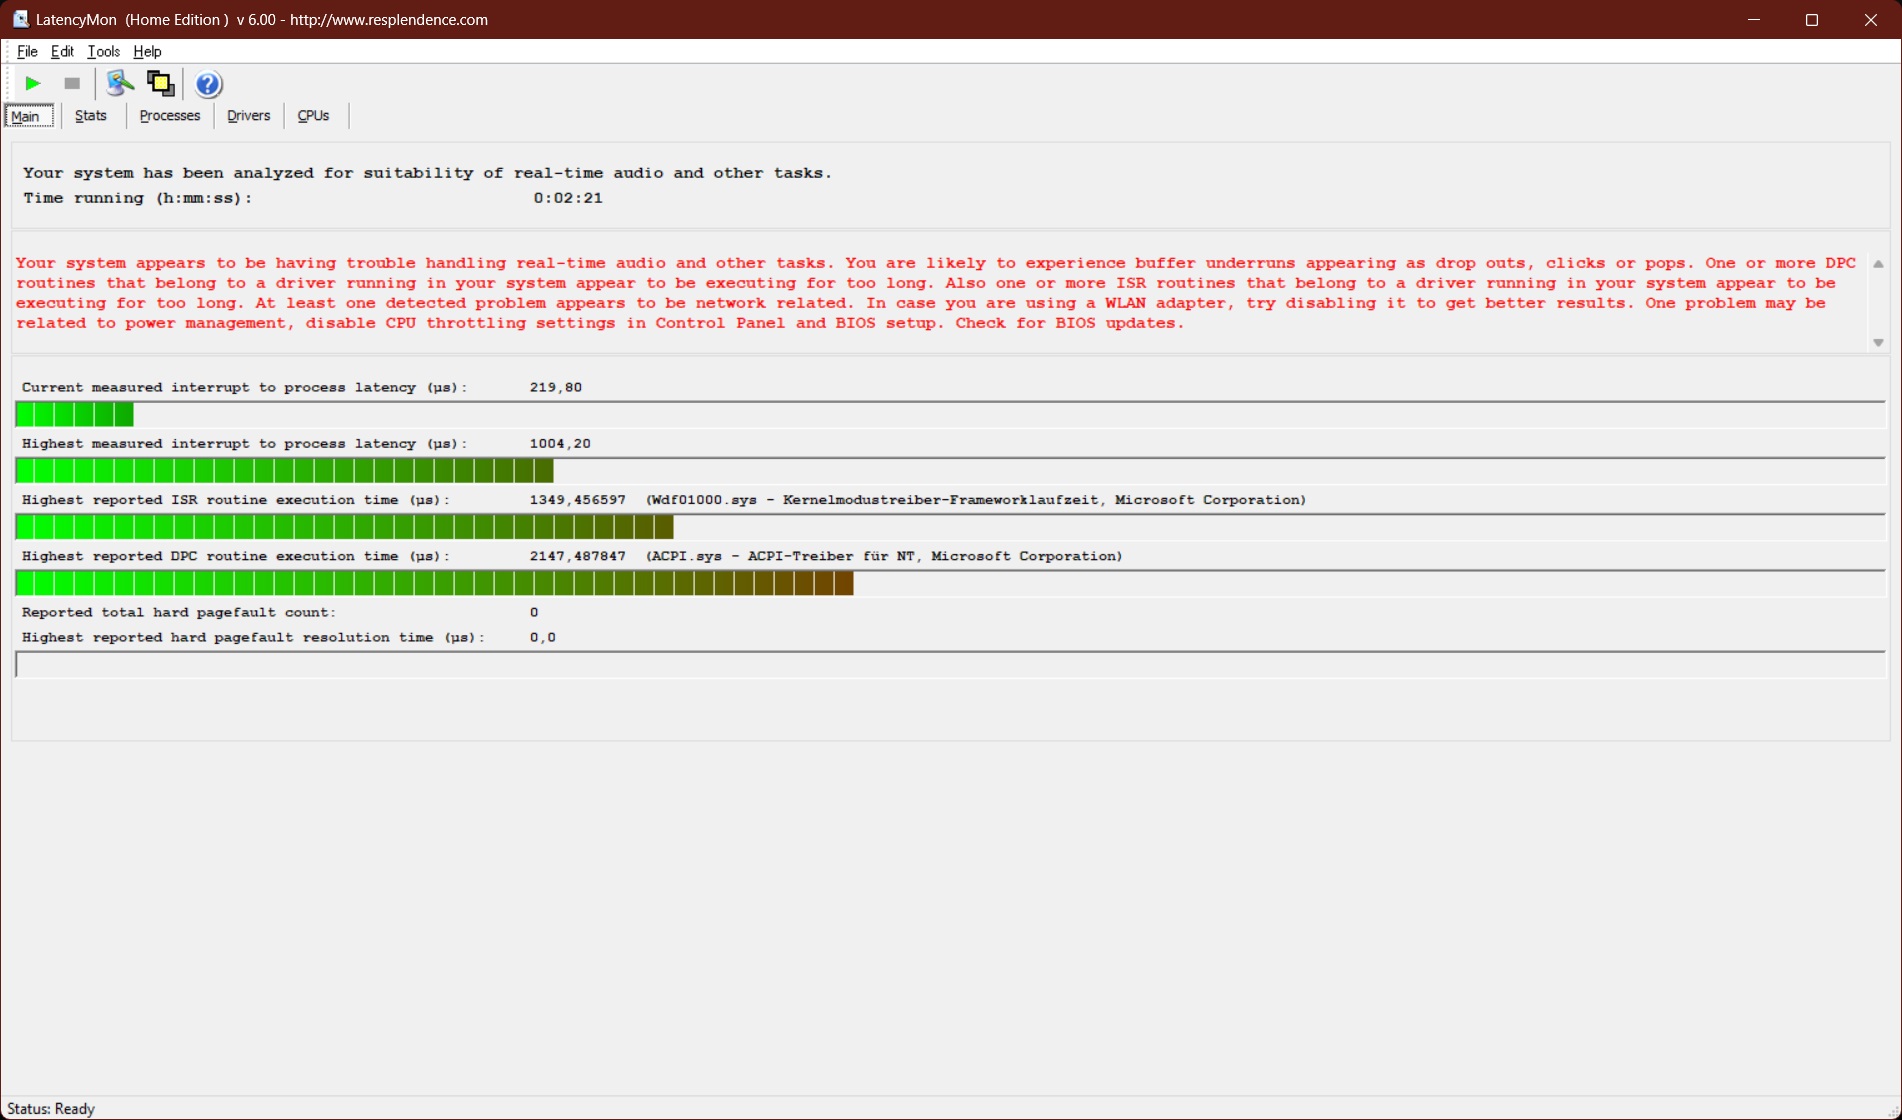
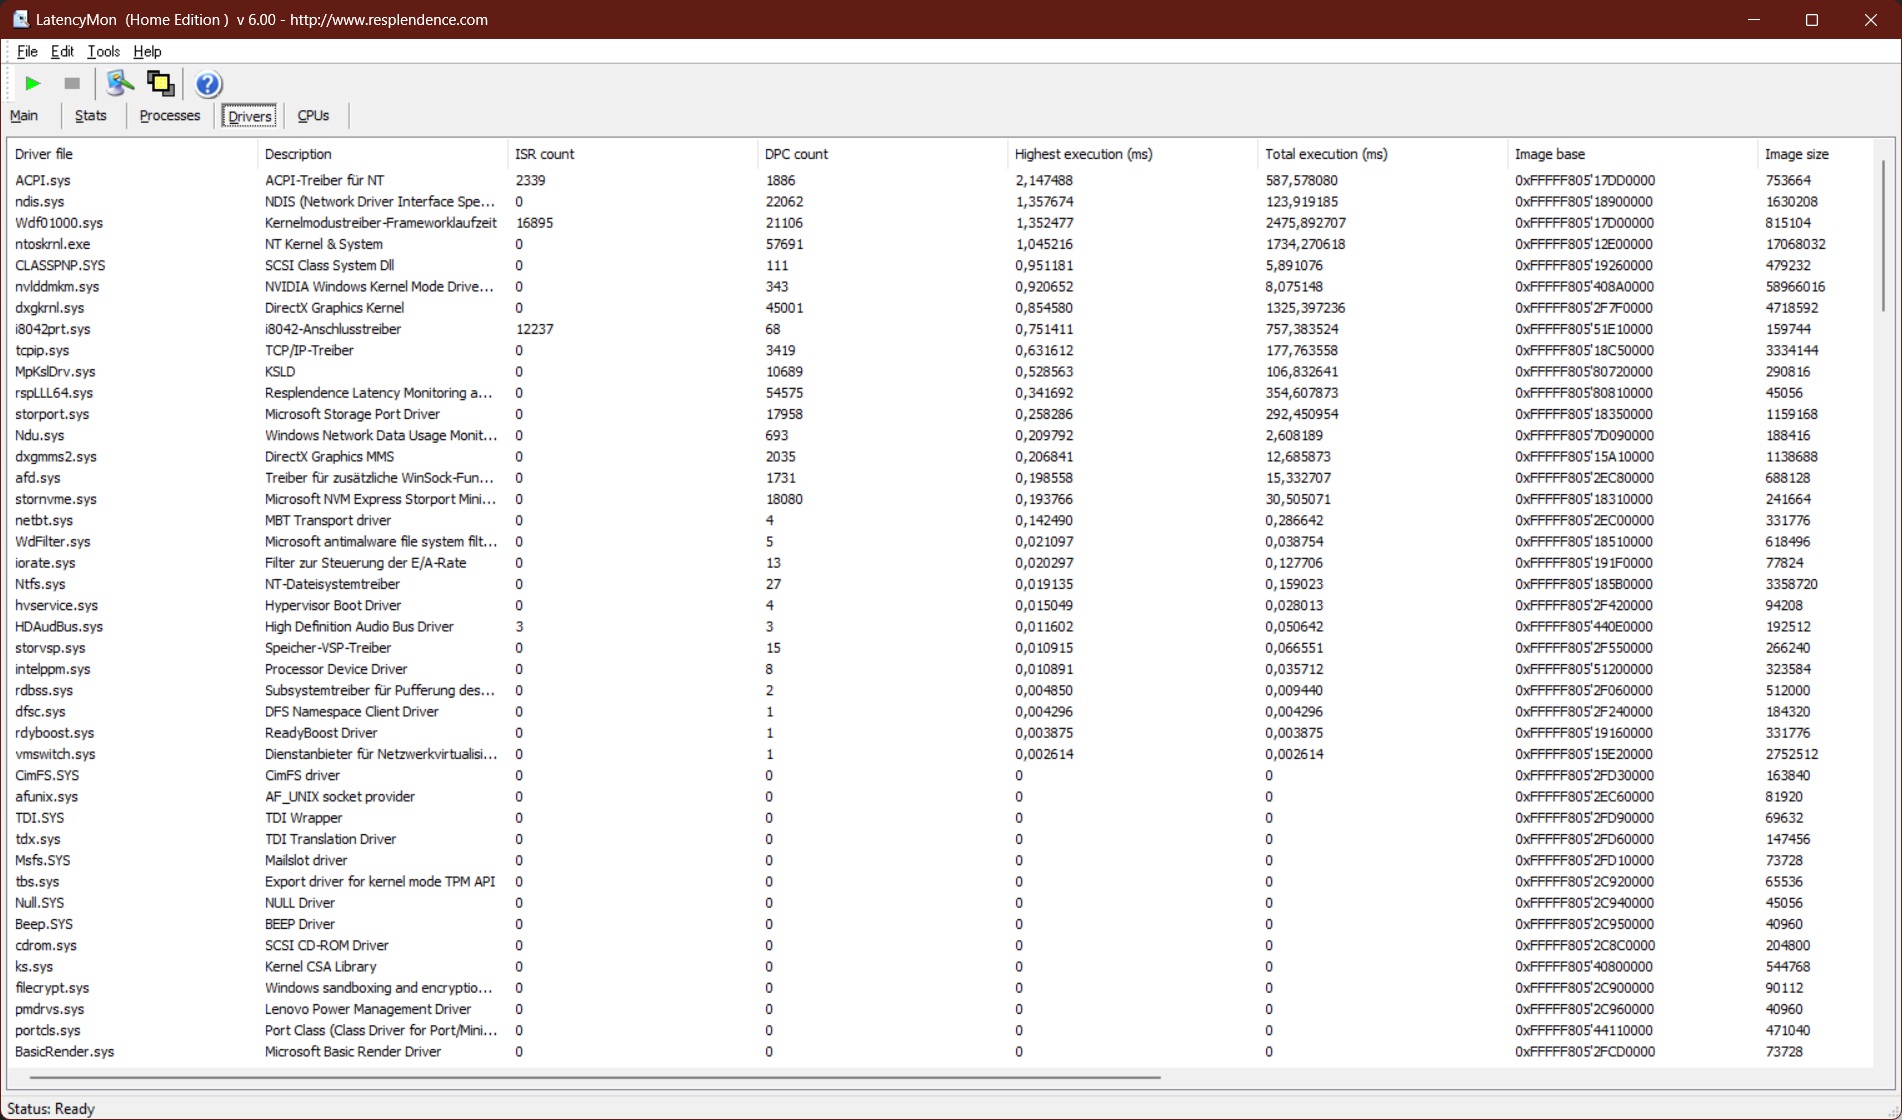
DPC Latency
The system has some trouble when it comes to DPC latency sensitive work. Lenovo could fix those issues at any point though with a driver and/or BIOS update.
| DPC Latencies / LatencyMon - interrupt to process latency (max), Web, Youtube, Prime95 | |
| HP ZBook Fury 16 G10 | |
| Lenovo ThinkPad P1 G6-21FV000DGE | |
| HP ZBook Power 15 G10 | |
| Lenovo ThinkPad P16 G1 21D6001DMB | |
| Lenovo ThinkPad P16 G2 21FA000FGE | |
| Lenovo ThinkPad P16v G1 AMD | |
* ... smaller is better
Storage Devices
Lenovo's ThinkPad P16 Gen 2 contains a 1 TB SSD made by SK Hynix. It is a fast M.2 2280 drive connected via NVMe PCIe Gen 4. While the SSD lags behind the competition in the benchmarks, the difference is not substantial.
What is substantial: There are only two M.2 2280 slots, with one free ex-factory. While this is better than most laptops, HP's ZBook Fury 16 G10 has four M.2 2280 bays, outclassing the ThinkPad in terms of storage.

* ... smaller is better
Disk Throttling: DiskSpd Read Loop, Queue Depth 8
GPU Performance
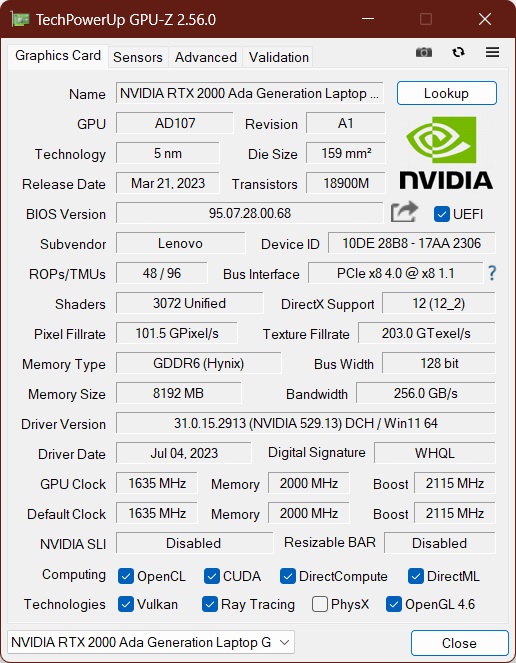
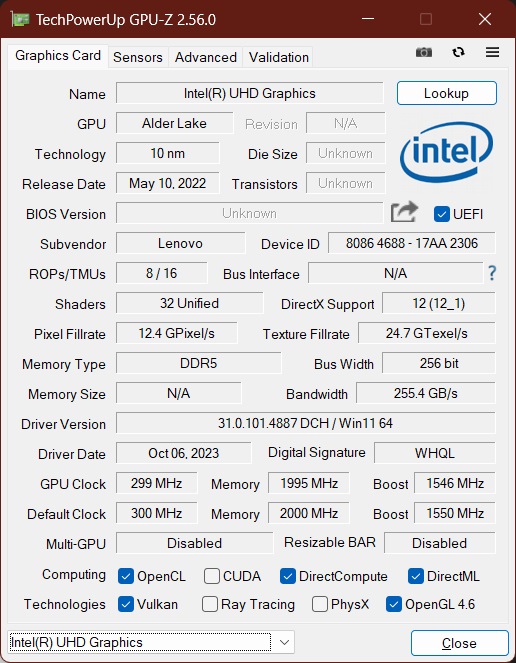
The Nvidia RTX 2000 Ada is a current entry level Nvidia GPU for the professional market based on the Ada Lovelace generation. As a professional chip, this graphics card is made for tasks like CAD and it has special ISV optimized drivers.
In the ThinkPad P16 G2, it can consume up to 80 W, with 20 W of dynamic boost. This puts the ThinkPad P16 ahead of the ThinkPad P1 Gen 6 with the same GPU, as the P1 is limited to 65 W, 15 W of which was dynamic boost. The difference is visible in the 3DMark benchmarks, where the P16 is roughly 27 percent faster than the P1 on average. Of course, the HP ZBook Fury 16 G10 is far superior in terms of the GPU performance, but this model also contains the Nvidia RTX 5000 Ada.
As with the processor, the GPU performance is tuned down when the device runs only on the battery.
| 3DMark 11 Performance | 29077 points | |
| 3DMark Cloud Gate Standard Score | 58198 points | |
| 3DMark Fire Strike Score | 22505 points | |
| 3DMark Time Spy Score | 9628 points | |
Help | ||
* ... smaller is better
Gaming Performance
It is certainly not made for gaming, but the Lenovo ThinkPad P16 Gen 2 is quite capable when it comes to playing games. Even recent titles should run, though maybe just in the high graphics settings instead of ultra. Older games can also be played in the native QHD resolution of the internal display. For 4K gaming, the GPU is not quite powerful enough. Also, the 8 GB VRAM may be a hindrance in some cases.
| The Witcher 3 - 1920x1080 Ultra Graphics & Postprocessing (HBAO+) | |
| HP ZBook Fury 16 G10 | |
| Lenovo ThinkPad P16 G2 21FA000FGE | |
| Average of class Workstation (n=1last 2 years) | |
| Lenovo ThinkPad P1 G6-21FV000DGE | |
| HP ZBook Power 15 G10 | |
| Lenovo ThinkPad P16 21D6001DMB A2000 Retest | |
| Lenovo ThinkPad P16v G1 AMD | |
Witcher 3 FPS Chart
| low | med. | high | ultra | QHD | |
|---|---|---|---|---|---|
| GTA V (2015) | 176.3 | 173.4 | 163.6 | 98 | 76.8 |
| The Witcher 3 (2015) | 424 | 291 | 184.5 | 95.6 | |
| Dota 2 Reborn (2015) | 188.2 | 168.7 | 160.7 | 150.2 | |
| Final Fantasy XV Benchmark (2018) | 199.2 | 120.3 | 84.2 | 61.3 | |
| X-Plane 11.11 (2018) | 156.5 | 133.5 | 103.4 | ||
| Strange Brigade (2018) | 408 | 231 | 184.2 | 158.4 | 103.9 |
| F1 23 (2023) | 201 | 191.1 | 147 | 49.2 | 31.6 |
Emissions: ThinkPad P16 does not run hot, but loud
System Noise
The fan noice characteristics paint a mixed picture. While idling, the fans of the Lenovo ThinkPad P16 G2 tend to turn on faster compared with the HP ZBook Fury 16 G10. And under maximum load, the fans are much louder than on the HP, reaching a loud 56 dB(a) as the maximum. However, under medium load, the Lenovo ThinkPad laptop stays quieter than the HP. Saying that the Lenovo is the louder laptop thus is not true for every scenario. Interestingly, the HP has the faster RTX 5000 Ada, so a ThinkPad P16 G2 with that chip might outperform the ZBook, thanks to the louder fan under maximum load.
We did not detect coil-while with our review device.
Noise level
| Idle |
| 23.5 / 29.2 / 29.5 dB(A) |
| Load |
| 32.7 / 56.6 dB(A) |
 | ||
30 dB silent 40 dB(A) audible 50 dB(A) loud |
||
min: | ||
| Lenovo ThinkPad P16 G2 21FA000FGE RTX 2000 Ada Generation Laptop, i7-13700HX, SK hynix PC801 HFS001TEJ9X162N | Lenovo ThinkPad P16 G1 21D6001DMB RTX A2000 Laptop GPU, i7-12850HX, Micron 3400 1TB MTFDKBA1T0TFH | HP ZBook Fury 16 G10 RTX 5000 Ada Generation Laptop, i9-13950HX, SK hynix PC801 HFS001TEJ9X101N | Lenovo ThinkPad P1 G6-21FV000DGE RTX 2000 Ada Generation Laptop, i9-13900H, SK Hynix PC711 1TB HFS001TDE9X084N | HP ZBook Power 15 G10 RTX 2000 Ada Generation Laptop, R7 PRO 7840HS, WDC PC SN810 2TB | Lenovo ThinkPad P16v G1 AMD RTX A1000 Laptop GPU, R7 PRO 7840HS, SK hynix PC801 HFS001TEJ9X101N | |
|---|---|---|---|---|---|---|
| Noise | 5% | 6% | 2% | 10% | 6% | |
| off / environment * (dB) | 23.5 | 23.2 1% | 22.9 3% | 24.5 -4% | 24.2 -3% | 24.3 -3% |
| Idle Minimum * (dB) | 23.5 | 23.2 1% | 22.9 3% | 24.5 -4% | 24.4 -4% | 24.3 -3% |
| Idle Average * (dB) | 29.2 | 23.2 21% | 22.9 22% | 24.5 16% | 24.4 16% | 24.3 17% |
| Idle Maximum * (dB) | 29.5 | 23.2 21% | 28.5 3% | 24.5 17% | 24.4 17% | 24.3 18% |
| Load Average * (dB) | 32.7 | 47.8 -46% | 40.6 -24% | 48 -47% | 27.4 16% | 35.7 -9% |
| Witcher 3 ultra * (dB) | 50.6 | 34.1 33% | 44.1 13% | 40.7 20% | 43.3 14% | 43.7 14% |
| Load Maximum * (dB) | 56.6 | 56.3 1% | 45.8 19% | 48 15% | 46.8 17% | 50.2 11% |
* ... smaller is better
Temperature
The device stays completely cool when idling, there is some heat build up under load. In particular, the area around the TrackPoint and the middle of the keyboard does heat up. The maximum temperature of 47 degrees Celsius is measured here. The rest of the machine mostly stays cool to the touch, despite the powerful components on the inside.
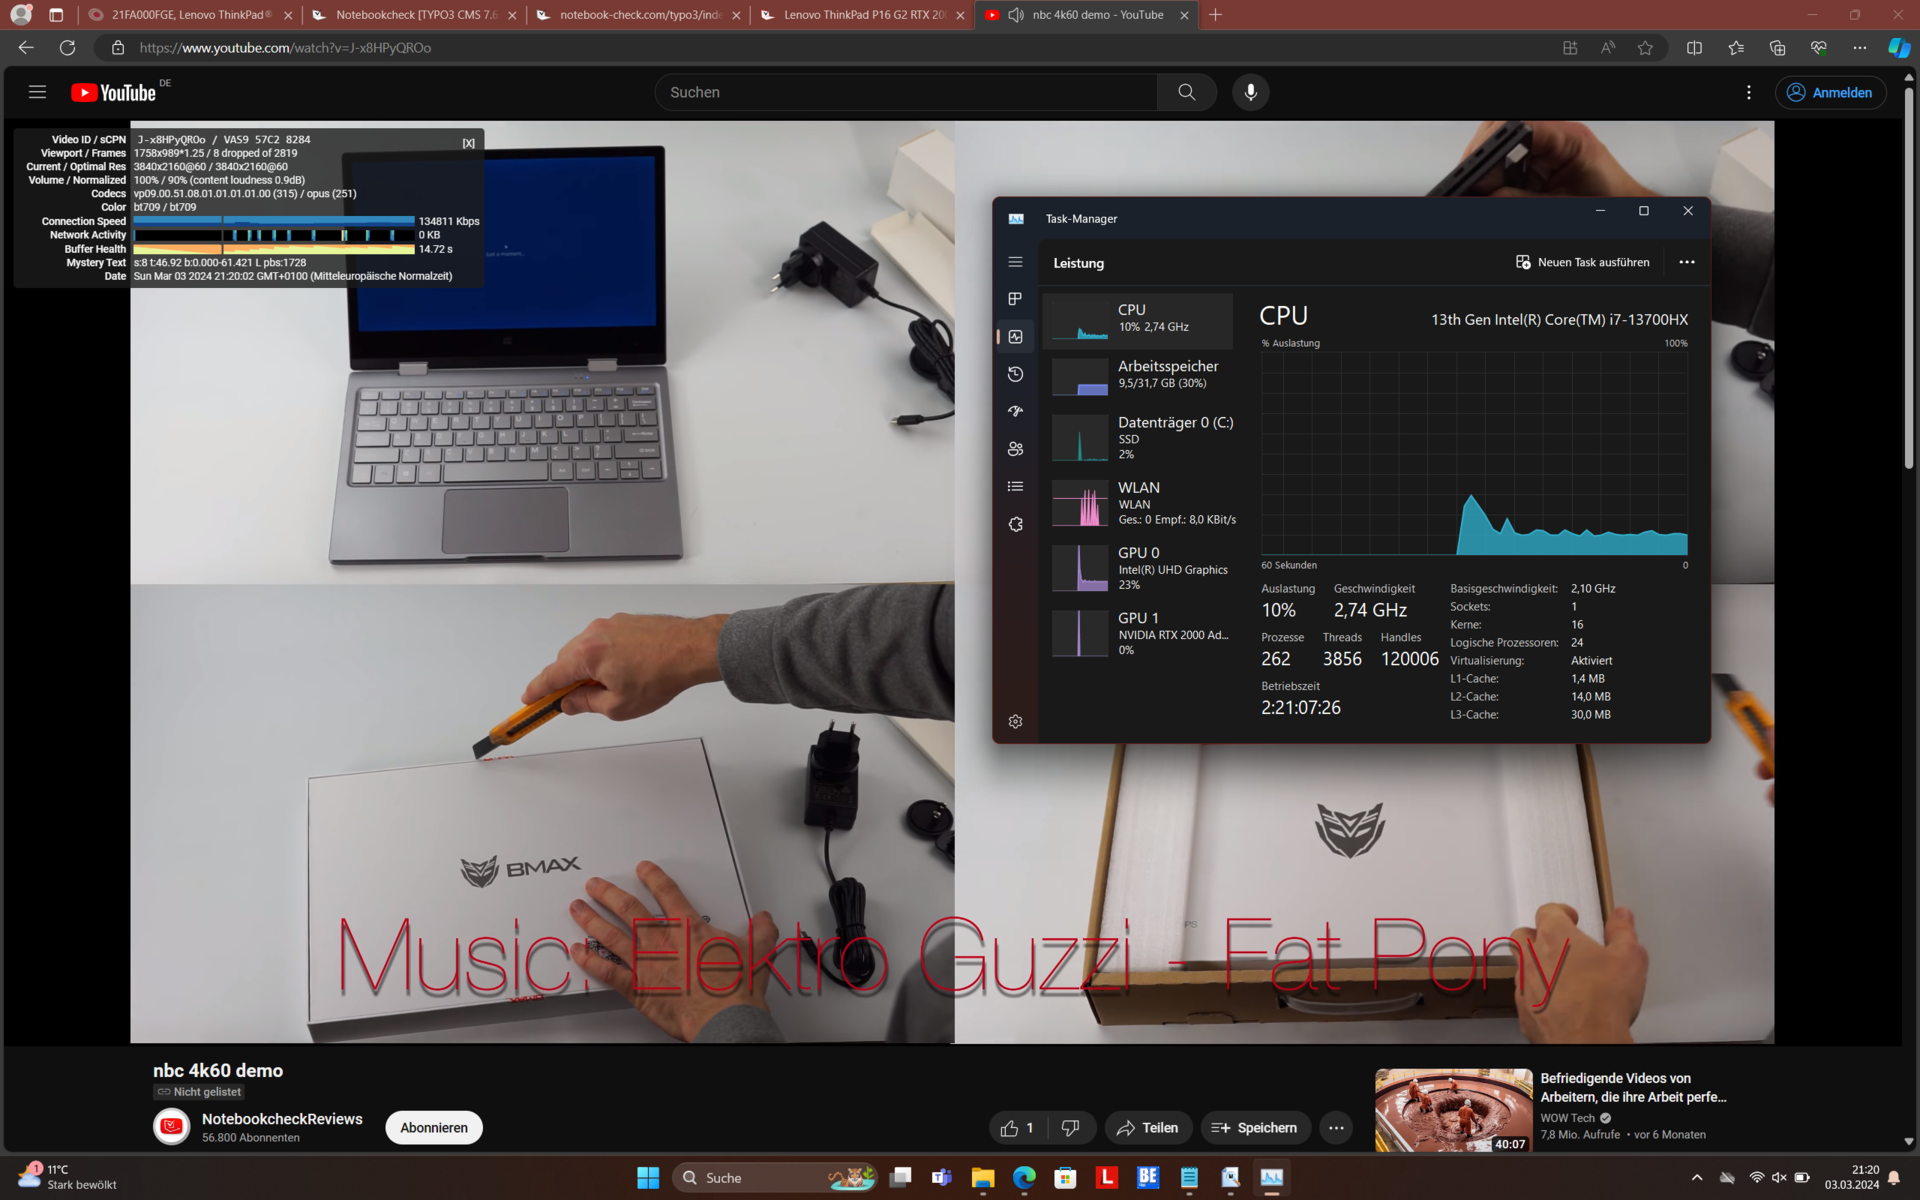
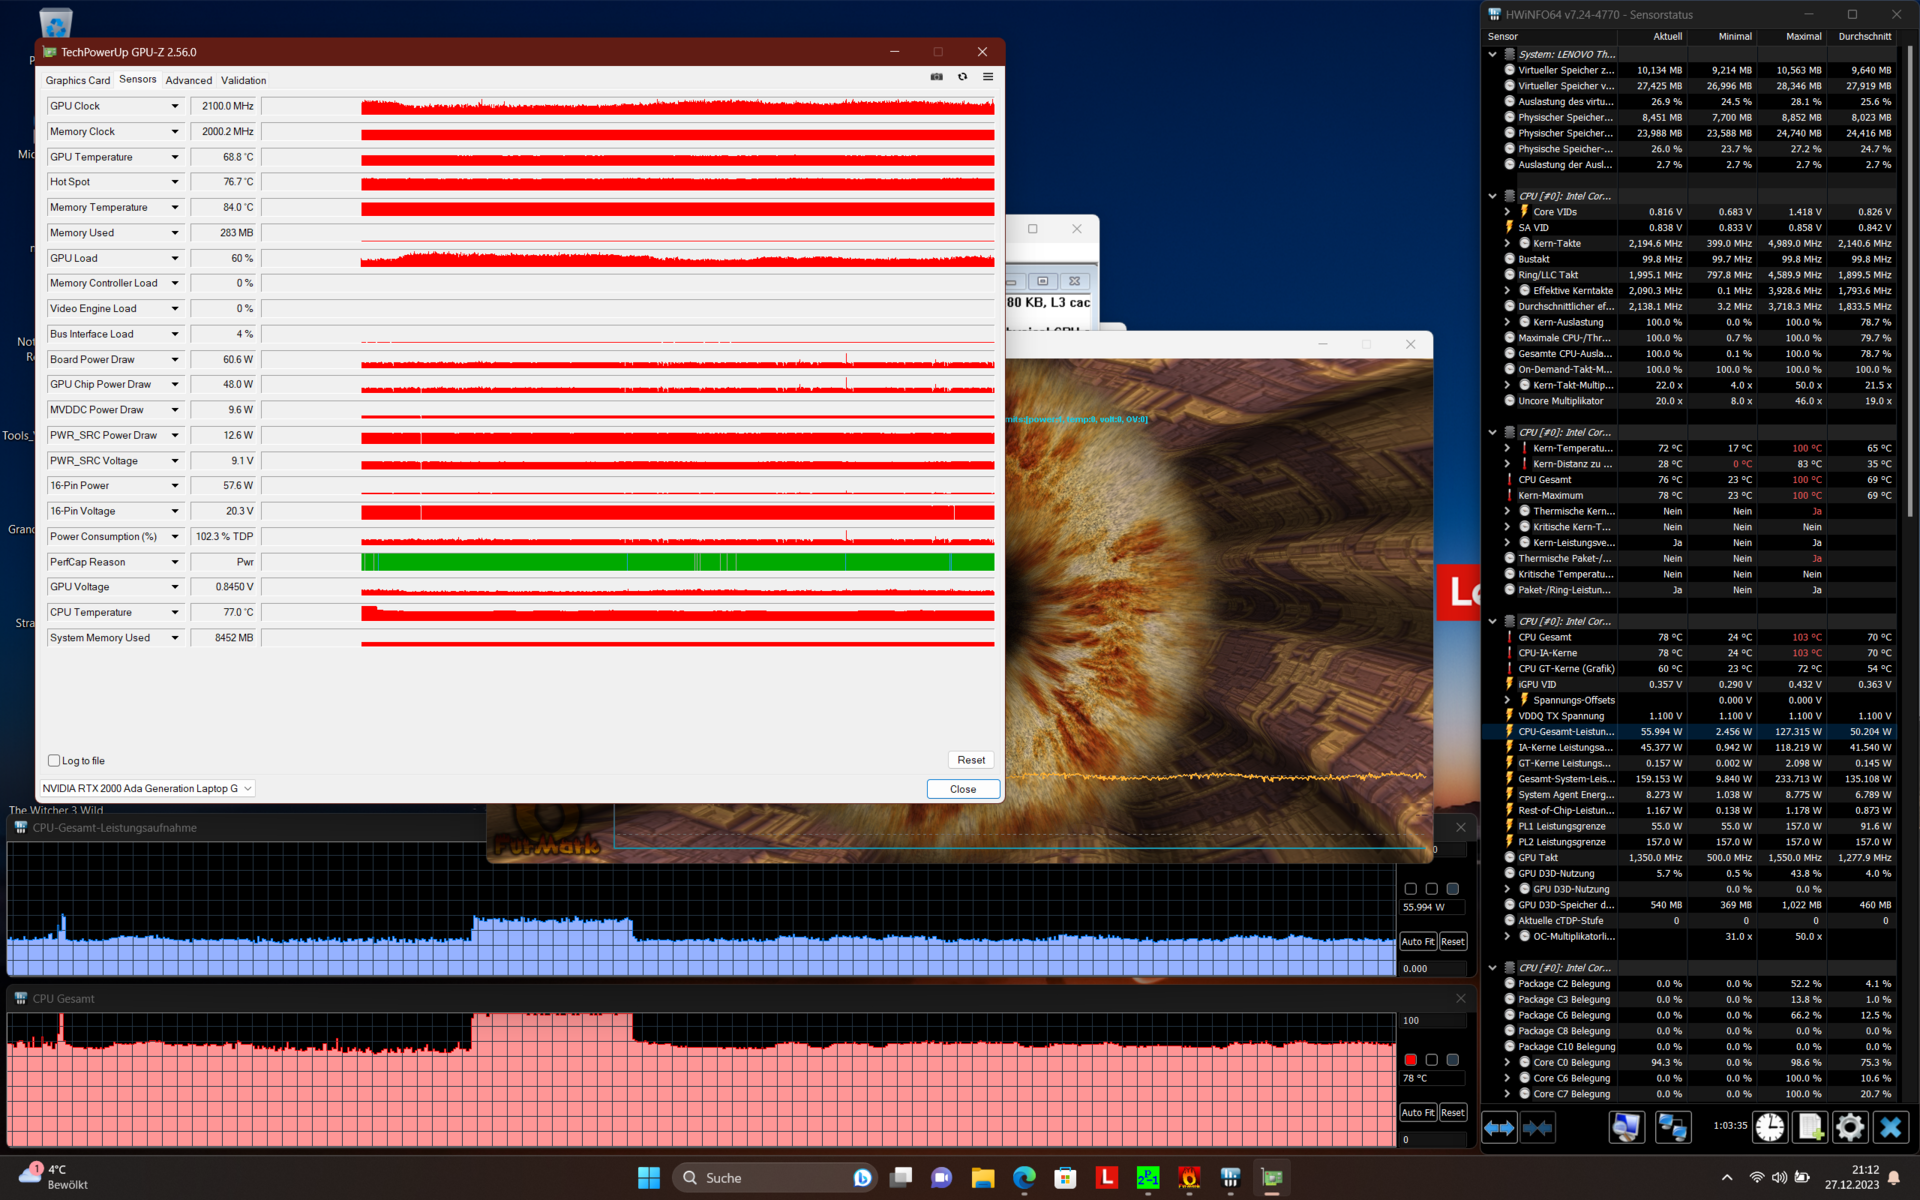
When running the stress test with combined CPU and GPU load, the Nvidia GPU works without any throttling. The CPU does get limited to 55 W though.
(-) The maximum temperature on the upper side is 47.2 °C / 117 F, compared to the average of 38.2 °C / 101 F, ranging from 22.2 to 69.8 °C for the class Workstation.
(+) The bottom heats up to a maximum of 39.5 °C / 103 F, compared to the average of 41.1 °C / 106 F
(+) In idle usage, the average temperature for the upper side is 24.2 °C / 76 F, compared to the device average of 32 °C / 90 F.
(+) Playing The Witcher 3, the average temperature for the upper side is 31 °C / 88 F, compared to the device average of 32 °C / 90 F.
(+) The palmrests and touchpad are cooler than skin temperature with a maximum of 31.2 °C / 88.2 F and are therefore cool to the touch.
(-) The average temperature of the palmrest area of similar devices was 27.8 °C / 82 F (-3.4 °C / -6.2 F).
| Lenovo ThinkPad P16 G2 21FA000FGE Intel Core i7-13700HX, NVIDIA RTX 2000 Ada Generation Laptop | Lenovo ThinkPad P16 G1 21D6001DMB Intel Core i7-12850HX, NVIDIA RTX A2000 Laptop GPU | HP ZBook Fury 16 G10 Intel Core i9-13950HX, NVIDIA RTX 5000 Ada Generation Laptop | Lenovo ThinkPad P1 G6-21FV000DGE Intel Core i9-13900H, NVIDIA RTX 2000 Ada Generation Laptop | HP ZBook Power 15 G10 AMD Ryzen 7 PRO 7840HS, NVIDIA RTX 2000 Ada Generation Laptop | Lenovo ThinkPad P16v G1 AMD AMD Ryzen 7 PRO 7840HS, NVIDIA RTX A1000 Laptop GPU | |
|---|---|---|---|---|---|---|
| Heat | 2% | -18% | -13% | -4% | -6% | |
| Maximum Upper Side * (°C) | 47.2 | 43.1 9% | 44.8 5% | 47.1 -0% | 42.4 10% | 40.9 13% |
| Maximum Bottom * (°C) | 39.5 | 39.9 -1% | 50 -27% | 56.5 -43% | 47.8 -21% | 57.9 -47% |
| Idle Upper Side * (°C) | 28.1 | 26 7% | 34.4 -22% | 28.1 -0% | 26.8 5% | 24.5 13% |
| Idle Bottom * (°C) | 25.3 | 27.6 -9% | 31.8 -26% | 27.6 -9% | 27.2 -8% | 25.5 -1% |
* ... smaller is better
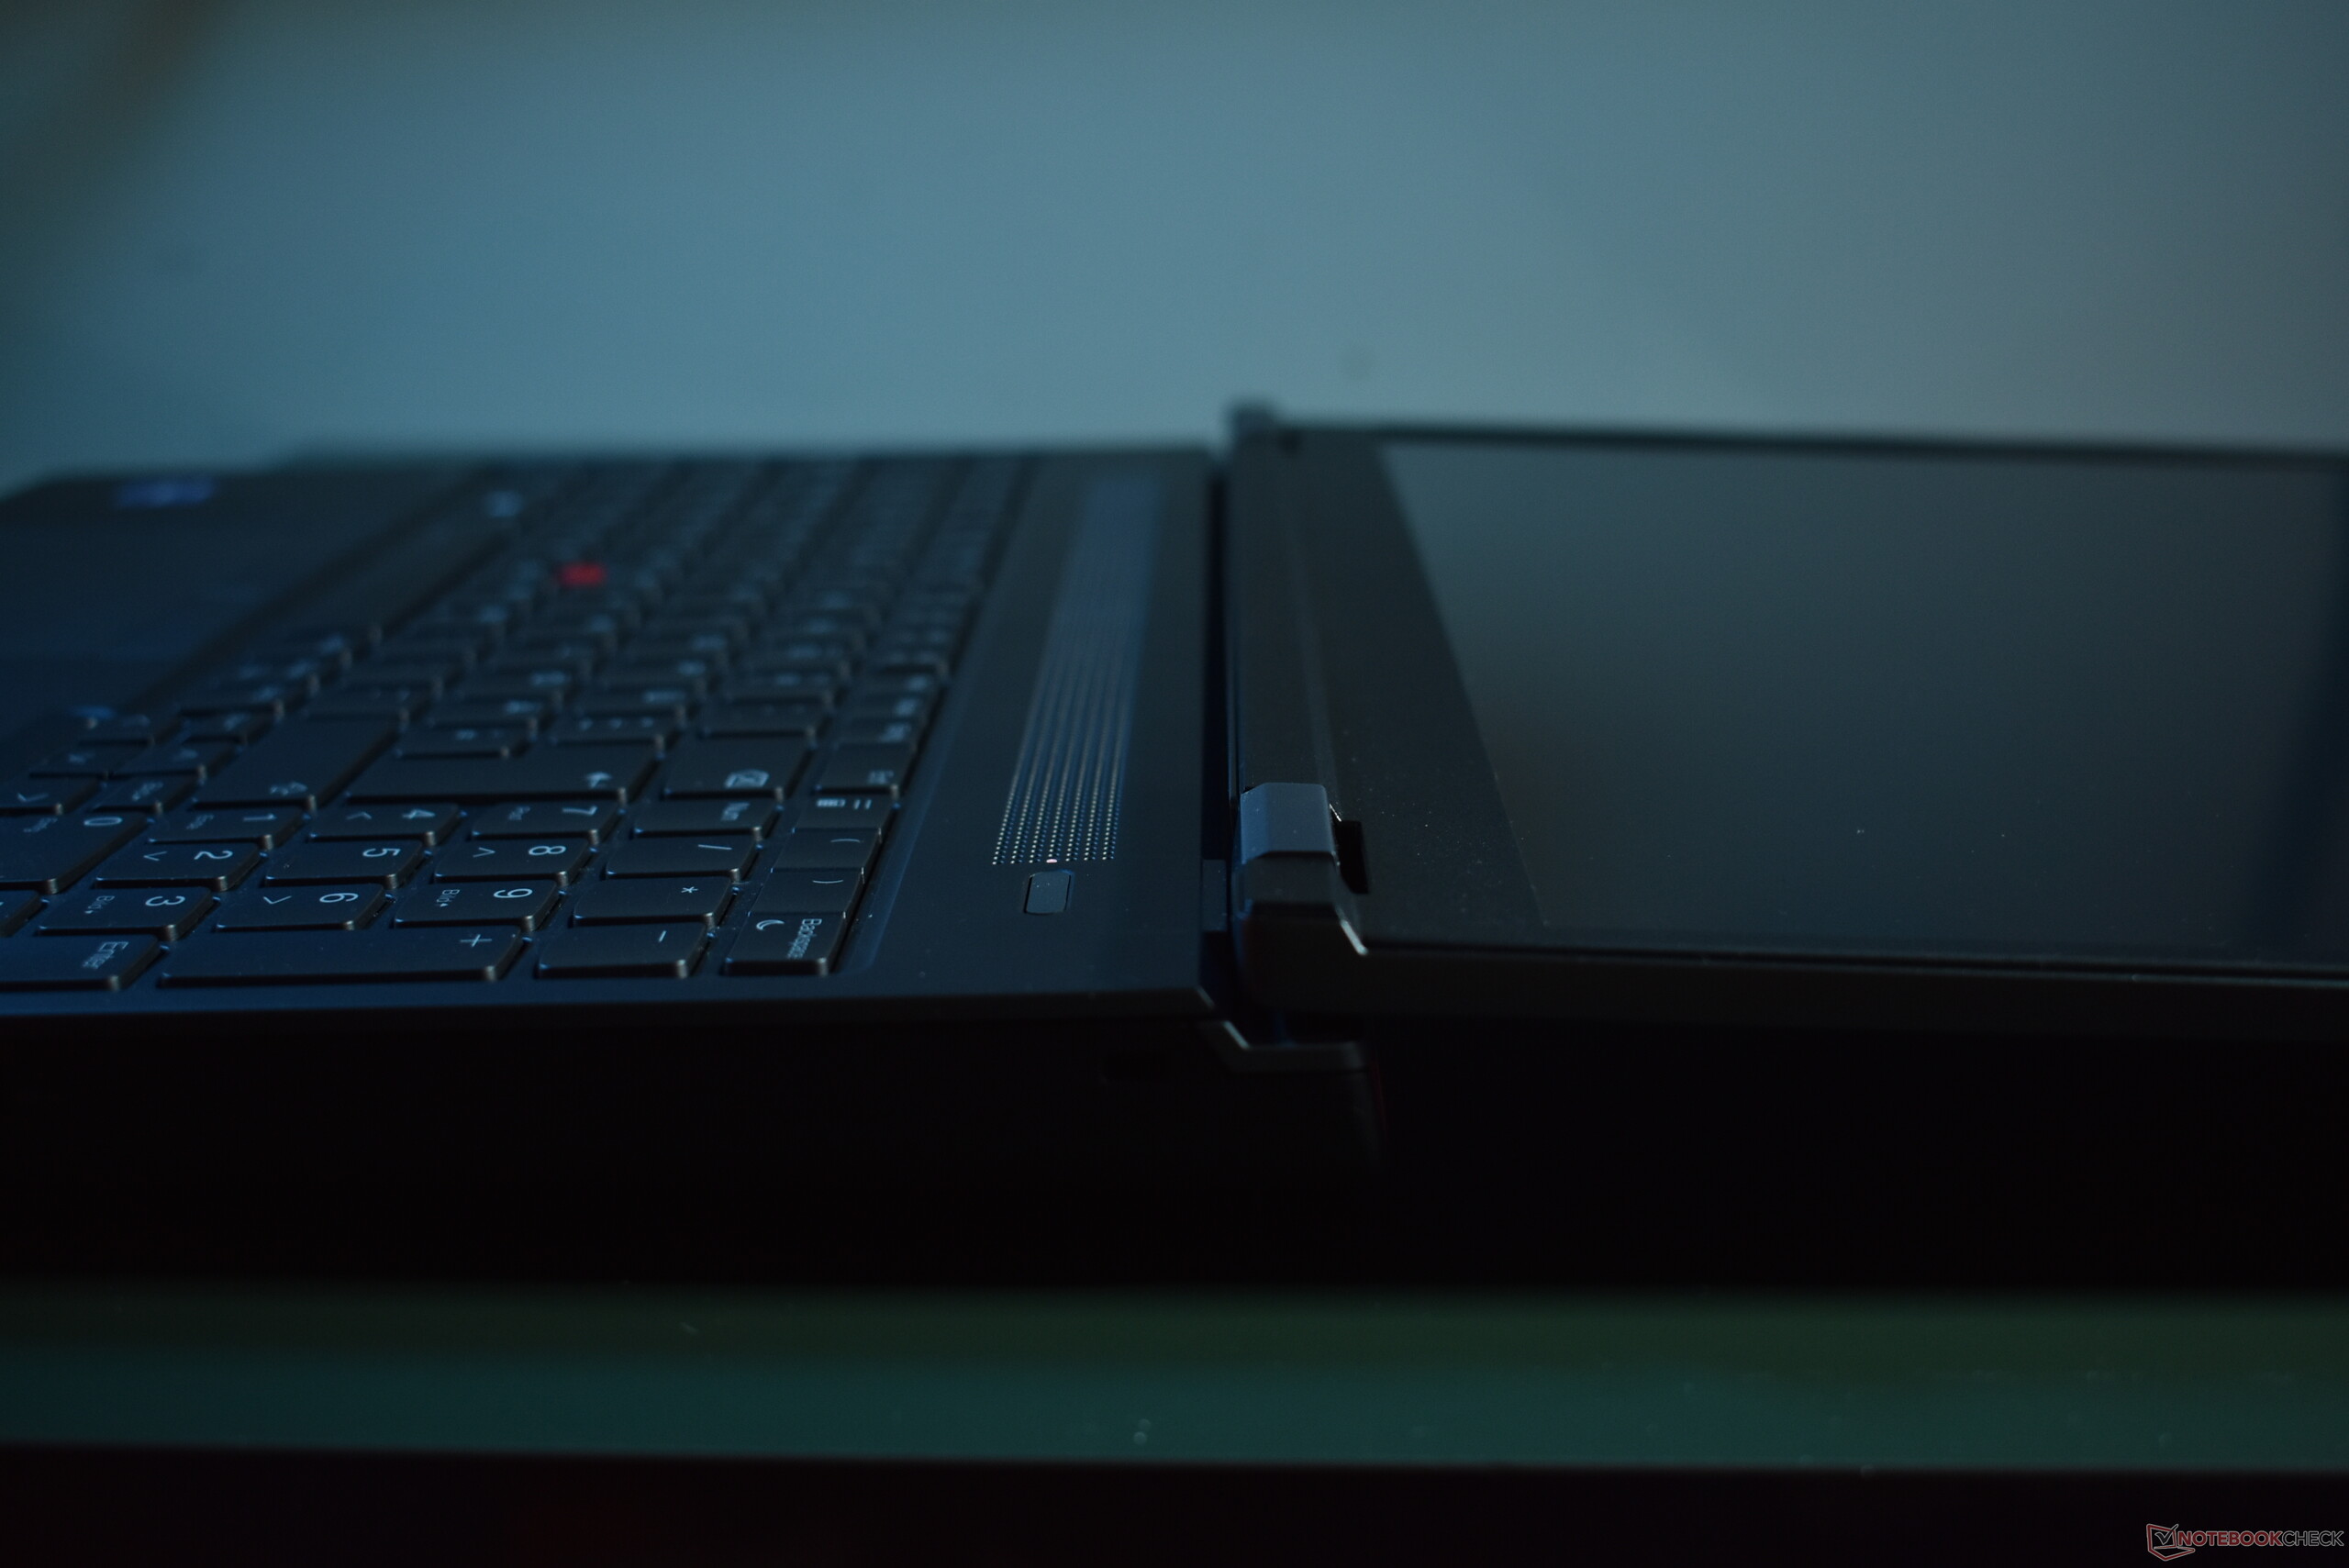
Speakers
The up-firing stereo speakers that Lenovo places above the keyboard deliver adequate sound, although clearly lacking in terms of volume compared with HP's ZBook Fury 16 G10. In loud environments, the ThinkPad will do noticably worse.
Lenovo ThinkPad P16 G2 21FA000FGE audio analysis
(±) | speaker loudness is average but good (79.1 dB)
Bass 100 - 315 Hz
(±) | reduced bass - on average 11.1% lower than median
(±) | linearity of bass is average (9.7% delta to prev. frequency)
Mids 400 - 2000 Hz
(±) | higher mids - on average 5.9% higher than median
(+) | mids are linear (5.1% delta to prev. frequency)
Highs 2 - 16 kHz
(+) | balanced highs - only 3.6% away from median
(+) | highs are linear (6.3% delta to prev. frequency)
Overall 100 - 16.000 Hz
(+) | overall sound is linear (14.5% difference to median)
Compared to same class
» 30% of all tested devices in this class were better, 4% similar, 66% worse
» The best had a delta of 7%, average was 17%, worst was 35%
Compared to all devices tested
» 19% of all tested devices were better, 4% similar, 77% worse
» The best had a delta of 4%, average was 23%, worst was 134%
HP ZBook Fury 16 G10 audio analysis
(+) | speakers can play relatively loud (88.2 dB)
Bass 100 - 315 Hz
(±) | reduced bass - on average 7.7% lower than median
(±) | linearity of bass is average (8.7% delta to prev. frequency)
Mids 400 - 2000 Hz
(+) | balanced mids - only 1.2% away from median
(+) | mids are linear (3.3% delta to prev. frequency)
Highs 2 - 16 kHz
(+) | balanced highs - only 2.8% away from median
(+) | highs are linear (5.2% delta to prev. frequency)
Overall 100 - 16.000 Hz
(+) | overall sound is linear (8.6% difference to median)
Compared to same class
» 2% of all tested devices in this class were better, 1% similar, 96% worse
» The best had a delta of 7%, average was 17%, worst was 35%
Compared to all devices tested
» 2% of all tested devices were better, 1% similar, 97% worse
» The best had a delta of 4%, average was 23%, worst was 134%
Energy Management: Battery life takes a back seat for performance workhorse
Power Consumption
Power consumption is slightly increased compared with the previous generation of the ThinkPad P16. The difference is probably due to optimization of the drivers. Configuration wise, both workstation laptops are very similar.
The 2170 W slim tip charger is not quite sufficient for the maximum power consumption of around 180 W. Power consumption quickly drops though, so this is not a big problem.
| Off / Standby | |
| Idle | |
| Load |
|
Key:
min: | |
| Lenovo ThinkPad P16 G2 21FA000FGE i7-13700HX, RTX 2000 Ada Generation Laptop, SK hynix PC801 HFS001TEJ9X162N, IPS LED, 2560x1600, 16" | Lenovo ThinkPad P16 G1 21D6001DMB i7-12850HX, RTX A2000 Laptop GPU, Micron 3400 1TB MTFDKBA1T0TFH, IPS LED, 2560x1600, 16" | HP ZBook Fury 16 G10 i9-13950HX, RTX 5000 Ada Generation Laptop, SK hynix PC801 HFS001TEJ9X101N, IPS, 3840x2400, 16" | Lenovo ThinkPad P1 G6-21FV000DGE i9-13900H, RTX 2000 Ada Generation Laptop, SK Hynix PC711 1TB HFS001TDE9X084N, IPS, 2560x1600, 16" | HP ZBook Power 15 G10 R7 PRO 7840HS, RTX 2000 Ada Generation Laptop, WDC PC SN810 2TB, IPS, 2560x1440, 15.6" | Lenovo ThinkPad P16v G1 AMD R7 PRO 7840HS, RTX A1000 Laptop GPU, SK hynix PC801 HFS001TEJ9X101N, IPS, 1920x1200, 16" | Average NVIDIA RTX 2000 Ada Generation Laptop | Average of class Workstation | |
|---|---|---|---|---|---|---|---|---|
| Power Consumption | 28% | -37% | 13% | 30% | 47% | 18% | 3% | |
| Idle Minimum * (Watt) | 9.3 | 5.1 45% | 15.3 -65% | 8.3 11% | 5.3 43% | 4.1 56% | 6.88 ? 26% | 9.11 ? 2% |
| Idle Average * (Watt) | 14.1 | 9.2 35% | 18.2 -29% | 14.5 -3% | 9.9 30% | 6.5 54% | 12.1 ? 14% | 13.8 ? 2% |
| Idle Maximum * (Watt) | 15.5 | 9.9 36% | 28 -81% | 15.3 1% | 16.7 -8% | 6.7 57% | 14.5 ? 6% | 17.9 ? -15% |
| Load Average * (Watt) | 133.6 | 124.1 7% | 137.9 -3% | 91.8 31% | 61.3 54% | 65.2 51% | 86.9 ? 35% | 96 ? 28% |
| Witcher 3 ultra * (Watt) | 144.9 | 87.7 39% | 189.4 -31% | 104.7 28% | 87.9 39% | 77.2 47% | ||
| Load Maximum * (Watt) | 179.6 | 168.9 6% | 202 -12% | 164.5 8% | 145.3 19% | 147 18% | 161.1 ? 10% | 180.3 ? -0% |
* ... smaller is better
Power Consumption Witcher 3 / Stresstest
Power Consumption external Monitor
Battery Life
Despite the fact that Lenovo did not change the capacity of the internal 94 Wh battery, battery life is slightly worse compared with last years Lenovo ThinkPad P16 G1. Over eight hours in our WiFi test (150 cd/m² screen brightness) are still an OK result for such a powerful device.
| Lenovo ThinkPad P16 G2 21FA000FGE i7-13700HX, RTX 2000 Ada Generation Laptop, 94 Wh | Lenovo ThinkPad P16 G1 21D6001DMB i7-12850HX, RTX A2000 Laptop GPU, 94 Wh | HP ZBook Fury 16 G10 i9-13950HX, RTX 5000 Ada Generation Laptop, 95 Wh | Lenovo ThinkPad P1 G6-21FV000DGE i9-13900H, RTX 2000 Ada Generation Laptop, 90 Wh | HP ZBook Power 15 G10 R7 PRO 7840HS, RTX 2000 Ada Generation Laptop, 83 Wh | Lenovo ThinkPad P16v G1 AMD R7 PRO 7840HS, RTX A1000 Laptop GPU, 90 Wh | Average of class Workstation | |
|---|---|---|---|---|---|---|---|
| Battery runtime | 9% | -15% | 10% | 16% | 74% | -1% | |
| WiFi v1.3 (h) | 8.6 | 9.4 9% | 7.3 -15% | 9.5 10% | 10 16% | 15 74% | 8.55 ? -1% |
| Load (h) | 1.8 | 1.1 | 1.1 | 1.441 ? |
Pros
Cons
Verdict: Lenovo ThinkPad P16 G2 better than last generation model


The Lenovo ThinkPad P16 Gen 2 is an improved version of the 2022 Lenovo ThinkPad P16 Gen 1. It is both faster in terms of performance and faster in terms of the display, as the new model now has a 165 Hz screen, fixing one of our complaints about last year's version. The performance of the CPU and GPU is improved, thanks to newer Raptor Lake HX CPUs and Nvidia Ada Lovelace GPUs.
As an updated laptop, the ThinkPad P16 G2 keeps the strengths of its predecessor, but also the weaknesses. It is a very strong design in many regards, like input quality, robustness, performance / cooling and features. However, it still lacks RJ45 Ethernet, the SD card reader is just average in terms of speed and storage expandability is limited compared with some competitors. Also, it is a rather big and heavy design relative to the competition.
Lenovo's ThinkPad P16 G2 is a very strong choice in the workstation segment, especially if mobility is not a big concern.
Overall, the Lenovo ThinkPad P16 G2 is a very strong choice in the workstation segment, especially if mobility is not a big concern. One of the biggest competitors is the HP ZBook Fury 16 G10, which offers more storage capabilities and is slightly smaller and lighter.
Price and Availability
Lenovo sells the ThinkPad P16 G2 base model for $1,855. Amazon sells a similar configuration to the one we tested for roughly $2,030.
Lenovo ThinkPad P16 G2 21FA000FGE
- 03/16/2024 v7 (old)
Benjamin Herzig
Transparency
The selection of devices to be reviewed is made by our editorial team. The test sample was provided to the author as a loan by the manufacturer or retailer for the purpose of this review. The lender had no influence on this review, nor did the manufacturer receive a copy of this review before publication. There was no obligation to publish this review. As an independent media company, Notebookcheck is not subjected to the authority of manufacturers, retailers or publishers.
This is how Notebookcheck is testing
Every year, Notebookcheck independently reviews hundreds of laptops and smartphones using standardized procedures to ensure that all results are comparable. We have continuously developed our test methods for around 20 years and set industry standards in the process. In our test labs, high-quality measuring equipment is utilized by experienced technicians and editors. These tests involve a multi-stage validation process. Our complex rating system is based on hundreds of well-founded measurements and benchmarks, which maintains objectivity. Further information on our test methods can be found here.
Price comparison
