Intel Core i9-13980HX
The Intel Core i9-13980HX is a fast high-end mobile processor of the Raptor Lake-HX series. Is was announced in early 2023 and is based on the desktop Core i9-13000K with combined 24 cores and 32 threads. Eight fast Raptor Cove performance cores (P-cores) with HyperThreading that clock between 2.2 GHz (base) to 5.6 GHz (single core Turbo). The sixteen Gracemont cores are smaller and slower and optimized for efficiency. They clock between 1.6 GHz (base) and 4 GHz (Turbo).
Compared to Alder Lake, Raptor Lake offers improved P-Cores (Raptor Cove micro-architecture) with bigger Caches and more E-Cores (same Gracemont micro-architecture). Furthermore, the chip supports faster DDR5 memory (up to 5600 MHz for the 13980HX).
Performance
The average 13980HX in our database is in the same league as the Core i9-13950HX and the Ryzen 9 7845HX , as far as multi-thread benchmark scores are concerned.
Thanks to its decent cooling solution and a long-term CPU power limit of 143 W, the Alienware m18 R1 is among the fastest systems built around the 13980HX that we know of. It can be at least 10% faster in CPU-bound workloads than the slowest system featuring the same chip in our database, as of August 2023.
The CPU is still produced on a further improved 10nm FinFET process (Intel 7) that allows the higher clock speeds. The power consumption is specified at 55W base power up to 157 Watt max. Turbo power.
Series Intel Raptor Lake-HX Codename Raptor Lake-HX Series: Raptor Lake-HX Raptor Lake-HX Clock Rate 1600 - 5600 MHz Level 2 Cache 32 MB Level 3 Cache 36 MB Number of Cores / Threads 24 / 32 8 x 5.6 GHz Intel Raptor Cove P-Core 16 x 4.0 GHz Intel Gracemont E-Core Power Consumption (TDP = Thermal Design Power) 55 Watt Manufacturing Technology 10 nm Die Size 257 mm2 Max. Temperature 100 °C Socket BGA1964 Features DDR4-3200/DDR5-5600 RAM, PCIe 5, Thr. Dir., DL Boost, GNA, MMX, SSE, SSE2, SSE3, SSSE3, SSE4.1, SSE4.2, AVX, AVX2, BMI2, ABM, FMA, ADX, SMEP, SMAP, EIST, TM1, TM2, Hyper-Threading, Turbo, SST, AES-NI, RDRAND, RDSEED, SHA GPU Intel UHD Graphics 770 ( - 1650 MHz)64 Bit 64 Bit support Architecture x86 Announcement Date 01/04/2023 Product Link (external) ark.intel.com
Benchmarks Performance Rating - CB R15 + R20 + 7-Zip + X265 + Blender + 3DM11 CPU
54.5 pt (76%)
...
max:
Cinebench R23 - Cinebench R23 Multi Core
min: 28301 avg: 30428 median: 30273 (28%) max: 33052 Points
CPU TDP ? TDP 65 W TDP 80 W TDP 125 W TDP 130 W TDP 143 W TDP 157 W TDP 170 W 94% 87% 89% 92% 93% 100% 89% 97%
...
...
max:
Cinebench R23 - Cinebench R23 Single Core
min: 1825 avg: 2081 median: 2110 (90%) max: 2169 Points
CPU TDP ? TDP 65 W TDP 80 W TDP 125 W TDP 130 W TDP 143 W TDP 170 W 98% 97% 85% 99% 99% 98% 100%
...
max:
Cinebench R20 - Cinebench R20 CPU (Single Core)
min: 717 avg: 790 median: 807 (90%) max: 825 Points
CPU TDP ? TDP 65 W TDP 80 W TDP 125 W TDP 130 W TDP 143 W TDP 157 W TDP 170 W 98% 97% 87% 88% 99% 98% 94% 100%
...
max:
Cinebench R20 - Cinebench R20 CPU (Multi Core)
min: 10353 avg: 11583 median: 11510 (28%) max: 12437 Points
CPU TDP ? TDP 65 W TDP 80 W TDP 125 W TDP 130 W TDP 143 W TDP 157 W TDP 170 W 95% 83% 91% 90% 94% 100% 90% 97%
...
max:
Cinebench R15 - Cinebench R15 CPU Multi 64 Bit
min: 4358 avg: 4724 median: 4717 (30%) max: 5172 Points
CPU TDP ? TDP 65 W TDP 80 W TDP 125 W TDP 130 W TDP 143 W TDP 157 W TDP 170 W 98% 87% 94% 92% 94% 100% 91% 96%
...
max:
0 260 520 780 1040 1300 1560 1820 2080 2340 2600 2860 3120 3380 3640 3900 4160 4420 4680 4940 Tooltip Asus ROG Strix Scar 18 2023 G834JY-N6005W: Ø4253 (4165.8-4357.77)
Asus Vivobook Pro 16X K6604JV-MX016W Höchste Leistung: Ø4345 (3864.36-4543.91)
Lenovo Legion 9 16IRX8: Ø4416 (4337.45-4565.69)
Asus ProArt Studiobook 16 OLED H7604: Ø4477 (4374.45-4604.05)
Asus Vivobook Pro 16X K6604JV-MX016W: Ø3763 (3529.2-4703.12)
Asus ROG Strix G16 G614JZ turbo: Ø4416 (1123.72-4730.93)
Asus ROG Strix G16 G614JZ turbo: Ø4509 (4425.76-4764.17)
Asus ROG Strix Scar 18 2023 G834JY-N6005W: Ø4735 (4684.94-4780.69)
Alienware m18 R1: Ø4934 (4579.8-4989.4)
MSI Titan GT77 HX 13VI: Ø4987 (4917.63-5171.97)
Cinebench R15 - Cinebench R15 CPU Single 64 Bit
min: 289 avg: 303.6 median: 304.5 (92%) max: 312 Points
CPU TDP ? TDP 65 W TDP 80 W TDP 125 W TDP 130 W TDP 143 W TDP 157 W TDP 170 W 98% 98% 93% 97% 97% 97% 94% 100%
...
max:
Cinebench R11.5 - Cinebench R11.5 CPU Multi 64 Bit
55.8 Points (73%)
...
max:
Cinebench R11.5 - Cinebench R11.5 CPU Single 64 Bit
3.7 Points (93%)
...
max:
Cinebench R10 - Cinebench R10 Rend. Single (32bit)
11940 points (72%)
...
max:
Cinebench R10 - Cinebench R10 Rend. Multi (32bit)
85088 points (62%)
...
max:
Cinebench R10 - Cinebench R10 Rend. Multi (64bit)
125983 Points (87%)
...
max:
Cinebench R10 - Cinebench R10 Rend. Single (64bit)
17400 Points (21%)
...
wPrime 2.10 - wPrime 2.0 1024m *
183.5 s (2%)
...
Intel Core i5-11500B
...
VIA C3-M C3-M-1200
wPrime 2.10 - wPrime 2.0 32m *
3 s (1%)
...
11438 points (18%)
...
...
max:
7-Zip 18.03 - 7-Zip 18.03 Multli Thread 4 runs
min: 104616 avg: 118958 median: 119244 (68%) max: 129804 MIPS
CPU TDP ? TDP 65 W TDP 80 W TDP 125 W TDP 130 W TDP 143 W TDP 157 W TDP 170 W 94% 89% 81% 91% 90% 100% 86% 95%
...
...
max:
7-Zip 18.03 - 7-Zip 18.03 Single Thread 4 runs
min: 6889 avg: 6991 median: 6972 (83%) max: 7163 MIPS
CPU TDP ? TDP 65 W TDP 80 W TDP 125 W TDP 130 W TDP 143 W TDP 157 W TDP 170 W 98% 99% 98% 98% 99% 97% 88% 100%
...
max:
X264 HD Benchmark 4.0 - x264 Pass 2
198.1 fps (69%)
...
max:
X264 HD Benchmark 4.0 - x264 Pass 1
374 fps (86%)
...
max:
HWBOT x265 Benchmark v2.2 - HWBOT x265 4k Preset
min: 27 avg: 31.1 median: 31.6 (56%) max: 33.4 fps
CPU TDP ? TDP 65 W TDP 80 W TDP 125 W TDP 130 W TDP 143 W TDP 170 W 97% 88% 81% 95% 90% 99% 100%
...
max:
0 5 10 15 20 25 30 35 40 45 Tooltip Asus Vivobook Pro 16X K6604JV-MX016W: Ø23.9 (0.19-27)
Asus ROG Strix Scar 18 2023 G834JY-N6005W: Ø26.1 (0.32-29.2)
Asus ROG Strix G16 G614JZ: Ø25.5 (0.2-29.4)
Asus ProArt Studiobook 16 OLED H7604: Ø27 (0.32-30.2)
MSI Raider GE78 HX 13VI: Ø31.8 (1.45-42.5)
Lenovo Legion 9 16IRX8: Ø30.1 (0.79-33.6)
Alienware m18 R1: Ø28.3 (0.25-32.9)
Asus ROG Strix Scar 18 2023 G834JY-N6005W: Ø33.5 (1.87-45.3)
MSI Titan GT77 HX 13VI: Ø31.7 (0.68-33.6)
TrueCrypt - TrueCrypt Serpent
2.5 GB/s (76%)
...
max:
TrueCrypt - TrueCrypt Twofish
4.9 GB/s (84%)
...
max:
TrueCrypt - TrueCrypt AES
18.4 GB/s (48%)
...
max:
Blender - Blender 3.3 Classroom CPU *
min: 170 avg: 194.7 median: 190 (2%) max: 249 Seconds
CPU TDP ? TDP 65 W TDP 80 W TDP 125 W TDP 130 W TDP 143 W TDP 170 W 101% 101% 100% 101% 101% 101% 101%
...
...
Blender - Blender 2.79 BMW27 CPU *
min: 97 avg: 108.4 median: 106 (1%) max: 136 Seconds
CPU TDP ? TDP 65 W TDP 80 W TDP 125 W TDP 130 W TDP 143 W TDP 157 W TDP 170 W 100% 100% 100% 100% 100% 100% 100% 100%
...
R Benchmark 2.5 - R Benchmark 2.5 *
min: 0.3793 avg: 0.4 median: 0.4 (8%) max: 0.4041 sec
CPU TDP ? TDP 65 W TDP 80 W TDP 125 W TDP 130 W TDP 143 W TDP 157 W TDP 170 W 101% 101% 101% 102% 101% 101% 100% 102%
...
3DMark 06 - CPU - 3DMark 06 - CPU
19734 Points (42%)
...
max:
Super Pi mod 1.5 XS 1M - Super Pi mod 1.5 XS 1M *
7.4 s (2%)
...
Intel Core i5-11500B
...
VIA C3-M C3-M-1200
Super Pi mod 1.5 XS 2M - Super Pi mod 1.5 XS 2M *
15.5 s (1%)
...
...
Super Pi Mod 1.5 XS 32M - Super Pi mod 1.5 XS 32M *
345.8 s (2%)
...
VIA C3-M C3-M-1200
3DMark 11 - 3DM11 Performance Physics
min: 12665 avg: 23608 median: 25051 (68%) max: 27094 Points
CPU TDP ? TDP 65 W TDP 80 W TDP 125 W TDP 130 W TDP 143 W TDP 170 W 89% 84% 47% 88% 95% 100% 98%
...
...
max:
3DMark - 3DMark Ice Storm Physics
min: 91195 avg: 94076 median: 94075.5 (76%) max: 96956 Points
CPU TDP 130 W TDP 170 W 100% 94%
...
max:
3DMark - 3DMark Ice Storm Extreme Physics
91414 Points (74%)
...
max:
3DMark - 3DMark Ice Storm Unlimited Physics
94552 Points (80%)
...
max:
3DMark - 3DMark Cloud Gate Physics
min: 15674 avg: 20652 median: 21142 (53%) max: 24650 Points
CPU TDP 65 W TDP 80 W TDP 130 W TDP 170 W 74% 64% 100% 98%
...
max:
3DMark - 3DMark Fire Strike Standard Physics
min: 19708 avg: 37344 median: 40175 (72%) max: 41644 Points
CPU TDP ? TDP 65 W TDP 80 W TDP 125 W TDP 130 W TDP 143 W TDP 170 W 93% 87% 47% 93% 98% 100% 99%
...
max:
3DMark - 3DMark Time Spy CPU
min: 14503 avg: 16587 median: 17026 (72%) max: 18234 Points
CPU TDP ? TDP 65 W TDP 80 W TDP 125 W TDP 130 W TDP 143 W TDP 170 W 100% 82% 84% 100% 95% 99% 90%
...
...
max:
Geekbench 6.2 - Geekbench 6.2 Single-Core
min: 2802 avg: 2882 median: 2881.5 (87%) max: 2961 points
CPU TDP ? TDP 125 W 95% 100%
...
Geekbench 6.2 - Geekbench 6.2 Multi-Core
min: 17472 avg: 17564 median: 17564 (69%) max: 17656 points
CPU TDP ? TDP 125 W 100% 99%
...
max:
Geekbench 5.5 - Geekbench 5.1 - 5.4 64 Bit Single-Core
min: 1986 avg: 2079 median: 2099 (89%) max: 2139 points
CPU TDP ? TDP 65 W TDP 80 W TDP 125 W TDP 130 W TDP 143 W TDP 157 W TDP 170 W 97% 99% 94% 100% 98% 97% 84% 98%
...
Geekbench 5.5 - Geekbench 5.1 - 5.4 64 Bit Multi-Core
min: 18475 avg: 20205 median: 20329 (36%) max: 22200 points
CPU TDP ? TDP 65 W TDP 80 W TDP 125 W TDP 130 W TDP 143 W TDP 157 W TDP 170 W 93% 85% 83% 93% 89% 100% 86% 94%
...
max:
Geekbench 5.0 - Geekbench 5.0 64 Bit Single-Core
1987 points (9%)
...
max:
Geekbench 5.0 - Geekbench 5.0 64 Bit Multi-Core
22107 points (70%)
...
max:
Mozilla Kraken 1.1 - Kraken 1.1 Total Score *
min: 446 avg: 459.9 median: 451 (1%) max: 515 ms
CPU TDP ? TDP 65 W TDP 80 W TDP 125 W TDP 130 W TDP 143 W TDP 170 W 100% 100% 100% 100% 100% 100% 100%
...
...
max:
Octane V2 - Octane V2 Total Score
min: 96184 avg: 102620 median: 102620 (92%) max: 109055 Points
CPU TDP 80 W TDP 130 W 88% 100%
...
WebXPRT 4 - WebXPRT 4 Score
min: 254 avg: 298.6 median: 306 (88%) max: 318 Points
CPU TDP ? TDP 80 W TDP 125 W TDP 130 W TDP 143 W TDP 170 W 94% 80% 96% 96% 96% 100%
...
max:
WebXPRT 3 - WebXPRT 3 Score
min: 277 avg: 330.2 median: 337 (70%) max: 349 Points
CPU TDP ? TDP 65 W TDP 80 W TDP 125 W TDP 130 W TDP 143 W TDP 170 W 94% 98% 79% 100% 97% 97% 97%
...
...
CrossMark - CrossMark Overall
min: 1935 avg: 2079 median: 2080 (80%) max: 2182 Points
CPU TDP 65 W TDP 80 W TDP 125 W TDP 130 W TDP 143 W TDP 170 W 93% 94% 89% 99% 100% 96%
...
max:
Power Consumption - Prime95 Power Consumption - external Monitor *
min: 157.3 avg: 197.5 median: 191.9 (33%) max: 262 Watt
CPU TDP 65 W TDP 80 W TDP 125 W TDP 130 W TDP 143 W 123% 129% 116% 127% 100%
...
max:
0 15 30 45 60 75 90 105 120 135 150 165 180 195 210 225 240 255 270 285 Tooltip Asus ROG Strix G16 G614JZ: Ø157.3 (143.6-190.8)
Asus Vivobook Pro 16X K6604JV-MX016W: Ø170.9 (44.2-234)
Asus ROG Strix Scar 18 2023 G834JY-N6005W: Ø188.8 (171.7-199.7)
Asus ProArt Studiobook 16 OLED H7604: Ø195 (94.6-239)
Lenovo Legion 9 16IRX8: Ø211 (195.9-228)
Alienware m18 R1: Ø262 (239-295)
Power Consumption - Cinebench R15 Multi Power Consumption - external Monitor *
min: 172.2 avg: 222.5 median: 225 (41%) max: 291 Watt
CPU TDP 65 W TDP 80 W TDP 125 W TDP 130 W TDP 143 W TDP 170 W 146% 132% 116% 135% 100% 122%
...
...
max:
0 15 30 45 60 75 90 105 120 135 150 165 180 195 210 225 240 255 270 285 Tooltip Asus ROG Strix Scar 18 2023 G834JY-N6005W: Ø172.2 (128.1-186)
Asus ROG Strix G16 G614JZ: Ø175.1 (169.3-176.9)
Asus Vivobook Pro 16X K6604JV-MX016W: Ø210 (115.7-230)
Asus ProArt Studiobook 16 OLED H7604: Ø225 (212-230)
Asus ROG Strix Scar 18 2023 G834JY-N6005W: Ø235 (162.8-253)
Lenovo Legion 9 16IRX8: Ø249 (237-257)
Alienware m18 R1: Ø291 (287-295)
Power Consumption - Geekbench 5.5 Power Consumption 150cd *
230 Watt (100%)
0 15 30 45 60 75 90 105 120 135 150 165 180 195 210 225 240 Tooltip Asus ROG Strix Scar 18 2023 G834JY-N6005W: Ø230 (139.1-255)
Power Consumption - Idle Power Consumption - external Monitor *
min: 19.8 avg: 25.3 median: 23.2 (17%) max: 32.3 Watt
CPU TDP 65 W TDP 80 W TDP 125 W TDP 130 W TDP 143 W TDP 170 W 103% 111% 100% 111% 109% 101%
...
...
max:
0 5 10 15 20 25 30 35 40 45 50 55 Tooltip Asus ROG Strix G16 G614JZ: Ø19.8 (17.1-25.4)
Asus Vivobook Pro 16X K6604JV-MX016W: Ø20.2 (12.3-38.9)
Asus ProArt Studiobook 16 OLED H7604: Ø21.3 (12.6-35.5)
Alienware m18 R1: Ø23.2 (17.2-48.7)
Asus ROG Strix Scar 18 2023 G834JY-N6005W: Ø28.7 (21.5-39.7)
Asus ROG Strix Scar 18 2023 G834JY-N6005W: Ø31.4 (26-57.7)
Lenovo Legion 9 16IRX8: Ø32.3 (21.8-57.2)
Power Consumption - Idle Power Consumption 150cd 1min *
min: 15.2 avg: 25.2 median: 24.9 (28%) max: 37.8 Watt
CPU TDP 65 W TDP 80 W TDP 125 W TDP 130 W TDP 143 W TDP 170 W 121% 143% 101% 139% 125% 100%
...
max:
0 5 10 15 20 25 30 35 40 45 50 55 60 65 70 75 80 85 Tooltip Asus Vivobook Pro 16X K6604JV-MX016W: Ø15.2 (4.02-27.7)
Asus ROG Strix G16 G614JZ: Ø16.4 (10.8-68.1)
Asus ProArt Studiobook 16 OLED H7604: Ø18.4 (12.9-25.5)
Alienware m18 R1: Ø24.9 (23.1-32.8)
Asus ROG Strix Scar 18 2023 G834JY-N6005W: Ø26.6 (20.6-45.4)
Lenovo Legion 9 16IRX8: Ø37.2 (33.2-58.1)
Asus ROG Strix Scar 18 2023 G834JY-N6005W: Ø37.8 (29.1-89.3)
Power Consumption - Cinebench R15 Multi Power Efficiency - external Monitor
min: 18.3 avg: 21.1 median: 20.4 (15%) max: 25.3 Points per Watt
CPU TDP 65 W TDP 125 W TDP 130 W TDP 170 W 100% 72% 81% 80%
...
...
- Range of benchmark values for this graphics card
- Average benchmark values for this graphics card
* Smaller numbers mean a higher performance
v1.26
log 18. 13:05:15
#0 no ids found in url (should be separated by "_") +0s ... 0s
#1 not redirecting to Ajax server +0s ... 0s
#2 did not recreate cache, as it is less than 5 days old! Created at Sat, 16 Mar 2024 05:37:00 +0100 +0.001s ... 0.001s
#3 composed specs +0.018s ... 0.019s
#4 did output specs +0s ... 0.019s
#5 getting avg benchmarks for device 14665 +0.015s ... 0.034s
#6 got single benchmarks 14665 +0.038s ... 0.072s
#7 got avg benchmarks for devices +0s ... 0.072s
#8 min, max, avg, median took s +0.918s ... 0.991s
#9 return log +0.022s ... 1.013s
Reviews for the Intel Core i9-13980HX processor
Legion 9i Gen 8 16IRX8 review: Lenovo's most ambitious gaming laptop yet After launching a handful of Legion 5 and Legion 7 options, Lenovo is finally ready to revisit its flagship Legion 9 series with the Legion 9i 16 G8. You know t...
Intel Core i9-13980HX | NVIDIA GeForce RTX 4090 Laptop GPU | 16.00" | 2.6 kg
Asus Vivobook Pro 16X review: Creator notebook with an outstanding processor 
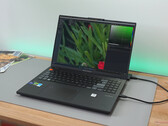
Thanks to an outstanding Intel Core i9, a decent RTX 4060 and an OLED display, the VivoBook Pro 16X leaves no doubt that it is perfectly positioned for image an...
Intel Core i9-13980HX | NVIDIA GeForce RTX 4060 Laptop GPU | 16.00" | 2.1 kg
Asus ProArt Studiobook 16 OLED review: Multimedia laptop with extreme CPU performance Asus offers a powerful machine for creative users in the ProArt Studiobook 16 OLED. Intel's Core i9-13980HX and the GeForce RTX 4070 laptop take care of perform...
Intel Core i9-13980HX | NVIDIA GeForce RTX 4070 Laptop GPU | 16.00" | 2.4 kg
Alienware m18 R1 laptop review: Bigger and heavier than the MSI Titan GT77 
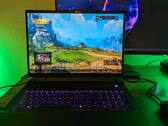
Dell is reviving its 18-inch Alienware laptop with almost every feature we can think of under the sun: 4x M.2 SSDs, 480 Hz refresh rate, 175 W GPU, liquid metal...
Intel Core i9-13980HX | NVIDIA GeForce RTX 4090 Laptop GPU | 18.00" | 3.9 kg
Asus ROG Strix G16 G614JZ laptop review: Clear the stage for the RTX 4080 
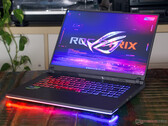
The ROG Strix G16 is the third Strix we've reviewed in a still-ripening 2023. Based on recent experience, the choice to downsize to a 16-inch model is a good on...
Intel Core i9-13980HX | NVIDIA GeForce RTX 4080 Laptop GPU | 16.00" | 2.4 kg
Asus ROG Strix Scar 18 2023 G834JY-N6005W : NVIDIA GeForce RTX 4090 Laptop GPU, 18.00", 3.1 kg
Review » Asus ROG Strix Scar 18 2023 G834JY review - Gaming laptop with RTX 4090
MSI Vector GP78 HX 13VI : NVIDIA GeForce RTX 4090 Laptop GPU, 17.30", 3 kg
External Review » MSI Vector GP78 HX 13VI
Lenovo Legion 9 16IRX8, RTX 4080 : NVIDIA GeForce RTX 4080 Laptop GPU, 16.00", 2.6 kg
External Review » Lenovo Legion 9 16IRX8, RTX 4080
Asus VivoBook Pro 16X K6604JV : NVIDIA GeForce RTX 4060 Laptop GPU, 16.00", 1.9 kg
External Review » Asus VivoBook Pro 16X K6604JV
MSI Vector GP78 HX 13VH : NVIDIA GeForce RTX 4080 Laptop GPU, 17.00", 3 kg
External Review » MSI Vector GP78 HX 13VH
Lenovo Legion 9 16IRX8 : NVIDIA GeForce RTX 4090 Laptop GPU, 16.00", 2.6 kg
External Review » Lenovo Legion 9 16IRX8
Asus ROG Strix Scar 18 G834JZ : NVIDIA GeForce RTX 4080 Laptop GPU, 18.00", 3.1 kg
External Review » Asus ROG Strix Scar 18 G834JZ
Asus ProArt StudioBook 16 OLED H7604JI : NVIDIA GeForce RTX 4070 Laptop GPU, 16.00", 2.4 kg
External Review » Asus ProArt StudioBook 16 OLED H7604JI
Asus VivoBook Pro 16 OLED K6604JI : NVIDIA GeForce RTX 4070 Laptop GPU, 16.00", 2 kg
External Review » Asus VivoBook Pro 16 OLED K6604JI
Asus ROG Strix G16 G614JZ : NVIDIA GeForce RTX 4080 Laptop GPU, 16.00", 2.4 kg
External Review » Asus ROG Strix G16 G614JZ
MSI Raider GE78 HX 13VI : NVIDIA GeForce RTX 4090 Laptop GPU, 17.00", 3.1 kg
External Review » MSI Raider GE78 HX 13VI
MSI CreatorPro X17 HX A13VM : NVIDIA RTX A5000 Laptop GPU, 17.30", 3.3 kg
External Review » MSI CreatorPro X17 HX A13VM
Asus ProArt Studiobook 16 OLED H7604 : NVIDIA GeForce RTX 4070 Laptop GPU, 16.00", 2.4 kg
External Review » Asus ProArt Studiobook 16 OLED H7604
Asus ROG Strix G16 G614JV : NVIDIA GeForce RTX 4060 Laptop GPU, 16.00", 2.5 kg
External Review » Asus ROG Strix G16 G614JV
Asus ROG Strix G18 G814JI, i9-13980HX : NVIDIA GeForce RTX 4070 Laptop GPU, 18.00", 3 kg
External Review » Asus ROG Strix G18 G814JI, i9-13980HX
Asus ROG Strix G16 G614JI : NVIDIA GeForce RTX 4070 Laptop GPU, 16.00", 2.5 kg
External Review » Asus ROG Strix G16 G614JI
Asus ROG Strix Scar 16 G634JZ : NVIDIA GeForce RTX 4080 Laptop GPU, 16.00", 2.5 kg
External Review » Asus ROG Strix Scar 16 G634JZ
Alienware m18 R1 : NVIDIA GeForce RTX 4090 Laptop GPU, 18.00", 3.9 kg
External Review » Alienware m18 R1
Asus ROG Strix Scar 16 G634JY-NM001W : NVIDIA GeForce RTX 4090 Laptop GPU, 16.00", 2.5 kg
External Review » Asus ROG Strix Scar 16 2023 G634JY-NM001W
MSI Titan GT77 HX 13VI-044 : NVIDIA GeForce RTX 4090 Laptop GPU, 17.30", 3.3 kg
External Review » MSI Titan GT77 HX 13VI-044
Asus ROG Strix Scar 18 2023 G834JY-N6005W : NVIDIA GeForce RTX 4090 Laptop GPU, 18.00", 3.1 kg
External Review » Asus ROG Strix Scar 18 2023 G834JY-N6005W
Alienware m18 R1 : NVIDIA GeForce RTX 4090 Laptop GPU, 18.00", 3.9 kg
» Beastly Alienware m18 with RTX 4080, i9-13900HX and 480Hz display now 25% off in Dell's gaming laptop sale
Asus Vivobook Pro 16X K6604JV-MX016W : NVIDIA GeForce RTX 4060 Laptop GPU, 16.00", 2.1 kg
» Extremely fast creator: Asus Vivobook Pro 16X reviewed
»
2023 Lenovo Legion Slim 5 price sees whopping 38% cut for open-box SKU with Ryzen 5 7640HS CPU and RTX 4060 GPU
Asus ProArt Studiobook 16 OLED H7604 : NVIDIA GeForce RTX 4070 Laptop GPU, 16.00", 2.4 kg
» The ProArt Studiobook 16 OLED is fast, but too loud
Asus ROG Strix G16 G614JZ : NVIDIA GeForce RTX 4080 Laptop GPU, 16.00", 2.4 kg
» RTX 4060-powered Asus ROG Strix G16 (2023) gets first discount in Amazon's gaming laptop sale
Alienware m18 R1 : NVIDIA GeForce RTX 4090 Laptop GPU, 18.00", 3.9 kg
» Razer is ahead of the curve when it comes to small and compact 330 W AC adapters
Asus ROG Strix G16 G614JZ : NVIDIA GeForce RTX 4080 Laptop GPU, 16.00", 2.4 kg
» Finally, quiet gaming with the Asus ROG Strix G16
Please share our article, every link counts!
Other CPUs of the series Raptor Lake-HX Surrounding CPUs
Working For Notebookcheck
Are you a techie who knows how to translate? Then join our Team!
Details here
Top 10 Laptops Multimedia , Budget Multimedia , Gaming , Budget Gaming , Lightweight Gaming , Business , Budget Office , Workstation , Subnotebooks , Ultrabooks , Chromebooks
under 300 USD/Euros , under 500 USD/Euros , 1,000 USD/Euros , for University Students , Best Displays
Top 10 Smartphones Smartphones , Phablets , ≤6-inch , Camera Smartphones
Klaus Hinum (Update: 2022-12-19)