Asus Vivobook Pro 16X review: Creator notebook with an outstanding processor
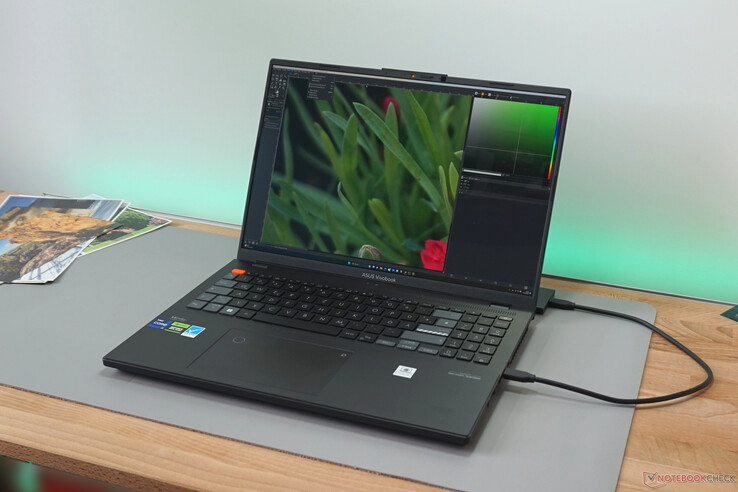
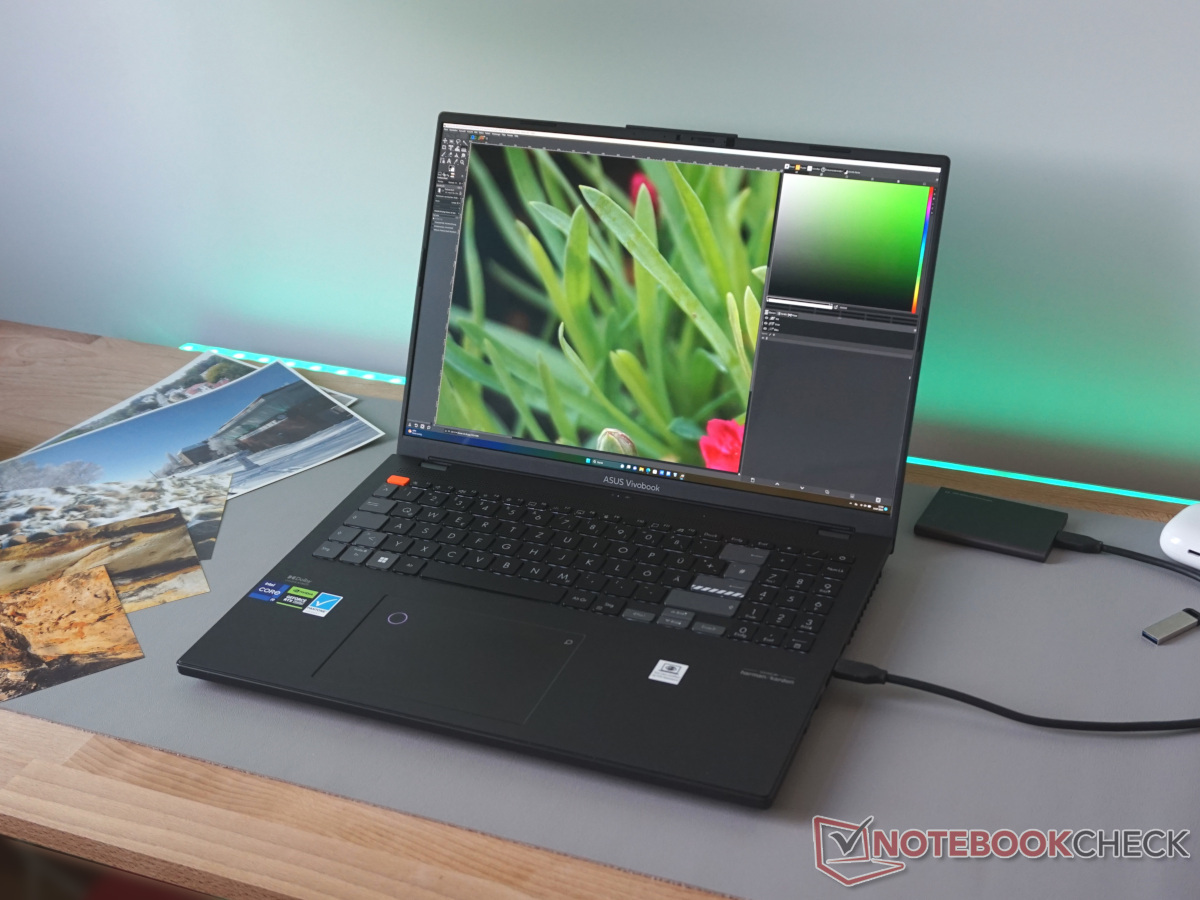
The VivoBook Pro belongs to the category of multimedia laptops aimed at ambitious home users for creative projects. A powerful processor, the current top model i9-13980HX in this case, and a mobile GPU in various configurations ensure adequate working speed. An OLED display illustrates the respective content almost realistically and the "Asus Dial" also distinguishes this model apart from simple notebooks.
The Asus VivoBook Pro 16X in review today does not resemble much of the typical Vivobooks, which start at around US$1,500. The processor and display come from the professional ProArt Studiobook series, which we have already reviewed in the form of the Asus ProArt Studiobook 16 OLED H7604. The case and many features, on the other hand, have been kept simple. The VivoBook Pro 16X thus moves in the gray area between a hyperpotent laptop for the home and a creative work device in a (too) simple guise.
Competitors on a comparable level include the Gigabyte AERO 16 OLED or the Samsung Galaxy Book3 Ultra 16. Our review will reveal whether the Vivobook can score with its borrowings from the professional segment.
Possible competitors in comparison
Rating | Date | Model | Weight | Height | Size | Resolution | Price |
|---|---|---|---|---|---|---|---|
| 86.2 % v7 (old) | 07 / 2023 | Asus Vivobook Pro 16X K6604JV-MX016W i9-13980HX, GeForce RTX 4060 Laptop GPU | 2.1 kg | 22.8 mm | 16.00" | 3200x2000 | |
| 90.3 % v7 (old) | 04 / 2023 | Dell XPS 15 9530 RTX 4070 i7-13700H, GeForce RTX 4070 Laptop GPU | 1.9 kg | 18 mm | 15.60" | 3456x2160 | |
| 89.4 % v7 (old) | 04 / 2023 | Samsung Galaxy Book3 Ultra 16 i7-13700H, GeForce RTX 4050 Laptop GPU | 1.8 kg | 16.5 mm | 16.00" | 2880x1800 | |
| 88.6 % v7 (old) | 07 / 2023 | Schenker VISION 16 Pro (M23) i7-13700H, GeForce RTX 4070 Laptop GPU | 1.6 kg | 17.1 mm | 16.00" | 2560x1600 | |
| 86.1 % v7 (old) | 06 / 2023 | Asus ProArt Studiobook 16 OLED H7604 i9-13980HX, GeForce RTX 4070 Laptop GPU | 2.4 kg | 23.9 mm | 16.00" | 3200x2000 | |
| 83.8 % v7 (old) | 09 / 2022 | MSI Creator Z17 A12UGST-054 i9-12900H, GeForce RTX 3070 Ti Laptop GPU | 2.5 kg | 19 mm | 17.00" | 2560x1600 |
Case - Too much plastic on the Vivobook
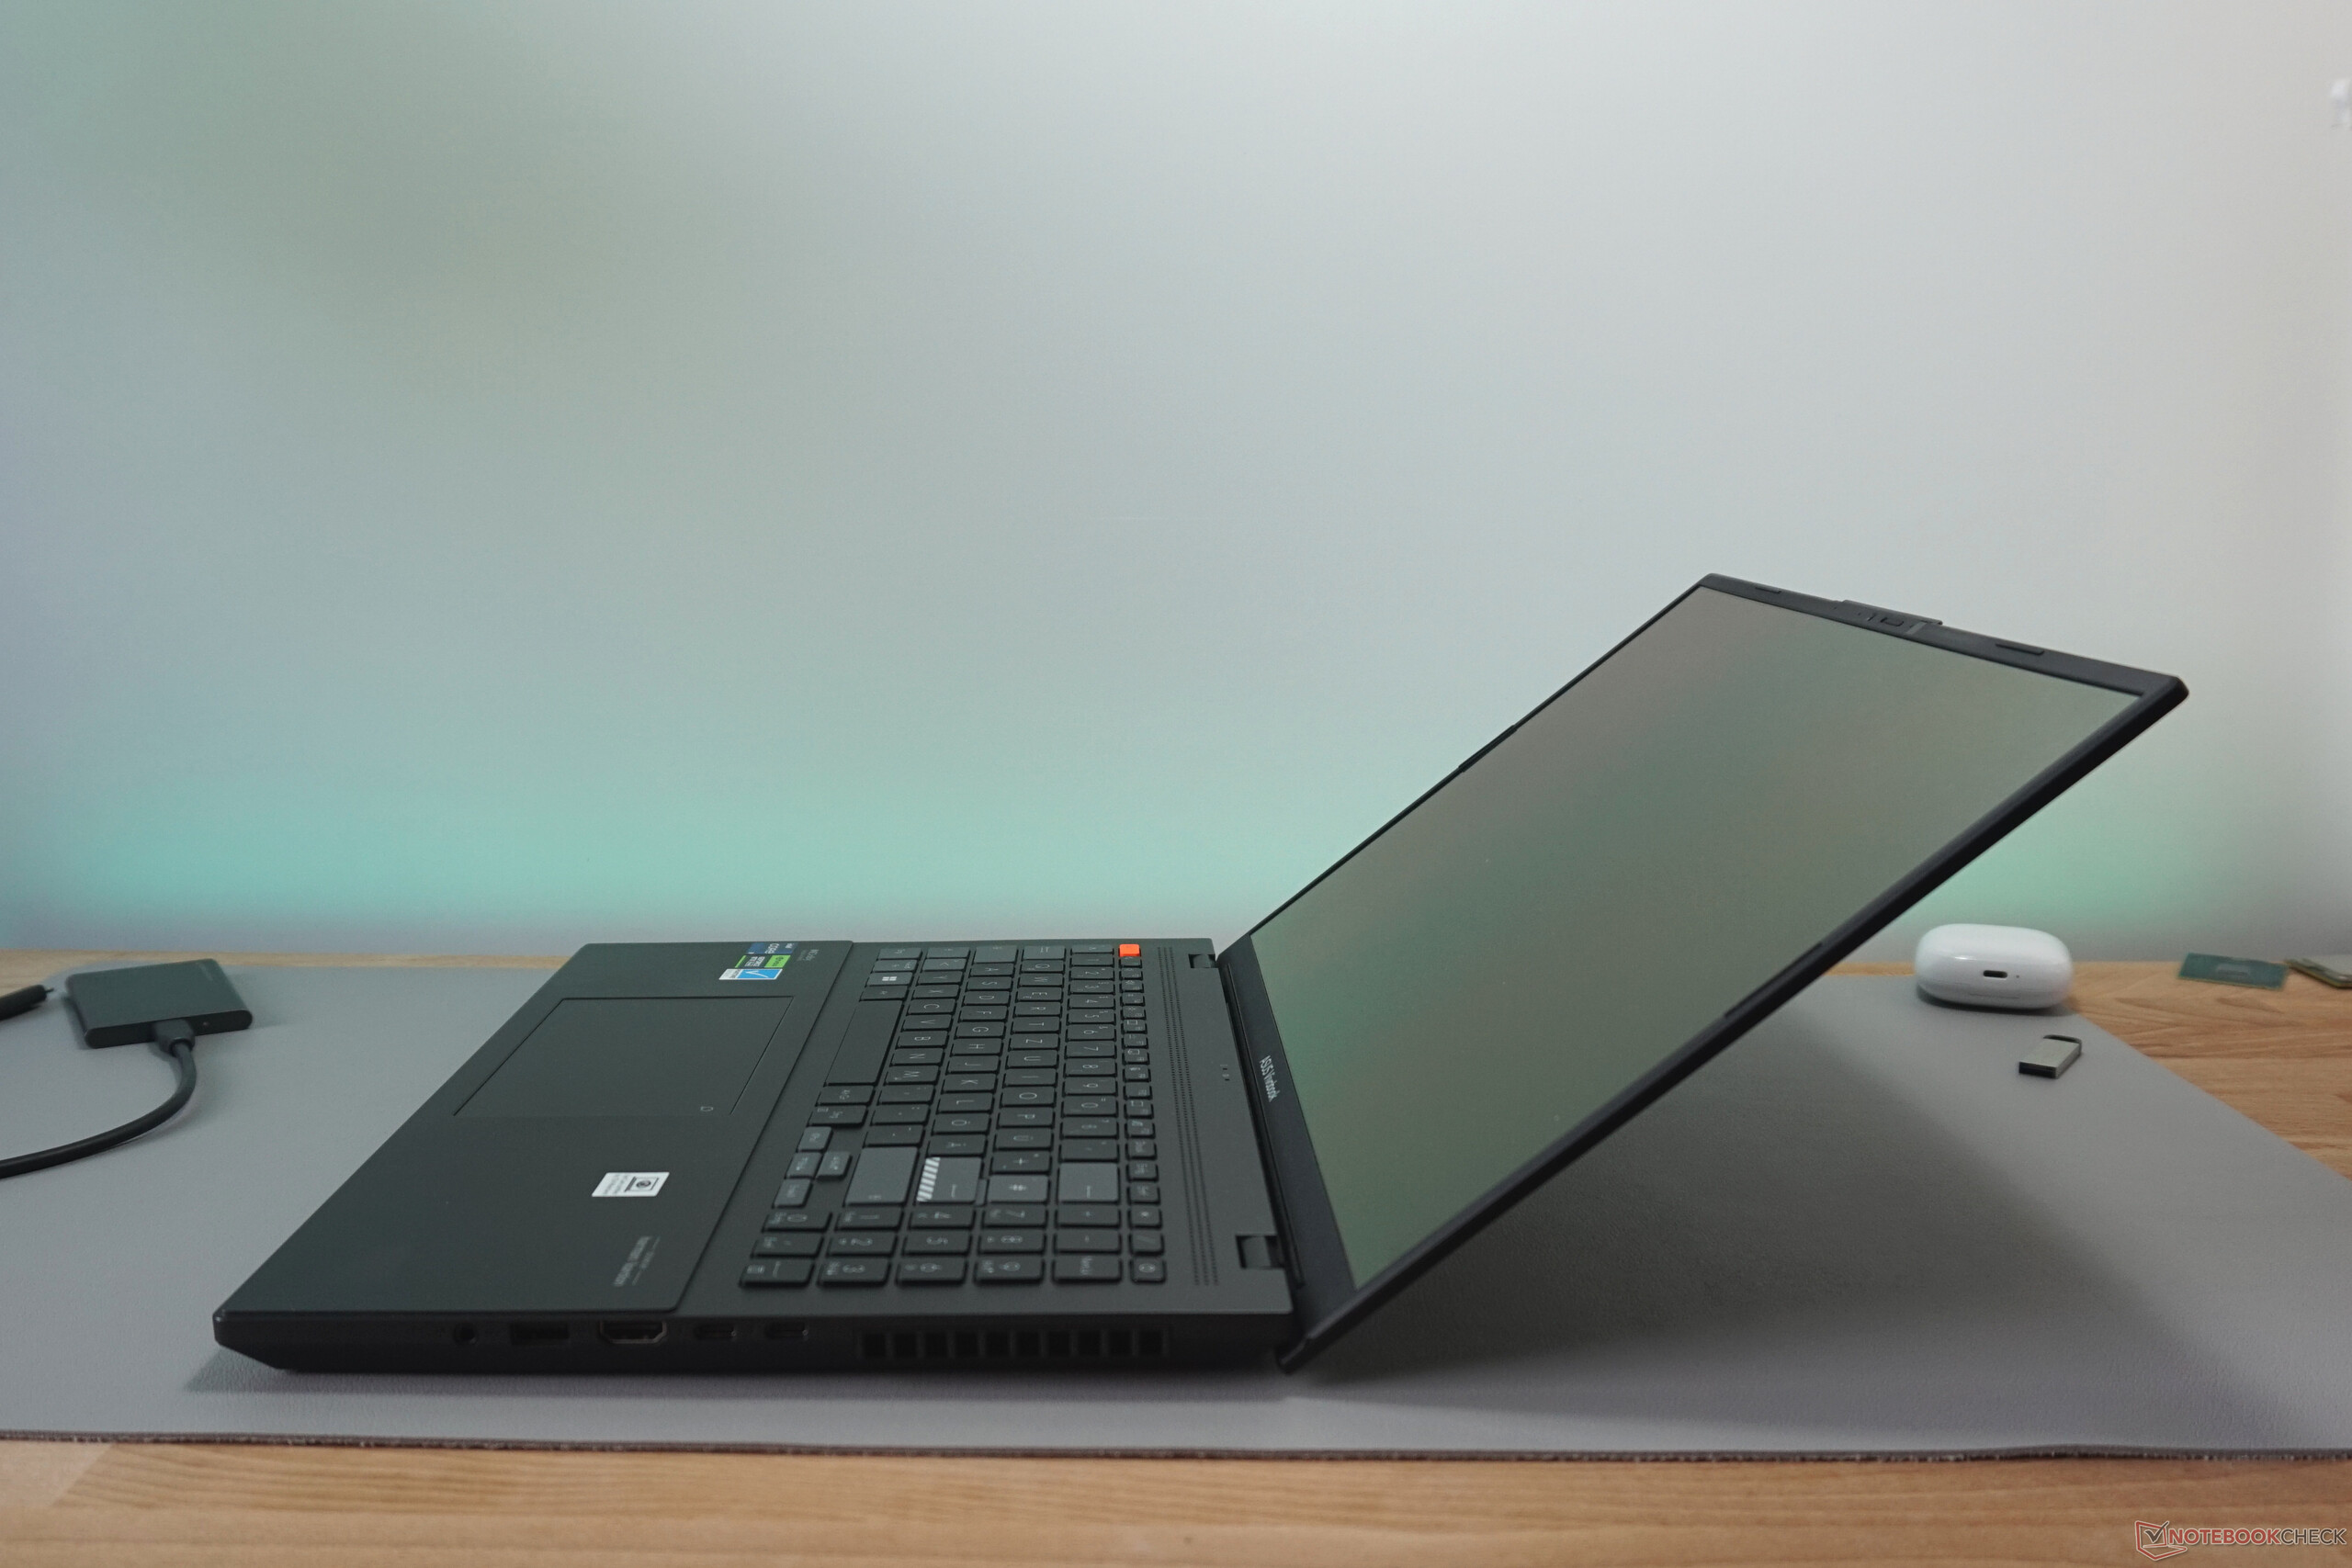
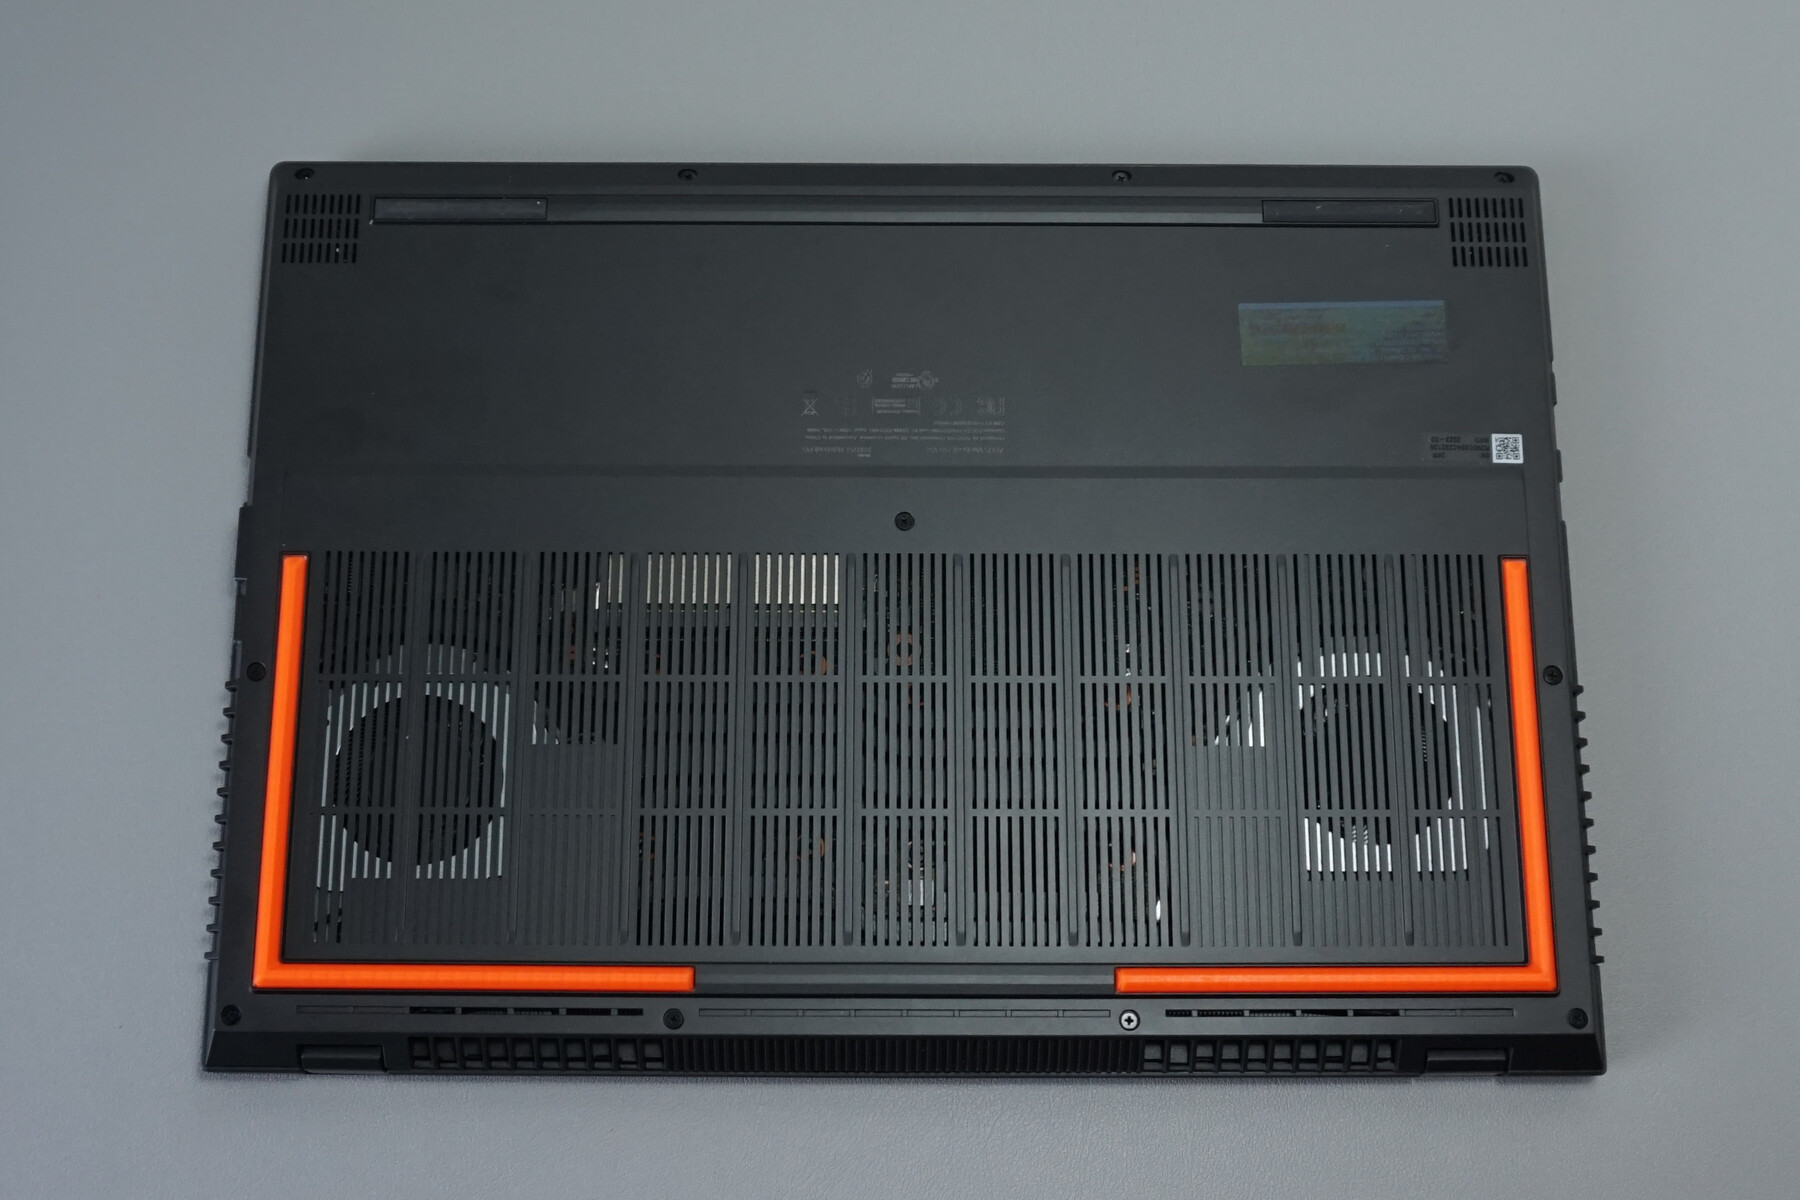
Made entirely of black plastic, the case of the Vivobook Pro 16X makes a rather simple impression. The neon orange feet provide a splash of color. The workmanship of the base and the hinges is solid. Only minimal twisting can be elicited when the case is held by one of the front corners. Moreover, the display always stays firmly in the set angle, which reaches just over 140°.
The display lid and the bezel of the OLED screen, on the other hand, could have been better designed. Given the plastic cover, it is hardly surprising that the display can be bent. The edges are also not straight, which also makes itself manifest in the screen's unsightly curvature. In addition, there is a gap to the display frame on the right of the screen in our test model, in which dust quickly accumulated.
The weight and size of the case are quite average for a notebook with a 16-inch screen. The Samsung Galaxy Book3 Ultra, for example, is slimmer and lighter. The Asus ProArt Studiobook, on the other hand, is larger and heavier.


Equipment - Everything important included and two TB4
All important ports are distributed on the left and right. Neither the range or number leave any room for criticism. Conveniently, there is a USB-A port on both sides. Video and image data can be easily copied from a camera via the SD card reader. Thanks to the LAN port, a fast network connection can be established on the desk. In addition, there are two Thunderbolt 4 ports for fast data exchange, for a docking station or for charging the battery if necessary.
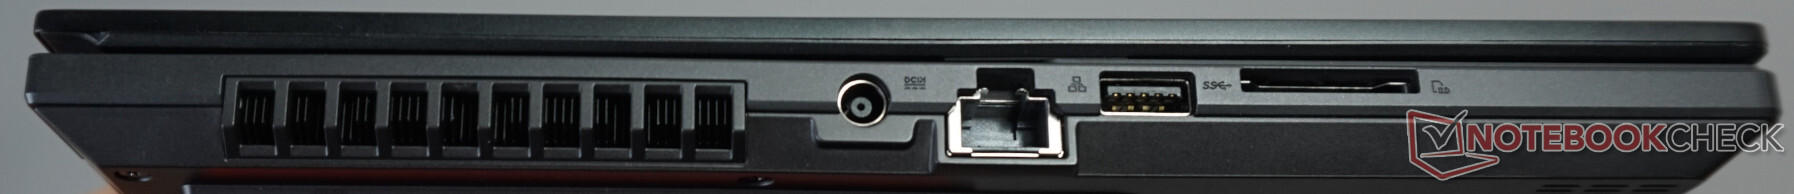

SD Card Reader
With the fully-fledged SD card reader, our AV PRO microSD 128 GB V60 reference card achieves a solid transfer rate. An average of 120 MB/s means that a full 32 GB card is copied in just under 4 minutes. It would take two minutes longer with the Samsung Galaxy Book3 Ultra 16, for example.
| SD Card Reader | |
| average JPG Copy Test (av. of 3 runs) | |
| Dell XPS 15 9530 RTX 4070 (Toshiba Exceria Pro SDXC 64 GB UHS-II) | |
| Average of class Multimedia (23 - 531, n=43, last 2 years) | |
| Asus Vivobook Pro 16X K6604JV-MX016W | |
| MSI Creator Z17 A12UGST-054 (AV Pro SD microSD 128 GB V60) | |
| Samsung Galaxy Book3 Ultra 16 (AV PRO microSD 128 GB V60) | |
| Asus ProArt Studiobook 16 OLED H7604 (Angelibird AV Pro V60) | |
| Schenker VISION 16 Pro (M23) (Angelbird AV Pro V60) | |
| maximum AS SSD Seq Read Test (1GB) | |
| Average of class Multimedia (27.9 - 1455, n=42, last 2 years) | |
| Dell XPS 15 9530 RTX 4070 (Toshiba Exceria Pro SDXC 64 GB UHS-II) | |
| Asus Vivobook Pro 16X K6604JV-MX016W | |
| Asus ProArt Studiobook 16 OLED H7604 (Angelibird AV Pro V60) | |
| Samsung Galaxy Book3 Ultra 16 (AV PRO microSD 128 GB V60) | |
| MSI Creator Z17 A12UGST-054 (AV Pro SD microSD 128 GB V60) | |
| Schenker VISION 16 Pro (M23) (Angelbird AV Pro V60) | |
Communication
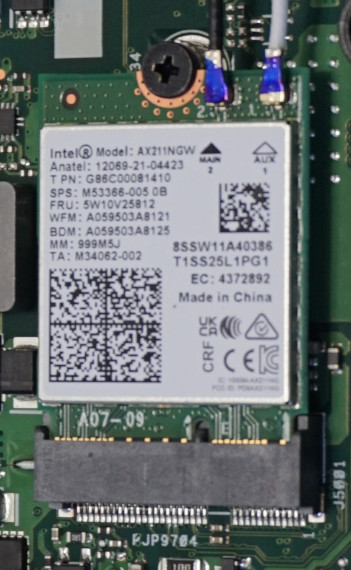
The installed Intel AX211 WLAN module, which can be replaced, works at consistently high transfer rates. The measured values for receiving data of just under 1,700 Mbps are almost 25% above the average of all recorded values with identical hardware. Dell's XPS 15 9530, for example, scores about a third worse, although it also uses Intel's AX211.
A Gigabit LAN port from Realtek is also on board for wired transmission.
Webcam
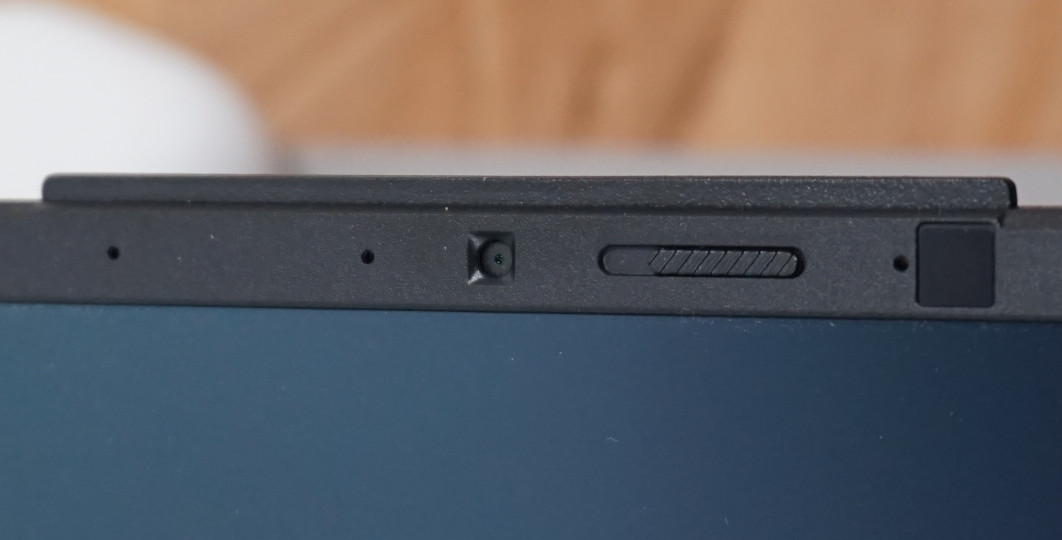
The features of the Full HD webcam are solid. There is a mechanical shutter that has the same orange of the feet and the Esc button. In addition, an IR camera for logging in via facial recognition and a dual-array microphone are installed.
In terms of image quality, there is definitely room for improvement. Although the brightening of the video image is convincing in low ambient light, image noise increases enormously at the same time. The recording quality of the voice, on the other hand, is good. It sounds natural and is recorded evenly from different distances and speaking directions.


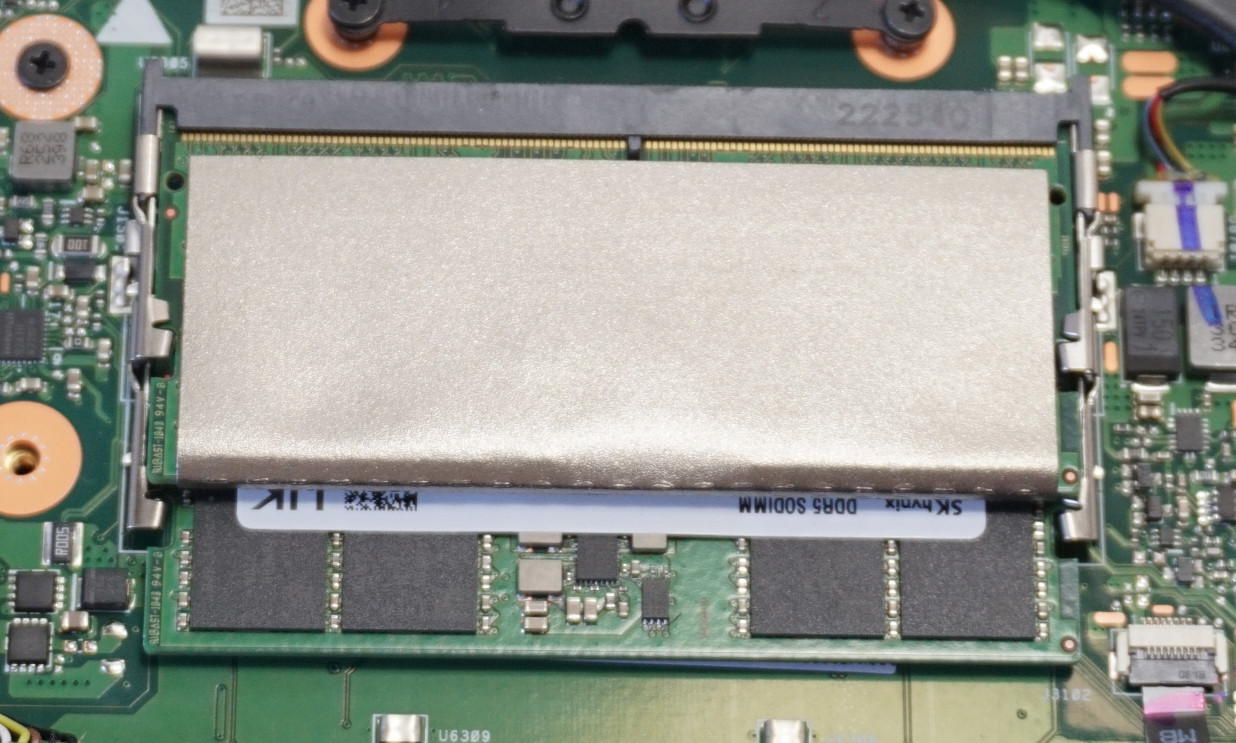
Maintenance
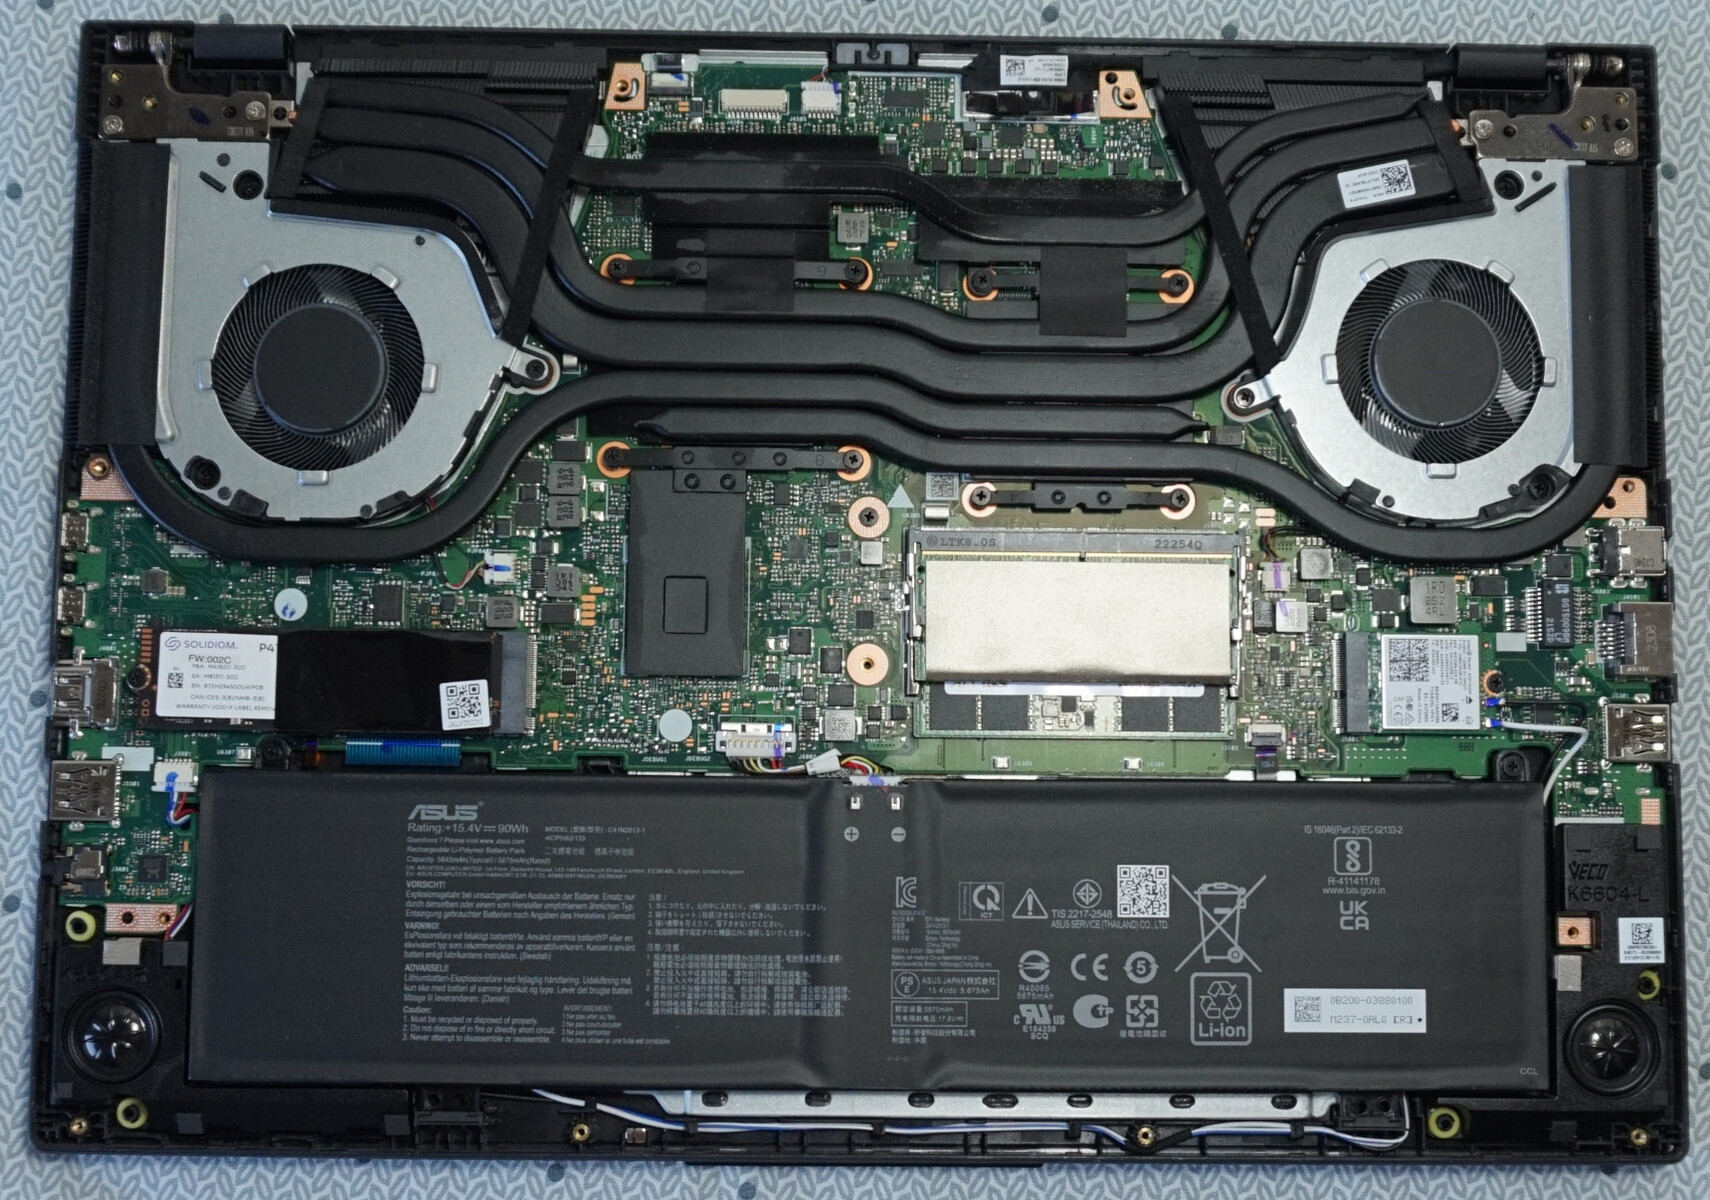
Eleven Phillips screws need to be loosened. A certain amount of force is also required to loosen the numerous plastic clamps. As so often is the case, starting next to the hinges is recommended. With a small lever tool or pick, opening up the underside without damage should be easy.
The battery, RAM, SSD and WLAN module are easily accessible and replaceable. Unfortunately, there is no second slot for an M.2 NVMe SSD.


Warranty
Asus provides a 2-year manufacturer's warranty, but limits the statutory warranty for the battery. In order to be able to use the warranty, the VivoBook has to be registered with Asus after purchase. These conditions may differ in other regions, so interested buyers should double check before purchasing.
Input Devices - Vivobook with practical dial
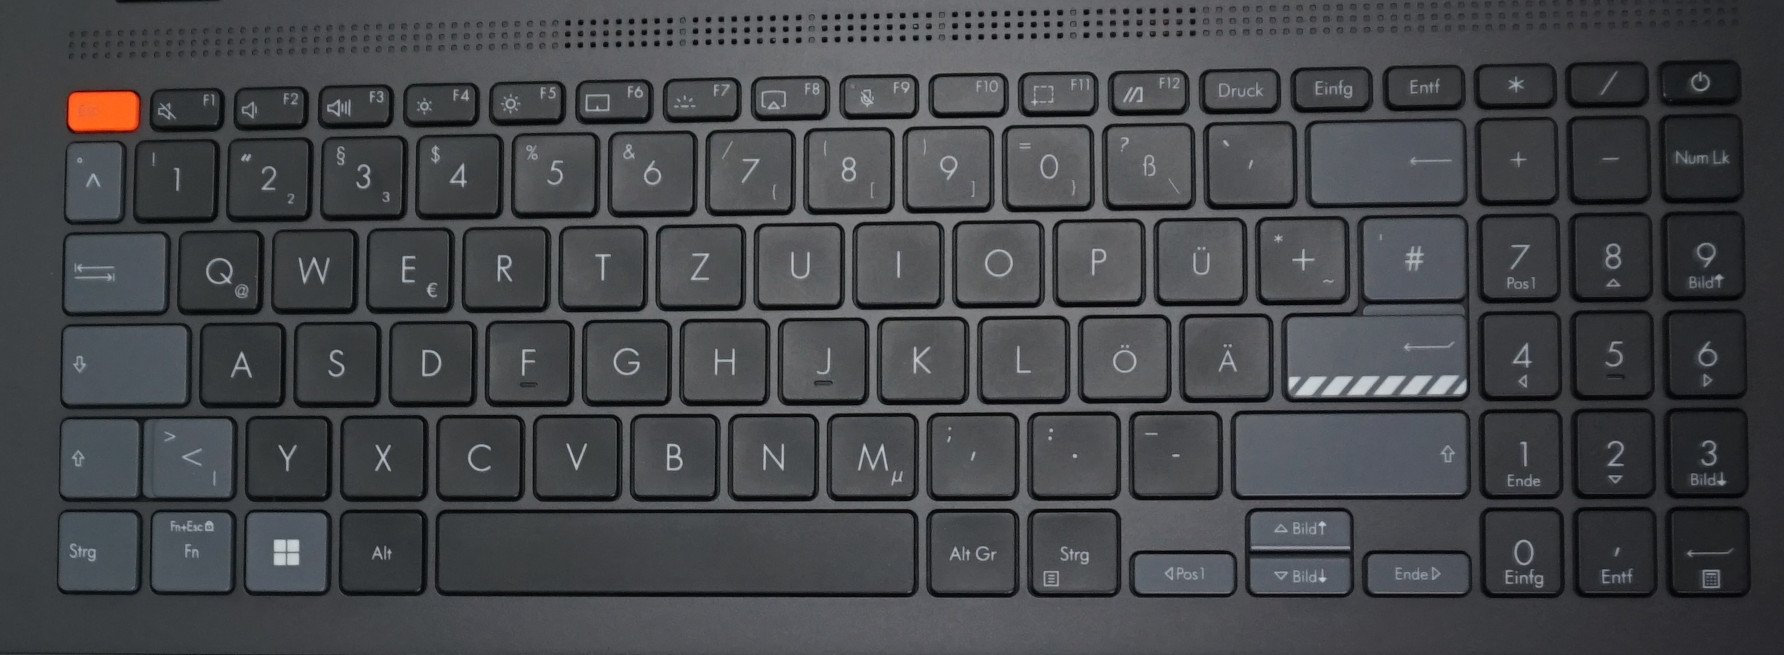
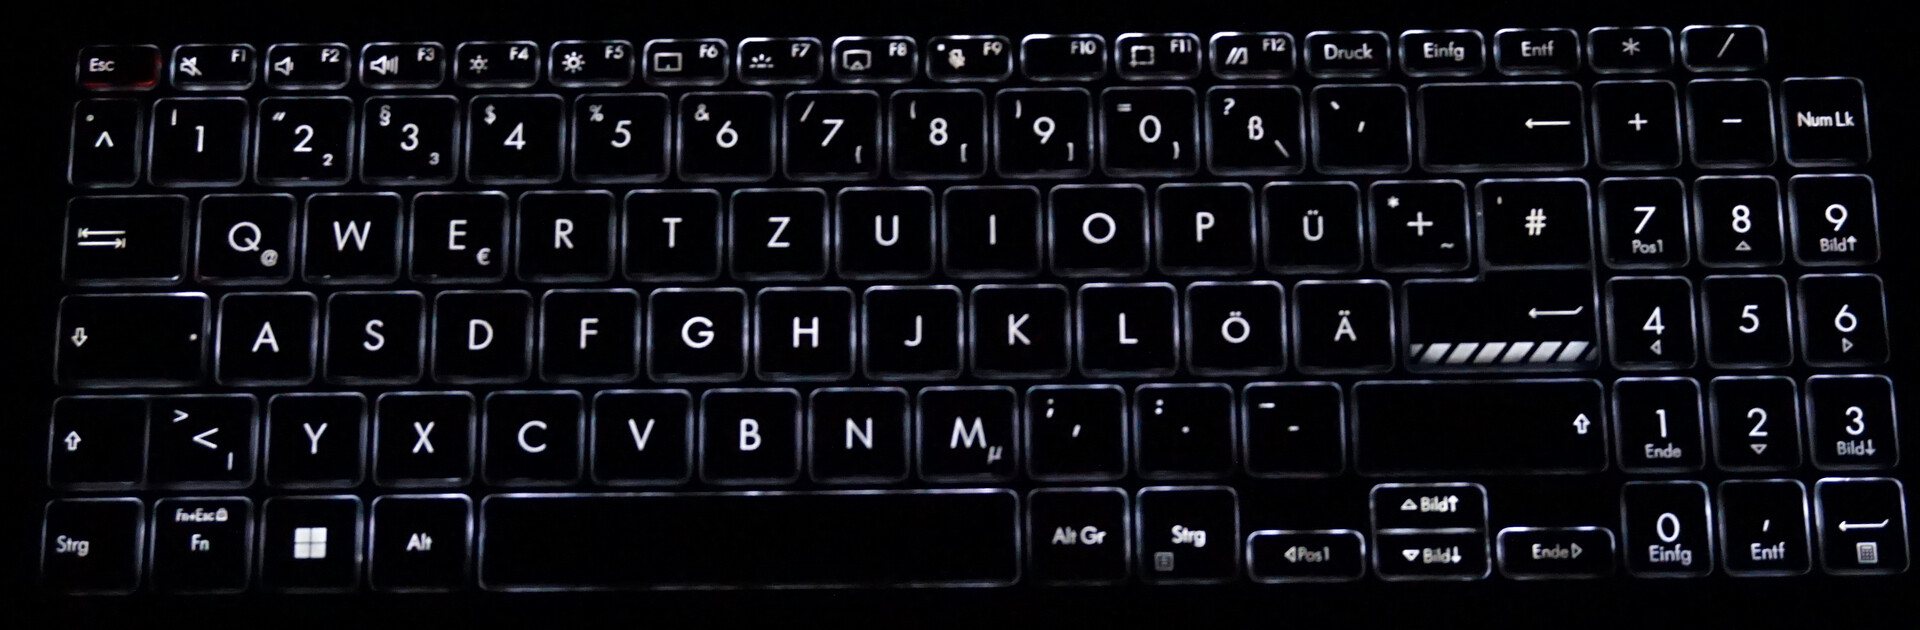
Keyboard
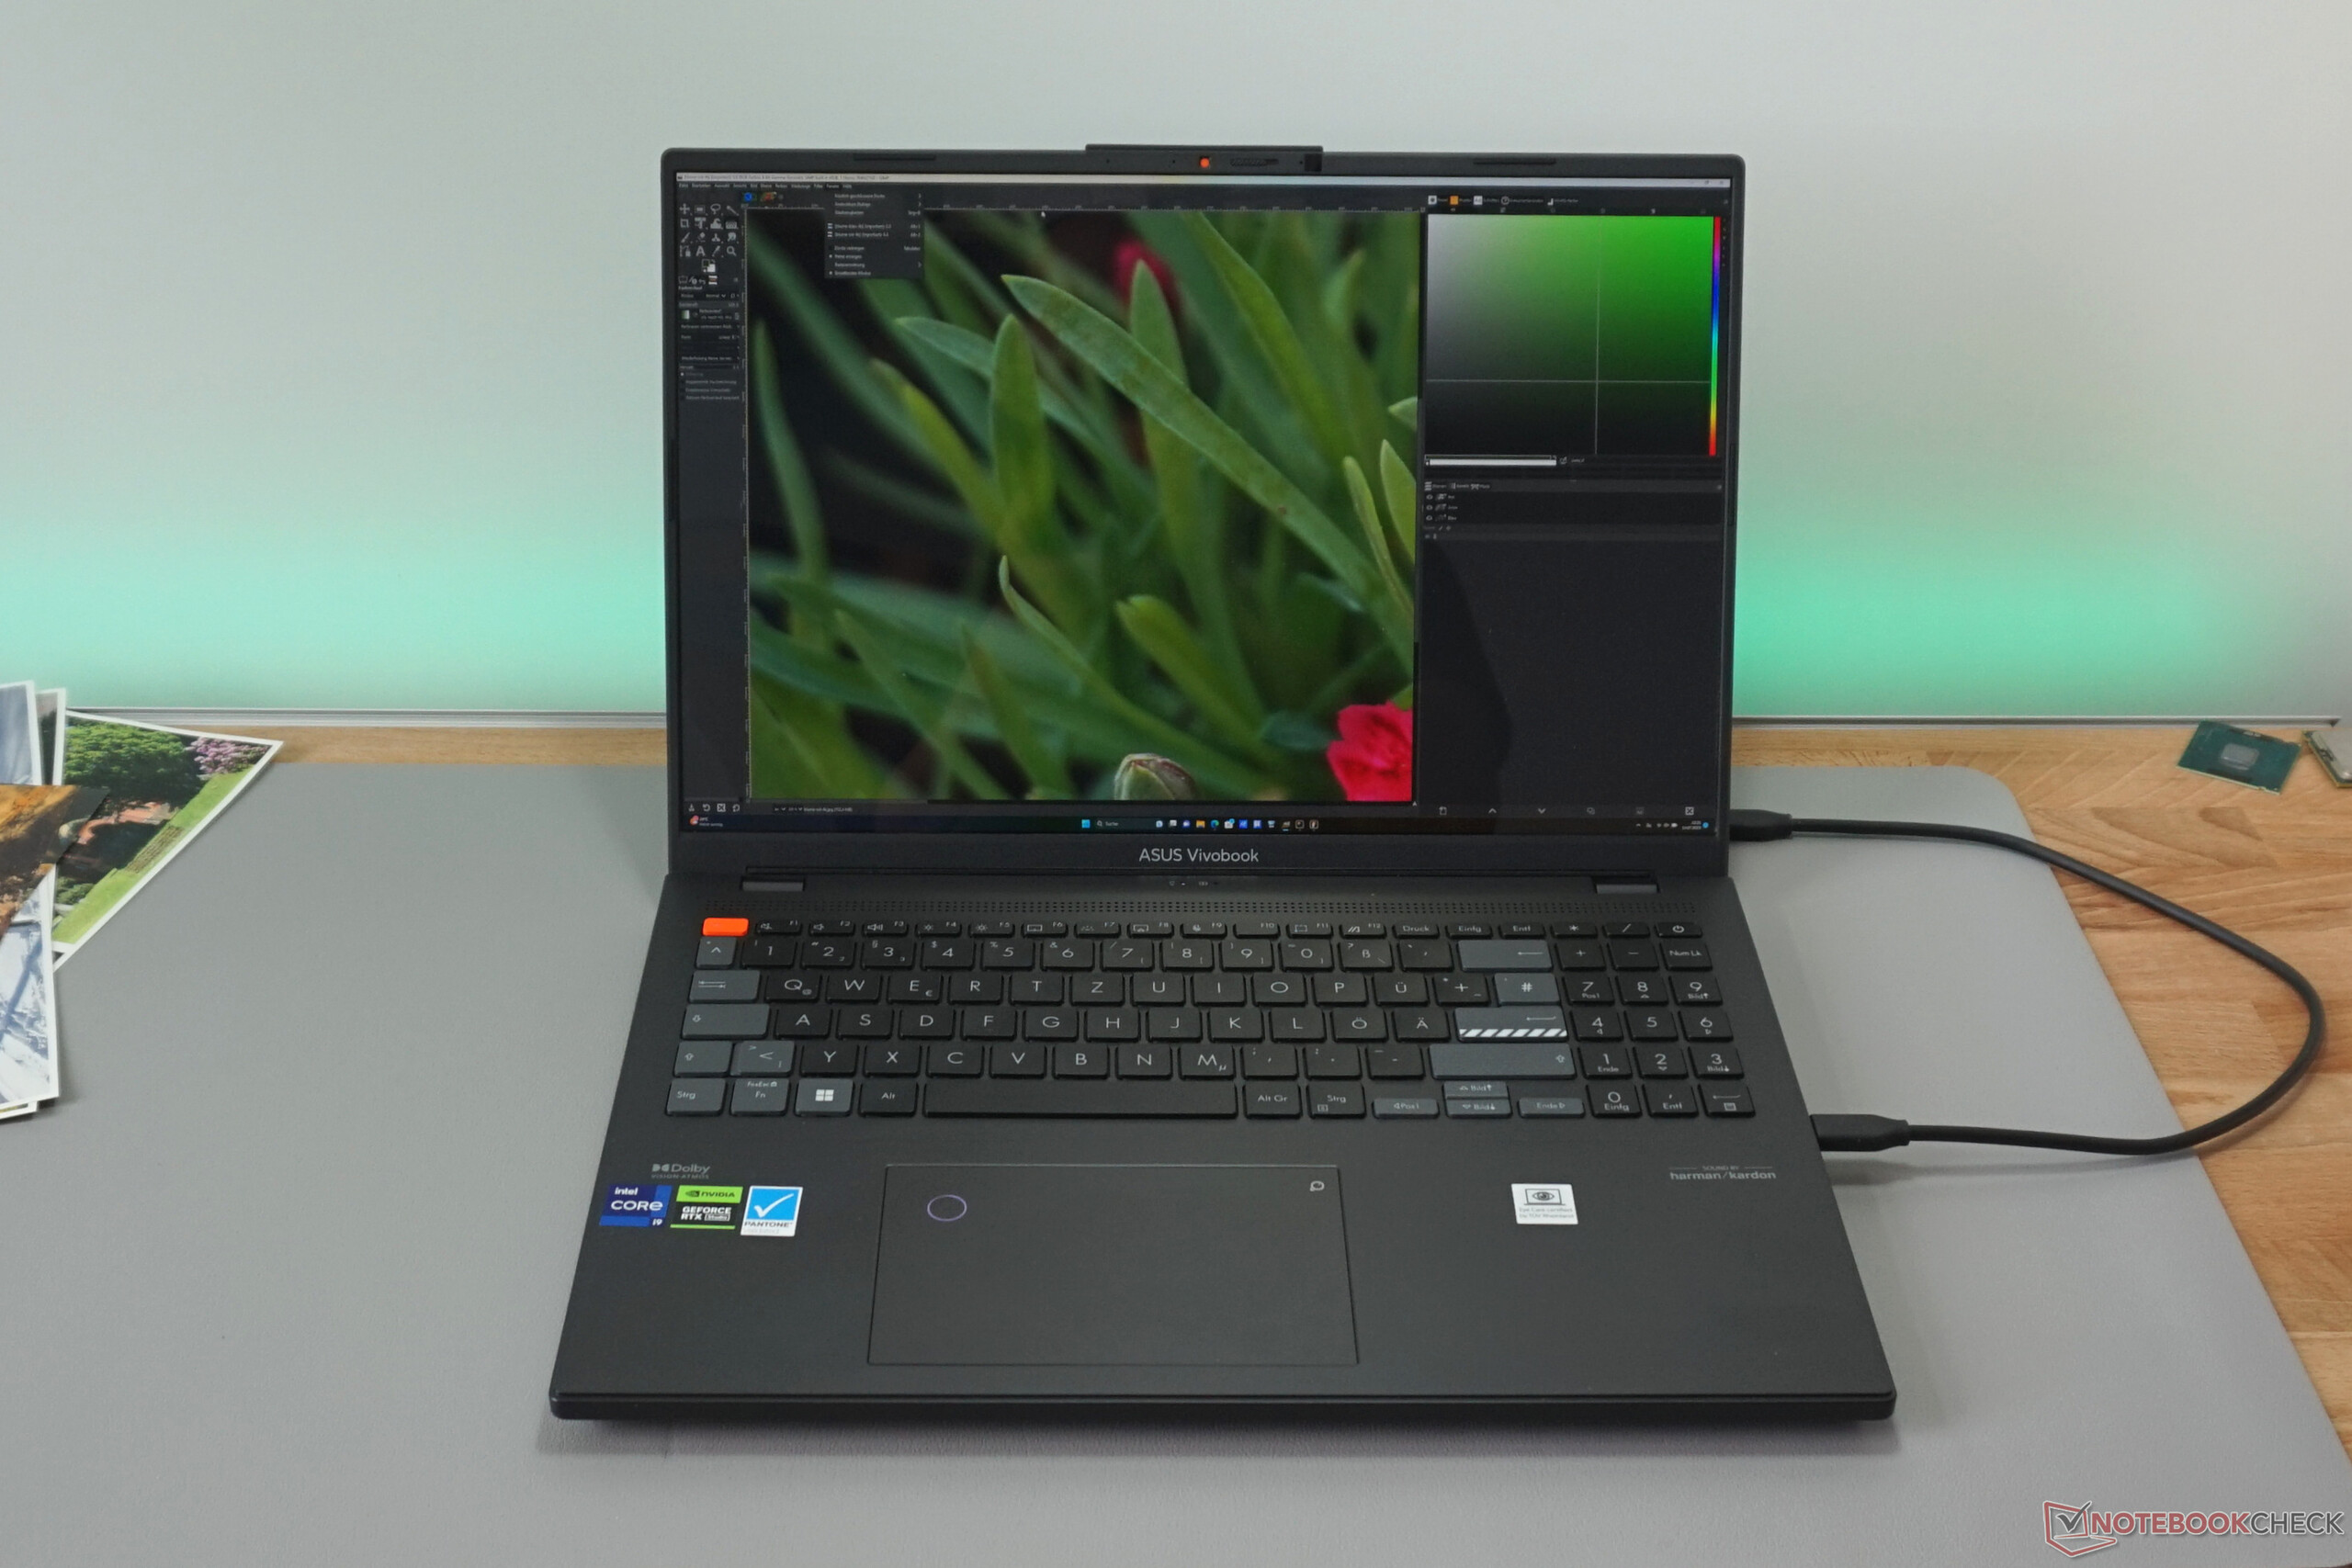
With a fully-fledged numpad, a travel of 1.4 mm (our measurement) and well-dosed back pressure, the keyboard leaves an excellent impression, even if the color accents are certainly not everyone's cup of tea. In addition, there is the three-stage, uniform keyboard backlight.
Unfortunately, the keyboard frame yields too much when typing. This is likely to be a disruptive factor, even for frequent typists who are less squeamish.
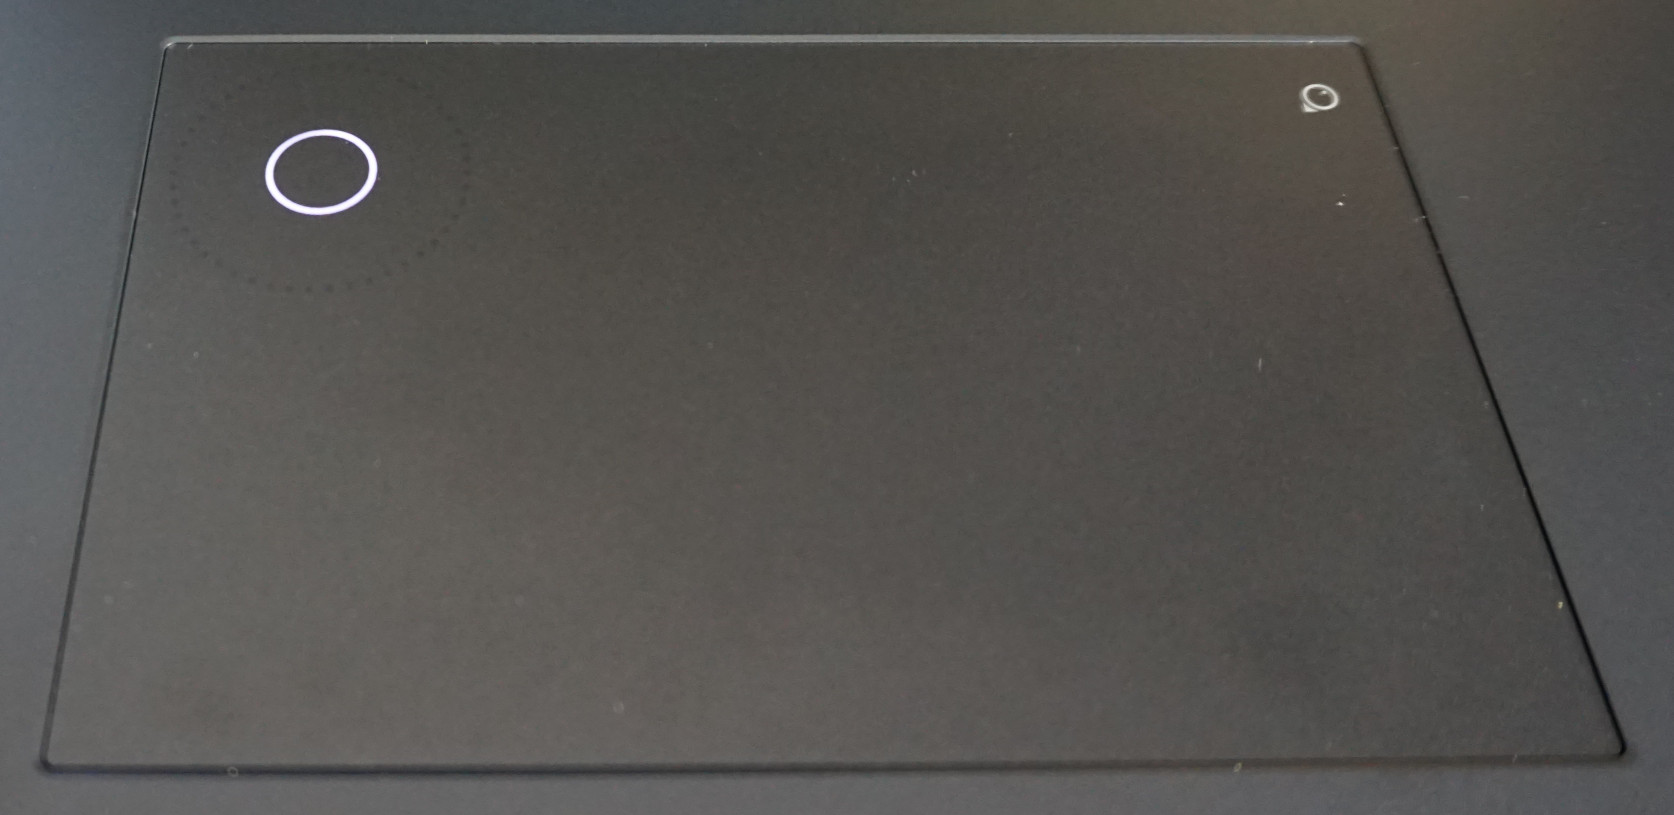
Touchpad
At 8 by 13 cm, the touchpad is pleasantly large, precise, and houses easy-to-press hidden buttons, leaving a solid impression overall.
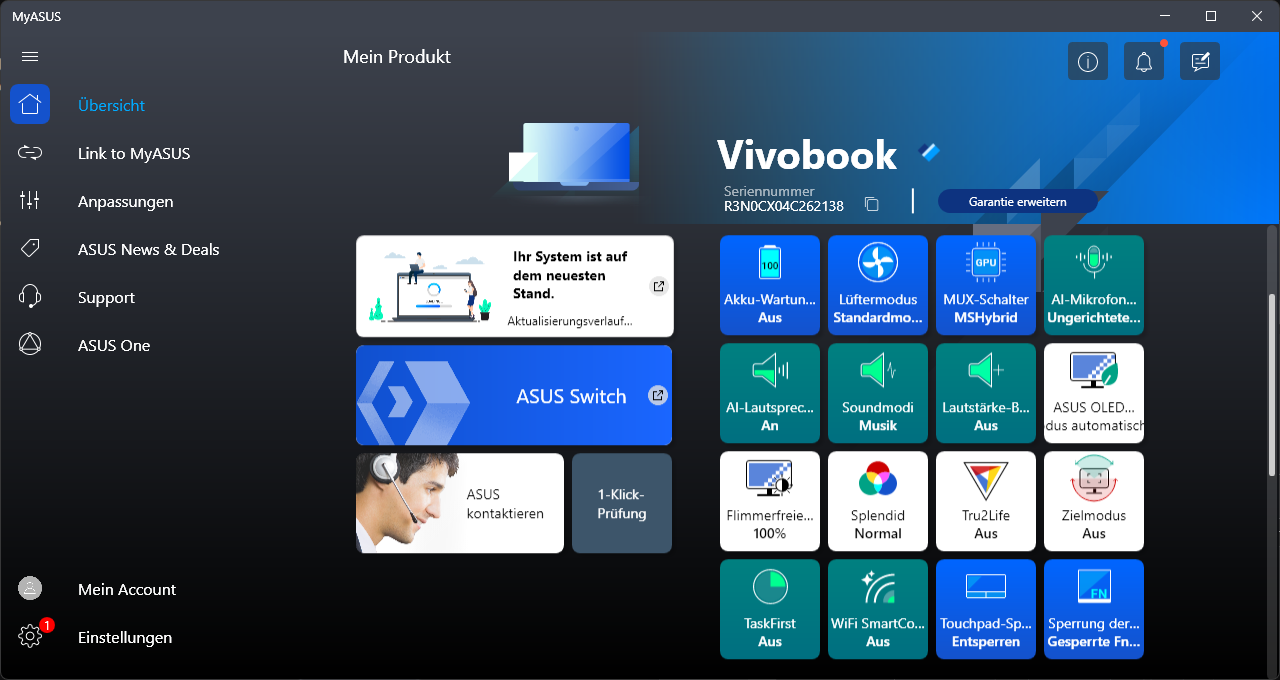
A control wheel can also be displayed in the upper left corner via a button in the upper right corner. This doesn't work quite as precisely and reliably as the physical wheel installed in the Asus ProArt Studiobook. Nevertheless, it earns its spot via basic functions for adjusting brightness and volume. The ProArt software can also be used to add a wide variety of functions and, for example, store key combinations for different applications.
In video editing, for example, one can scroll from frame to frame. In image editing, contrast and color settings can be accessed directly. And, of course, everything else can be controlled via the control panel, as long as the key combination is known.
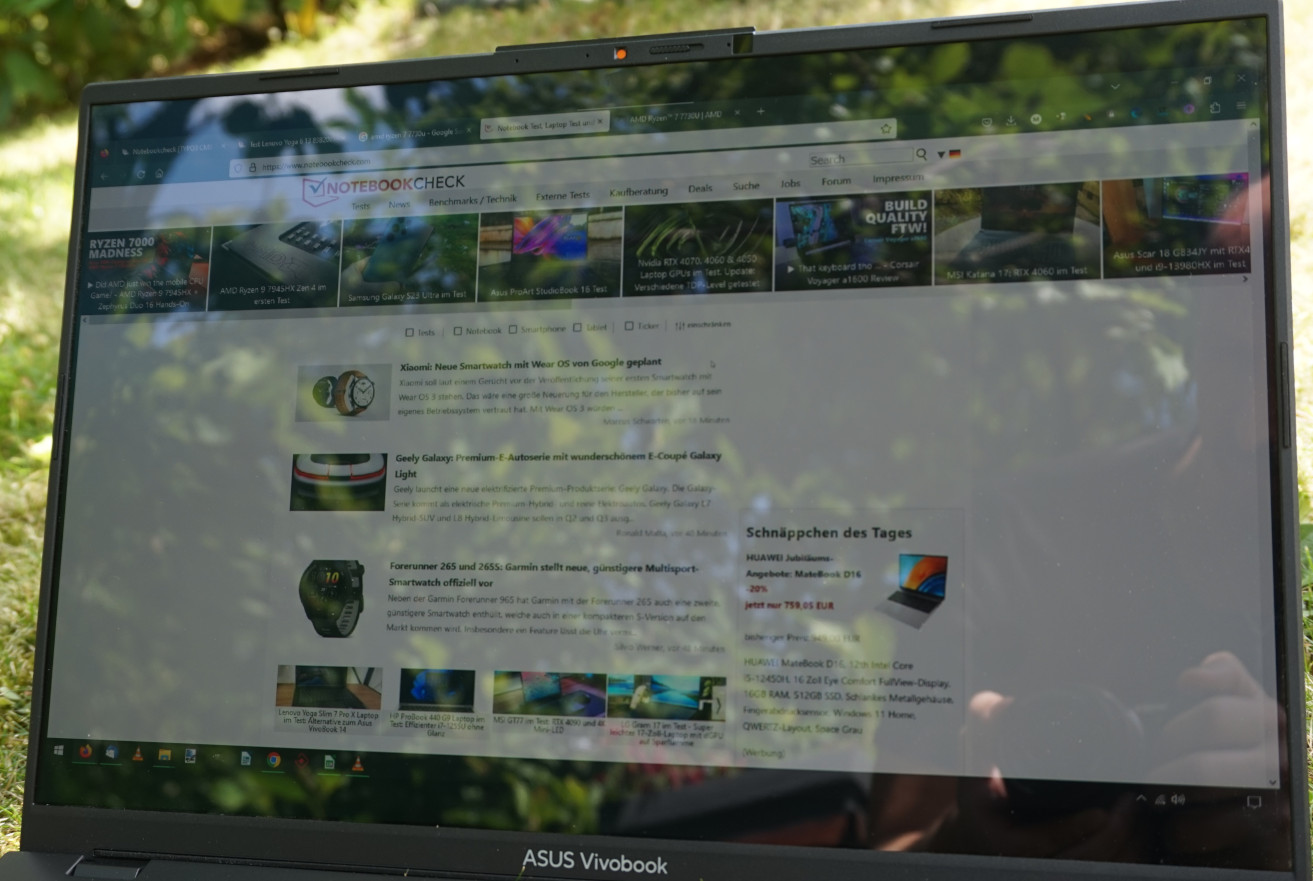
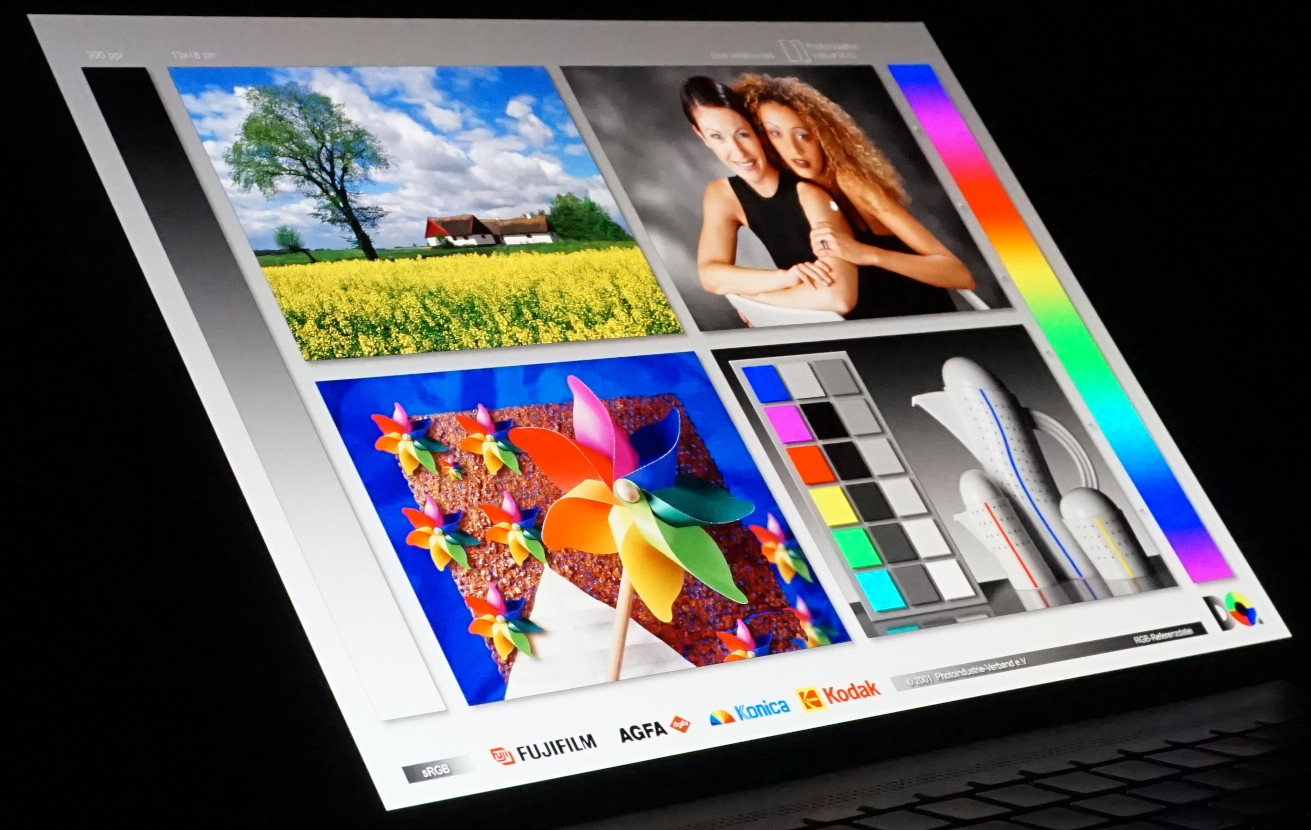
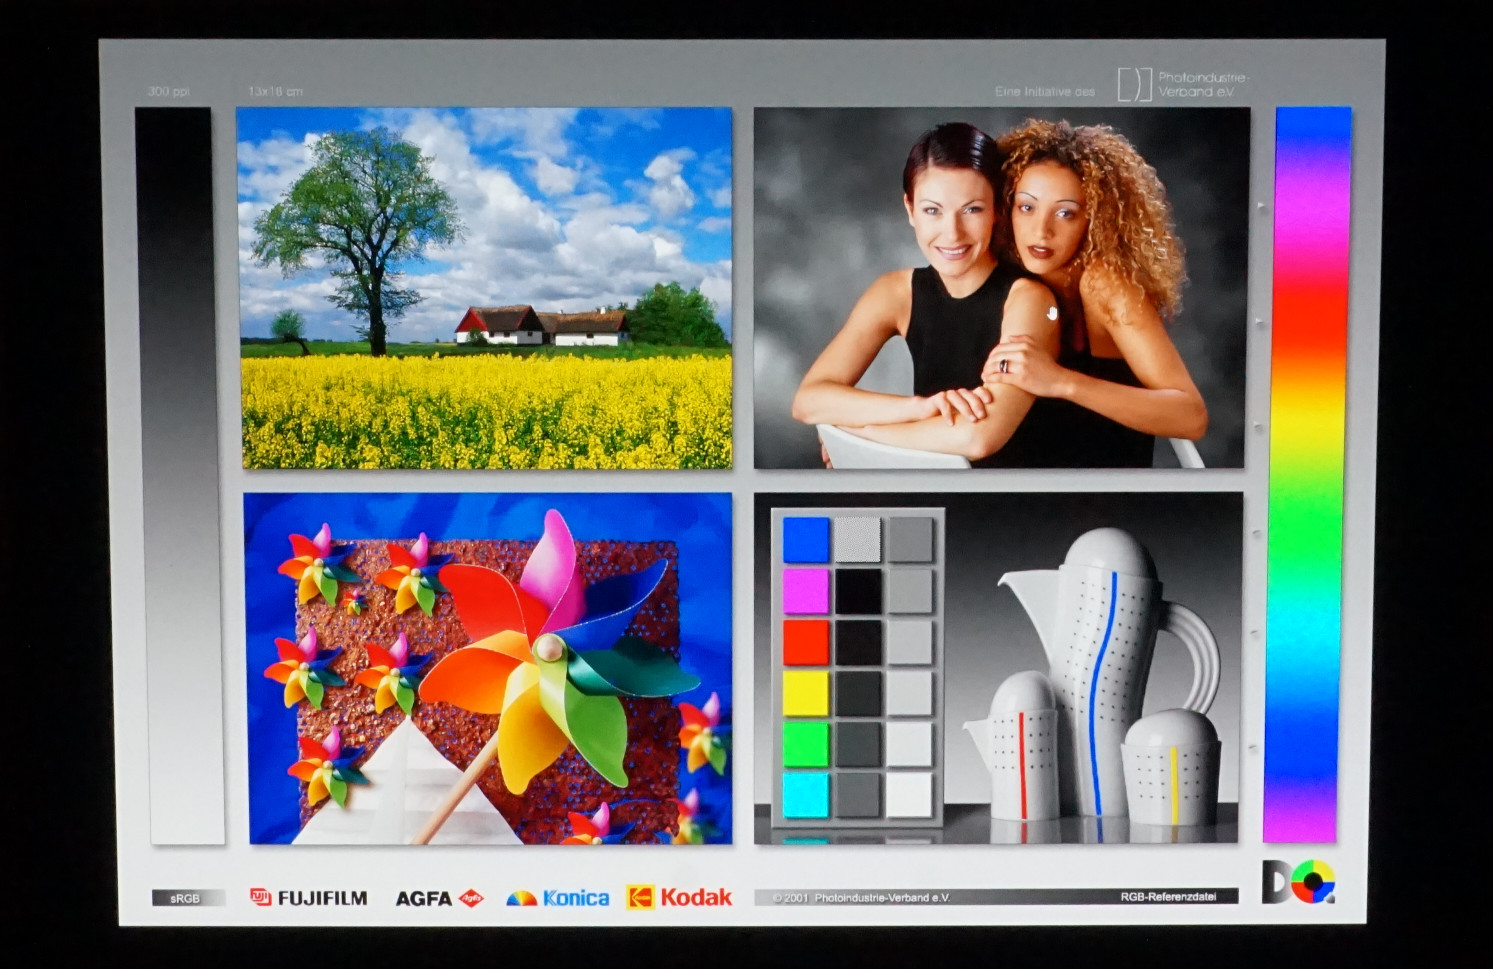
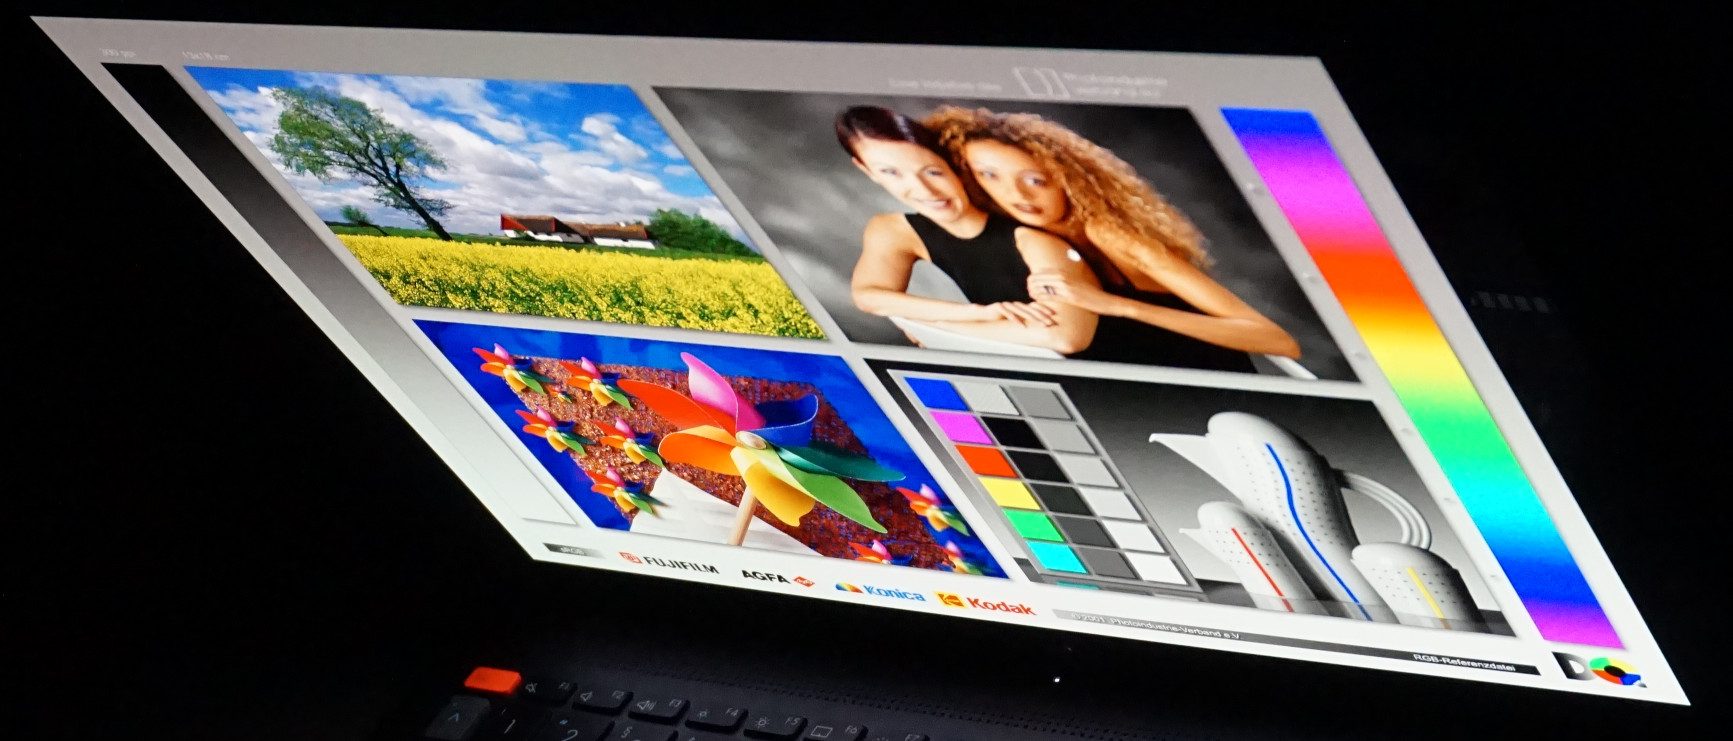
Display - Color-intensive OLED without touch

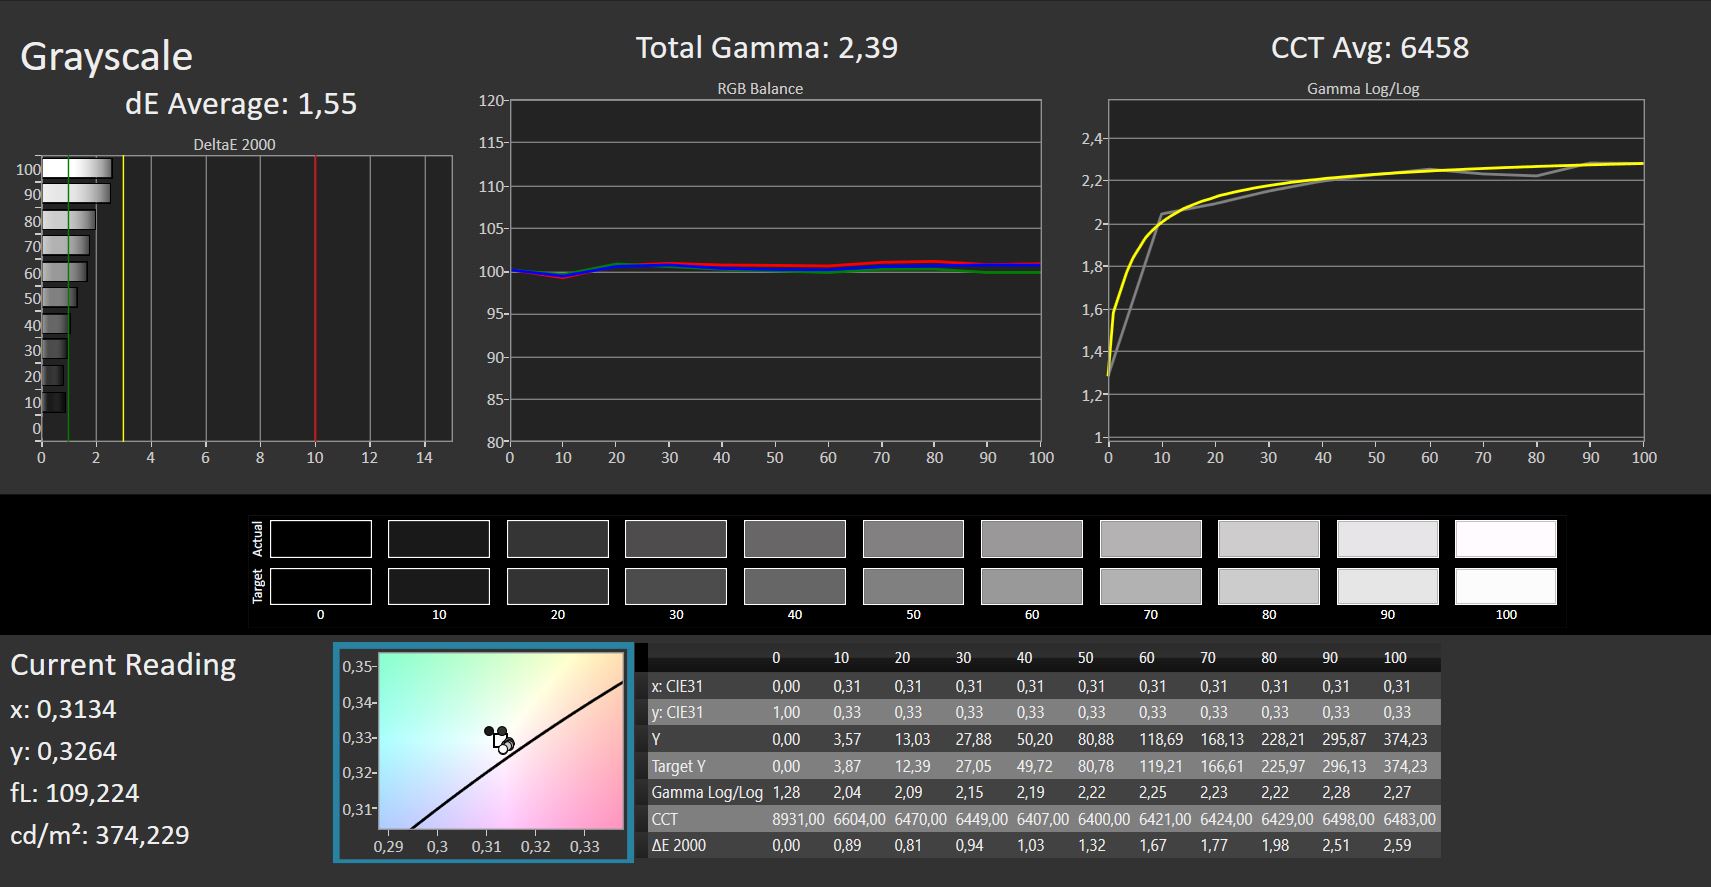
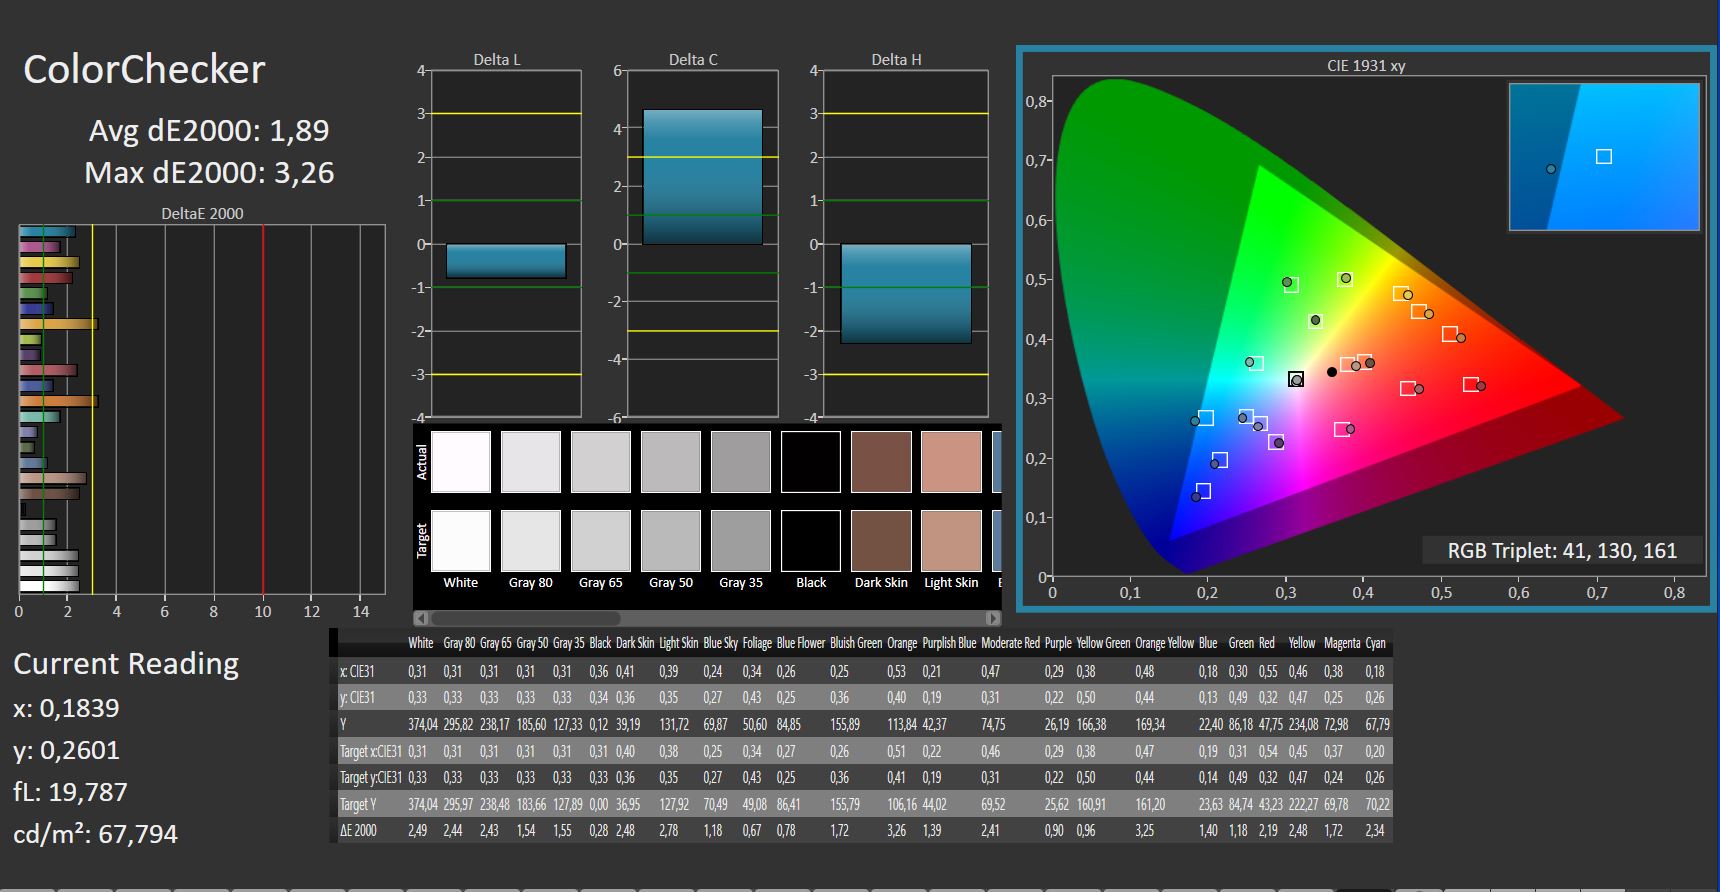
The OLED display also plays to its strengths in the VivoBook Pro 16X. The deep black and the resulting high contrast make for bright and lively colors. These are reproduced almost perfectly, even without further calibration.
The unusual resolution of 3,200 by 2,000 pixels corresponds to the 16:10 format and falls roughly in the middle between QHD and 4K. On the 16-inch display, it ensures a detailed display of high-resolution digital photos, at least in sections, without the representations becoming too tiny like in 4K.
The average-only brightness does not have any drawbacks, at least indoors. Due to the very low black value, the image appears brighter than on an IPS panel. However, the glossy surface prevents good visibility outdoors at just under 350 cd/m² in SDR mode.
Compared to similar rivals with an OLED display, the Asus VivoBook only uses a frame rate of 120 Hz, which also corresponds to the measured PWM flickering of precisely 120 Hz. Although it is much more subtle than on TN or some IPS panels, it is still perceptible for sensitive eyes. It also increases to 240 Hz at 60% brightness and below.
Screen bleeding or halos do not occur on an OLED display.
| |||||||||||||||||||||||||
Brightness Distribution: 97 %
Contrast: 5783:1 (Black: 0.06 cd/m²)
ΔE ColorChecker Calman: 1.89 | ∀{0.5-29.43 Ø4.73}
calibrated: 1.97
ΔE Greyscale Calman: 1.55 | ∀{0.09-98 Ø4.97}
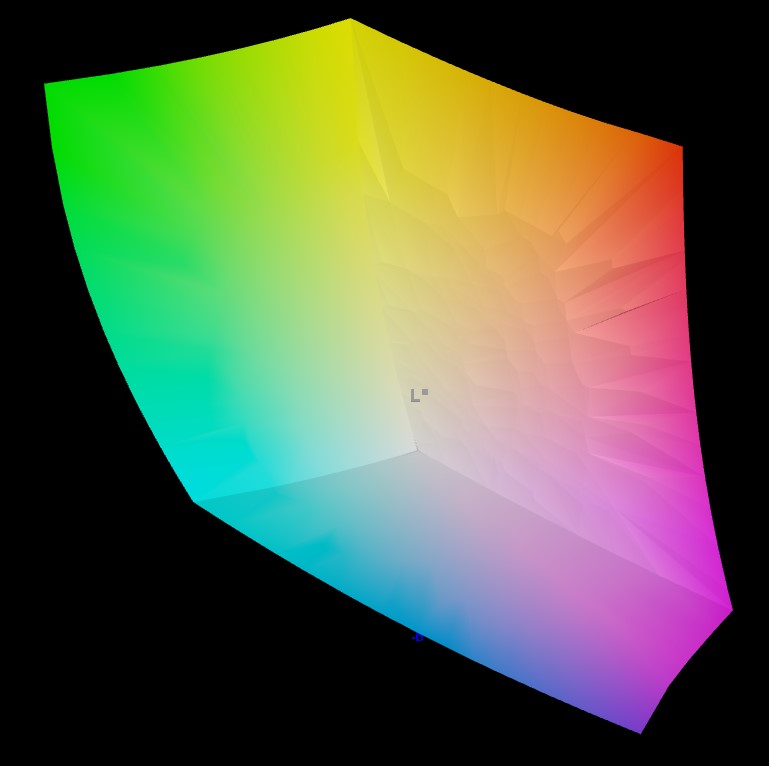
95.8% AdobeRGB 1998 (Argyll 3D)
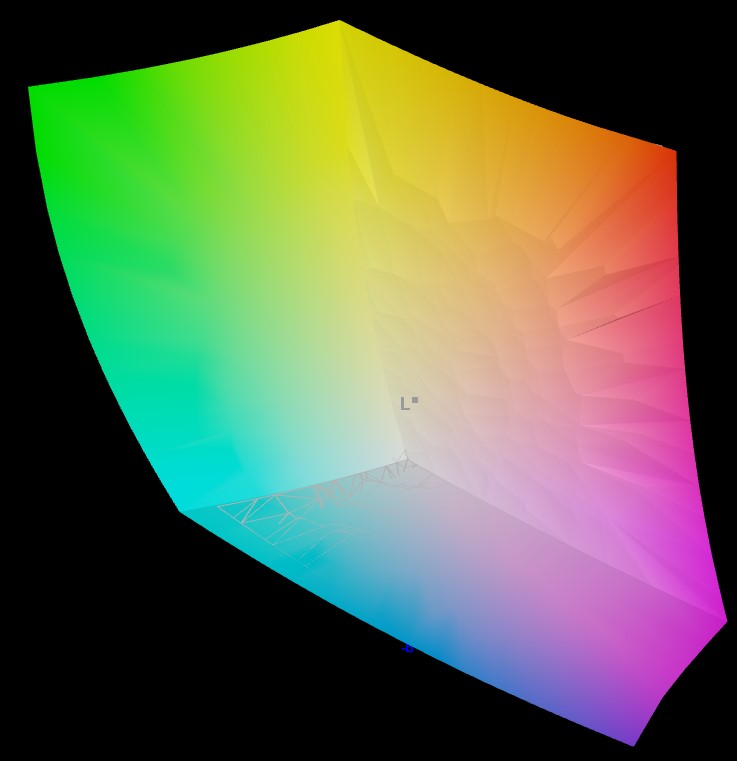
99.7% sRGB (Argyll 3D)
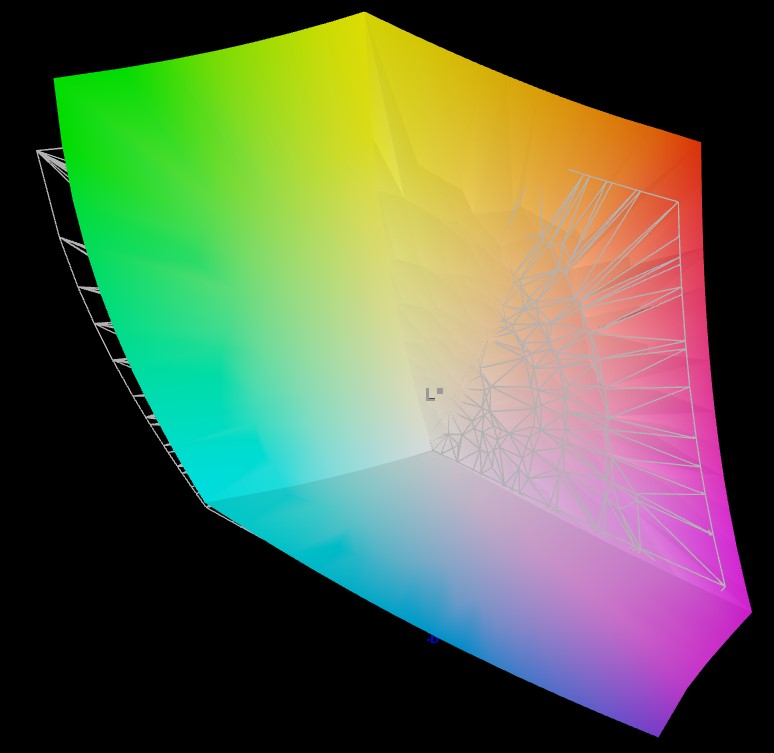
98.4% Display P3 (Argyll 3D)
Gamma: 2.39
CCT: 6458 K
| Asus Vivobook Pro 16X K6604JV-MX016W Samsung SDC4178 ATNA60BX01-1, OLED, 3200x2000, 16" | Dell XPS 15 9530 RTX 4070 Samsung 156XG01, OLED, 3456x2160, 15.6" | Samsung Galaxy Book3 Ultra 16 Samsung ATNA60CL03-0, AMOLED, 2880x1800, 16" | Asus ProArt Studiobook 16 OLED H7604 ATNA60BX01-1, OLED, 3200x2000, 16" | Schenker VISION 16 Pro (M23) NE160QDM-NZ1, IPS, 2560x1600, 16" | MSI Creator Z17 A12UGST-054 AUO3C9B (B170QAN01.0), IPS, 2560x1600, 17" | |
|---|---|---|---|---|---|---|
| Display | 1% | 1% | -2% | -19% | -3% | |
| Display P3 Coverage (%) | 98.4 | 99.8 1% | 99.9 2% | 99.6 1% | 68.8 -30% | 98.9 1% |
| sRGB Coverage (%) | 99.7 | 100 0% | 100 0% | 100 0% | 98.8 -1% | 99.9 0% |
| AdobeRGB 1998 Coverage (%) | 95.8 | 98.4 3% | 96.3 1% | 89.4 -7% | 70 -27% | 86.4 -10% |
| Response Times | -22% | 62% | 54% | -618% | -423% | |
| Response Time Grey 50% / Grey 80% * (ms) | 1.6 ? | 1.68 ? -5% | 0.49 ? 69% | 0.59 ? 63% | 13.7 ? -756% | 11 ? -588% |
| Response Time Black / White * (ms) | 1.4 ? | 1.94 ? -39% | 0.65 ? 54% | 0.79 ? 44% | 8.1 ? -479% | 5 ? -257% |
| PWM Frequency (Hz) | 120 ? | 239 | 240 ? | 240 ? | ||
| Screen | -44% | 11% | 23% | -91% | -147% | |
| Brightness middle (cd/m²) | 347 | 389.5 12% | 400 15% | 349 1% | 384 11% | 444 28% |
| Brightness (cd/m²) | 346 | 392 13% | 399 15% | 350 1% | 371 7% | 415 20% |
| Brightness Distribution (%) | 97 | 98 1% | 93 -4% | 95 -2% | 88 -9% | 88 -9% |
| Black Level * (cd/m²) | 0.06 | 0.03 50% | 0.02 67% | 0.3 -400% | 0.7 -1067% | |
| Contrast (:1) | 5783 | 13333 131% | 17450 202% | 1280 -78% | 634 -89% | |
| Colorchecker dE 2000 * | 1.89 | 4.95 -162% | 2.3 -22% | 2.1 -11% | 3.4 -80% | 2.48 -31% |
| Colorchecker dE 2000 max. * | 3.26 | 8.65 -165% | 4.15 -27% | 5.5 -69% | 9.2 -182% | 3.52 -8% |
| Colorchecker dE 2000 calibrated * | 1.97 | 1.53 22% | 1.66 16% | 2.1 -7% | 1.3 34% | 2.91 -48% |
| Greyscale dE 2000 * | 1.55 | 2 -29% | 2.7 -74% | 1.2 23% | 3.4 -119% | 3.33 -115% |
| Gamma | 2.39 92% | 2.27 97% | 2.266 97% | 2.19 100% | 2.16 102% | 2.33 94% |
| CCT | 6458 101% | 6265 104% | 7047 92% | 6545 99% | 7462 87% | 6230 104% |
| Total Average (Program / Settings) | -22% /
-29% | 25% /
16% | 25% /
22% | -243% /
-151% | -191% /
-155% |
* ... smaller is better
Not quite perfect in the very dark tones, the screen doesn't fully cover the sRGB color space, although 99.7% is also completely sufficient. The same can be said of the AdobeRGB color space, which is covered at almost 96%. Here, the VivoBook Pro 16X is also clearly ahead of the Asus Studiobook 16, which only manages 89% in AdobeRGB, according to our measurements.
With an average DeltaE of less than 2, the color reproduction is almost natural. Even trained eyes are unlikely to be able to notice the difference. This applies without further calibrations, which did not bring about any improvement. In view of the minimal deviations, this is unnecessary anyway.

Display Response Times
| ↔ Response Time Black to White | ||
|---|---|---|
| 1.4 ms ... rise ↗ and fall ↘ combined | ↗ 0.6 ms rise | 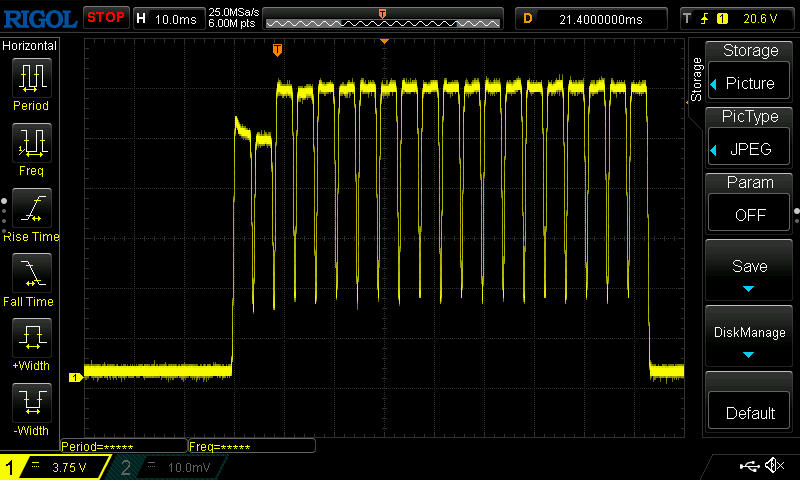 |
| ↘ 0.8 ms fall | ||
| The screen shows very fast response rates in our tests and should be very well suited for fast-paced gaming. In comparison, all tested devices range from 0.1 (minimum) to 240 (maximum) ms. » 8 % of all devices are better. This means that the measured response time is better than the average of all tested devices (19.9 ms). | ||
| ↔ Response Time 50% Grey to 80% Grey | ||
| 1.6 ms ... rise ↗ and fall ↘ combined | ↗ 0.8 ms rise | 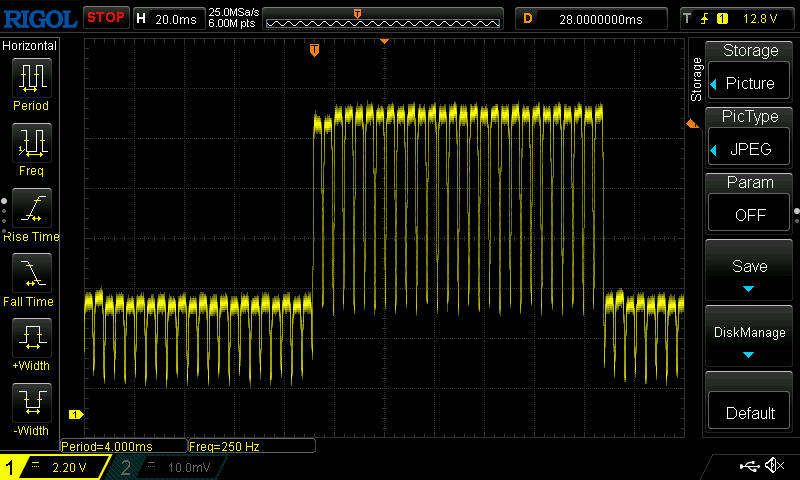 |
| ↘ 0.8 ms fall | ||
| The screen shows very fast response rates in our tests and should be very well suited for fast-paced gaming. In comparison, all tested devices range from 0.165 (minimum) to 636 (maximum) ms. » 8 % of all devices are better. This means that the measured response time is better than the average of all tested devices (31.1 ms). | ||
Screen Flickering / PWM (Pulse-Width Modulation)
| Screen flickering / PWM detected | 120 Hz | ≤ 100 % brightness setting |  |
The display backlight flickers at 120 Hz (worst case, e.g., utilizing PWM) Flickering detected at a brightness setting of 100 % and below. There should be no flickering or PWM above this brightness setting. The frequency of 120 Hz is very low, so the flickering may cause eyestrain and headaches after extended use. In comparison: 52 % of all tested devices do not use PWM to dim the display. If PWM was detected, an average of 7791 (minimum: 5 - maximum: 343500) Hz was measured. | |||


The screen's glossy surface in particular means that reflections make legibility much more difficult in a bright environment and almost impossible in sunlight. On the other hand, you can work with the VivoBook Pro outdoors as long as you sit in the shade. But you should sit indoors for image editing.

As expected for an OLED panel, brightness and color reproduction remain stable from all normal viewing angles. Also typical for OLEDs are significant color deviations at a very steep angle of more than 80°.

Performance - Working speed in the VivoBook maxed out
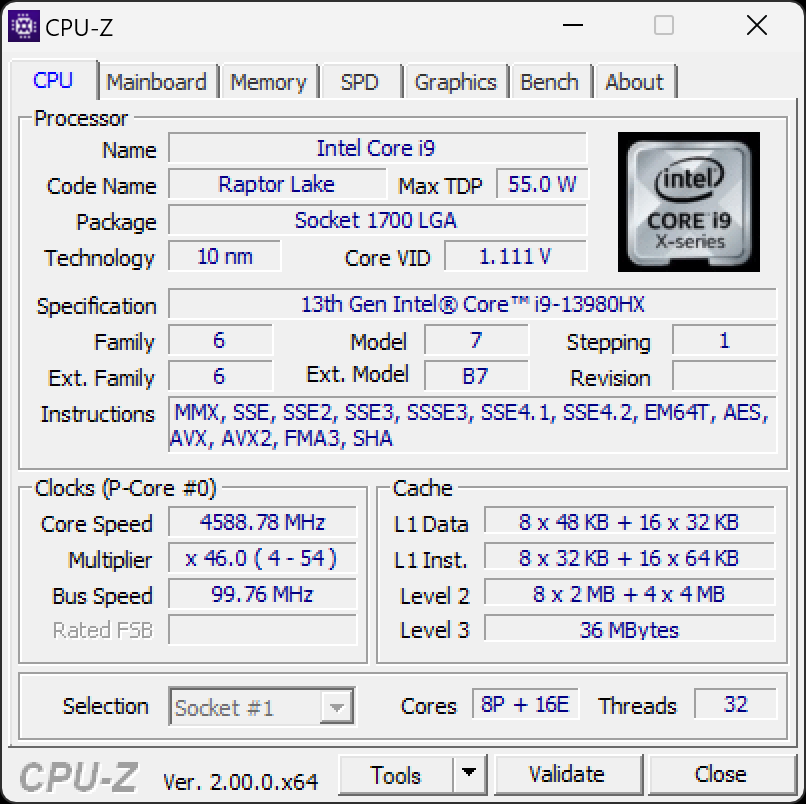
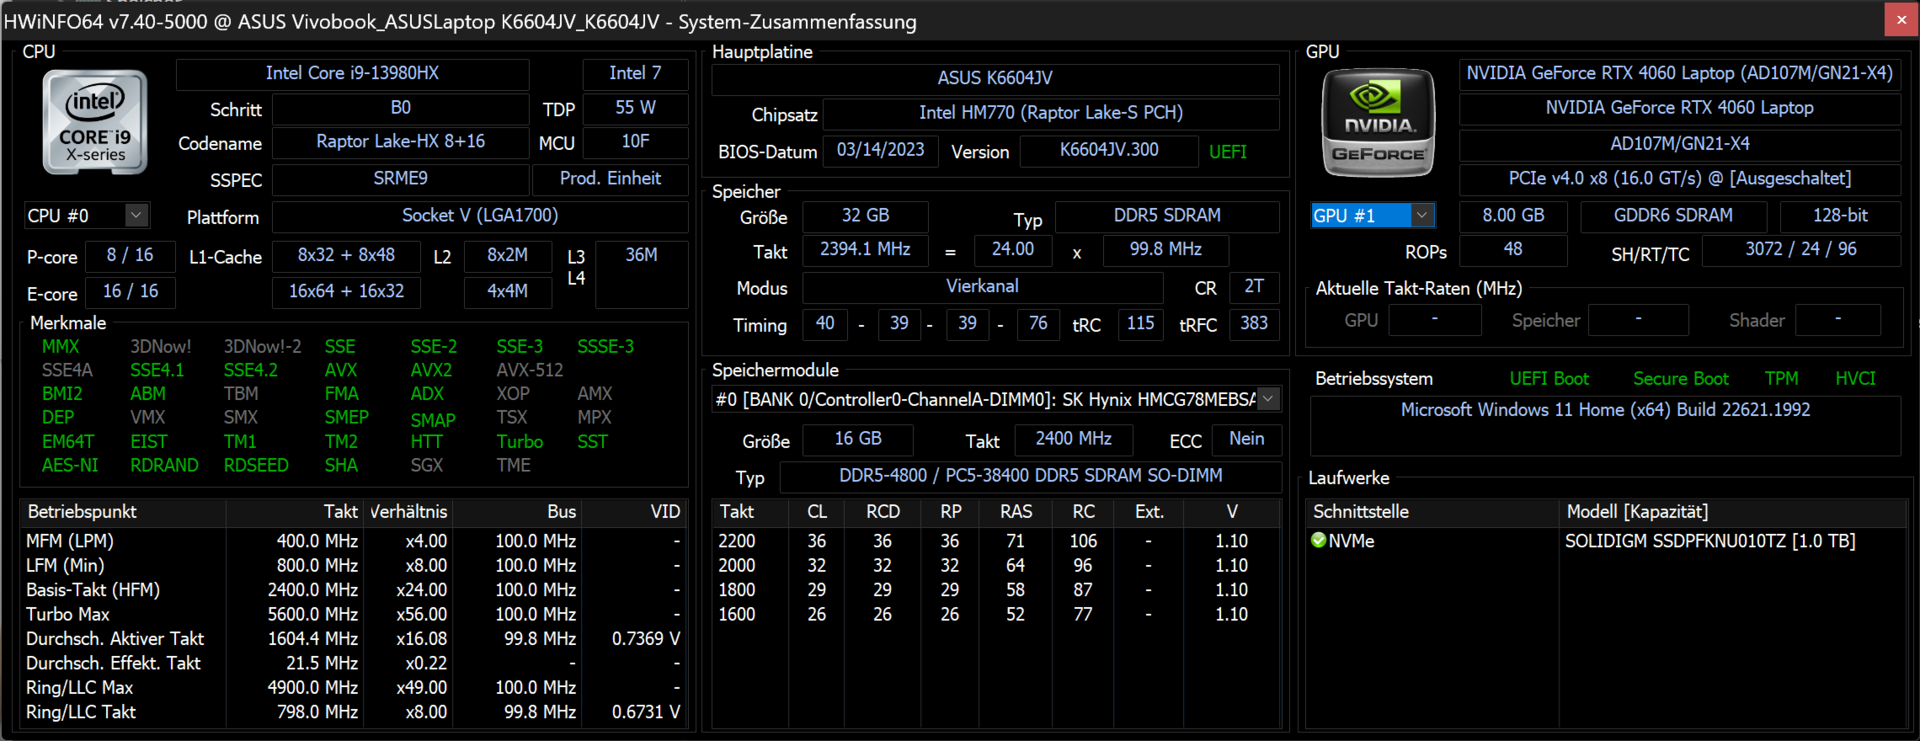
Our very strong overall impression is mainly due to the Intel Core i9-13980HX, one of the currently best mobile processors. The optional Nvidia GeForce RTX 4060, as in our test unit, or the RTX 4070, are primarily intended to accelerate image processing, video editing, rendering and, of course, 3D applications.
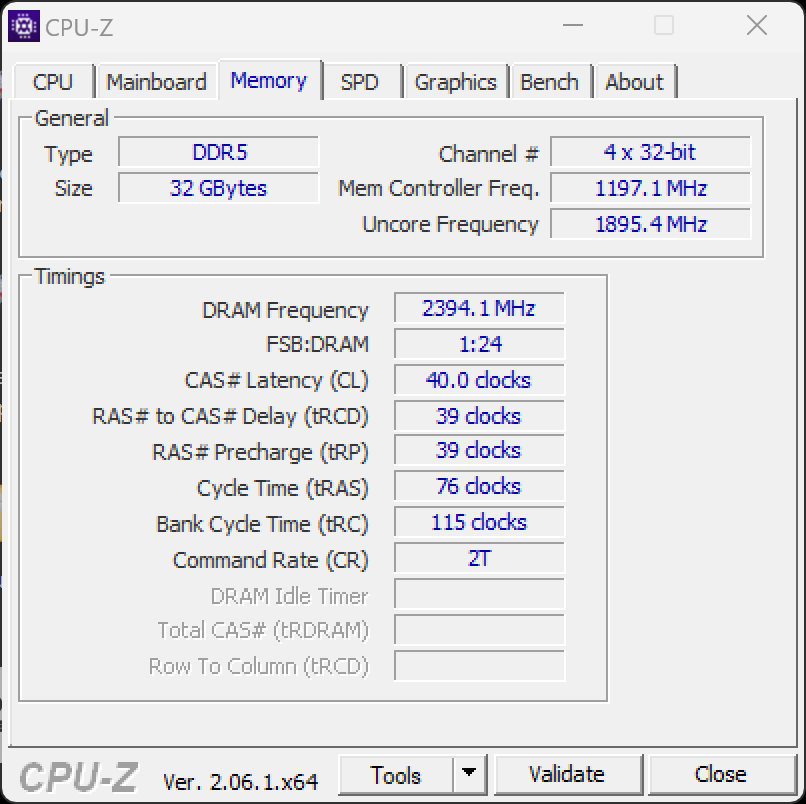
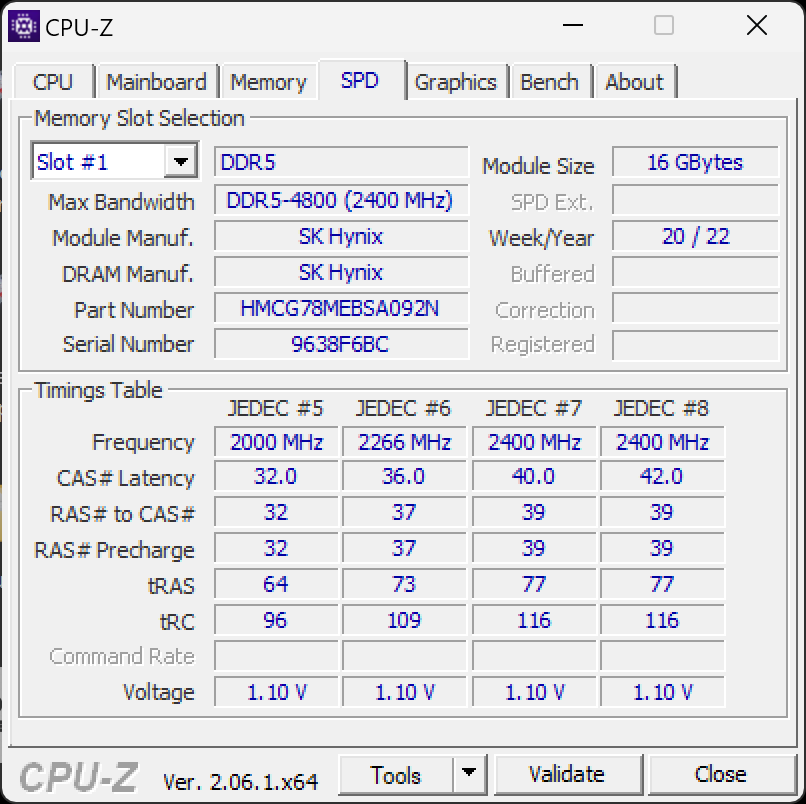
The Asus VivoBook Pro 16X impresses with enormous working speeds. It handles complex and graphically demanding applications effortlessly and likes to multitask. 32 GB of RAM, which does not exhaust the maximum possible clock of 5,600 MHz, but 4,800 MHz, complements the system well.
Testing Conditions
The setting options in the VivoBook Pro 16X are limited to three modes. Performance also results in maximum fan noise, while the performance gain is noticeable in extreme situations, but play only a subordinate role in everyday work.
For this reason, Standard mode was used for all tests, in which the power supply to the processor and graphics card is slightly reduced. In addition, Silent is added as a supplement. Here, the focus is on near-silent work, so the maximum possible computing performance always has to be reduced after short loads. Nonetheless, we did not register any serious throttling in Standard mode.
The maximum power consumption of the CPU and GPU as well as the measured fan noise are summarized in the table below.
| Energy profile | CPU load | GPU load | Max. fan volume |
|---|---|---|---|
| Standard | 157/80 watts | 90 watts | 37.0 dB(A) |
| Performance | 157/157 watts | 115 watts | 56.7 dB(A) |
| Silent | 105/55 watts | 80 watts | 29.2 dB(A) |
Processor
Not many notebooks surpass the Asus VivoBook Pro with its Intel Core i9-13980HX in terms of pure computing power. Larger, heavier laptops for gaming such as the Lenovo Legion Pro 7 or the Asus ROG Strix G17 are on par or better thanks to the AMD Ryzen 9 7945HX. With 8 performance cores and a total of 32 threads, a maximum clock rate of 5.6 GHz and an external controller, the i9-13980HX is certainly well equipped.
The Asus ProArt Studiobook 16 is also on the same level as long as Performance mode is set. And this is despite the fact that the VivoBook is "only" allowed to consume 157 W instead of 170 W. Our benchmarks are often 10% better. Due to the significantly increased fan power, the sustained performance values are also slightly better, as can be clearly seen in the Cinebench R15 loop. The values for Standard and Performance are in the diagram.
In Standard mode with moderate fan noise, the measured values are weaker, but still excellent. Similarly positioned multimedia notebooks with smaller CPUs such as the Intel Core i7-13700H are clearly outperformed. This is reflected in the evaluation of various CPU benchmarks, where there is a clear gap to the VivoBook.
In Silent mode, the CPU is throttled relatively quickly because it would otherwise get too hot due to the reduced cooling. When the mains plug is pulled, there is a significant drop in performance. For example, just under 11,000 points is reached in the Cinebench R23 multi-core test. This is just under a third of the score in Standard mode, but is not far off the average of all multimedia laptops we have reviewed in the last 2 years.
More benchmarks and information can be found in our CPU benchmark list.
Cinebench R15 Multi Sustained Load
Cinebench R23: Multi Core | Single Core
Cinebench R20: CPU (Multi Core) | CPU (Single Core)
Cinebench R15: CPU Multi 64Bit | CPU Single 64Bit
Blender: v2.79 BMW27 CPU
7-Zip 18.03: 7z b 4 | 7z b 4 -mmt1
Geekbench 5.5: Multi-Core | Single-Core
HWBOT x265 Benchmark v2.2: 4k Preset
LibreOffice : 20 Documents To PDF
R Benchmark 2.5: Overall mean
| CPU Performance rating | |
| Asus ProArt Studiobook 16 OLED H7604 | |
| Average Intel Core i9-13980HX | |
| Asus Vivobook Pro 16X K6604JV-MX016W | |
| MSI Creator Z17 A12UGST-054 | |
| Dell XPS 15 9530 RTX 4070 | |
| Average of class Multimedia | |
| Schenker VISION 16 Pro (M23) | |
| Samsung Galaxy Book3 Ultra 16 | |
| Cinebench R23 / Multi Core | |
| Asus ProArt Studiobook 16 OLED H7604 | |
| Average Intel Core i9-13980HX (28301 - 33052, n=11) | |
| Asus Vivobook Pro 16X K6604JV-MX016W | |
| Average of class Multimedia (4861 - 33362, n=81, last 2 years) | |
| MSI Creator Z17 A12UGST-054 | |
| Dell XPS 15 9530 RTX 4070 | |
| Samsung Galaxy Book3 Ultra 16 | |
| Schenker VISION 16 Pro (M23) | |
| Cinebench R23 / Single Core | |
| Asus ProArt Studiobook 16 OLED H7604 | |
| Average Intel Core i9-13980HX (1825 - 2169, n=9) | |
| Average of class Multimedia (1128 - 2459, n=73, last 2 years) | |
| Schenker VISION 16 Pro (M23) | |
| MSI Creator Z17 A12UGST-054 | |
| Dell XPS 15 9530 RTX 4070 | |
| Asus Vivobook Pro 16X K6604JV-MX016W | |
| Samsung Galaxy Book3 Ultra 16 | |
| Cinebench R20 / CPU (Multi Core) | |
| Asus ProArt Studiobook 16 OLED H7604 | |
| Average Intel Core i9-13980HX (10353 - 12437, n=10) | |
| Asus Vivobook Pro 16X K6604JV-MX016W | |
| Average of class Multimedia (1887 - 12912, n=64, last 2 years) | |
| MSI Creator Z17 A12UGST-054 | |
| Dell XPS 15 9530 RTX 4070 | |
| Samsung Galaxy Book3 Ultra 16 | |
| Schenker VISION 16 Pro (M23) | |
| Cinebench R20 / CPU (Single Core) | |
| Asus ProArt Studiobook 16 OLED H7604 | |
| Average Intel Core i9-13980HX (717 - 825, n=10) | |
| Schenker VISION 16 Pro (M23) | |
| Average of class Multimedia (425 - 853, n=64, last 2 years) | |
| Asus Vivobook Pro 16X K6604JV-MX016W | |
| MSI Creator Z17 A12UGST-054 | |
| Dell XPS 15 9530 RTX 4070 | |
| Samsung Galaxy Book3 Ultra 16 | |
| Cinebench R15 / CPU Multi 64Bit | |
| Average Intel Core i9-13980HX (4358 - 5172, n=11) | |
| Asus Vivobook Pro 16X K6604JV-MX016W | |
| Asus ProArt Studiobook 16 OLED H7604 | |
| Dell XPS 15 9530 RTX 4070 | |
| MSI Creator Z17 A12UGST-054 | |
| Average of class Multimedia (856 - 5224, n=68, last 2 years) | |
| Samsung Galaxy Book3 Ultra 16 | |
| Schenker VISION 16 Pro (M23) | |
| Cinebench R15 / CPU Single 64Bit | |
| Asus ProArt Studiobook 16 OLED H7604 | |
| Average Intel Core i9-13980HX (289 - 312, n=11) | |
| Asus Vivobook Pro 16X K6604JV-MX016W | |
| Average of class Multimedia (184.8 - 326, n=66, last 2 years) | |
| Schenker VISION 16 Pro (M23) | |
| Dell XPS 15 9530 RTX 4070 | |
| MSI Creator Z17 A12UGST-054 | |
| Samsung Galaxy Book3 Ultra 16 | |
| Blender / v2.79 BMW27 CPU | |
| Average of class Multimedia (100 - 557, n=65, last 2 years) | |
| Schenker VISION 16 Pro (M23) | |
| Samsung Galaxy Book3 Ultra 16 | |
| Dell XPS 15 9530 RTX 4070 | |
| MSI Creator Z17 A12UGST-054 | |
| Asus Vivobook Pro 16X K6604JV-MX016W | |
| Average Intel Core i9-13980HX (97 - 136, n=10) | |
| Asus ProArt Studiobook 16 OLED H7604 | |
| 7-Zip 18.03 / 7z b 4 | |
| Asus ProArt Studiobook 16 OLED H7604 | |
| Average Intel Core i9-13980HX (104616 - 129804, n=10) | |
| Asus Vivobook Pro 16X K6604JV-MX016W | |
| MSI Creator Z17 A12UGST-054 | |
| Schenker VISION 16 Pro (M23) | |
| Samsung Galaxy Book3 Ultra 16 | |
| Dell XPS 15 9530 RTX 4070 | |
| Average of class Multimedia (29095 - 130368, n=62, last 2 years) | |
| 7-Zip 18.03 / 7z b 4 -mmt1 | |
| Asus ProArt Studiobook 16 OLED H7604 | |
| Asus Vivobook Pro 16X K6604JV-MX016W | |
| Average Intel Core i9-13980HX (6230 - 7163, n=10) | |
| Schenker VISION 16 Pro (M23) | |
| Dell XPS 15 9530 RTX 4070 | |
| Average of class Multimedia (3666 - 7545, n=63, last 2 years) | |
| MSI Creator Z17 A12UGST-054 | |
| Samsung Galaxy Book3 Ultra 16 | |
| Geekbench 5.5 / Multi-Core | |
| Average Intel Core i9-13980HX (18475 - 22200, n=10) | |
| Asus ProArt Studiobook 16 OLED H7604 | |
| Asus Vivobook Pro 16X K6604JV-MX016W | |
| MSI Creator Z17 A12UGST-054 | |
| Dell XPS 15 9530 RTX 4070 | |
| Average of class Multimedia (4652 - 20422, n=62, last 2 years) | |
| Schenker VISION 16 Pro (M23) | |
| Samsung Galaxy Book3 Ultra 16 | |
| Geekbench 5.5 / Single-Core | |
| Asus ProArt Studiobook 16 OLED H7604 | |
| Average Intel Core i9-13980HX (1796 - 2139, n=10) | |
| Asus Vivobook Pro 16X K6604JV-MX016W | |
| Average of class Multimedia (805 - 2974, n=62, last 2 years) | |
| Dell XPS 15 9530 RTX 4070 | |
| Schenker VISION 16 Pro (M23) | |
| MSI Creator Z17 A12UGST-054 | |
| Samsung Galaxy Book3 Ultra 16 | |
| HWBOT x265 Benchmark v2.2 / 4k Preset | |
| Average Intel Core i9-13980HX (27 - 33.4, n=9) | |
| Asus ProArt Studiobook 16 OLED H7604 | |
| Asus Vivobook Pro 16X K6604JV-MX016W | |
| Average of class Multimedia (5.26 - 36.1, n=63, last 2 years) | |
| MSI Creator Z17 A12UGST-054 | |
| Dell XPS 15 9530 RTX 4070 | |
| Samsung Galaxy Book3 Ultra 16 | |
| Schenker VISION 16 Pro (M23) | |
| LibreOffice / 20 Documents To PDF | |
| Asus Vivobook Pro 16X K6604JV-MX016W | |
| Average of class Multimedia (23.9 - 146.7, n=64, last 2 years) | |
| Samsung Galaxy Book3 Ultra 16 | |
| Schenker VISION 16 Pro (M23) | |
| Asus ProArt Studiobook 16 OLED H7604 | |
| Dell XPS 15 9530 RTX 4070 | |
| Average Intel Core i9-13980HX (35 - 51.4, n=10) | |
| MSI Creator Z17 A12UGST-054 | |
| R Benchmark 2.5 / Overall mean | |
| Samsung Galaxy Book3 Ultra 16 | |
| Average of class Multimedia (0.3604 - 0.947, n=63, last 2 years) | |
| MSI Creator Z17 A12UGST-054 | |
| Dell XPS 15 9530 RTX 4070 | |
| Schenker VISION 16 Pro (M23) | |
| Asus Vivobook Pro 16X K6604JV-MX016W | |
| Average Intel Core i9-13980HX (0.3793 - 0.4462, n=10) | |
| Asus ProArt Studiobook 16 OLED H7604 | |
* ... smaller is better
AIDA64: FP32 Ray-Trace | FPU Julia | CPU SHA3 | CPU Queen | FPU SinJulia | FPU Mandel | CPU AES | CPU ZLib | FP64 Ray-Trace | CPU PhotoWorxx
| Performance rating | |
| Asus ProArt Studiobook 16 OLED H7604 | |
| Average Intel Core i9-13980HX | |
| Asus Vivobook Pro 16X K6604JV-MX016W | |
| Average of class Multimedia | |
| Samsung Galaxy Book3 Ultra 16 | |
| Schenker VISION 16 Pro (M23) | |
| Dell XPS 15 9530 RTX 4070 | |
| MSI Creator Z17 A12UGST-054 | |
| AIDA64 / FP32 Ray-Trace | |
| Asus ProArt Studiobook 16 OLED H7604 | |
| Average Intel Core i9-13980HX (21332 - 29553, n=9) | |
| Asus Vivobook Pro 16X K6604JV-MX016W | |
| Average of class Multimedia (2214 - 50388, n=60, last 2 years) | |
| Samsung Galaxy Book3 Ultra 16 | |
| Dell XPS 15 9530 RTX 4070 | |
| Schenker VISION 16 Pro (M23) | |
| MSI Creator Z17 A12UGST-054 | |
| AIDA64 / FPU Julia | |
| Asus ProArt Studiobook 16 OLED H7604 | |
| Average Intel Core i9-13980HX (108001 - 148168, n=9) | |
| Asus Vivobook Pro 16X K6604JV-MX016W | |
| Average of class Multimedia (12867 - 201874, n=61, last 2 years) | |
| Schenker VISION 16 Pro (M23) | |
| Samsung Galaxy Book3 Ultra 16 | |
| Dell XPS 15 9530 RTX 4070 | |
| MSI Creator Z17 A12UGST-054 | |
| AIDA64 / CPU SHA3 | |
| Asus ProArt Studiobook 16 OLED H7604 | |
| Average Intel Core i9-13980HX (5264 - 7142, n=9) | |
| Asus Vivobook Pro 16X K6604JV-MX016W | |
| Average of class Multimedia (653 - 8623, n=61, last 2 years) | |
| Samsung Galaxy Book3 Ultra 16 | |
| Schenker VISION 16 Pro (M23) | |
| Dell XPS 15 9530 RTX 4070 | |
| MSI Creator Z17 A12UGST-054 | |
| AIDA64 / CPU Queen | |
| Average Intel Core i9-13980HX (126758 - 143409, n=9) | |
| Asus ProArt Studiobook 16 OLED H7604 | |
| Asus Vivobook Pro 16X K6604JV-MX016W | |
| MSI Creator Z17 A12UGST-054 | |
| Dell XPS 15 9530 RTX 4070 | |
| Samsung Galaxy Book3 Ultra 16 | |
| Schenker VISION 16 Pro (M23) | |
| Average of class Multimedia (13483 - 181505, n=49, last 2 years) | |
| AIDA64 / FPU SinJulia | |
| Average Intel Core i9-13980HX (13785 - 17117, n=9) | |
| Asus ProArt Studiobook 16 OLED H7604 | |
| Asus Vivobook Pro 16X K6604JV-MX016W | |
| MSI Creator Z17 A12UGST-054 | |
| Average of class Multimedia (1240 - 28794, n=61, last 2 years) | |
| Samsung Galaxy Book3 Ultra 16 | |
| Schenker VISION 16 Pro (M23) | |
| Dell XPS 15 9530 RTX 4070 | |
| AIDA64 / FPU Mandel | |
| Asus ProArt Studiobook 16 OLED H7604 | |
| Average Intel Core i9-13980HX (53398 - 73758, n=9) | |
| Asus Vivobook Pro 16X K6604JV-MX016W | |
| Average of class Multimedia (6395 - 105740, n=60, last 2 years) | |
| Samsung Galaxy Book3 Ultra 16 | |
| Dell XPS 15 9530 RTX 4070 | |
| Schenker VISION 16 Pro (M23) | |
| MSI Creator Z17 A12UGST-054 | |
| AIDA64 / CPU AES | |
| Asus ProArt Studiobook 16 OLED H7604 | |
| Average Intel Core i9-13980HX (105169 - 136520, n=9) | |
| Asus Vivobook Pro 16X K6604JV-MX016W | |
| MSI Creator Z17 A12UGST-054 | |
| Samsung Galaxy Book3 Ultra 16 | |
| Average of class Multimedia (13243 - 126790, n=61, last 2 years) | |
| Schenker VISION 16 Pro (M23) | |
| Dell XPS 15 9530 RTX 4070 | |
| AIDA64 / CPU ZLib | |
| Asus ProArt Studiobook 16 OLED H7604 | |
| Average Intel Core i9-13980HX (1513 - 2039, n=9) | |
| Asus Vivobook Pro 16X K6604JV-MX016W | |
| Samsung Galaxy Book3 Ultra 16 | |
| Average of class Multimedia (167.2 - 2022, n=61, last 2 years) | |
| MSI Creator Z17 A12UGST-054 | |
| Schenker VISION 16 Pro (M23) | |
| Dell XPS 15 9530 RTX 4070 | |
| AIDA64 / FP64 Ray-Trace | |
| Average Intel Core i9-13980HX (11431 - 16325, n=9) | |
| Asus ProArt Studiobook 16 OLED H7604 | |
| Asus Vivobook Pro 16X K6604JV-MX016W | |
| Average of class Multimedia (1014 - 26875, n=61, last 2 years) | |
| Samsung Galaxy Book3 Ultra 16 | |
| Dell XPS 15 9530 RTX 4070 | |
| Schenker VISION 16 Pro (M23) | |
| MSI Creator Z17 A12UGST-054 | |
| AIDA64 / CPU PhotoWorxx | |
| Average of class Multimedia (12860 - 88154, n=61, last 2 years) | |
| Asus ProArt Studiobook 16 OLED H7604 | |
| Samsung Galaxy Book3 Ultra 16 | |
| Average Intel Core i9-13980HX (37069 - 52949, n=9) | |
| Schenker VISION 16 Pro (M23) | |
| Dell XPS 15 9530 RTX 4070 | |
| Asus Vivobook Pro 16X K6604JV-MX016W | |
| MSI Creator Z17 A12UGST-054 | |
System Performance
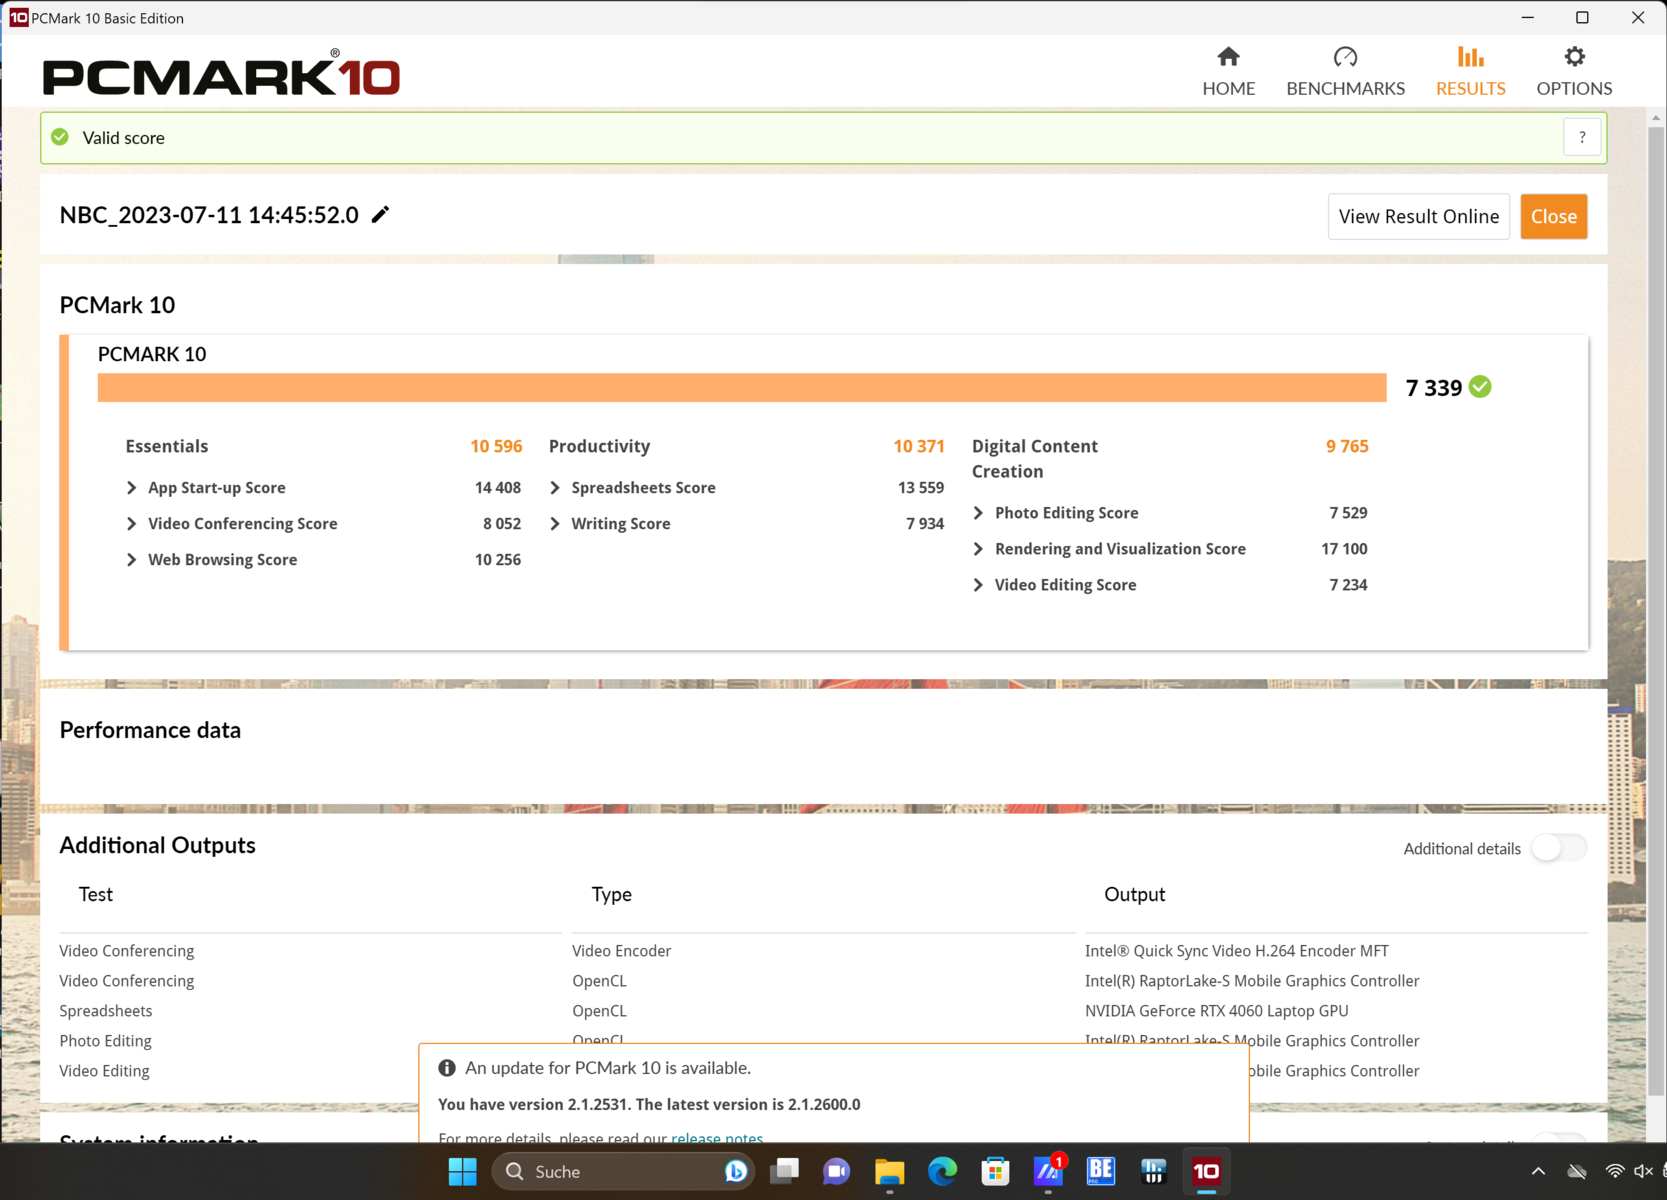
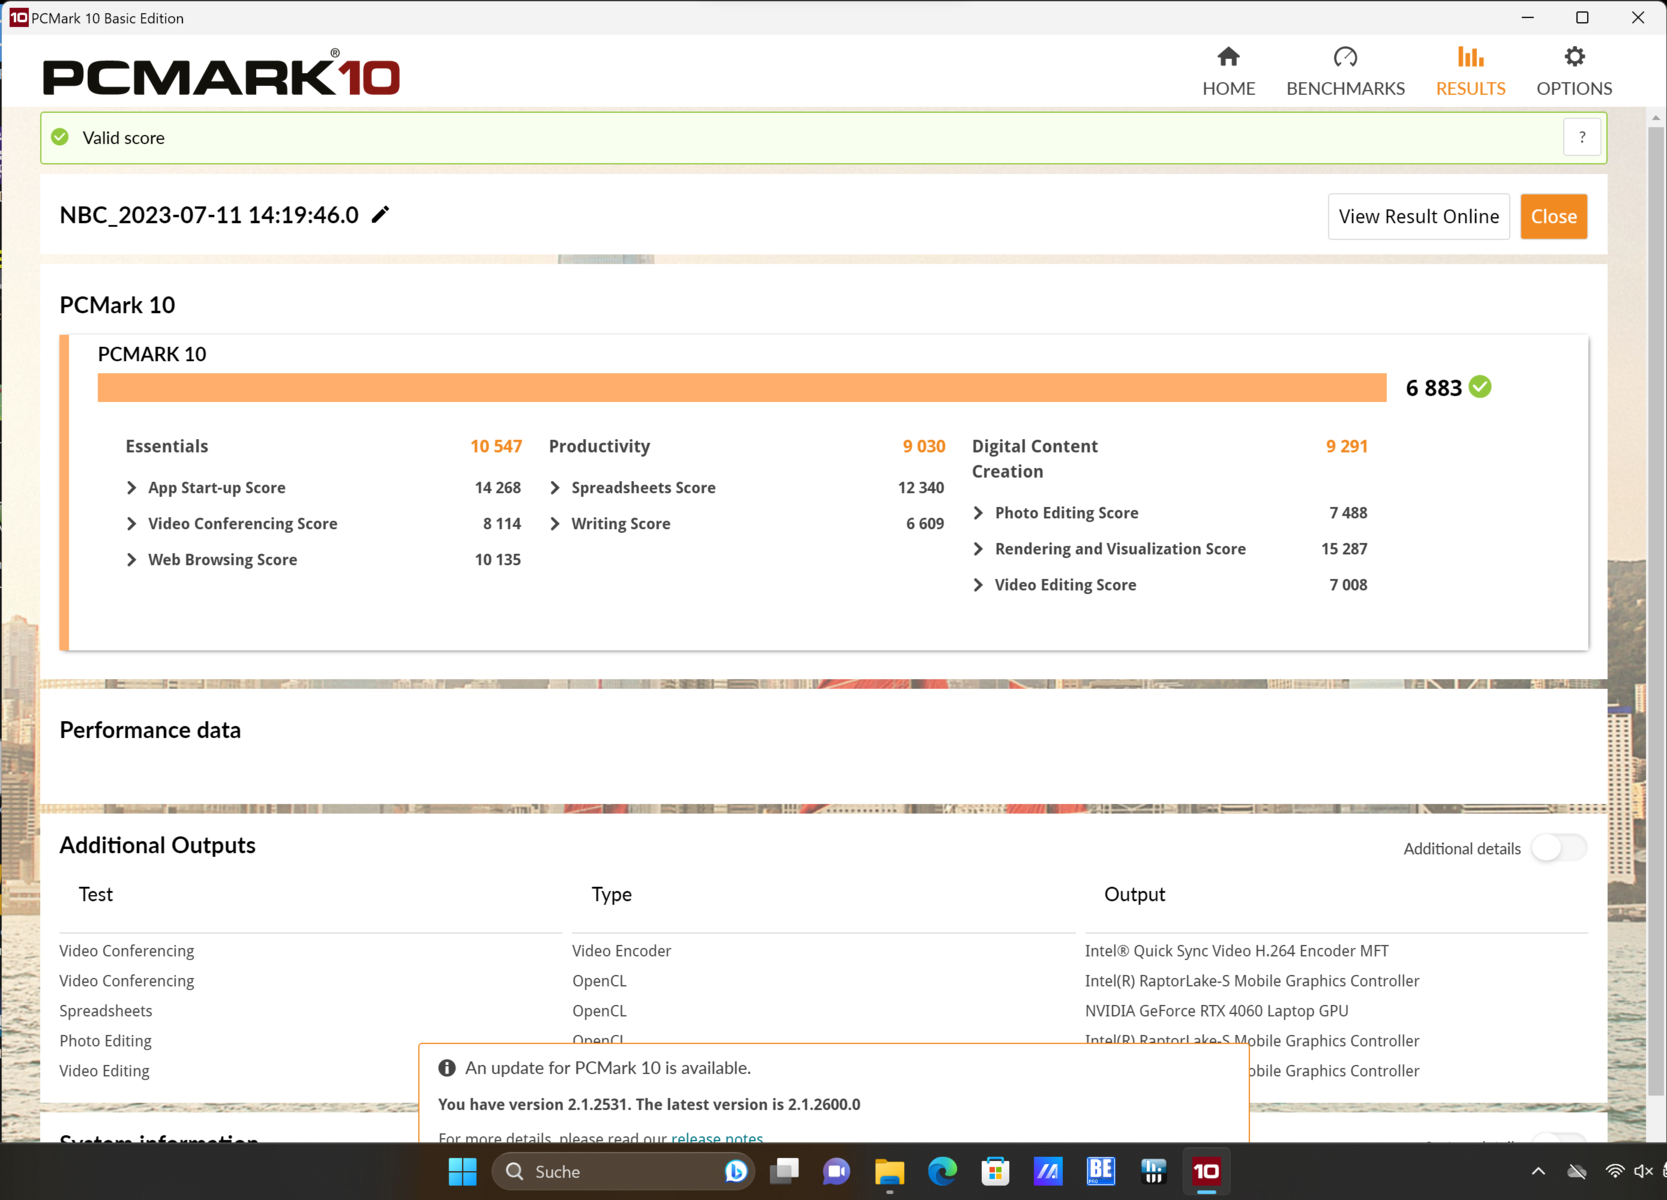

In contrast to the pure CPU tests, the rating with PCMark 10 is a little weaker. However, if Performance mode is selected here, there is only a small gap to the best models. In CrossMark, the Asus laptop is far ahead, even on standard settings.
Overall, the Vivobook Pro is consistently fast. Demanding applications do not completely exhaust it, so the notebook always remains usable. Installations, parallel program starts and the like do not pose an issue.
CrossMark: Overall | Productivity | Creativity | Responsiveness
| PCMark 10 / Score | |
| Average of class Multimedia (4325 - 10386, n=58, last 2 years) | |
| Asus ProArt Studiobook 16 OLED H7604 | |
| Schenker VISION 16 Pro (M23) | |
| Dell XPS 15 9530 RTX 4070 | |
| MSI Creator Z17 A12UGST-054 | |
| Asus Vivobook Pro 16X K6604JV-MX016W | |
| Average Intel Core i9-13980HX, NVIDIA GeForce RTX 4060 Laptop GPU (n=1) | |
| Samsung Galaxy Book3 Ultra 16 | |
| PCMark 10 / Essentials | |
| Dell XPS 15 9530 RTX 4070 | |
| Asus ProArt Studiobook 16 OLED H7604 | |
| Schenker VISION 16 Pro (M23) | |
| Asus Vivobook Pro 16X K6604JV-MX016W | |
| Average Intel Core i9-13980HX, NVIDIA GeForce RTX 4060 Laptop GPU (n=1) | |
| Samsung Galaxy Book3 Ultra 16 | |
| Average of class Multimedia (8025 - 11664, n=57, last 2 years) | |
| MSI Creator Z17 A12UGST-054 | |
| PCMark 10 / Productivity | |
| Average of class Multimedia (7323 - 18233, n=57, last 2 years) | |
| Asus ProArt Studiobook 16 OLED H7604 | |
| Schenker VISION 16 Pro (M23) | |
| MSI Creator Z17 A12UGST-054 | |
| Asus Vivobook Pro 16X K6604JV-MX016W | |
| Average Intel Core i9-13980HX, NVIDIA GeForce RTX 4060 Laptop GPU (n=1) | |
| Samsung Galaxy Book3 Ultra 16 | |
| Dell XPS 15 9530 RTX 4070 | |
| PCMark 10 / Digital Content Creation | |
| Schenker VISION 16 Pro (M23) | |
| Dell XPS 15 9530 RTX 4070 | |
| Asus ProArt Studiobook 16 OLED H7604 | |
| Average of class Multimedia (3651 - 16240, n=57, last 2 years) | |
| MSI Creator Z17 A12UGST-054 | |
| Samsung Galaxy Book3 Ultra 16 | |
| Asus Vivobook Pro 16X K6604JV-MX016W | |
| Average Intel Core i9-13980HX, NVIDIA GeForce RTX 4060 Laptop GPU (n=1) | |
| CrossMark / Overall | |
| Asus ProArt Studiobook 16 OLED H7604 | |
| Asus Vivobook Pro 16X K6604JV-MX016W | |
| Average Intel Core i9-13980HX, NVIDIA GeForce RTX 4060 Laptop GPU (n=1) | |
| MSI Creator Z17 A12UGST-054 | |
| Schenker VISION 16 Pro (M23) | |
| Dell XPS 15 9530 RTX 4070 | |
| Average of class Multimedia (866 - 2728, n=67, last 2 years) | |
| Samsung Galaxy Book3 Ultra 16 | |
| CrossMark / Productivity | |
| Asus ProArt Studiobook 16 OLED H7604 | |
| Asus Vivobook Pro 16X K6604JV-MX016W | |
| Average Intel Core i9-13980HX, NVIDIA GeForce RTX 4060 Laptop GPU (n=1) | |
| MSI Creator Z17 A12UGST-054 | |
| Schenker VISION 16 Pro (M23) | |
| Dell XPS 15 9530 RTX 4070 | |
| Average of class Multimedia (931 - 2489, n=67, last 2 years) | |
| Samsung Galaxy Book3 Ultra 16 | |
| CrossMark / Creativity | |
| Asus ProArt Studiobook 16 OLED H7604 | |
| Asus Vivobook Pro 16X K6604JV-MX016W | |
| Average Intel Core i9-13980HX, NVIDIA GeForce RTX 4060 Laptop GPU (n=1) | |
| MSI Creator Z17 A12UGST-054 | |
| Dell XPS 15 9530 RTX 4070 | |
| Average of class Multimedia (907 - 3465, n=67, last 2 years) | |
| Schenker VISION 16 Pro (M23) | |
| Samsung Galaxy Book3 Ultra 16 | |
| CrossMark / Responsiveness | |
| MSI Creator Z17 A12UGST-054 | |
| Asus ProArt Studiobook 16 OLED H7604 | |
| Schenker VISION 16 Pro (M23) | |
| Asus Vivobook Pro 16X K6604JV-MX016W | |
| Average Intel Core i9-13980HX, NVIDIA GeForce RTX 4060 Laptop GPU (n=1) | |
| Dell XPS 15 9530 RTX 4070 | |
| Average of class Multimedia (605 - 2024, n=67, last 2 years) | |
| Samsung Galaxy Book3 Ultra 16 | |
| PCMark 10 Score | 6883 points | |
Help | ||
| AIDA64 / Memory Copy | |
| Average of class Multimedia (21158 - 132135, n=61, last 2 years) | |
| Asus ProArt Studiobook 16 OLED H7604 | |
| Samsung Galaxy Book3 Ultra 16 | |
| Average Intel Core i9-13980HX (62189 - 80776, n=9) | |
| Asus Vivobook Pro 16X K6604JV-MX016W | |
| Dell XPS 15 9530 RTX 4070 | |
| Schenker VISION 16 Pro (M23) | |
| MSI Creator Z17 A12UGST-054 | |
| AIDA64 / Memory Read | |
| Average of class Multimedia (19699 - 174586, n=61, last 2 years) | |
| Asus ProArt Studiobook 16 OLED H7604 | |
| Average Intel Core i9-13980HX (62624 - 89096, n=9) | |
| Asus Vivobook Pro 16X K6604JV-MX016W | |
| Schenker VISION 16 Pro (M23) | |
| Dell XPS 15 9530 RTX 4070 | |
| Samsung Galaxy Book3 Ultra 16 | |
| MSI Creator Z17 A12UGST-054 | |
| AIDA64 / Memory Write | |
| Samsung Galaxy Book3 Ultra 16 | |
| Average of class Multimedia (17733 - 134998, n=61, last 2 years) | |
| Asus ProArt Studiobook 16 OLED H7604 | |
| Average Intel Core i9-13980HX (59912 - 79917, n=9) | |
| Asus Vivobook Pro 16X K6604JV-MX016W | |
| Dell XPS 15 9530 RTX 4070 | |
| Schenker VISION 16 Pro (M23) | |
| MSI Creator Z17 A12UGST-054 | |
| AIDA64 / Memory Latency | |
| Average of class Multimedia (7 - 535, n=60, last 2 years) | |
| Samsung Galaxy Book3 Ultra 16 | |
| MSI Creator Z17 A12UGST-054 | |
| Asus Vivobook Pro 16X K6604JV-MX016W | |
| Average Intel Core i9-13980HX (79.4 - 93.2, n=9) | |
| Dell XPS 15 9530 RTX 4070 | |
| Asus ProArt Studiobook 16 OLED H7604 | |
| Schenker VISION 16 Pro (M23) | |
* ... smaller is better
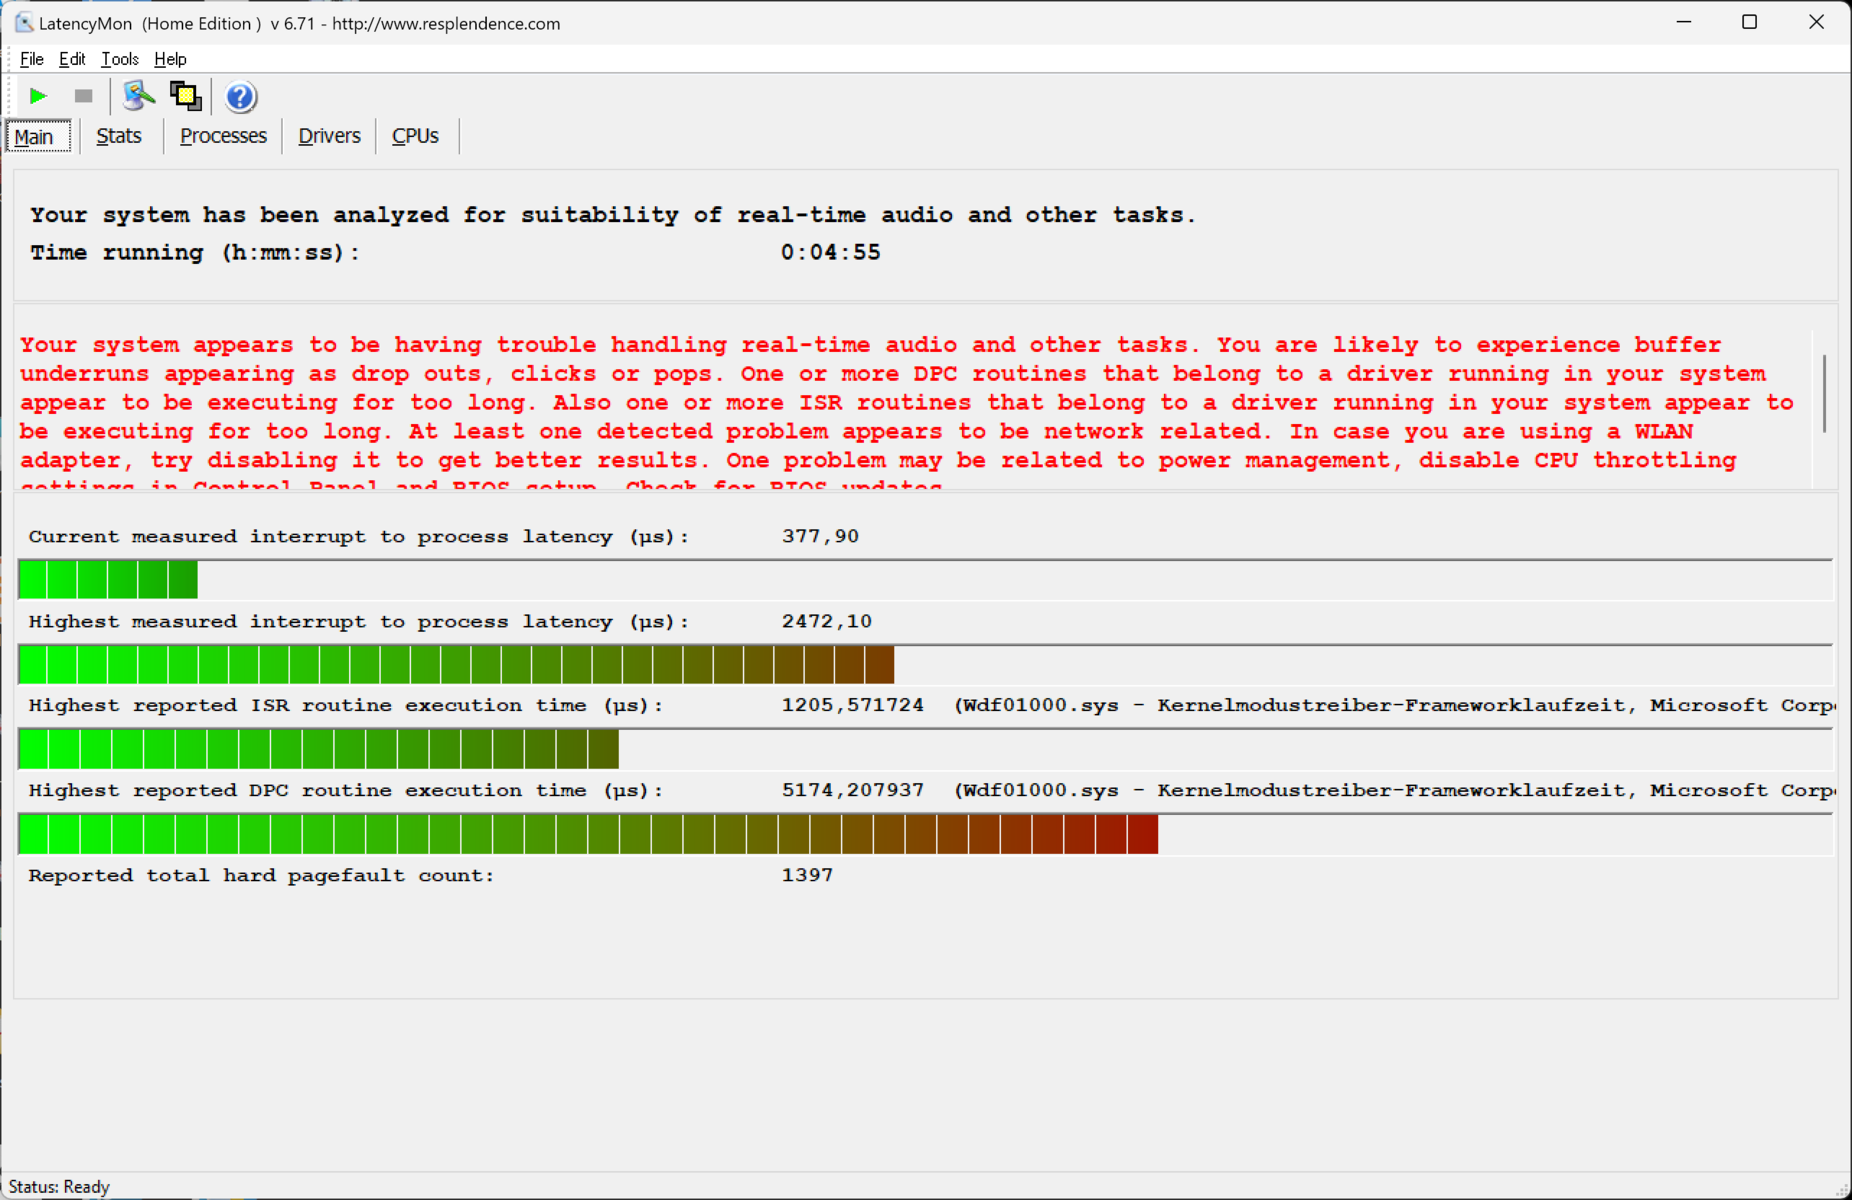
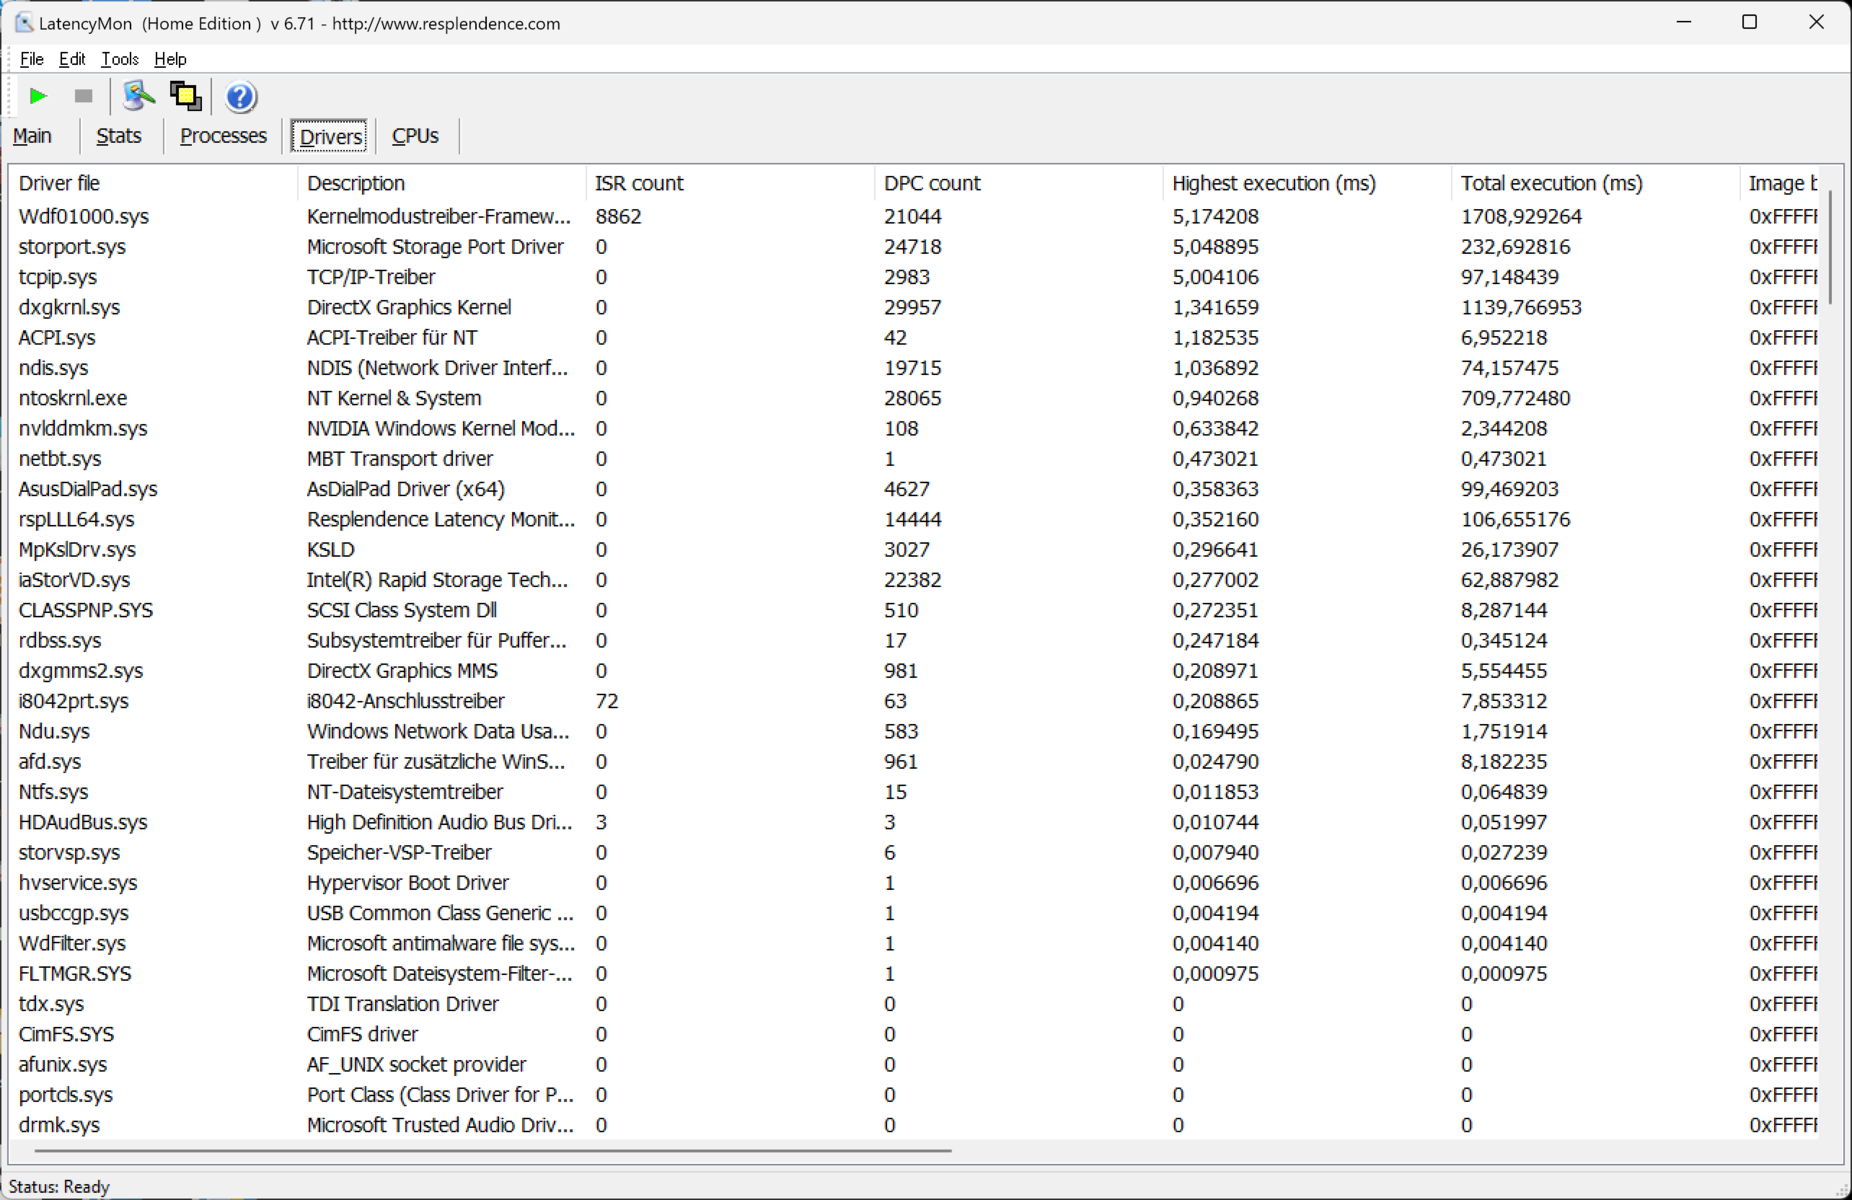
DPC Latency
Real-time audio editing does not count among the strengths of the Asus VivoBook Pro 16X. In the current configuration, the kernel mode driver and Nvidia's Studio driver, among others, cause too high latencies. However, this can be quite different with modified drivers and other software.
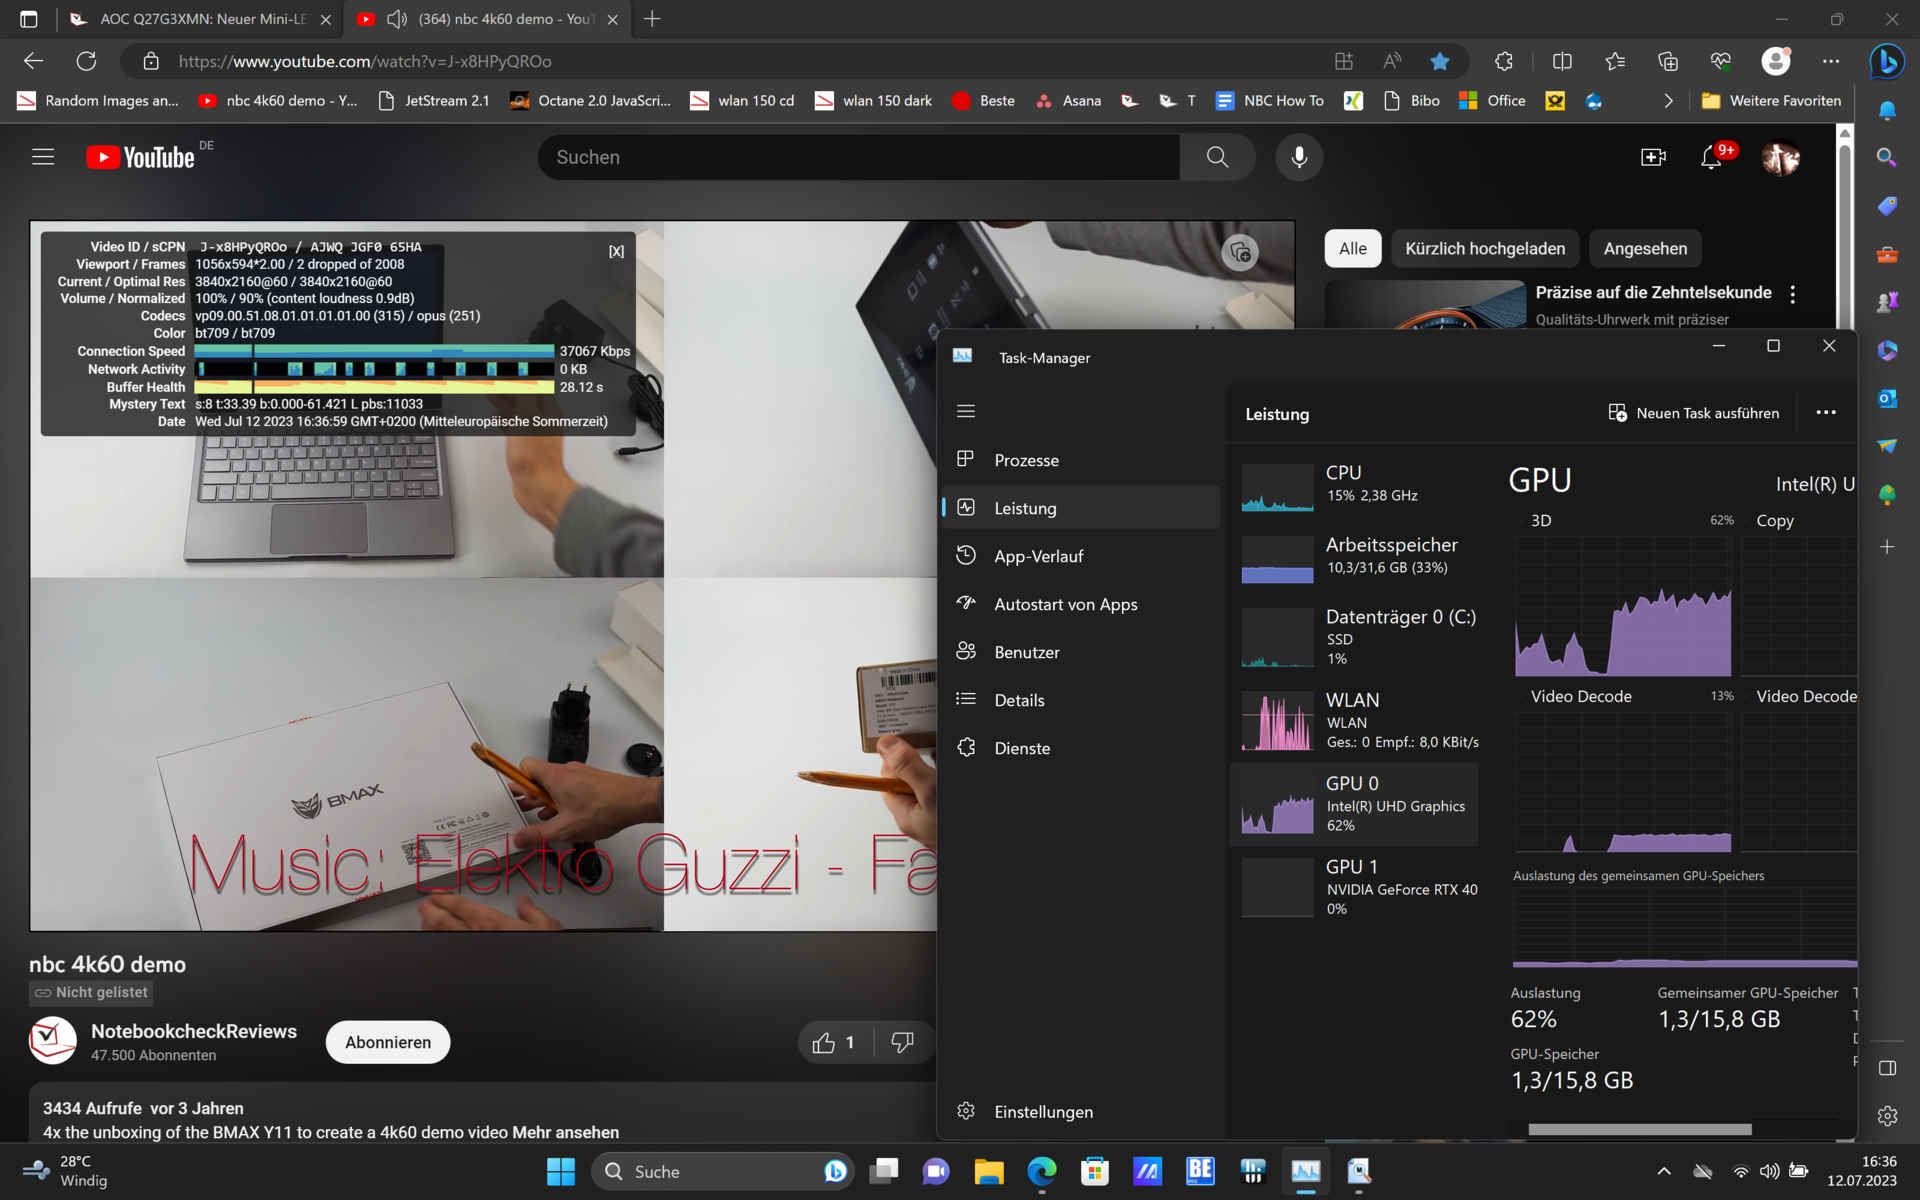
Only 3 dropped frames were registered during 4K video streaming; a multimedia notebook should not drop any frames at all.
| DPC Latencies / LatencyMon - interrupt to process latency (max), Web, Youtube, Prime95 | |
| Samsung Galaxy Book3 Ultra 16 | |
| Asus Vivobook Pro 16X K6604JV-MX016W | |
| Asus ProArt Studiobook 16 OLED H7604 | |
| MSI Creator Z17 A12UGST-054 | |
| Dell XPS 15 9530 RTX 4070 | |
| Schenker VISION 16 Pro (M23) | |
* ... smaller is better
Storage Devices
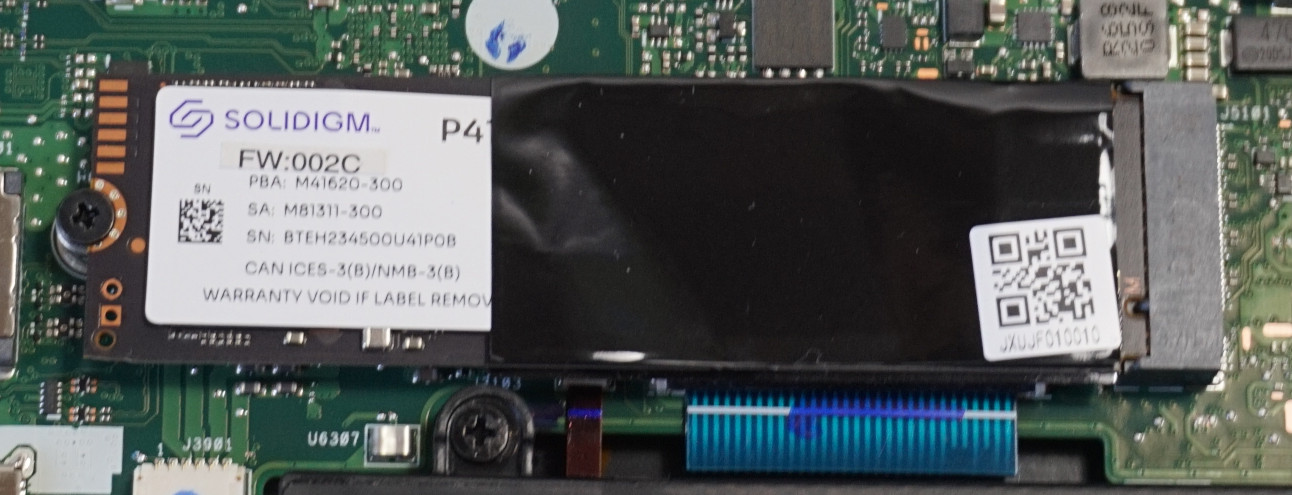
For a PCIe 4.0 SSD, the values we recorded are consistently weak, although the manufacturer specifies a maximum transfer rate of just over 4000 MB/s, which is barely two-thirds of the theoretical maximum. We also measured below-average values in other read- and write tests.
During intensive read- and write processes that occur when editing raw data, this behavior may have a negative impact on system performance. On the other hand, no negative effects should be seen in all other tasks.
The Samsung Galaxy Book3 Ultra or the Schenker Vision 16 Pro are clearly in front here. But at least the SSD can be replaced with little effort.

* ... smaller is better
Sustained Read Performance: DiskSpd Read Loop, Queue Depth 8
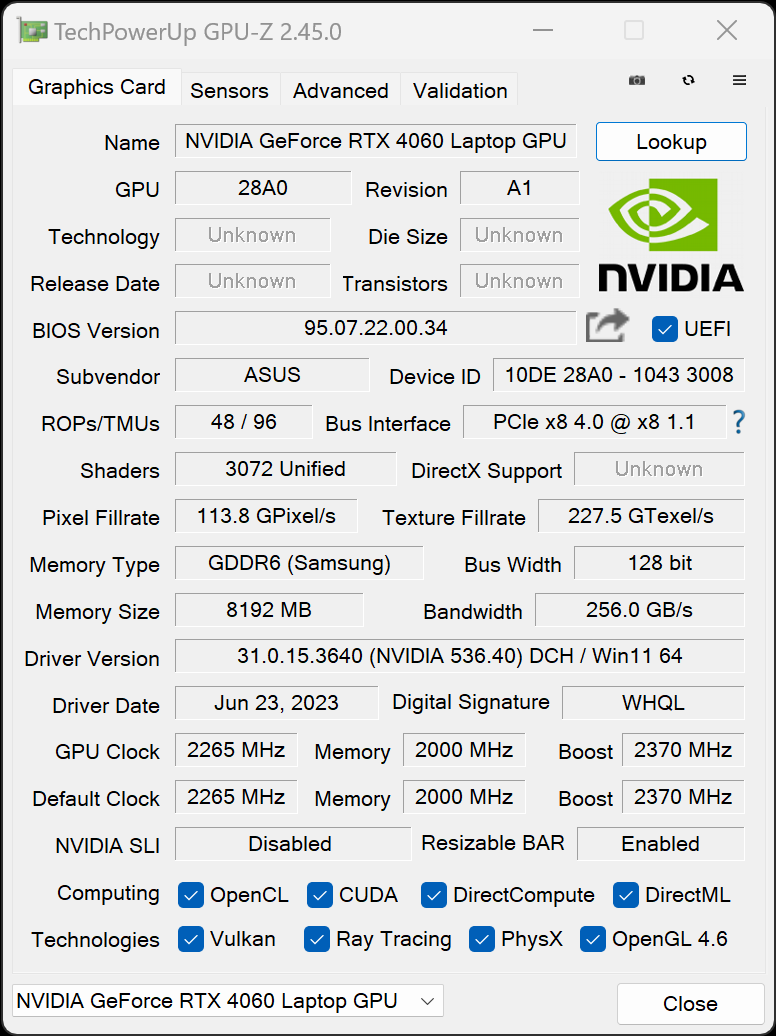
Graphics Card
In addition to the integrated Intel UHD Graphics chip, the Nvidia GeForce RTX 4060 is installed. In theory, both have a maximum possible output of 140 W at their disposal, which the manufacturer indeed allows.
However, only 115 W is reached, even in demanding tasks, which corresponds to the maximum load without dynamic boost from the CPU. Only in the stress test did we observe outputs of over 130 W for short periods of time.
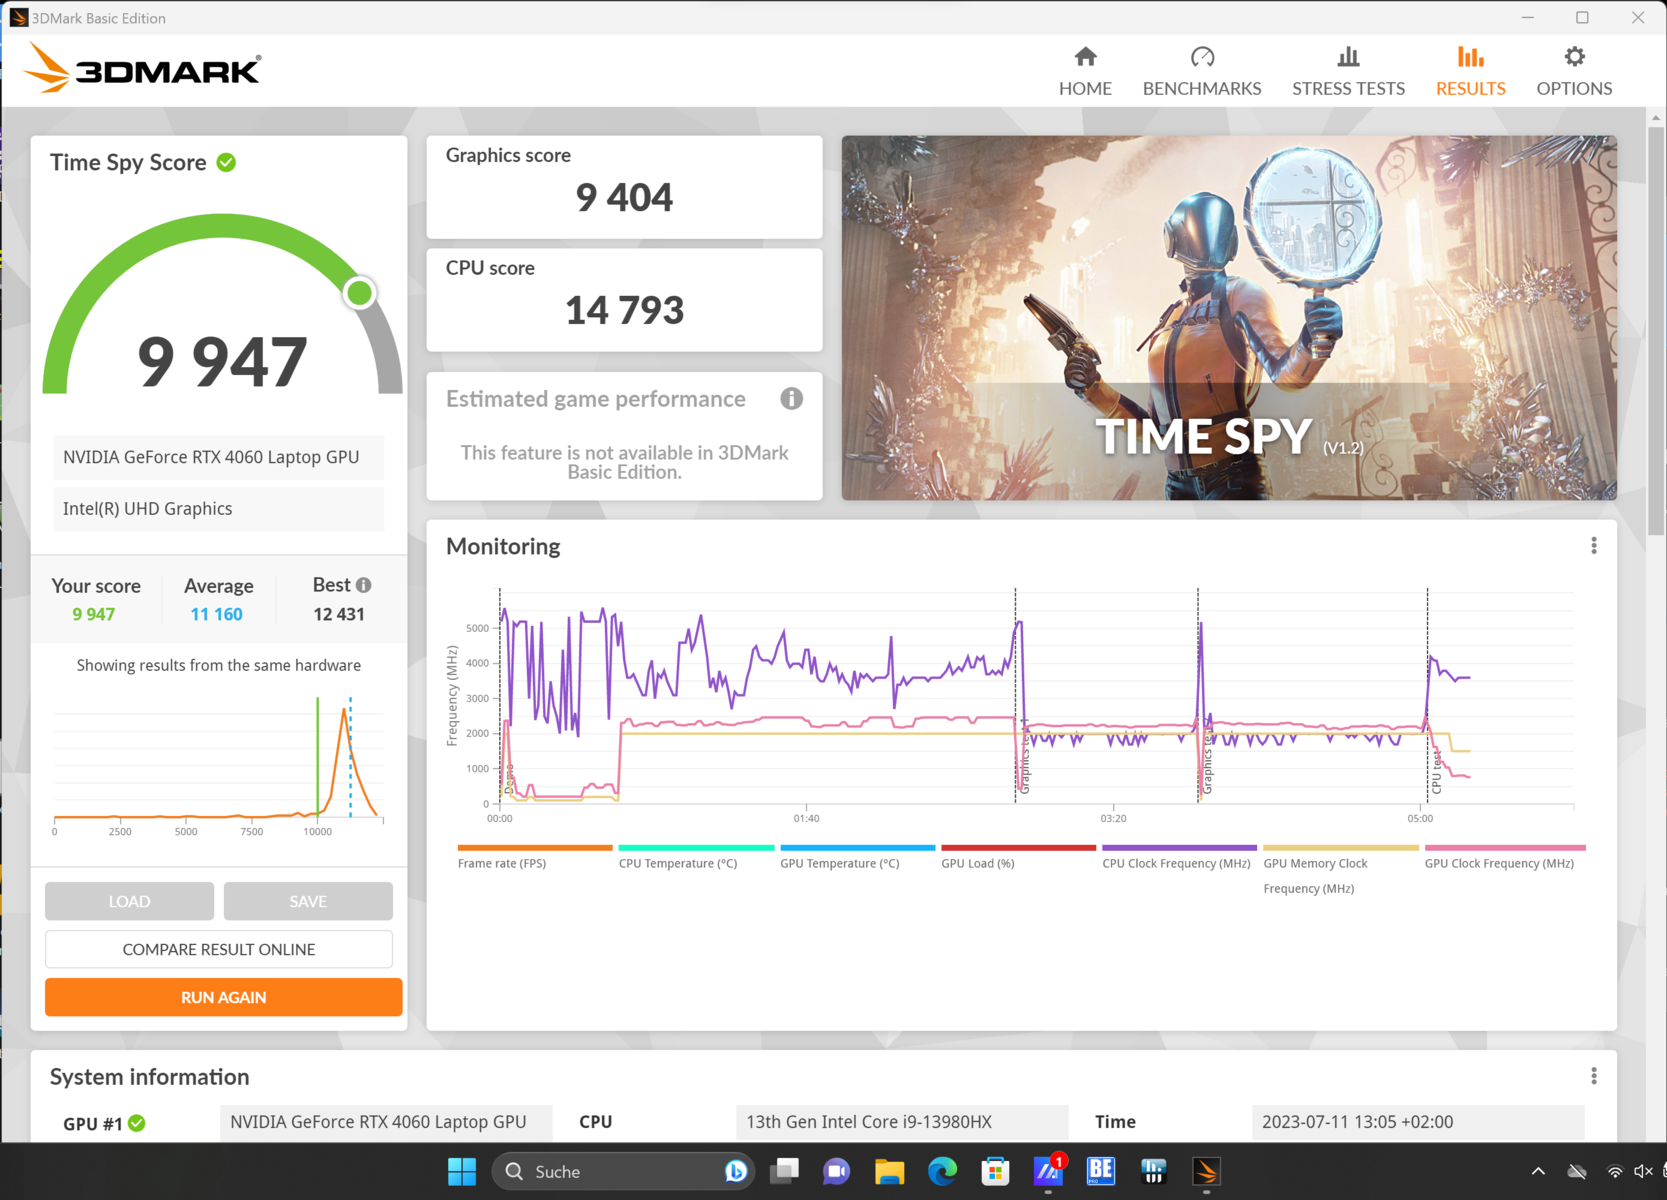
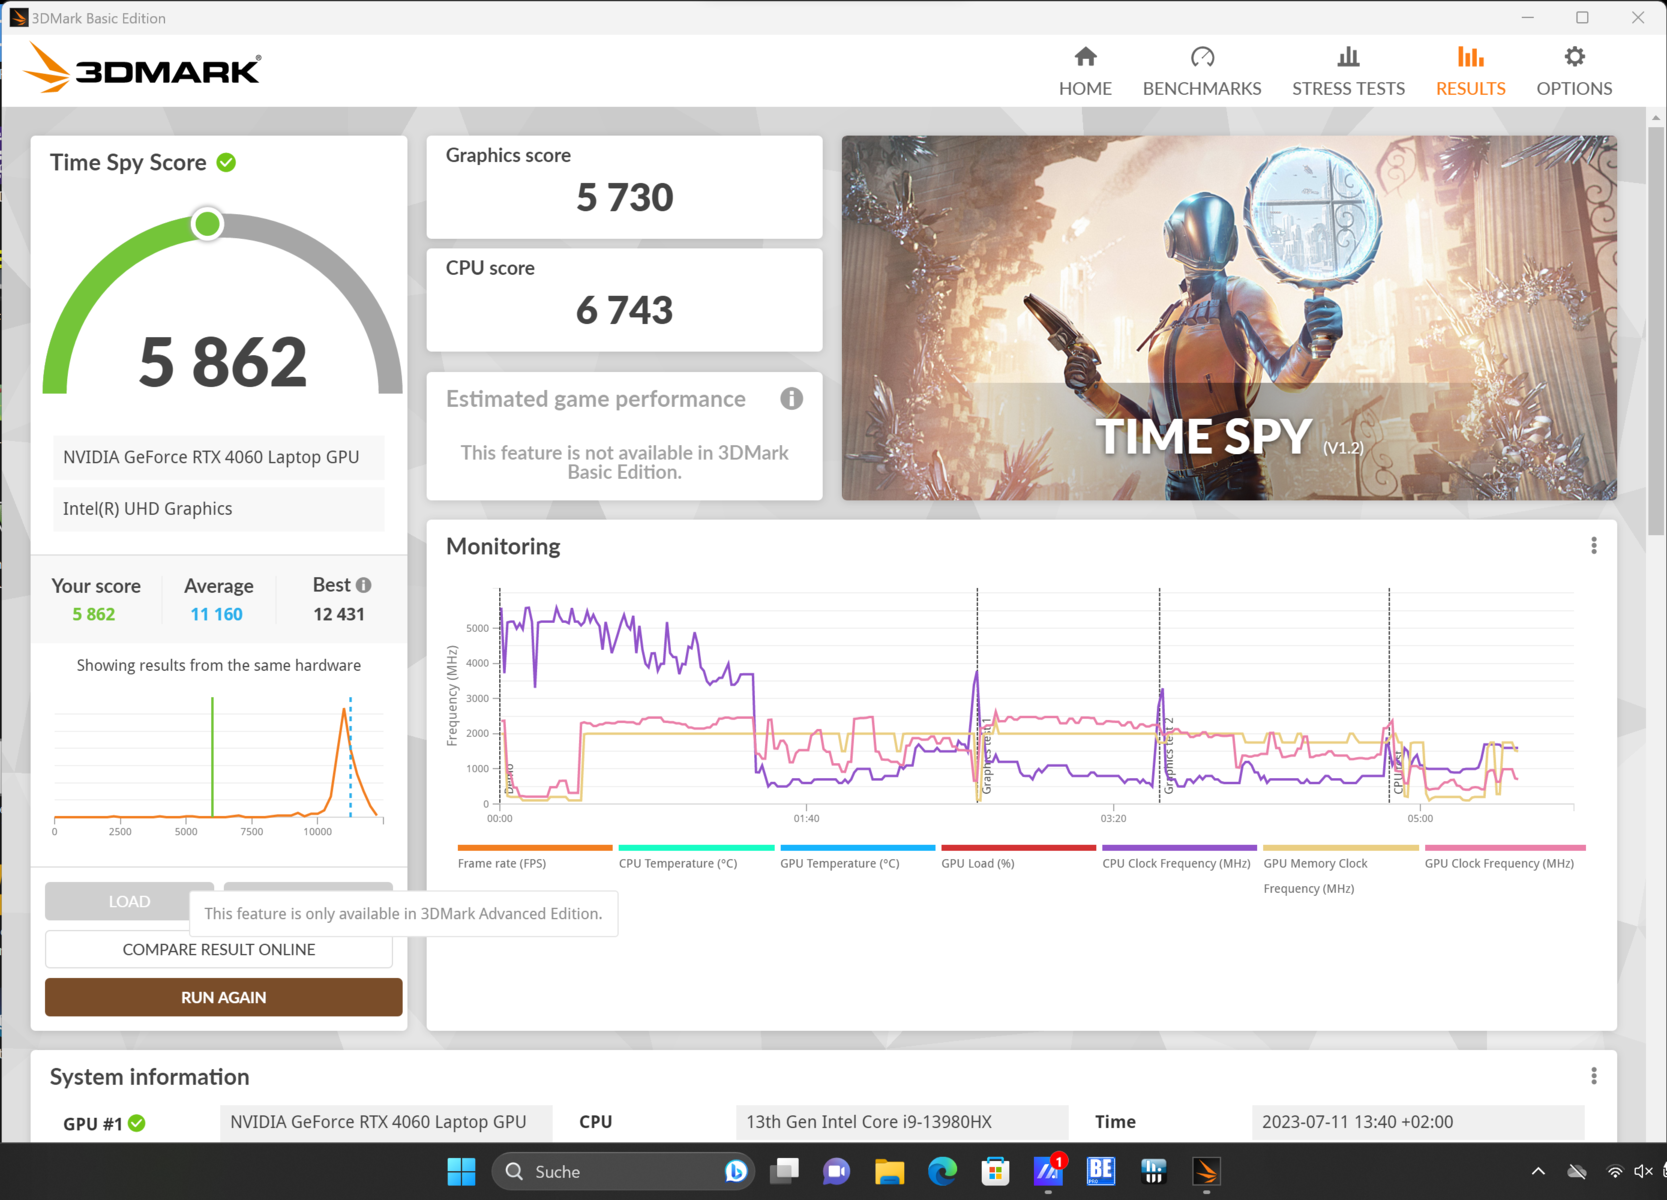
However, this hardly plays a role in the performance evaluation. Both 3DMark Time Spy as well as the rates of HWiNFO show that graphics performance doesn't really increase any further. In Standard mode, in which only a total of 90 W is allowed, the GPU clock is almost as high as when maximum power is allowed. In the article linked here, we reveal in detail why maximum load hardly benefits the small RTX 4050 and RTX 4060.
Compared to other multimedia laptops, the performance is roughly in line with the expectations of the installed GPU. The Samsung Galaxy Book3 Ultra with its RTX 4050 performs significantly worse. However, an MSI Creator Z17 with the RTX 3070 Ti is also slightly worse in the 3DMark scores. In Blender, only the Creator notebooks with the more powerful RTX 4070 perform better.
Full graphics performance can be nearly fully utilized in Standard mode. In Silent mode, the power supply gradually drops to just over 20 W. The limited cooling options result in a noticeable drop in performance.
At least this does not increase in battery mode. Among other things, Witcher 3 remains playable on the highest settings, which is why all other graphically demanding tasks should also be executable.
More benchmarks and information can be found in our GPU benchmark list.


| 3DMark 11 Performance | 25913 points | |
| 3DMark Cloud Gate Standard Score | 42137 points | |
| 3DMark Fire Strike Score | 20396 points | |
| 3DMark Time Spy Score | 9947 points | |
Help | ||
* ... smaller is better
Gaming Performance
Since the graphics chip, as already mentioned above, does not have to be fully utilized for best performance, the VivoBook Pro 16X also performs solidly when gaming, despite the slim case and limited power supply. In the presence of moderate fan noise, it can roughly keep up with the Acer Predator Helios 16 gaming notebook and its identical GPU.
Hence, playing current and demanding titles is possible without issue. If the resolution is set at Full HD, the new F1 23 can be played smoothly at the highest level of detail.
| The Witcher 3 - 1920x1080 Ultra Graphics & Postprocessing (HBAO+) | |
| Asus ProArt Studiobook 16 OLED H7604 | |
| Schenker VISION 16 Pro (M23) | |
| Acer Predator Helios 16 PH16-71-731Q | |
| Asus Vivobook Pro 16X K6604JV-MX016W | |
| MSI Creator Z17 A12UGST-054 | |
| Dell XPS 15 9530 RTX 4070 | |
| Samsung Galaxy Book3 Ultra 16 | |
| Average of class Multimedia (11 - 121, n=13, last 2 years) | |
| Star Wars Jedi Survivor | |
| 1920x1080 High Preset | |
| Schenker VISION 16 Pro (M23) | |
| Average NVIDIA GeForce RTX 4060 Laptop GPU (50.1 - 77.6, n=8) | |
| Asus Vivobook Pro 16X K6604JV-MX016W | |
| 1920x1080 Epic Preset | |
| Schenker VISION 16 Pro (M23) | |
| Average NVIDIA GeForce RTX 4060 Laptop GPU (45.5 - 66.7, n=10) | |
| Asus Vivobook Pro 16X K6604JV-MX016W | |
The Asus VivoBook Pro is unable to maintain the framerate in the Witcher 3 endurance test. Even though the typical day-night fluctuations can be seen in the curve, the rates drop by a little more than 5% overall. Assuming that a multimedia notebook rarely has to call up maximum performance for long periods of time, this does not seem to be a problem. Especially since just over 90 FPS is still an excellent value.
Witcher 3 FPS chart
| low | med. | high | ultra | QHD | |
|---|---|---|---|---|---|
| GTA V (2015) | 168.3 | 105.4 | 82 | ||
| The Witcher 3 (2015) | 180 | 98 | |||
| Dota 2 Reborn (2015) | 181.4 | 165.2 | |||
| Final Fantasy XV Benchmark (2018) | 84.4 | 65.2 | |||
| X-Plane 11.11 (2018) | 108.8 | ||||
| Far Cry 5 (2018) | 129 | 123 | 94 | ||
| Strange Brigade (2018) | 199.3 | 165.4 | 120.5 | ||
| Call of Duty Modern Warfare 2 2022 (2022) | 88 | 61 | |||
| Star Wars Jedi Survivor (2023) | 59 | 55 | 36 | ||
| F1 23 (2023) | 168.1 | 51.7 | 32.2 | ||
| Cyberpunk 2077 (2023) | 72.33 | 42.41 |
Emissions - Lots of cooling for the Creator notebook
Noise
The very high volume that we measured under maximum load is hardly reachable in practical use. In Standard mode, almost everything in the office should drown out the VivoBook, since the fans are then only a quarter as loud. The notebook is basically inaudible when the fans are quiet. We then measured one seventh of the maximum possible volume.
Quiet work is thus very much possible with the Asus VivoBook, even if you can hear the fans when listening closely. That this is not a given is shown, for example, by the MSI Creator Z17, where even Silent mode can be annoying in quiet environments.
Noise level
| Idle |
| 26.6 / 26.6 / 29.2 dB(A) |
| Load |
| 53.4 / 56.9 dB(A) |
 | ||
30 dB silent 40 dB(A) audible 50 dB(A) loud |
||
min: | ||
| Asus Vivobook Pro 16X K6604JV-MX016W GeForce RTX 4060 Laptop GPU, i9-13980HX, Solidigm P41 Plus SSDPFKNU010TZ | Dell XPS 15 9530 RTX 4070 GeForce RTX 4070 Laptop GPU, i7-13700H, SK hynix PC801 HFS001TEJ9X101N | Samsung Galaxy Book3 Ultra 16 GeForce RTX 4050 Laptop GPU, i7-13700H, Samsung PM9A1 MZVL2512HCJQ | Asus ProArt Studiobook 16 OLED H7604 GeForce RTX 4070 Laptop GPU, i9-13980HX, Phison EM2804TBMTCB47 | Schenker VISION 16 Pro (M23) GeForce RTX 4070 Laptop GPU, i7-13700H, Samsung 990 Pro 1 TB | MSI Creator Z17 A12UGST-054 GeForce RTX 3070 Ti Laptop GPU, i9-12900H, Micron 3400 1TB MTFDKBA1T0TFH | |
|---|---|---|---|---|---|---|
| Noise | 20% | 10% | 8% | 2% | -8% | |
| off / environment * (dB) | 25.2 | 23.1 8% | 25 1% | 24.5 3% | 25.9 -3% | 26 -3% |
| Idle Minimum * (dB) | 26.6 | 23.1 13% | 26 2% | 24.5 8% | 25.9 3% | 31.8 -20% |
| Idle Average * (dB) | 26.6 | 23.1 13% | 27 -2% | 24.5 8% | 25.9 3% | 31.8 -20% |
| Idle Maximum * (dB) | 29.2 | 24.2 17% | 28 4% | 24.5 16% | 32 -10% | 31.8 -9% |
| Load Average * (dB) | 53.4 | 27.1 49% | 40 25% | 47.6 11% | 47.2 12% | 53.9 -1% |
| Load Maximum * (dB) | 56.9 | 44.6 22% | 41 28% | 56.7 -0% | 53.1 7% | 54.9 4% |
| Witcher 3 ultra * (dB) | 40.1 | 39 | 55.9 | 53.1 | 53.9 |
* ... smaller is better
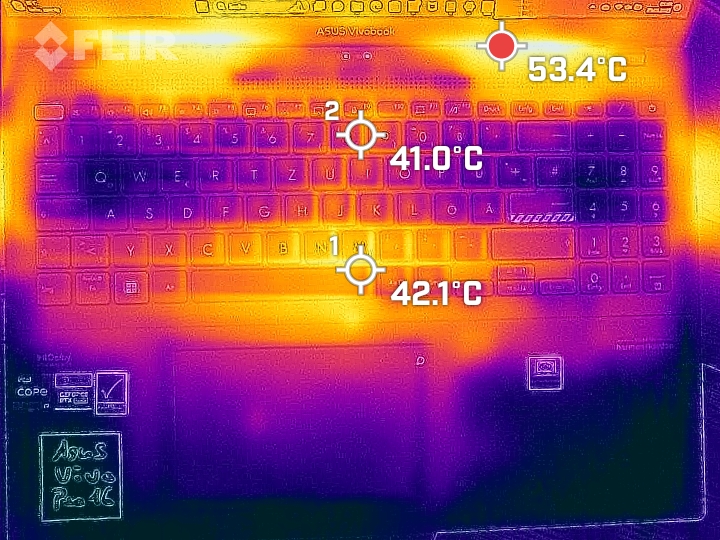
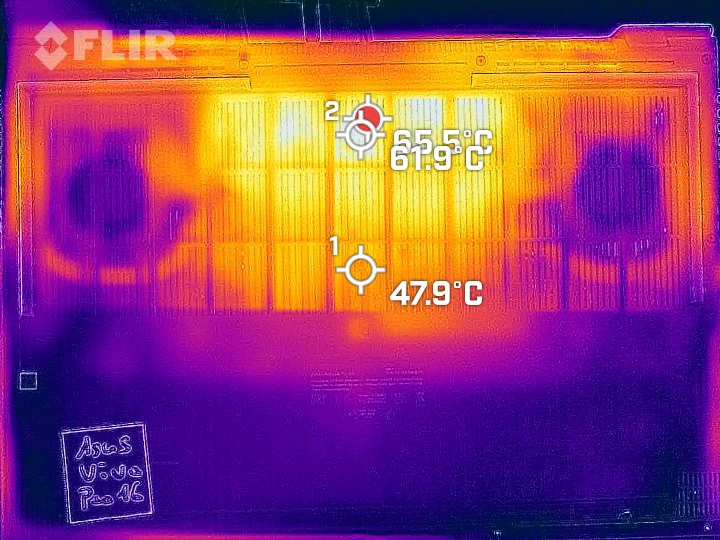
Temperature
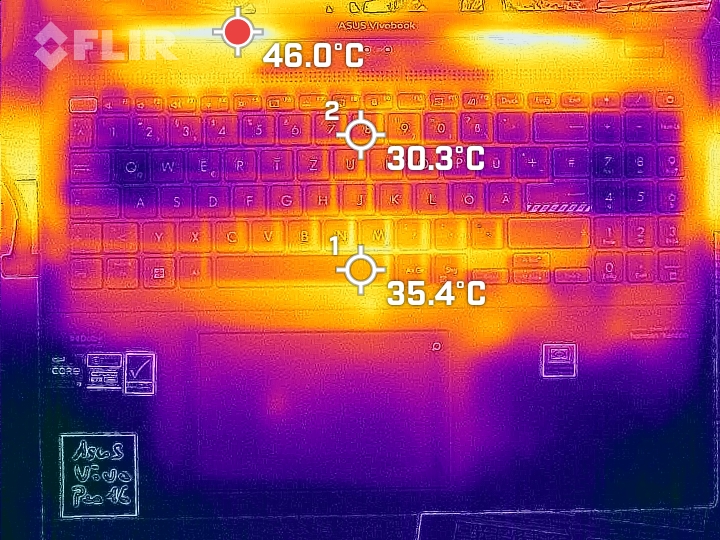
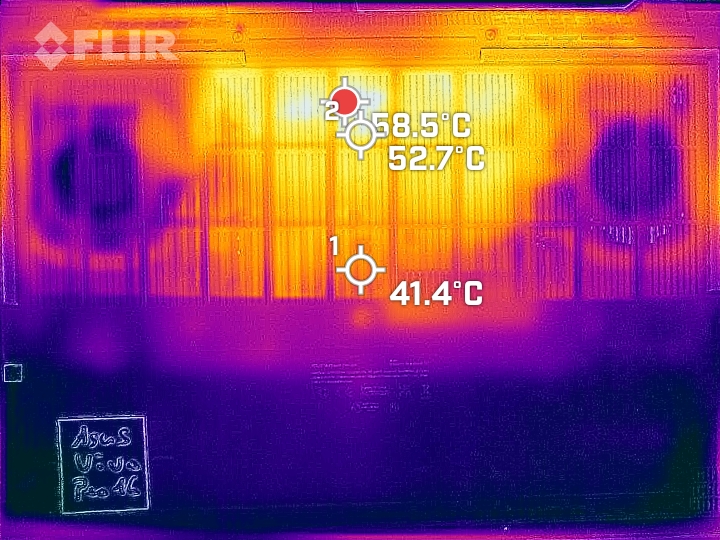
The touchpad heats up to 34 °C in the stress test. We also measure 60 °C on the underside. The comparatively thin case definitely gets too warm in what is an exceptional scenario.
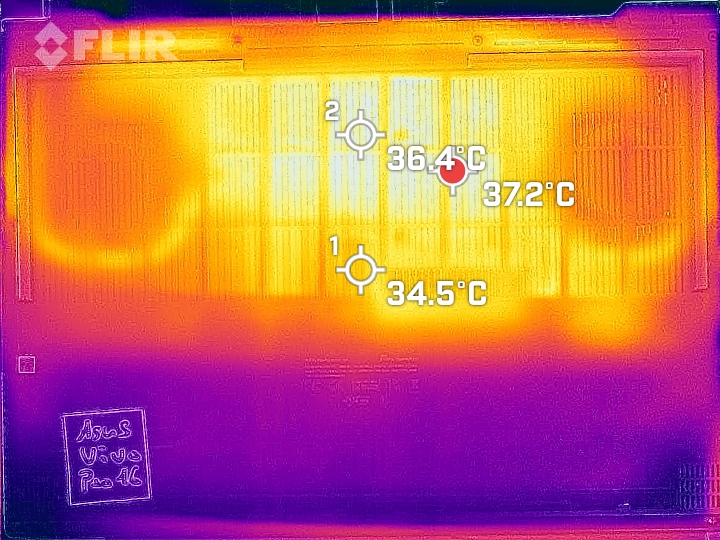
The Witcher 3 endurance test simulates a somewhat more realistic load. The palm rest stays below 30 °C and the bottom reaches a maximum of 47 °C. Although the VivoBook should always be placed on a firm surface, it doesn't get too hot to work with, even when demands on the hardware are high.
(+) The maximum temperature on the upper side is 39.7 °C / 103 F, compared to the average of 36.8 °C / 98 F, ranging from 21 to 71 °C for the class Multimedia.
(-) The bottom heats up to a maximum of 60 °C / 140 F, compared to the average of 39.1 °C / 102 F
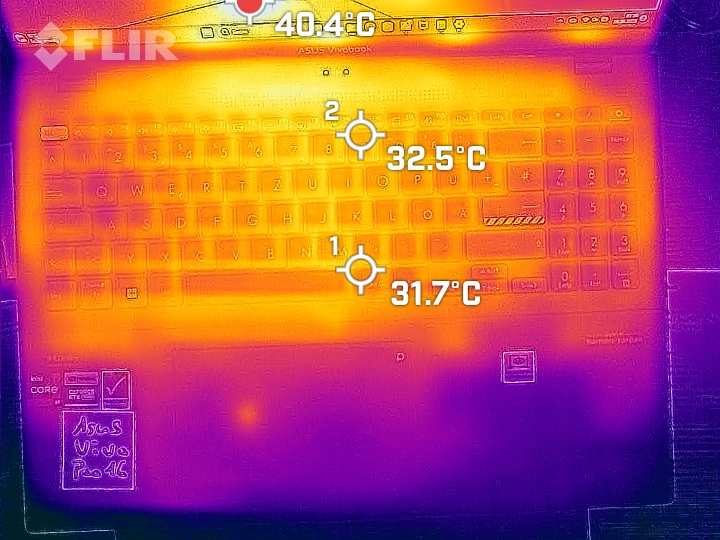
(+) In idle usage, the average temperature for the upper side is 28.2 °C / 83 F, compared to the device average of 31.3 °C / 88 F.
(+) Playing The Witcher 3, the average temperature for the upper side is 30.8 °C / 87 F, compared to the device average of 31.3 °C / 88 F.
(+) The palmrests and touchpad are reaching skin temperature as a maximum (33.8 °C / 92.8 F) and are therefore not hot.
(-) The average temperature of the palmrest area of similar devices was 28.7 °C / 83.7 F (-5.1 °C / -9.1 F).
| Asus Vivobook Pro 16X K6604JV-MX016W Intel Core i9-13980HX, NVIDIA GeForce RTX 4060 Laptop GPU | Dell XPS 15 9530 RTX 4070 Intel Core i7-13700H, NVIDIA GeForce RTX 4070 Laptop GPU | Samsung Galaxy Book3 Ultra 16 Intel Core i7-13700H, NVIDIA GeForce RTX 4050 Laptop GPU | Asus ProArt Studiobook 16 OLED H7604 Intel Core i9-13980HX, NVIDIA GeForce RTX 4070 Laptop GPU | Schenker VISION 16 Pro (M23) Intel Core i7-13700H, NVIDIA GeForce RTX 4070 Laptop GPU | MSI Creator Z17 A12UGST-054 Intel Core i9-12900H, NVIDIA GeForce RTX 3070 Ti Laptop GPU | |
|---|---|---|---|---|---|---|
| Heat | 2% | 19% | 1% | 7% | -13% | |
| Maximum Upper Side * (°C) | 39.7 | 45.6 -15% | 41 -3% | 44.1 -11% | 46.7 -18% | 63.9 -61% |
| Maximum Bottom * (°C) | 60 | 42 30% | 44 27% | 48 20% | 54.1 10% | 68 -13% |
| Idle Upper Side * (°C) | 30.9 | 34.4 -11% | 23 26% | 32.7 -6% | 26.5 14% | 28.3 8% |
| Idle Bottom * (°C) | 34.7 | 33.2 4% | 26 25% | 34.9 -1% | 26.8 23% | 30.2 13% |
* ... smaller is better
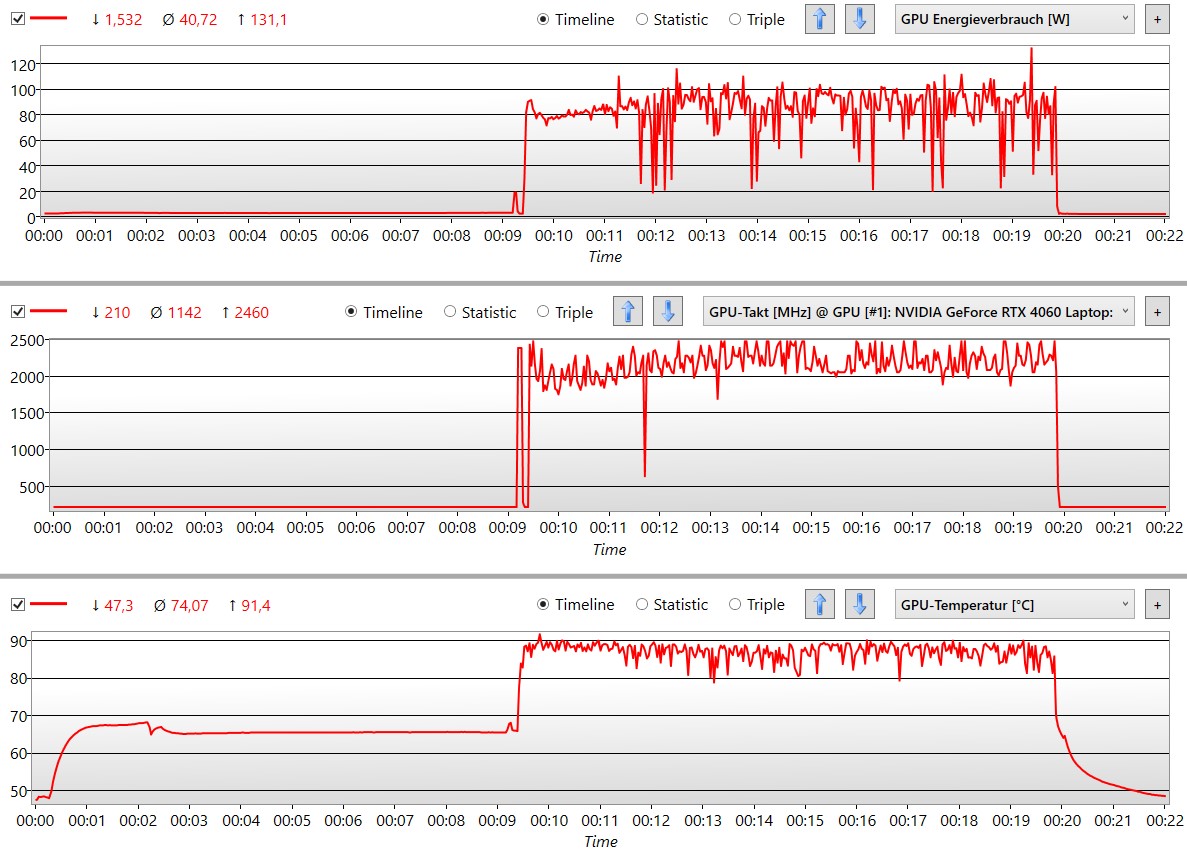
Stress Test
At maximum fan power and maximum load, the CPU's temperature rises to almost 100 °C, and the GPU gets hotter than 90 °C. So the processor in particular has to be throttled very quickly. Its clock rate remains stable at 2.0 GHz after about 2 minutes.
If the GPU is also required, the maximum power supply for the processor drops from just over 100 W to 50 W. At the same time, the graphics chip can continue to work at its maximum clock rate, but occasionally has to throttle from 2.4 to 2.0 GHz.

Speakers

The speakers are incapable of bass and lower mids, which is hardly surprising for a notebook. On the other hand, the mids and trebles, which are important for voice reproduction, are solid.
Thus, music that is not too bass-heavy sounds good. Playback precision could be a little better, since you can hear that certain elements are missing in music above MP3 quality. But this is criticism on the level of hairsplitting.
Asus Vivobook Pro 16X K6604JV-MX016W audio analysis
(+) | speakers can play relatively loud (87.4 dB)
Bass 100 - 315 Hz
(±) | reduced bass - on average 14% lower than median
(±) | linearity of bass is average (12.4% delta to prev. frequency)
Mids 400 - 2000 Hz
(+) | balanced mids - only 1.2% away from median
(+) | mids are linear (3.7% delta to prev. frequency)
Highs 2 - 16 kHz
(±) | higher highs - on average 7.1% higher than median
(+) | highs are linear (4.8% delta to prev. frequency)
Overall 100 - 16.000 Hz
(+) | overall sound is linear (12.7% difference to median)
Compared to same class
» 24% of all tested devices in this class were better, 5% similar, 71% worse
» The best had a delta of 5%, average was 17%, worst was 45%
Compared to all devices tested
» 12% of all tested devices were better, 3% similar, 86% worse
» The best had a delta of 4%, average was 24%, worst was 134%
Apple MacBook Pro 16 2021 M1 Pro audio analysis
(+) | speakers can play relatively loud (84.7 dB)
Bass 100 - 315 Hz
(+) | good bass - only 3.8% away from median
(+) | bass is linear (5.2% delta to prev. frequency)
Mids 400 - 2000 Hz
(+) | balanced mids - only 1.3% away from median
(+) | mids are linear (2.1% delta to prev. frequency)
Highs 2 - 16 kHz
(+) | balanced highs - only 1.9% away from median
(+) | highs are linear (2.7% delta to prev. frequency)
Overall 100 - 16.000 Hz
(+) | overall sound is linear (4.6% difference to median)
Compared to same class
» 0% of all tested devices in this class were better, 0% similar, 100% worse
» The best had a delta of 5%, average was 17%, worst was 45%
Compared to all devices tested
» 0% of all tested devices were better, 0% similar, 100% worse
» The best had a delta of 4%, average was 24%, worst was 134%
Power Management - Hungry i9 in the Vivobook
Power Consumption
Above all, the extremely powerful i9-13980HX drives up power consumption without load. We measured an average of 16 W. For comparison, the Samsung Galaxy Book3 Ultra, whose i7-13700H processor is not much worse and whose display is also a 16-inch OLED, consumes 5 W. Consequently, the VivoBook is not really efficient in simple tasks.
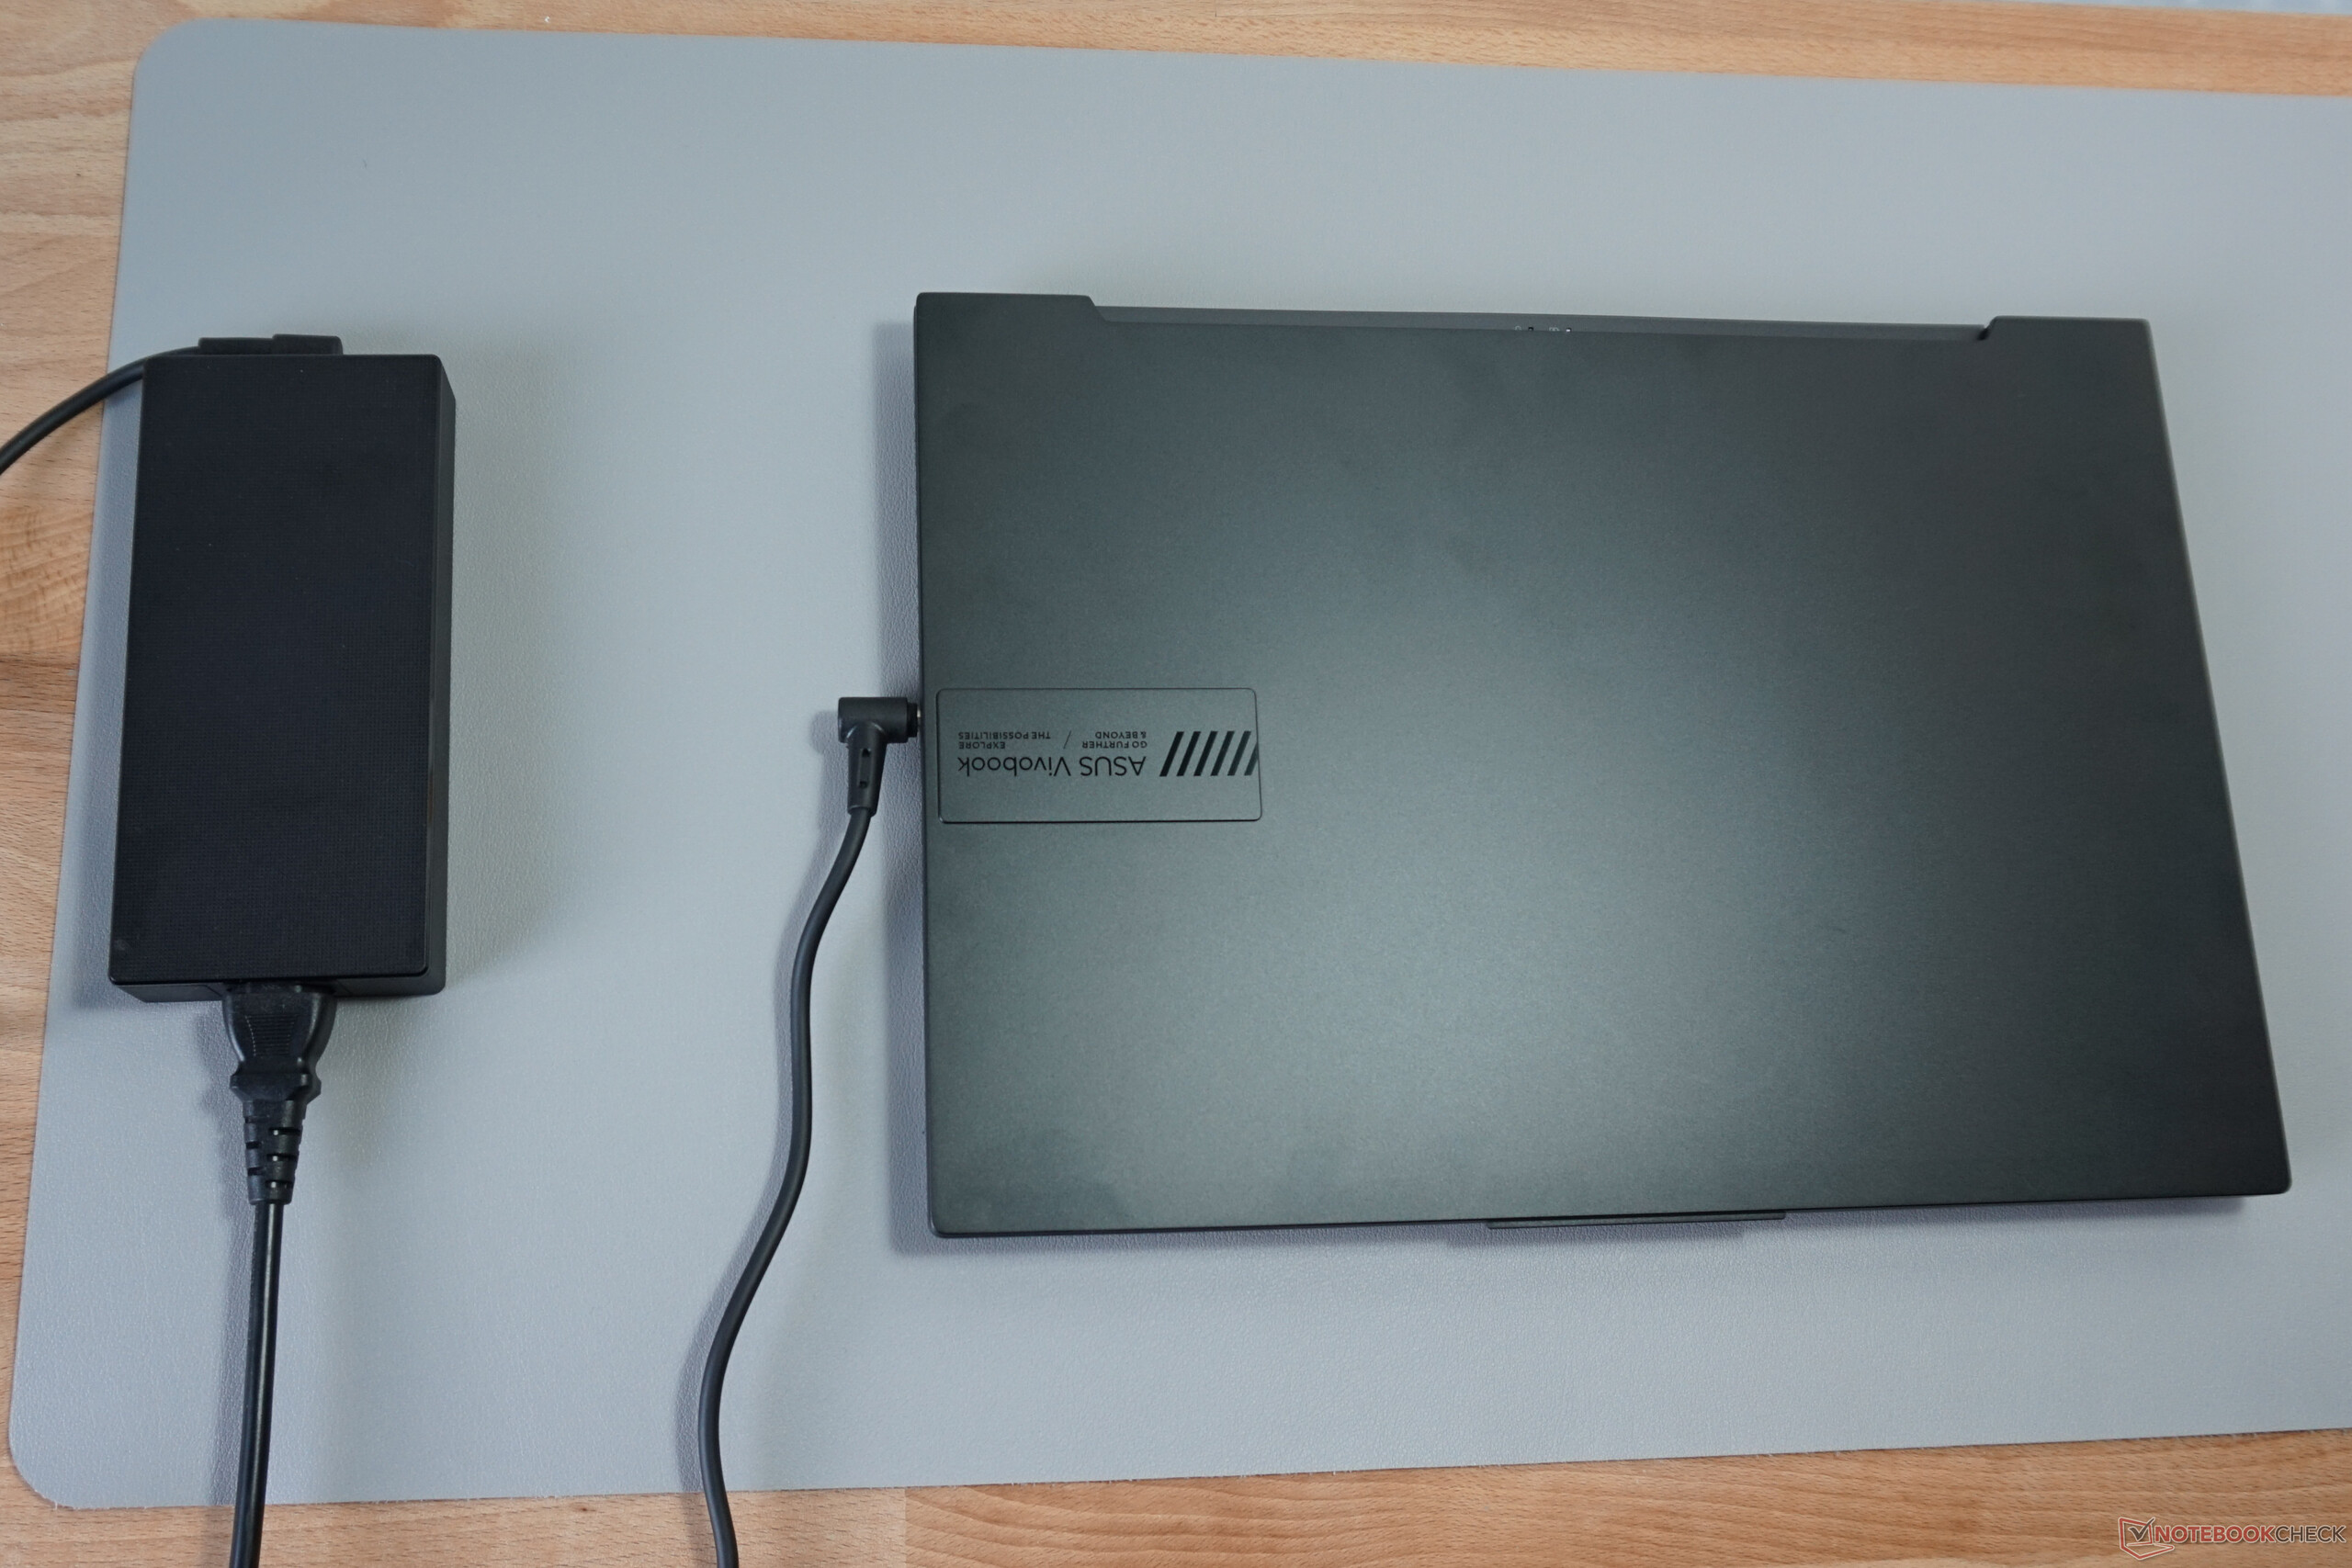
The maximum power consumption reaches 244 W, but only very briefly. A typical load is around 150 W, so the 240-watt power supply is well-sized.
| Off / Standby | |
| Idle | |
| Load |
|
Key:
min: | |
| Asus Vivobook Pro 16X K6604JV-MX016W i9-13980HX, GeForce RTX 4060 Laptop GPU, Solidigm P41 Plus SSDPFKNU010TZ, OLED, 3200x2000, 16" | Dell XPS 15 9530 RTX 4070 i7-13700H, GeForce RTX 4070 Laptop GPU, SK hynix PC801 HFS001TEJ9X101N, OLED, 3456x2160, 15.6" | Samsung Galaxy Book3 Ultra 16 i7-13700H, GeForce RTX 4050 Laptop GPU, Samsung PM9A1 MZVL2512HCJQ, AMOLED, 2880x1800, 16" | Asus ProArt Studiobook 16 OLED H7604 i9-13980HX, GeForce RTX 4070 Laptop GPU, Phison EM2804TBMTCB47, OLED, 3200x2000, 16" | Schenker VISION 16 Pro (M23) i7-13700H, GeForce RTX 4070 Laptop GPU, Samsung 990 Pro 1 TB, IPS, 2560x1600, 16" | MSI Creator Z17 A12UGST-054 i9-12900H, GeForce RTX 3070 Ti Laptop GPU, Micron 3400 1TB MTFDKBA1T0TFH, IPS, 2560x1600, 17" | Average NVIDIA GeForce RTX 4060 Laptop GPU | Average of class Multimedia | |
|---|---|---|---|---|---|---|---|---|
| Power Consumption | 6% | 58% | -8% | 29% | -75% | 12% | 48% | |
| Idle Minimum * (Watt) | 13.8 | 20 -45% | 3 78% | 12.8 7% | 8.6 38% | 34.6 -151% | 11.5 ? 17% | 5.71 ? 59% |
| Idle Average * (Watt) | 16 | 20.7 -29% | 5 69% | 19.9 -24% | 12 25% | 43 -169% | 16 ? -0% | 10.1 ? 37% |
| Idle Maximum * (Watt) | 19 | 22.4 -18% | 11 42% | 20.3 -7% | 12.4 35% | 44.9 -136% | 20.3 ? -7% | 12.4 ? 35% |
| Load Average * (Watt) | 147 | 77.1 48% | 72 51% | 131.4 11% | 80 46% | 145 1% | 92.9 ? 37% | 65 ? 56% |
| Witcher 3 ultra * (Watt) | 147.8 | 95.4 35% | 69.7 53% | 196.5 -33% | 147.7 -0% | 152.4 -3% | ||
| Load Maximum * (Watt) | 244 | 133.4 45% | 108 56% | 246.8 -1% | 173.1 29% | 220 10% | 210 ? 14% | 112.2 ? 54% |
* ... smaller is better
Power consumption Witcher 3 / Stress test
Power consumption with an external monitor
Battery Life
The VivoBook can only extract short runtimes from the large 90 Wh battery, which is mainly due to the high power consumption of 13.8 W without load. In purely mathematical terms, this should result in a maximum runtime of 6.5 hours, which is actually achieved when surfing the web in reduced brightness.
Browsing in dark mode brings you an additional three quarters of an hour, but the website background always has to be black. Video playback in flight mode is only possible for just under 5 hours.
Much more would be possible with a more efficient processor and more moderate settings overall. For example, the Samsung Galaxy Book3 Ultra and its smaller battery manages 13 hours of video playback and almost 10 hours in our web surfing test.
Asus advertises that the battery is charged by 50% after 30 minutes, which was confirmed in our tests.
| Asus Vivobook Pro 16X K6604JV-MX016W i9-13980HX, GeForce RTX 4060 Laptop GPU, 90 Wh | Dell XPS 15 9530 RTX 4070 i7-13700H, GeForce RTX 4070 Laptop GPU, 86 Wh | Samsung Galaxy Book3 Ultra 16 i7-13700H, GeForce RTX 4050 Laptop GPU, 76 Wh | Asus ProArt Studiobook 16 OLED H7604 i9-13980HX, GeForce RTX 4070 Laptop GPU, 90 Wh | Schenker VISION 16 Pro (M23) i7-13700H, GeForce RTX 4070 Laptop GPU, 80 Wh | MSI Creator Z17 A12UGST-054 i9-12900H, GeForce RTX 3070 Ti Laptop GPU, 90 Wh | Average of class Multimedia | |
|---|---|---|---|---|---|---|---|
| Battery runtime | 12% | 74% | -9% | 18% | 12% | 102% | |
| H.264 (h) | 5.3 | 13.4 153% | 6 13% | 7.8 47% | 5.5 4% | 16.4 ? 209% | |
| WiFi v1.3 (h) | 6.5 | 8 23% | 9.6 48% | 5.6 -14% | 7.8 20% | 5.5 -15% | 12 ? 85% |
| Load (h) | 1.5 | 1.5 0% | 1.8 20% | 1.1 -27% | 1.3 -13% | 2.2 47% | 1.675 ? 12% |
Pros
Cons
Verdict - Somewhat basic, but really fast
Thanks to a color-accurate OLED display with 6 million pixels, a well-adjusted RTX 4060 and an extremely powerful i9-13980HX, the Asus VivoBook Pro 16X offers the perfect qualities for an ambitious multimedia notebook. In addition, the cooling in the relatively compact case is solid, is not bothersome in standard settings and is almost imperceptible in Silent mode.
Maybe not as posh, but certainly on par with the Asus Studiobook premium model in terms of core competencies.
There is also the control wheel, which is not physically present, but integrated in the touchpad. The basic functions and the additional programming of the "Asus ProArt" software expand the operating options enormously. And no gaps are to be found in the connectivity either.
The differences to the considerably more expensive Asus ProArt Studiobook 16 OLED are to be found outside the screen and performance values. The case is not very solidly built, which also negatively impacts the keyboard. Furthermore, the cooling is not quite as convincing in extreme situations, but it doesn't really have to be. From a pragmatic point of view, the VivoBook Pro 16X is thus the preferable choice.
The Samsung Galaxy Book3 Ultra 16 is not quite as fast, but has much more stamina and is even thinner.
Price and Availability
In the US, the Asus Vivobook Pro 16X comes in a number of configurations. Amazon, for example, offers the strongest variant (Intel Core i9-13980HX CPU, RTX 4070 GPU, 32GB RAM, 1TB SSD) at a discounted price of US$1,994.99. Best Buy offers an identical variant, but with 16 GB of RAM only, for $1,999.99. Swap out the RTX 4070 for an RTX 4060 and you have another variant for $1,799.99.
Prices are as of 26.07.2023 and are subject to change.
Asus Vivobook Pro 16X K6604JV-MX016W
- 07/25/2023 v7 (old)
Mario Petzold
Transparency
The selection of devices to be reviewed is made by our editorial team. The test sample was provided to the author as a loan by the manufacturer or retailer for the purpose of this review. The lender had no influence on this review, nor did the manufacturer receive a copy of this review before publication. There was no obligation to publish this review. As an independent media company, Notebookcheck is not subjected to the authority of manufacturers, retailers or publishers.
This is how Notebookcheck is testing
Every year, Notebookcheck independently reviews hundreds of laptops and smartphones using standardized procedures to ensure that all results are comparable. We have continuously developed our test methods for around 20 years and set industry standards in the process. In our test labs, high-quality measuring equipment is utilized by experienced technicians and editors. These tests involve a multi-stage validation process. Our complex rating system is based on hundreds of well-founded measurements and benchmarks, which maintains objectivity. Further information on our test methods can be found here.
Price comparison

