Acer Predator Helios 16 laptop review: A quiet gaming laptop with many strengths
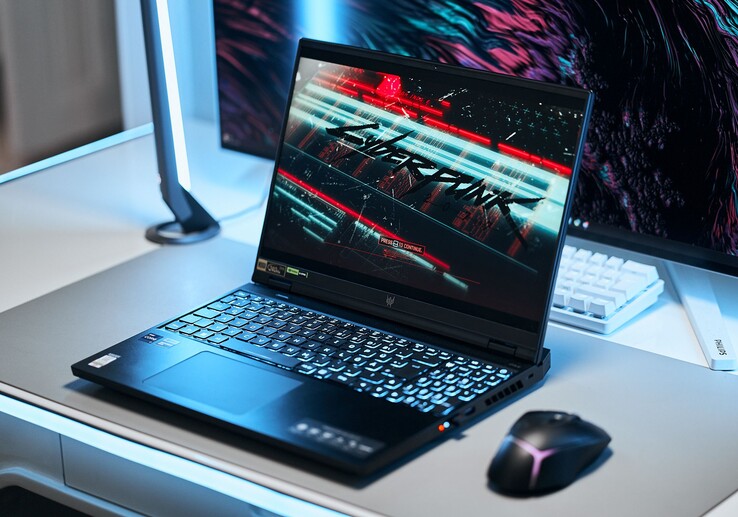
As the successor to the Predator Helios 300, the Predator Helios 16 is Acer's latest high-end gaming laptop with mid-range elements. Our review model has opted for an RTX 4060, a mid-tier GPU, and costs around $1,700, with SKUs up to an RTX 4080 also available. Acer's pure mid-range is represented by the Helios Neo 16 and the Nitro series with the latter serving to cover the entry-level segment. By contrast, the Triton 16 is Acer's ultra-thin gaming laptop.
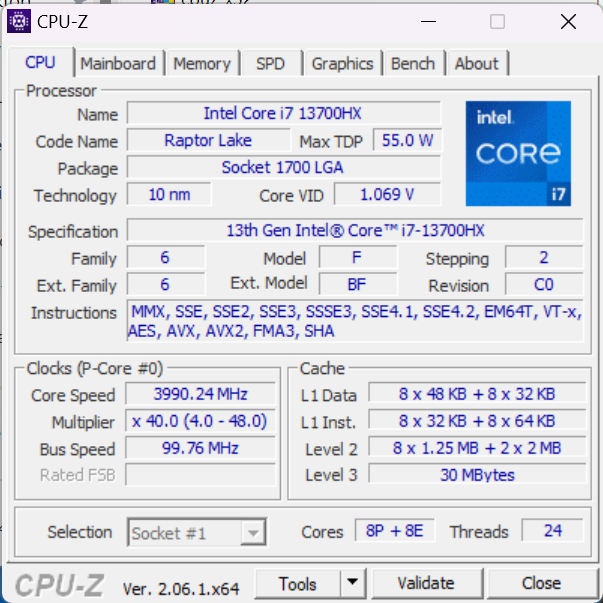
In addition, an Intel Core i7-13700HX (55-watt TDP), 16 GB of DDR5 RAM (two RAM banks) and a 1 TB SSD (PCIe 4.0) are also put into action. Although a mini-LED display is also available, our model comes with a regular LED-backlit IPS panel which, unexpectedly, has gone for a high-end feature set, as our review shows.
Competition comes mainly in the form of Lenovo's Legion Pro 5 but the Asus TUF Gaming A16, Gigabyte's Aorus 15X and Dell's G15 are also battling it out for the title of best mid-range gaming laptop.
Possible competitors compared
Rating | Date | Model | Weight | Height | Size | Resolution | Price |
|---|---|---|---|---|---|---|---|
| 89.5 % v7 (old) | 07 / 2023 | Acer Predator Helios 16 PH16-71-731Q i7-13700HX, GeForce RTX 4060 Laptop GPU | 2.6 kg | 26.9 mm | 16.00" | 2560x1600 | |
| 88.1 % v7 (old) | 06 / 2023 | Acer Nitro 16 AN16-41 R7 7735HS, GeForce RTX 4070 Laptop GPU | 2.7 kg | 27.9 mm | 16.00" | 2560x1600 | |
| 87.9 % v7 (old) | 05 / 2023 | Lenovo Legion Pro 5 16IRX8 i7-13700HX, GeForce RTX 4060 Laptop GPU | 2.5 kg | 26.8 mm | 16.00" | 2560x1600 | |
| 86.2 % v7 (old) | 04 / 2023 | Aorus 15X ASF i7-13700HX, GeForce RTX 4070 Laptop GPU | 2.3 kg | 19.7 mm | 15.60" | 2560x1440 | |
| 86.2 % v7 (old) | 02 / 2023 | Asus TUF Gaming A16 FA617 R7 7735HS, Radeon RX 7600S | 2.2 kg | 27 mm | 16.00" | 1920x1200 | |
| 84.2 % v7 (old) | 06 / 2023 | Dell G15 5530 i7-13650HX, GeForce RTX 4060 Laptop GPU | 3 kg | 26.95 mm | 15.60" | 1920x1080 |
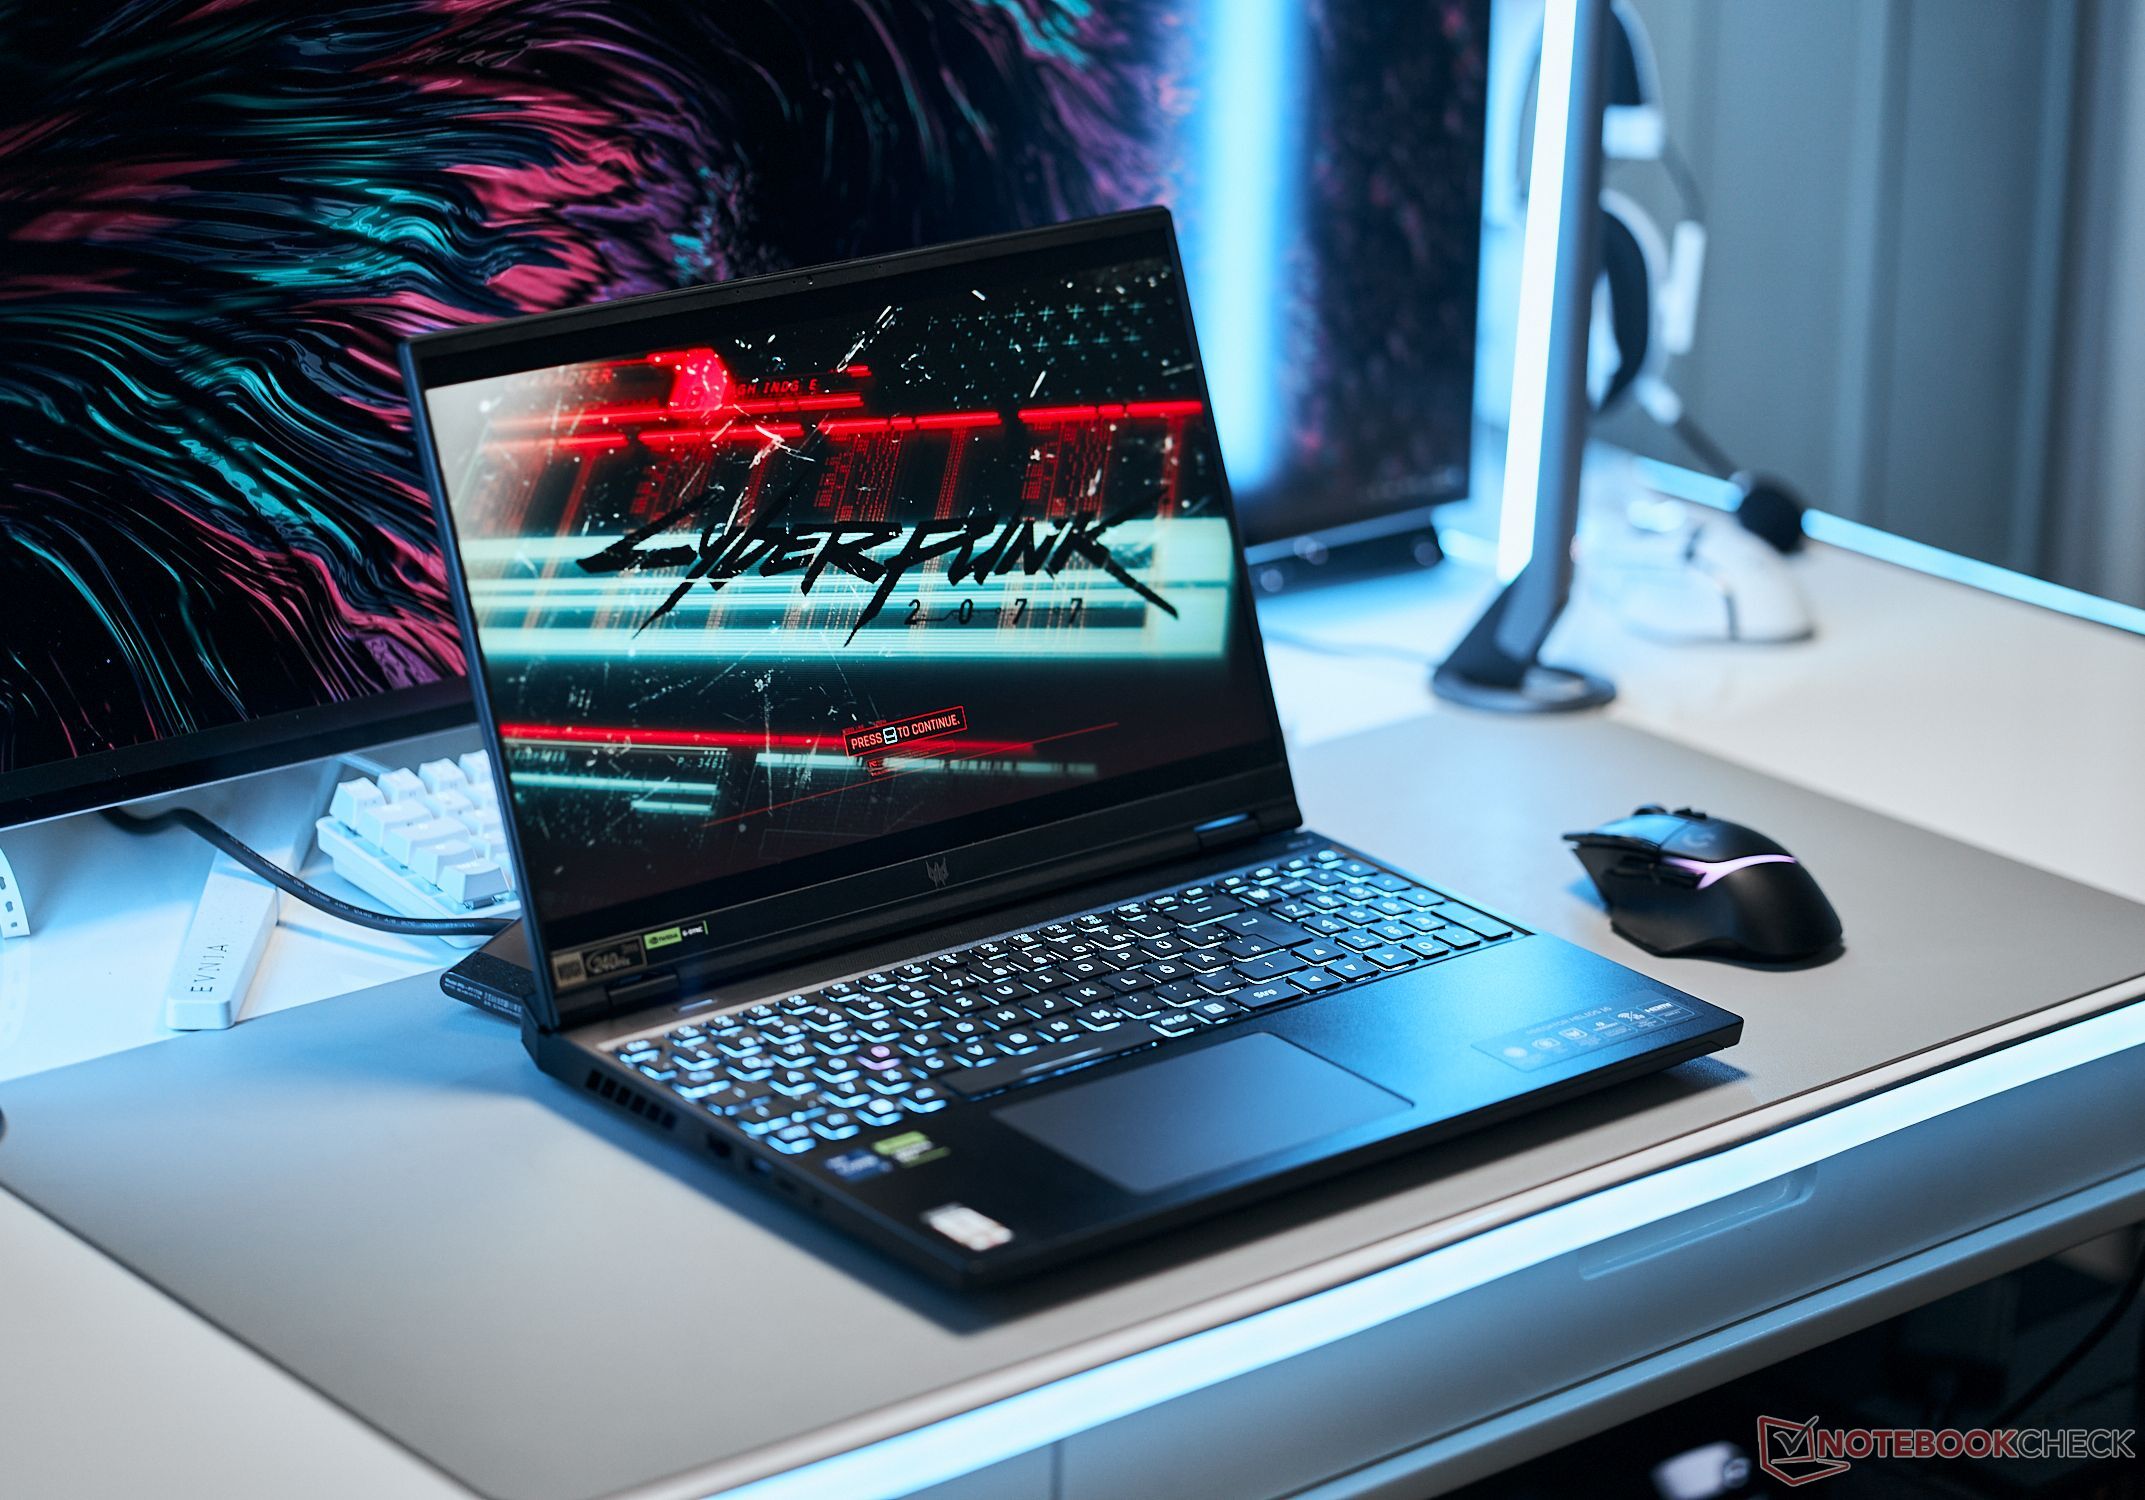
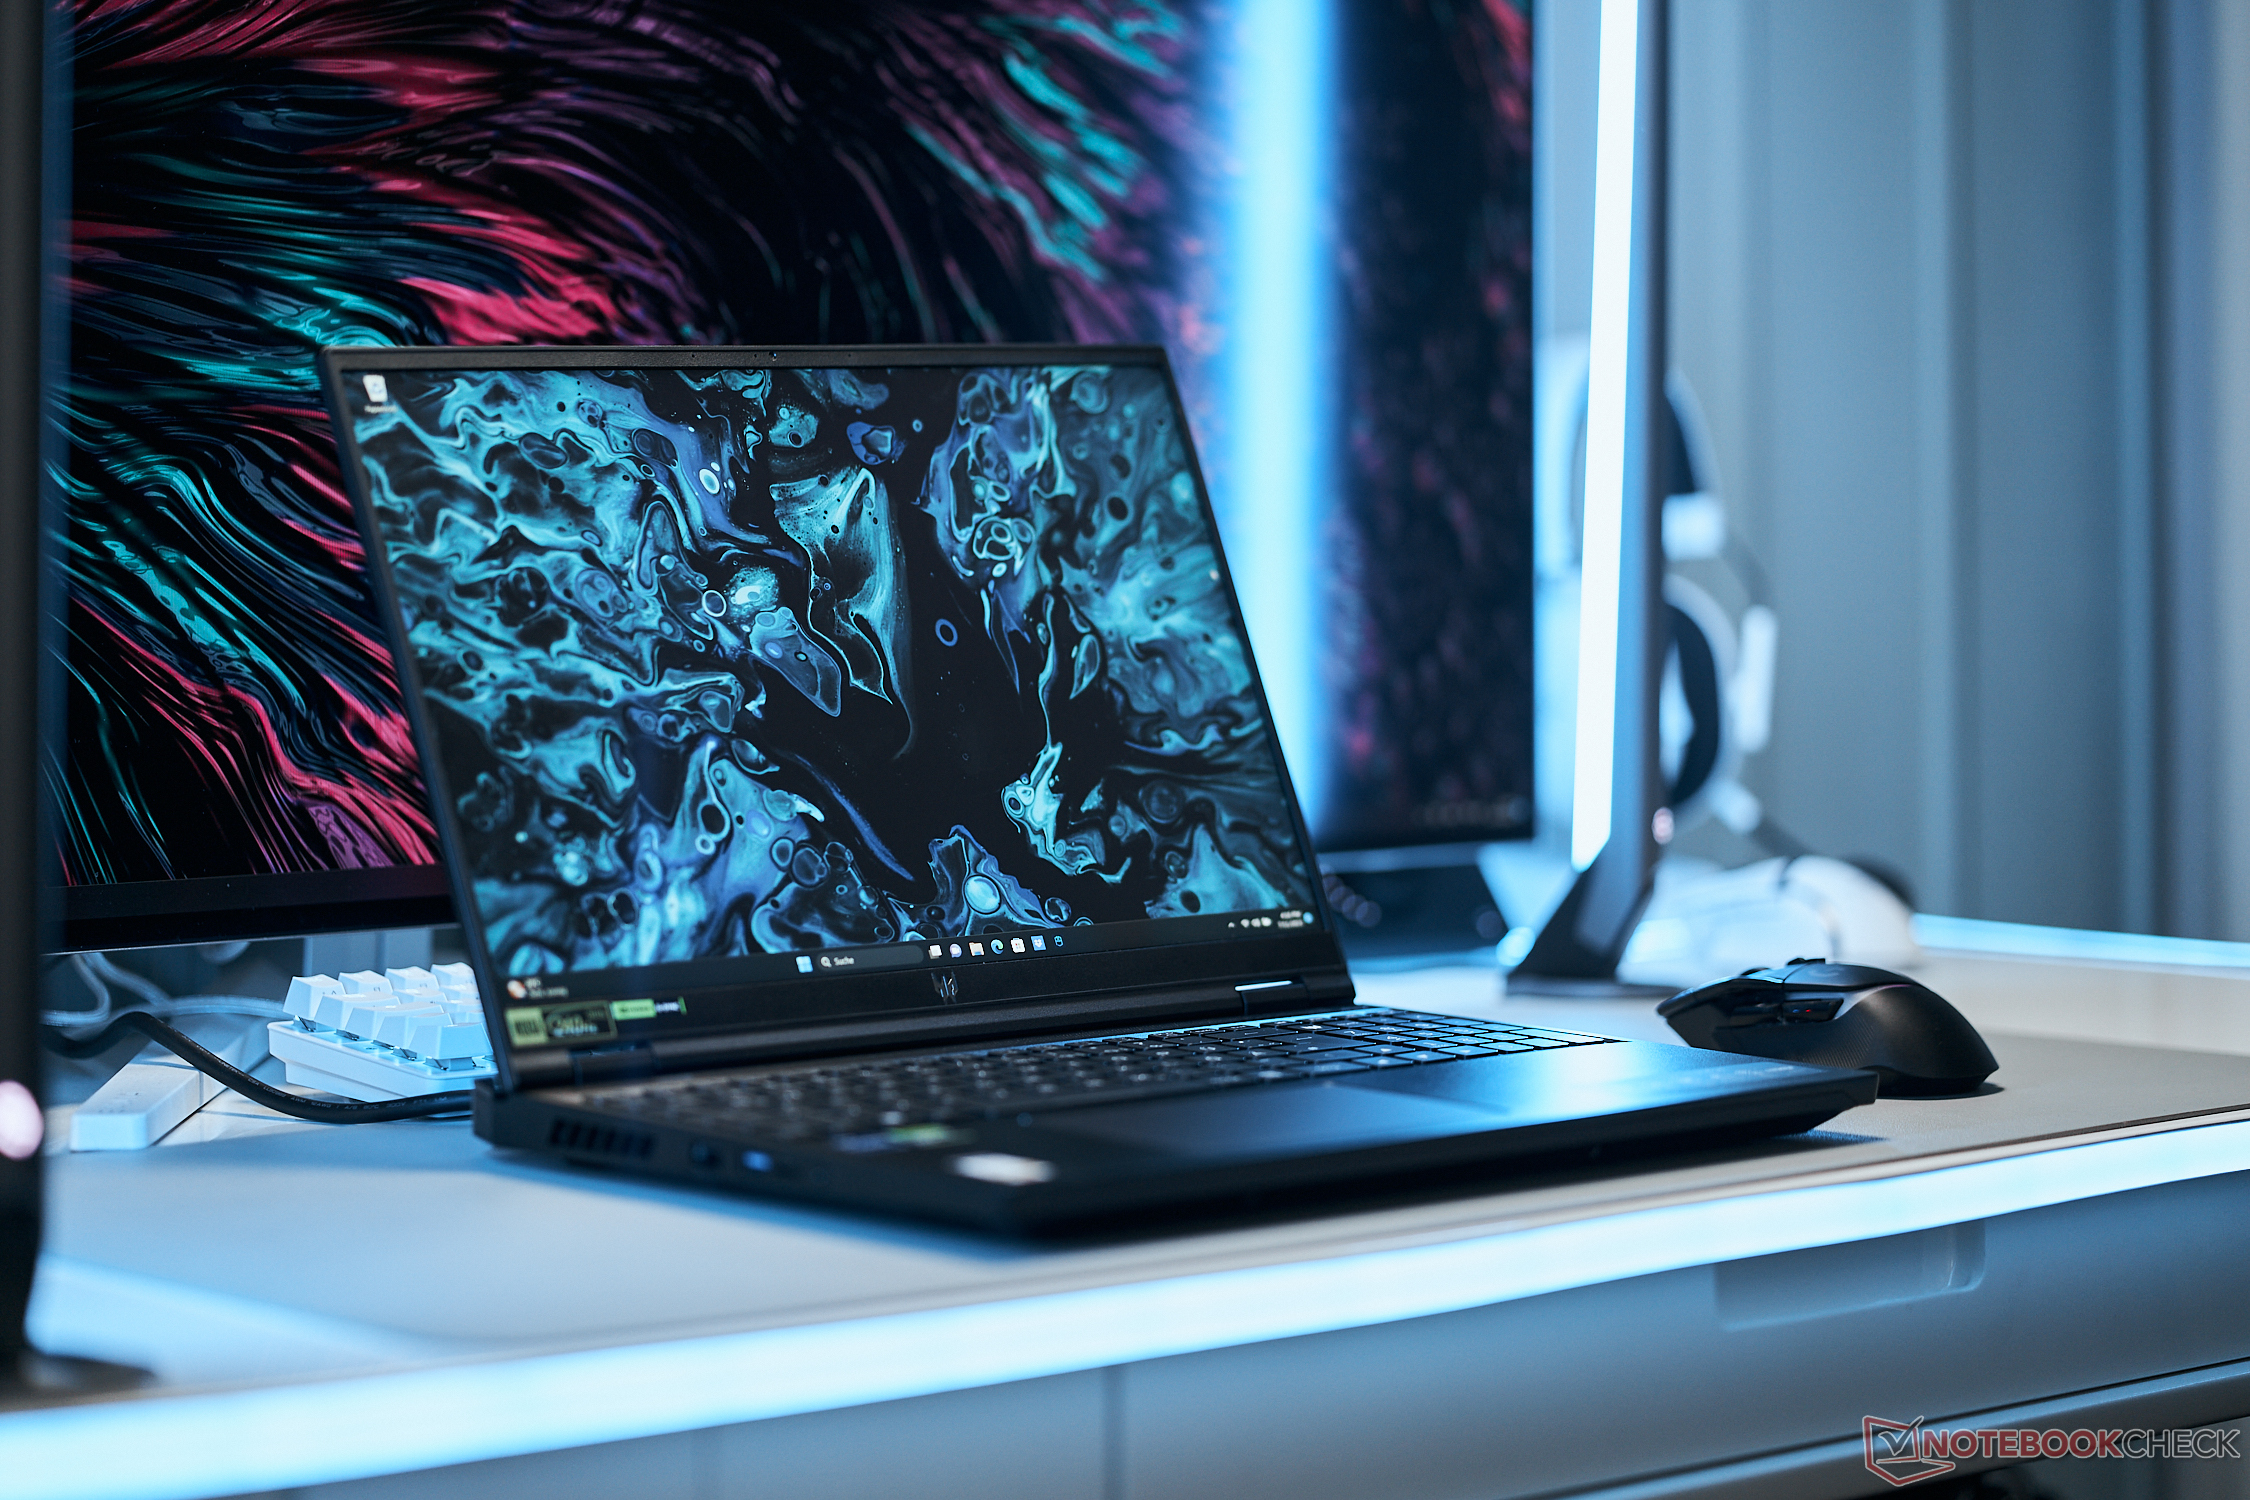
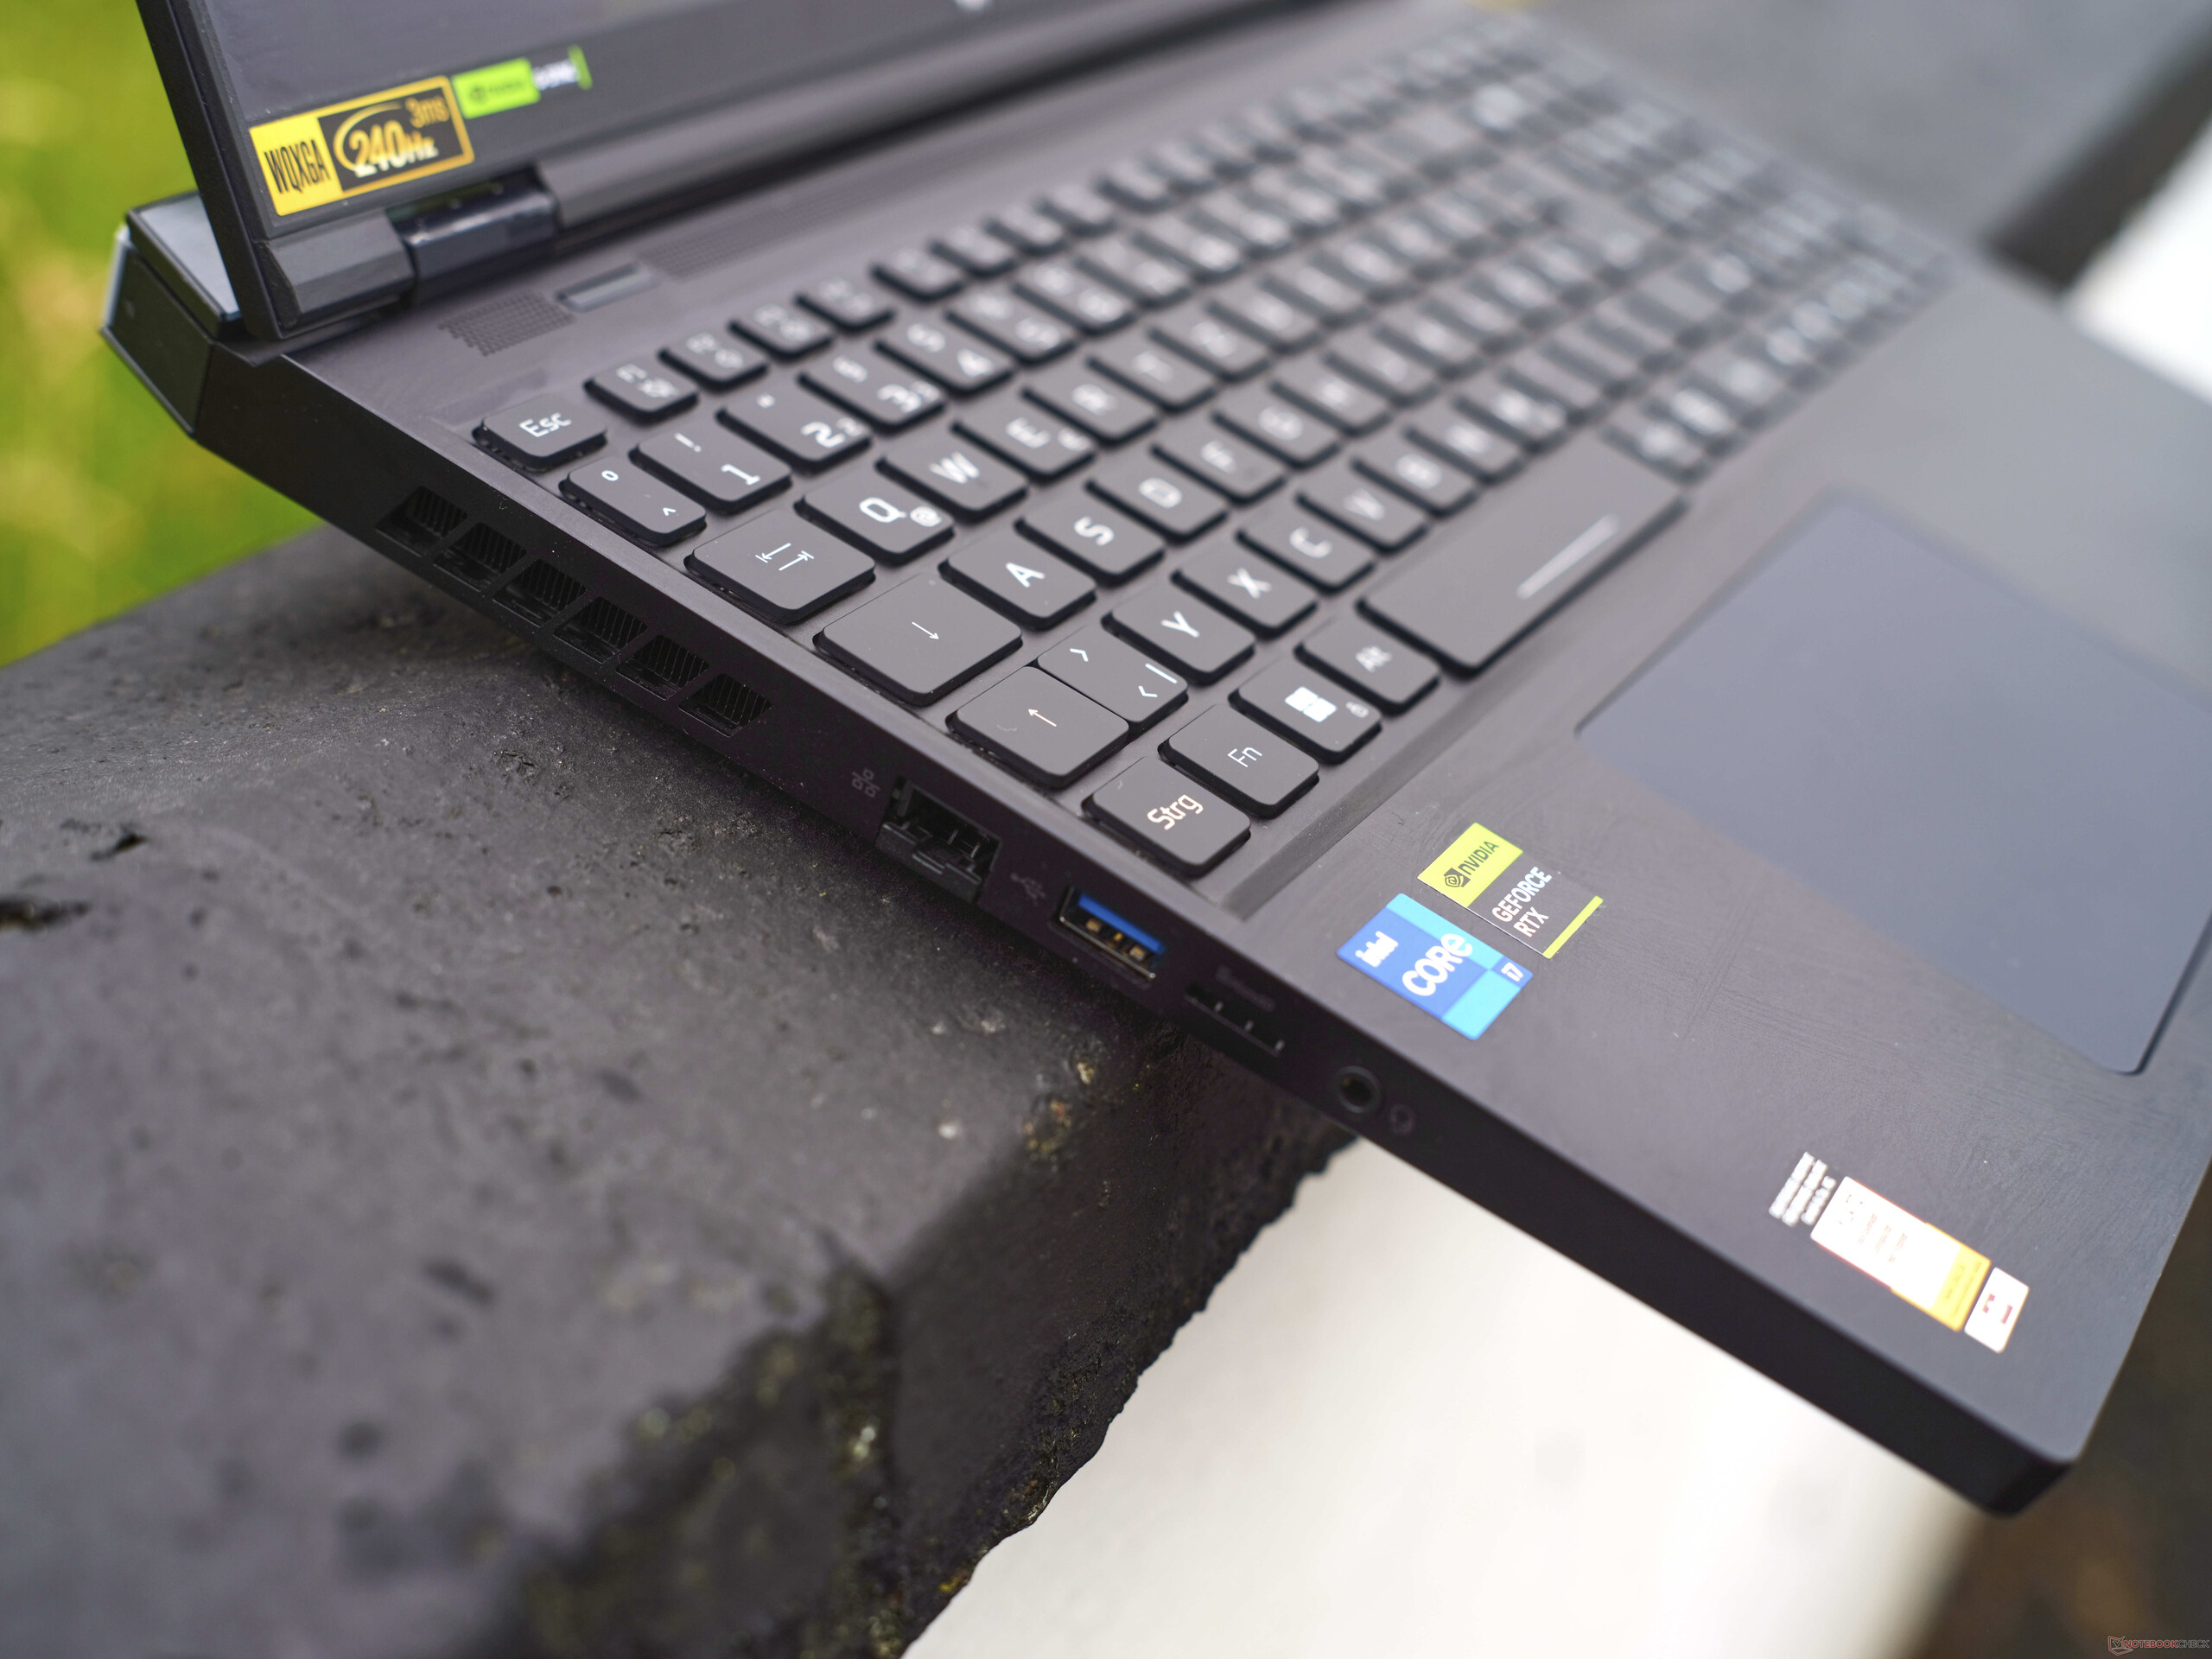
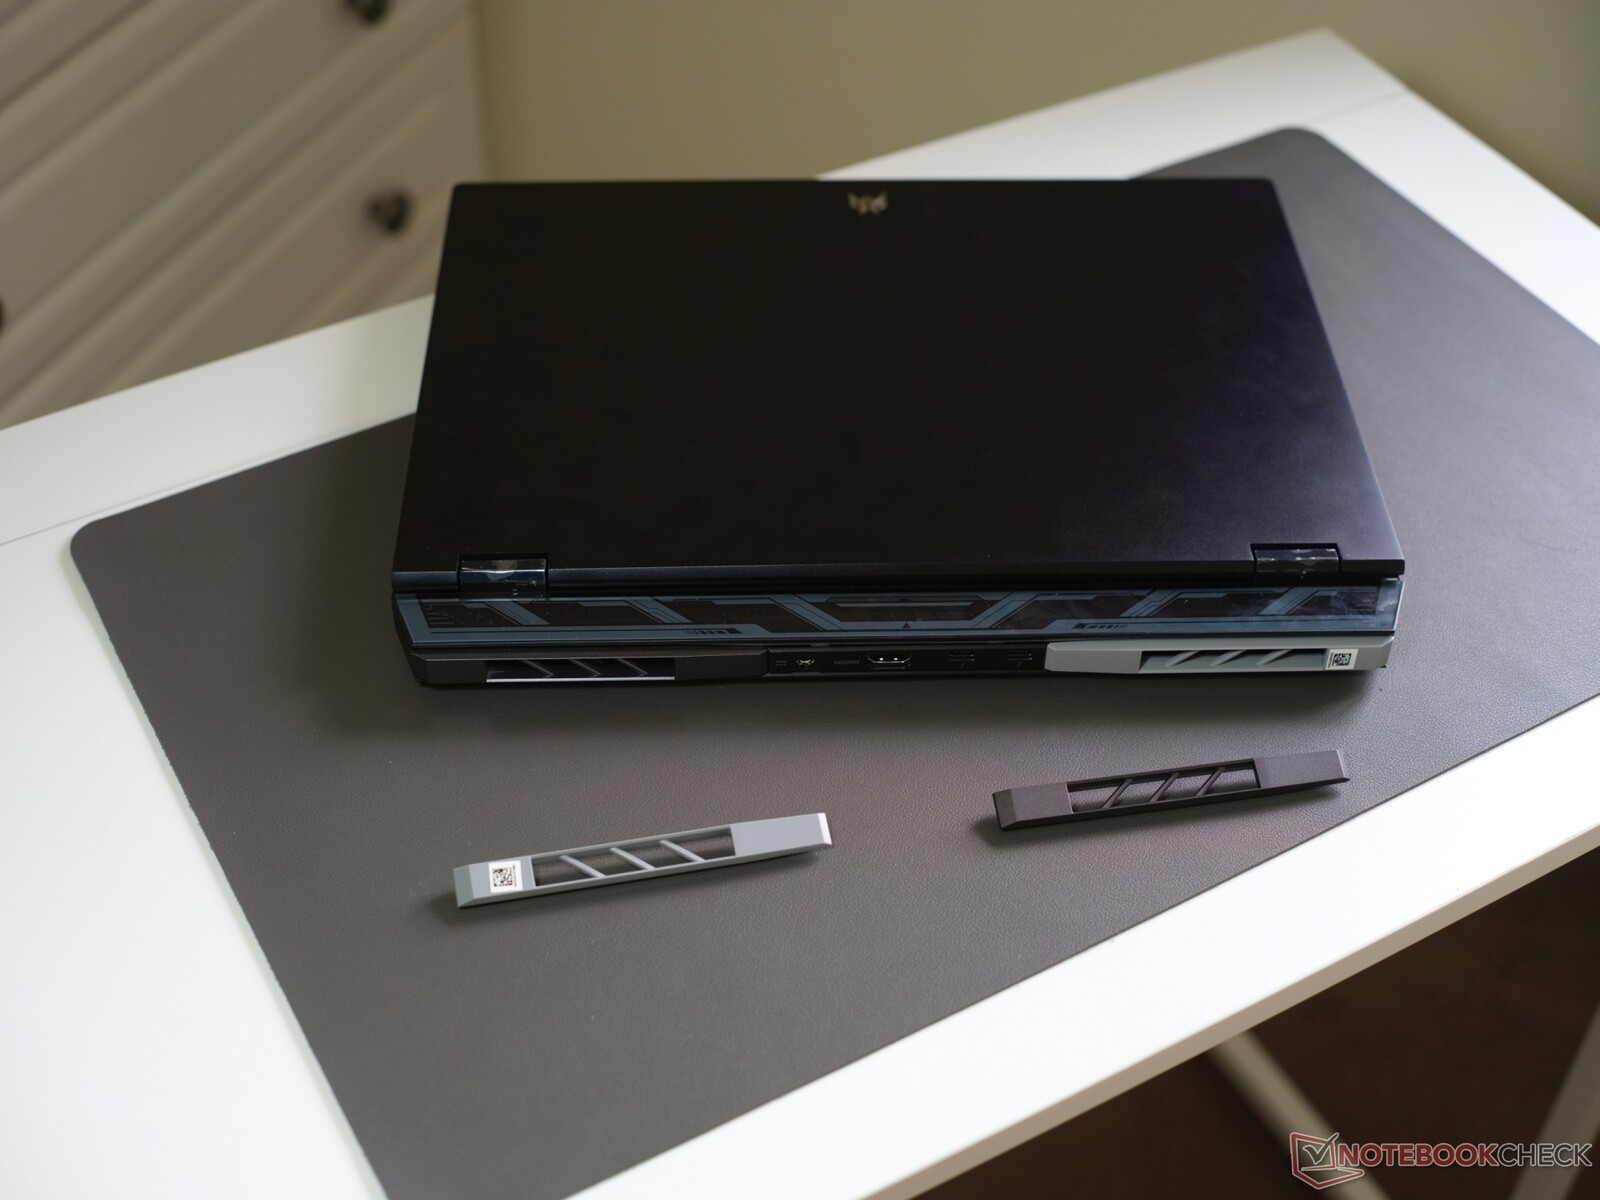
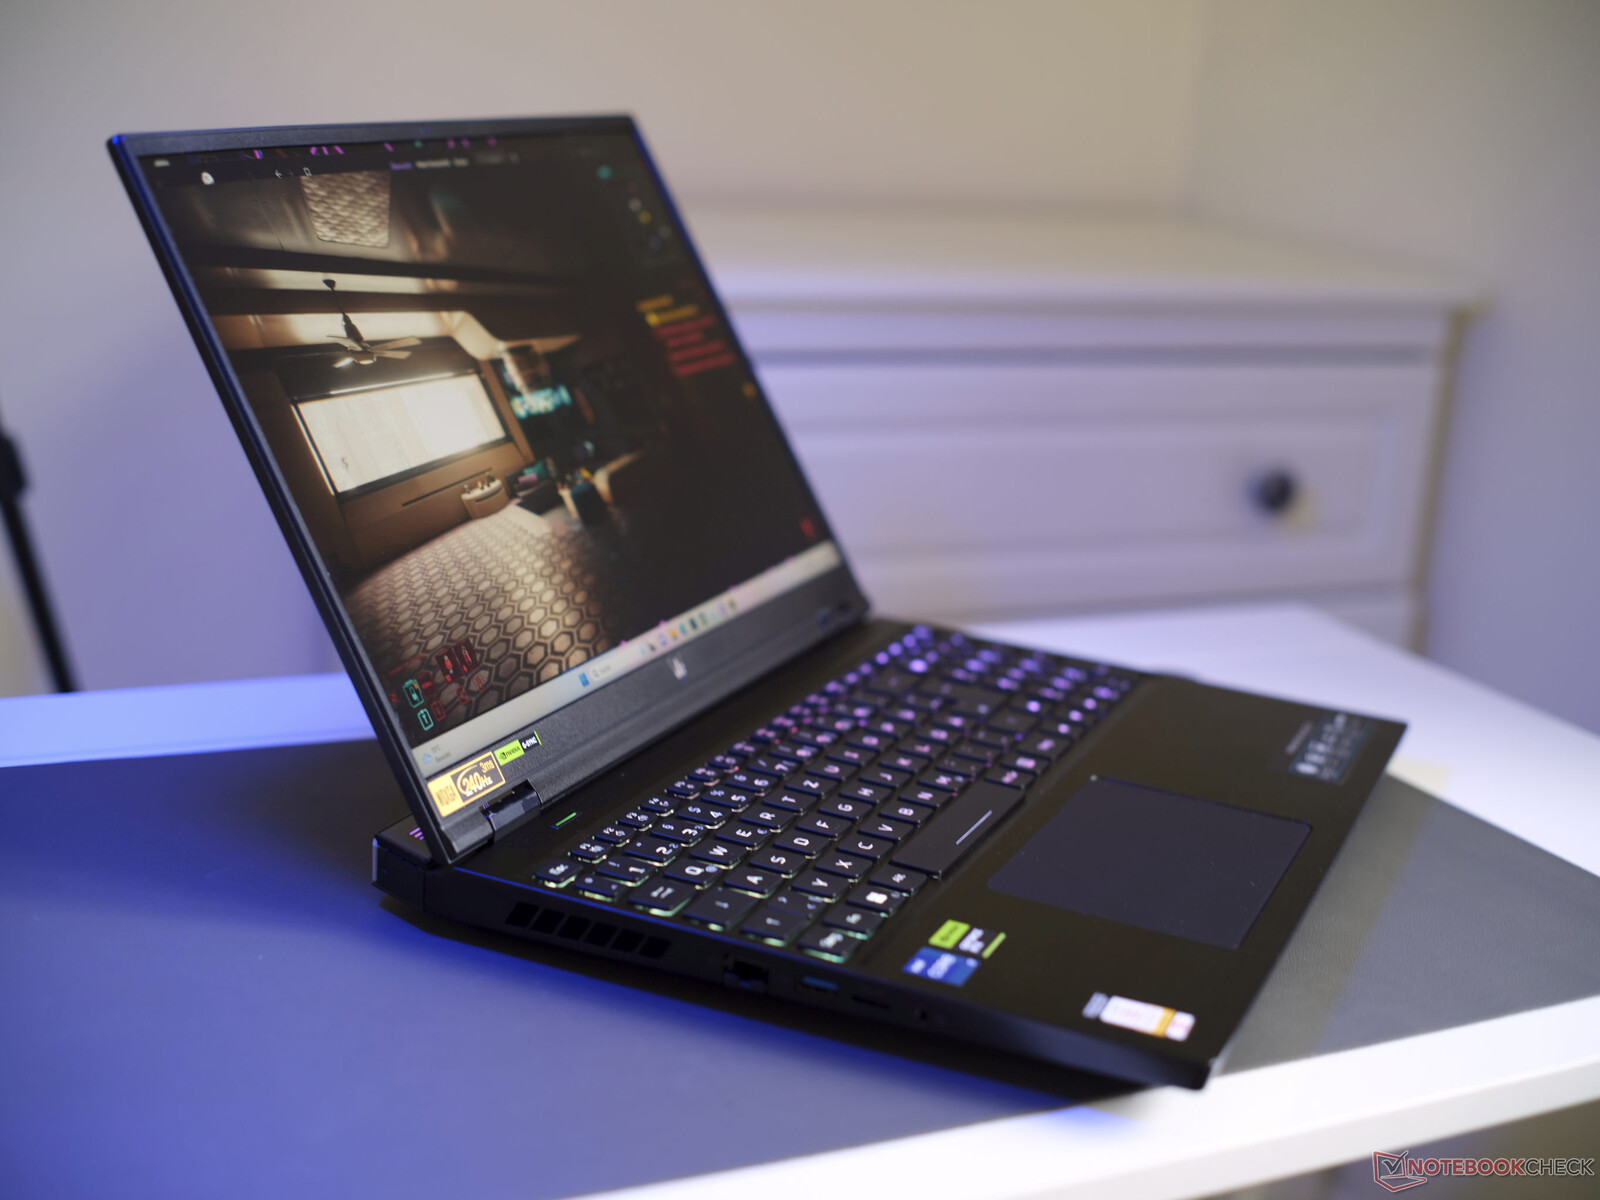
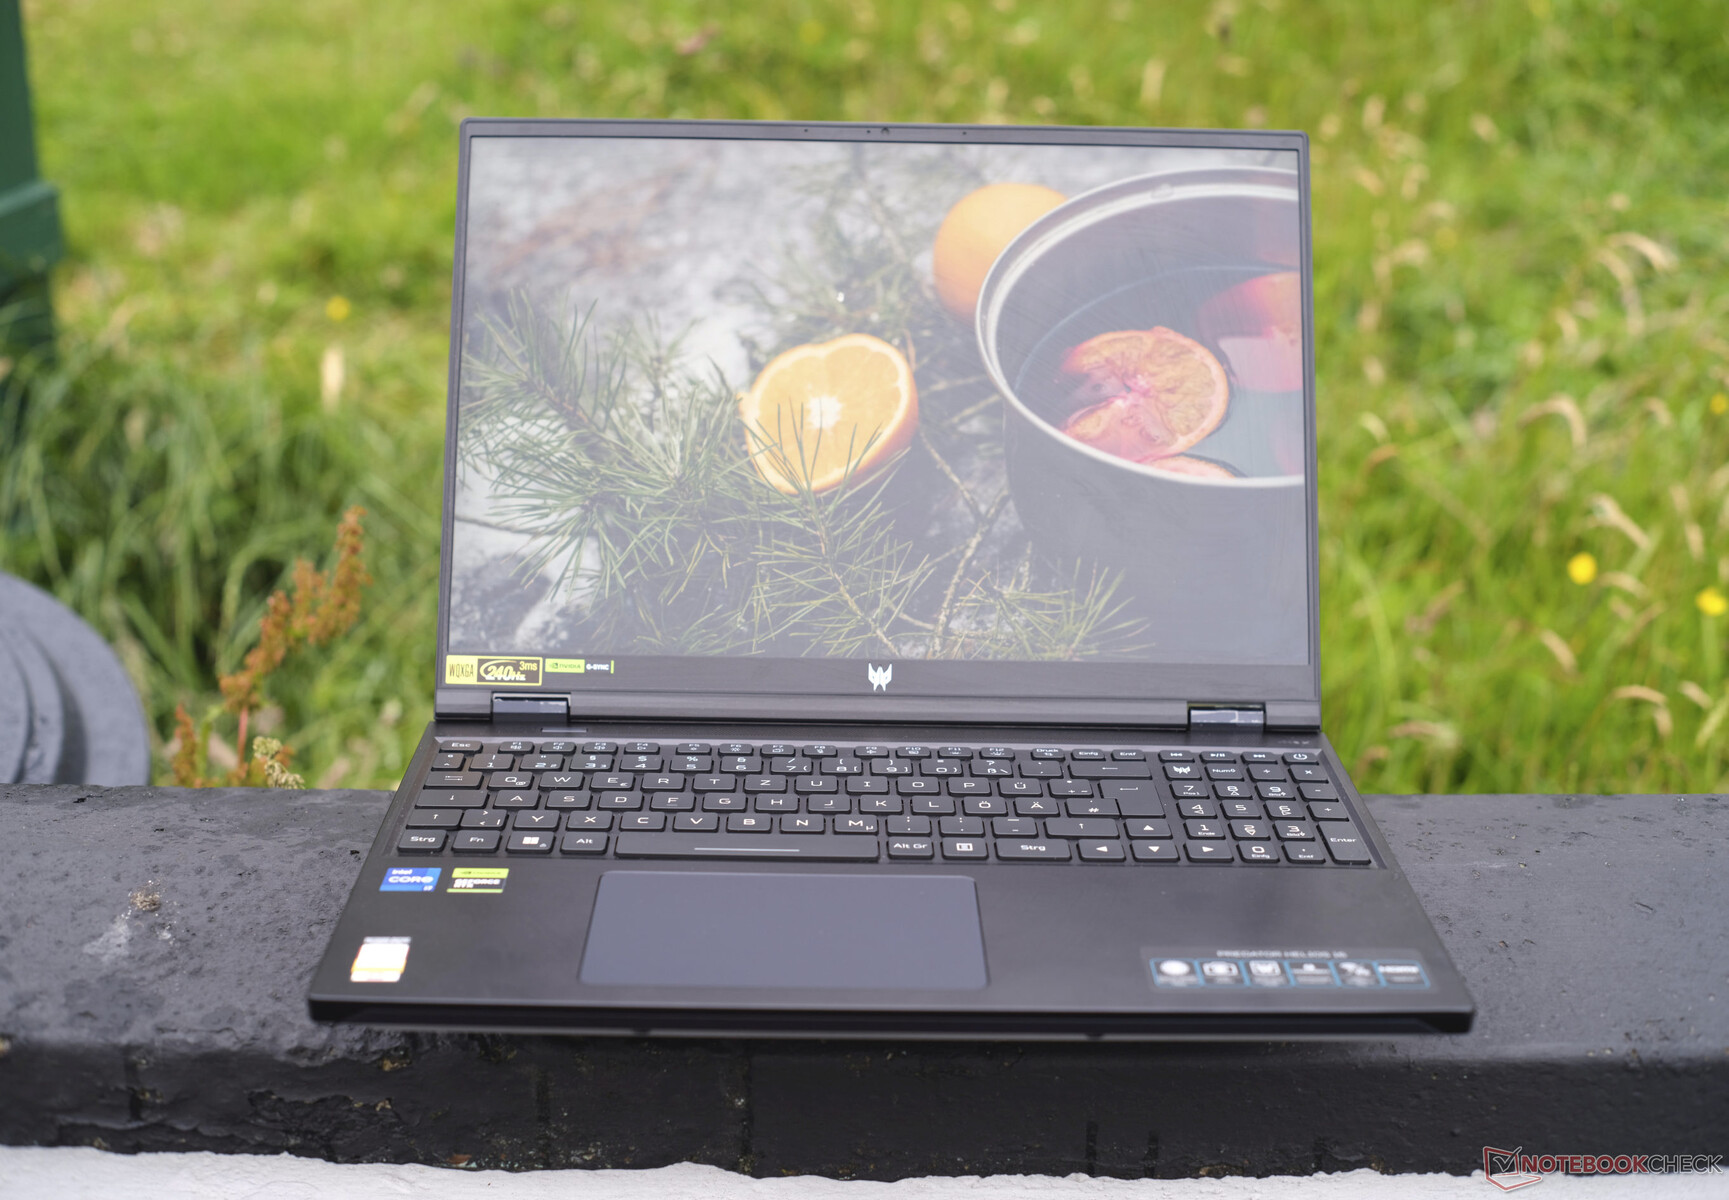
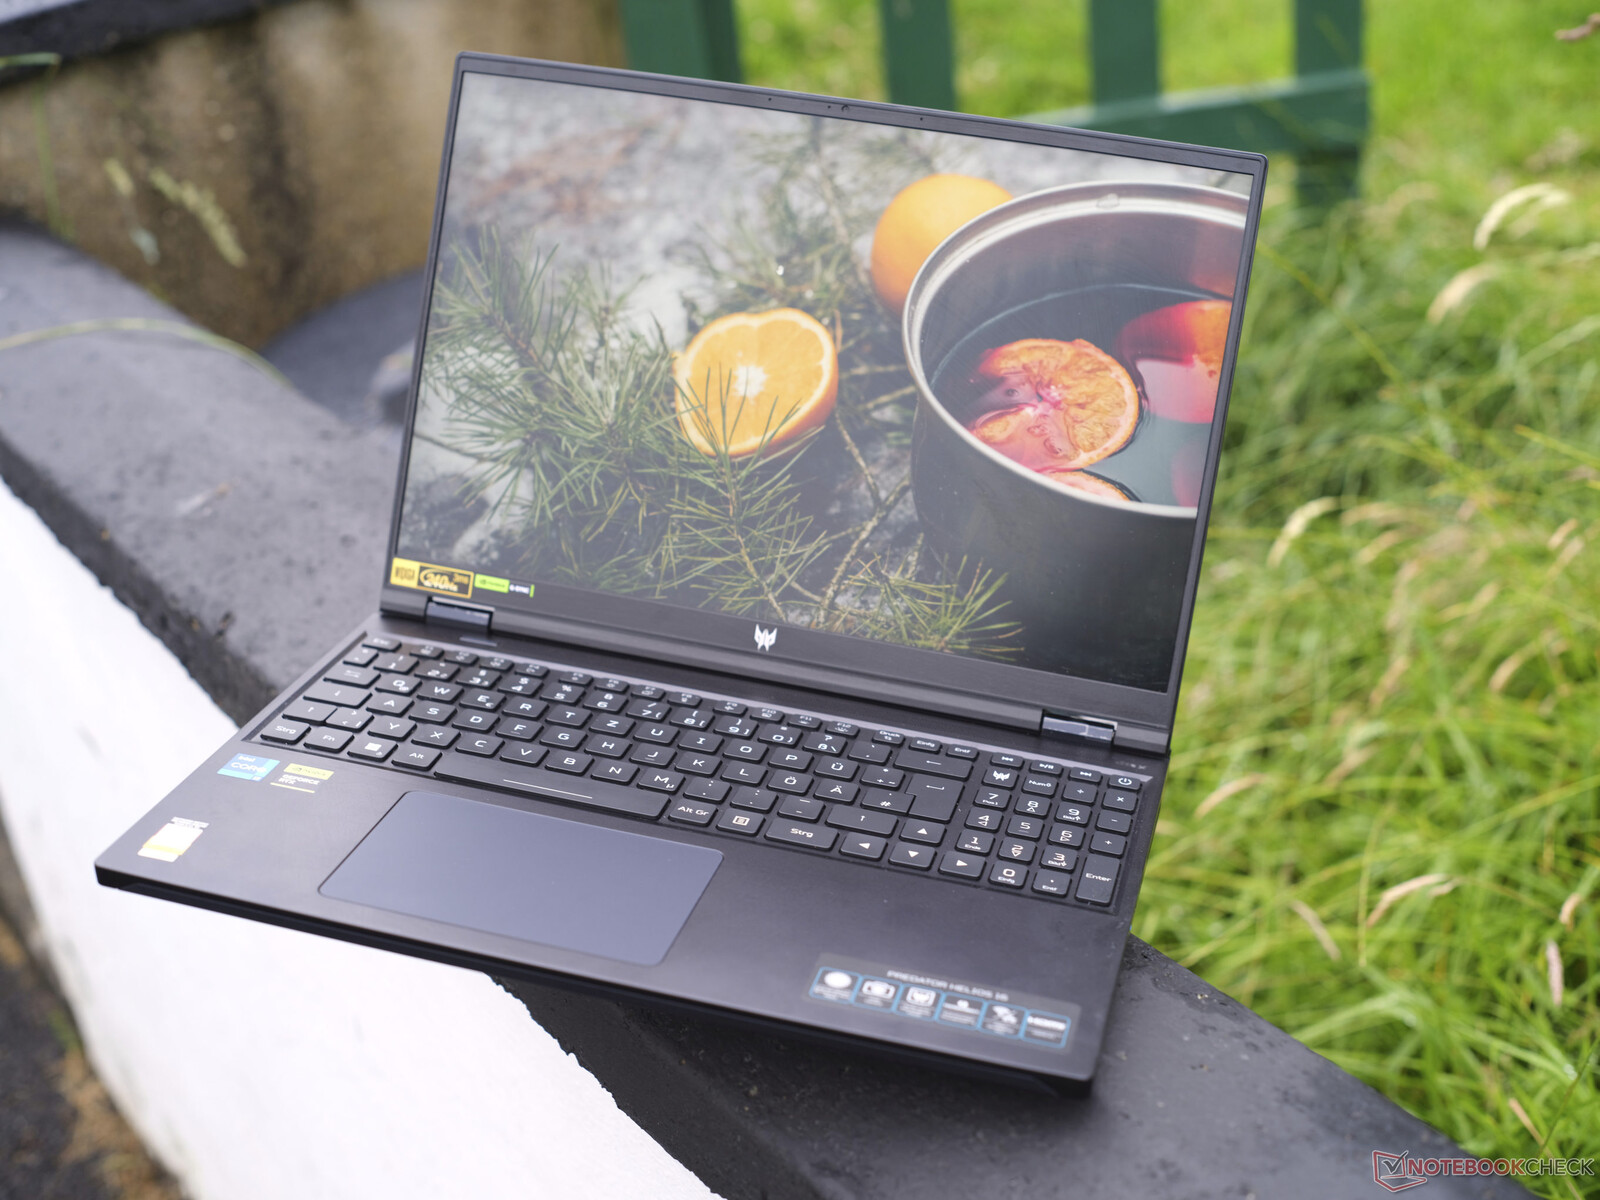
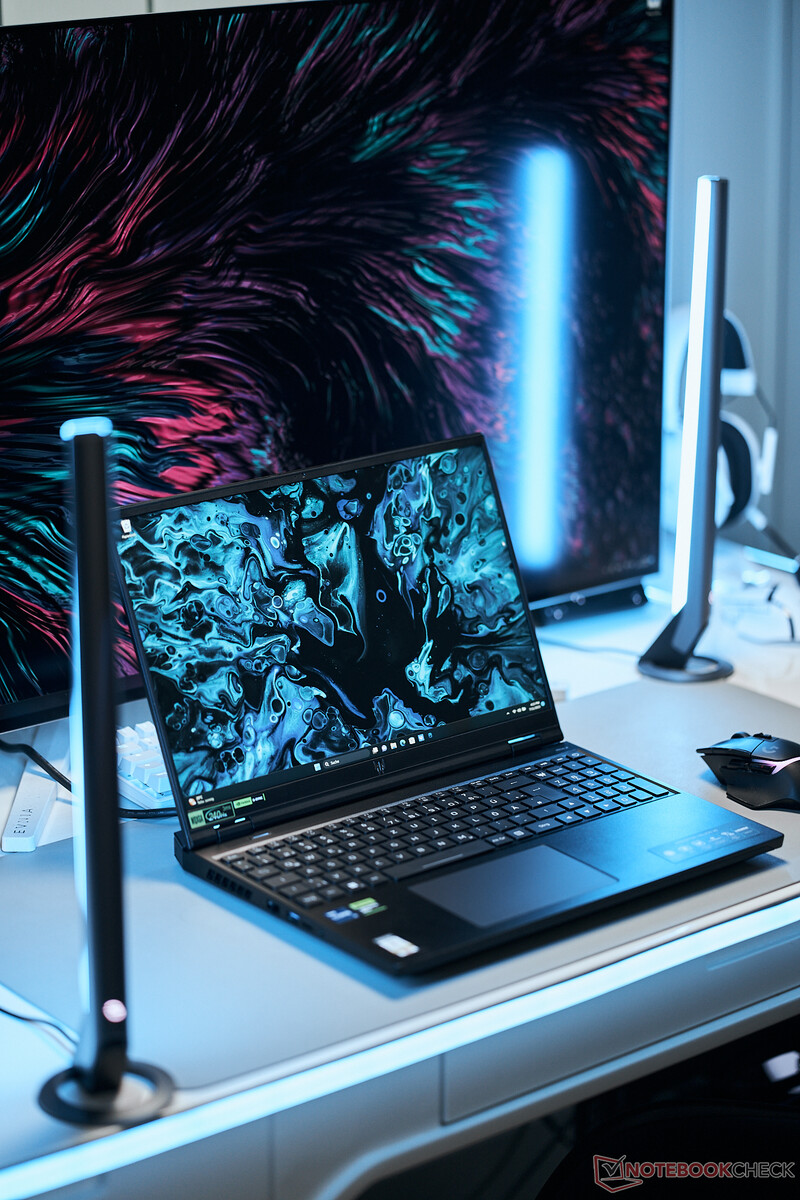
Case: A robust, almost understated Acer gaming laptop
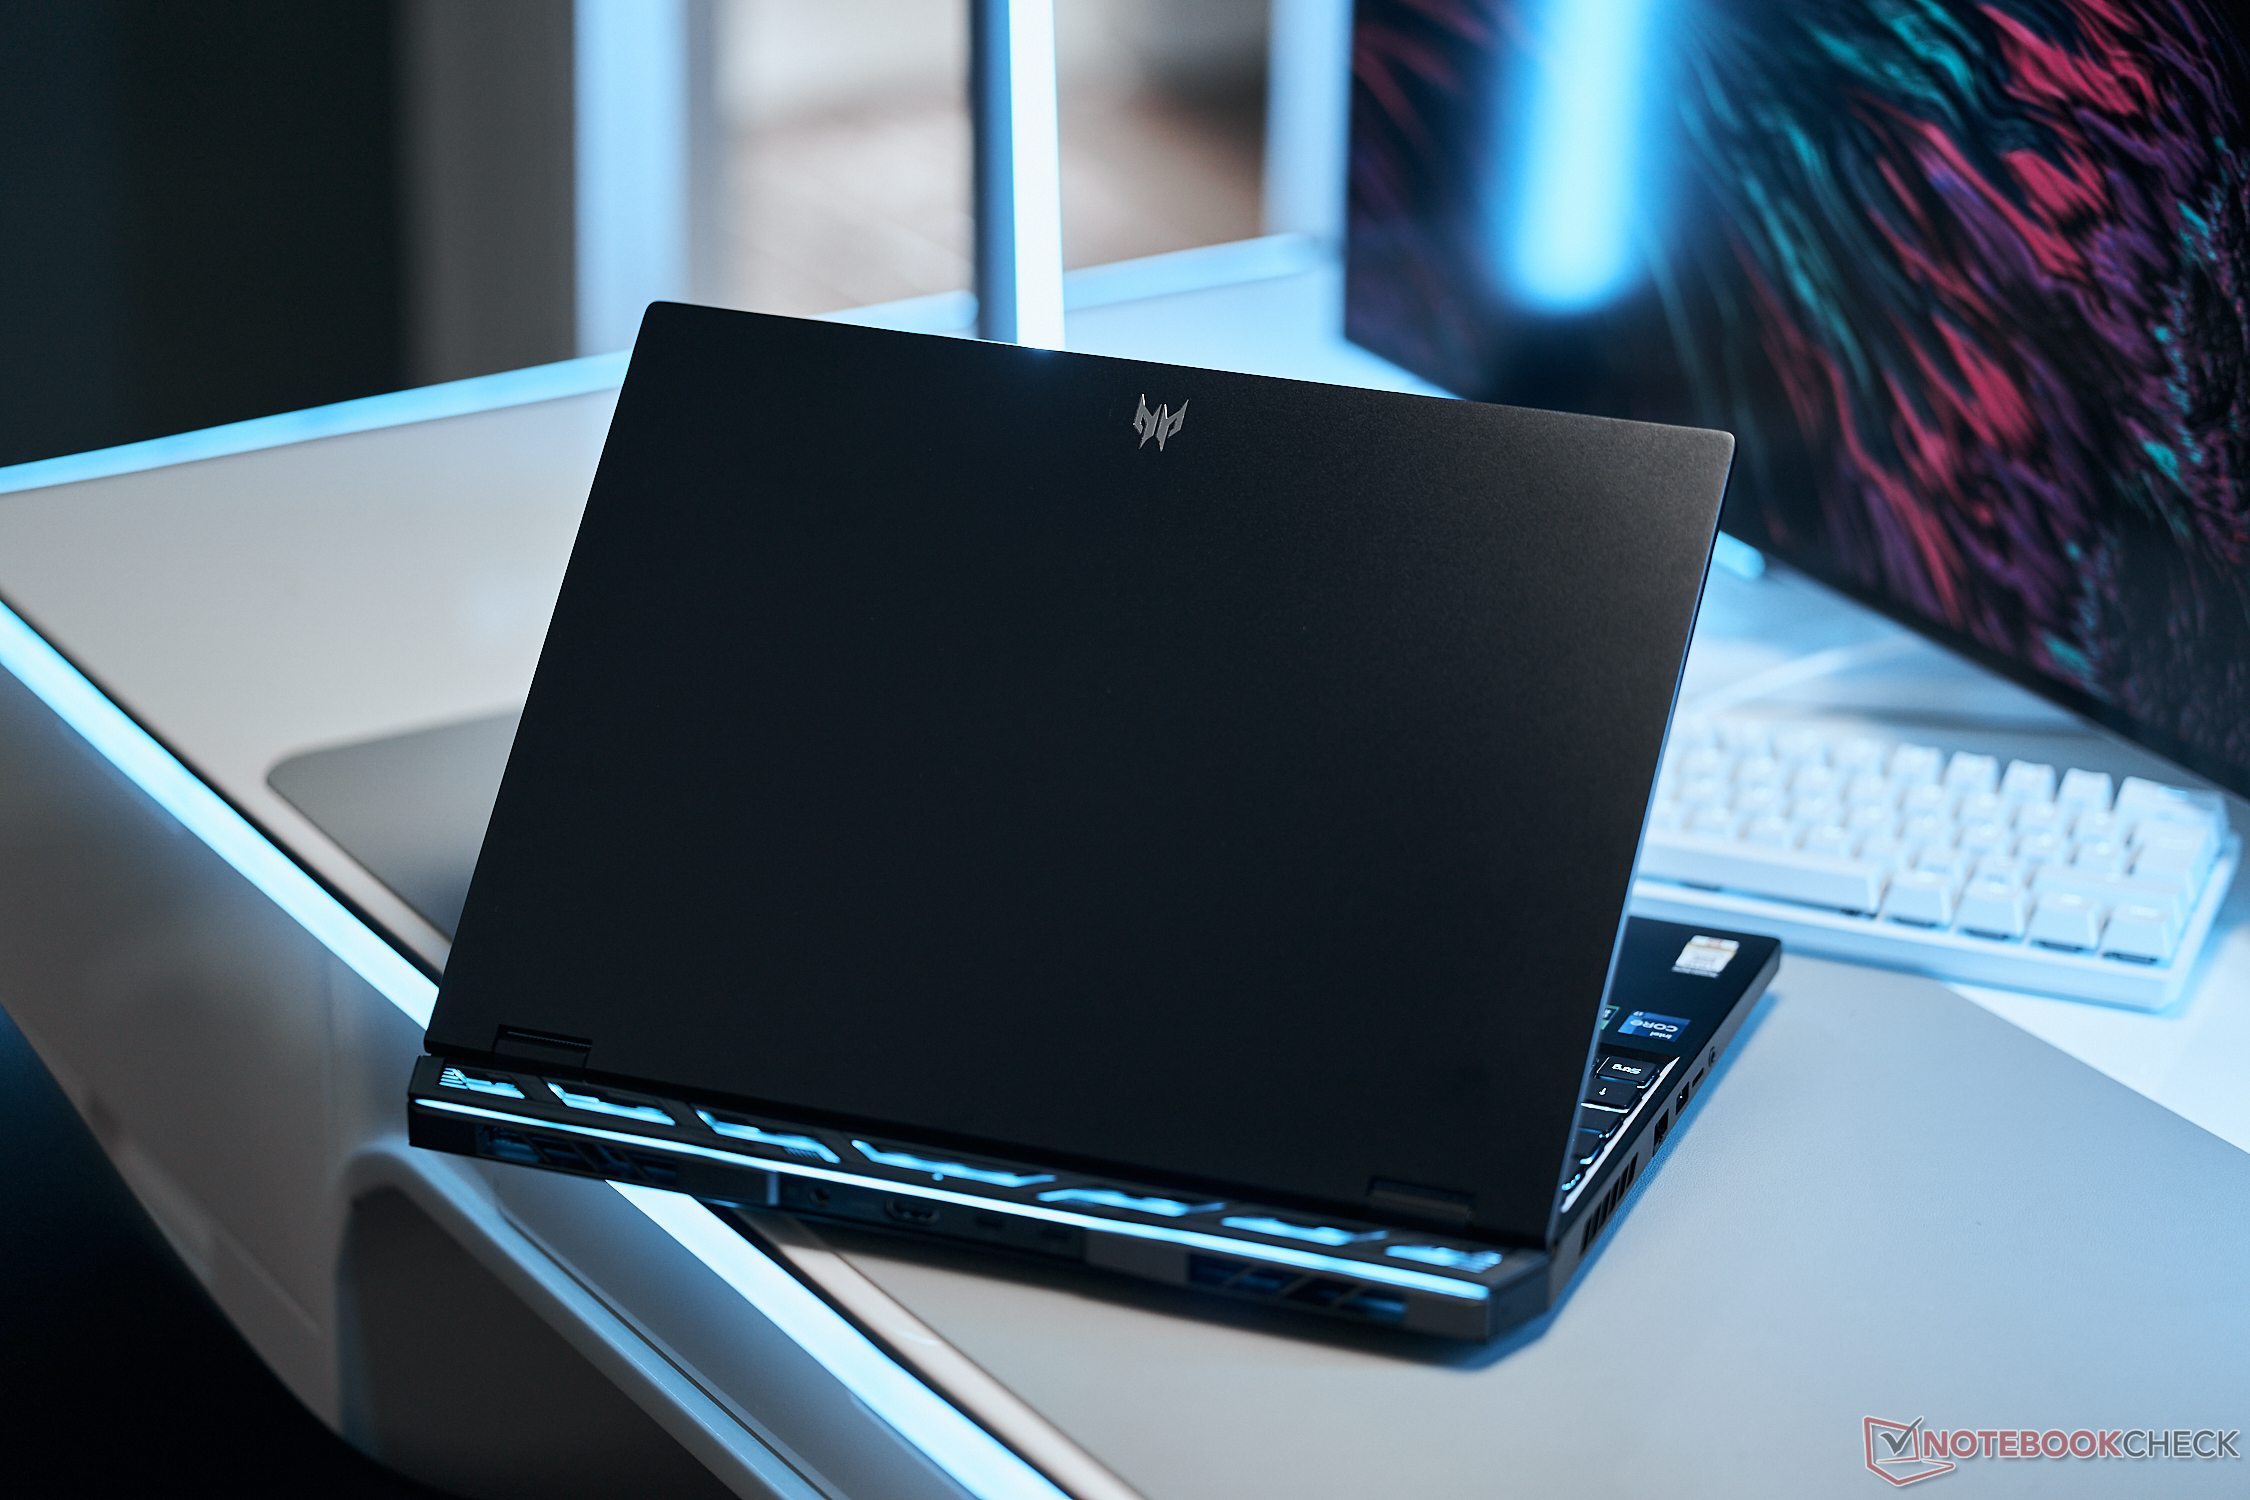
Just like its predecessor, the Helios 16 comes in matte black and is mostly made of brushed aluminum alloy with only the base unit and display's edge constructed from plastic in order to avoid the disadvantages associated with heat-conducting materials.
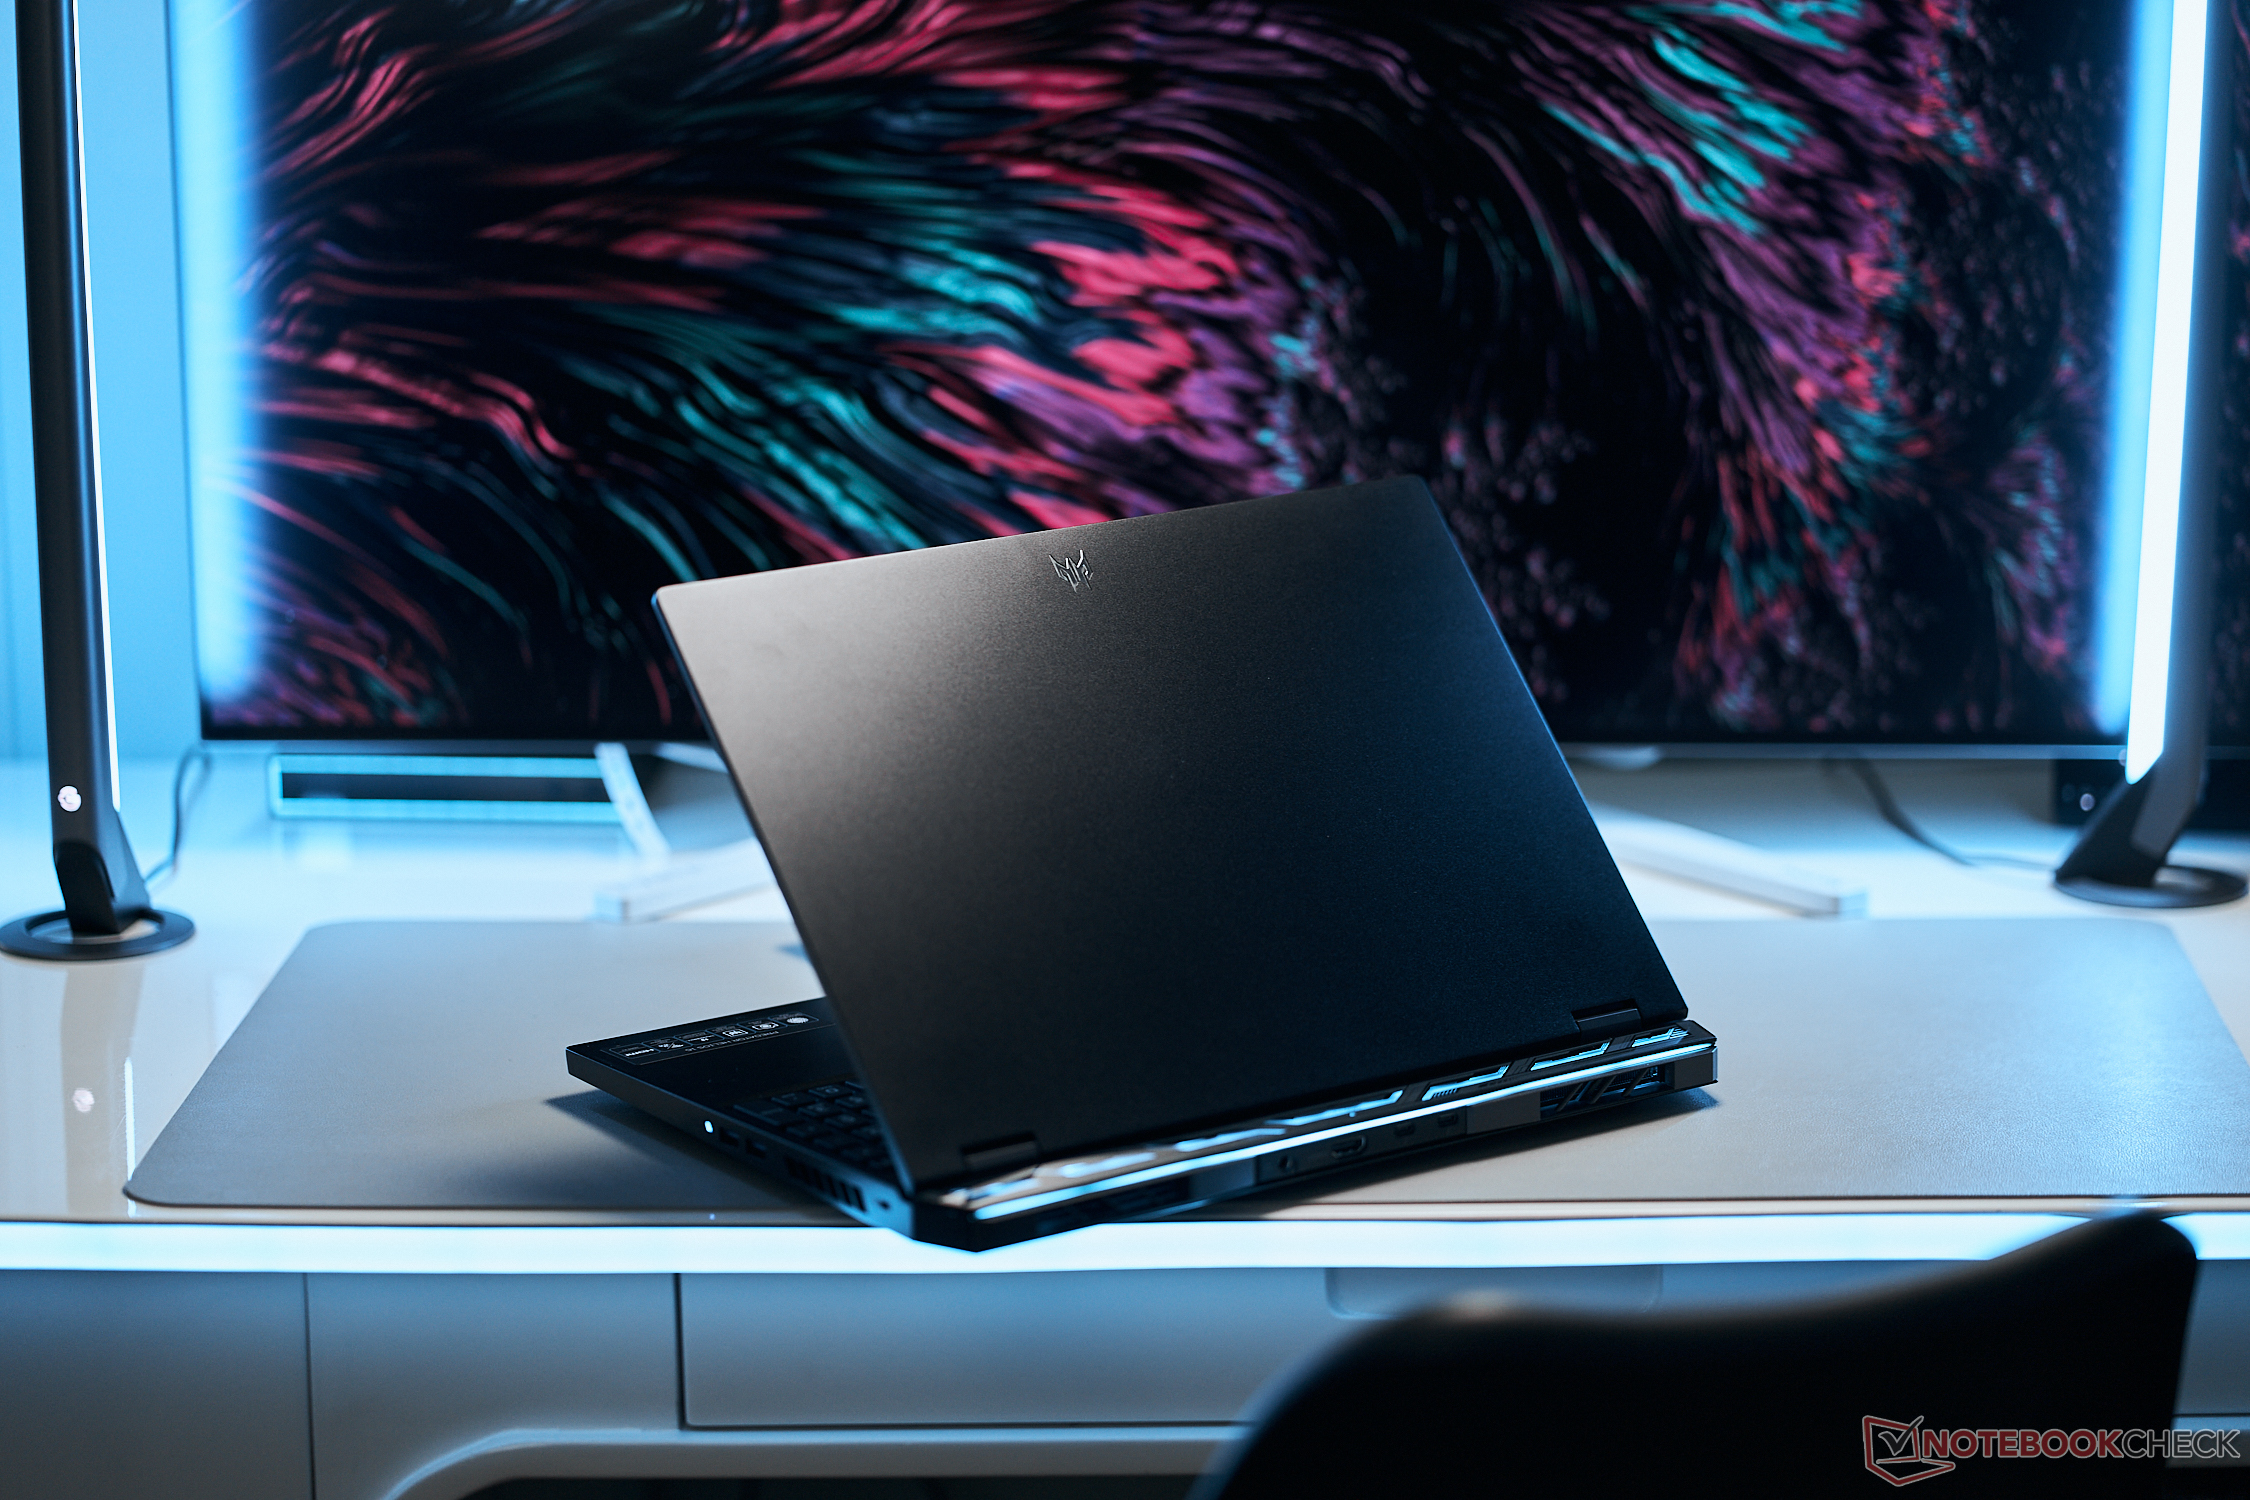
Accents, on an otherwise understated-looking exterior, come in the form of the sleek Predator logo on the display lid and bottom bezel as well as an LED-lit, backwards-facing cooling system. The smooth surfaces do a good job of attracting fingerprints while the fit and finish are flawless – no creaks here.
The base unit is very stable while the lid can be twisted slightly but we were unable to produce image distortions, even after applying targeted pressure. The hinges are secured very firmly, the lid hardly wobbles and can be opened with one hand to an angle of up to ~145°. Overall, the Predator Helios makes a very solid impression.


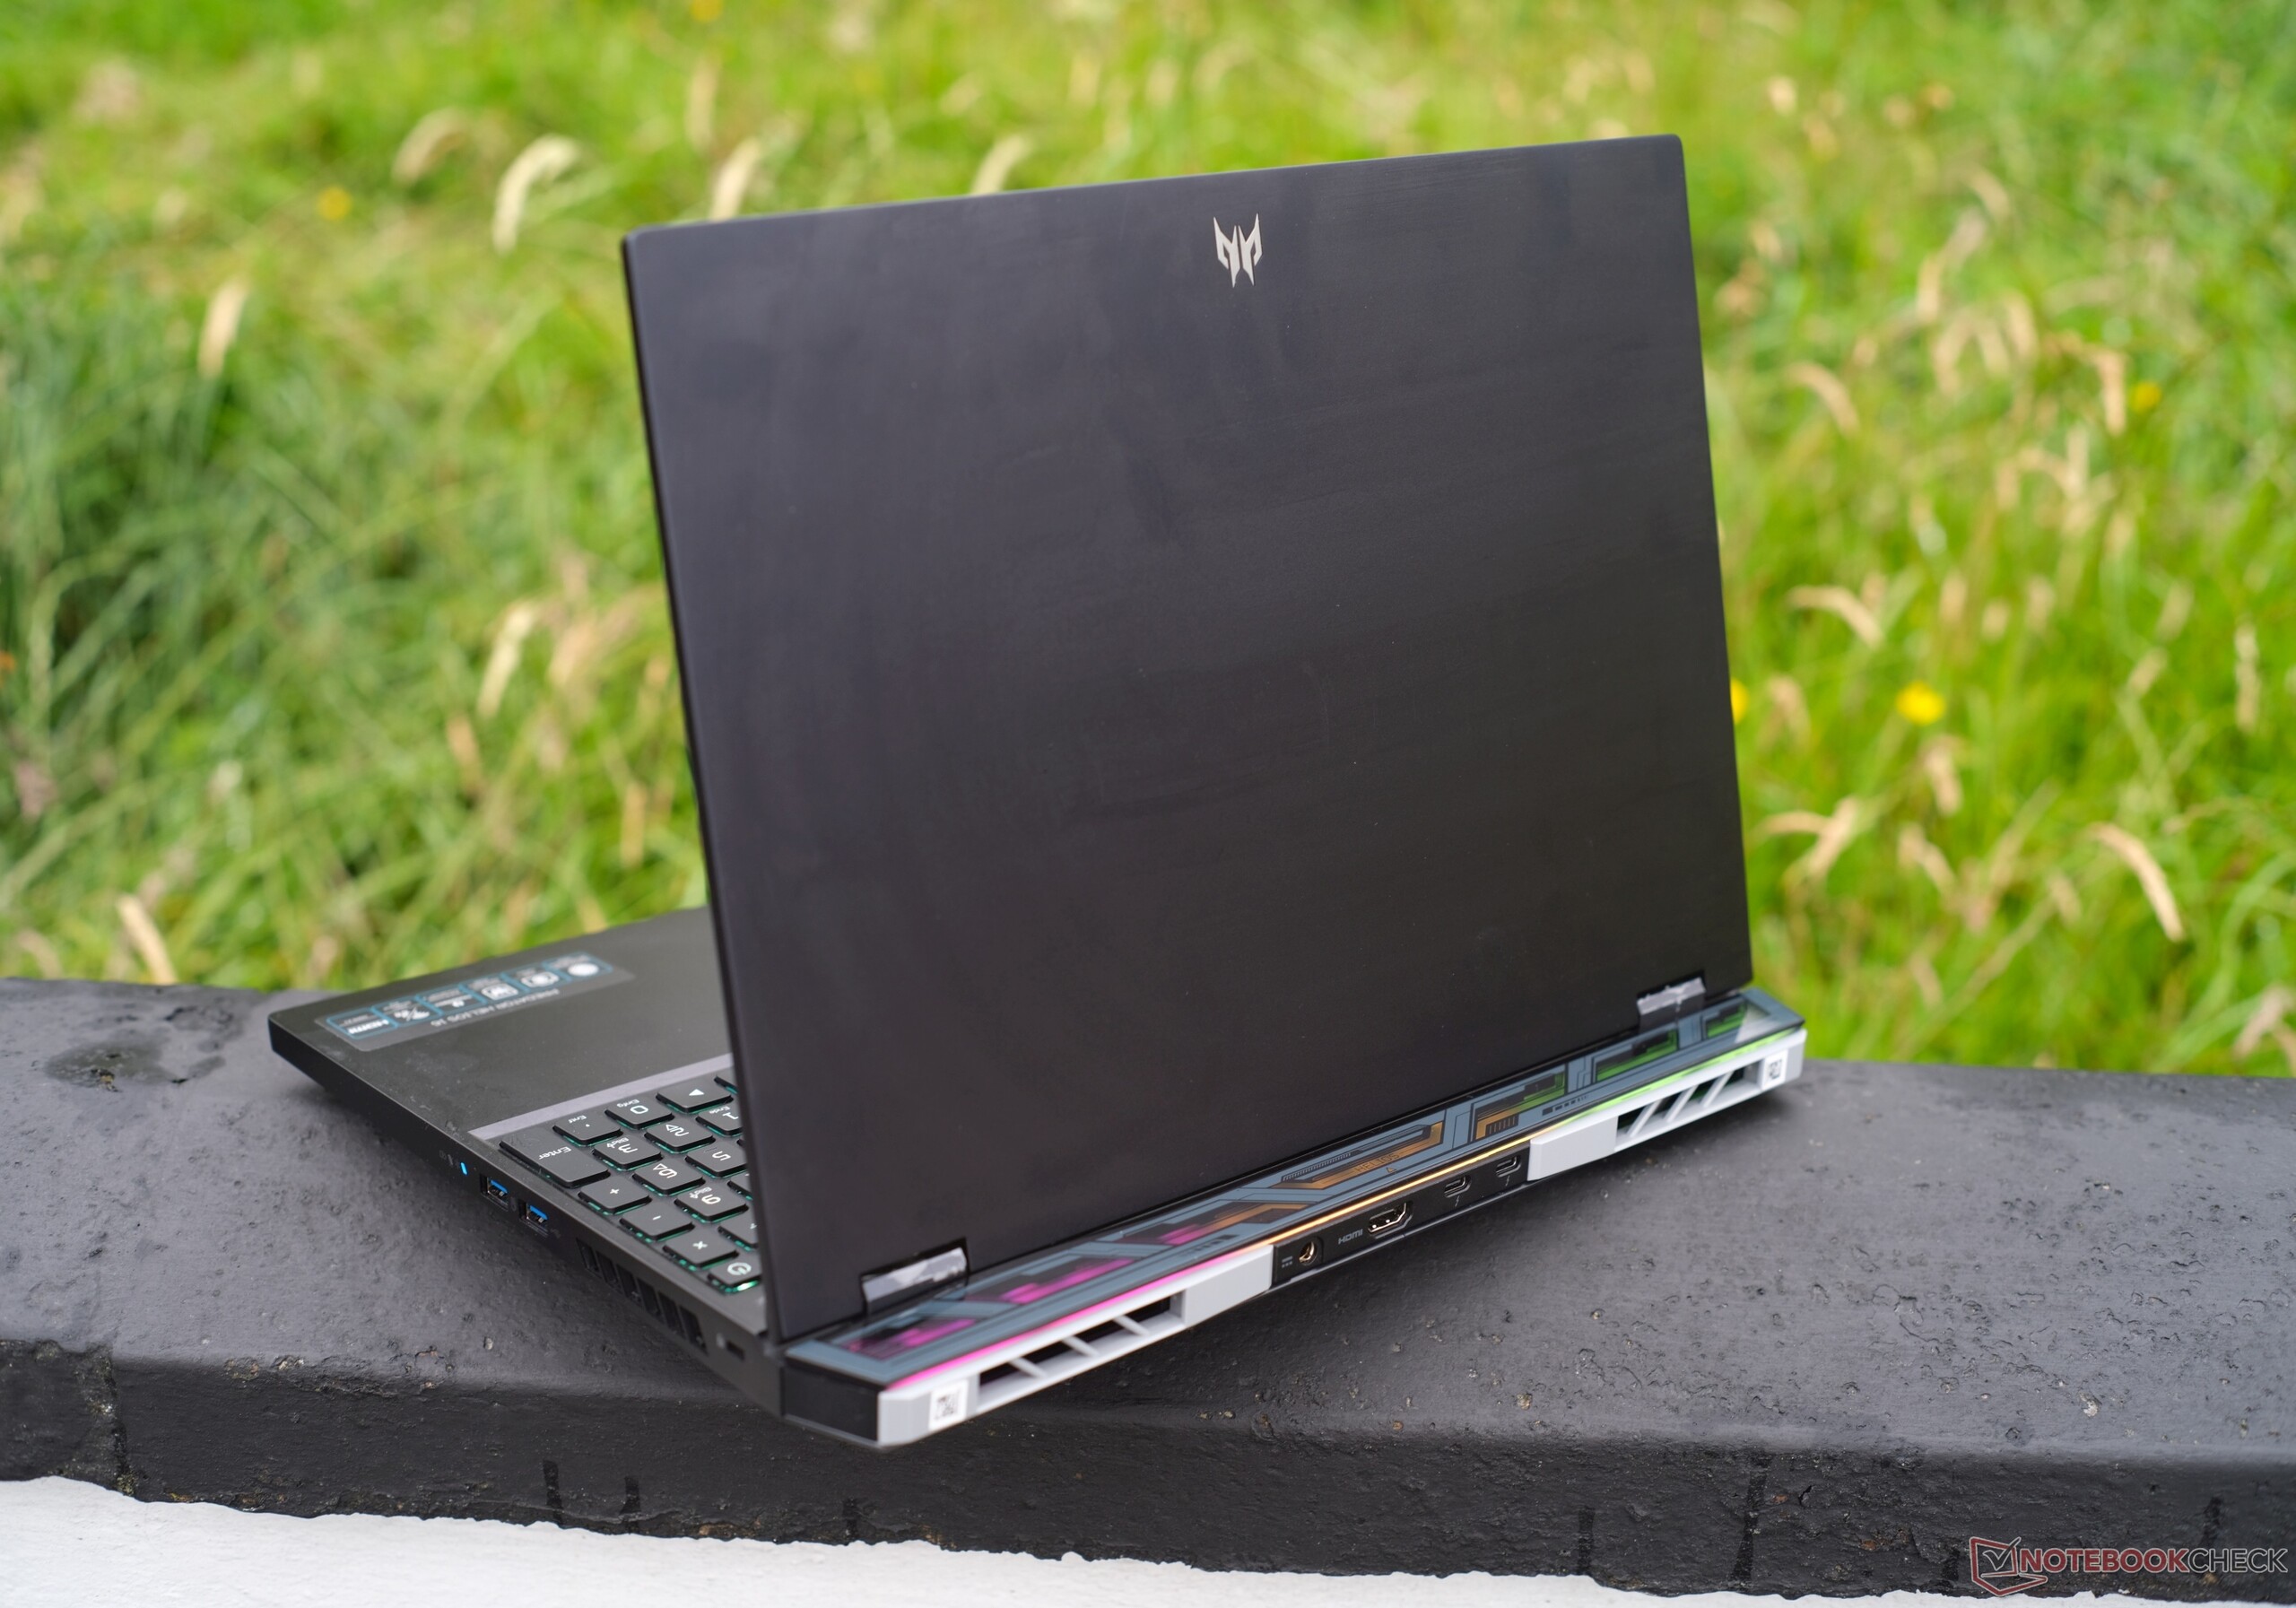
The Acer Predator Helios is around 27 mm thick and weighs just short of 2.6 kg. These vital statistics can be considered average for a gaming machine with such a potent cooling system. However, despite being the same height, at 2.2 kg, the Asus TUF Gaming A16 is significantly lighter while the 19.7 mm-thick Gigabyte Aorus 15X is considerably thinner in spite of having the same TGP.
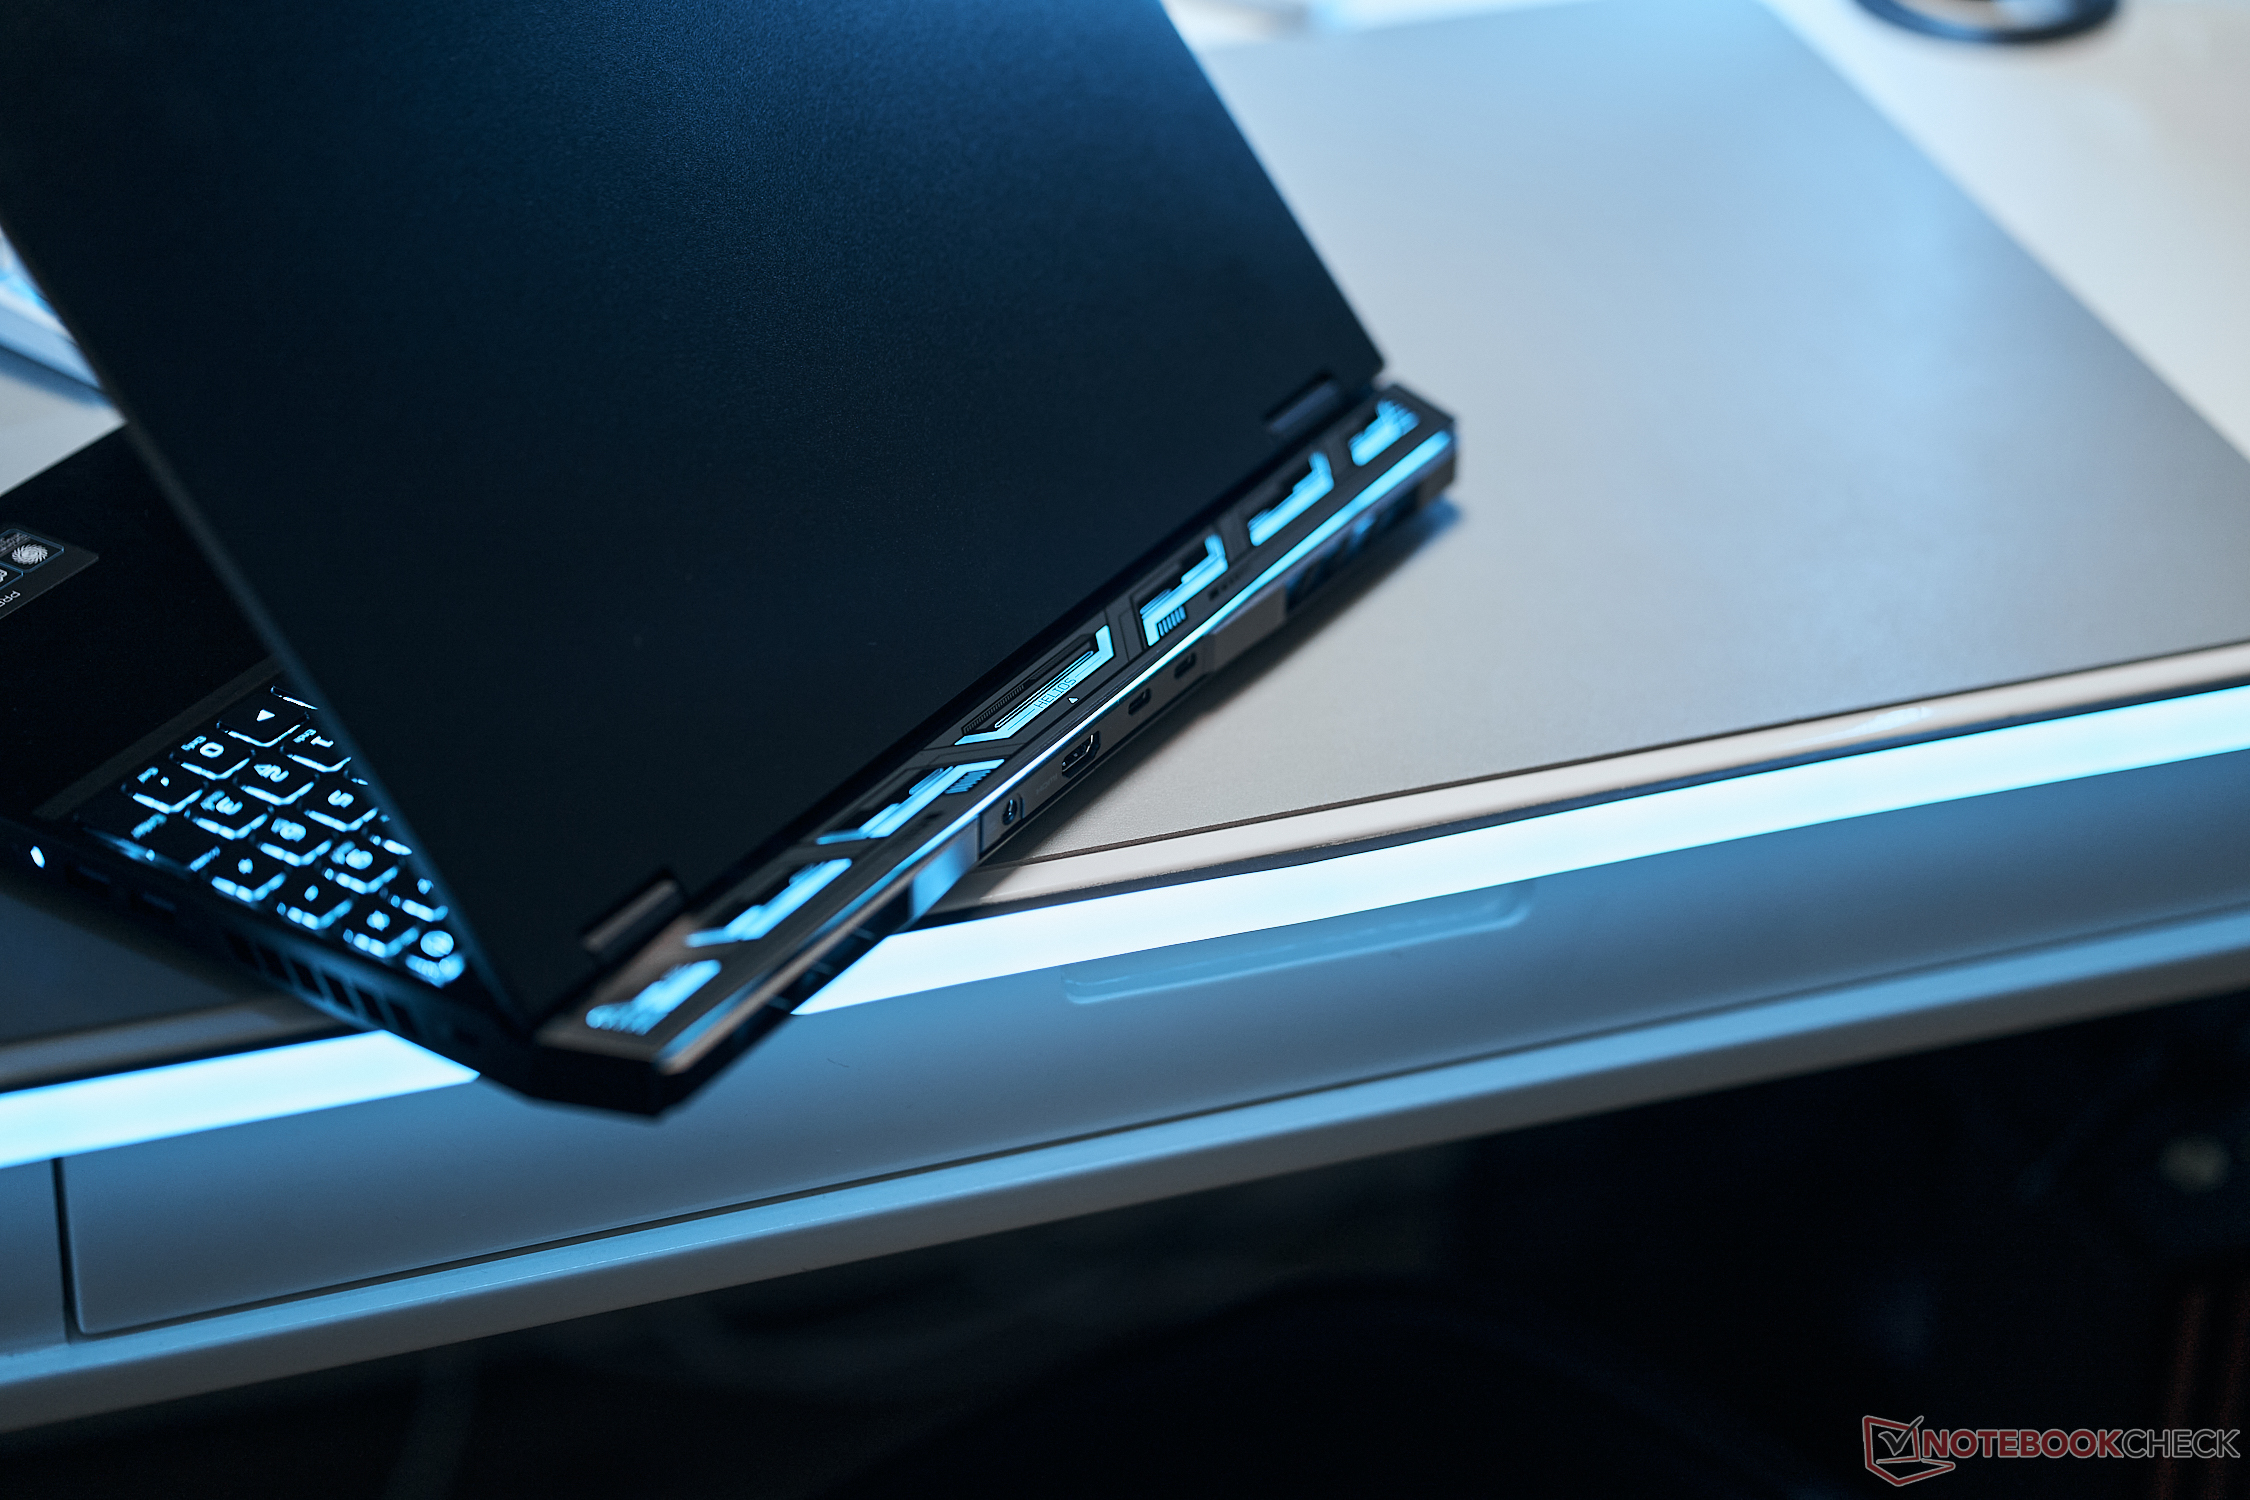
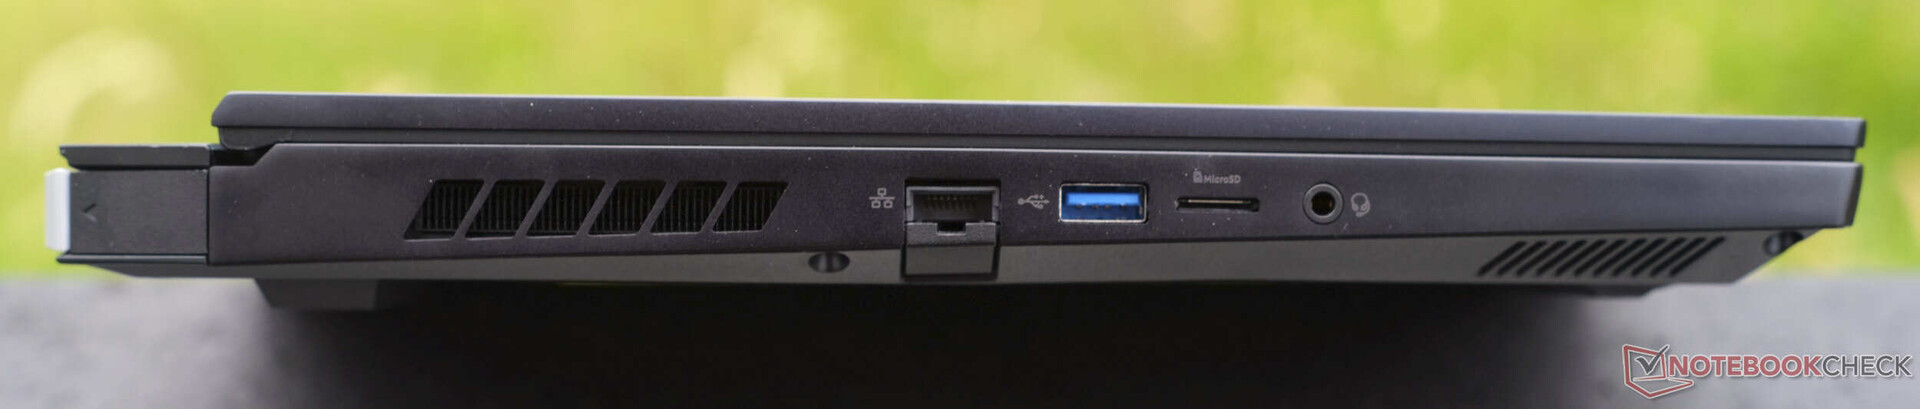
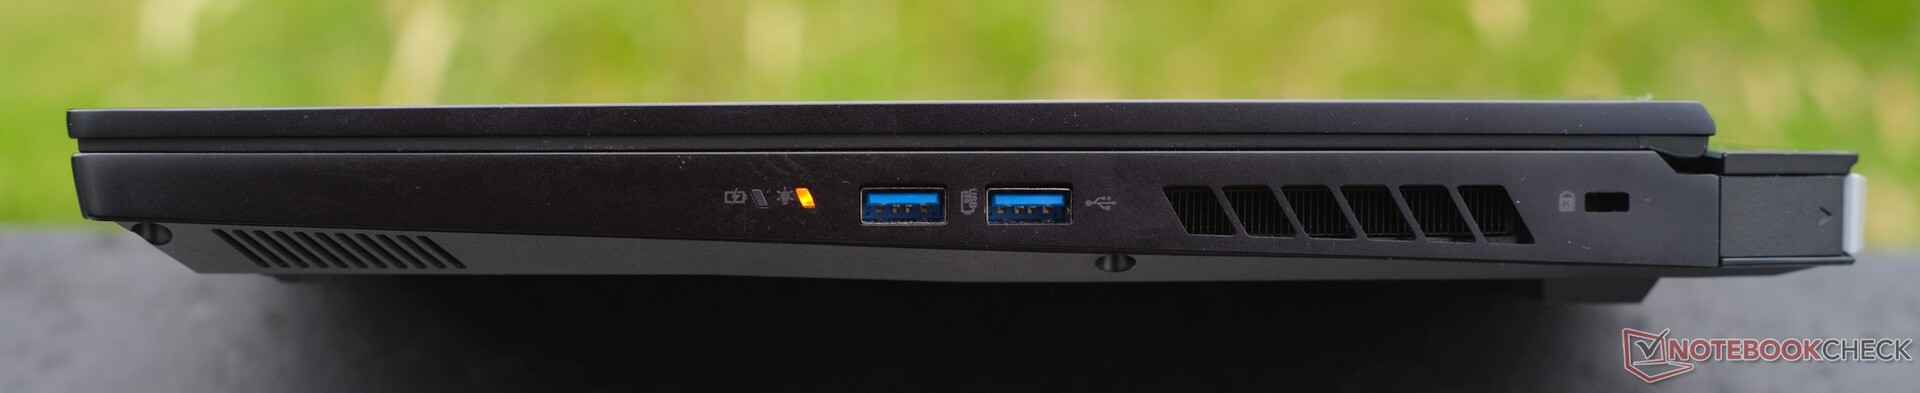
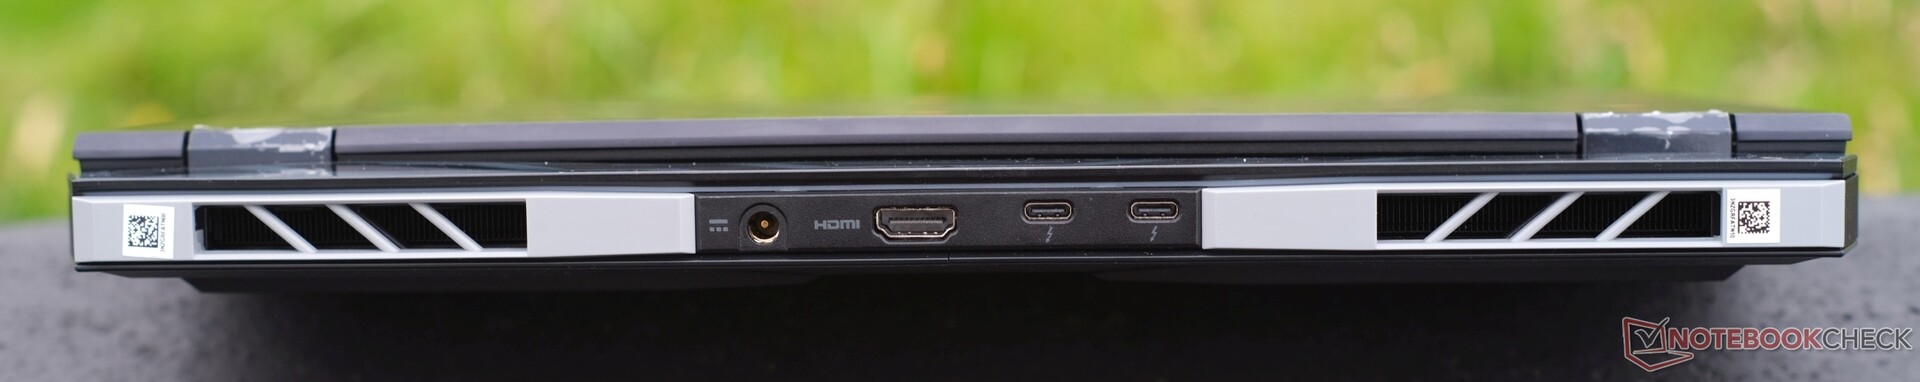
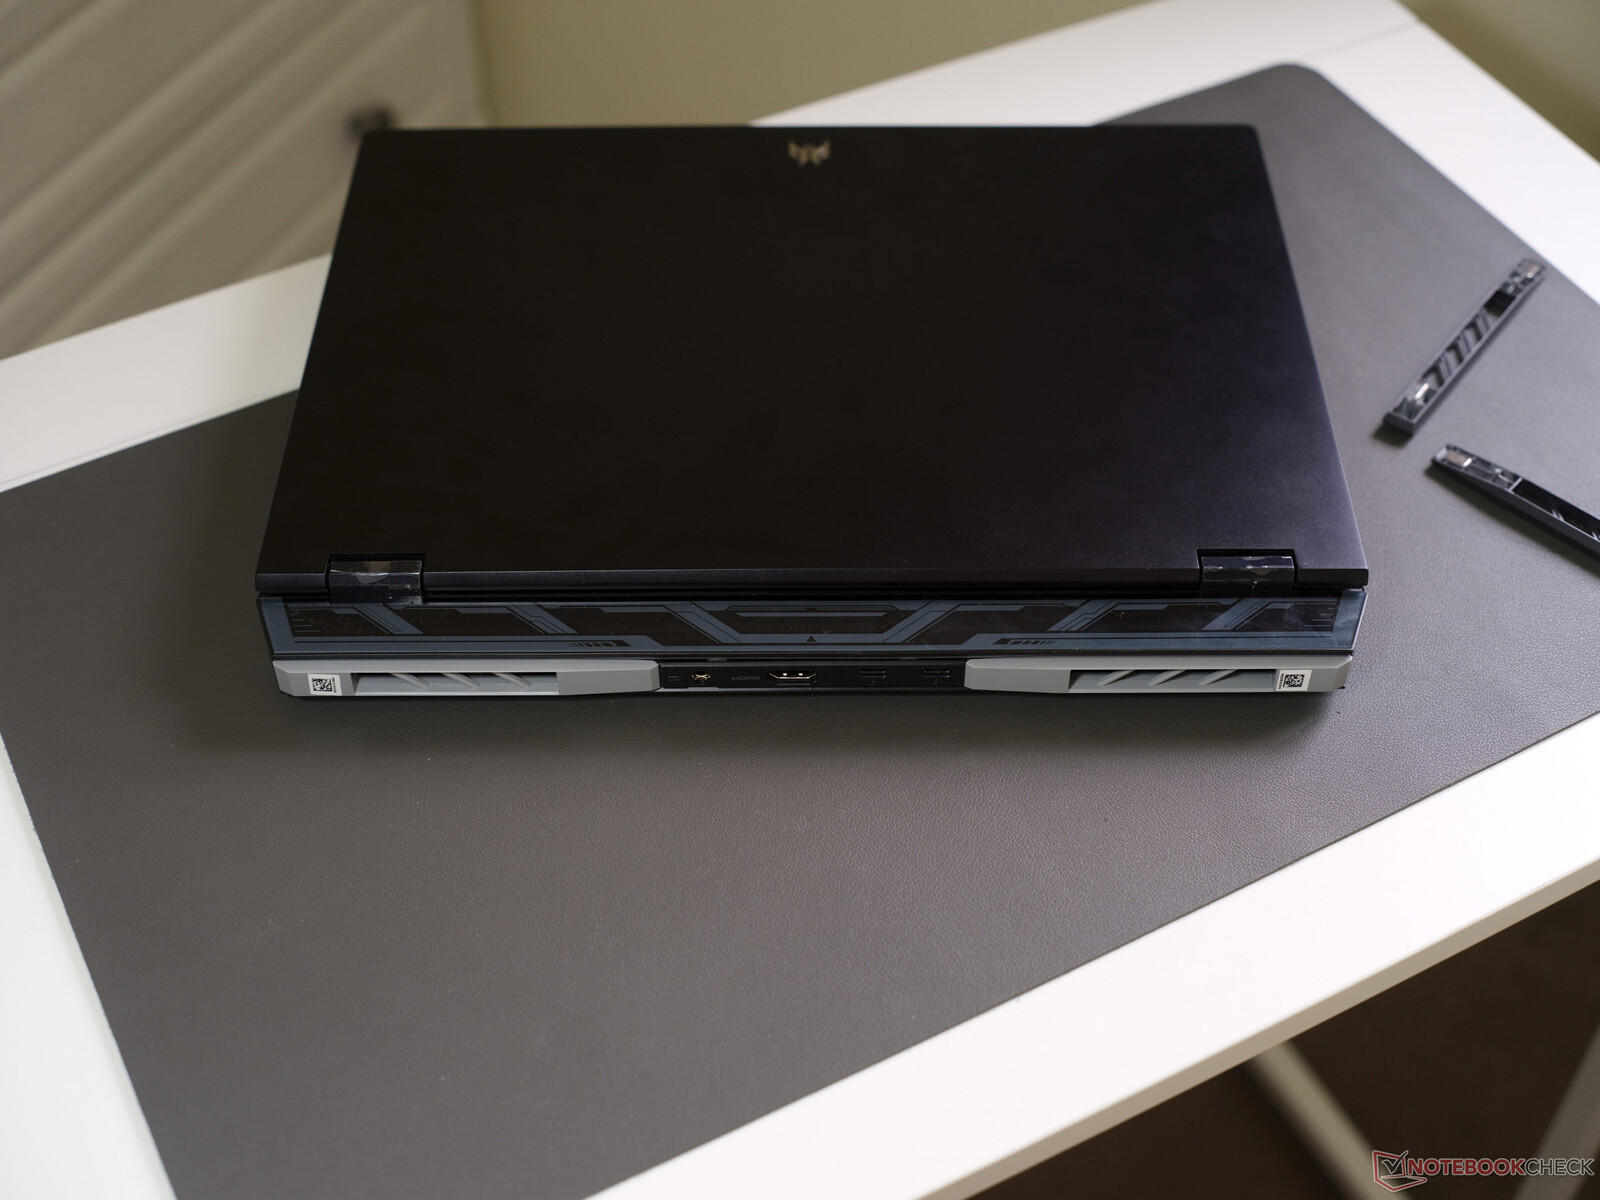
Features: The Helios 16 offers a generous selection of ports and fast Killer Wi-Fi
The Acer gaming laptop has numerous ports including 5x USB. On the left, there is 1x USB-A 3.1 (5 GBit/s), on the right, 2x USB-A 3.2 (10 GBit/s) as well as 2x Thunderbolt 4 on the rear that include DisplayPort 1.4 and Power Delivery (100 watts). The laptop is also home to Gigabit ethernet, a microSD card reader, a 3.5 mm audio jack, a Kensington lock, HDMI 2.1 and the charging connector.
SD card reader
Paired with our AV PRO microSD 128 GB V60 reference card, the microSD card reader is not necessarily slow but also not very fast and this is a pity considering the Helios 16's price tag. However, the devices in our field of competitors (at least the ones equipped with a card reader), read and copy data similarly fast.
| SD Card Reader | |
| average JPG Copy Test (av. of 3 runs) | |
| Average of class Gaming (20.9 - 210, n=55, last 2 years) | |
| Lenovo Legion S7 16ARHA7 (AV PRO microSD 128 GB V60) | |
| Medion Erazer Defender P40 (AV PRO microSD 128 GB V60) | |
| Acer Nitro 16 AN16-41 (AV Pro SD microSD 128 GB V60) | |
| HP Omen 17-ck2097ng (AV PRO microSD 128 GB V60) | |
| Acer Predator Helios 16 PH16-71-731Q | |
| maximum AS SSD Seq Read Test (1GB) | |
| Average of class Gaming (25.5 - 261, n=52, last 2 years) | |
| Medion Erazer Defender P40 (AV PRO microSD 128 GB V60) | |
| Lenovo Legion S7 16ARHA7 (AV PRO microSD 128 GB V60) | |
| Acer Predator Helios 16 PH16-71-731Q | |
| Acer Nitro 16 AN16-41 (AV Pro SD microSD 128 GB V60) | |
| HP Omen 17-ck2097ng (AV PRO microSD 128 GB V60) | |
Communication
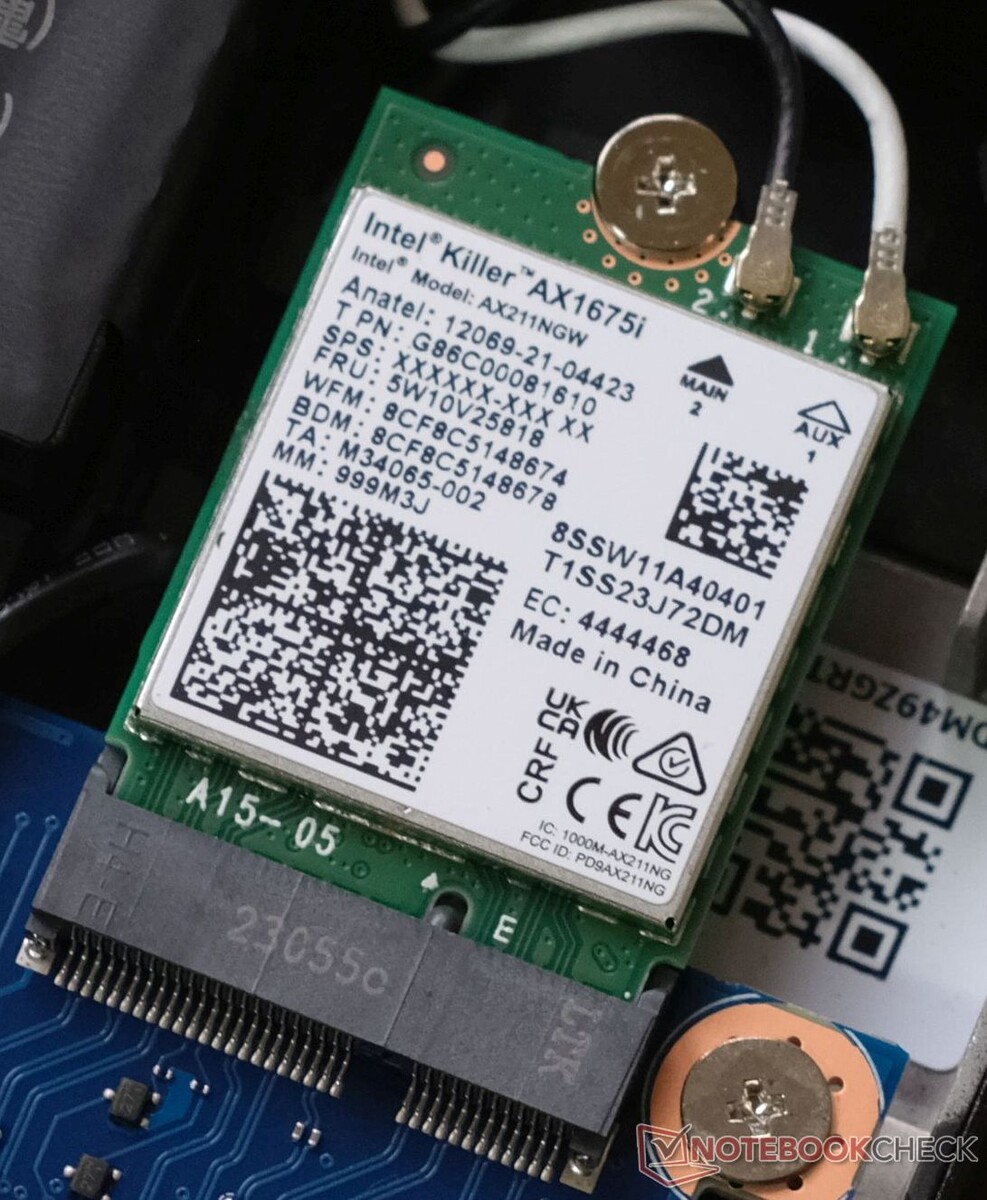
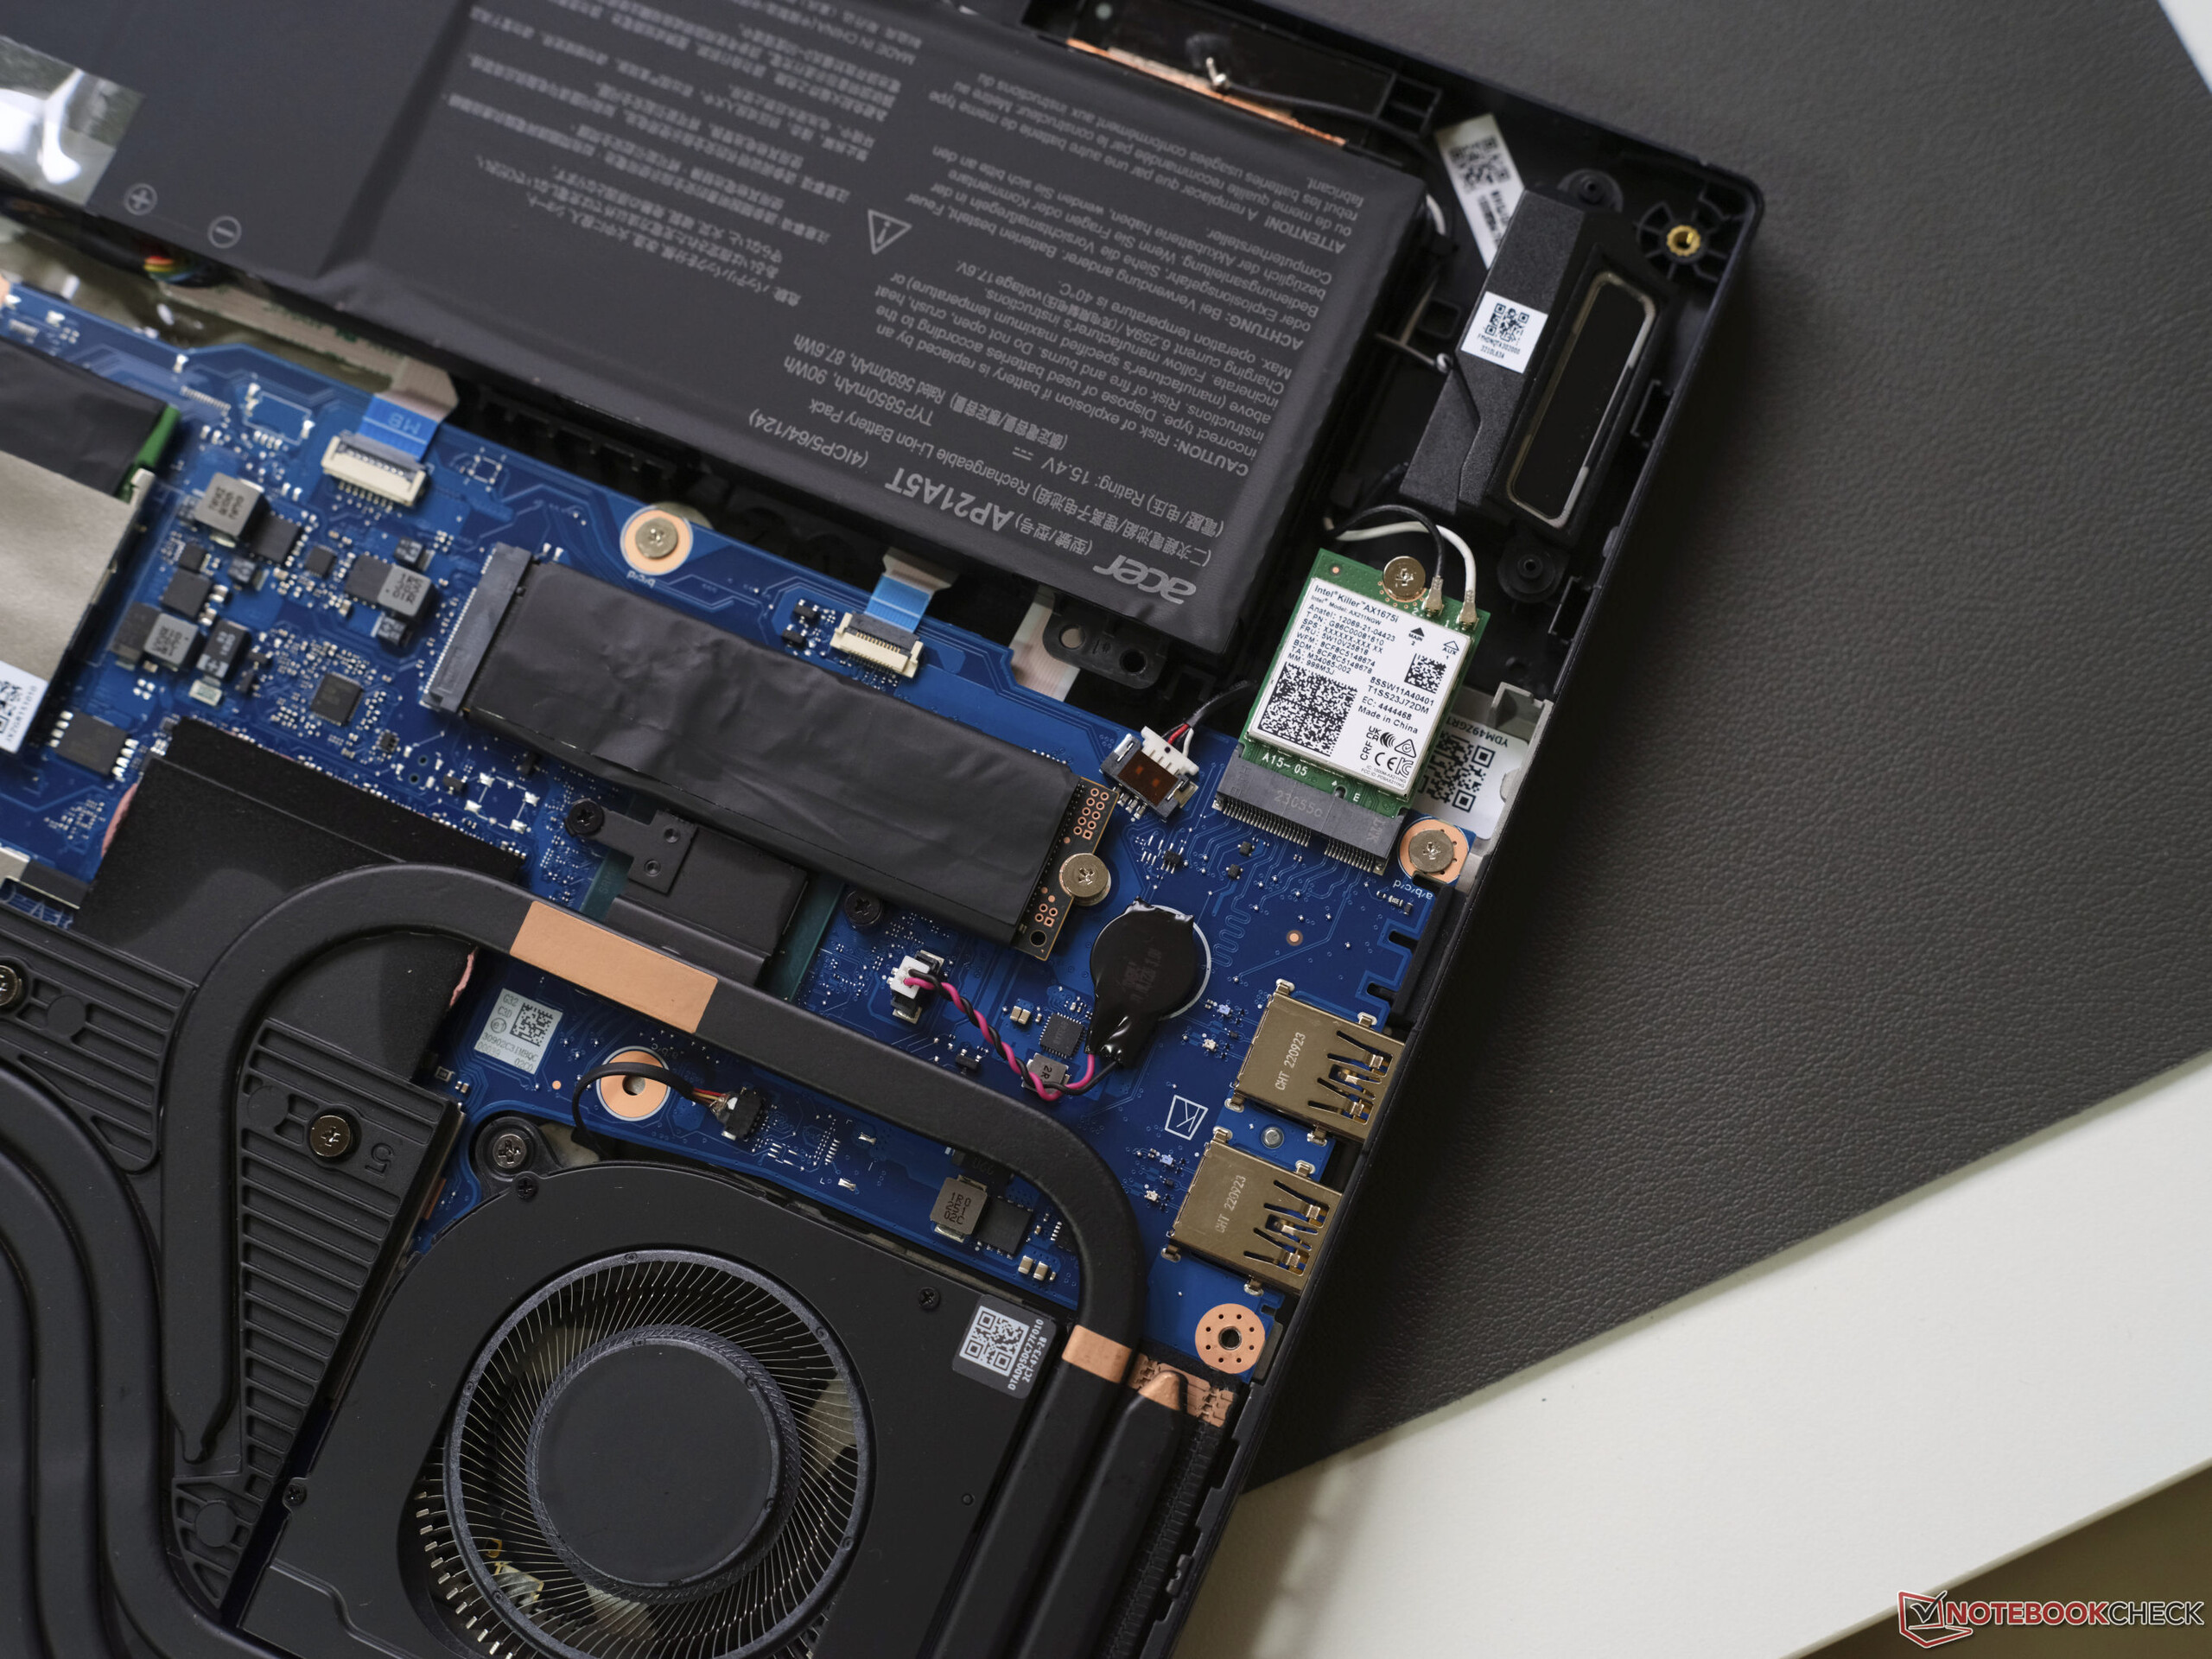
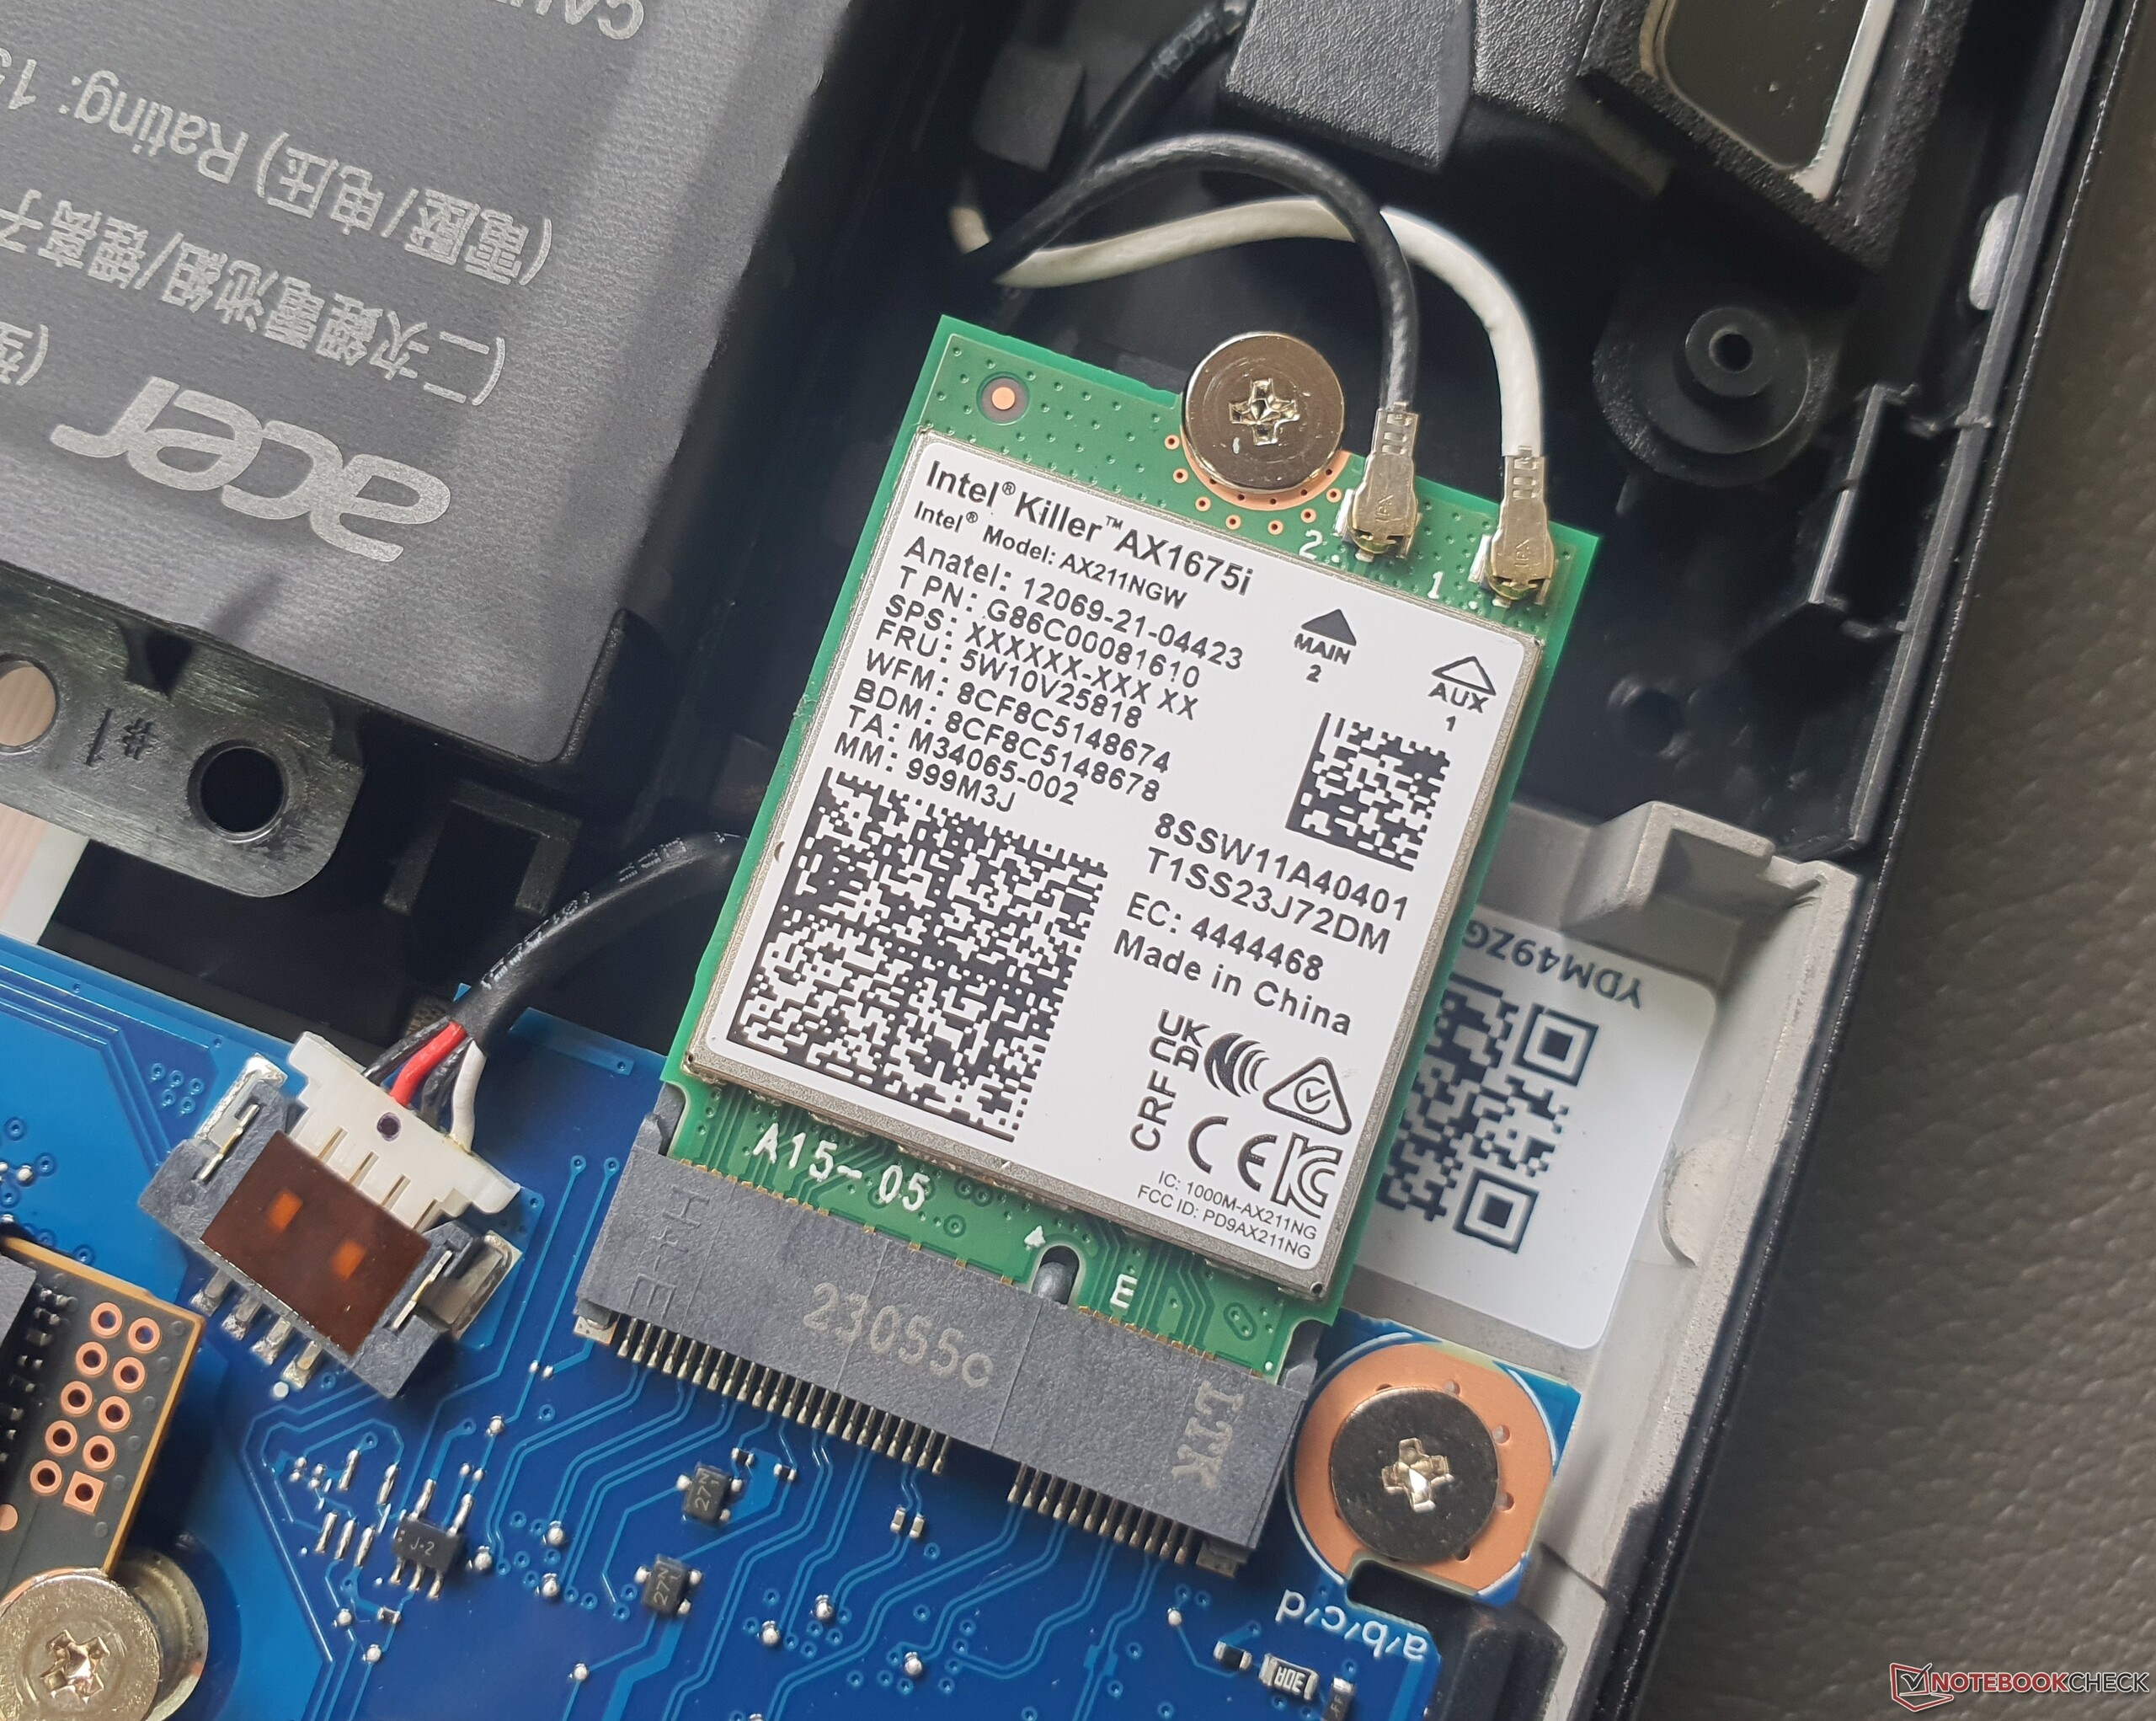
The Intel Killer AX1675i Wi-Fi 6E chip is responsible for wireless network transmission, operating at a top speed of up to 1.6 GBit/s and is quicker than the installed Gigabit RJ45 port (Killer 2600) allows since it doesn't support 2.5 GBit/s. In particular, the Legion Pro 5 16 and the TUF Gaming A16 lag some distance behind the Helios 16. Bluetooth 5.2 is on board.
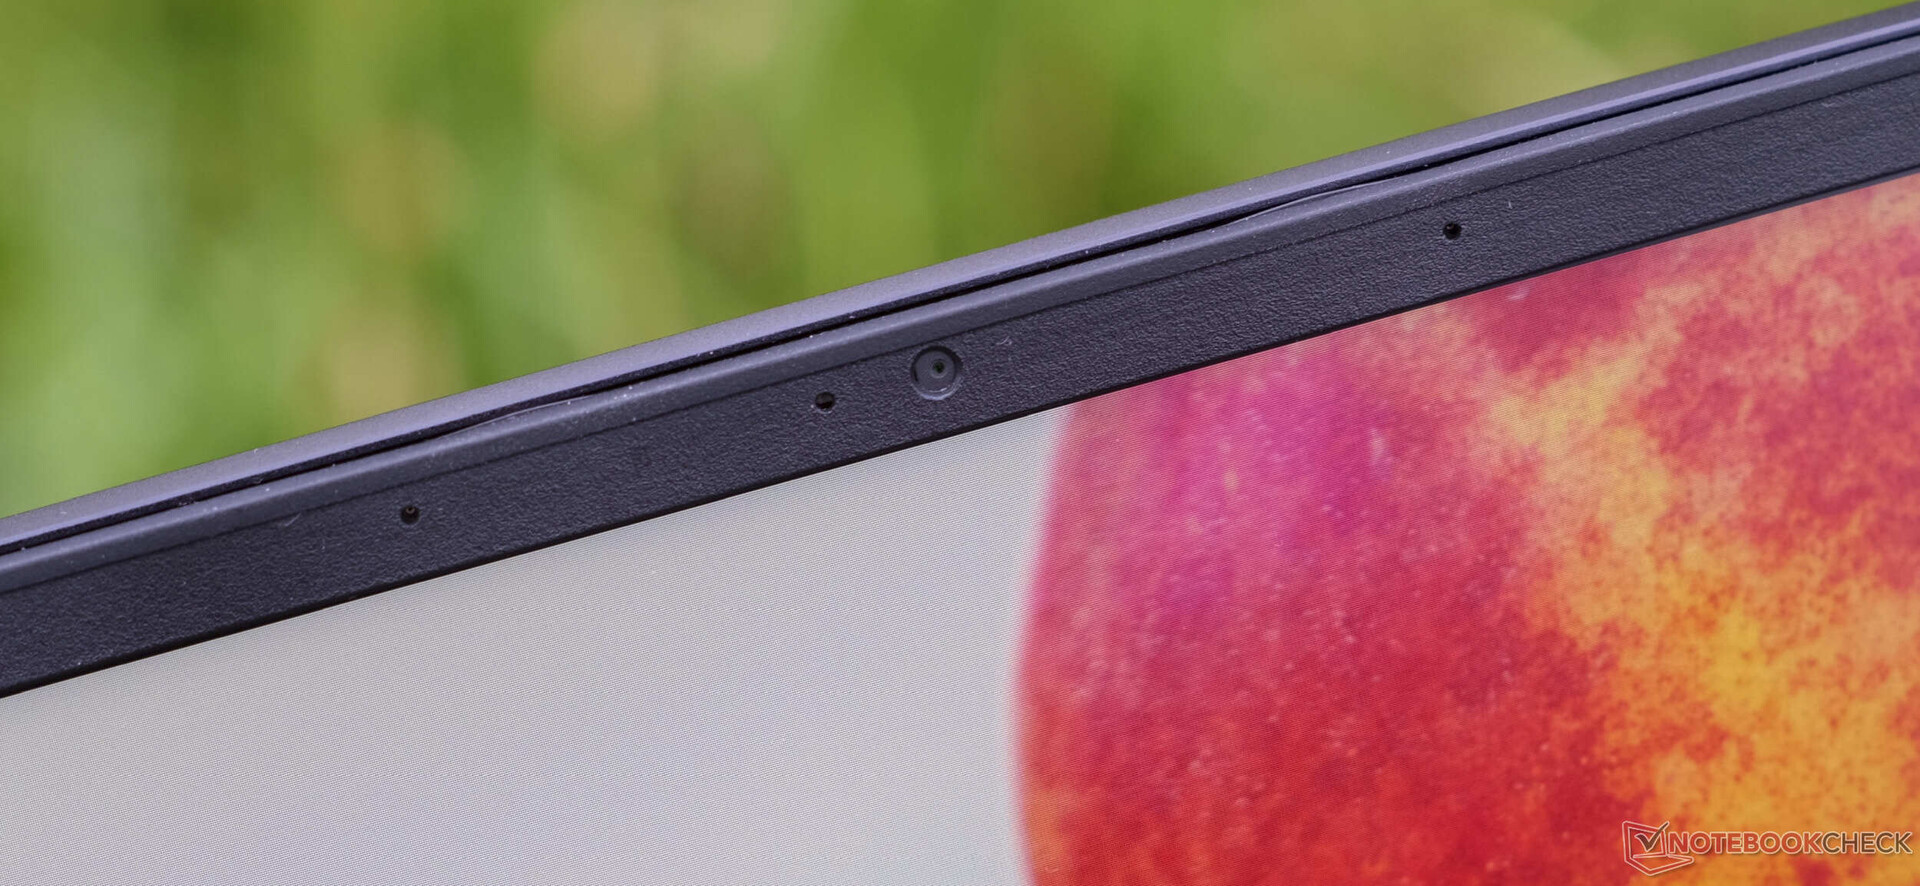
Webcam
Under good lighting conditions, the 1080p webcam delivers very good images. Confronted with a backlight (in this case, coming from a side window with no additional light sources), there is a drastic reduction in quality. Windows Hello is supported but a physical camera shutter is absent.


Accessories

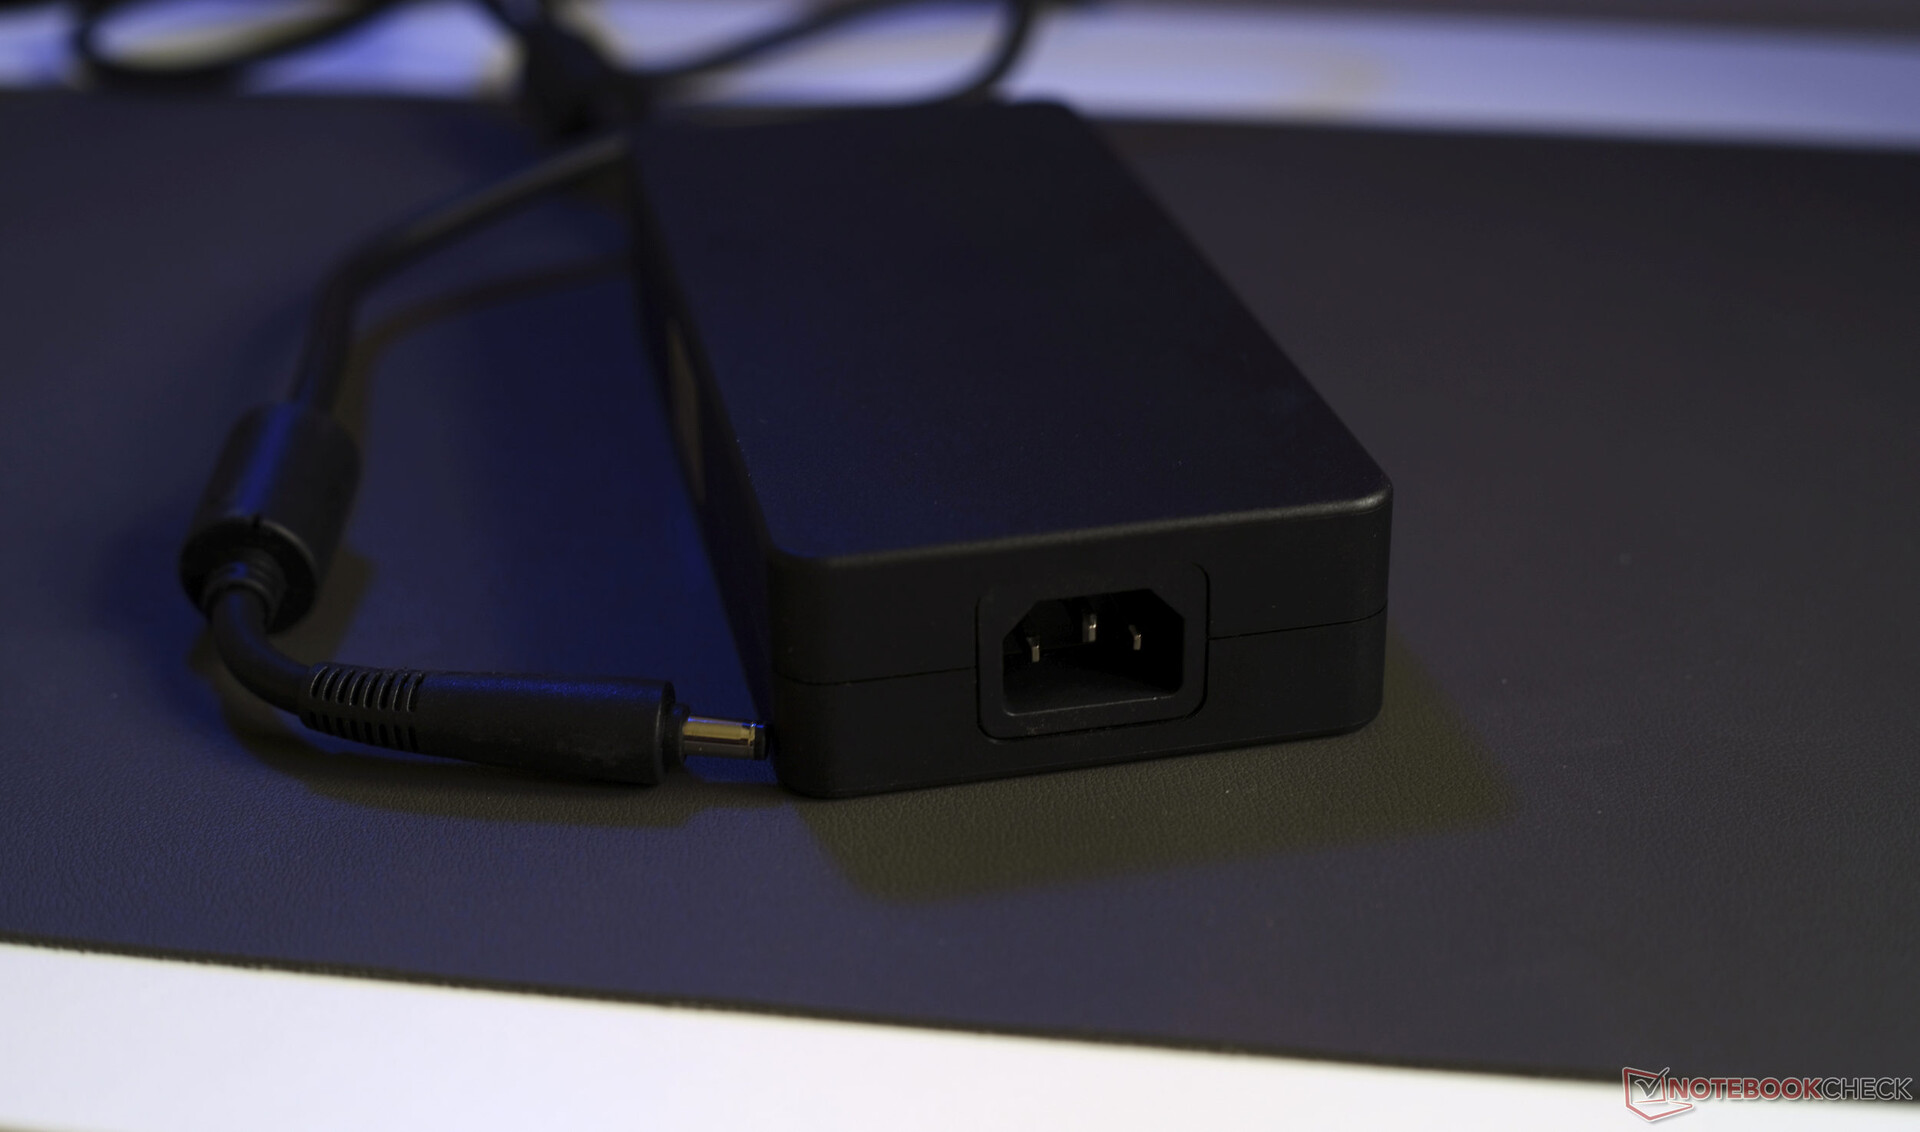
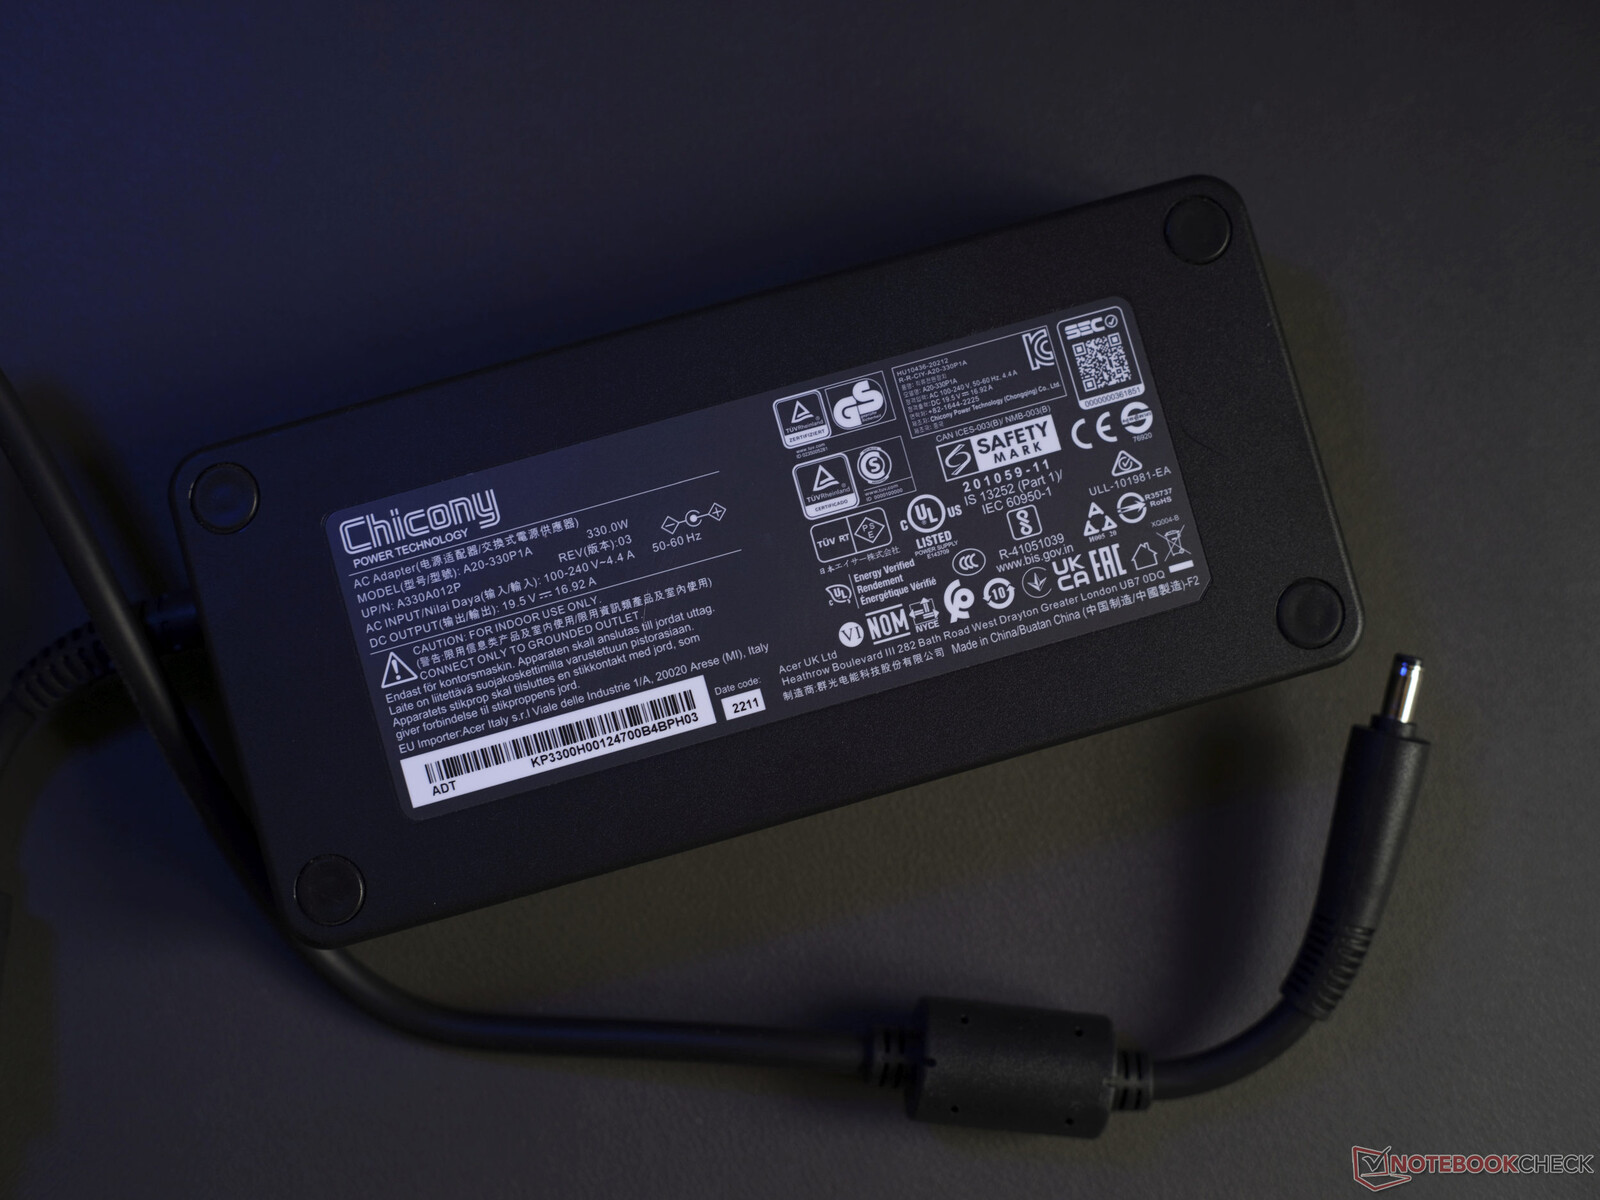
Acer has included two additional light gray magnetic fan grills in order to replace the preinstalled dark gray ones. More adventurous color accents would have been fun. Apart from that, there is only the 330-watt PSU. The manufacturer has not gone for environmentally friendly packaging.
The photos on the right apply to the Predator gaming package currently available on the German Acer store.
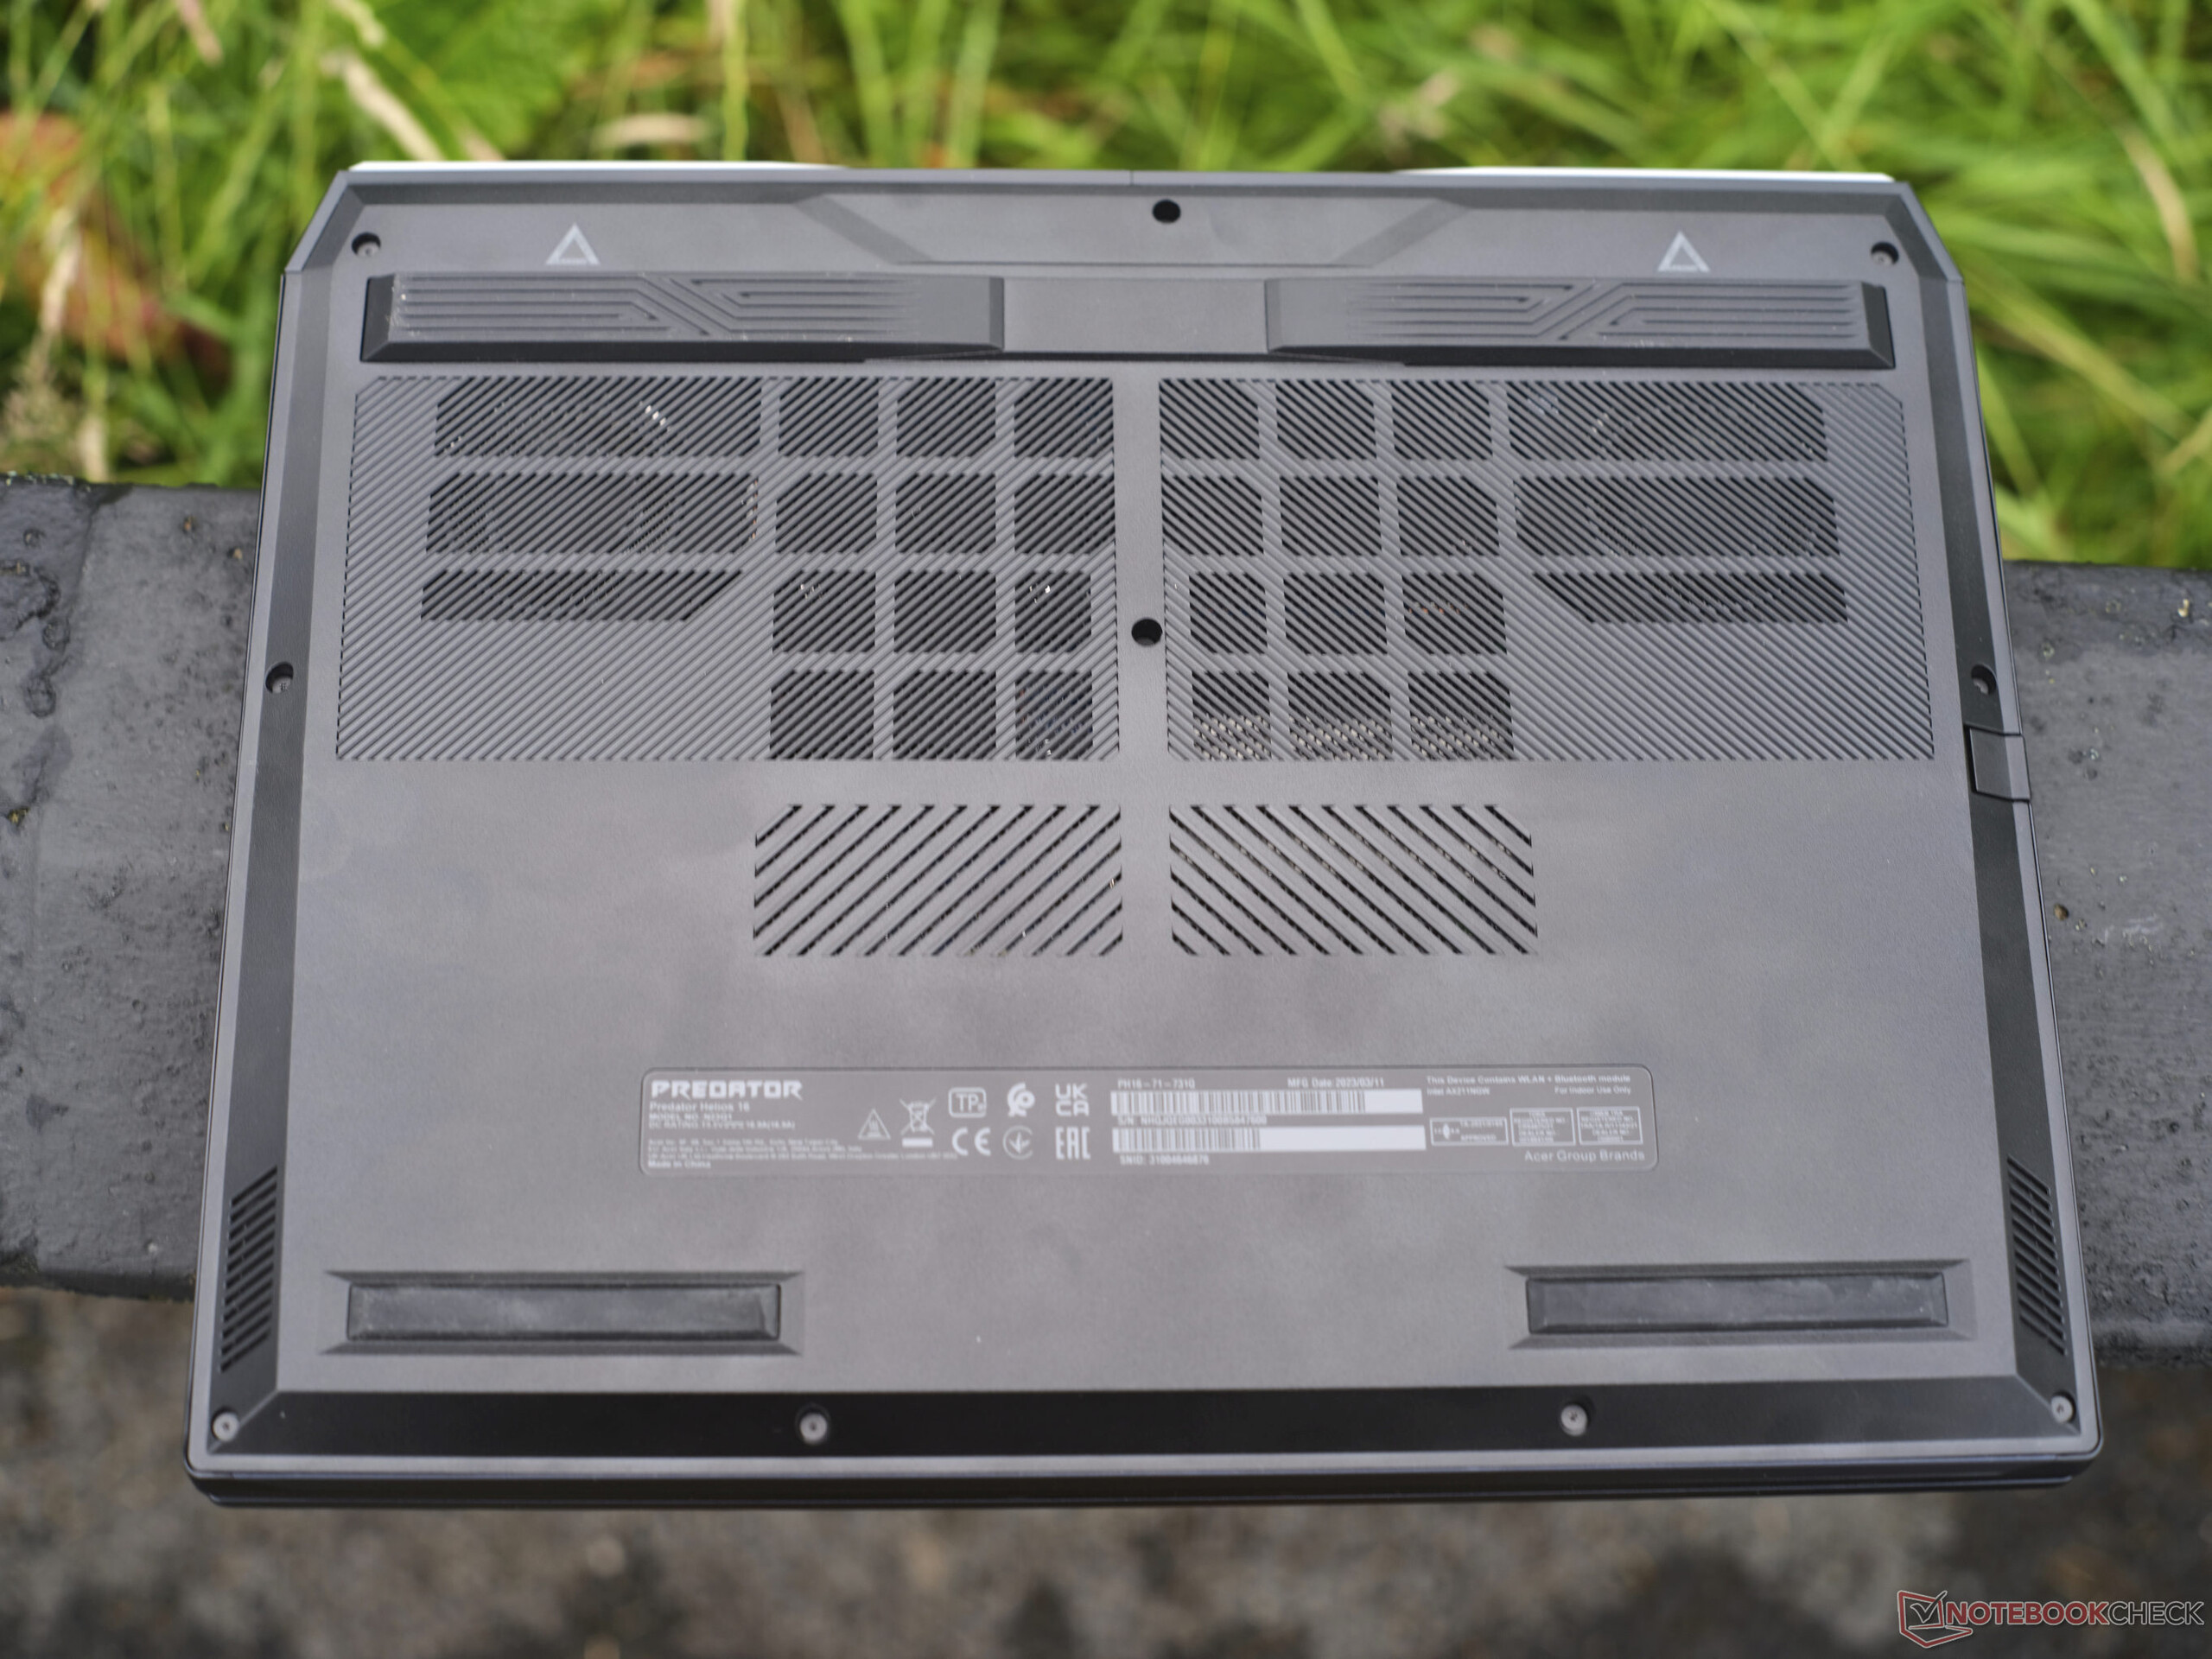
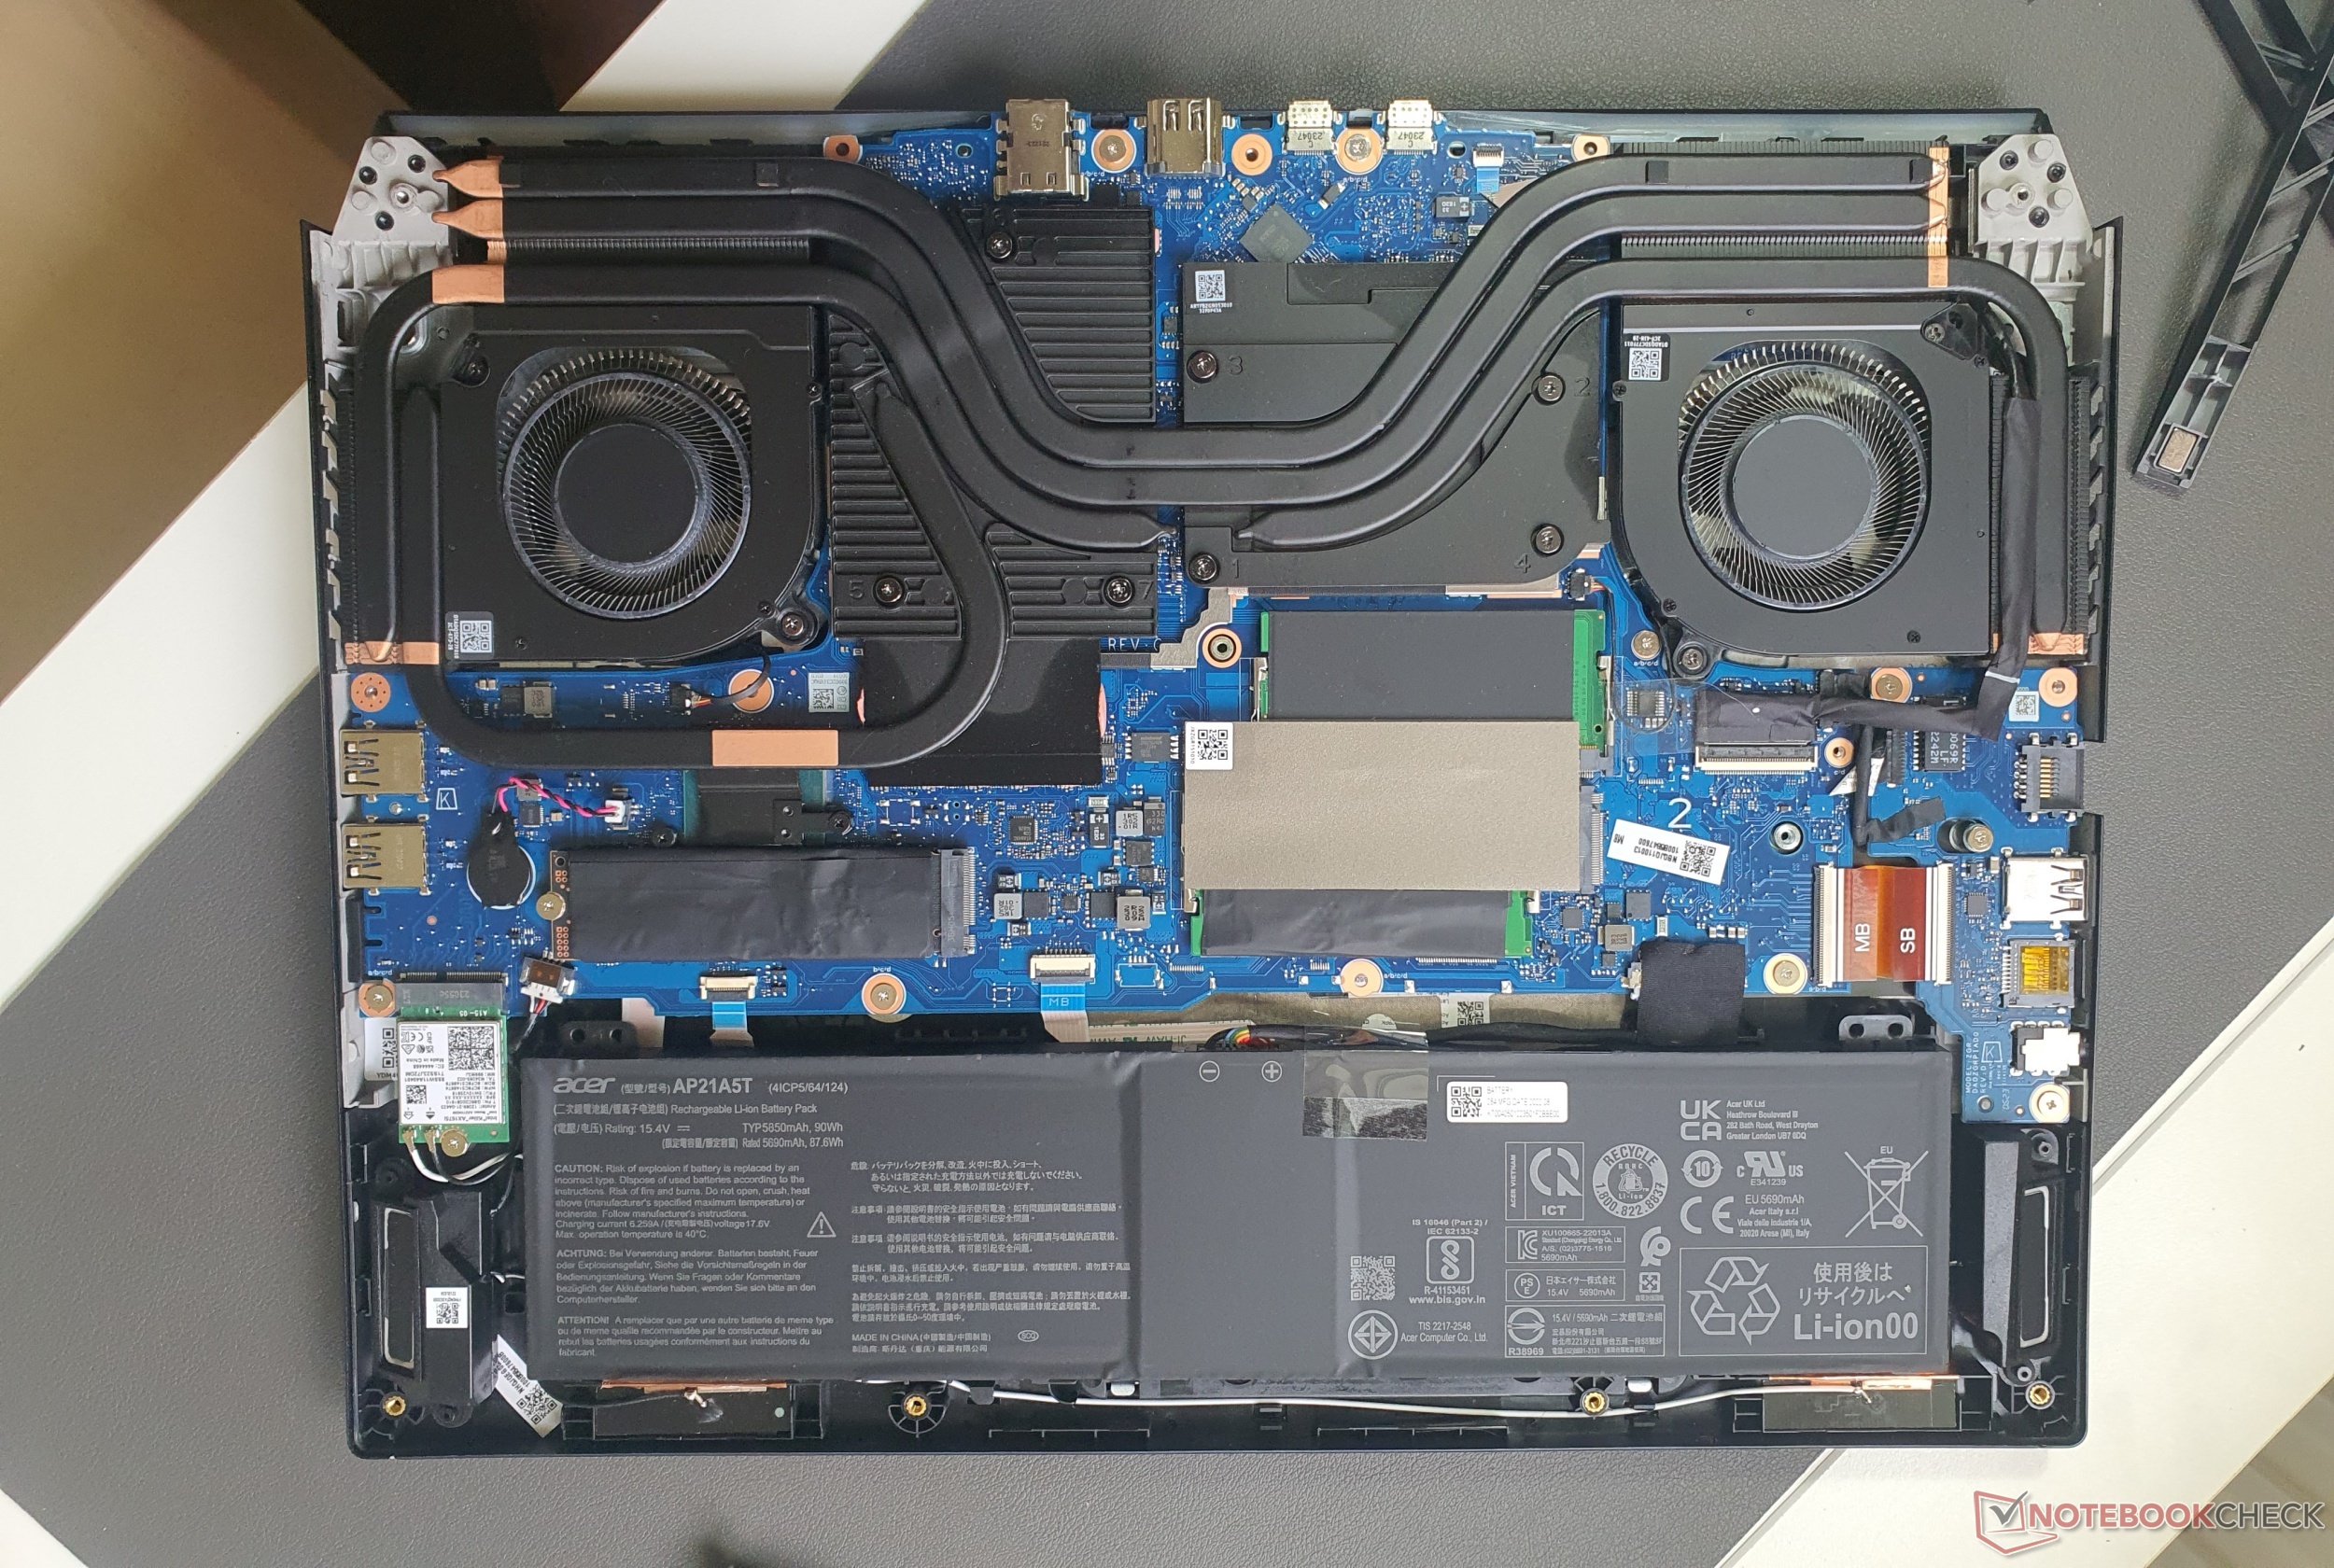
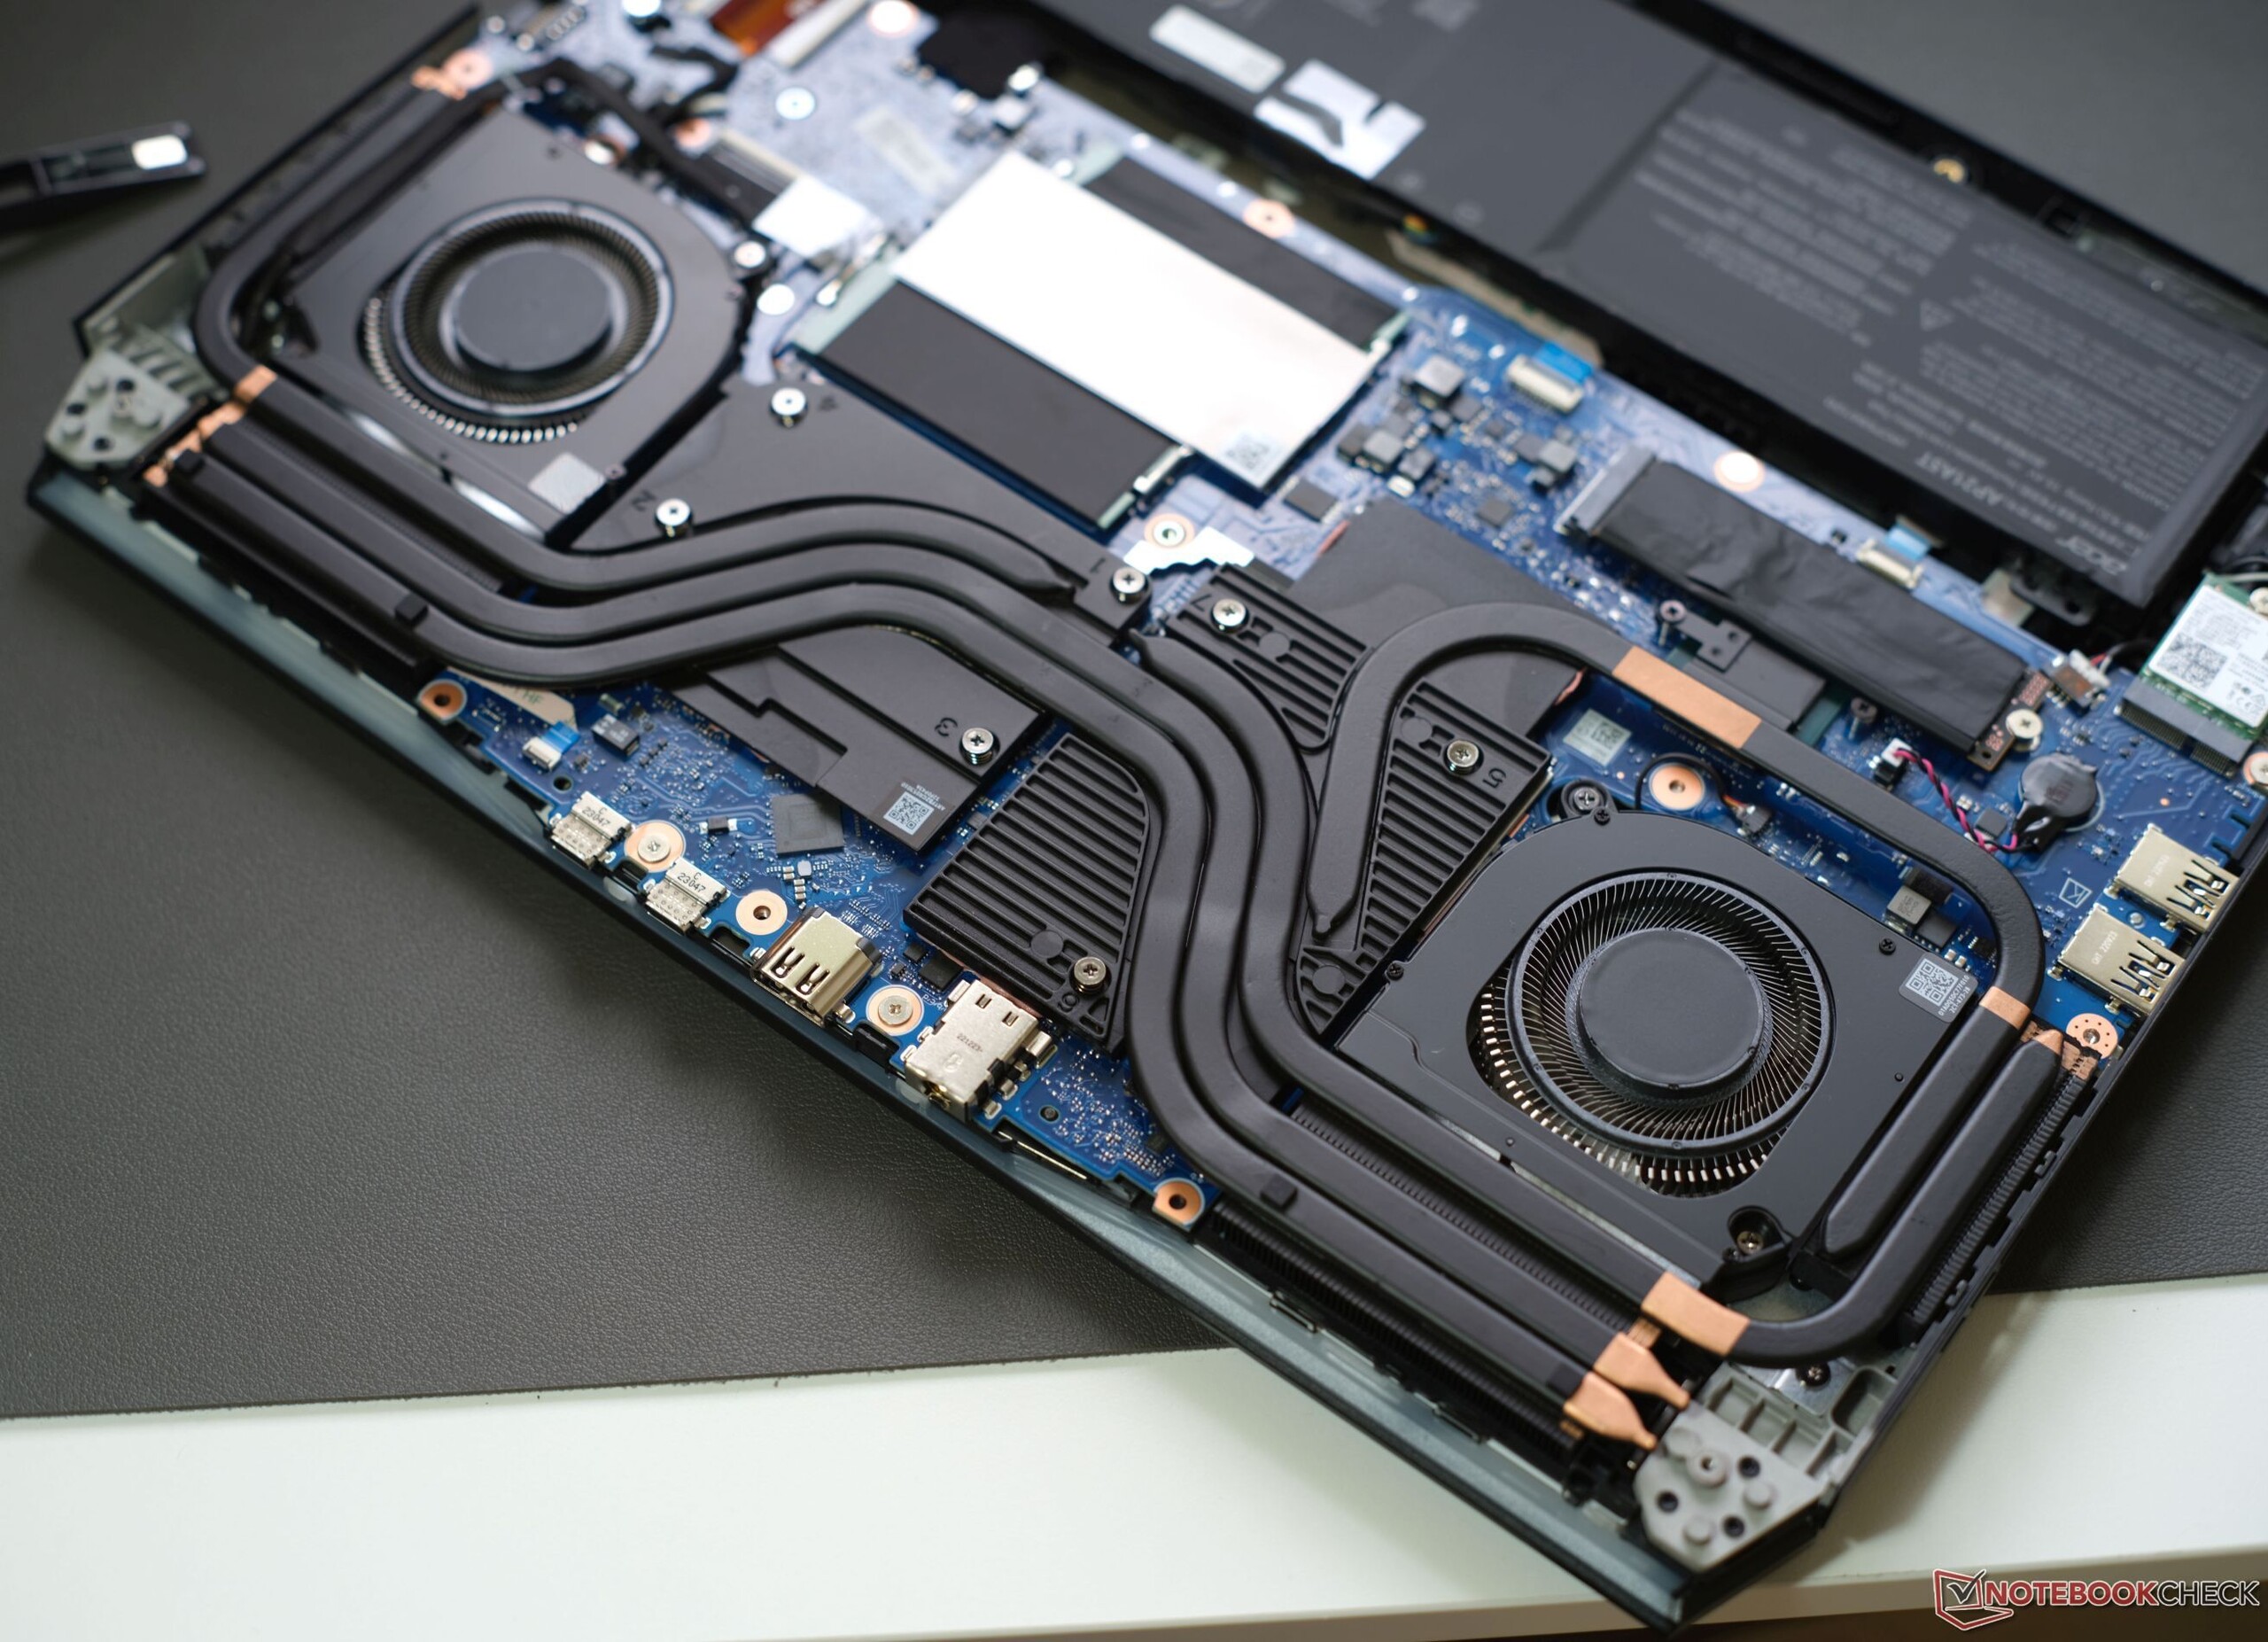
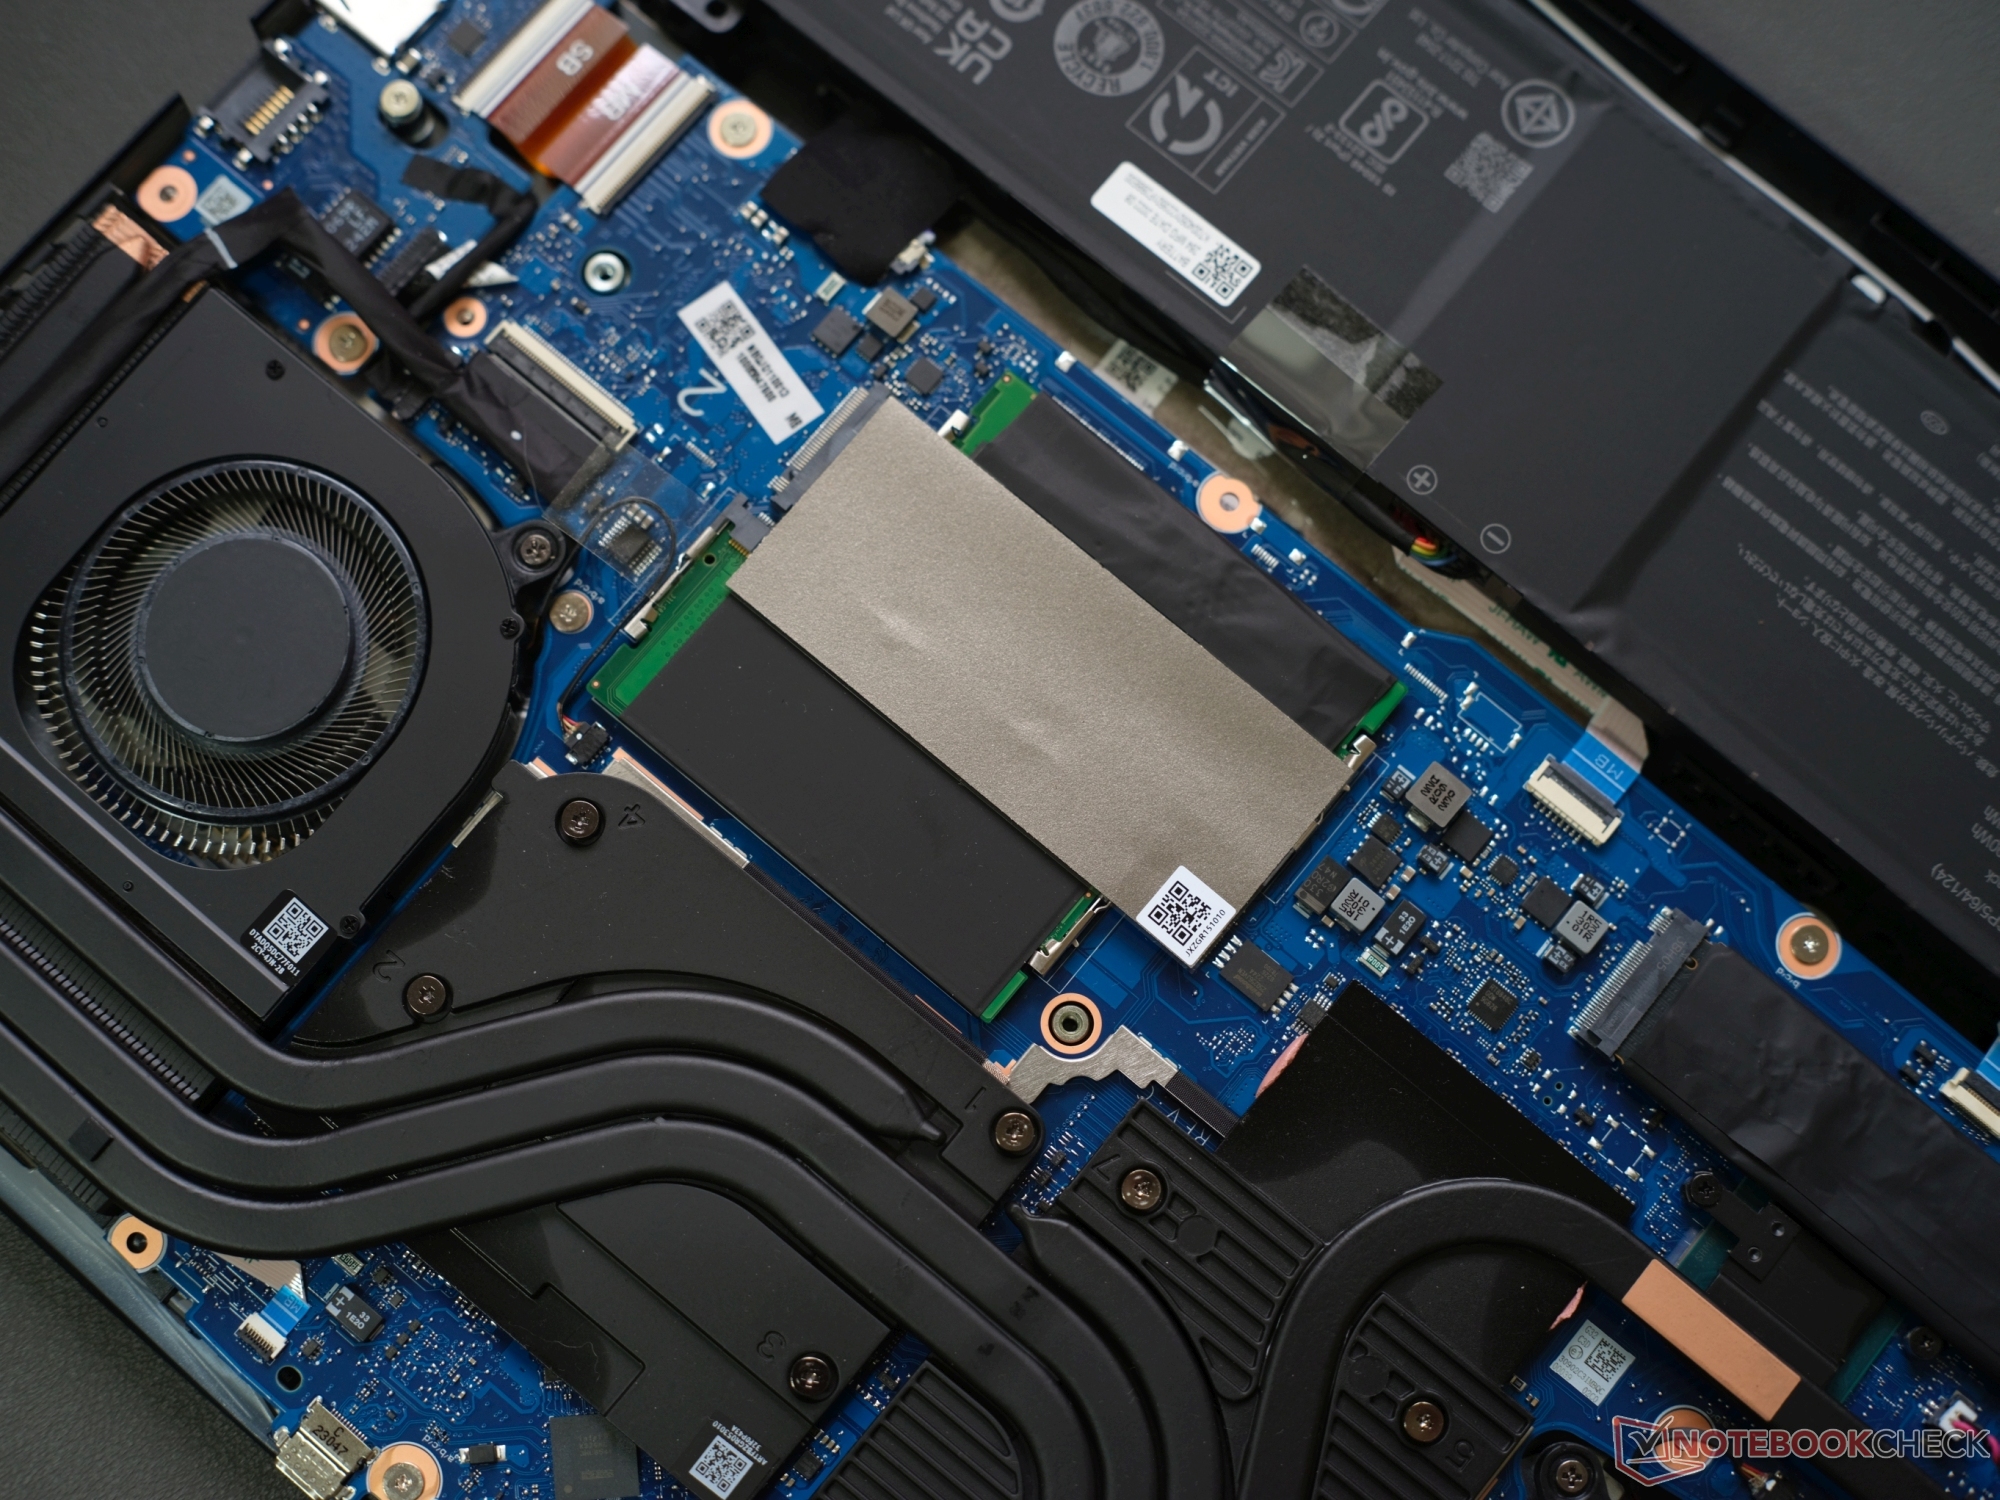
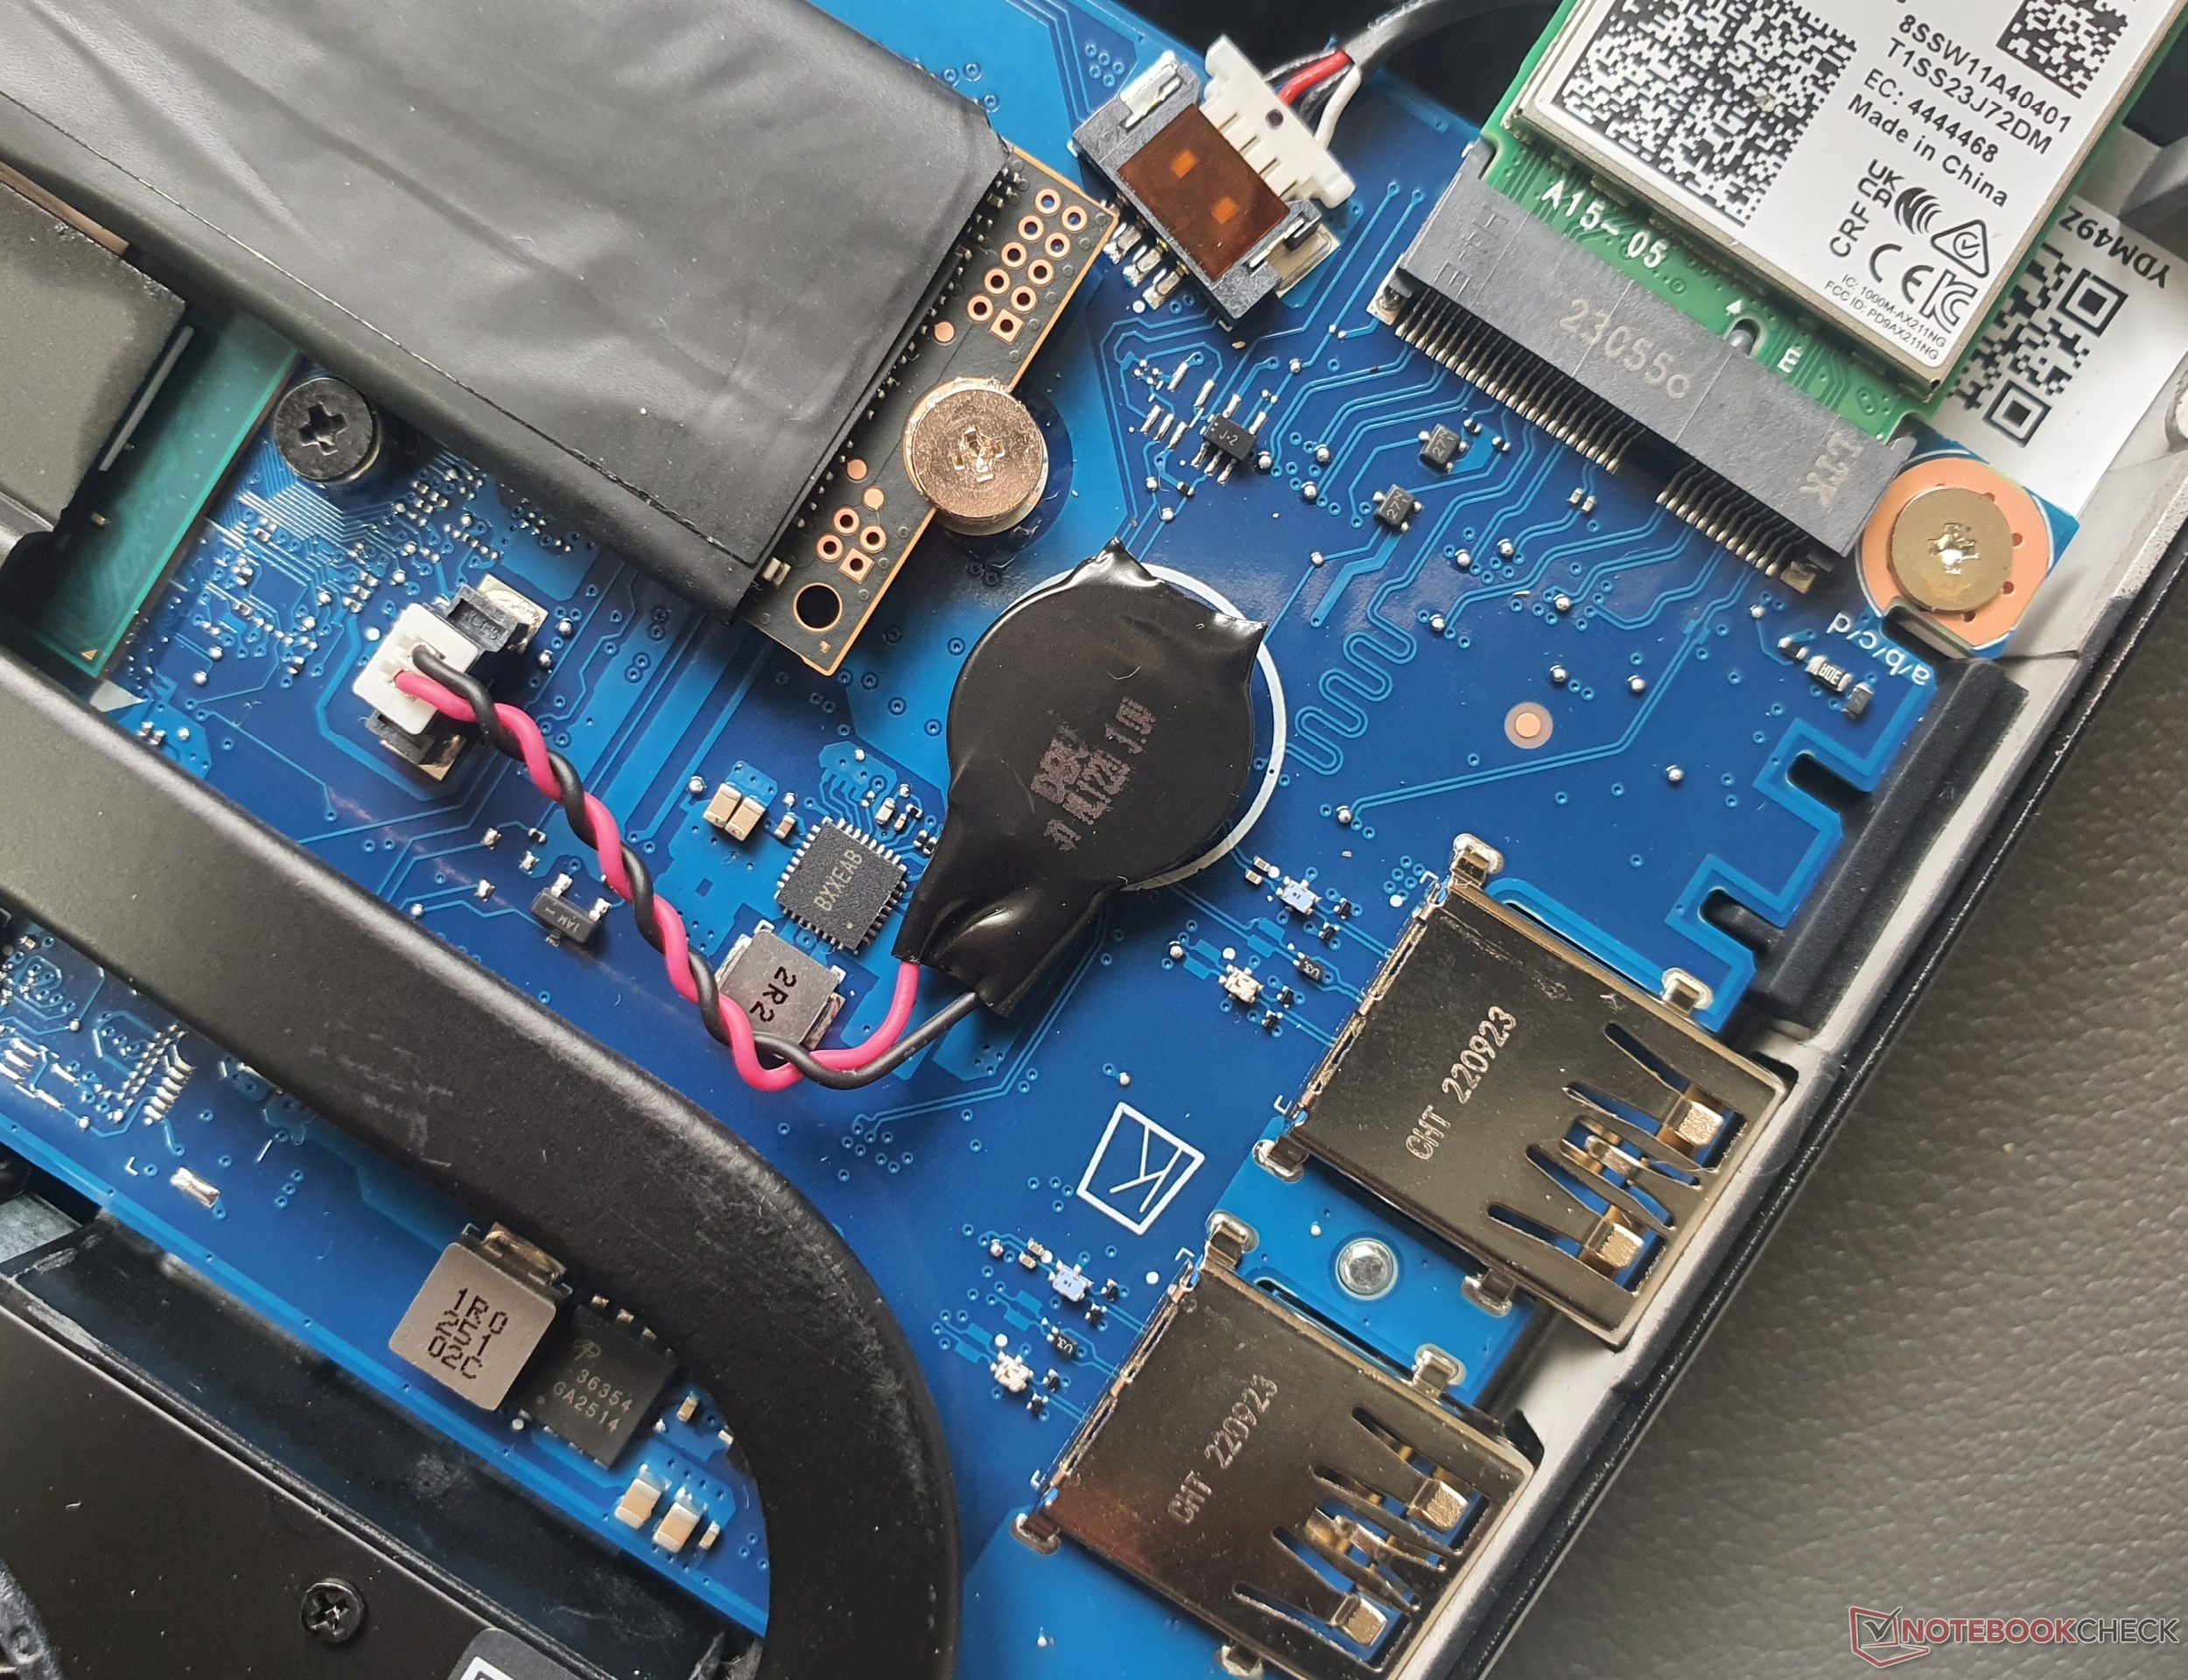
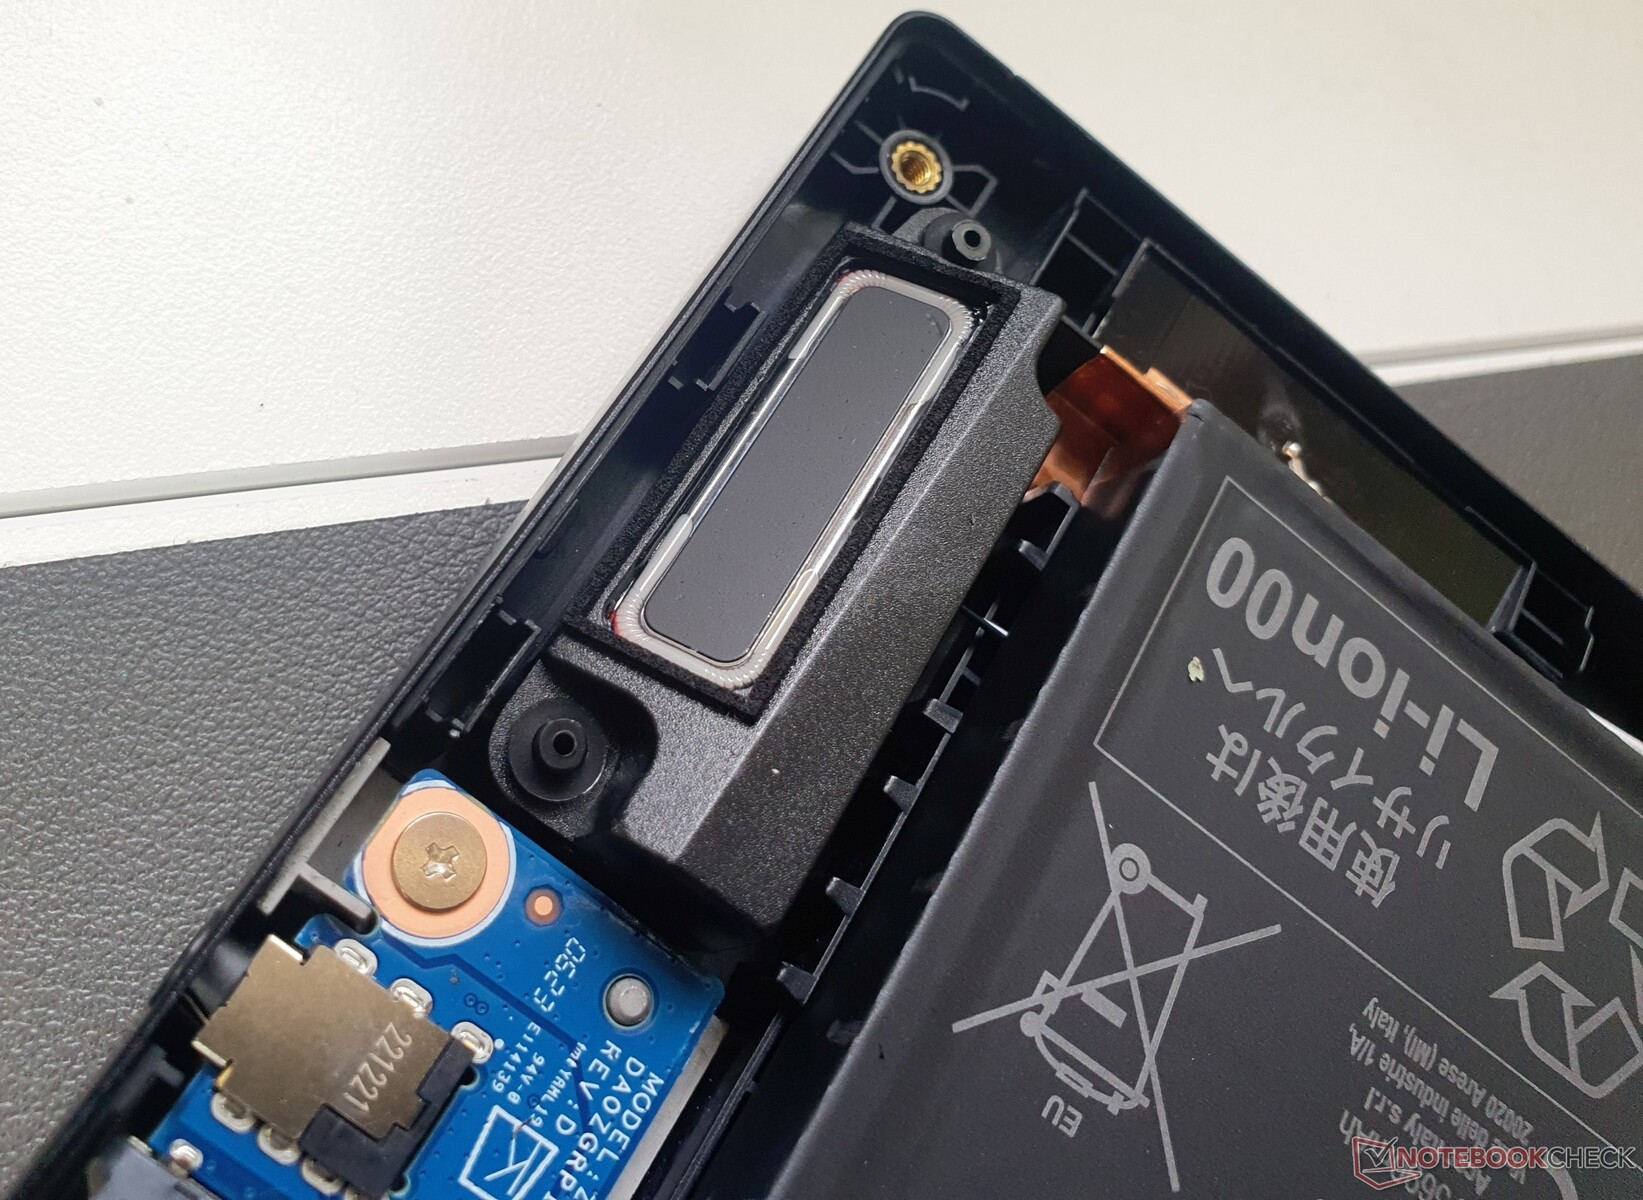
Maintenance
It's fairly easy to access the case internals after loosening ten Torx T5 screws. The swappable parts include the RAM (two banks), the M.2 2280 SSD (Update: There is a second M.2 slot hidden right next to the bottom RAM bank) and the Wi-Fi chip. However, the screwed battery and the BIOS battery can also be easily replaced.
Warranty
In Germany, Acer provides a 24-month warranty. With Acer Care Plus, this can be extended by up to five years.
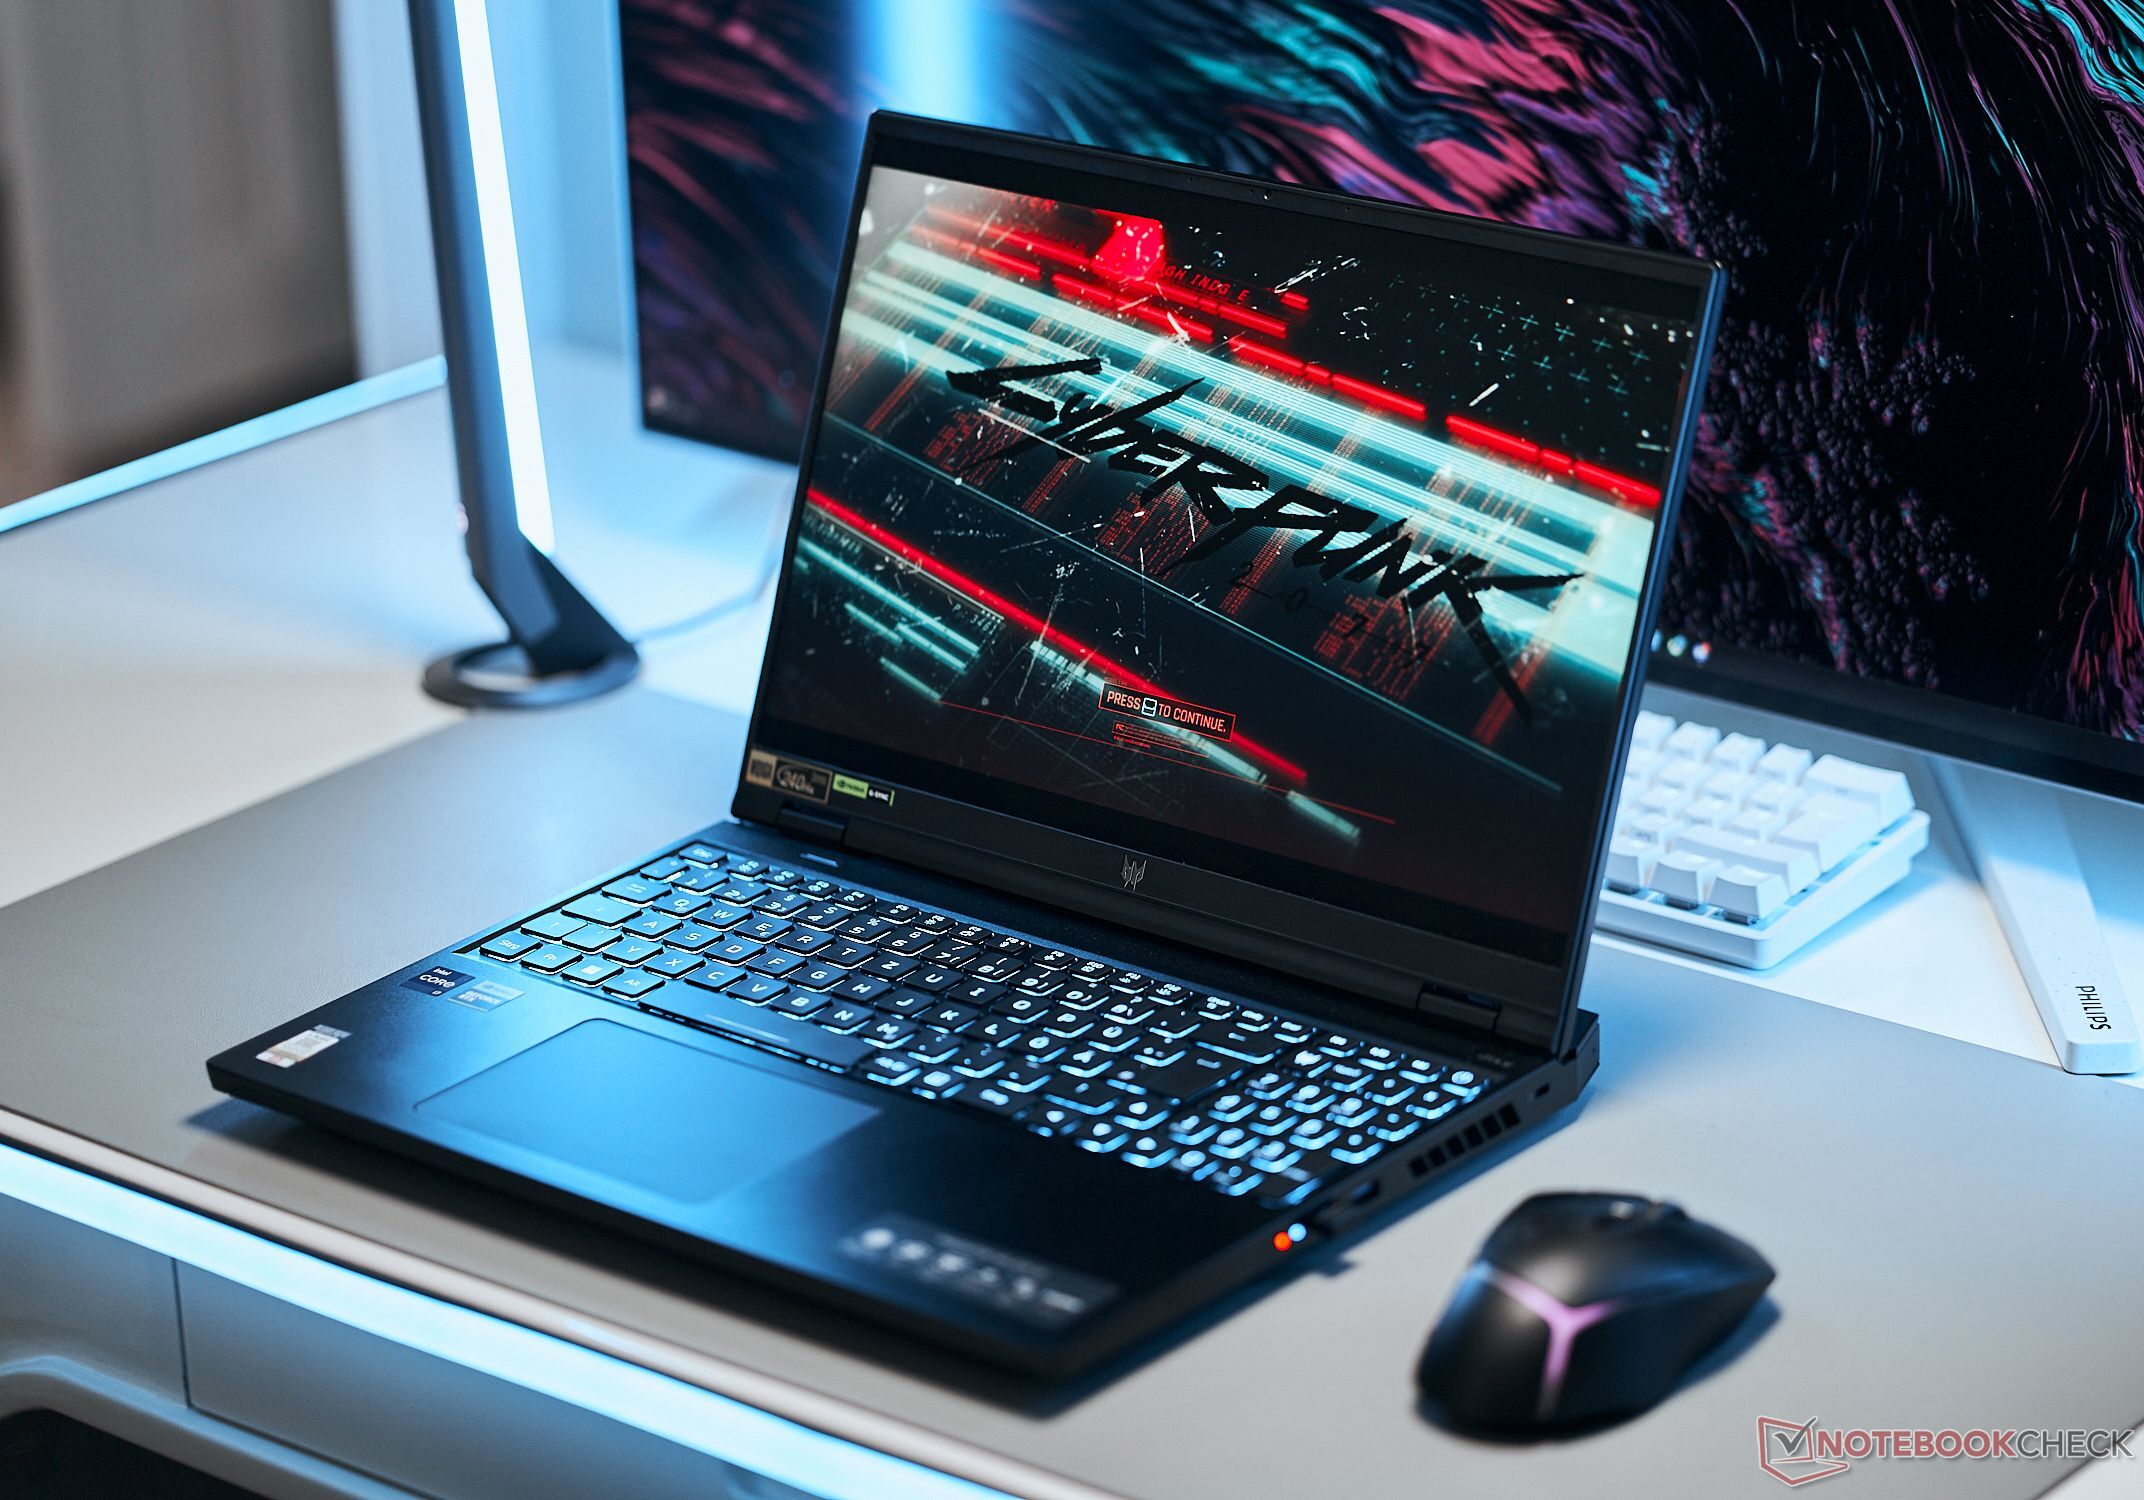
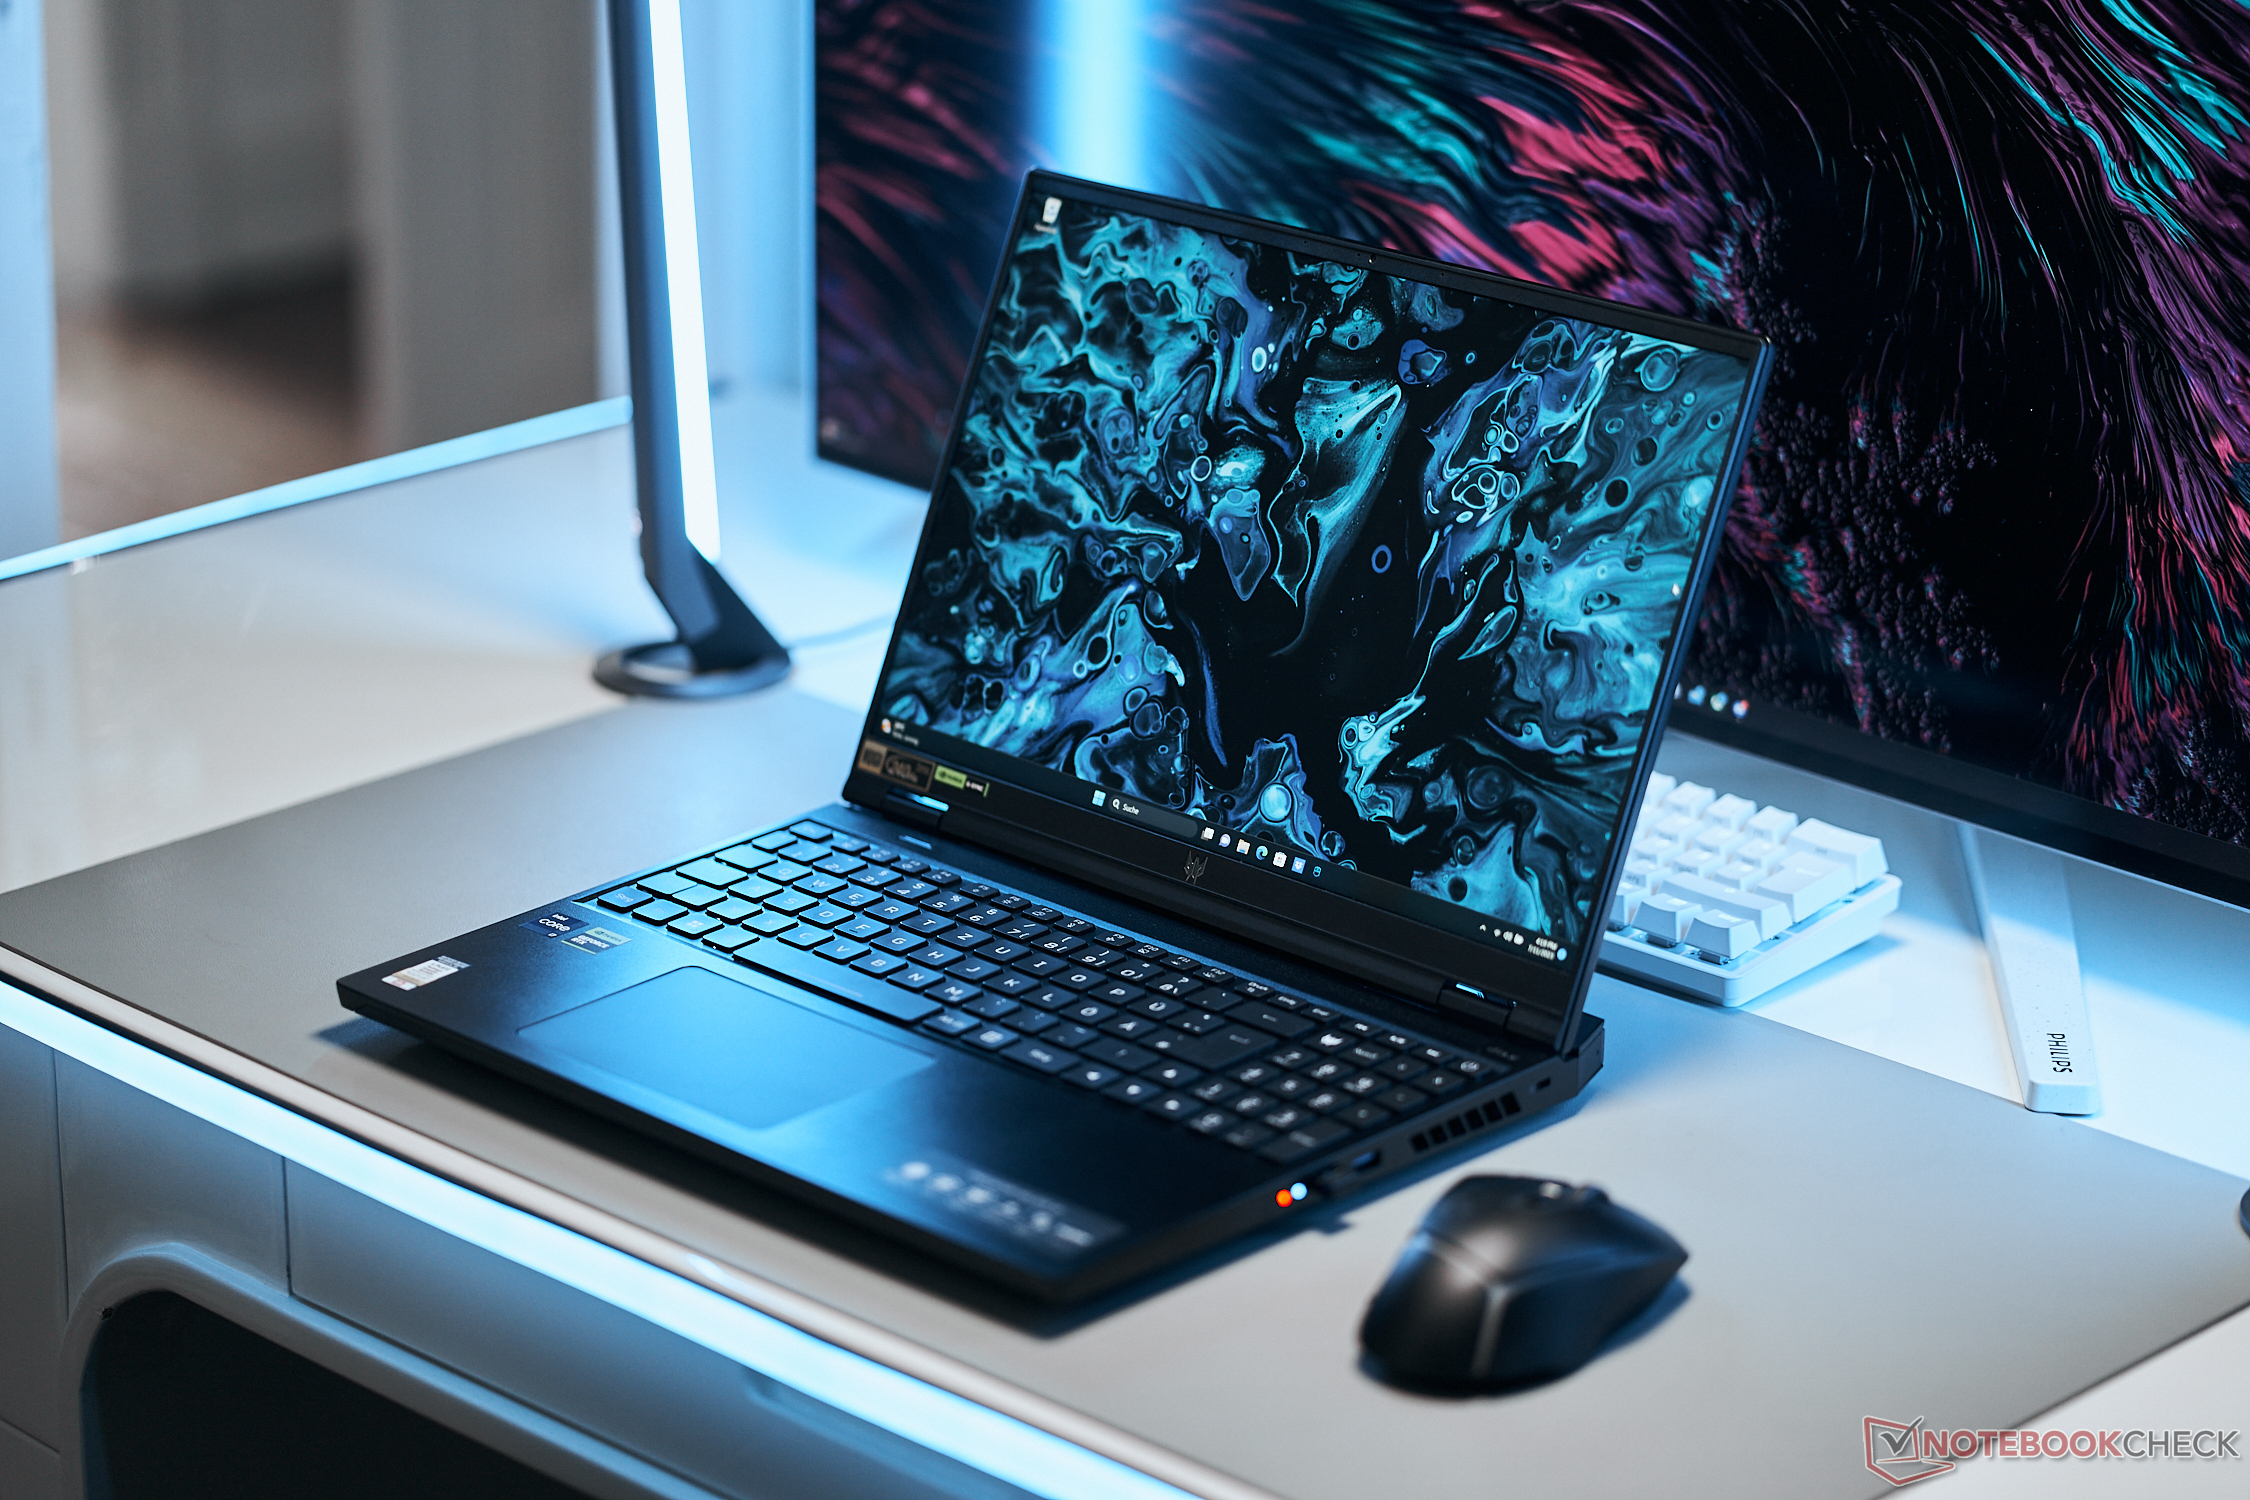
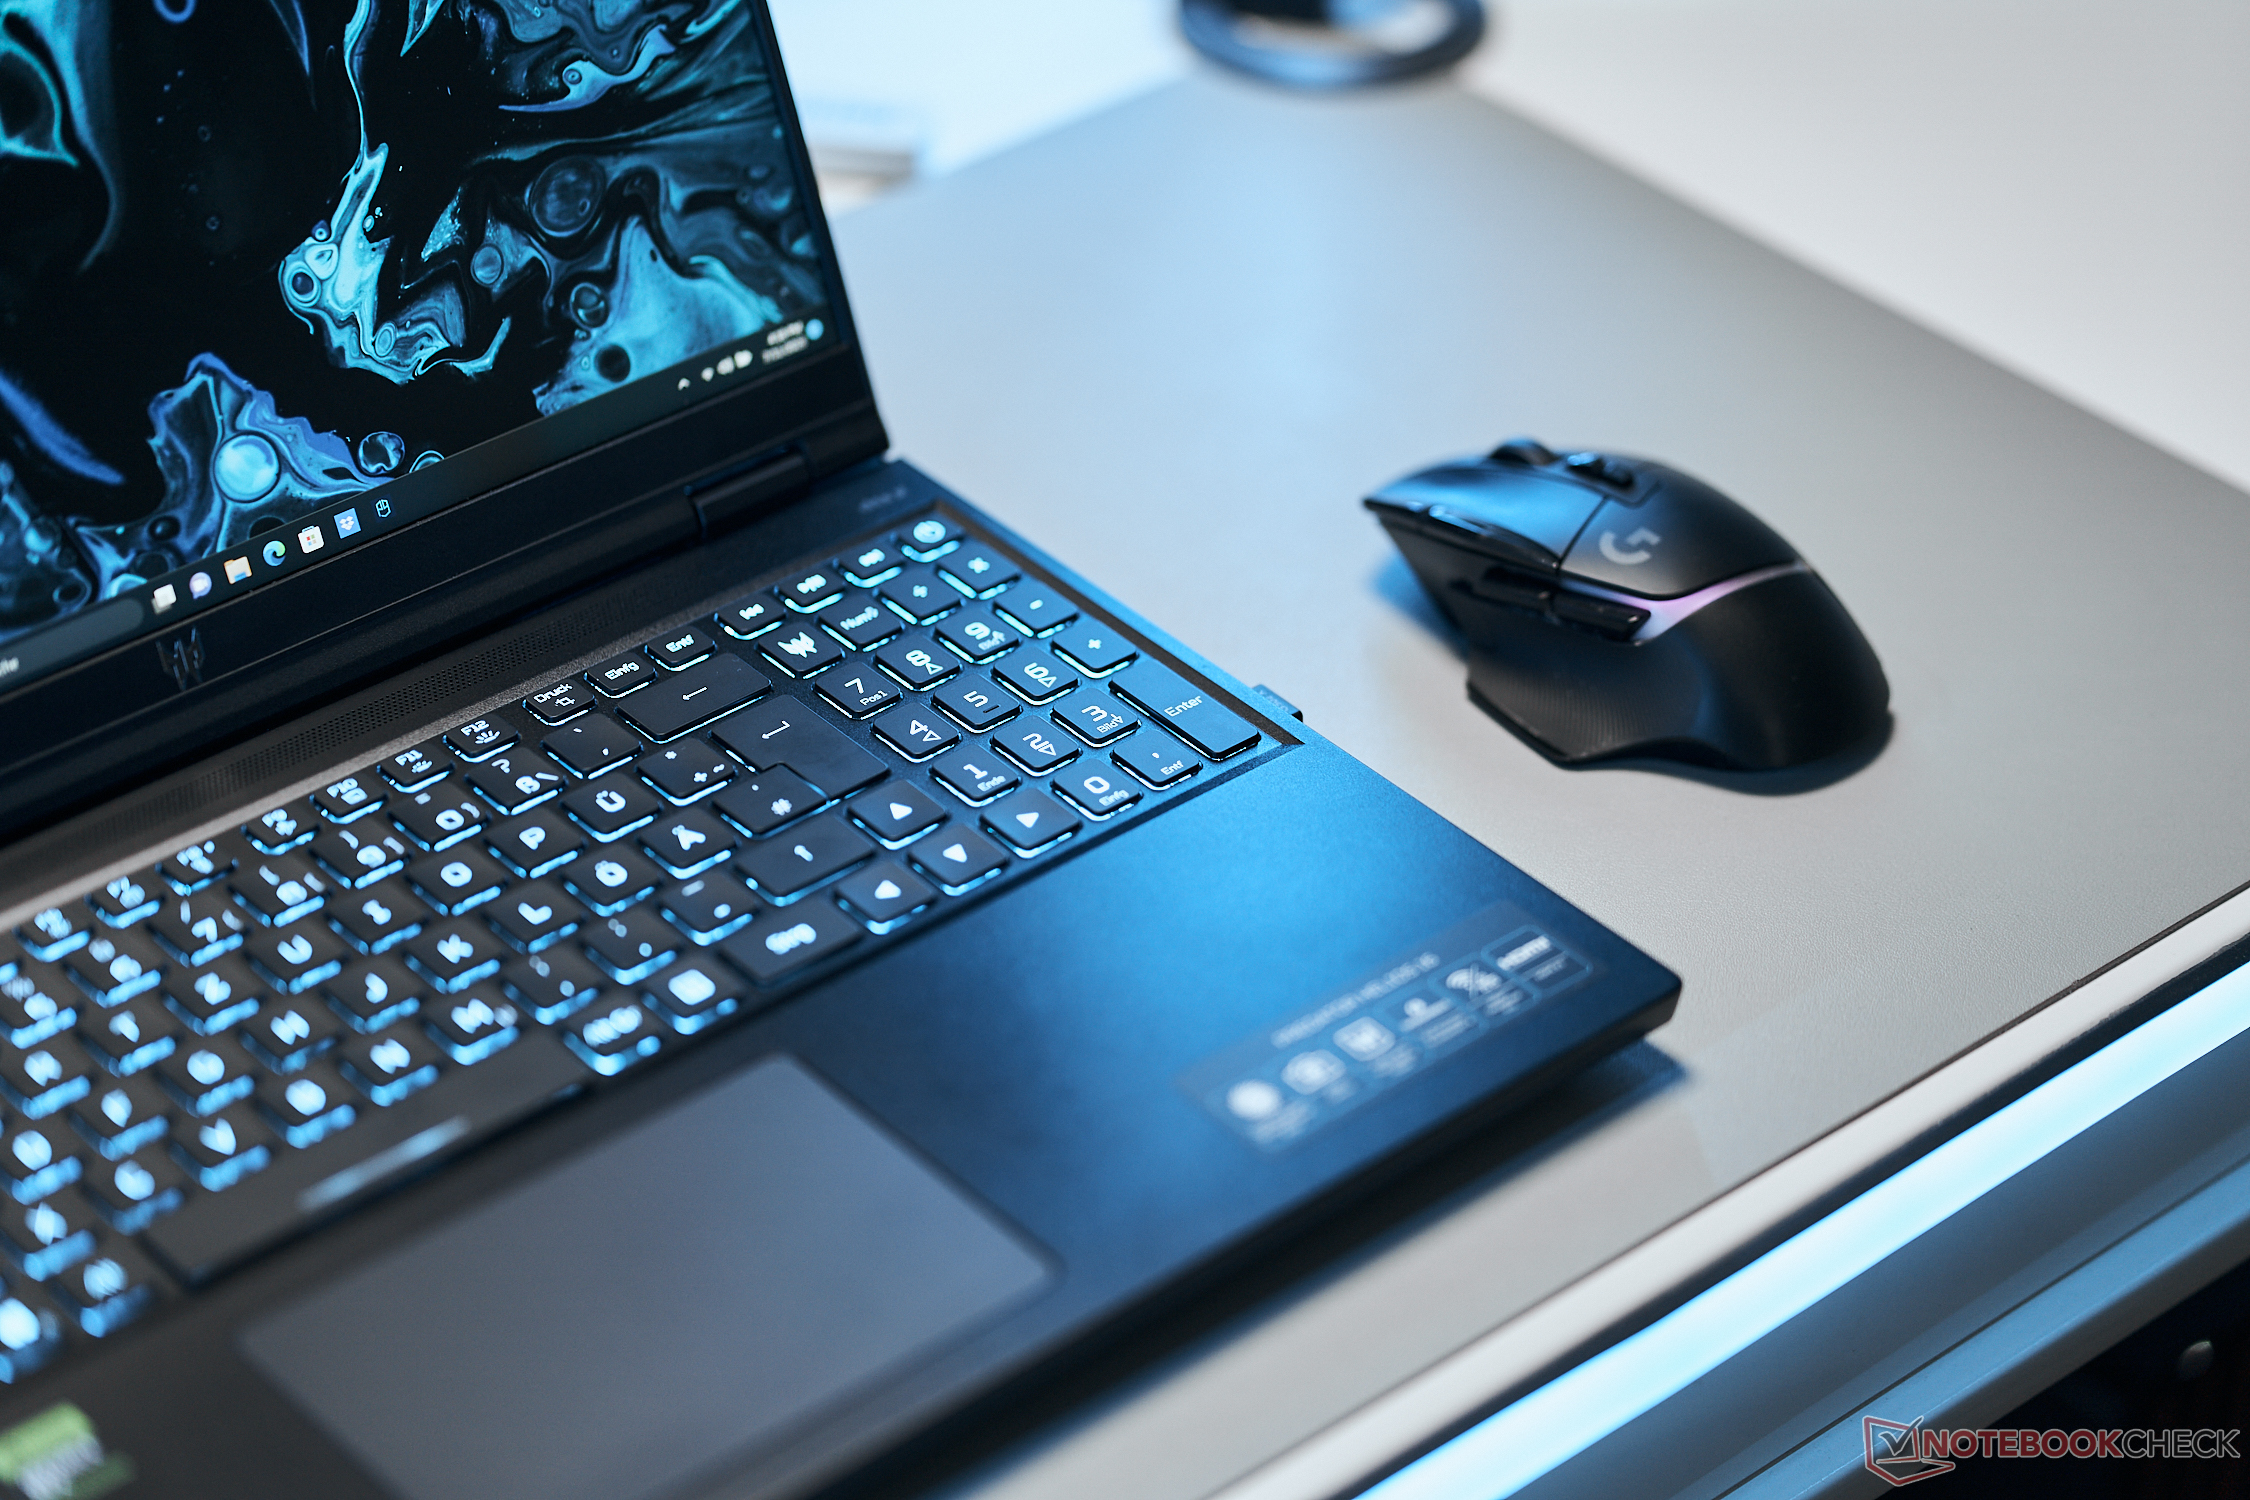
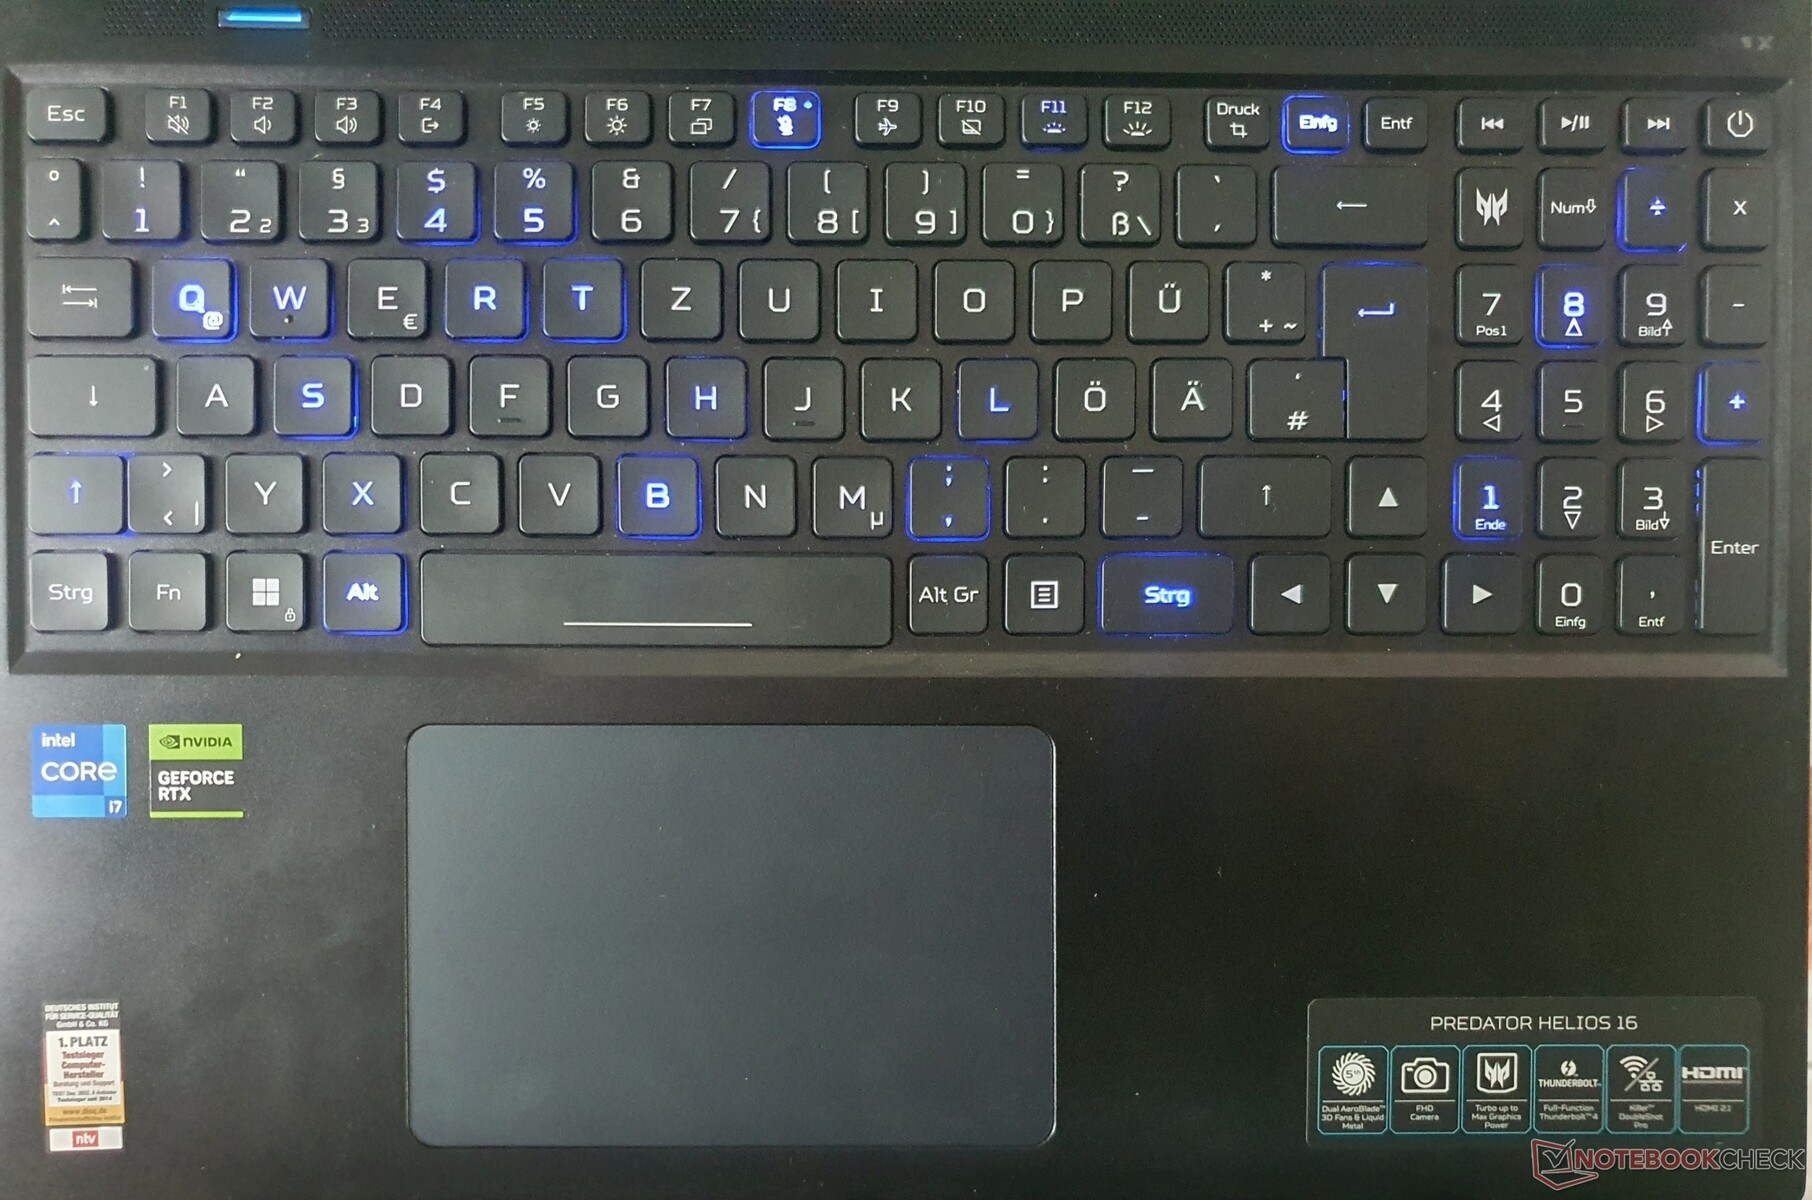
Input devices: The Predator Helios has mini-LED lighting
Keyboard
Acer has been using the same 6-row, chiclet keyboard with 15 x 15 mm keys since the 2020 model. Despite the generous key travel, the feedback doesn't quite reach its potential: The pressure point is tangible and could be a little more defined but the typing noise is pleasantly quiet. In the middle and on the right-hand side, the keyboard flexes significantly but this is not annoying when typing, as long as you don't hammer the keys.
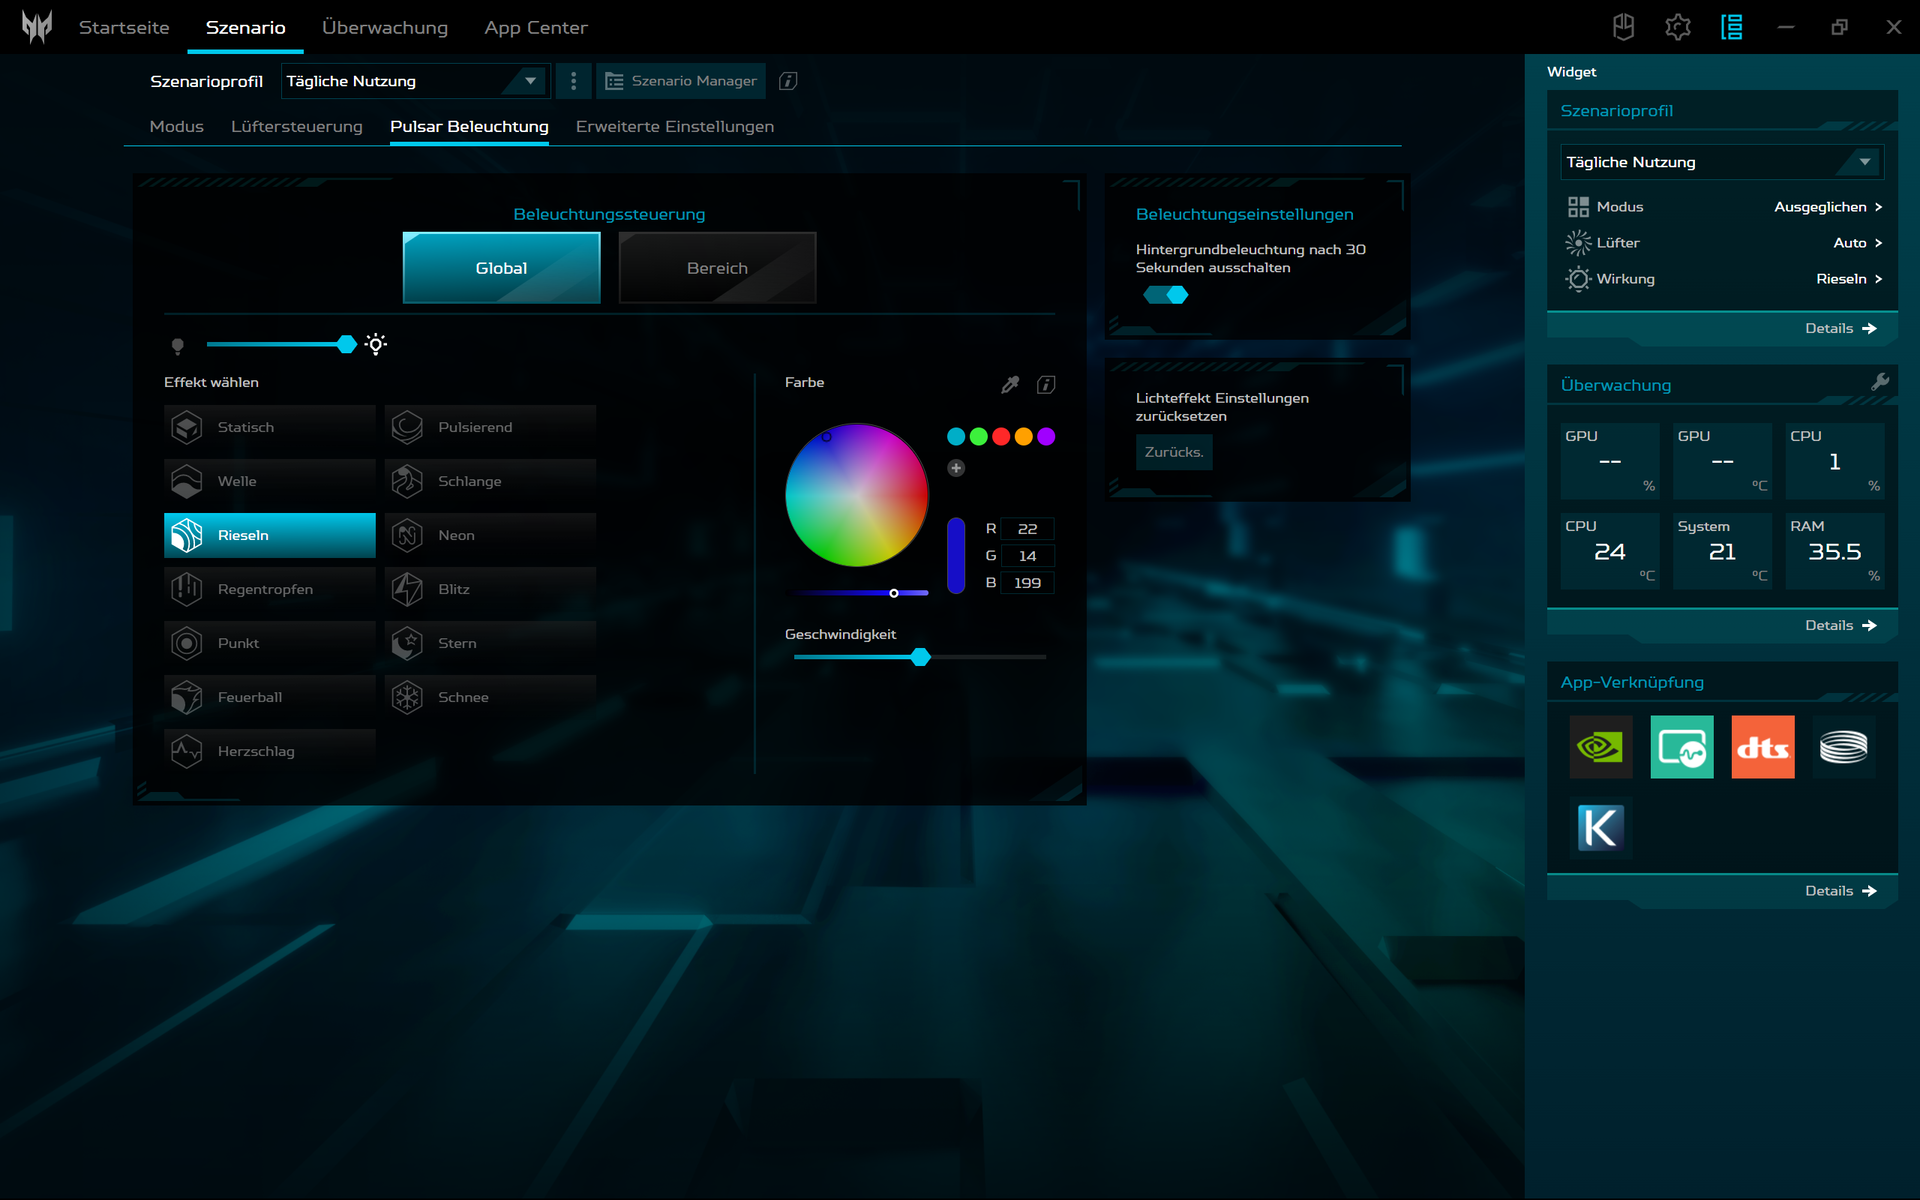
The mini-LED backlighting is new and offers many different settings. The individual-key RGB has four available settings and can get very bright. The transitions are particularly smooth and clean while the mini-LEDs are also more energy efficient.
We like the layout and, in particular, the normal-sized arrow keys at the cost of a smaller shift. While the logo button boots the Predator Sense app, it is possible to switch between the performance modes by using the button on the left-hand side above the keyboard.
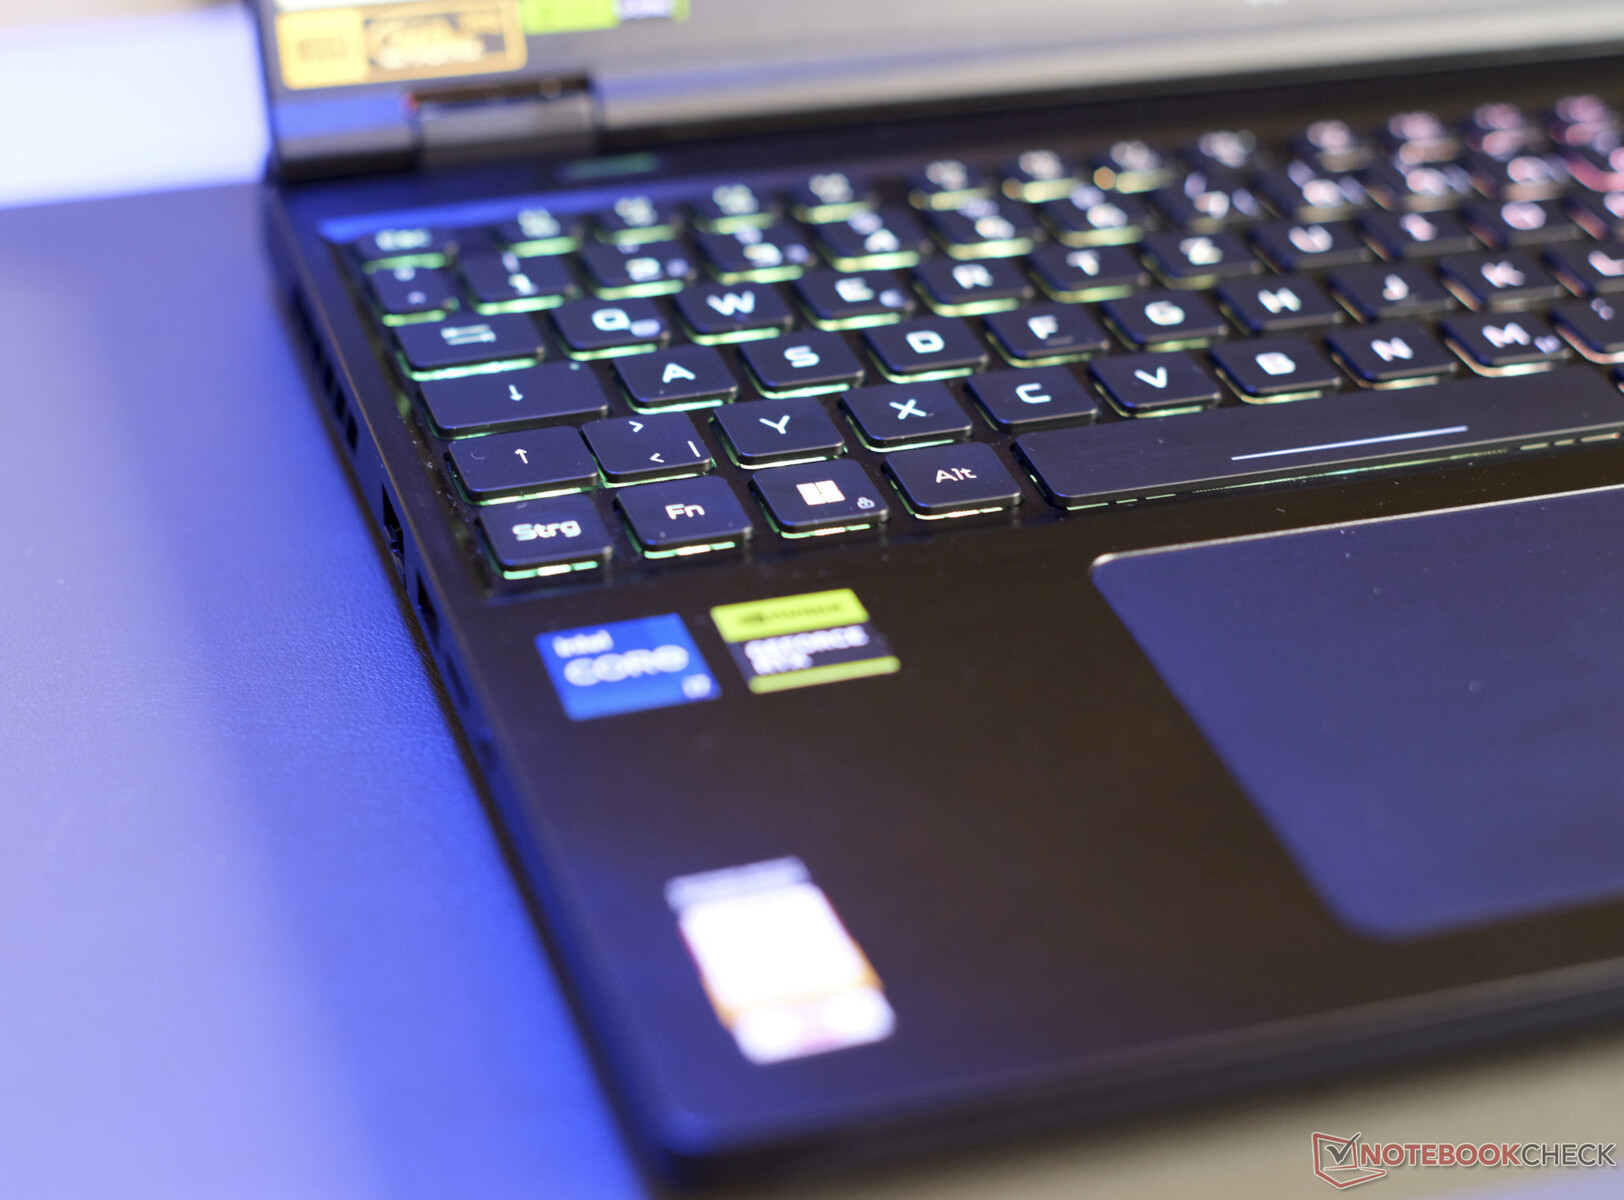
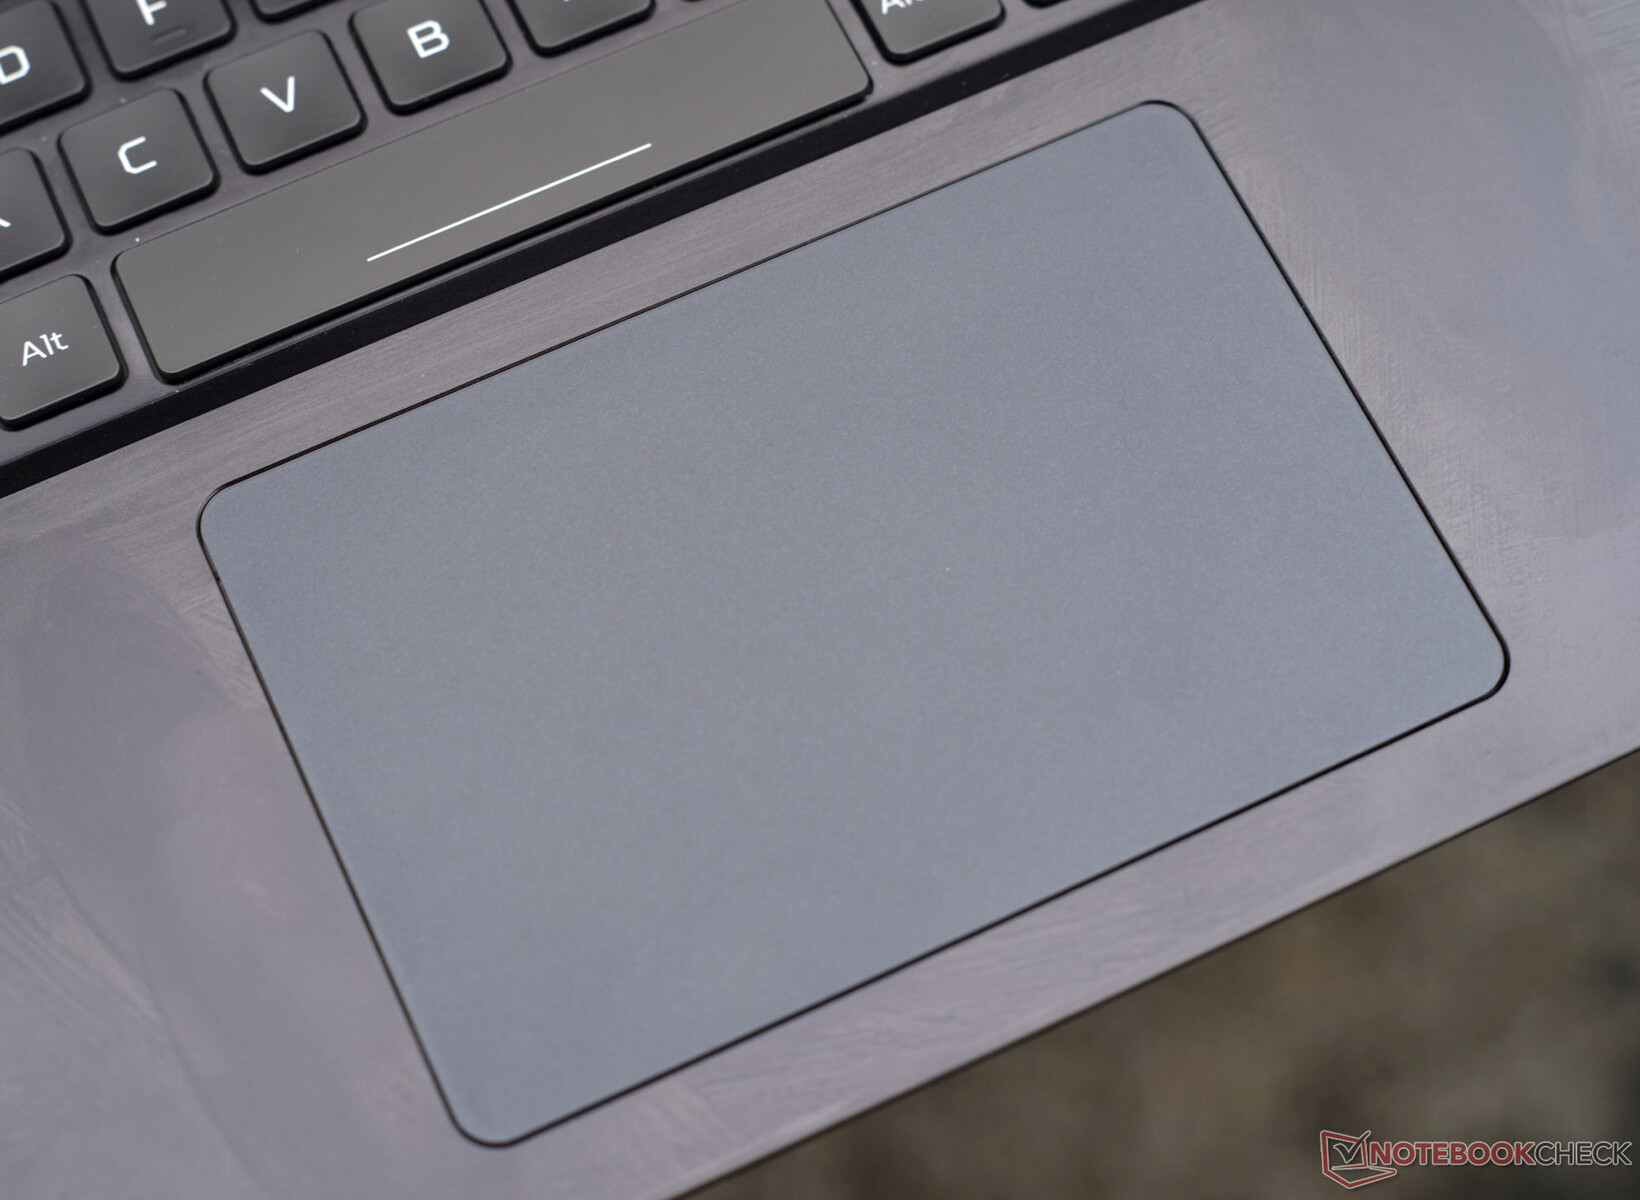
Touchpad
Fingers glide beautifully and with very precise feedback over the 12.6 x 8.3 mm touchpad thanks to its Gorilla Glass coating. Accordingly, multi-touch gestures and scrolling are done effortlessly. The integrated click buttons possess medium travel and satisfactory feedback.
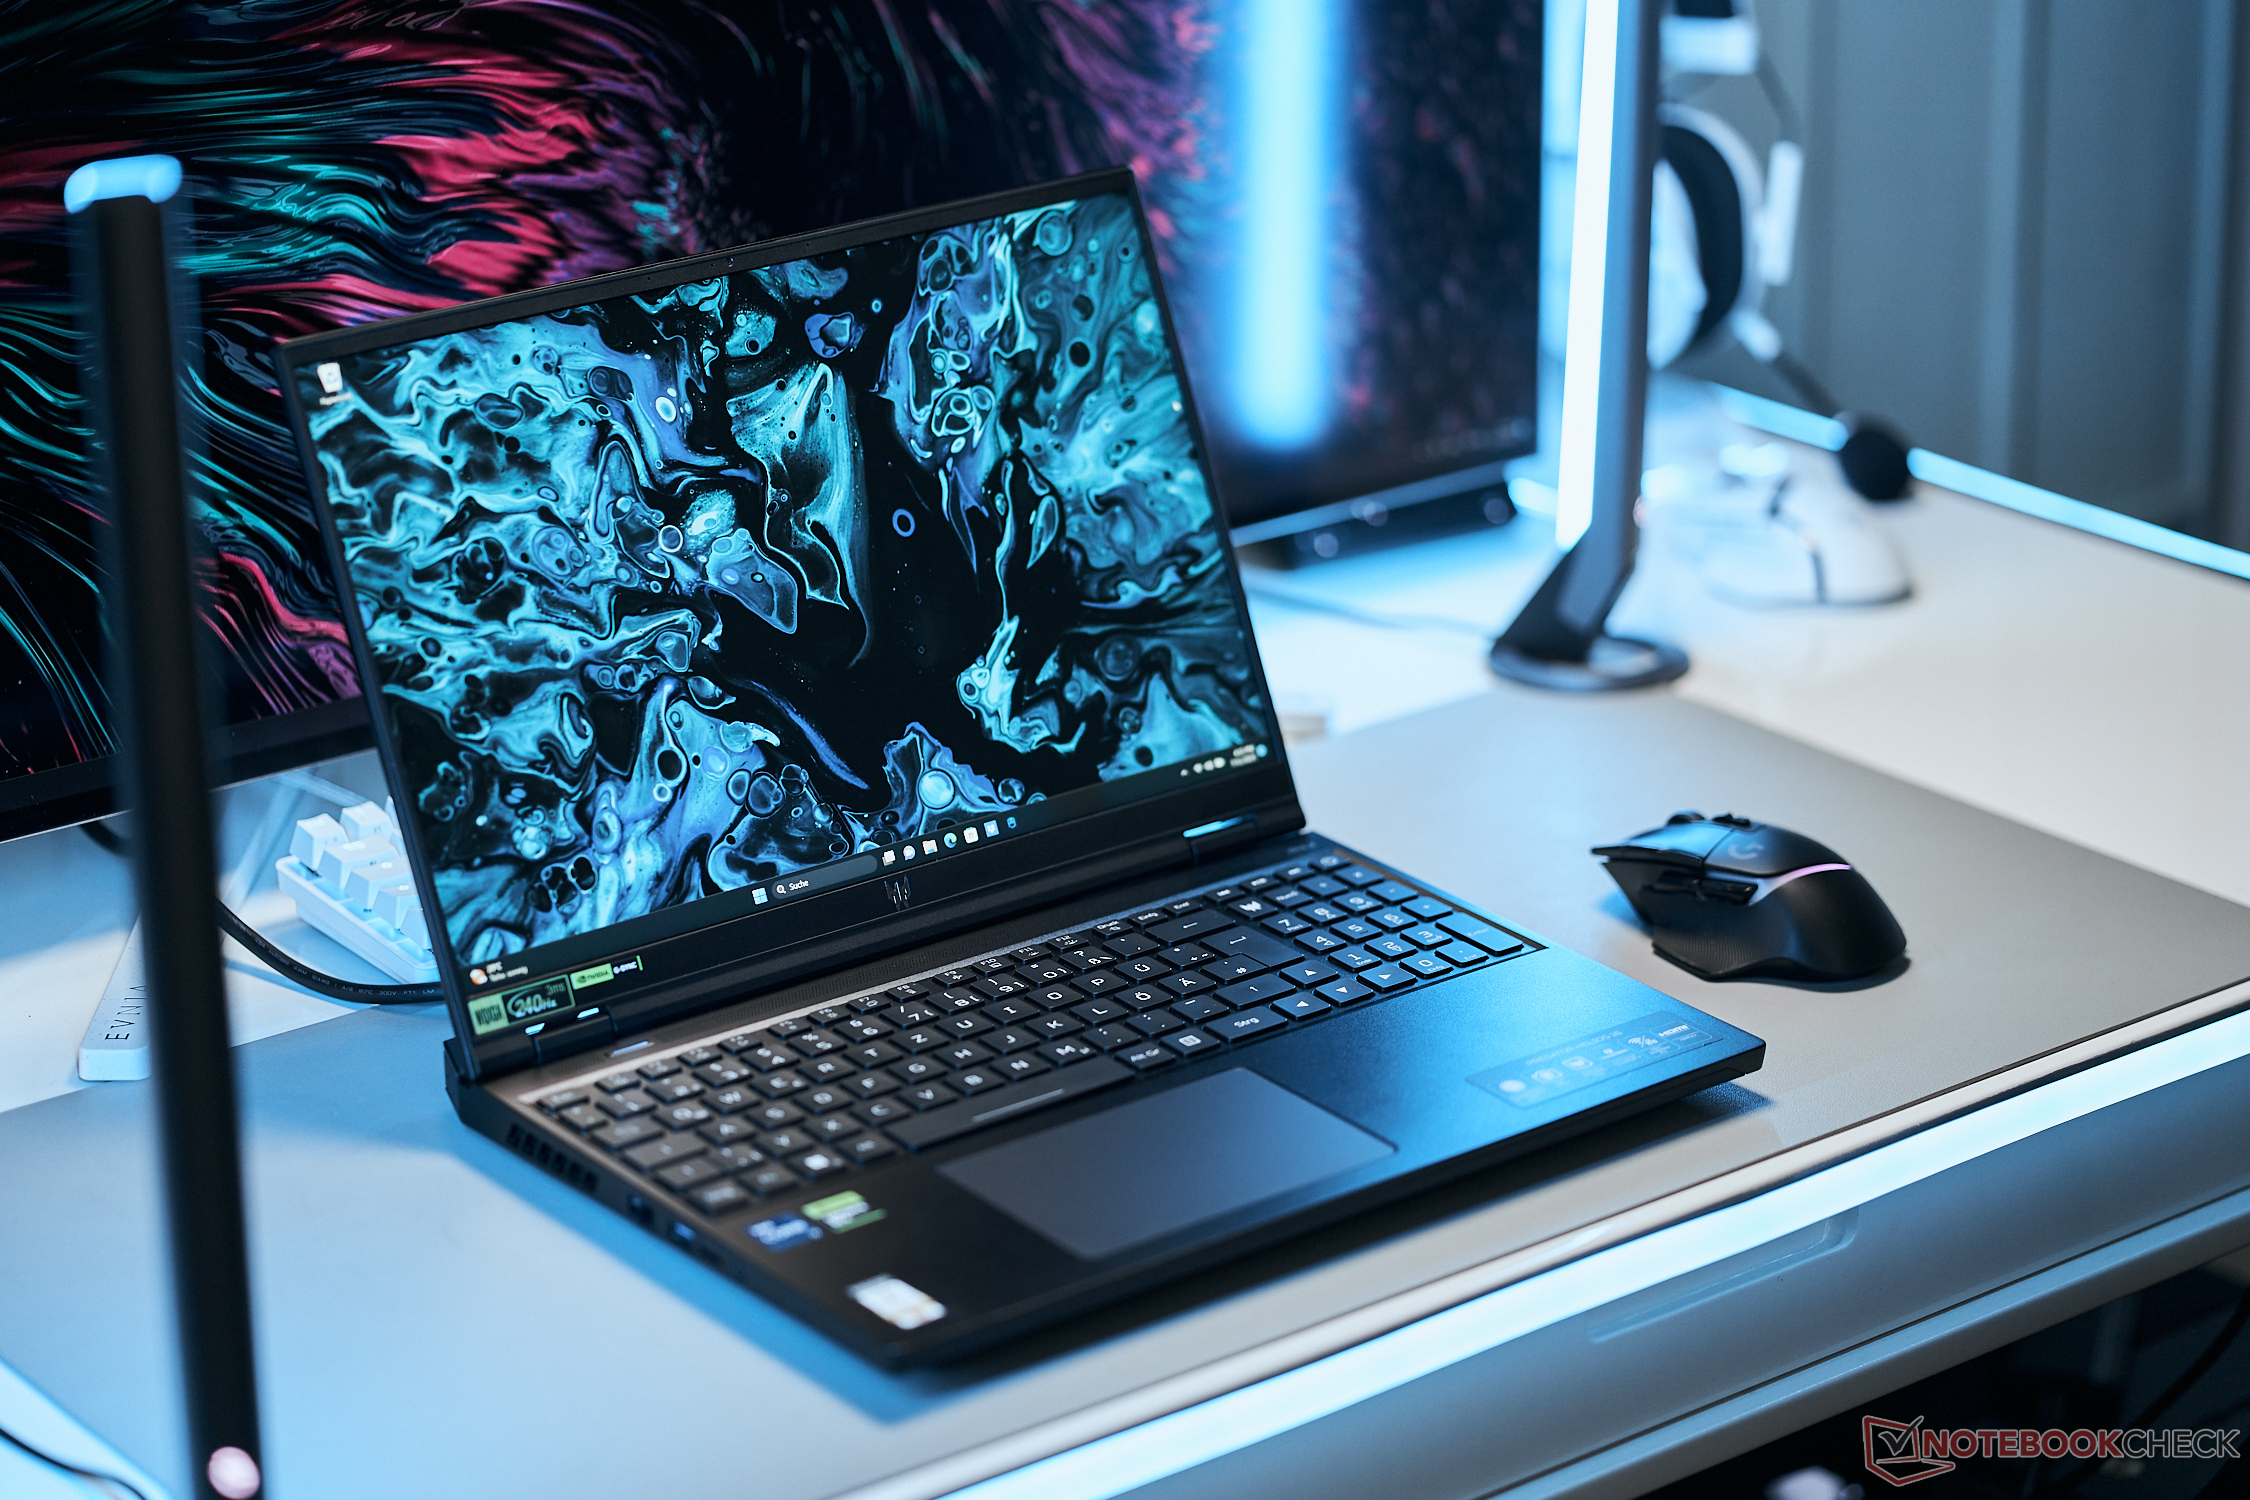
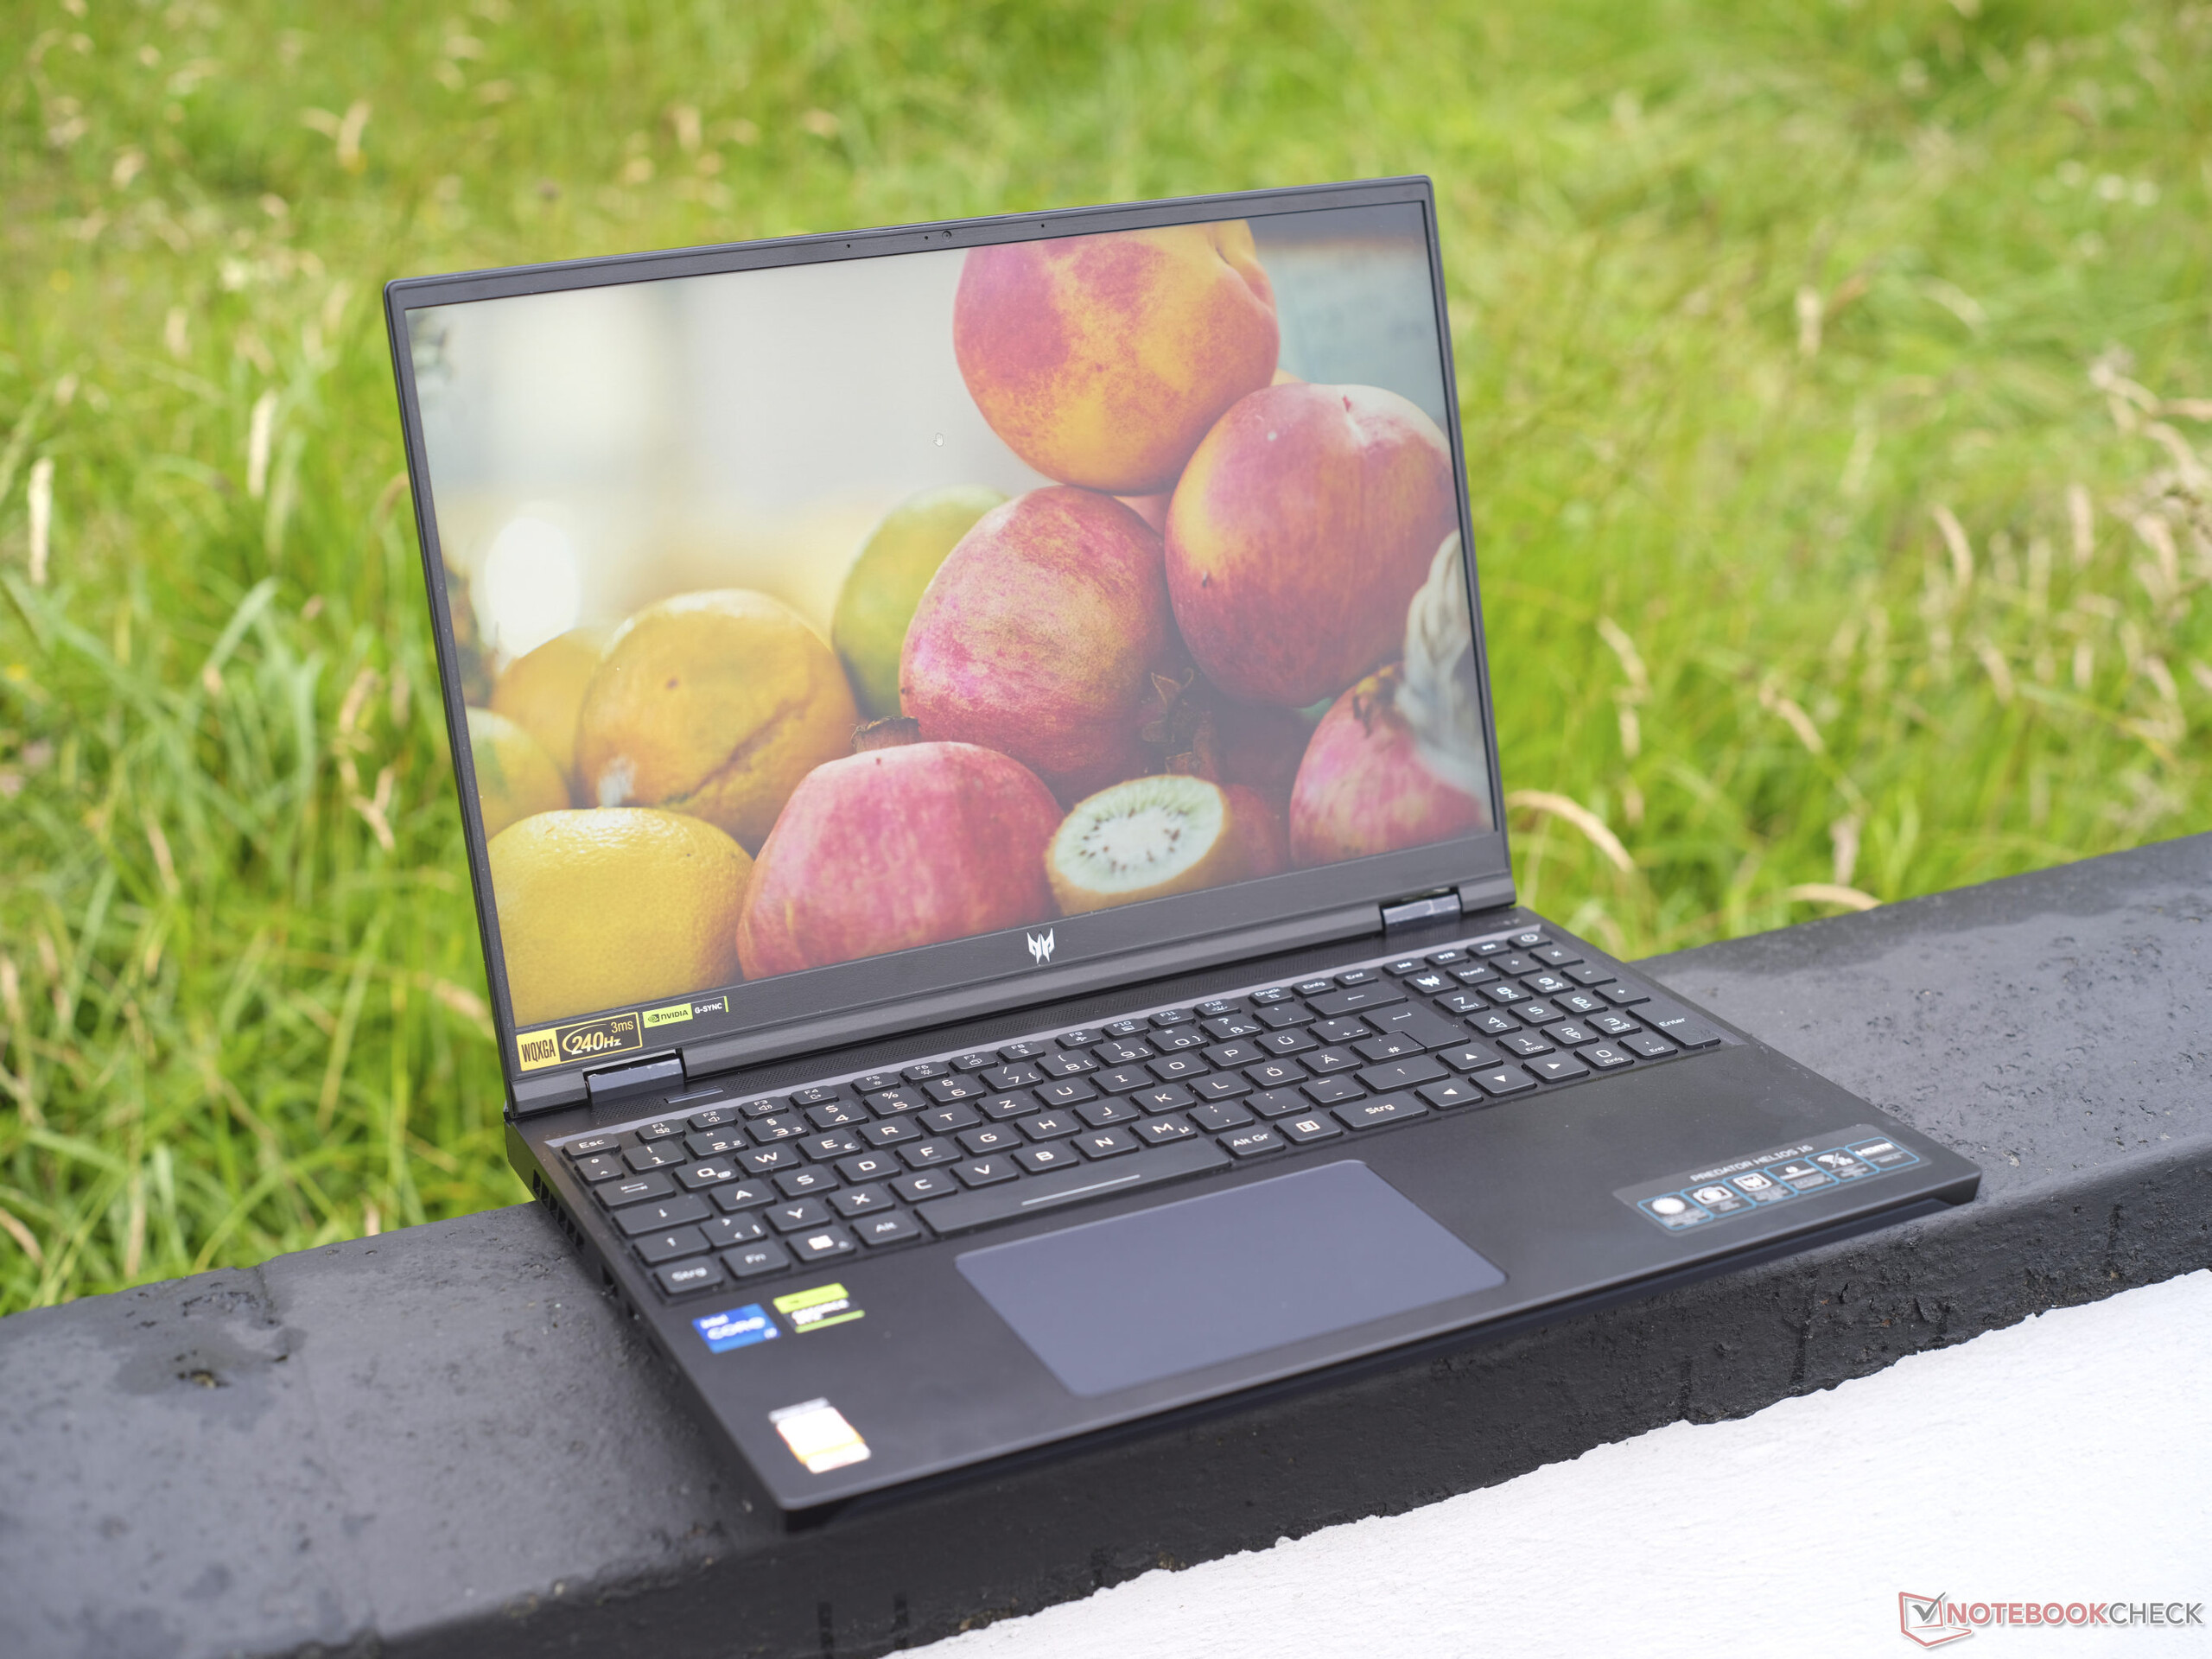
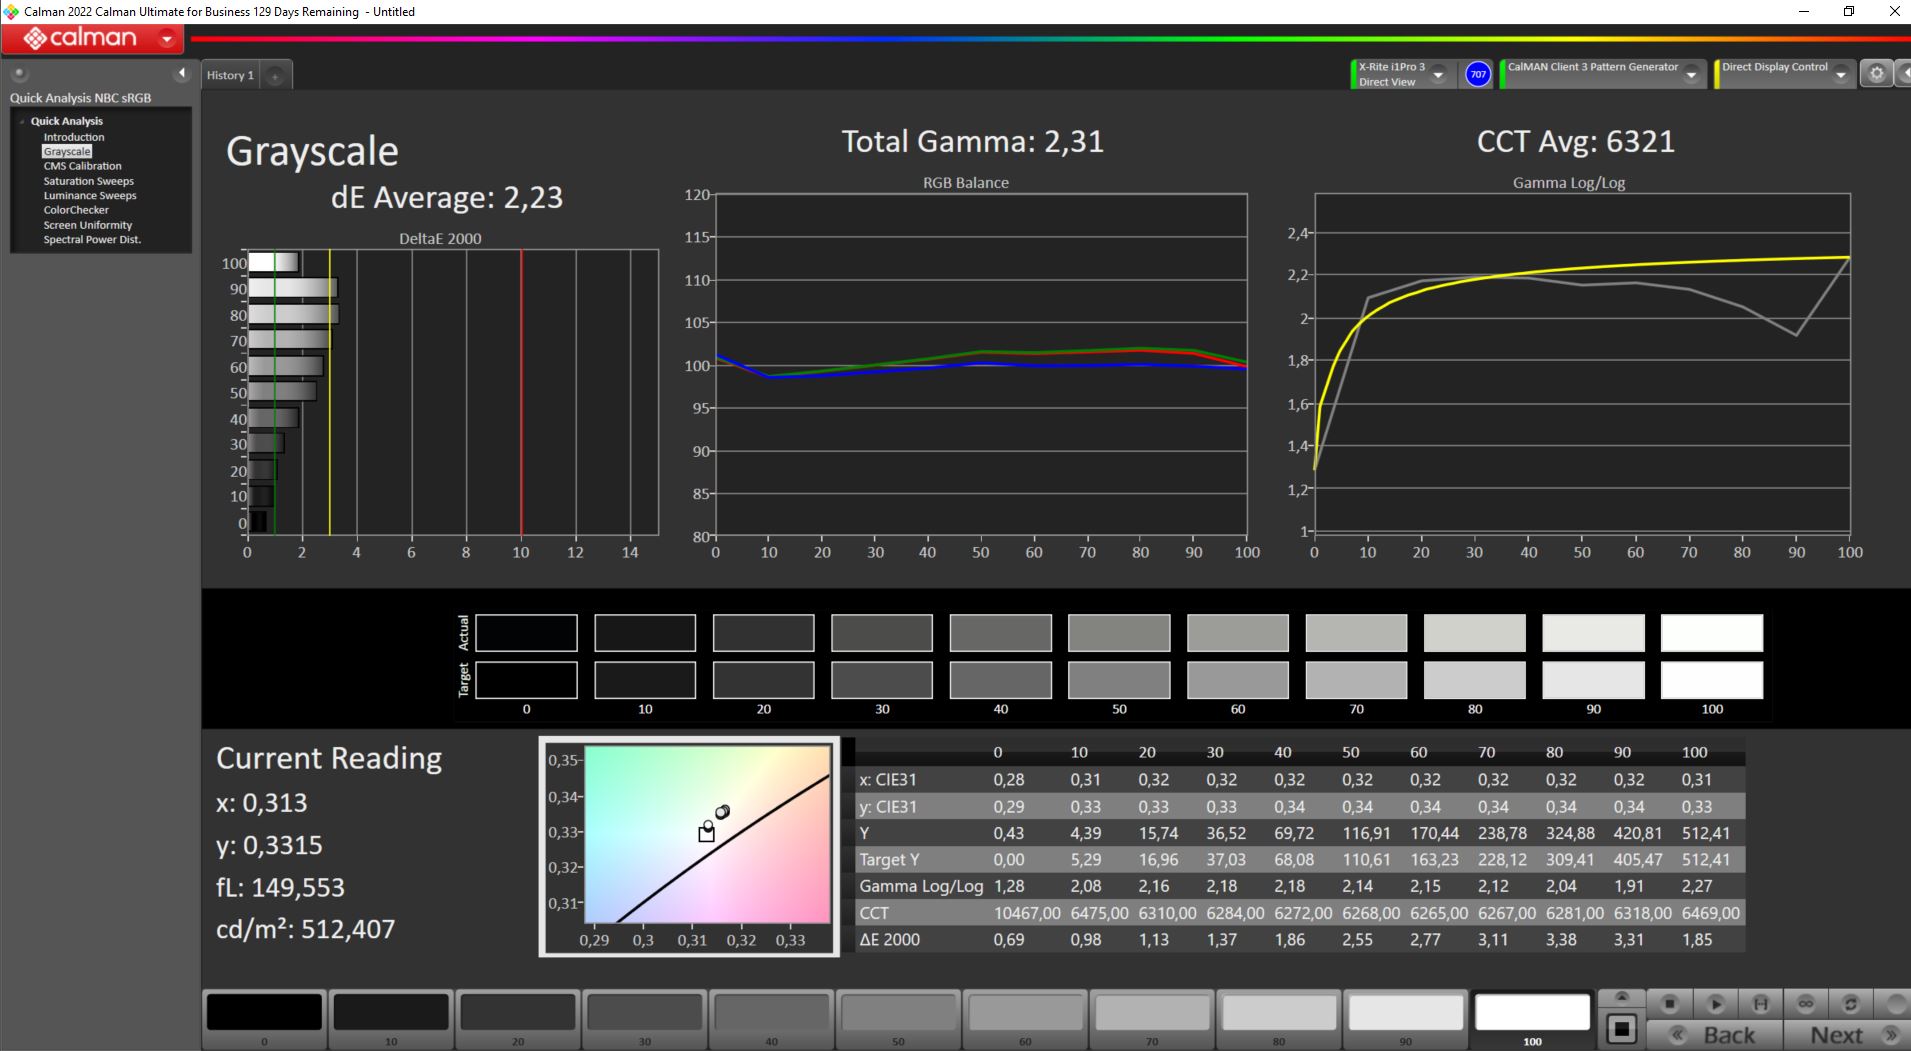
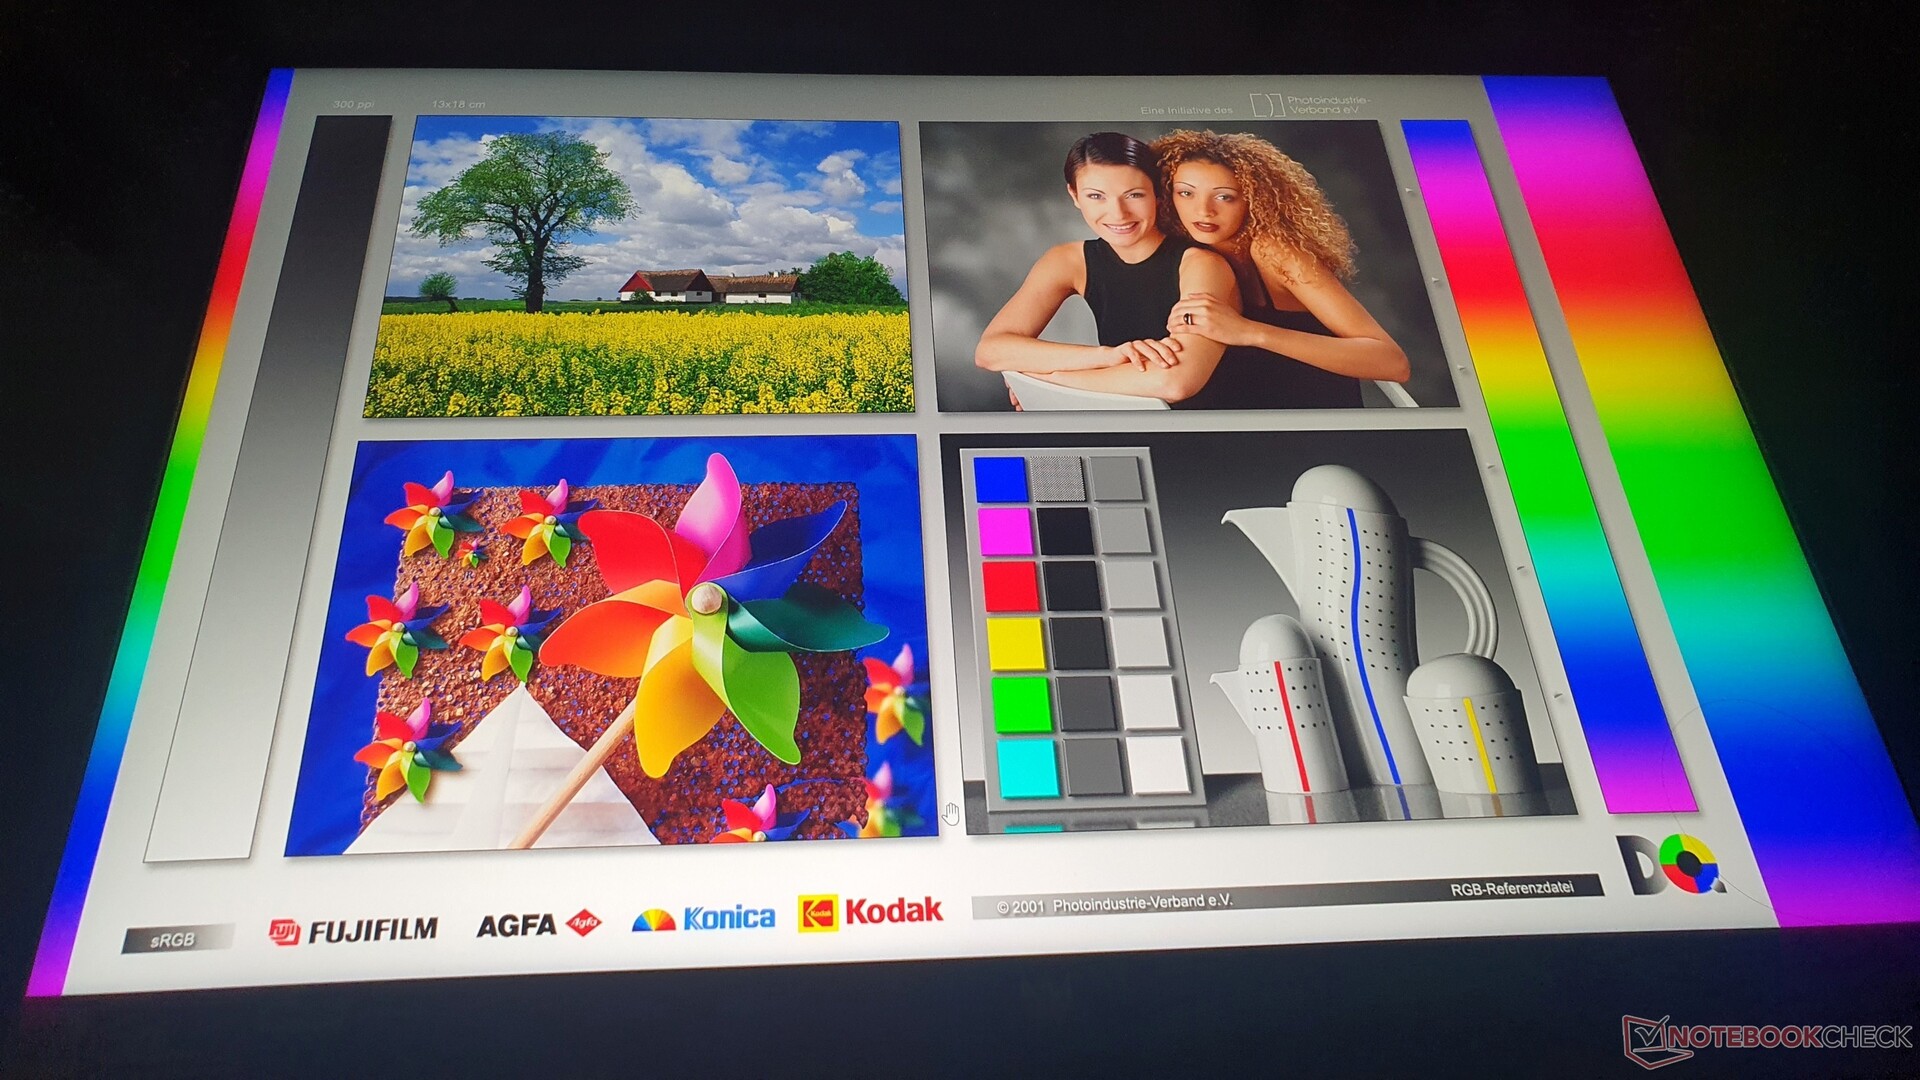
Display: A gaming machine with 97 % DCI P3, 500 cd/m² and 240 Hz
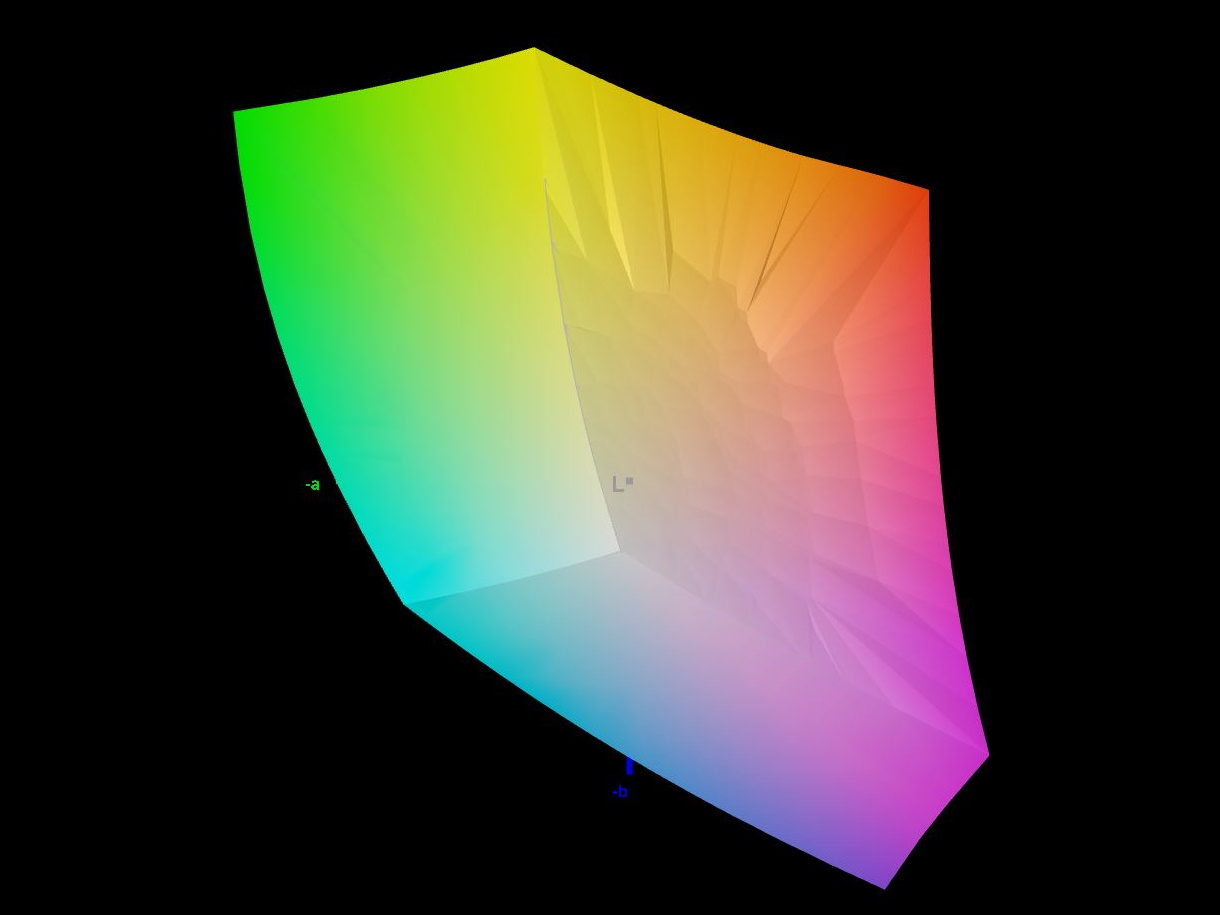
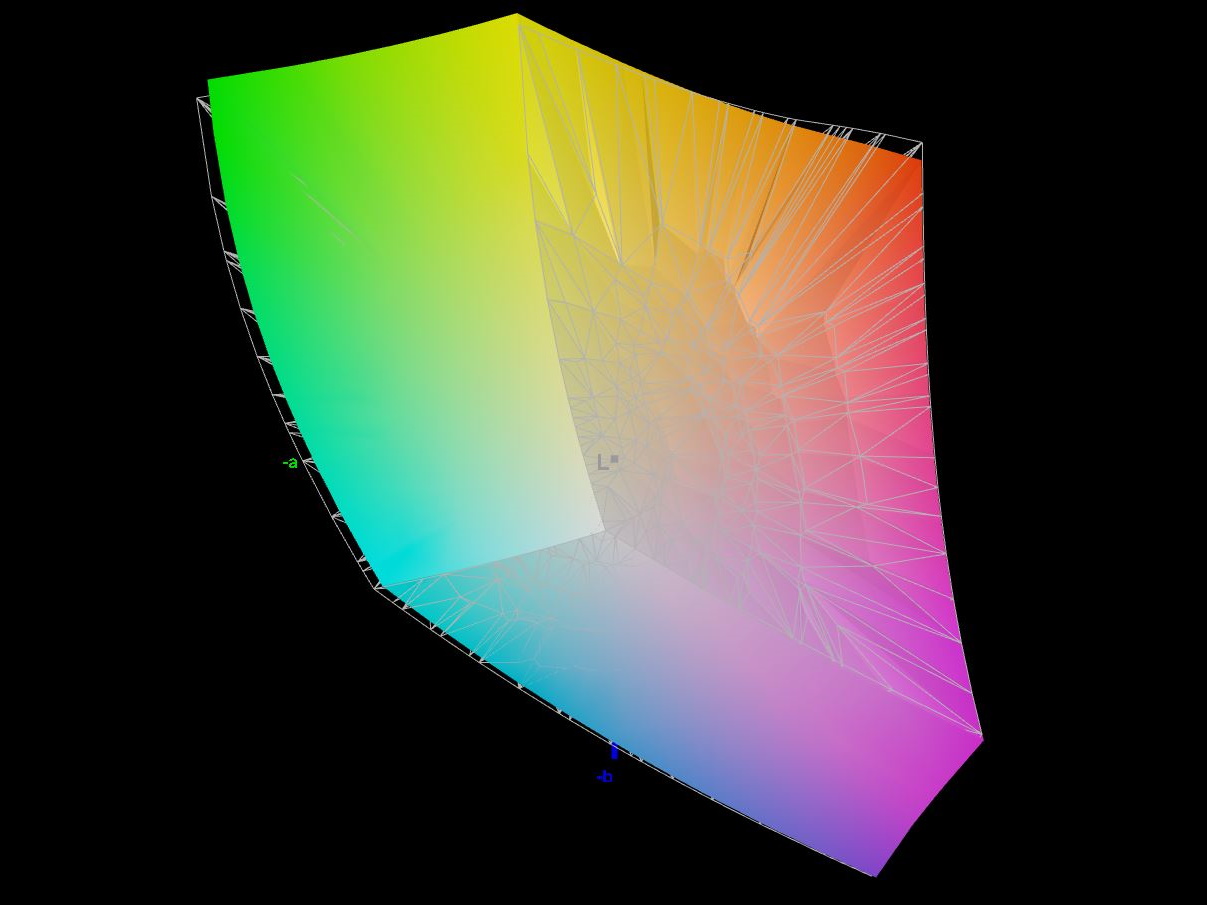
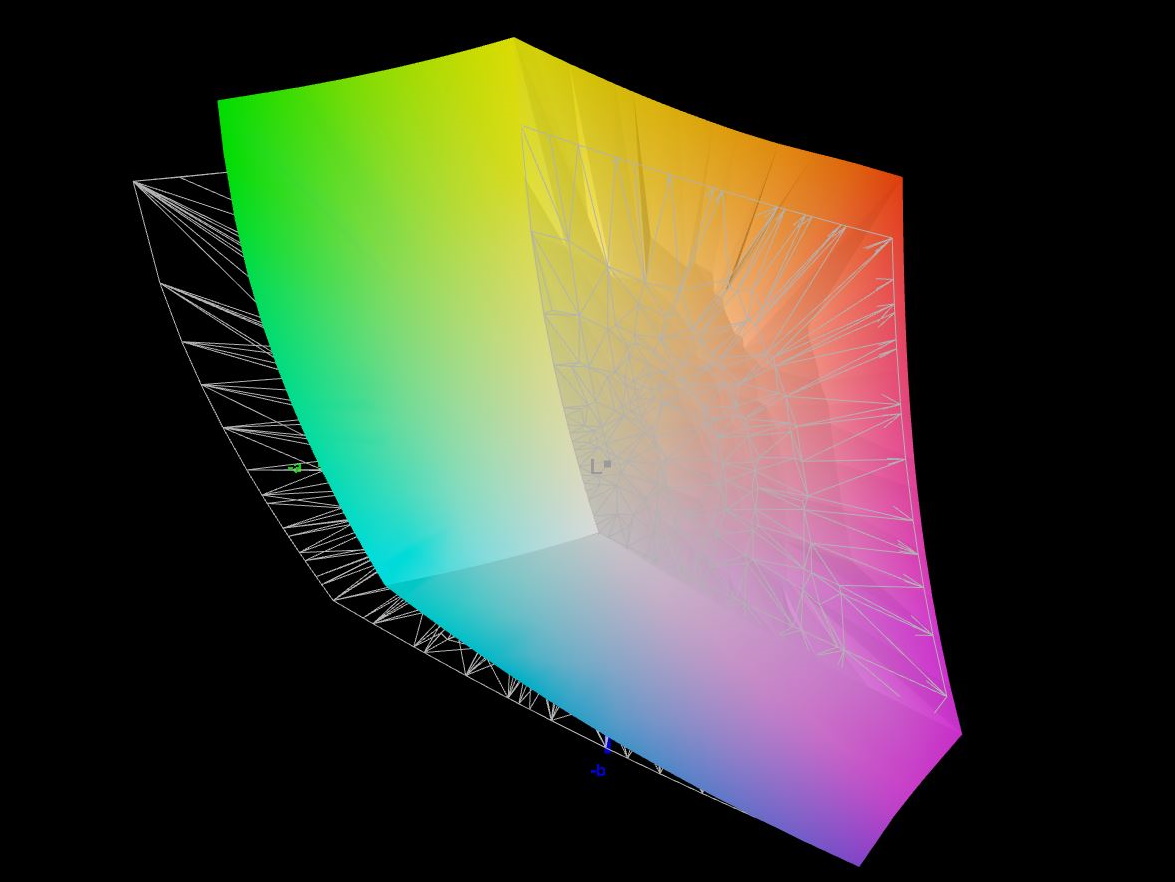
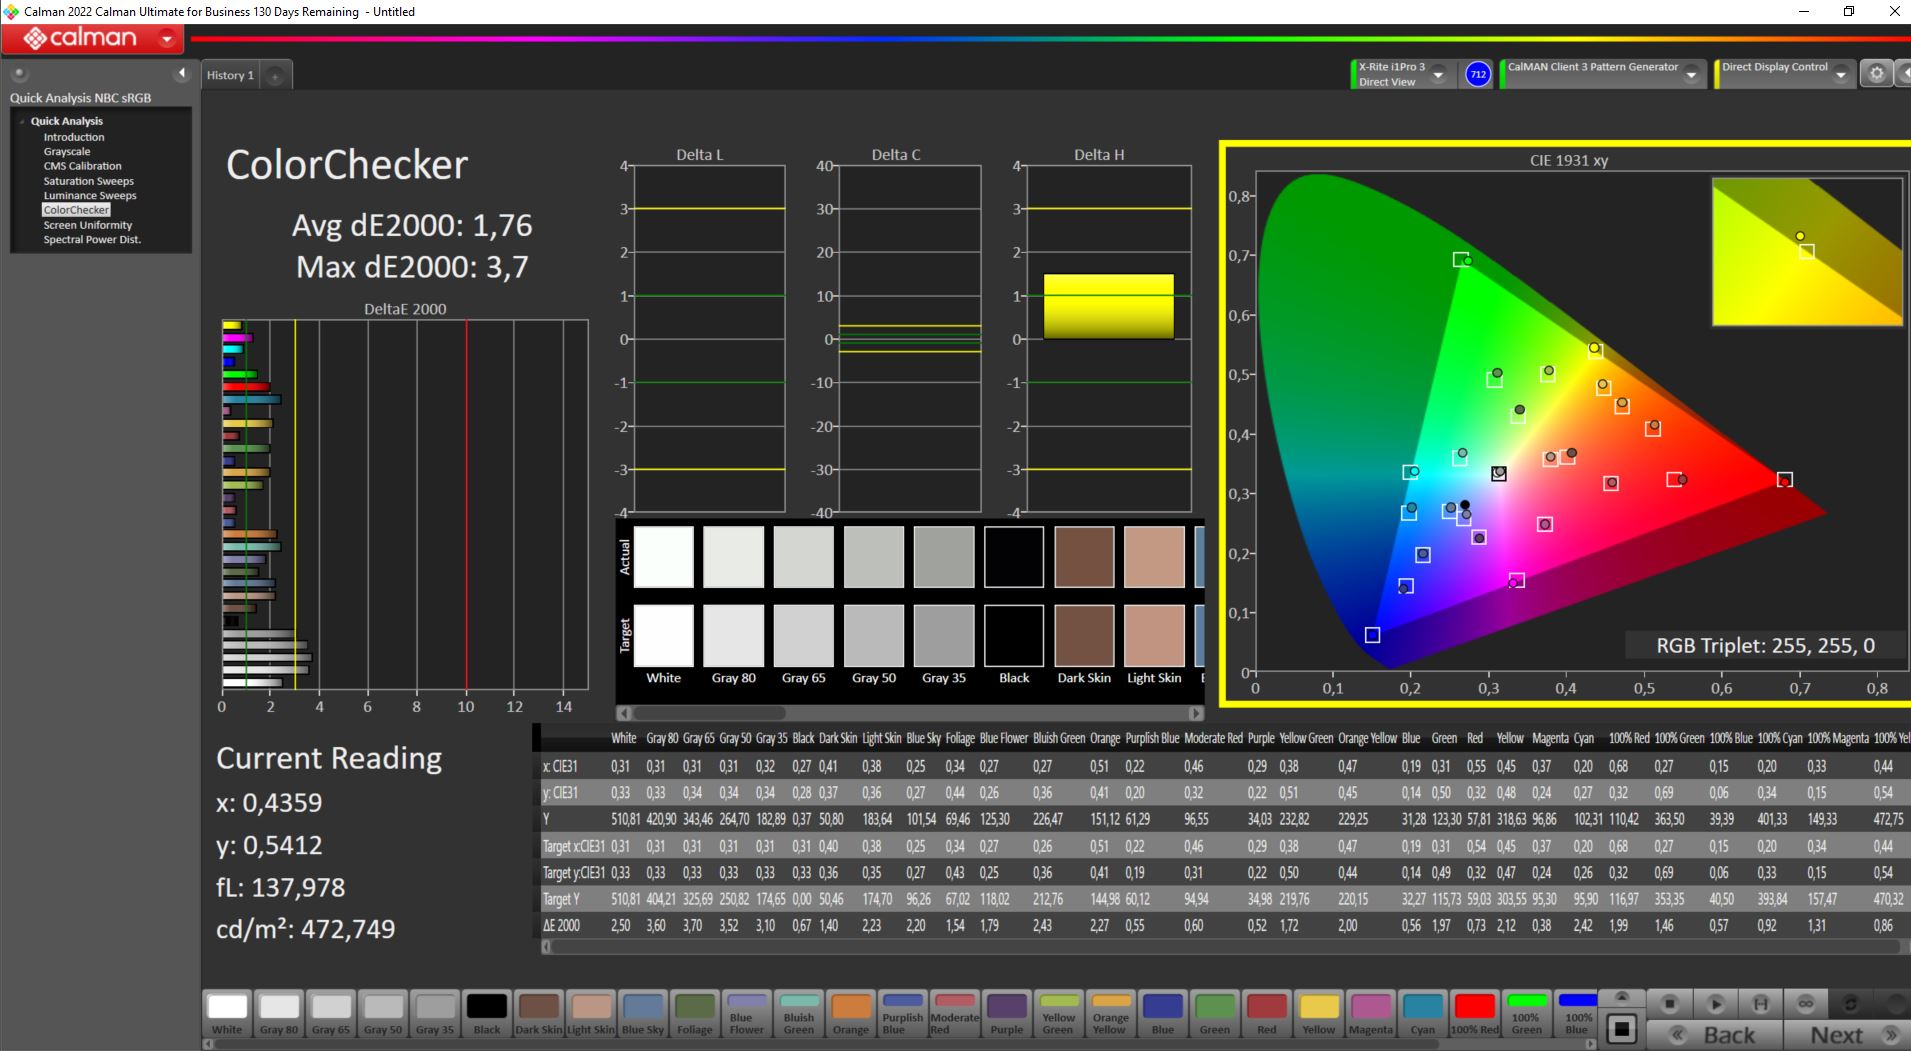
The review device with the model number PH16-71-731Q doesn't come with the optionally available mini-LED display and its 1,024 dimming zones. Nevertheless, we were surprised that the fast, 240 Hz, matte IPS, 2,560 x 1,600-pixel resolution panel (16:10) proudly covers 97 % of the DCI P3 color space. This means images, in games amongst other things, appear even more vivid.
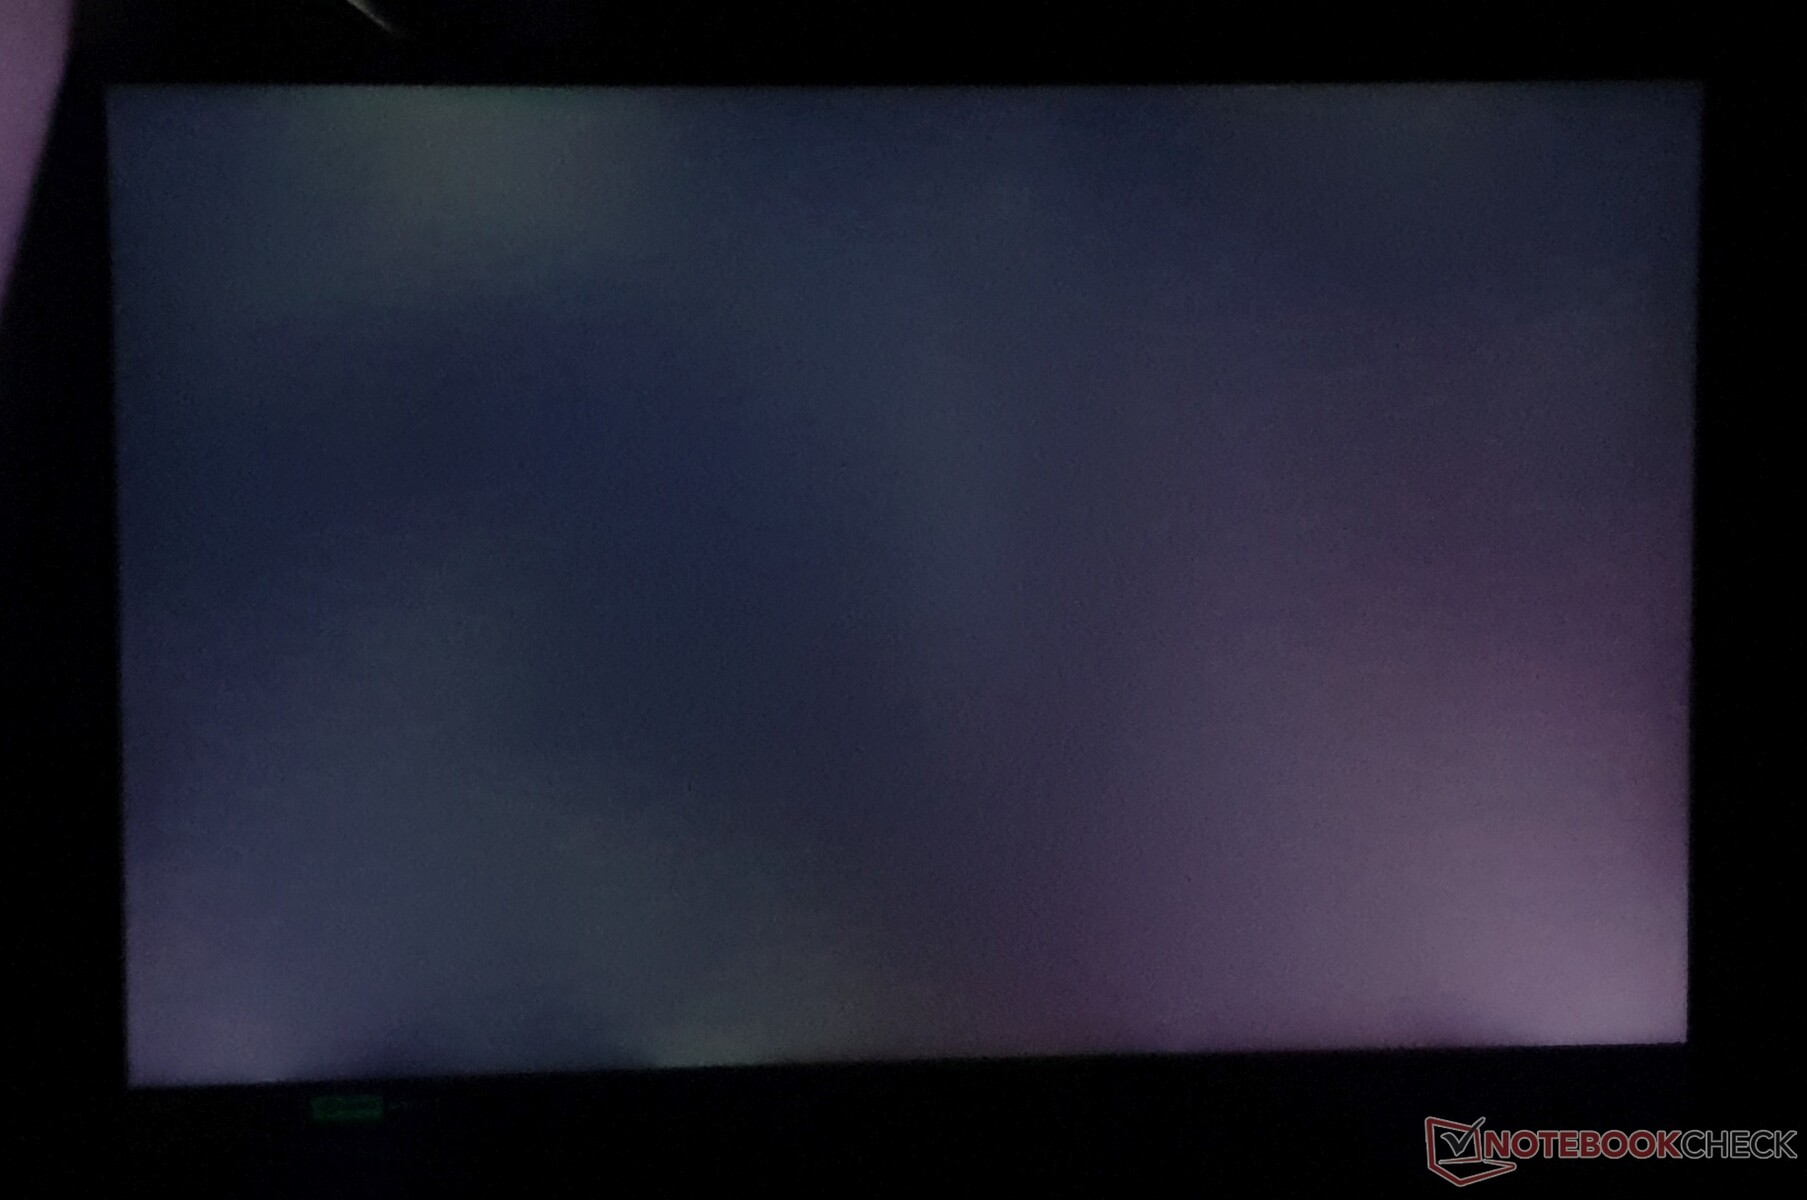
All the other key data also looks good: Brightness of just under 500 cd/m², high contrast of 1,419:1 and even illumination of 94 %. In addition, PWM, which can lead to eye strain or headaches, is not used. The Acer Nitro 16 is the only competitor in our list of competing devices that manages a brightness of significantly over ~300 cd/m².
The good gray-to-gray response times of 13.6 ms and black-to-white of 6.4 ms are similar to its peers whereby the Dell G15 5530 has its nose in front with a gray-to-gray time of only 3.4 ms. Additionally, Nvidia G-Sync and Dolby Vision are also supported.
| |||||||||||||||||||||||||
Brightness Distribution: 94 %
Center on Battery: 511 cd/m²
Contrast: 1419:1 (Black: 0.36 cd/m²)
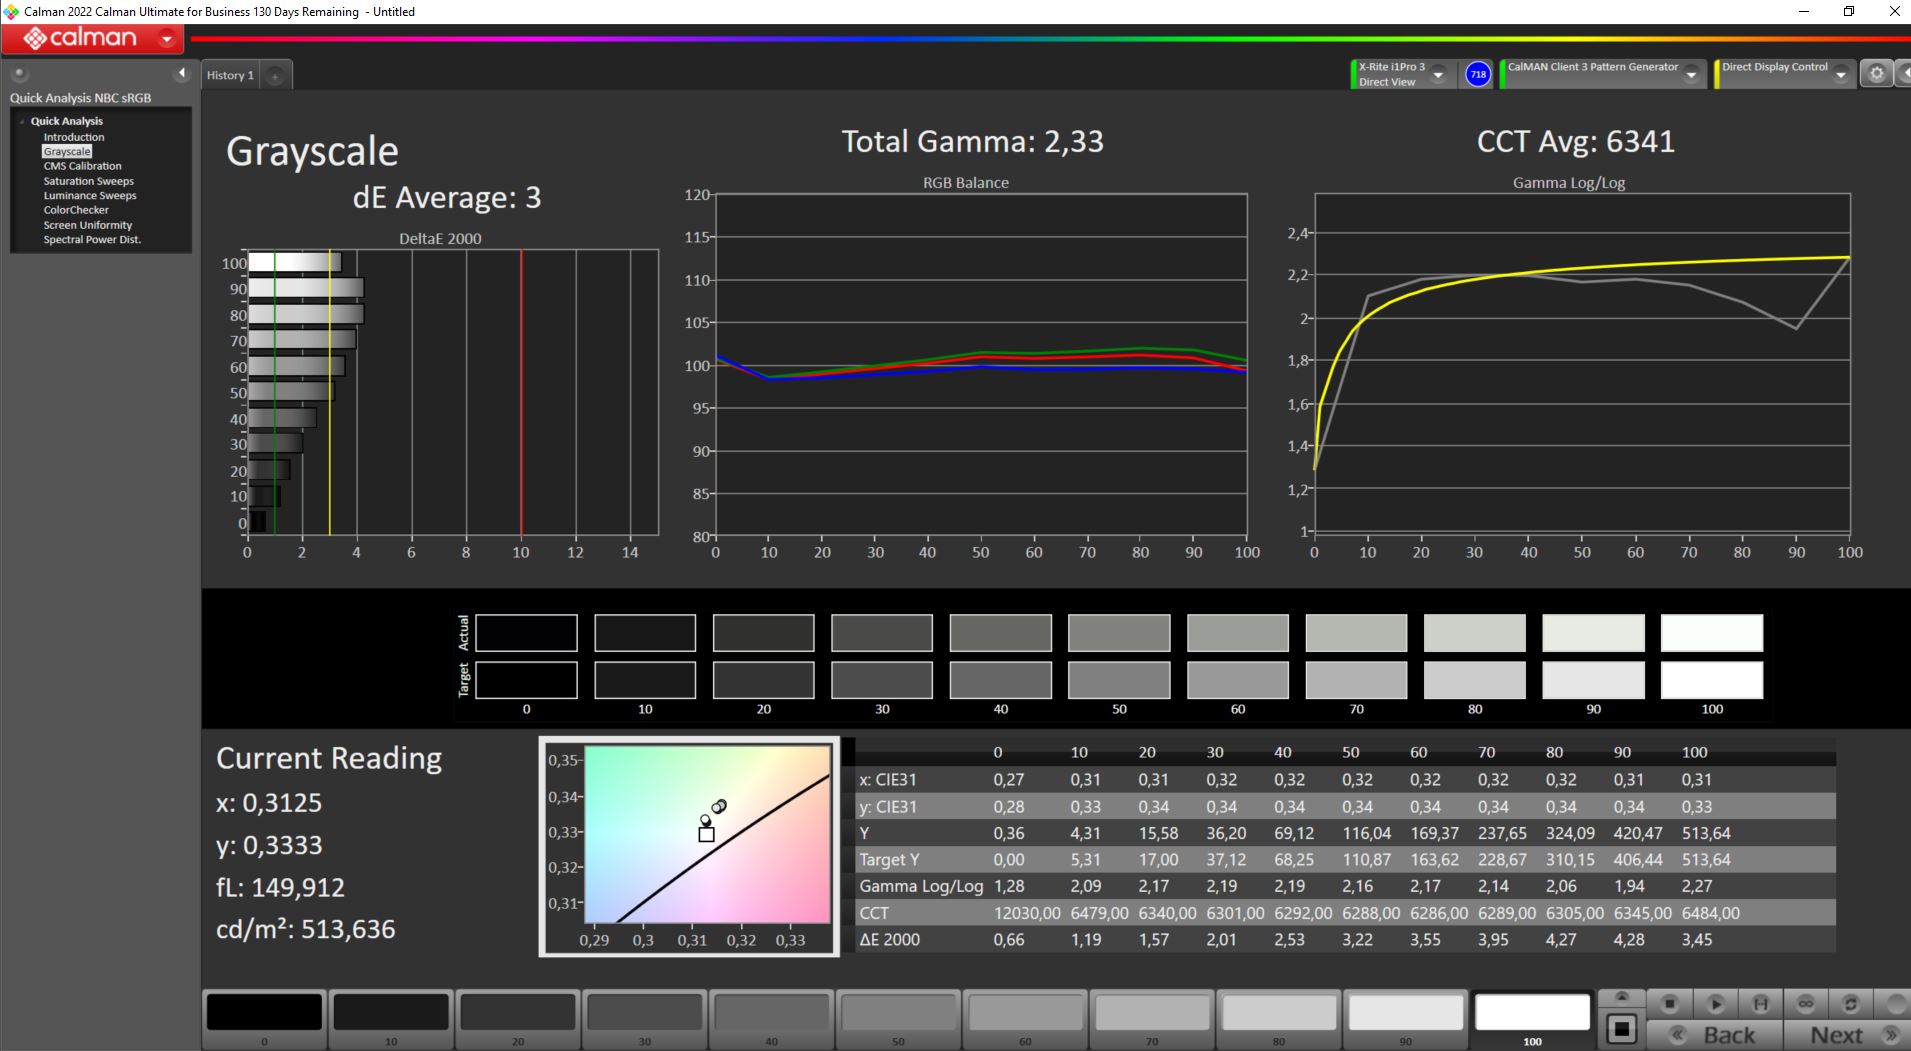
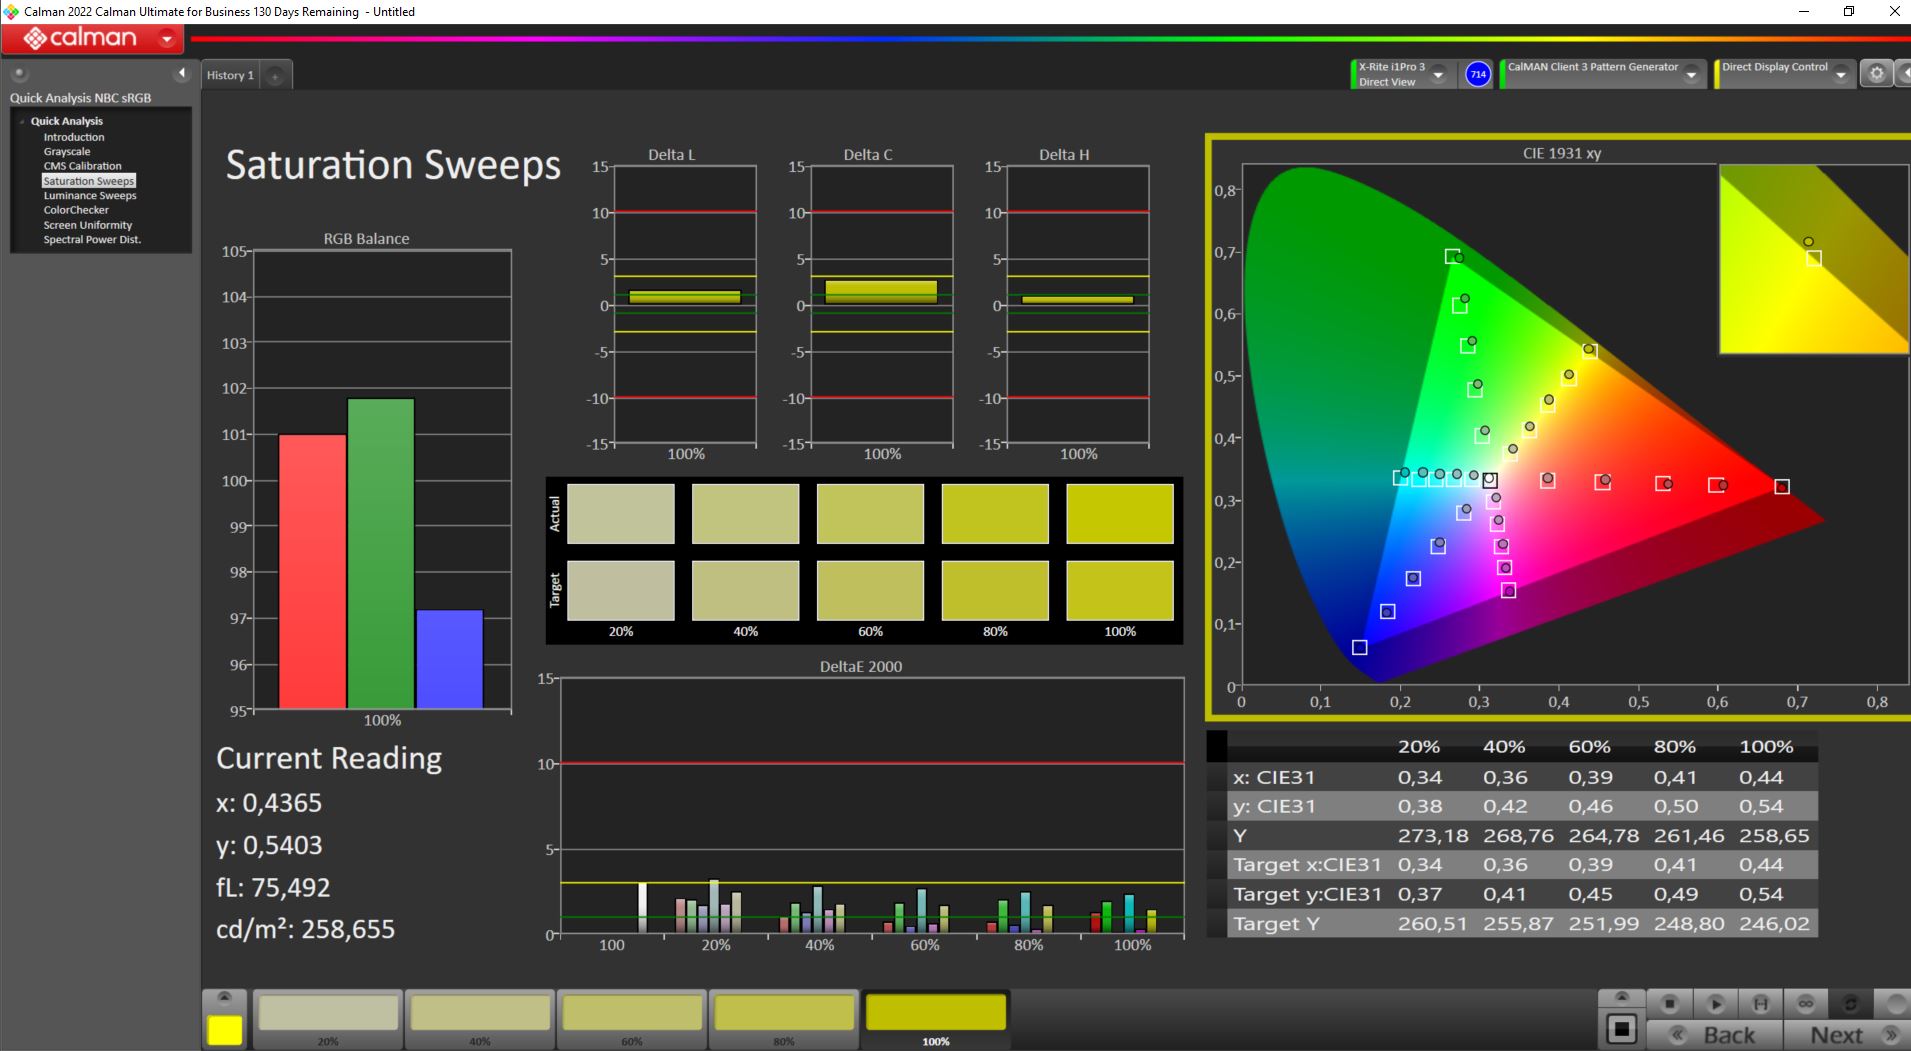
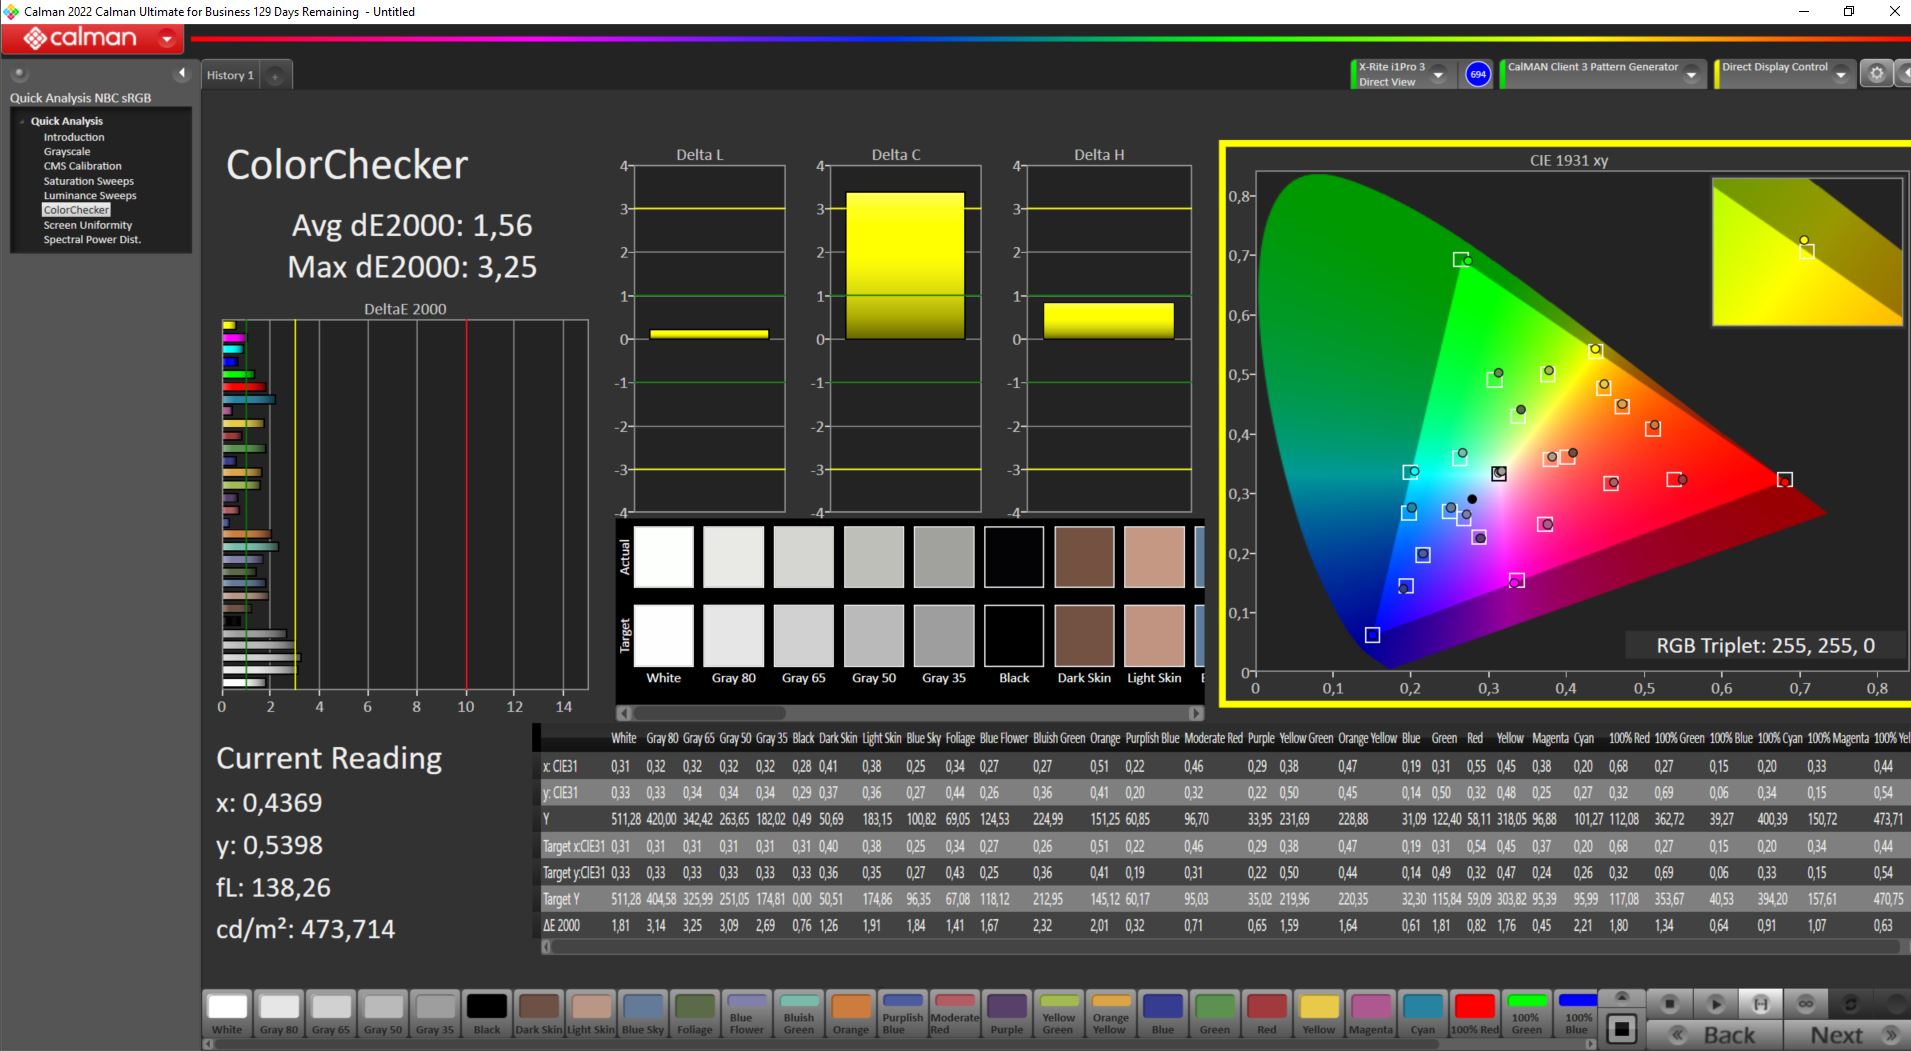
ΔE ColorChecker Calman: 1.76 | ∀{0.5-29.43 Ø4.73}
calibrated: 1.56
ΔE Greyscale Calman: 3 | ∀{0.09-98 Ø4.97}
84.7% AdobeRGB 1998 (Argyll 3D)
100% sRGB (Argyll 3D)
97.1% Display P3 (Argyll 3D)
Gamma: 2.33
CCT: 6341 K
| Acer Predator Helios 16 PH16-71-731Q BOE NE160QDM-NZ2, IPS-LED, 2560x1600, 16" | Acer Nitro 16 AN16-41 BOE CQ NE16QDM-NY1, IPS, 2560x1600, 16" | Lenovo Legion Pro 5 16IRX8 AU Optronics B160QAN03.1, IPS, 2560x1600, 16" | Aorus 15X ASF BOE CQ NE156QHM-NZ1, IPS, 2560x1440, 15.6" | Asus TUF Gaming A16 FA617 NE160WUM-NX2 (BOE0B33), IPS-Level, 1920x1200, 16" | Dell G15 5530 AUO B156HAN, IPS, 1920x1080, 15.6" | |
|---|---|---|---|---|---|---|
| Display | -16% | -14% | -16% | -16% | -13% | |
| Display P3 Coverage (%) | 97.1 | 67.9 -30% | 71.2 -27% | 69.3 -29% | 69.4 -29% | 73.1 -25% |
| sRGB Coverage (%) | 100 | 99.1 -1% | 98.8 -1% | 98.2 -2% | 97.8 -2% | 98.4 -2% |
| AdobeRGB 1998 Coverage (%) | 84.7 | 69.9 -17% | 73.3 -13% | 70.5 -17% | 70.9 -16% | 74.4 -12% |
| Response Times | 21% | -35% | -19% | -42% | 46% | |
| Response Time Grey 50% / Grey 80% * (ms) | 13.6 ? | 11 ? 19% | 14.5 ? -7% | 12.4 ? 9% | 17 ? -25% | 3.39 ? 75% |
| Response Time Black / White * (ms) | 6.4 ? | 5 ? 22% | 10.4 ? -63% | 9.4 ? -47% | 10.1 ? -58% | 5.35 ? 16% |
| PWM Frequency (Hz) | 21620 ? | |||||
| Screen | -3% | 4% | 5% | 5% | -50% | |
| Brightness middle (cd/m²) | 511 | 520 2% | 405.7 -21% | 316 -38% | 308 -40% | 320 -37% |
| Brightness (cd/m²) | 498 | 494 -1% | 368 -26% | 301 -40% | 293 -41% | 316 -37% |
| Brightness Distribution (%) | 94 | 91 -3% | 87 -7% | 90 -4% | 90 -4% | 94 0% |
| Black Level * (cd/m²) | 0.36 | 0.39 -8% | 0.38 -6% | 0.28 22% | 0.23 36% | 0.21 42% |
| Contrast (:1) | 1419 | 1333 -6% | 1068 -25% | 1129 -20% | 1339 -6% | 1524 7% |
| Colorchecker dE 2000 * | 1.76 | 1.94 -10% | 1.65 6% | 1.54 12% | 1.47 16% | 4.55 -159% |
| Colorchecker dE 2000 max. * | 3.7 | 5.62 -52% | 4.2 -14% | 2.46 34% | 2.98 19% | 9.83 -166% |
| Colorchecker dE 2000 calibrated * | 1.56 | 0.74 53% | 0.53 66% | 1.21 22% | 1.02 35% | 1.51 3% |
| Greyscale dE 2000 * | 3 | 2.94 2% | 1.2 60% | 1.3 57% | 2.2 27% | 6.2 -107% |
| Gamma | 2.33 94% | 2.37 93% | 2.3 96% | 2.307 95% | 2.228 99% | 2.07 106% |
| CCT | 6341 103% | 6443 101% | 6453 101% | 6456 101% | 6228 104% | 6479 100% |
| Total Average (Program / Settings) | 1% /
-2% | -15% /
-6% | -10% /
-3% | -18% /
-6% | -6% /
-29% |
* ... smaller is better
Since 100 % of sRGB, 97.1 % of DCI P3 and 84.7 % of AdobeRGB are covered, nothing stands in the way of photo and video editing, both of which rely on accurate colors. No gaming laptop in our comparison field can even get close to these numbers with the exception of the sRGB color space.
Out-of-the-box, the colors and gray scales are already calibrated and therefore do not exceed the DeltaE 3 limit, up to which the human eye can detect color deviations. Our calibration managed to further improve these values with no visible color cast. Our calibrated color profile can be downloaded here.

Display Response Times
| ↔ Response Time Black to White | ||
|---|---|---|
| 6.4 ms ... rise ↗ and fall ↘ combined | ↗ 2.2 ms rise | 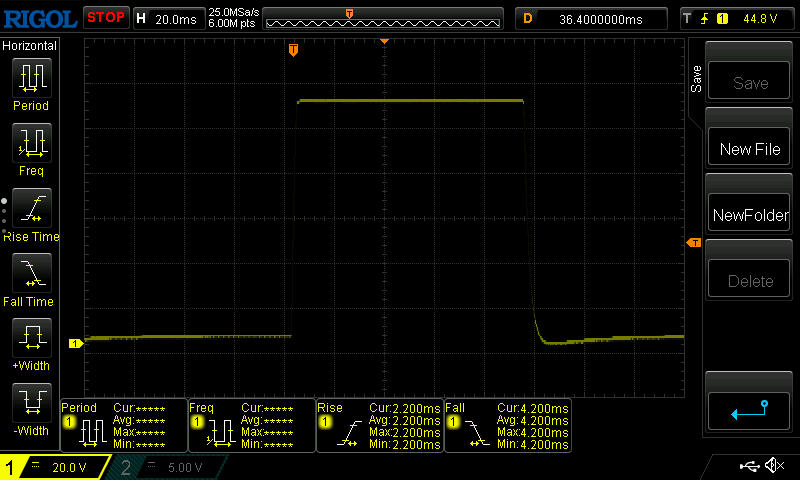 |
| ↘ 4.2 ms fall | ||
| The screen shows very fast response rates in our tests and should be very well suited for fast-paced gaming. In comparison, all tested devices range from 0.1 (minimum) to 240 (maximum) ms. » 20 % of all devices are better. This means that the measured response time is better than the average of all tested devices (19.9 ms). | ||
| ↔ Response Time 50% Grey to 80% Grey | ||
| 13.6 ms ... rise ↗ and fall ↘ combined | ↗ 6.2 ms rise | 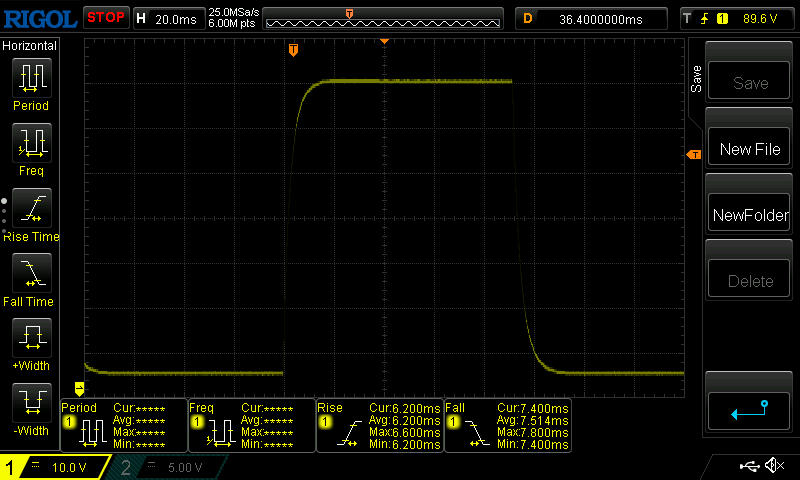 |
| ↘ 7.4 ms fall | ||
| The screen shows good response rates in our tests, but may be too slow for competitive gamers. In comparison, all tested devices range from 0.165 (minimum) to 636 (maximum) ms. » 27 % of all devices are better. This means that the measured response time is better than the average of all tested devices (31.1 ms). | ||
Screen Flickering / PWM (Pulse-Width Modulation)
| Screen flickering / PWM not detected |  | ||
In comparison: 52 % of all tested devices do not use PWM to dim the display. If PWM was detected, an average of 7798 (minimum: 5 - maximum: 343500) Hz was measured. | |||
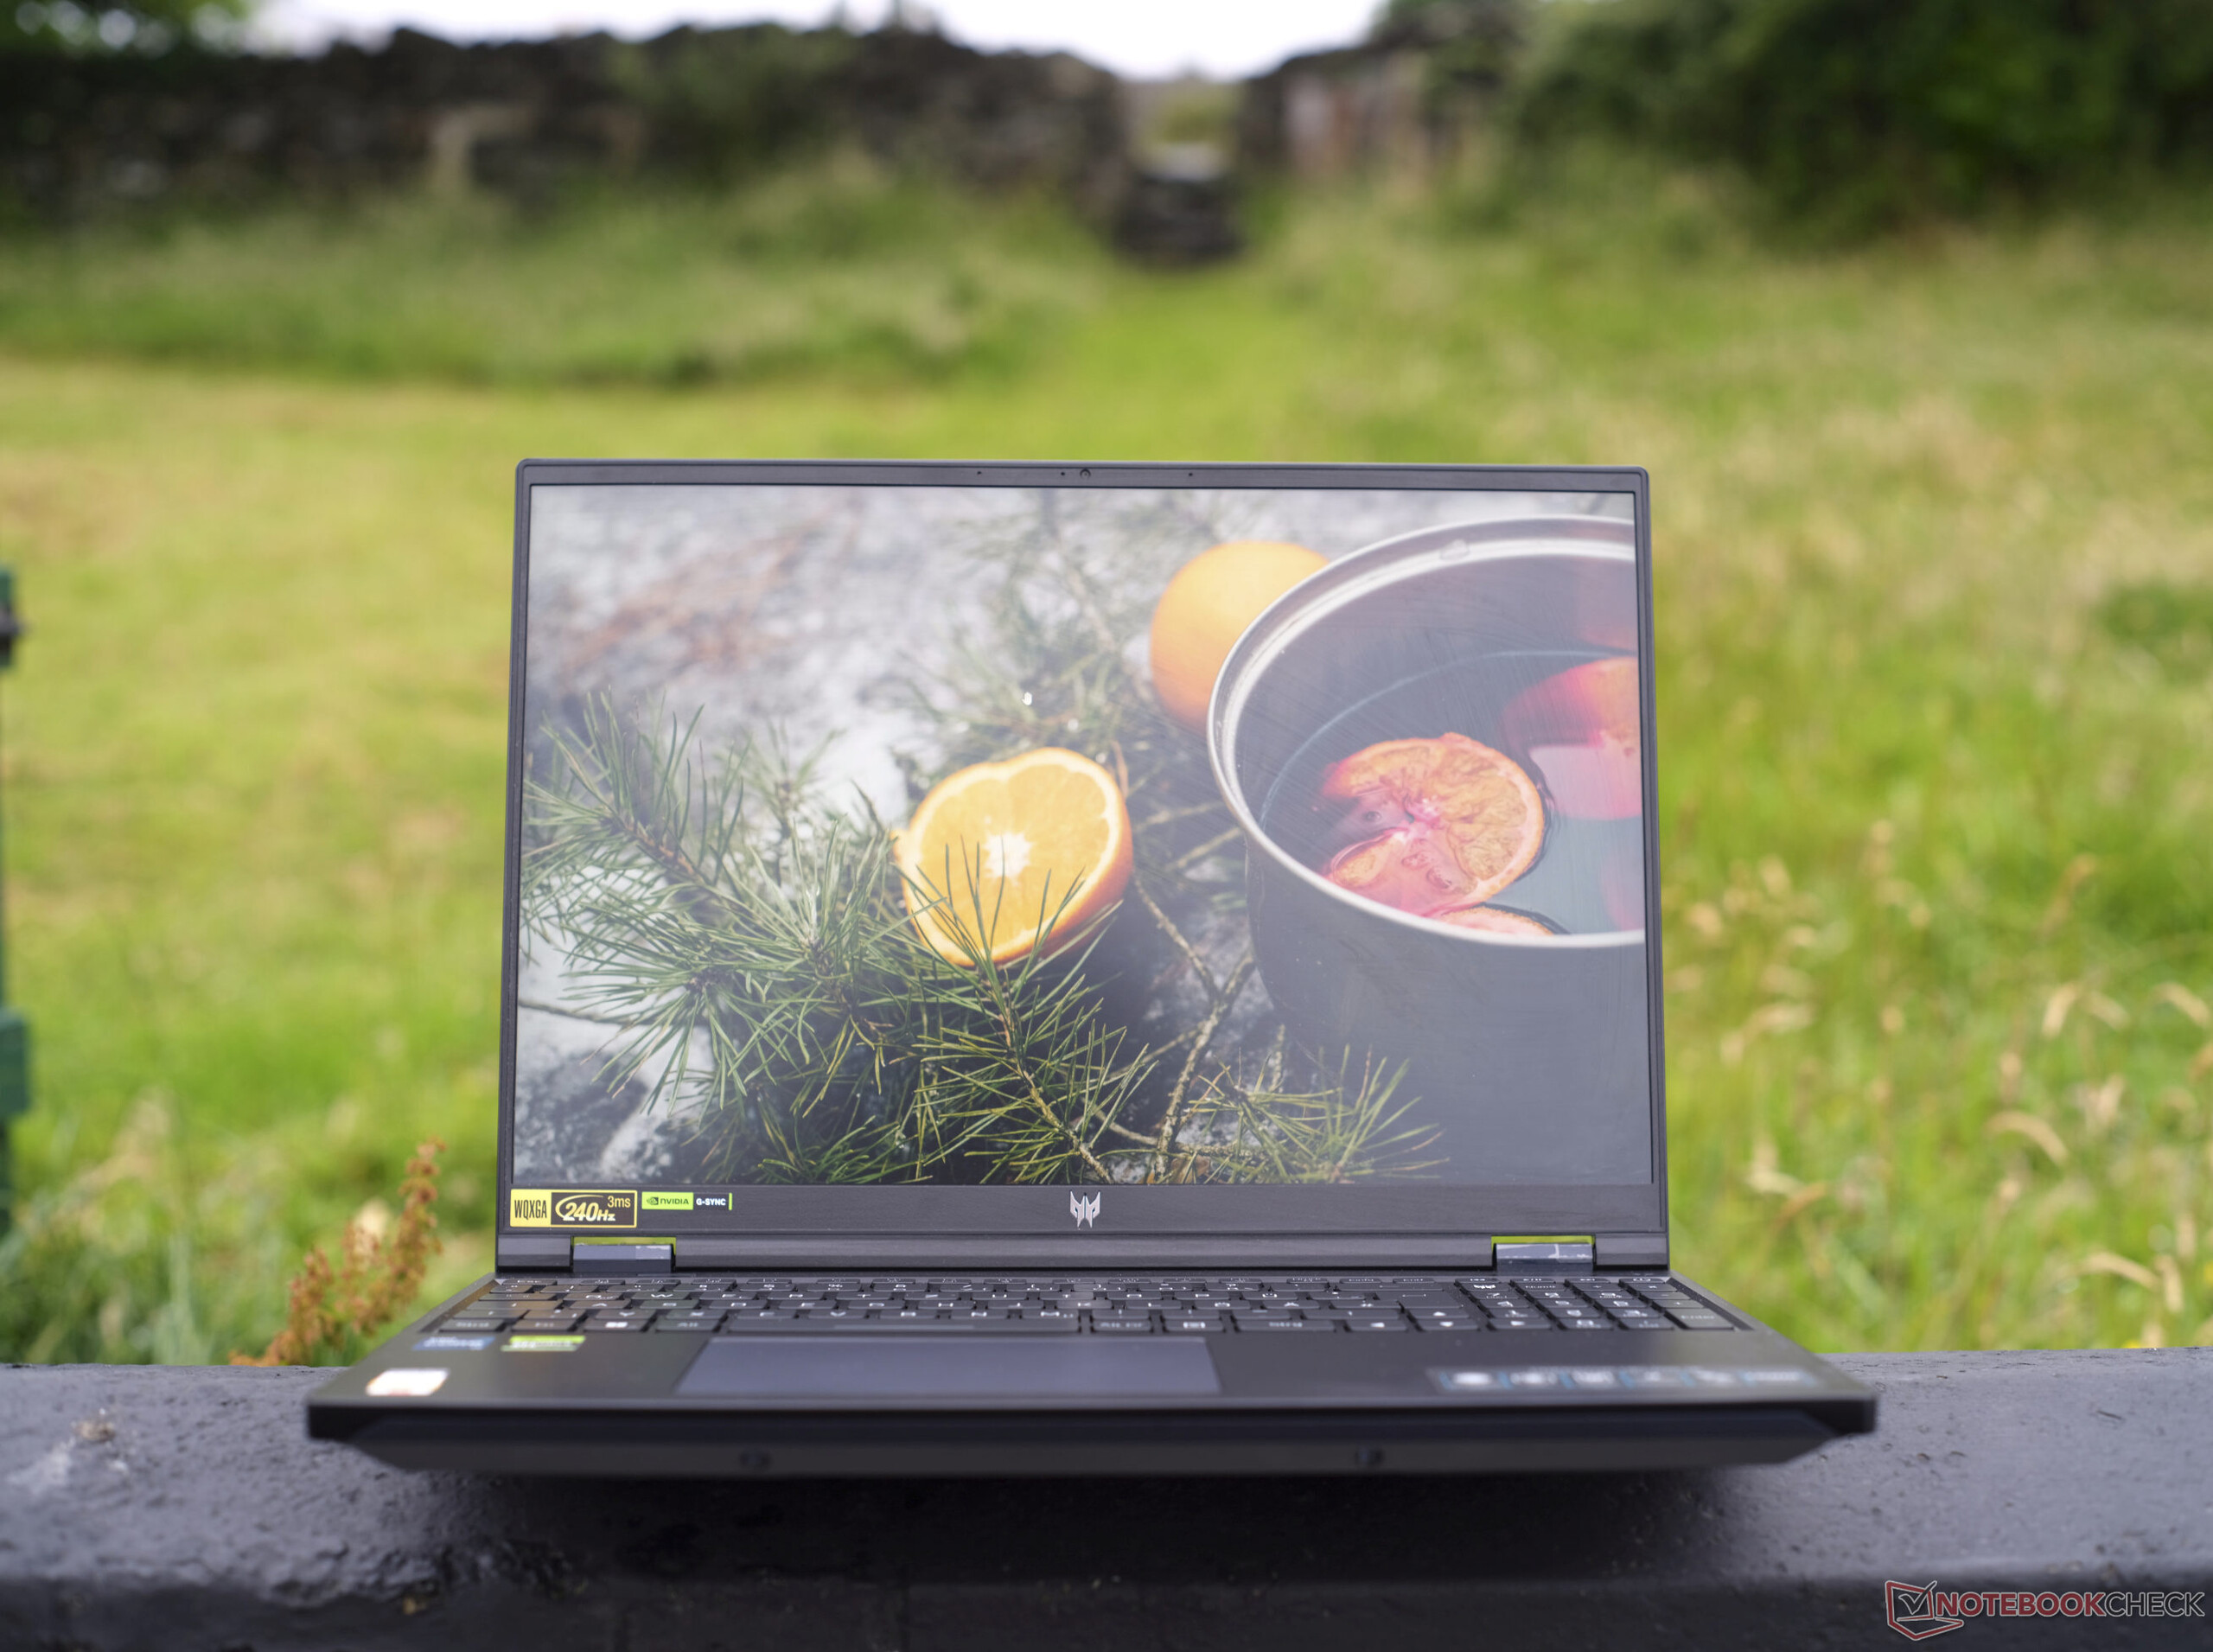
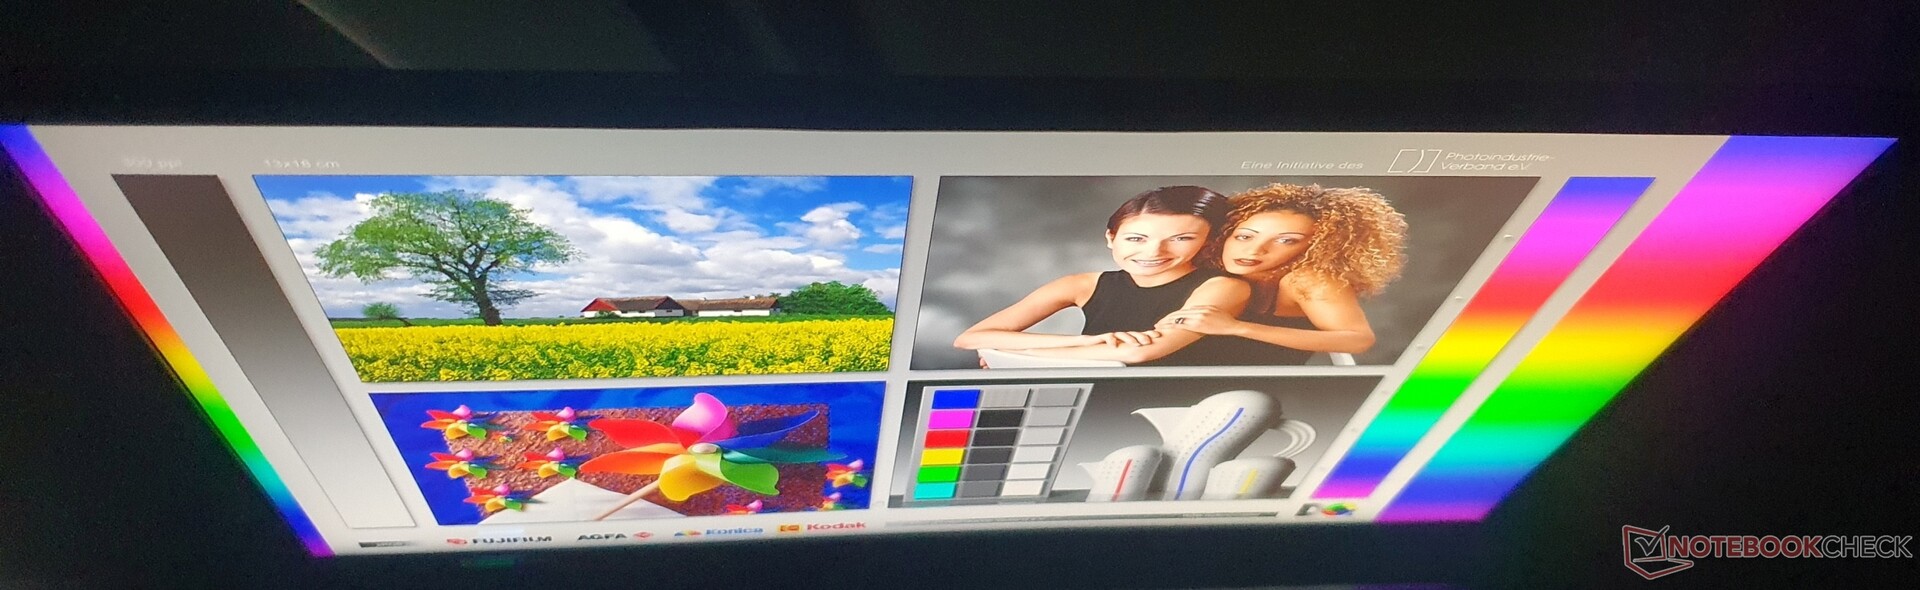
Outdoors, the screen is legible both in the shade and semi-shaded areas. In direct sunlight, even a matte display and 500 cd/m² don't always help.

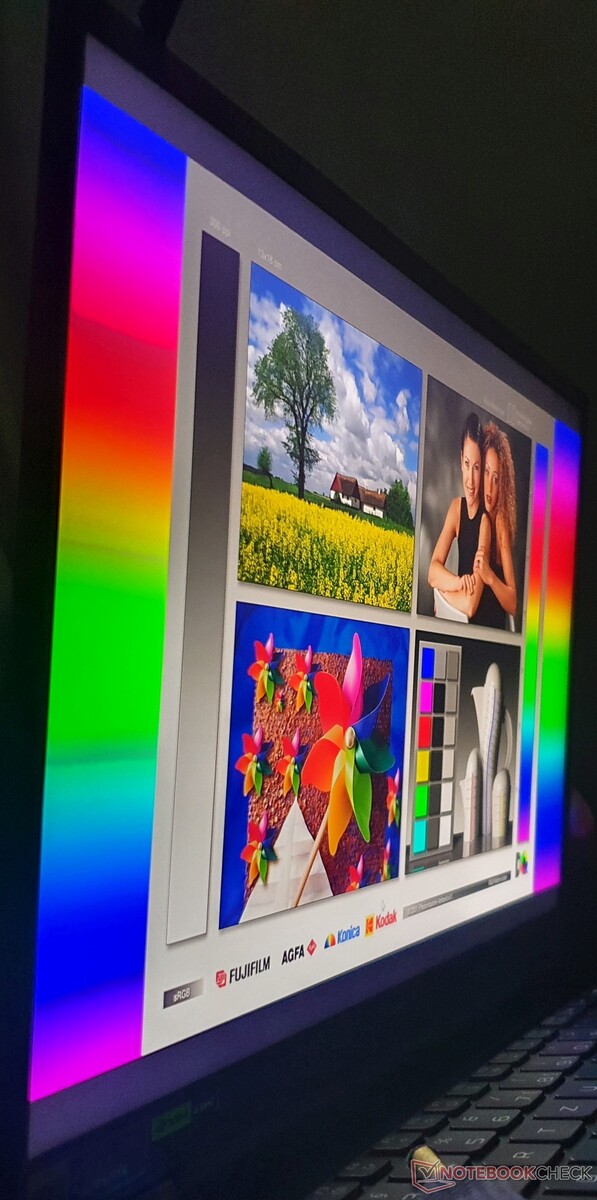
Typical for an IPS panel, the viewing angles are stable, from above, from below and also from the side.
Performance: The RTX 4060 already reaches its maximum clock speed at 100 watts
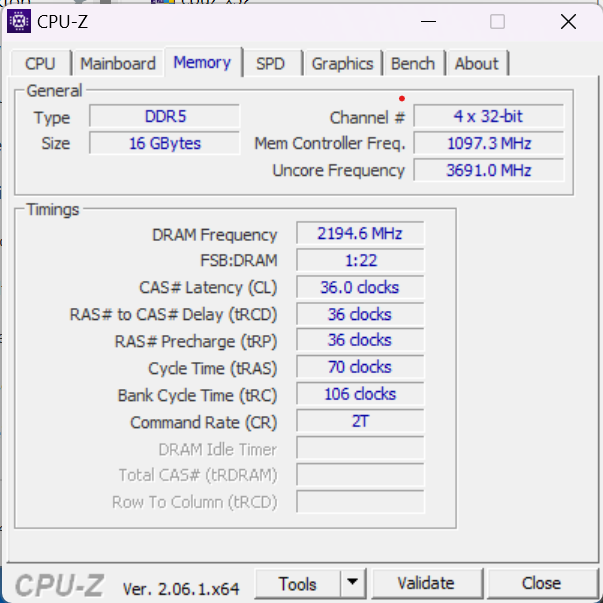
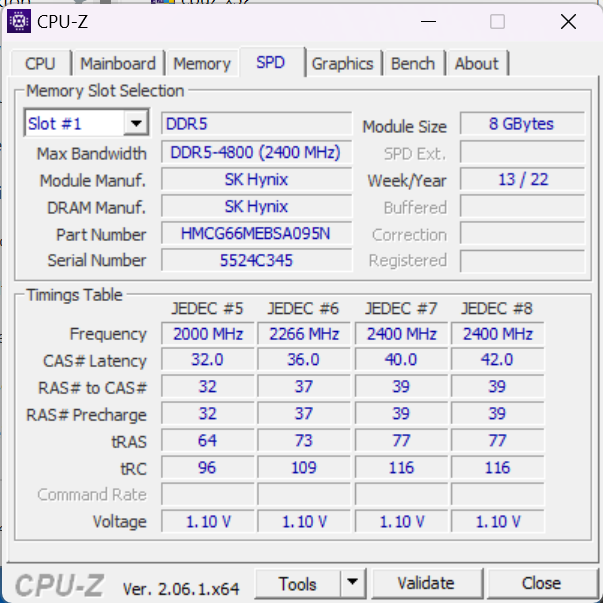
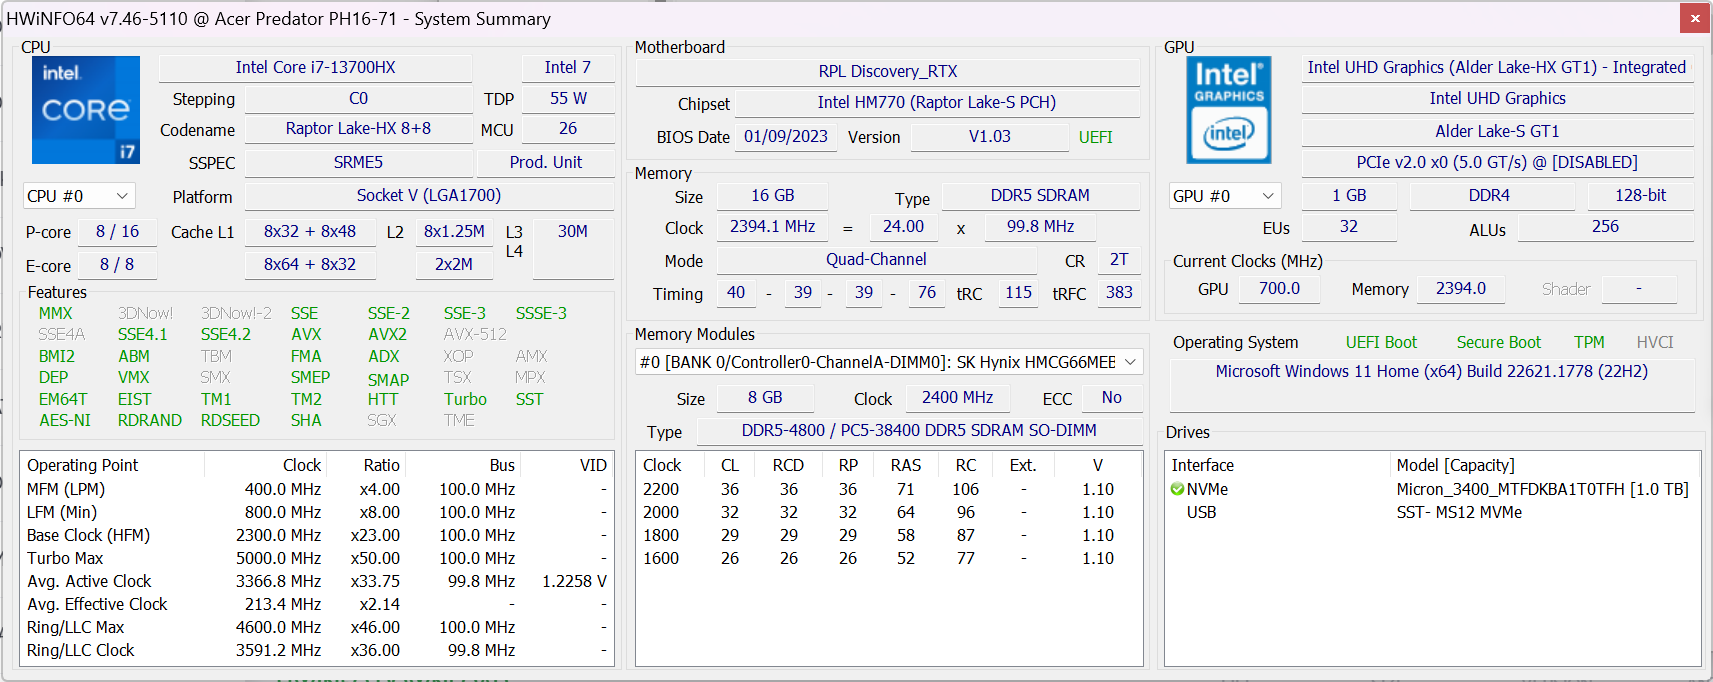
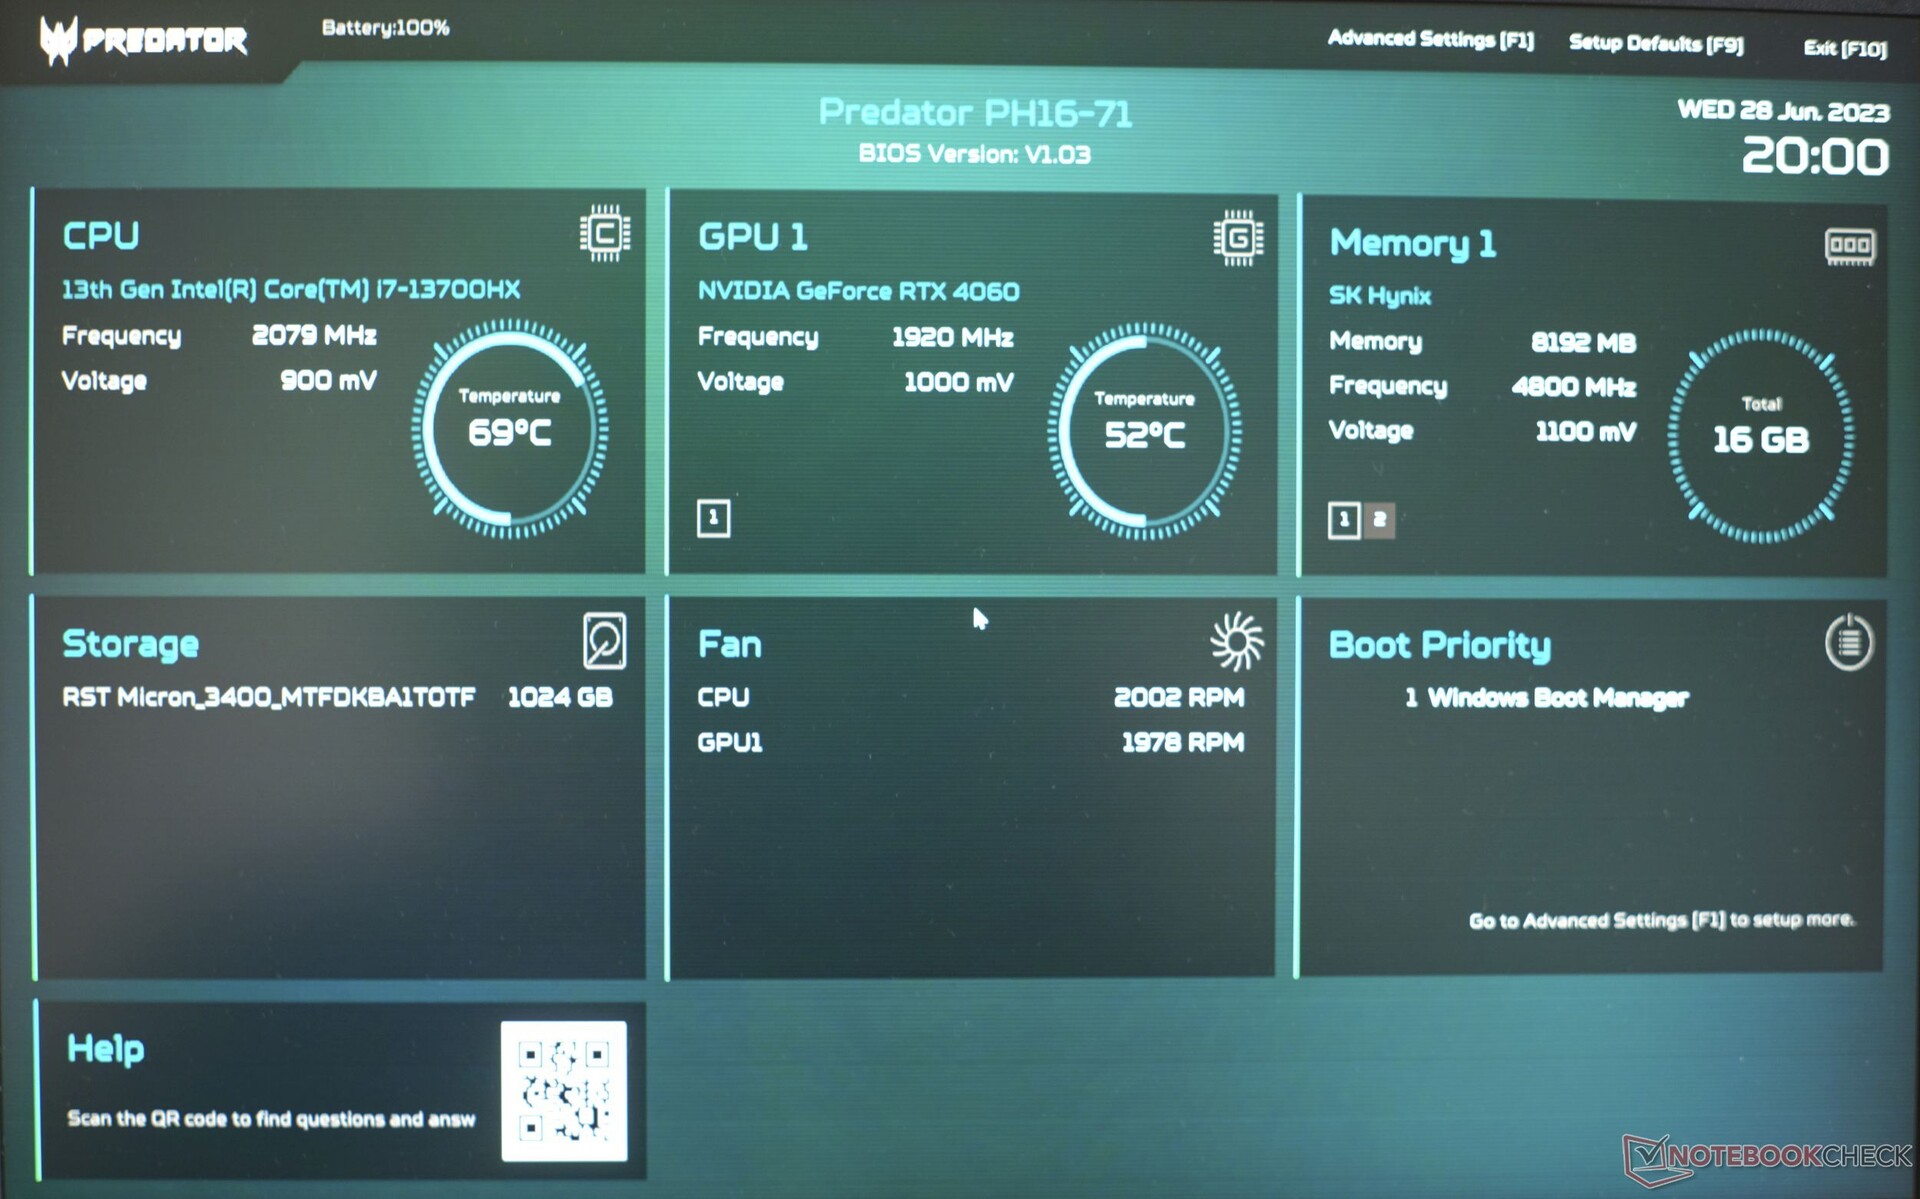
Our review configuration Acer Predator Helios 16 has an Intel Core i7-13700HX (8 P-cores + 8 E-cores), 16 GB of DDR5-4800 RAM, a 1 TB SSD drive (PCIe 4.0) and an Nvidia GeForce RTX 4060 with the highest TGP possible (140 watts). Other SKUs are available with a Core i9-13900HX (8 P-cores + 16 E-cores), an RTX 4070 or RTX 4080.
The review model's target market is gamers who don't need to play current games either at the highest frame rates or at the device's native QHD resolution. Other graphic applications such as 4K video editing or 3D rendering are easily achievable with this model.
Test conditions

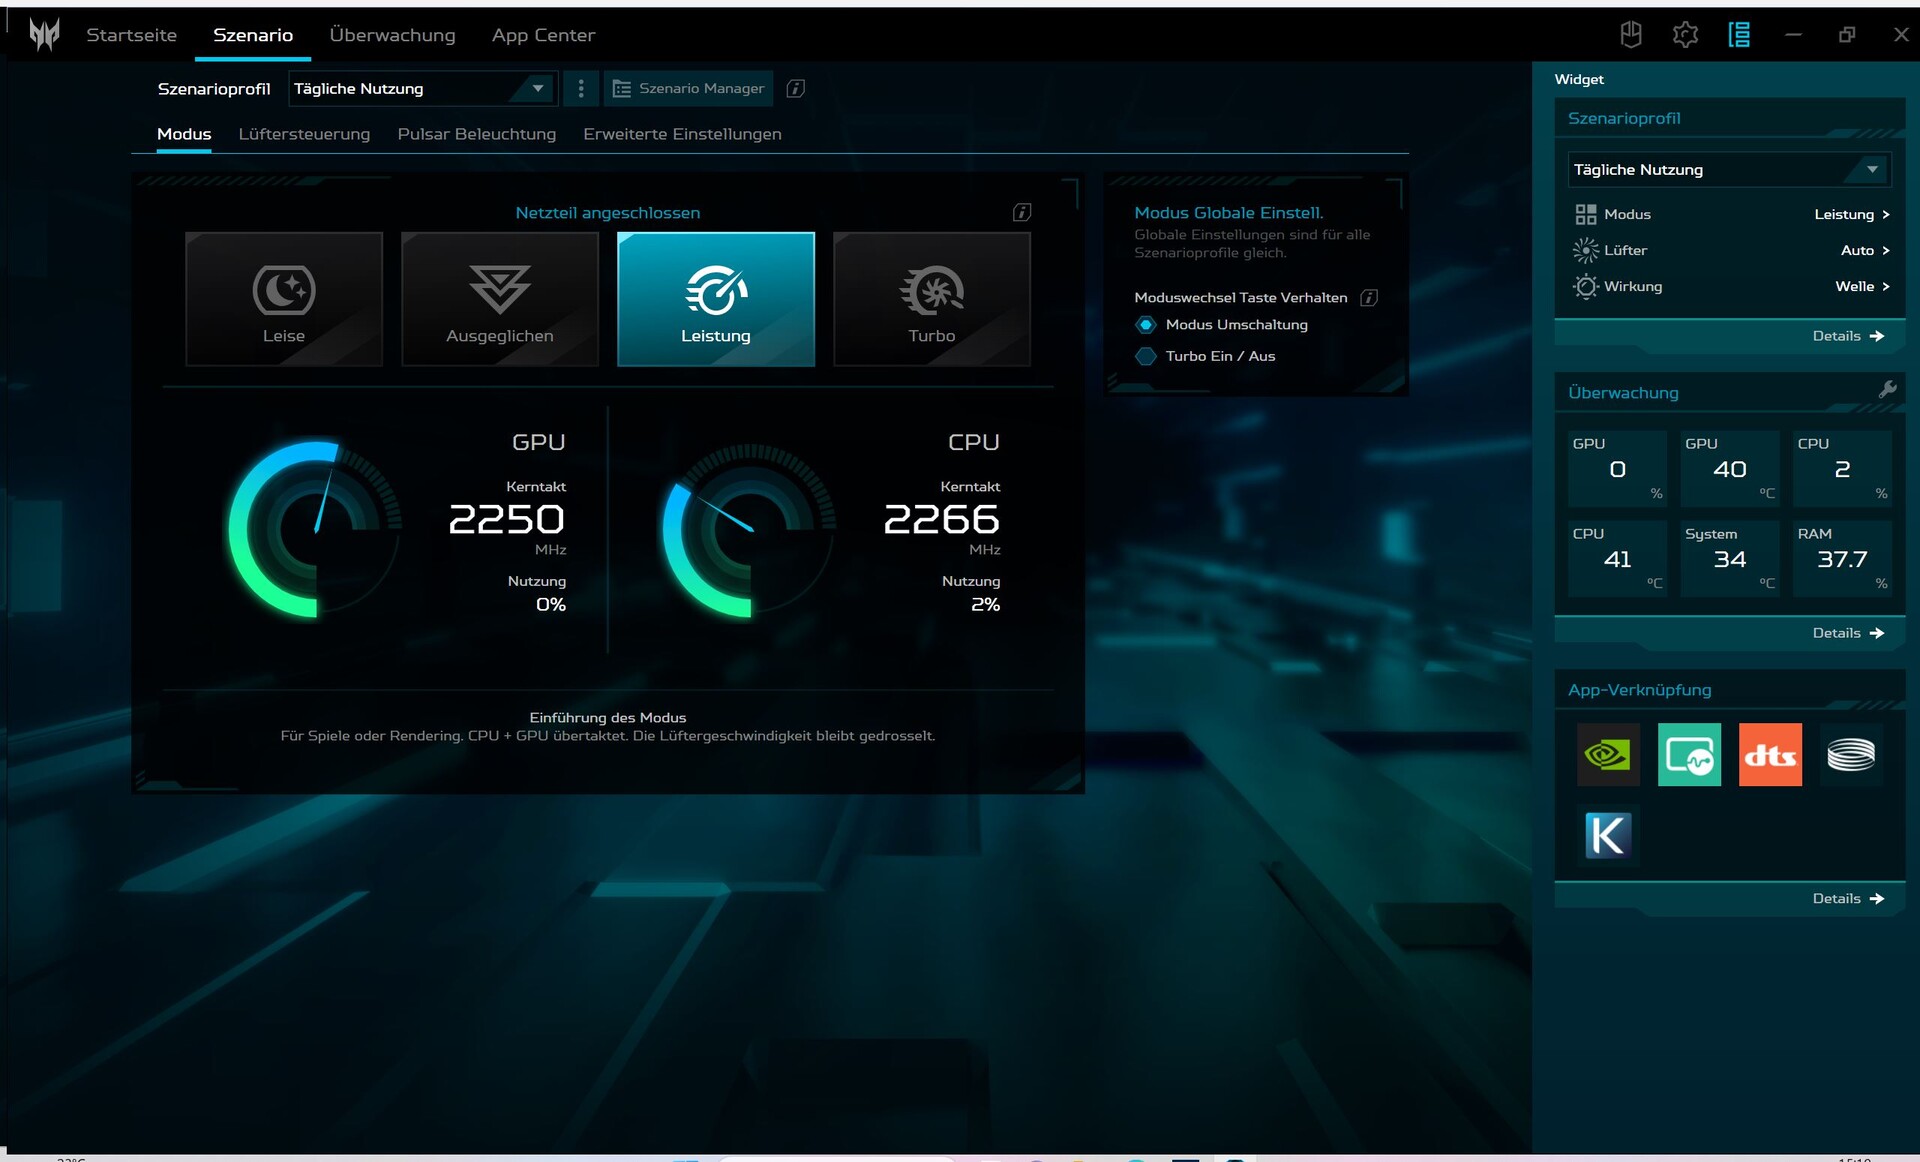

In Acer's Control Center software, "PredatorSense", four performance modes are available which can alternatively be selected via the button on the left-hand side above the keyboard. We carried out our performance-based benchmarks using the "Performance" mode. When unplugged from the mains, this was automatically switched to the "Balanced" mode. The "Eco" mode, which is also available here, reduces the screen brightness and all forms of LED lighting are deactivated. The Helios 16 has to be charged to at least 40 % in order to control the performance modes.
The table below highlights that very little power is lost in the "Balanced" mode with the fans remaining considerably quieter, in fact, almost pleasantly quiet. In contrast, the "Turbo" mode is unbearably loud and is therefore only useful for long video rendering or something similar.
| Scenario | Turbo + Max fans | Turbo | Performance | Balanced | Quiet | Battery |
|---|---|---|---|---|---|---|
| CPU PL2 | 157 W (1:05 min) | 157 W > 150 W (1 min) | 157 W > 140 W (~55 sec) | 157 W > 135 W (~55 sec) | 157 W > 120 W (~40 sec) | 25 W |
| CPU PL1 | 118 W | 115 W | 95 W | 85 W | 55 W | 25 W |
| GPU @Cyberpunk 2077 1.6 | 103 W | 100 W | 100 W | 90 W | 55 W | 37 W |
| GPU @FurMark | 138 W | 137 W | 130 W | 100 W | 60 W | 40 W |
| Performance (Cyperpunk 2077 1.6 @FHD/Ultra) | 96.2fps | 95.5fps | 93.2fps | 87.4fps | 65.8fps | 30fps |
Processor
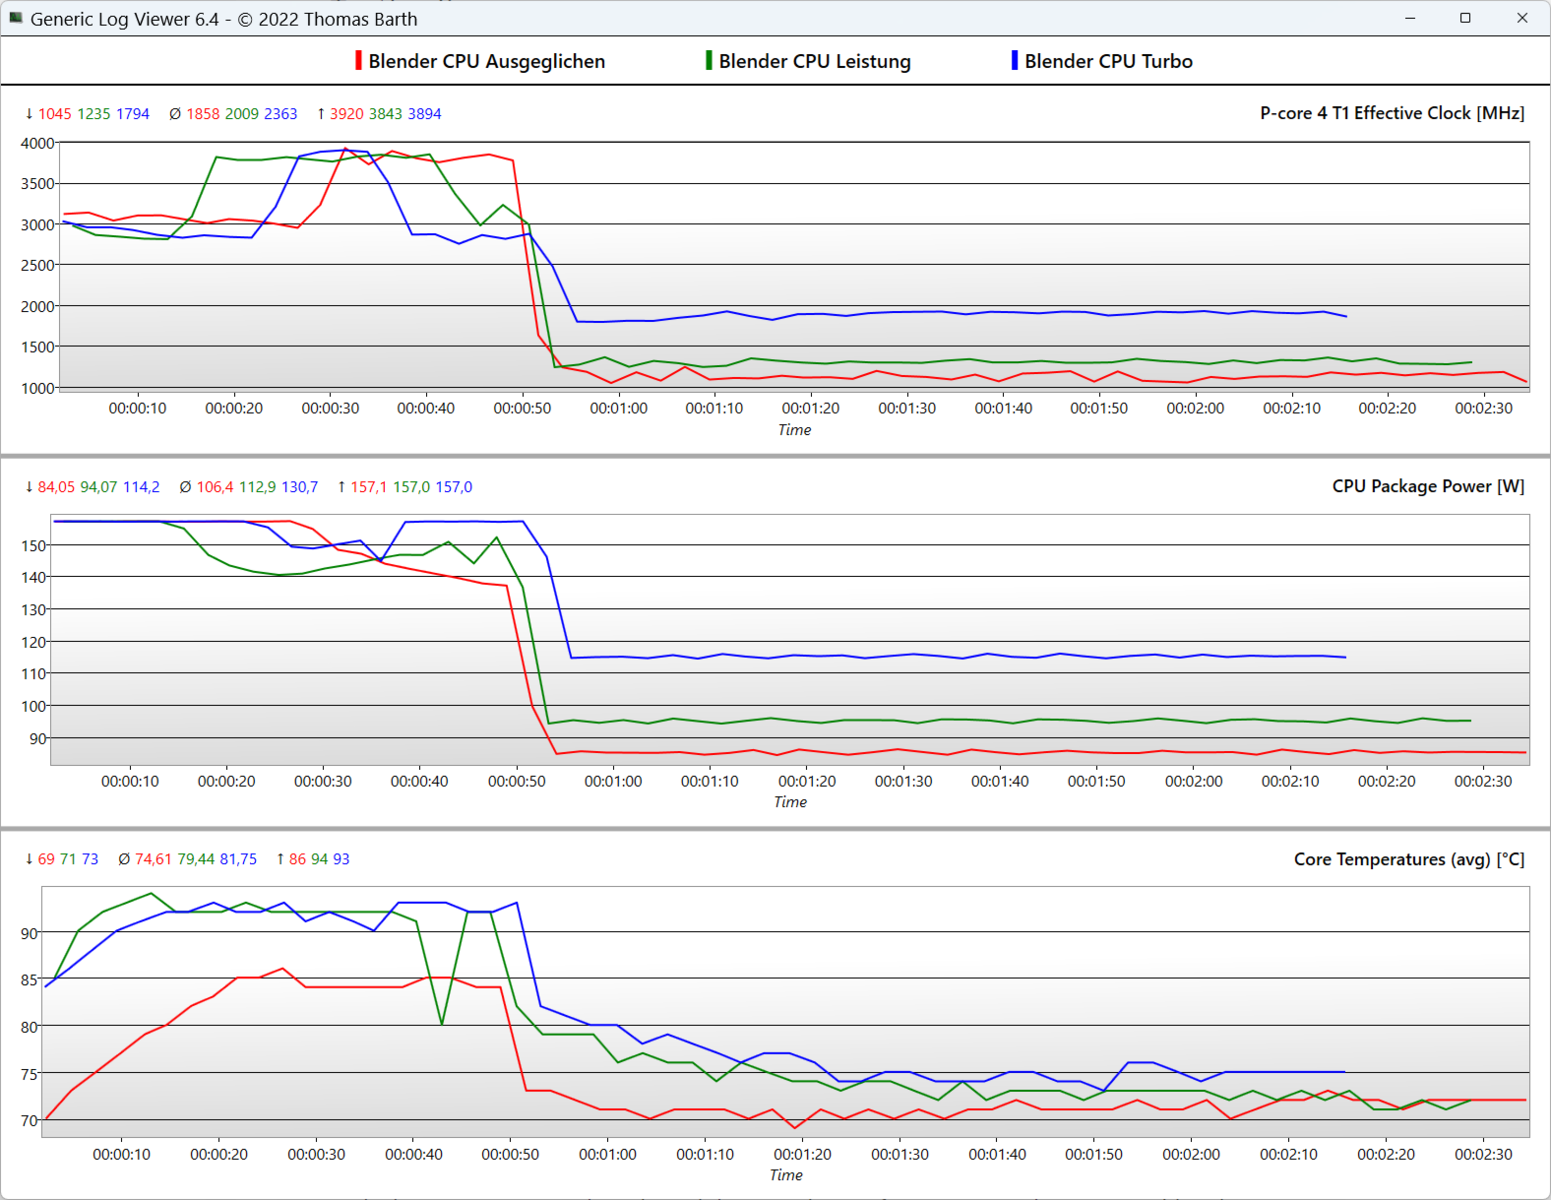
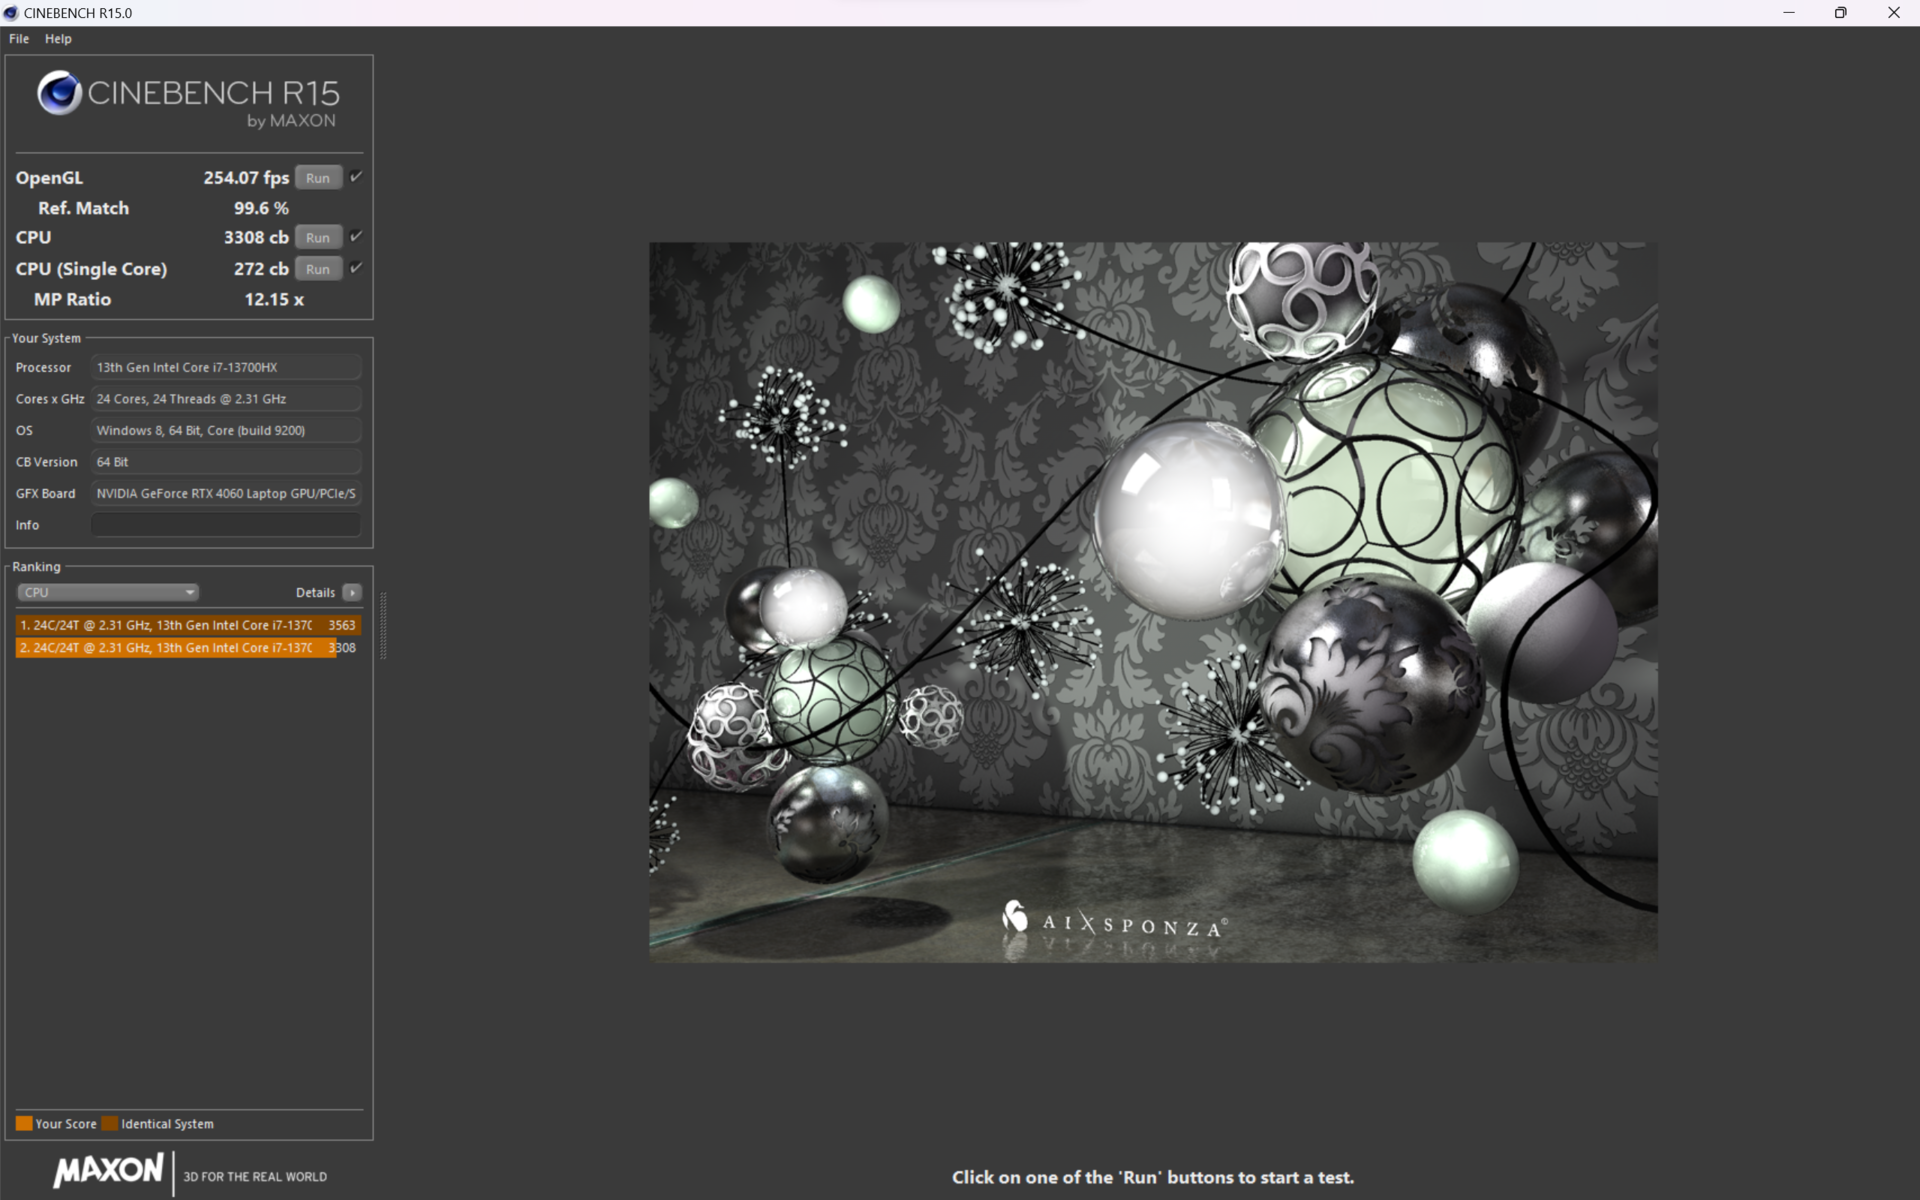
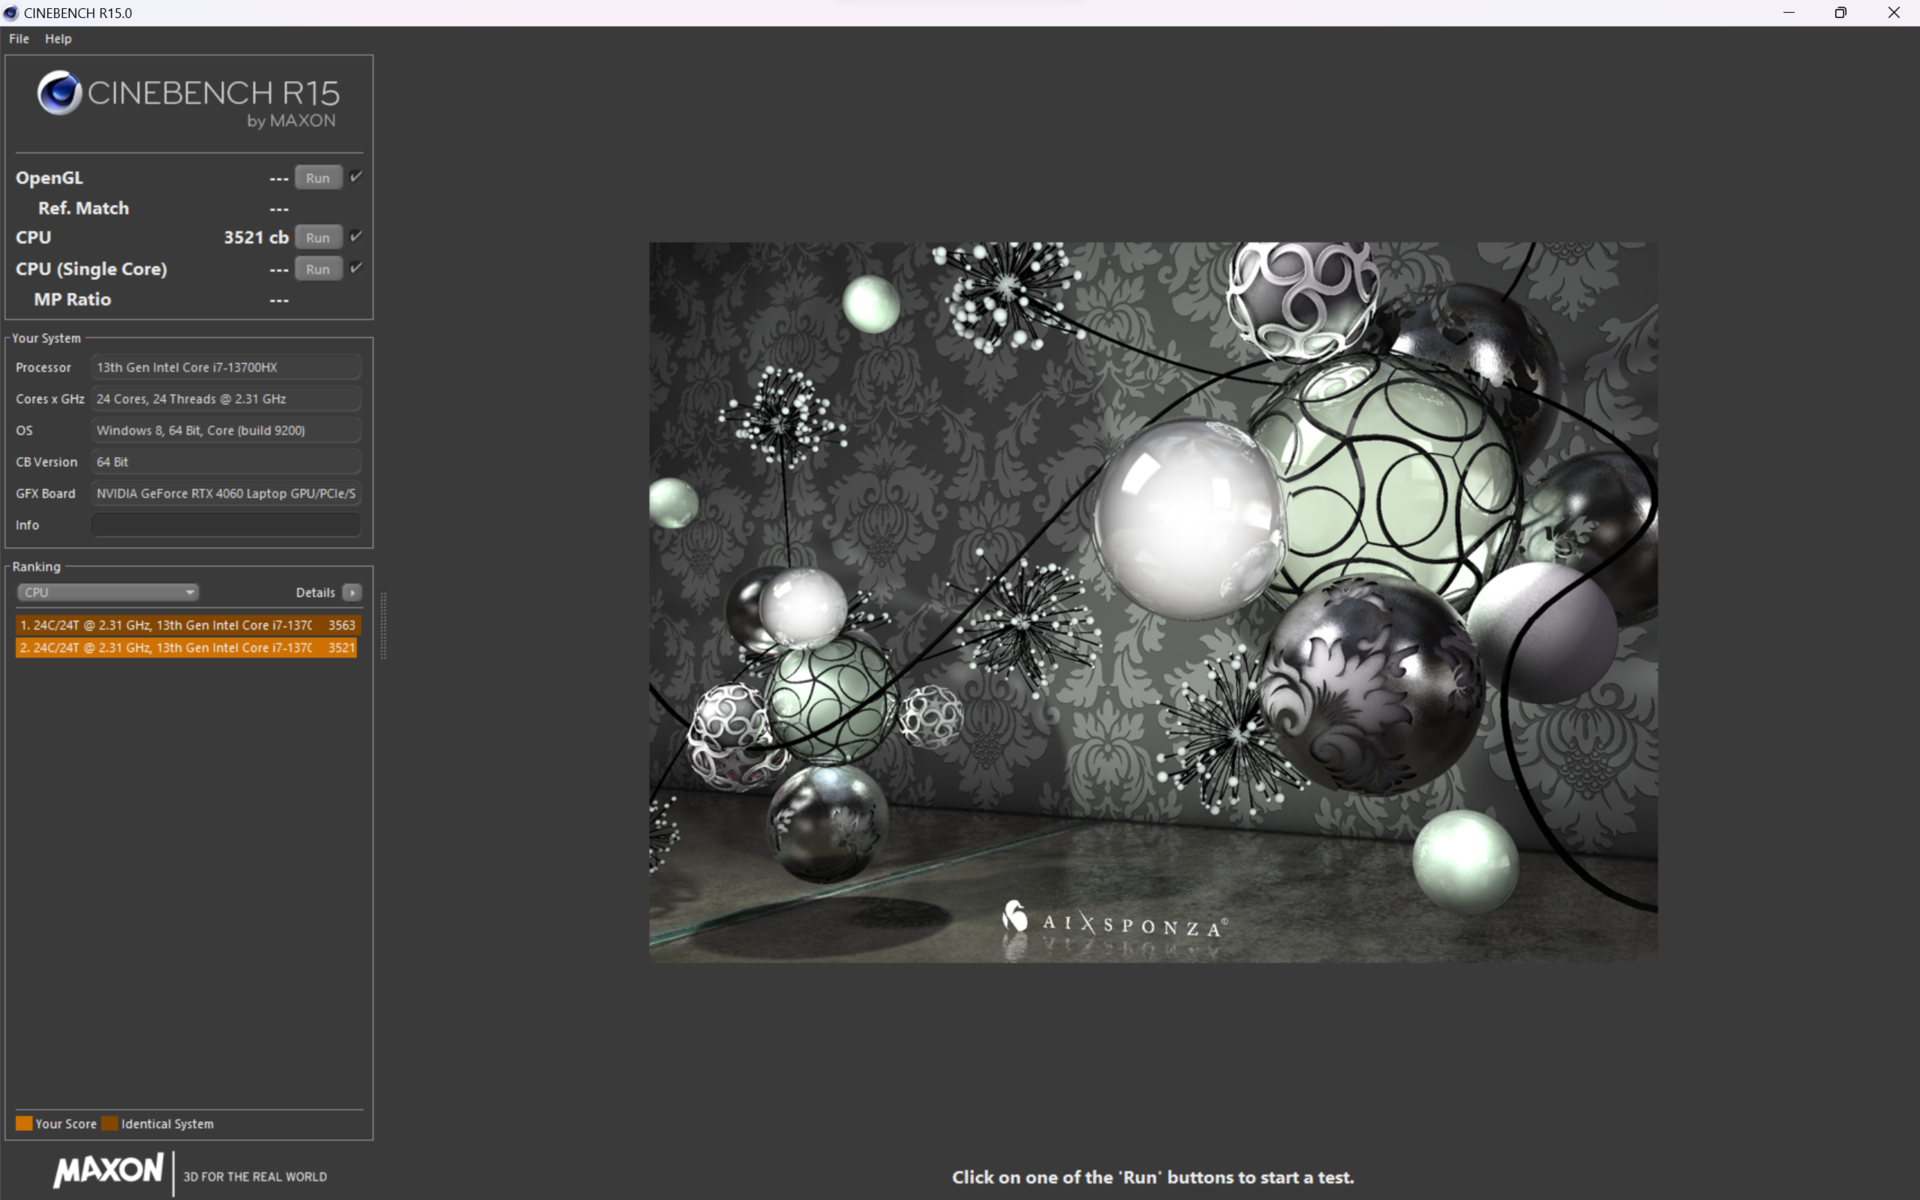
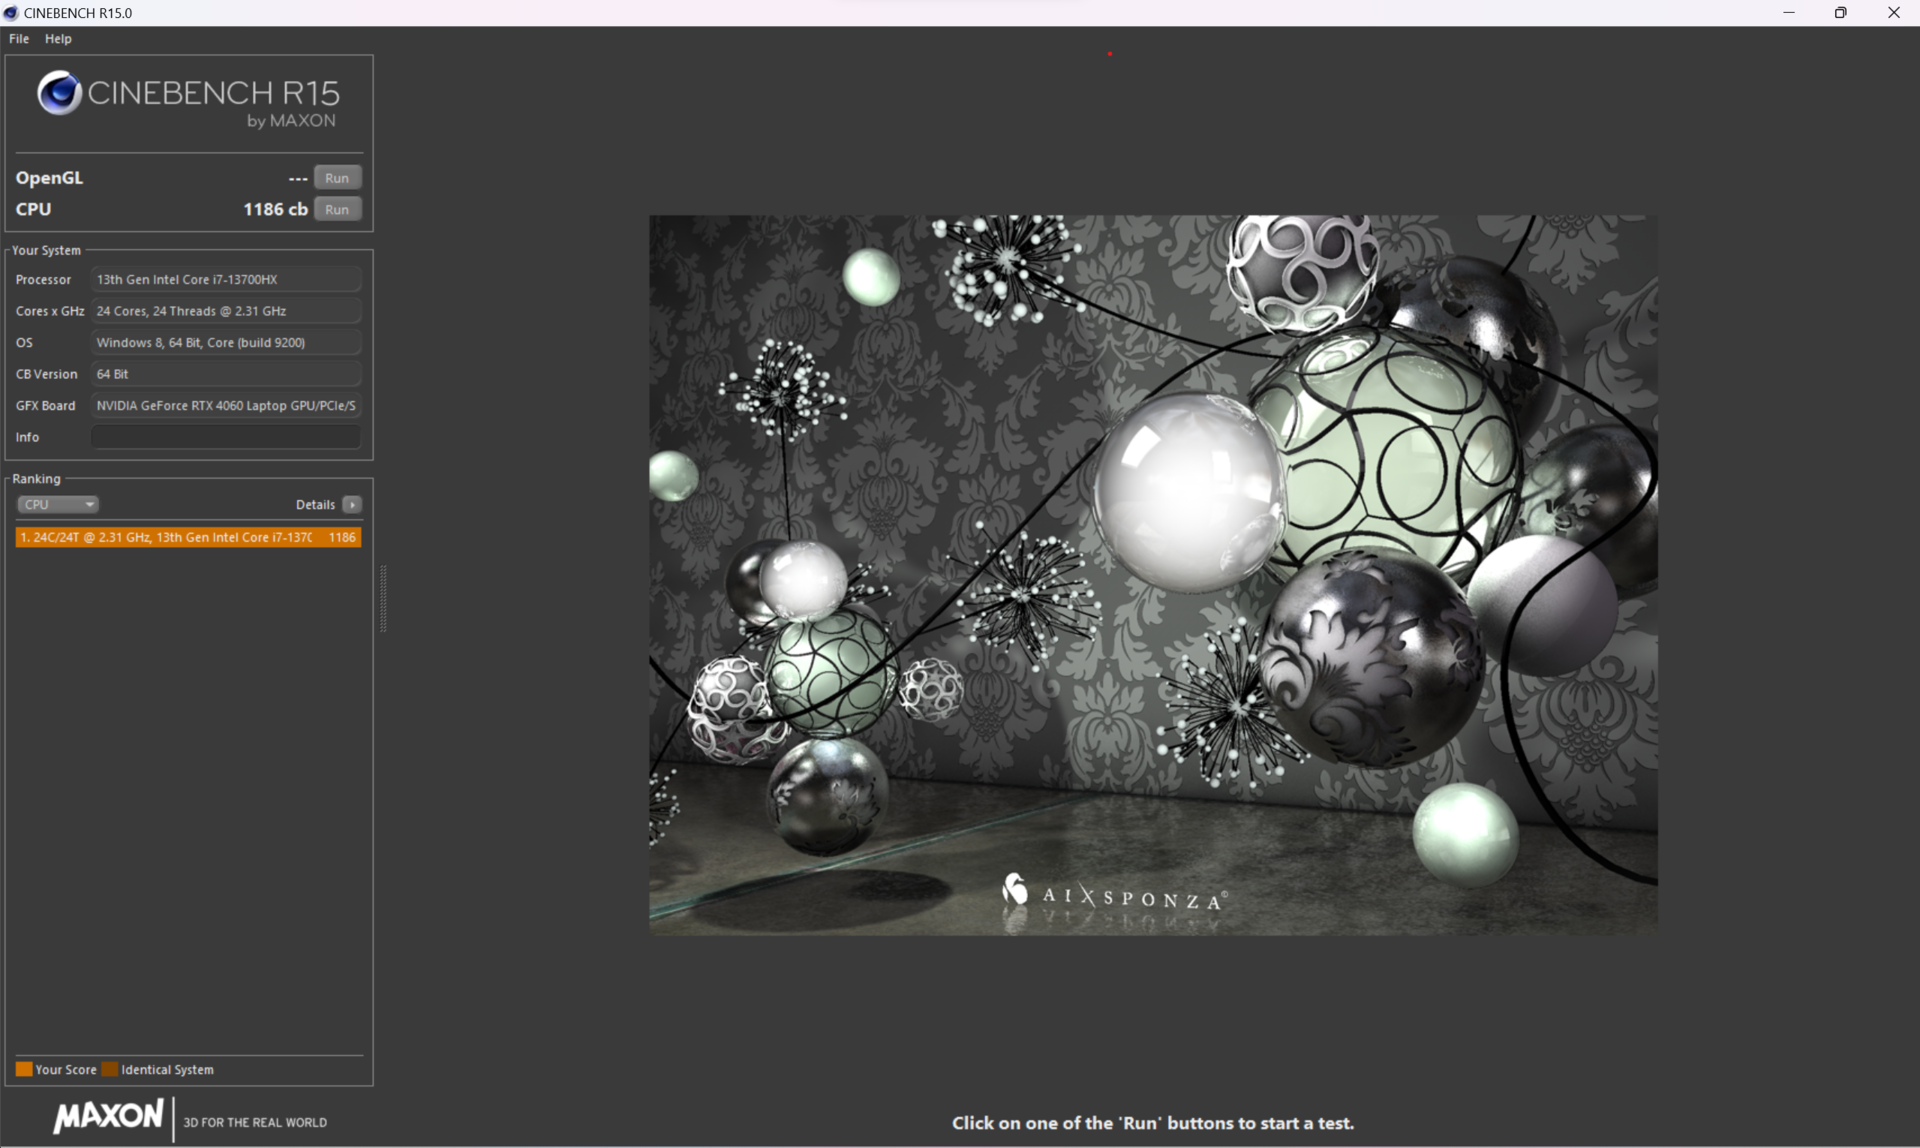
The Intel Core i7-13700HX processor possesses 16 cores and 24 threads (8 P-cores + 8 E-cores) as well as a TDP of 55 watts. The turbo of 4.5 GHz is not fully utilized and, in the first minute, the P-cores sit between 3 GHz and 3.9 GHz and then fall to 1.9 GHz (Turbo mode) and 1.3 GHz (Performance mode), respectively.
The multi-core performance corresponds to its competitors with the same CPU. The 8-core AMD Ryzen 7 7735HS found in the Acer Nitro 16 and the Asus TUF Gaming A16 is clearly outperformed. As of the fifth Cinebench R15 run, the throttling sat at ~15 % and could be almost completely avoided by activating the loud "Turbo" mode. The optionally available Core i9-13900HX possesses twice the number of E-cores and is typically ~33 % faster in multi-core tasks. In battery mode, things look bleak since the measly 25-watt TDP limit means a drop in performance of almost 65 %.


Cinebench R15 Multi Continuous Test
Cinebench R23: Multi Core | Single Core
Cinebench R20: CPU (Multi Core) | CPU (Single Core)
Cinebench R15: CPU Multi 64Bit | CPU Single 64Bit
Blender: v2.79 BMW27 CPU
7-Zip 18.03: 7z b 4 | 7z b 4 -mmt1
Geekbench 5.5: Multi-Core | Single-Core
HWBOT x265 Benchmark v2.2: 4k Preset
LibreOffice : 20 Documents To PDF
R Benchmark 2.5: Overall mean
| CPU Performance rating | |
| Average of class Gaming | |
| Acer Predator Helios 16 PH16-71-731Q | |
| Asus ROG Zephyrus M16 GU604VY-NM042X | |
| Aorus 15X ASF | |
| Dell G15 5530 | |
| Average Intel Core i7-13700HX | |
| Lenovo Legion Pro 5 16IRX8 | |
| Acer Predator Helios 300 (i7-12700H, RTX 3070 Ti) | |
| Acer Nitro 16 AN16-41 | |
| Asus TUF Gaming A16 FA617 | |
| Cinebench R23 / Multi Core | |
| Average of class Gaming (10488 - 40970, n=113, last 2 years) | |
| Acer Predator Helios 16 PH16-71-731Q | |
| Dell G15 5530 | |
| Average Intel Core i7-13700HX (15558 - 22598, n=11) | |
| Aorus 15X ASF | |
| Lenovo Legion Pro 5 16IRX8 | |
| Asus ROG Zephyrus M16 GU604VY-NM042X | |
| Acer Predator Helios 300 (i7-12700H, RTX 3070 Ti) | |
| Acer Nitro 16 AN16-41 | |
| Asus TUF Gaming A16 FA617 | |
| Cinebench R23 / Single Core | |
| Average of class Gaming (1166 - 2356, n=113, last 2 years) | |
| Asus ROG Zephyrus M16 GU604VY-NM042X | |
| Acer Predator Helios 16 PH16-71-731Q | |
| Aorus 15X ASF | |
| Dell G15 5530 | |
| Average Intel Core i7-13700HX (1666 - 1933, n=11) | |
| Acer Predator Helios 300 (i7-12700H, RTX 3070 Ti) | |
| Lenovo Legion Pro 5 16IRX8 | |
| Asus TUF Gaming A16 FA617 | |
| Acer Nitro 16 AN16-41 | |
| Cinebench R20 / CPU (Multi Core) | |
| Average of class Gaming (4029 - 16108, n=112, last 2 years) | |
| Acer Predator Helios 16 PH16-71-731Q | |
| Dell G15 5530 | |
| Aorus 15X ASF | |
| Average Intel Core i7-13700HX (6160 - 8610, n=11) | |
| Asus ROG Zephyrus M16 GU604VY-NM042X | |
| Lenovo Legion Pro 5 16IRX8 | |
| Acer Predator Helios 300 (i7-12700H, RTX 3070 Ti) | |
| Acer Nitro 16 AN16-41 | |
| Asus TUF Gaming A16 FA617 | |
| Cinebench R20 / CPU (Single Core) | |
| Average of class Gaming (442 - 895, n=112, last 2 years) | |
| Asus ROG Zephyrus M16 GU604VY-NM042X | |
| Acer Predator Helios 16 PH16-71-731Q | |
| Aorus 15X ASF | |
| Dell G15 5530 | |
| Average Intel Core i7-13700HX (644 - 740, n=11) | |
| Acer Predator Helios 300 (i7-12700H, RTX 3070 Ti) | |
| Lenovo Legion Pro 5 16IRX8 | |
| Asus TUF Gaming A16 FA617 | |
| Acer Nitro 16 AN16-41 | |
| Cinebench R15 / CPU Multi 64Bit | |
| Average of class Gaming (1578 - 6271, n=113, last 2 years) | |
| Aorus 15X ASF | |
| Acer Predator Helios 16 PH16-71-731Q | |
| Acer Predator Helios 16 PH16-71-731Q | |
| Lenovo Legion Pro 5 16IRX8 | |
| Average Intel Core i7-13700HX (2548 - 3482, n=12) | |
| Dell G15 5530 | |
| Asus ROG Zephyrus M16 GU604VY-NM042X | |
| Acer Predator Helios 300 (i7-12700H, RTX 3070 Ti) | |
| Acer Nitro 16 AN16-41 | |
| Asus TUF Gaming A16 FA617 | |
| Cinebench R15 / CPU Single 64Bit | |
| Average of class Gaming (188.8 - 343, n=112, last 2 years) | |
| Asus ROG Zephyrus M16 GU604VY-NM042X | |
| Aorus 15X ASF | |
| Dell G15 5530 | |
| Acer Predator Helios 16 PH16-71-731Q | |
| Average Intel Core i7-13700HX (243 - 279, n=11) | |
| Lenovo Legion Pro 5 16IRX8 | |
| Acer Predator Helios 300 (i7-12700H, RTX 3070 Ti) | |
| Asus TUF Gaming A16 FA617 | |
| Acer Nitro 16 AN16-41 | |
| Blender / v2.79 BMW27 CPU | |
| Asus TUF Gaming A16 FA617 | |
| Acer Nitro 16 AN16-41 | |
| Acer Predator Helios 300 (i7-12700H, RTX 3070 Ti) | |
| Aorus 15X ASF | |
| Asus ROG Zephyrus M16 GU604VY-NM042X | |
| Average Intel Core i7-13700HX (138 - 207, n=10) | |
| Dell G15 5530 | |
| Acer Predator Helios 16 PH16-71-731Q | |
| Average of class Gaming (80 - 330, n=110, last 2 years) | |
| Lenovo Legion Pro 5 16IRX8 | |
| 7-Zip 18.03 / 7z b 4 | |
| Average of class Gaming (33491 - 148086, n=111, last 2 years) | |
| Acer Predator Helios 16 PH16-71-731Q | |
| Asus ROG Zephyrus M16 GU604VY-NM042X | |
| Lenovo Legion Pro 5 16IRX8 | |
| Dell G15 5530 | |
| Average Intel Core i7-13700HX (58912 - 89294, n=11) | |
| Aorus 15X ASF | |
| Acer Predator Helios 300 (i7-12700H, RTX 3070 Ti) | |
| Asus TUF Gaming A16 FA617 | |
| Acer Nitro 16 AN16-41 | |
| 7-Zip 18.03 / 7z b 4 -mmt1 | |
| Aorus 15X ASF | |
| Average of class Gaming (4199 - 7436, n=111, last 2 years) | |
| Asus ROG Zephyrus M16 GU604VY-NM042X | |
| Acer Predator Helios 16 PH16-71-731Q | |
| Average Intel Core i7-13700HX (5552 - 6409, n=11) | |
| Dell G15 5530 | |
| Asus TUF Gaming A16 FA617 | |
| Acer Predator Helios 300 (i7-12700H, RTX 3070 Ti) | |
| Lenovo Legion Pro 5 16IRX8 | |
| Acer Nitro 16 AN16-41 | |
| Geekbench 5.5 / Multi-Core | |
| Average of class Gaming (6460 - 27010, n=111, last 2 years) | |
| Acer Predator Helios 16 PH16-71-731Q | |
| Asus ROG Zephyrus M16 GU604VY-NM042X | |
| Aorus 15X ASF | |
| Lenovo Legion Pro 5 16IRX8 | |
| Dell G15 5530 | |
| Average Intel Core i7-13700HX (10156 - 15850, n=12) | |
| Acer Predator Helios 300 (i7-12700H, RTX 3070 Ti) | |
| Asus TUF Gaming A16 FA617 | |
| Acer Nitro 16 AN16-41 | |
| Geekbench 5.5 / Single-Core | |
| Average of class Gaming (986 - 2474, n=111, last 2 years) | |
| Asus ROG Zephyrus M16 GU604VY-NM042X | |
| Acer Predator Helios 16 PH16-71-731Q | |
| Aorus 15X ASF | |
| Dell G15 5530 | |
| Average Intel Core i7-13700HX (1666 - 1899, n=12) | |
| Lenovo Legion Pro 5 16IRX8 | |
| Acer Predator Helios 300 (i7-12700H, RTX 3070 Ti) | |
| Asus TUF Gaming A16 FA617 | |
| Acer Nitro 16 AN16-41 | |
| HWBOT x265 Benchmark v2.2 / 4k Preset | |
| Average of class Gaming (11.5 - 44.3, n=111, last 2 years) | |
| Lenovo Legion Pro 5 16IRX8 | |
| Acer Predator Helios 16 PH16-71-731Q | |
| Dell G15 5530 | |
| Average Intel Core i7-13700HX (17.1 - 25.5, n=11) | |
| Asus ROG Zephyrus M16 GU604VY-NM042X | |
| Aorus 15X ASF | |
| Asus TUF Gaming A16 FA617 | |
| Acer Nitro 16 AN16-41 | |
| Acer Predator Helios 300 (i7-12700H, RTX 3070 Ti) | |
| LibreOffice / 20 Documents To PDF | |
| Acer Predator Helios 300 (i7-12700H, RTX 3070 Ti) | |
| Asus TUF Gaming A16 FA617 | |
| Acer Nitro 16 AN16-41 | |
| Asus ROG Zephyrus M16 GU604VY-NM042X | |
| Average of class Gaming (19 - 88.8, n=111, last 2 years) | |
| Dell G15 5530 | |
| Average Intel Core i7-13700HX (36.5 - 52.9, n=11) | |
| Aorus 15X ASF | |
| Acer Predator Helios 16 PH16-71-731Q | |
| Lenovo Legion Pro 5 16IRX8 | |
| R Benchmark 2.5 / Overall mean | |
| Asus TUF Gaming A16 FA617 | |
| Acer Nitro 16 AN16-41 | |
| Lenovo Legion Pro 5 16IRX8 | |
| Average Intel Core i7-13700HX (0.4274 - 0.513, n=11) | |
| Acer Predator Helios 300 (i7-12700H, RTX 3070 Ti) | |
| Aorus 15X ASF | |
| Average of class Gaming (0.3439 - 0.759, n=112, last 2 years) | |
| Acer Predator Helios 16 PH16-71-731Q | |
| Dell G15 5530 | |
| Asus ROG Zephyrus M16 GU604VY-NM042X | |
* ... smaller is better
AIDA64: FP32 Ray-Trace | FPU Julia | CPU SHA3 | CPU Queen | FPU SinJulia | FPU Mandel | CPU AES | CPU ZLib | FP64 Ray-Trace | CPU PhotoWorxx
| Performance rating | |
| Average of class Gaming | |
| Acer Predator Helios 16 PH16-71-731Q | |
| Lenovo Legion Pro 5 16IRX8 | |
| Average Intel Core i7-13700HX | |
| Aorus 15X ASF | |
| Dell G15 5530 | |
| Acer Nitro 16 AN16-41 | |
| Asus TUF Gaming A16 FA617 | |
| AIDA64 / FP32 Ray-Trace | |
| Average of class Gaming (10227 - 85542, n=110, last 2 years) | |
| Lenovo Legion Pro 5 16IRX8 | |
| Acer Predator Helios 16 PH16-71-731Q | |
| Average Intel Core i7-13700HX (14261 - 21999, n=11) | |
| Dell G15 5530 | |
| Aorus 15X ASF | |
| Acer Nitro 16 AN16-41 | |
| Asus TUF Gaming A16 FA617 | |
| AIDA64 / FPU Julia | |
| Average of class Gaming (51376 - 238426, n=110, last 2 years) | |
| Acer Nitro 16 AN16-41 | |
| Lenovo Legion Pro 5 16IRX8 | |
| Asus TUF Gaming A16 FA617 | |
| Acer Predator Helios 16 PH16-71-731Q | |
| Average Intel Core i7-13700HX (74636 - 109364, n=11) | |
| Dell G15 5530 | |
| Aorus 15X ASF | |
| AIDA64 / CPU SHA3 | |
| Average of class Gaming (2180 - 9817, n=110, last 2 years) | |
| Lenovo Legion Pro 5 16IRX8 | |
| Acer Predator Helios 16 PH16-71-731Q | |
| Dell G15 5530 | |
| Average Intel Core i7-13700HX (3359 - 5053, n=11) | |
| Aorus 15X ASF | |
| Asus TUF Gaming A16 FA617 | |
| Acer Nitro 16 AN16-41 | |
| AIDA64 / CPU Queen | |
| Average of class Gaming (49785 - 173351, n=101, last 2 years) | |
| Acer Predator Helios 16 PH16-71-731Q | |
| Lenovo Legion Pro 5 16IRX8 | |
| Aorus 15X ASF | |
| Average Intel Core i7-13700HX (86532 - 114717, n=11) | |
| Acer Nitro 16 AN16-41 | |
| Dell G15 5530 | |
| Asus TUF Gaming A16 FA617 | |
| AIDA64 / FPU SinJulia | |
| Average of class Gaming (4424 - 33636, n=110, last 2 years) | |
| Lenovo Legion Pro 5 16IRX8 | |
| Acer Nitro 16 AN16-41 | |
| Acer Predator Helios 16 PH16-71-731Q | |
| Asus TUF Gaming A16 FA617 | |
| Average Intel Core i7-13700HX (9290 - 13519, n=11) | |
| Aorus 15X ASF | |
| Dell G15 5530 | |
| AIDA64 / FPU Mandel | |
| Average of class Gaming (25115 - 128721, n=110, last 2 years) | |
| Acer Nitro 16 AN16-41 | |
| Asus TUF Gaming A16 FA617 | |
| Lenovo Legion Pro 5 16IRX8 | |
| Acer Predator Helios 16 PH16-71-731Q | |
| Average Intel Core i7-13700HX (35751 - 53484, n=11) | |
| Dell G15 5530 | |
| Aorus 15X ASF | |
| AIDA64 / CPU AES | |
| Acer Predator Helios 16 PH16-71-731Q | |
| Aorus 15X ASF | |
| Average Intel Core i7-13700HX (67846 - 182575, n=11) | |
| Average of class Gaming (39258 - 247074, n=110, last 2 years) | |
| Lenovo Legion Pro 5 16IRX8 | |
| Dell G15 5530 | |
| Asus TUF Gaming A16 FA617 | |
| Acer Nitro 16 AN16-41 | |
| AIDA64 / CPU ZLib | |
| Average of class Gaming (574 - 2531, n=110, last 2 years) | |
| Acer Predator Helios 16 PH16-71-731Q | |
| Lenovo Legion Pro 5 16IRX8 | |
| Dell G15 5530 | |
| Average Intel Core i7-13700HX (981 - 1451, n=11) | |
| Aorus 15X ASF | |
| Acer Nitro 16 AN16-41 | |
| Asus TUF Gaming A16 FA617 | |
| AIDA64 / FP64 Ray-Trace | |
| Average of class Gaming (5509 - 45446, n=110, last 2 years) | |
| Lenovo Legion Pro 5 16IRX8 | |
| Acer Predator Helios 16 PH16-71-731Q | |
| Average Intel Core i7-13700HX (7728 - 11837, n=11) | |
| Dell G15 5530 | |
| Aorus 15X ASF | |
| Acer Nitro 16 AN16-41 | |
| Asus TUF Gaming A16 FA617 | |
| AIDA64 / CPU PhotoWorxx | |
| Average of class Gaming (12271 - 89891, n=110, last 2 years) | |
| Dell G15 5530 | |
| Lenovo Legion Pro 5 16IRX8 | |
| Acer Predator Helios 16 PH16-71-731Q | |
| Aorus 15X ASF | |
| Average Intel Core i7-13700HX (19678 - 42415, n=11) | |
| Asus TUF Gaming A16 FA617 | |
| Acer Nitro 16 AN16-41 | |
System performance
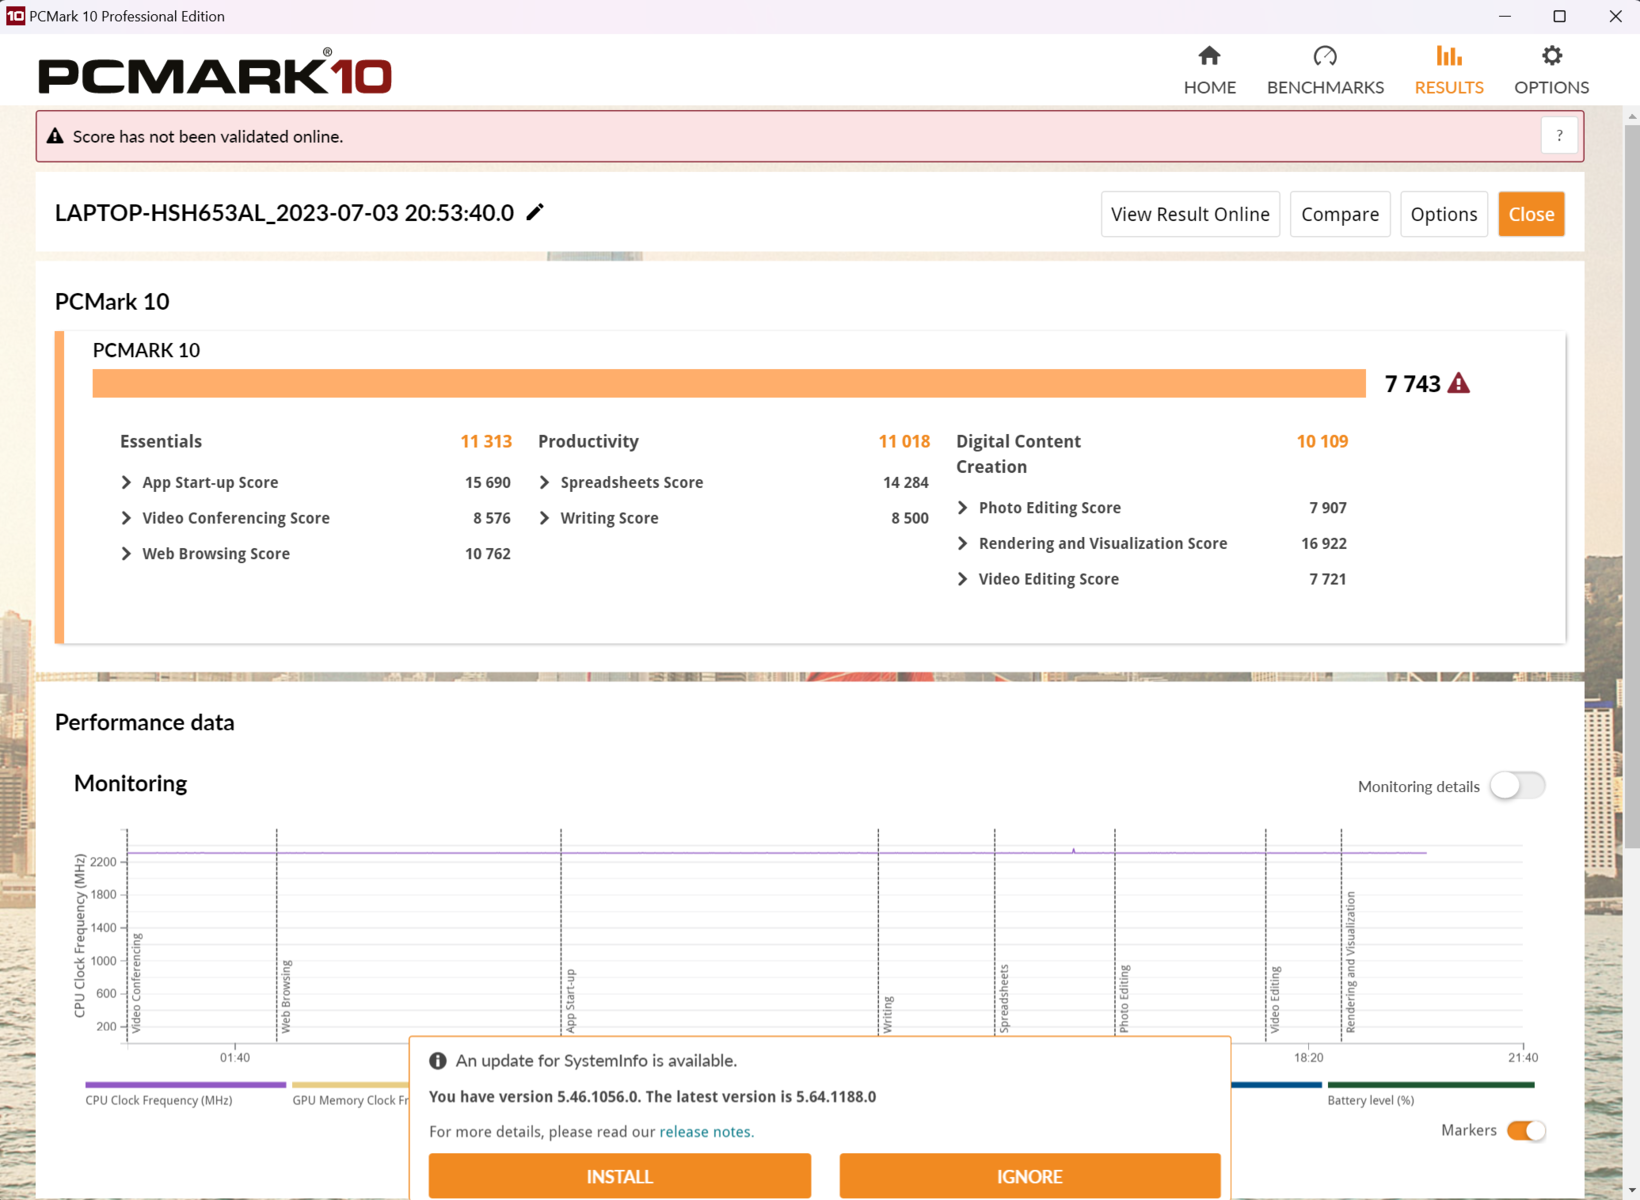
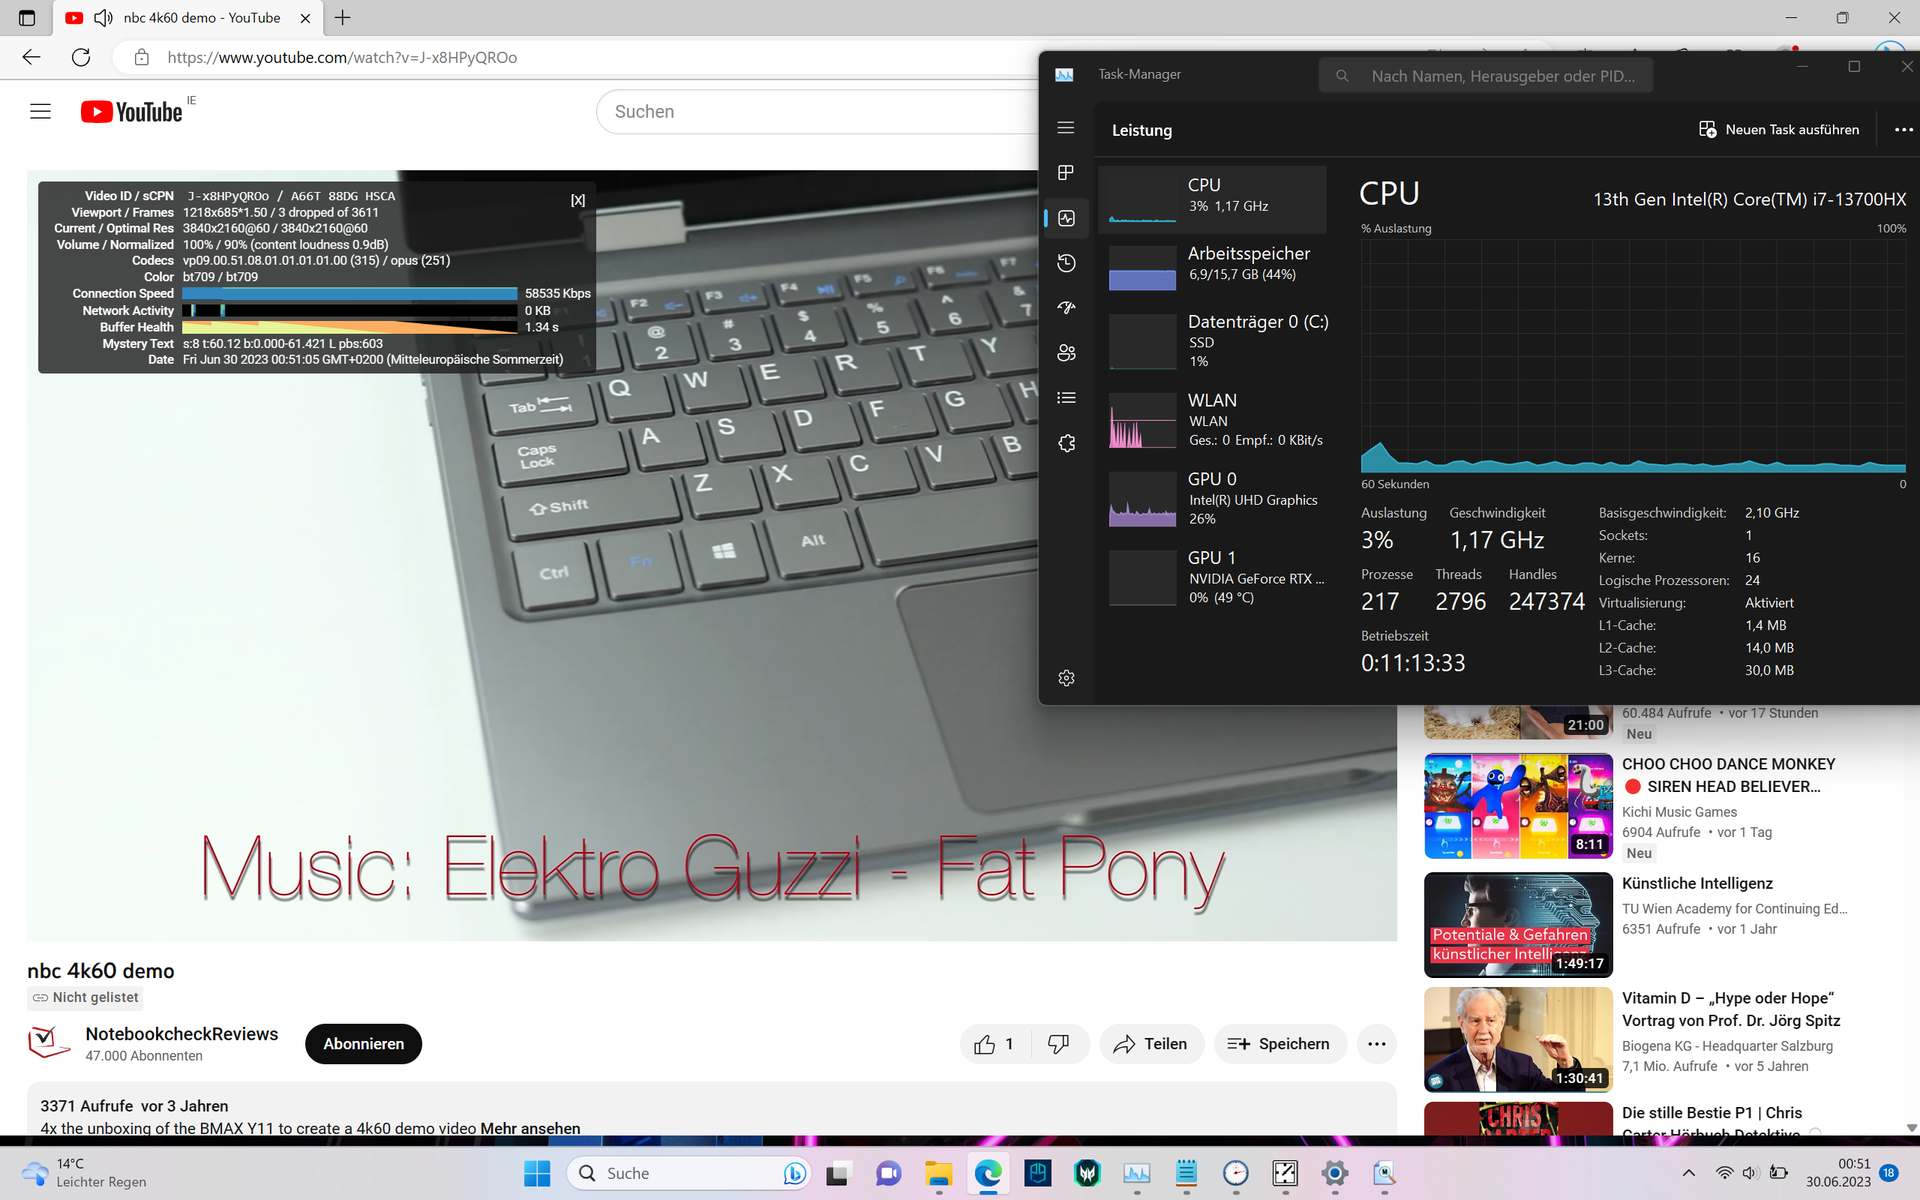
In everyday tasks, the Acer laptop is exceptionally responsive. Surfing on the internet while playing a 4K YouTube video doesn't even make the Intel-HX system break a sweat. This means, in the PCMark 10 benchmark, the Predator Helios sits in first place, closely followed by the Lenovo Legion Pro 5 16.
Likewise, the web browsing performance, as illustrated by Mozilla Kraken 1.1 and WebXPRT, is also on a very high level thanks to the strong single-core performance.
CrossMark: Overall | Productivity | Creativity | Responsiveness
Mozilla Kraken 1.1: Total
Speedometer 2.0: Result 2.0
Octane V2: Total Score
Jetstream 2: 2.0 Total
WebXPRT 3: Overall
WebXPRT 4: Overall
| PCMark 10 / Score | |
| Average of class Gaming (5828 - 11574, n=96, last 2 years) | |
| Acer Predator Helios 16 PH16-71-731Q | |
| Lenovo Legion Pro 5 16IRX8 | |
| Average Intel Core i7-13700HX, NVIDIA GeForce RTX 4060 Laptop GPU (6909 - 7743, n=5) | |
| Asus TUF Gaming A16 FA617 | |
| Acer Nitro 16 AN16-41 | |
| Aorus 15X ASF | |
| Dell G15 5530 | |
| PCMark 10 / Essentials | |
| Acer Predator Helios 16 PH16-71-731Q | |
| Dell G15 5530 | |
| Lenovo Legion Pro 5 16IRX8 | |
| Aorus 15X ASF | |
| Average Intel Core i7-13700HX, NVIDIA GeForce RTX 4060 Laptop GPU (9760 - 11313, n=5) | |
| Average of class Gaming (8810 - 12600, n=100, last 2 years) | |
| Asus TUF Gaming A16 FA617 | |
| Acer Nitro 16 AN16-41 | |
| PCMark 10 / Productivity | |
| Acer Predator Helios 16 PH16-71-731Q | |
| Average of class Gaming (6845 - 18766, n=98, last 2 years) | |
| Dell G15 5530 | |
| Average Intel Core i7-13700HX, NVIDIA GeForce RTX 4060 Laptop GPU (9131 - 11018, n=5) | |
| Aorus 15X ASF | |
| Asus TUF Gaming A16 FA617 | |
| Acer Nitro 16 AN16-41 | |
| Lenovo Legion Pro 5 16IRX8 | |
| PCMark 10 / Digital Content Creation | |
| Average of class Gaming (7602 - 19657, n=98, last 2 years) | |
| Lenovo Legion Pro 5 16IRX8 | |
| Average Intel Core i7-13700HX, NVIDIA GeForce RTX 4060 Laptop GPU (9393 - 12434, n=5) | |
| Asus TUF Gaming A16 FA617 | |
| Acer Nitro 16 AN16-41 | |
| Acer Predator Helios 16 PH16-71-731Q | |
| Aorus 15X ASF | |
| Dell G15 5530 | |
| CrossMark / Overall | |
| Acer Predator Helios 16 PH16-71-731Q | |
| Aorus 15X ASF | |
| Average of class Gaming (1366 - 2409, n=98, last 2 years) | |
| Average Intel Core i7-13700HX, NVIDIA GeForce RTX 4060 Laptop GPU (1663 - 2105, n=5) | |
| Dell G15 5530 | |
| Lenovo Legion Pro 5 16IRX8 | |
| Acer Nitro 16 AN16-41 | |
| CrossMark / Productivity | |
| Acer Predator Helios 16 PH16-71-731Q | |
| Aorus 15X ASF | |
| Average of class Gaming (1386 - 2254, n=98, last 2 years) | |
| Average Intel Core i7-13700HX, NVIDIA GeForce RTX 4060 Laptop GPU (1618 - 1989, n=5) | |
| Dell G15 5530 | |
| Lenovo Legion Pro 5 16IRX8 | |
| Acer Nitro 16 AN16-41 | |
| CrossMark / Creativity | |
| Acer Predator Helios 16 PH16-71-731Q | |
| Average of class Gaming (1343 - 2729, n=98, last 2 years) | |
| Aorus 15X ASF | |
| Dell G15 5530 | |
| Average Intel Core i7-13700HX, NVIDIA GeForce RTX 4060 Laptop GPU (1710 - 2274, n=5) | |
| Lenovo Legion Pro 5 16IRX8 | |
| Acer Nitro 16 AN16-41 | |
| CrossMark / Responsiveness | |
| Aorus 15X ASF | |
| Acer Predator Helios 16 PH16-71-731Q | |
| Average of class Gaming (1226 - 2334, n=98, last 2 years) | |
| Average Intel Core i7-13700HX, NVIDIA GeForce RTX 4060 Laptop GPU (1269 - 1983, n=5) | |
| Lenovo Legion Pro 5 16IRX8 | |
| Dell G15 5530 | |
| Acer Nitro 16 AN16-41 | |
| Mozilla Kraken 1.1 / Total | |
| Asus TUF Gaming A16 FA617 | |
| Asus TUF Gaming A16 FA617 | |
| Acer Nitro 16 AN16-41 | |
| Lenovo Legion Pro 5 16IRX8 | |
| Average Intel Core i7-13700HX, NVIDIA GeForce RTX 4060 Laptop GPU (495 - 538, n=5) | |
| Dell G15 5530 | |
| Acer Predator Helios 16 PH16-71-731Q | |
| Aorus 15X ASF | |
| Average of class Gaming (391 - 590, n=106, last 2 years) | |
| Speedometer 2.0 / Result 2.0 | |
| Average of class Gaming (29 - 686, n=30, last 2 years) | |
| Acer Predator Helios 16 PH16-71-731Q | |
| Average Intel Core i7-13700HX, NVIDIA GeForce RTX 4060 Laptop GPU (300 - 343, n=3) | |
| Aorus 15X ASF | |
| Acer Nitro 16 AN16-41 | |
| Octane V2 / Total Score | |
| Average of class Gaming (87588 - 139447, n=31, last 2 years) | |
| Aorus 15X ASF | |
| Acer Predator Helios 16 PH16-71-731Q | |
| Average Intel Core i7-13700HX, NVIDIA GeForce RTX 4060 Laptop GPU (86875 - 96413, n=3) | |
| Acer Nitro 16 AN16-41 | |
| Jetstream 2 / 2.0 Total | |
| Average of class Gaming (291 - 516, n=32, last 2 years) | |
| Lenovo Legion Pro 5 16IRX8 | |
| Acer Predator Helios 16 PH16-71-731Q | |
| Aorus 15X ASF | |
| Average Intel Core i7-13700HX, NVIDIA GeForce RTX 4060 Laptop GPU (263 - 305, n=4) | |
| Acer Nitro 16 AN16-41 | |
| WebXPRT 3 / Overall | |
| Acer Predator Helios 16 PH16-71-731Q | |
| Aorus 15X ASF | |
| Average of class Gaming (242 - 532, n=101, last 2 years) | |
| Asus TUF Gaming A16 FA617 | |
| Asus TUF Gaming A16 FA617 | |
| Dell G15 5530 | |
| Average Intel Core i7-13700HX, NVIDIA GeForce RTX 4060 Laptop GPU (238 - 336, n=4) | |
| Acer Nitro 16 AN16-41 | |
| Lenovo Legion Pro 5 16IRX8 | |
| WebXPRT 4 / Overall | |
| Average of class Gaming (176.4 - 354, n=101, last 2 years) | |
| Acer Predator Helios 16 PH16-71-731Q | |
| Dell G15 5530 | |
| Aorus 15X ASF | |
| Average Intel Core i7-13700HX, NVIDIA GeForce RTX 4060 Laptop GPU (247 - 283, n=5) | |
| Lenovo Legion Pro 5 16IRX8 | |
| Asus TUF Gaming A16 FA617 | |
| Asus TUF Gaming A16 FA617 | |
| Acer Nitro 16 AN16-41 | |
* ... smaller is better
| PCMark 10 Score | 7743 points | |
Help | ||
| AIDA64 / Memory Copy | |
| Average of class Gaming (21750 - 129946, n=110, last 2 years) | |
| Dell G15 5530 | |
| Lenovo Legion Pro 5 16IRX8 | |
| Aorus 15X ASF | |
| Acer Predator Helios 16 PH16-71-731Q | |
| Average Intel Core i7-13700HX (36125 - 63990, n=11) | |
| Asus TUF Gaming A16 FA617 | |
| Acer Nitro 16 AN16-41 | |
| AIDA64 / Memory Read | |
| Average of class Gaming (22956 - 118858, n=110, last 2 years) | |
| Dell G15 5530 | |
| Lenovo Legion Pro 5 16IRX8 | |
| Acer Predator Helios 16 PH16-71-731Q | |
| Aorus 15X ASF | |
| Average Intel Core i7-13700HX (36510 - 69729, n=11) | |
| Asus TUF Gaming A16 FA617 | |
| Acer Nitro 16 AN16-41 | |
| AIDA64 / Memory Write | |
| Acer Predator Helios 16 PH16-71-731Q | |
| Average of class Gaming (22297 - 135096, n=110, last 2 years) | |
| Lenovo Legion Pro 5 16IRX8 | |
| Dell G15 5530 | |
| Average Intel Core i7-13700HX (33598 - 85675, n=11) | |
| Aorus 15X ASF | |
| Asus TUF Gaming A16 FA617 | |
| Acer Nitro 16 AN16-41 | |
| AIDA64 / Memory Latency | |
| Average of class Gaming (75.3 - 259, n=110, last 2 years) | |
| Acer Nitro 16 AN16-41 | |
| Dell G15 5530 | |
| Average Intel Core i7-13700HX (81.5 - 97.9, n=11) | |
| Aorus 15X ASF | |
| Acer Predator Helios 16 PH16-71-731Q | |
| Asus TUF Gaming A16 FA617 | |
| Lenovo Legion Pro 5 16IRX8 | |
* ... smaller is better
DPC latencies
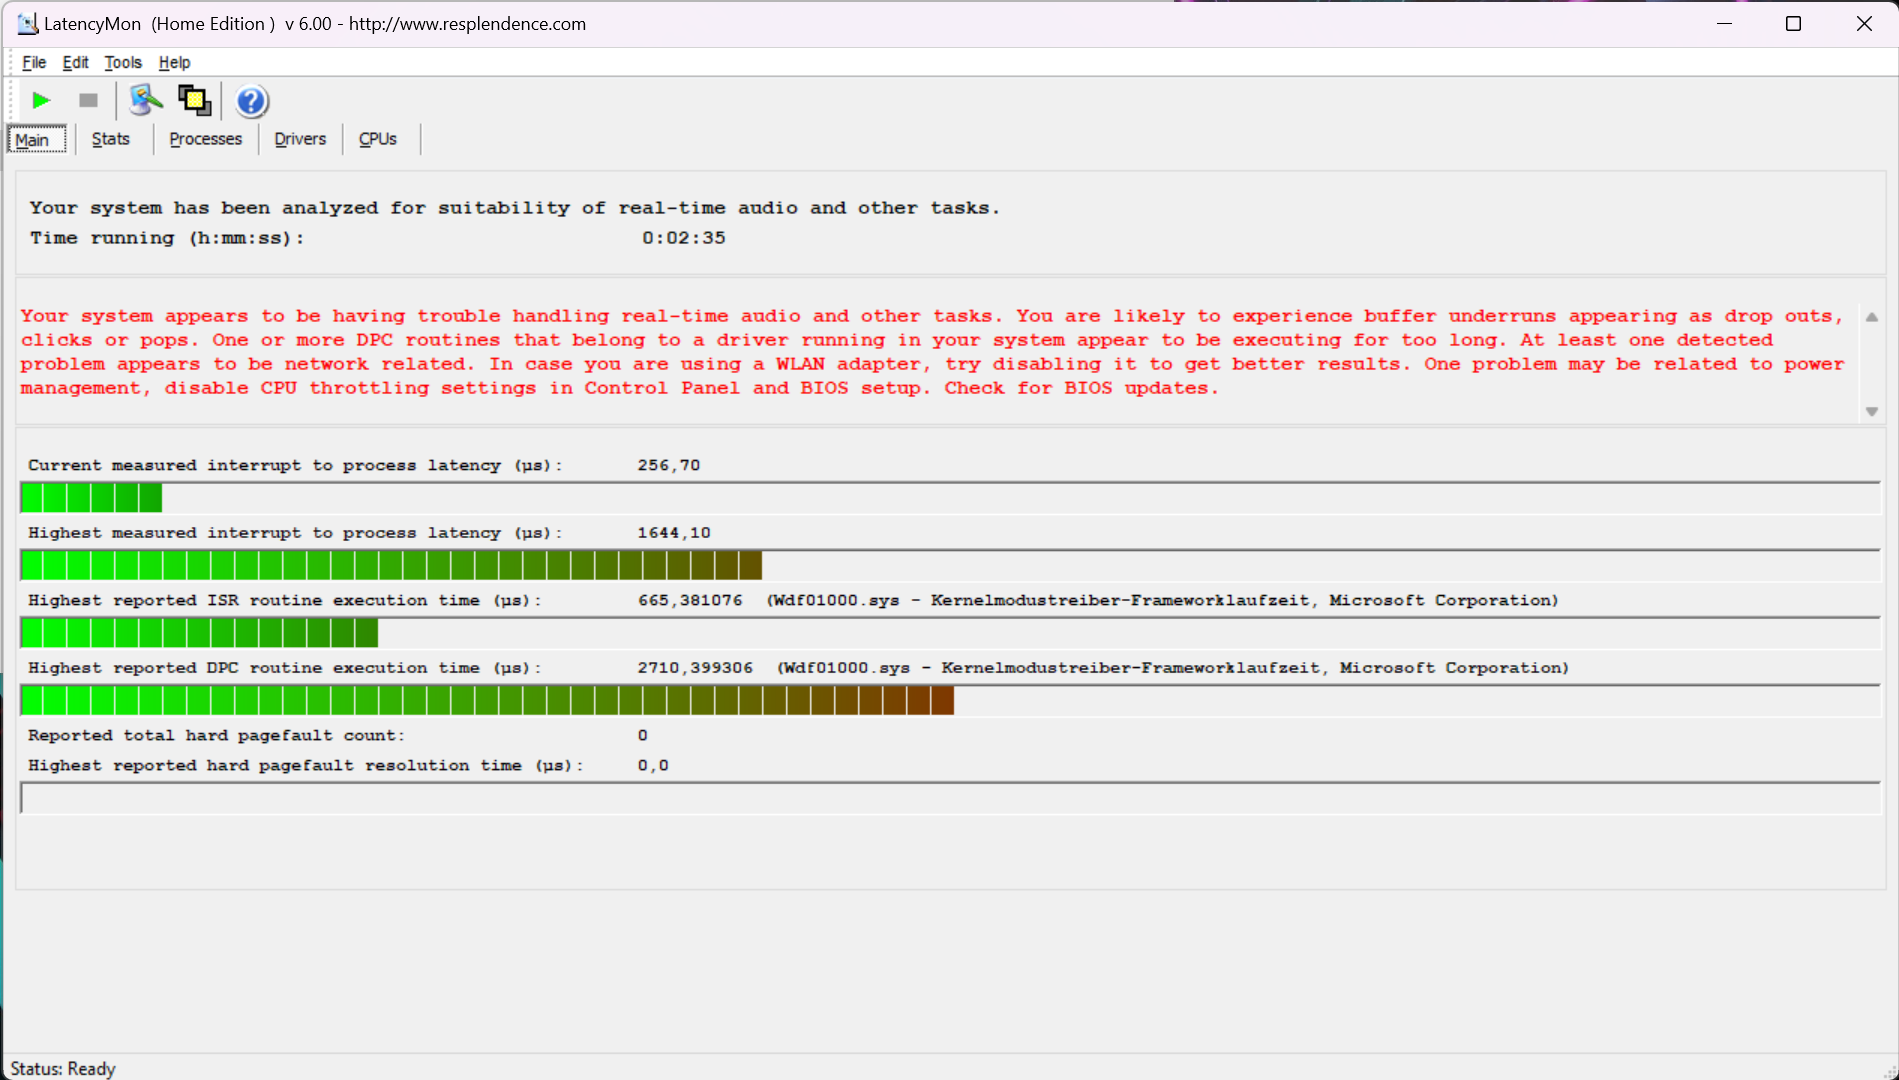
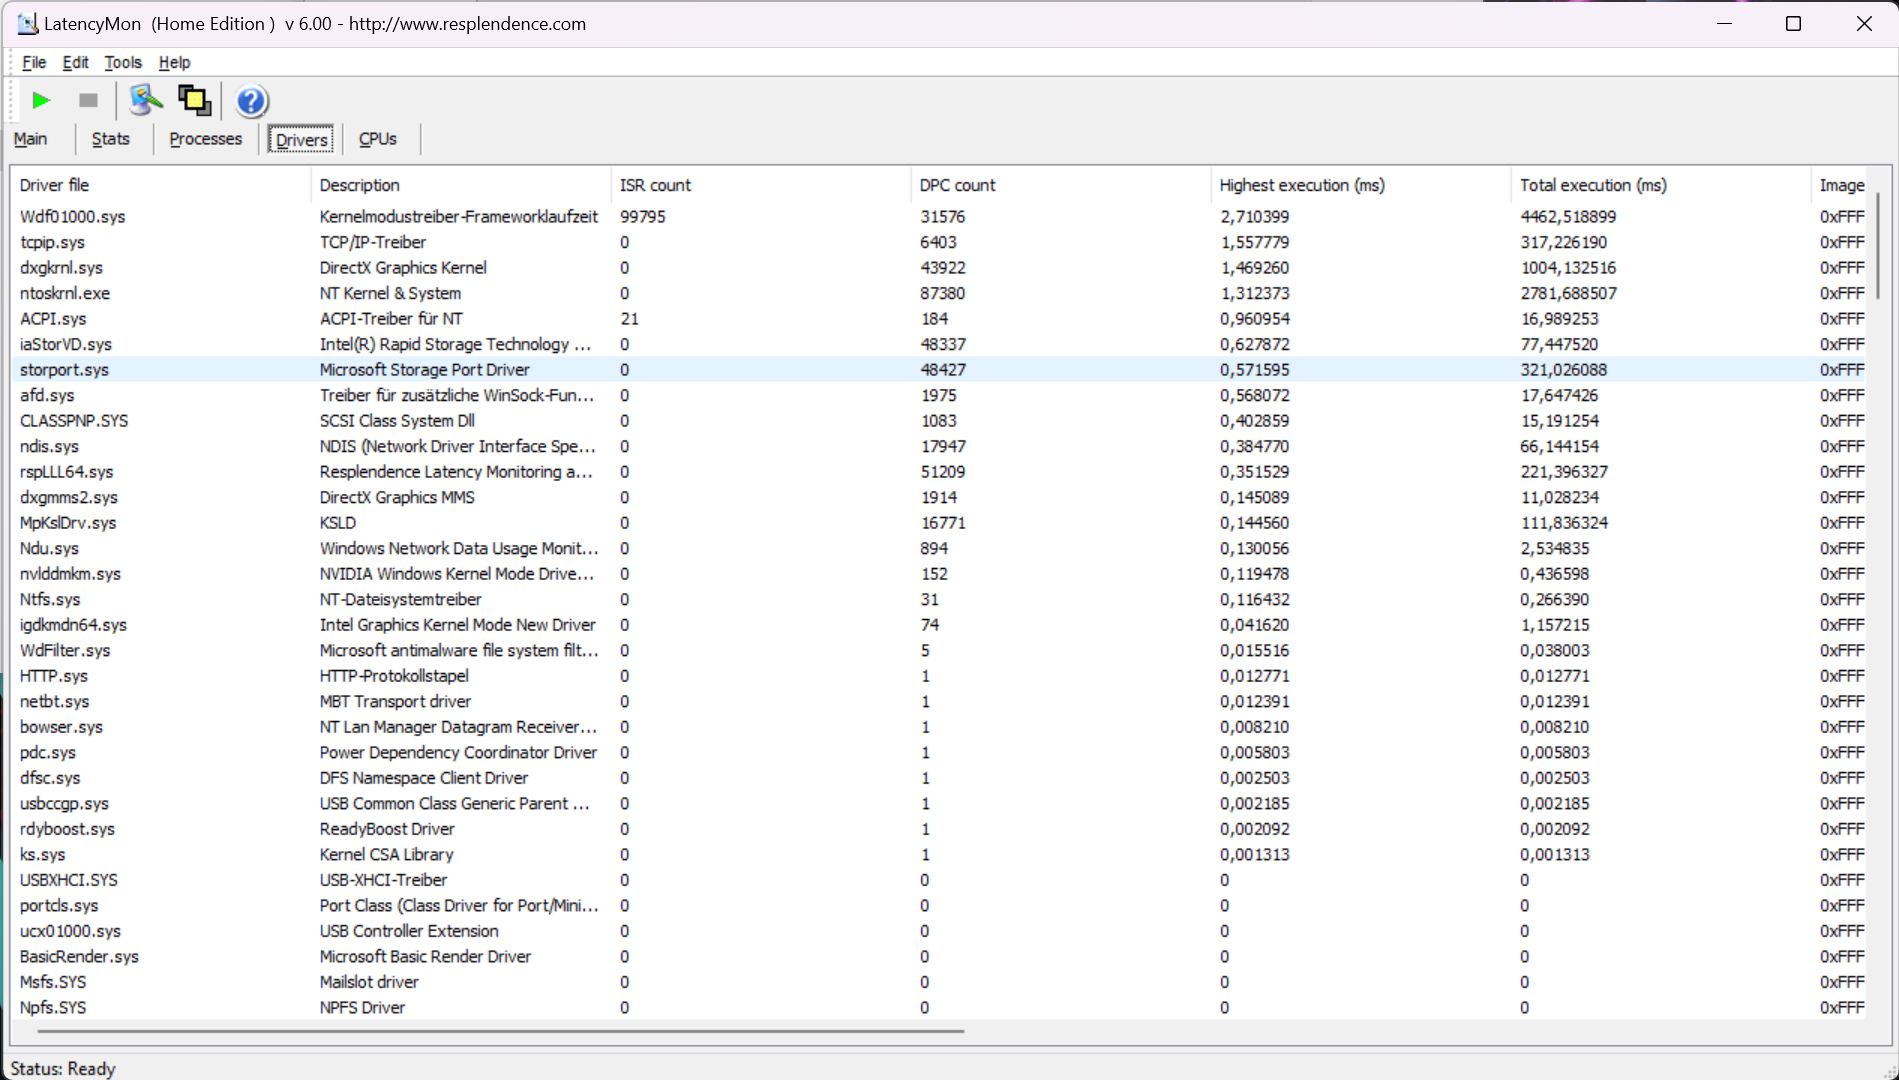
| DPC Latencies / LatencyMon - interrupt to process latency (max), Web, Youtube, Prime95 | |
| Dell G15 5530 | |
| Aorus 15X ASF | |
| Acer Predator Helios 16 PH16-71-731Q | |
| Acer Nitro 16 AN16-41 | |
| Lenovo Legion Pro 5 16IRX8 | |
| Asus TUF Gaming A16 FA617 | |
* ... smaller is better
Mass storage
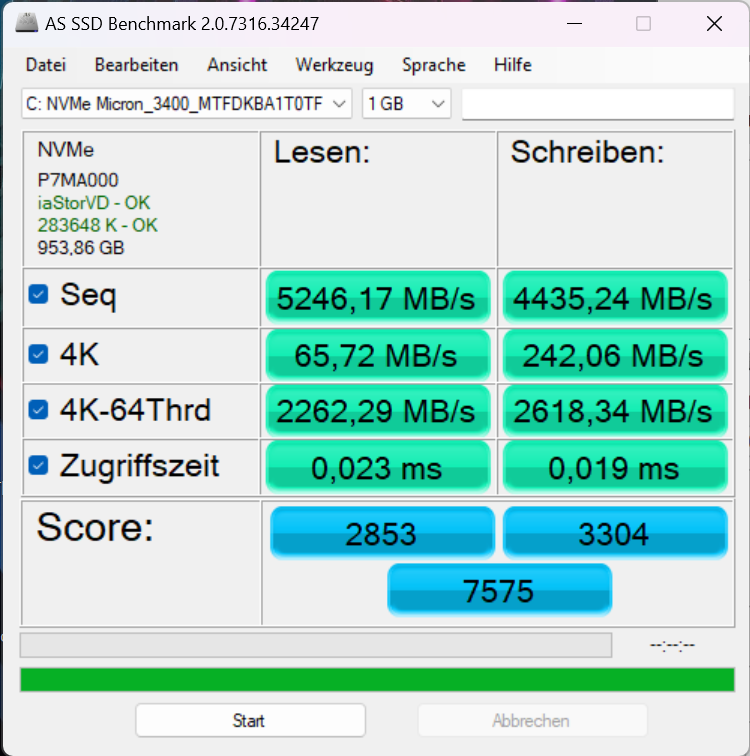
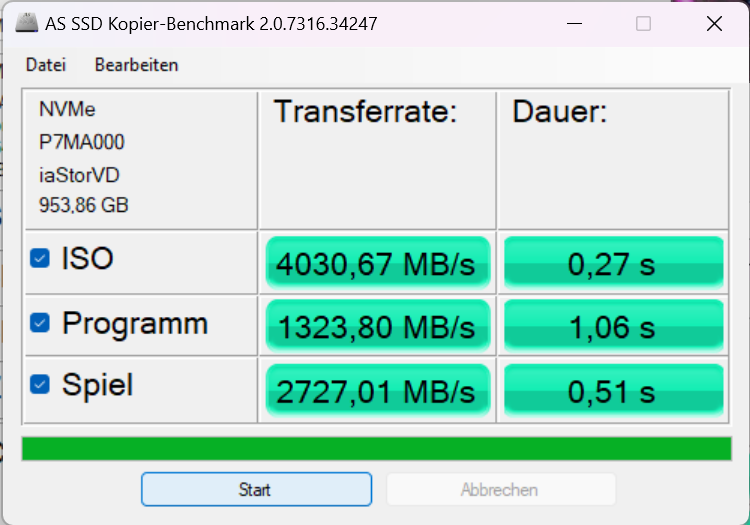
The installed PCIe 4.0 Micron 3400 SSD can hold 1 TB. The sequential read transfer rates of up to 6,100 MB/s are above-average. However, after a short time, drastic thermal-related throttling kicks in that reduces the speed to a third of its capacity. Throttling is not present in the Micron 3400 found in either the Asus ROG Flow X16 or Lenovo Legion 7 but the same issue was reported in both the HP ZBook Fury 16 and ZBook Firefly 14.
The SK Hynix PC801 in the Legion Pro 5 16 can also sustain transfers at up to ~6,000 MB/s while the small M.2 2242 SSD found in the Dell G15 5530 is clearly at the bottom of the pack.
| Acer Predator Helios 16 PH16-71-731Q Micron 3400 1TB MTFDKBA1T0TFH | Acer Nitro 16 AN16-41 Samsung PM9A1 MZVL21T0HCLR | Lenovo Legion Pro 5 16IRX8 SK hynix PC801 HFS512GEJ9X115N | Aorus 15X ASF Gigabyte AG470S1TB-SI B10 | Asus TUF Gaming A16 FA617 Micron 2400 MTFDKBA1T0QFM | Dell G15 5530 SSTC CL4-3D512-Q11 | |
|---|---|---|---|---|---|---|
| AS SSD | -25% | -15% | -15% | -72% | -144% | |
| Seq Read (MB/s) | 5246.2 | 5185.49 -1% | 5856.12 12% | 4649.46 -11% | 3976.53 -24% | 2603.73 -50% |
| Seq Write (MB/s) | 4435.2 | 3900.46 -12% | 4750.28 7% | 3810.26 -14% | 3020.8 -32% | 494.63 -89% |
| 4K Read (MB/s) | 65.7 | 62.76 -4% | 77.12 17% | 100.75 53% | 49.25 -25% | 36.37 -45% |
| 4K Write (MB/s) | 242.1 | 137.9 -43% | 276.66 14% | 308.92 28% | 152.75 -37% | 188.64 -22% |
| 4K-64 Read (MB/s) | 2262.3 | 2593.07 15% | 2572.63 14% | 2964.13 31% | 1901.41 -16% | 932.26 -59% |
| 4K-64 Write (MB/s) | 2618.3 | 3195.33 22% | 3536.78 35% | 3103.89 19% | 1949.13 -26% | 276.64 -89% |
| Access Time Read * (ms) | 0.023 | 0.079 -243% | 0.044 -91% | 0.068 -196% | 0.05 -117% | 0.103 -348% |
| Access Time Write * (ms) | 0.019 | 0.029 -53% | 0.053 -179% | 0.012 37% | 0.105 -453% | 0.182 -858% |
| Score Read (Points) | 2853 | 3174 11% | 3235 13% | 3530 24% | 2348 -18% | 1229 -57% |
| Score Write (Points) | 3304 | 3723 13% | 4288 30% | 3794 15% | 2404 -27% | 515 -84% |
| Score Total (Points) | 7575 | 8452 12% | 9125 20% | 9097 20% | 5903 -22% | 2271 -70% |
| Copy ISO MB/s (MB/s) | 4030.7 | 3037.59 -25% | 566.62 -86% | 1039.04 -74% | 488.98 -88% | |
| Copy Program MB/s (MB/s) | 1323.8 | 968.9 -27% | 1098.38 -17% | 439.84 -67% | 296.26 -78% | |
| Copy Game MB/s (MB/s) | 2727 | 2239.37 -18% | 2670.4 -2% | 721.09 -74% | 452.22 -83% | |
| DiskSpd | -22% | -3% | 9% | -31% | -57% | |
| seq read (MB/s) | 3587 | 3520 -2% | 5346 49% | 3419 -5% | 2460 -31% | 2726 -24% |
| seq write (MB/s) | 4634 | 2220 -52% | 1495 -68% | 3270 -29% | 2991 -35% | 535 -88% |
| seq q8 t1 read (MB/s) | 6521 | 6661 2% | 7127 9% | 7018 8% | 4633 -29% | 2985 -54% |
| seq q8 t1 write (MB/s) | 4962 | 2216 -55% | 4903 -1% | 4398 -11% | 3415 -31% | 539 -89% |
| 4k q1 t1 read (MB/s) | 68.3 | 48.4 -29% | 65.9 -4% | 73.5 8% | 35.5 -48% | 34 -50% |
| 4k q1 t1 write (MB/s) | 249 | 159.6 -36% | 328 32% | 346 39% | 181.3 -27% | 224 -10% |
| 4k q32 t16 read (MB/s) | 2848 | 3311 16% | 2889 1% | 3552 25% | 2025 -29% | 1054 -63% |
| 4k q32 t16 write (MB/s) | 2670 | 2193 -18% | 1457 -45% | 3610 35% | 2291 -14% | 507 -81% |
| Total Average (Program / Settings) | -24% /
-24% | -9% /
-11% | -3% /
-6% | -52% /
-55% | -101% /
-113% |
* ... smaller is better
* ... smaller is better
Continuous Performance Read: DiskSpd Read Loop, Queue Depth 8
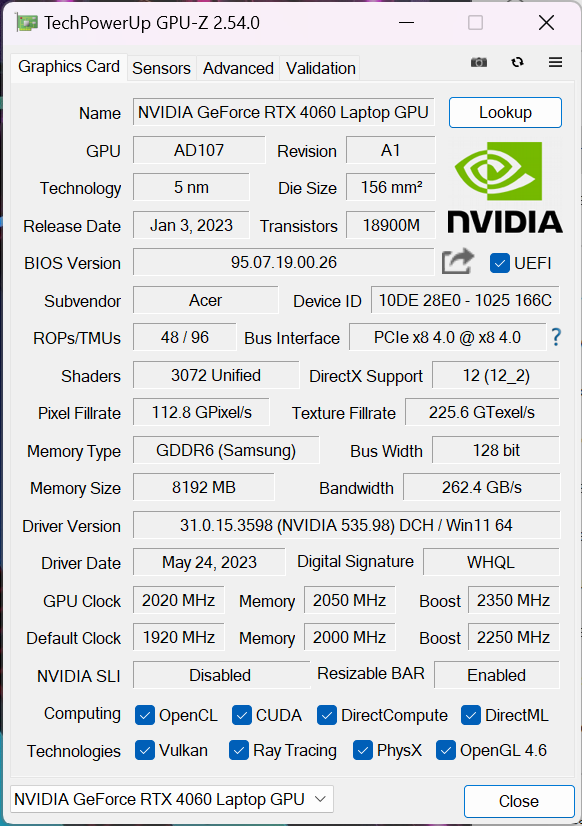
Graphics card
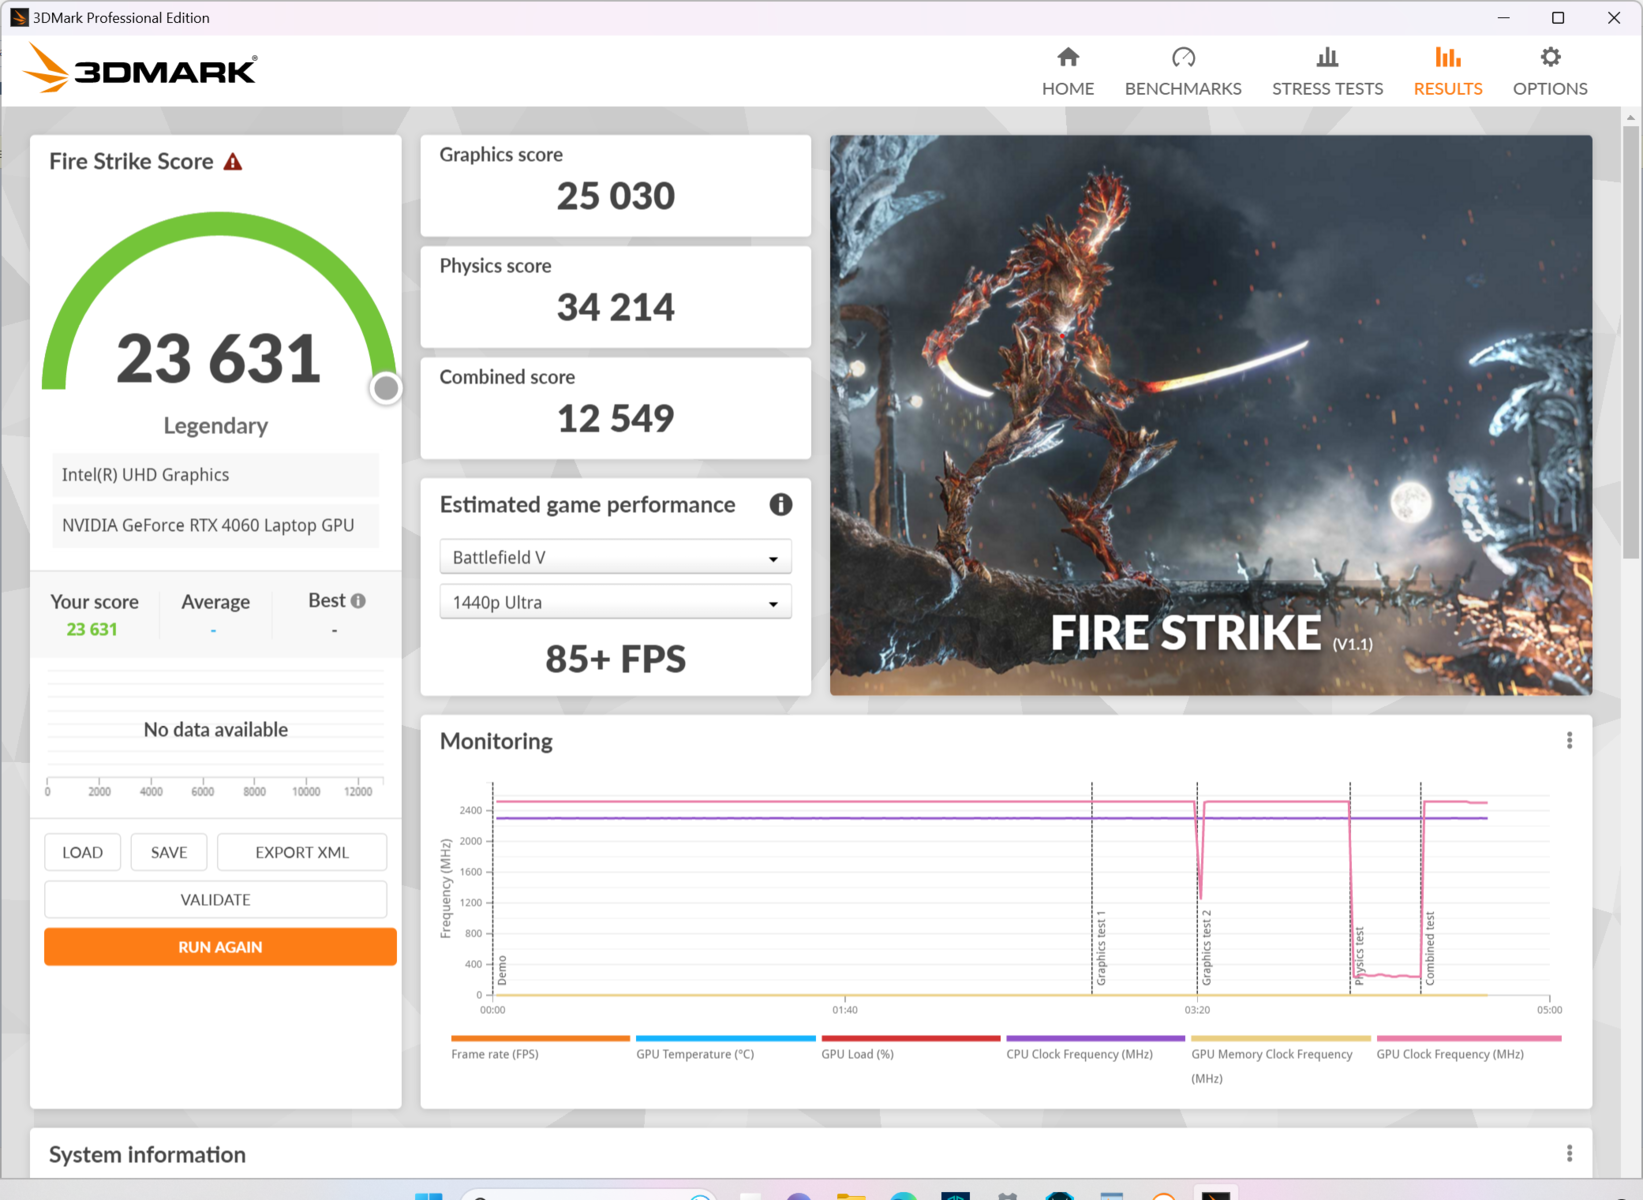
The Helios 16's Nvidia GeForce RTX 4060 is a mid-range chip with 8 GB of VRAM which has a maximum TGP of 140 watts (115 watts + 25 watts Dynamic Boost). However, the 2,570 MHz maximum clock speed is already reached at 100 watts. Only the FurMark stress test was able to coax ~140 watts from the GPU. By contrast, when gaming, an RTX 4060 laptop GPU never draws more than ~100 W.
Performance is correspondingly similar to other gaming laptops with an RTX 4060 such as the Legion Pro 5 16 and the Dell G15 5530. The RTX 4070 in the Aorus 15X is also not far off. The synthetic benchmark results are halved in battery mode.
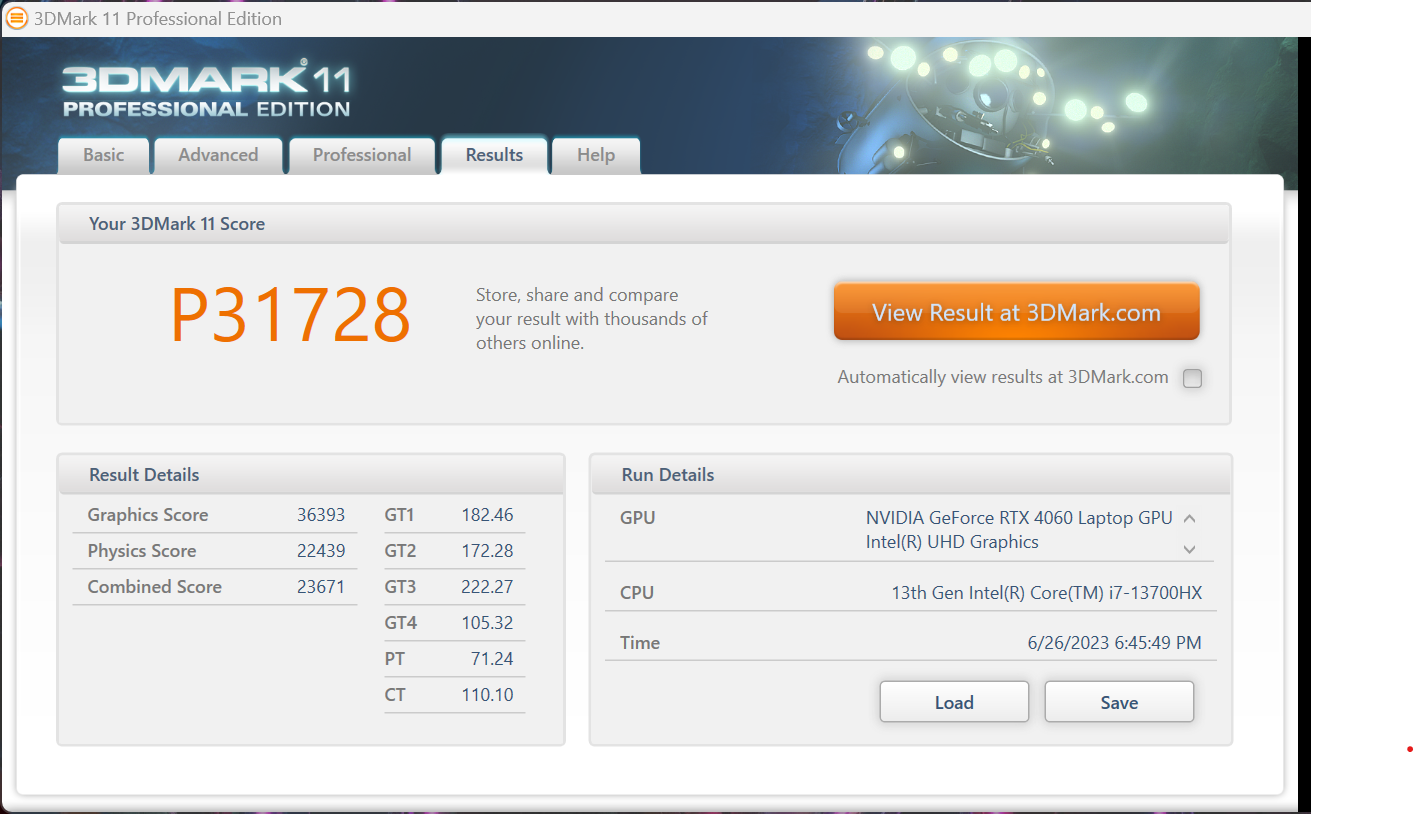
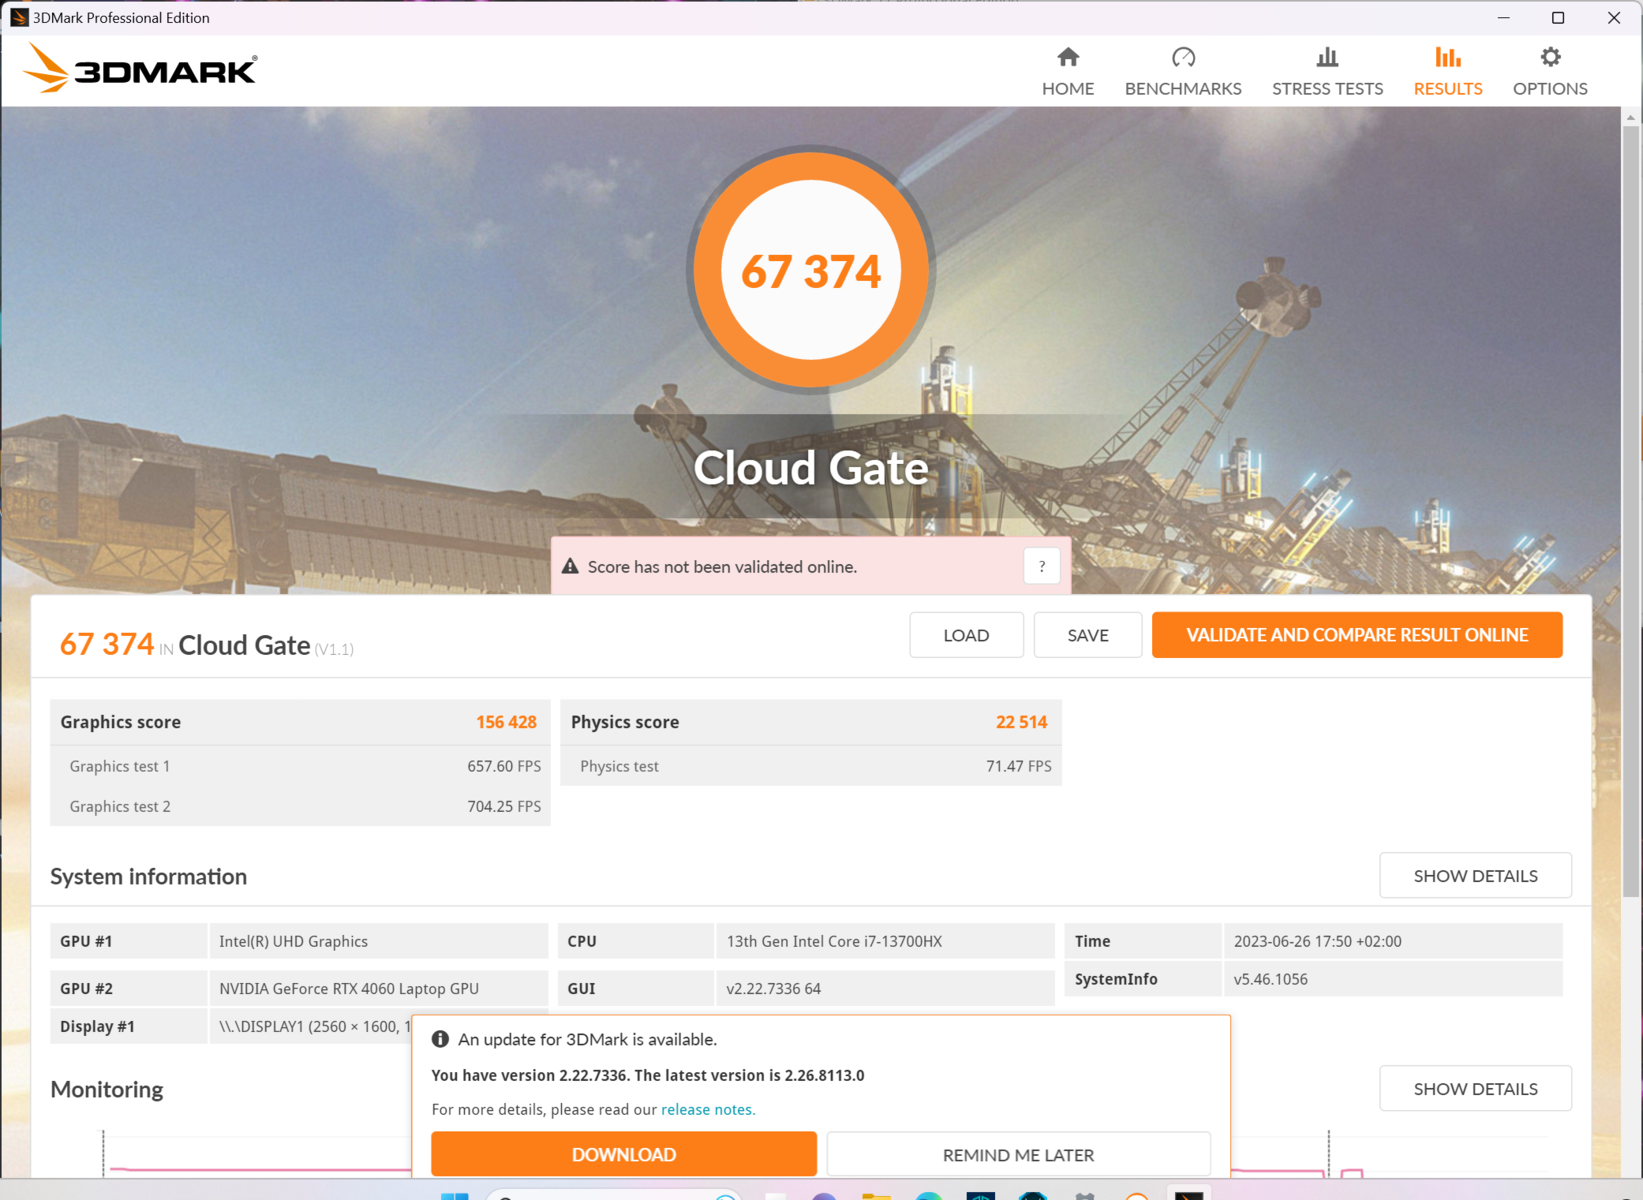
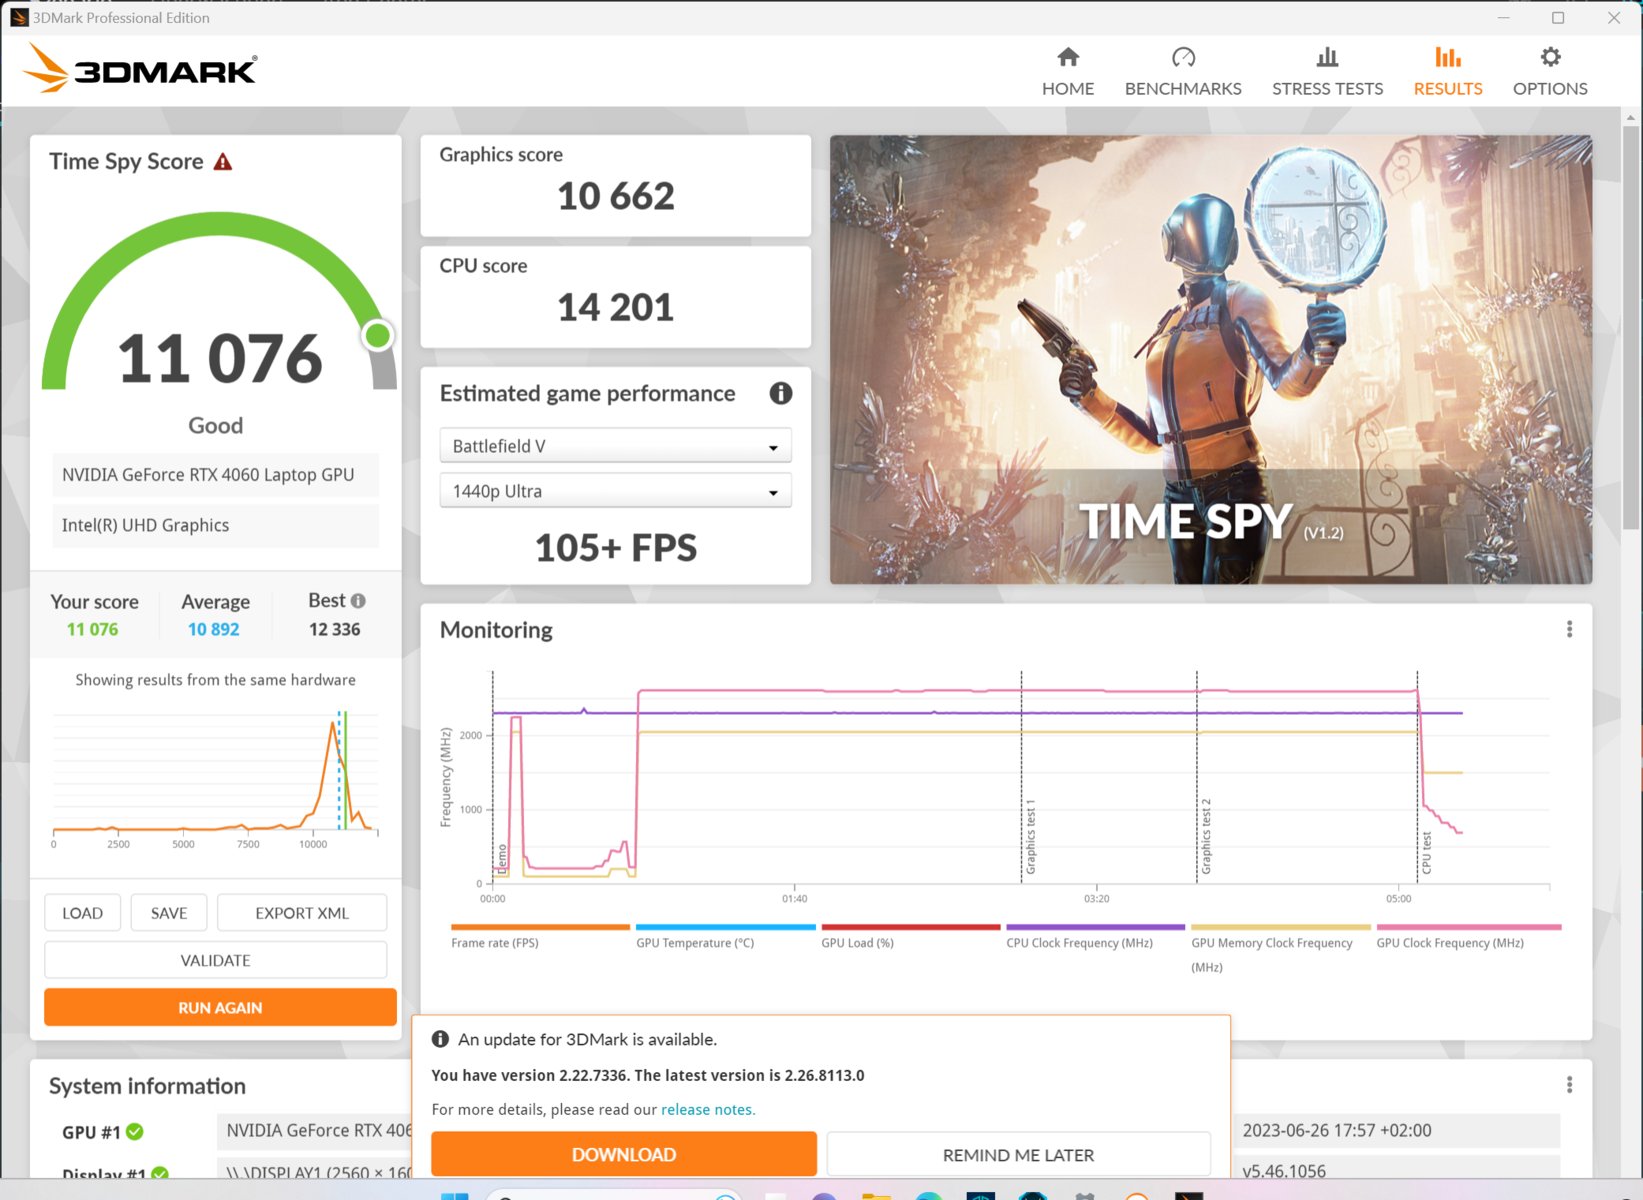
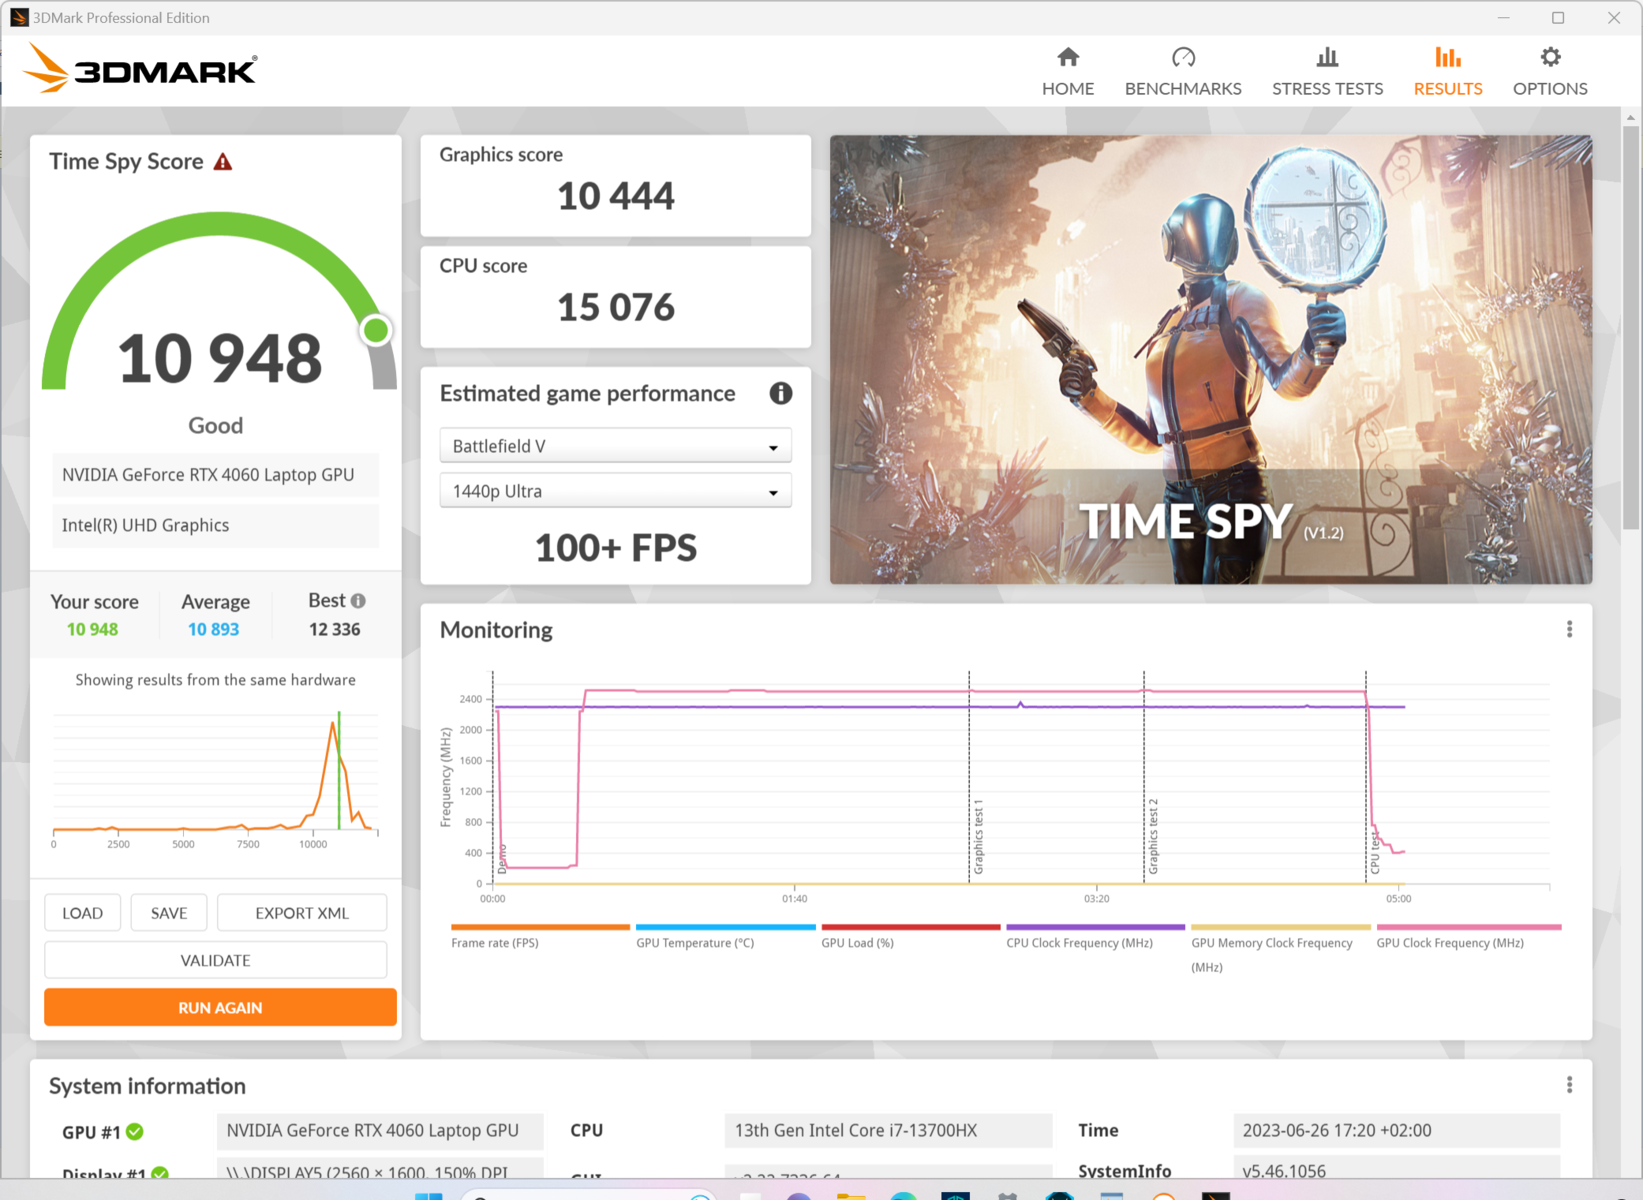
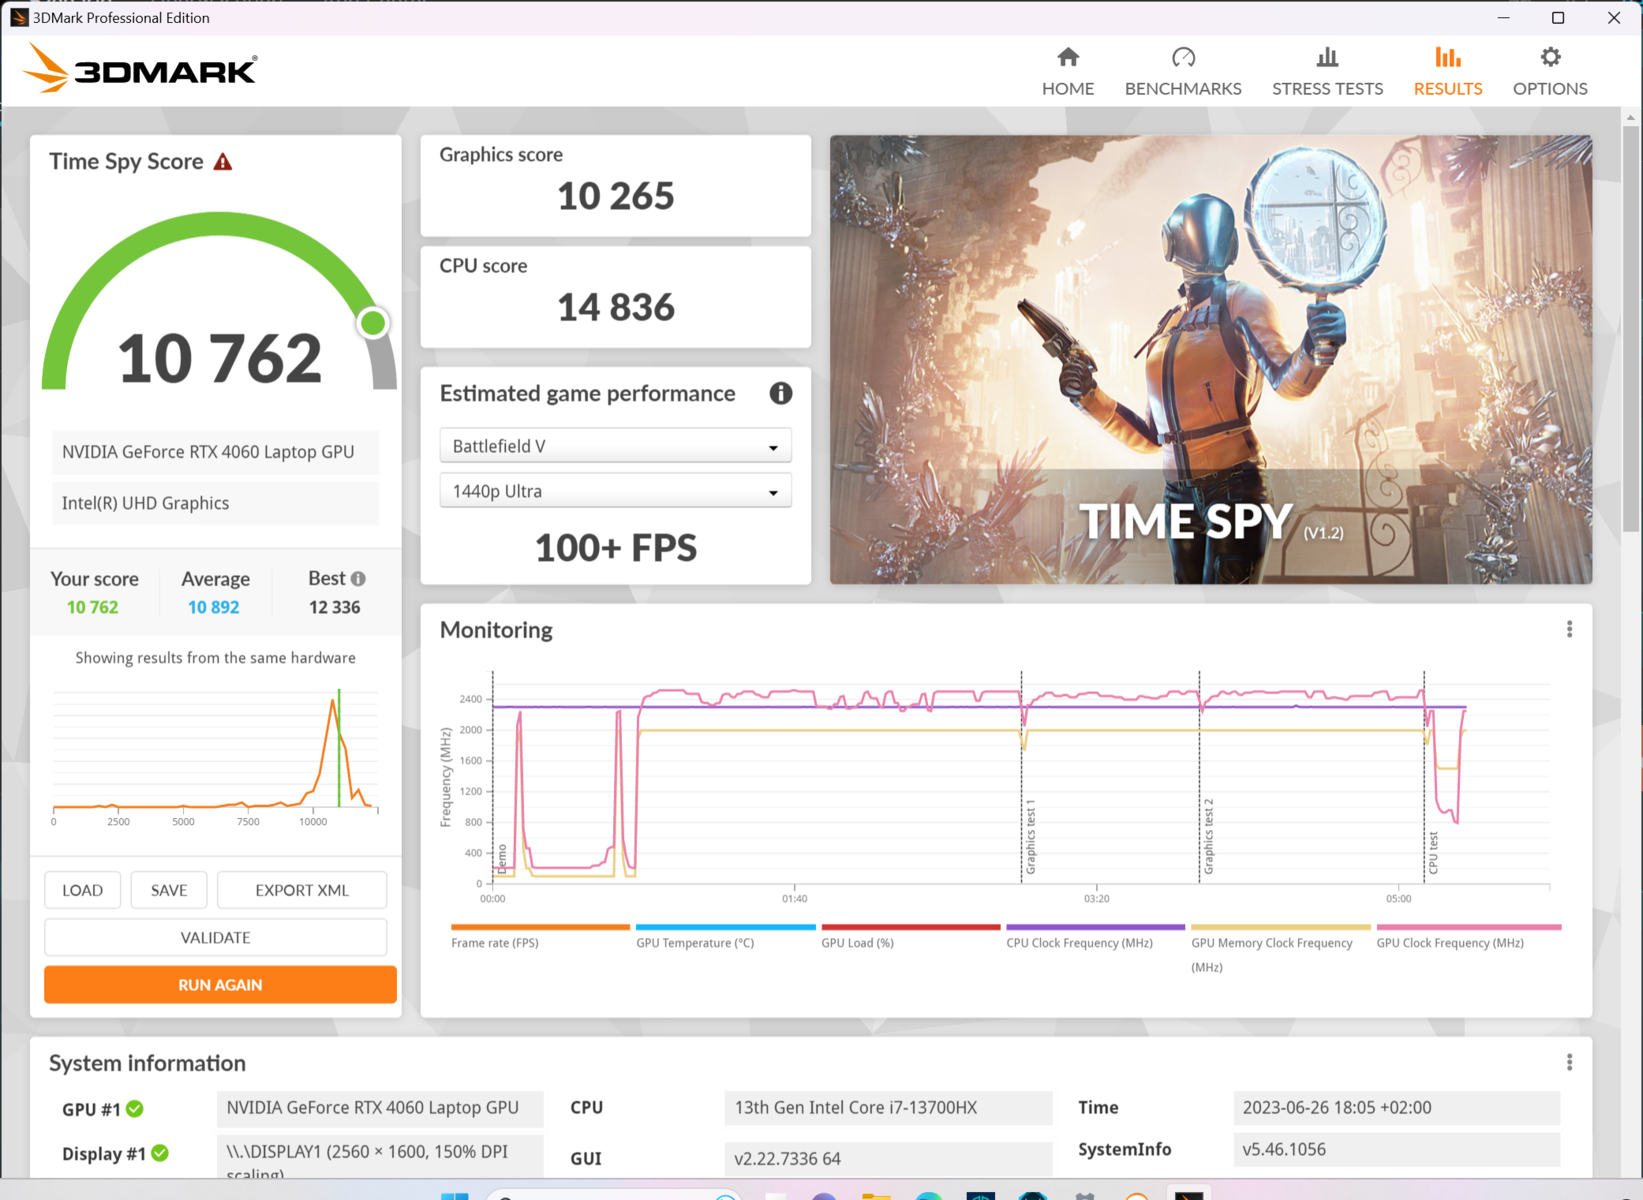


| 3DMark 11 Performance | 31728 points | |
| 3DMark Cloud Gate Standard Score | 67374 points | |
| 3DMark Fire Strike Score | 23631 points | |
| 3DMark Time Spy Score | 10948 points | |
Help | ||
| Geekbench 6.0 - GPU OpenCL 6.0 | |
| Aorus 15X ASF | |
| Acer Nitro 16 AN16-41 | |
| Acer Predator Helios 16 PH16-71-731Q | |
| Dell G15 5530 | |
* ... smaller is better
Gaming performance
In Cyberpunk 2077 @QHD/Ultra, the Acer Predator Helios 16 was able to race to the front of our field of competitors, even slightly in front of the Legion Pro 5 16's RTX 4070. However, in our performance rating, the competing devices are all bunched together with the Radeon RX 7600S found in the TUF Gaming A16 weakening slightly.
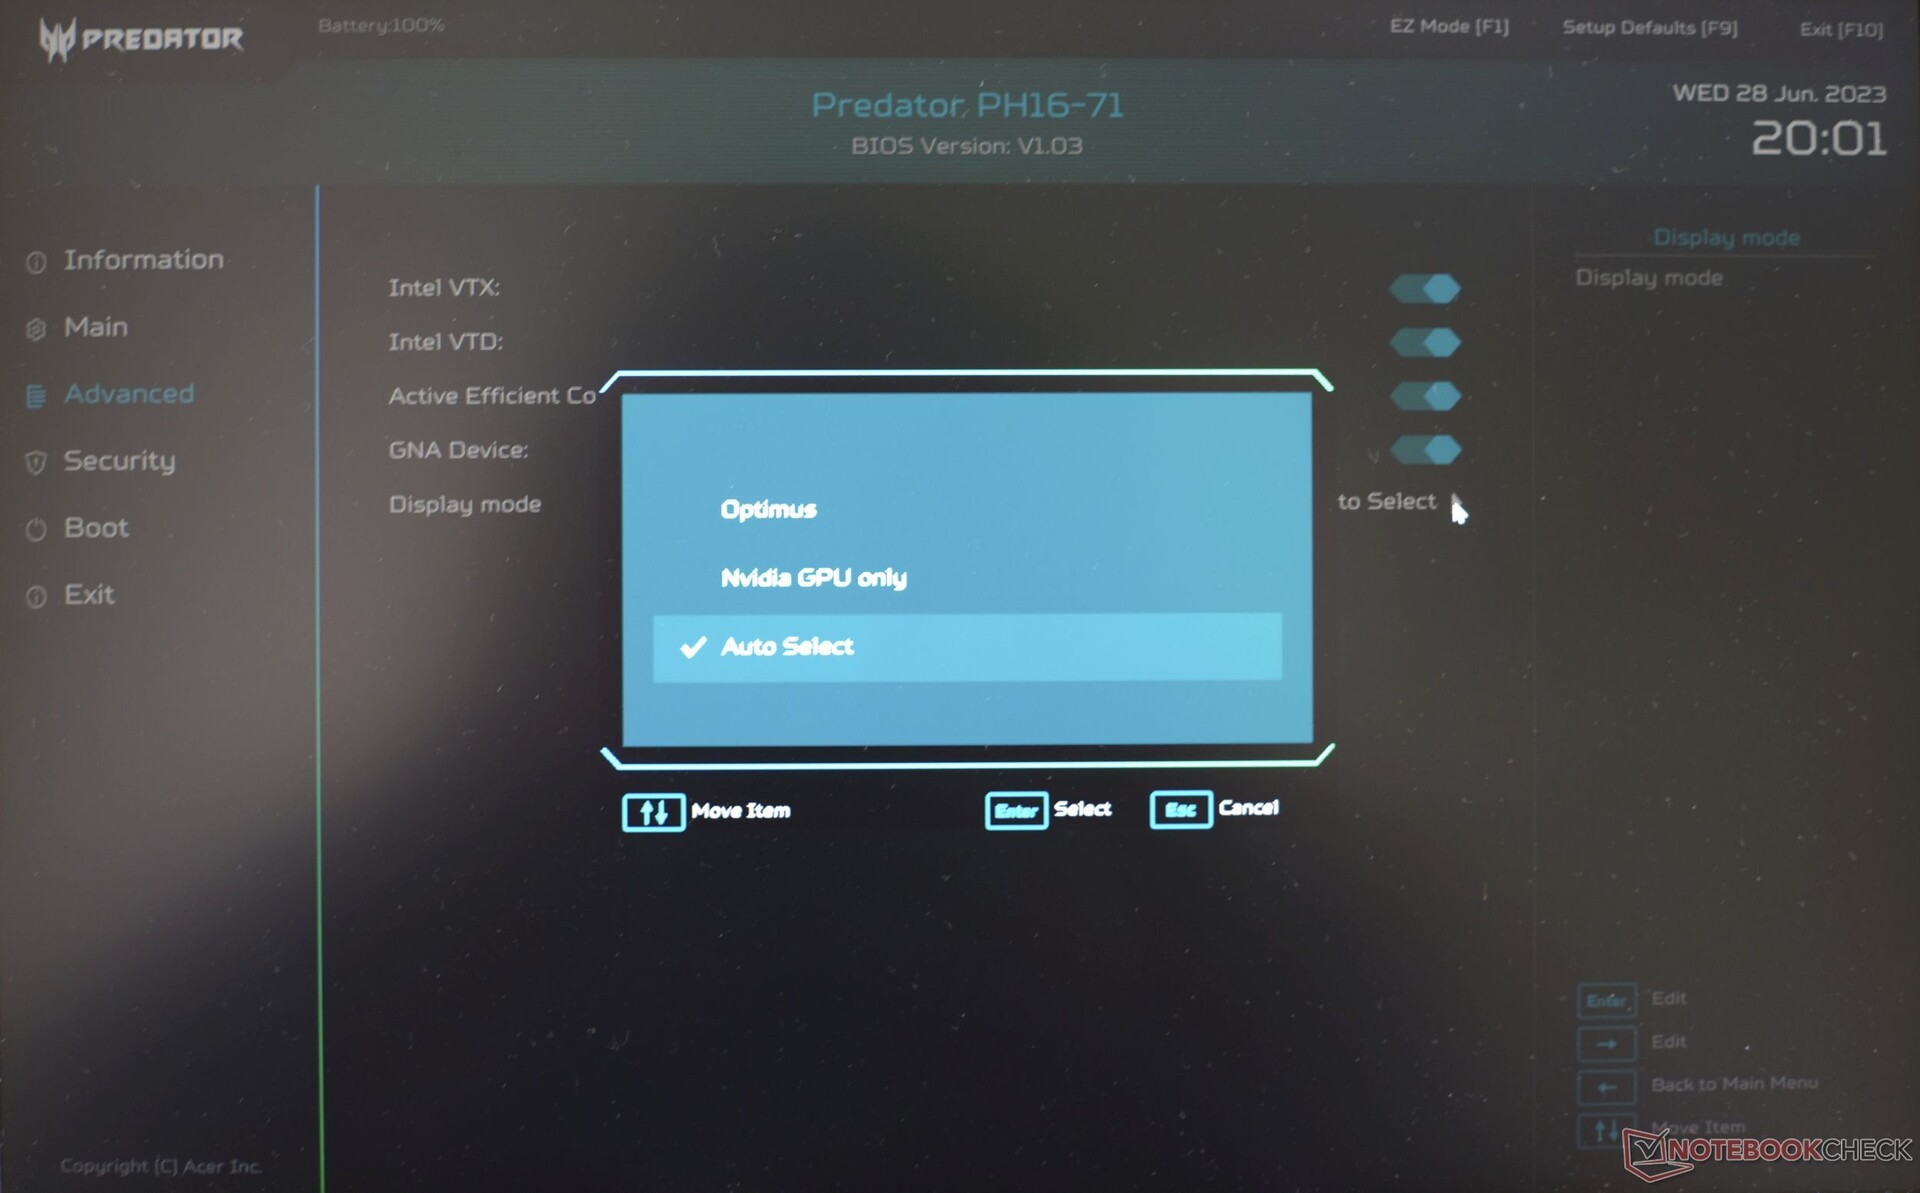
Switching to the dGPU-only mode results in a meagre 3 % performance gain. If this is combined with the turbo mode this increases to 6 %. With ray tracing activated, you still get 60fps in Cyberpunk 2077 1.6 Ultra/FHD instead of 93.2fps. With DLSS activated (balanced) – in this case without ray tracing – it's 134.2fps.
Balanced performance mode drops the frame rate to 87.4 which is more than acceptable considering the significantly quieter fans. In battery mode, the frame rate drops by almost 70 % to 30fps. With "DLSS Max Performance", it is possible to double the frame rates once more so that some new games play (and remain) relatively smoothly in battery mode.
| The Witcher 3 - 1920x1080 Ultra Graphics & Postprocessing (HBAO+) | |
| Average of class Gaming (95 - 240, n=8, last 2 years) | |
| Acer Predator Helios 300 (i7-12700H, RTX 3070 Ti) | |
| Aorus 15X ASF | |
| Acer Nitro 16 AN16-41 | |
| Acer Nitro 17 AN17-51-71ER | |
| Dell G15 5530 | |
| Acer Predator Triton 500 SE PT516-52s-70KX | |
| Acer Predator Helios 16 PH16-71-731Q | |
| Asus TUF Gaming A16 FA617 | |
Witcher 3 FPS diagram
| low | med. | high | ultra | QHD | |
|---|---|---|---|---|---|
| GTA V (2015) | 182.8 | 181.3 | 172.5 | 112.8 | 88.3 |
| The Witcher 3 (2015) | 466 | 331 | 181.3 | 102.1 | |
| Dota 2 Reborn (2015) | 189.6 | 171.8 | 159.2 | 153 | |
| Final Fantasy XV Benchmark (2018) | 226 | 150.3 | 100.1 | 72.4 | |
| X-Plane 11.11 (2018) | 136.2 | 123.2 | 95.4 | ||
| Strange Brigade (2018) | 434 | 272 | 215 | 185.2 | 123.5 |
| Shadow of the Tomb Raider (2018) | 141 | 93 | |||
| God of War (2022) | 134.4 | 112.3 | 89.4 | 64.6 | 53.3 |
| Cyberpunk 2077 1.6 (2022) | 132.5 | 126 | 114.9 | 93.2 | 58.6 |
| Tiny Tina's Wonderlands (2022) | 219 | 175.1 | 114.7 | 87.9 | 60 |
| F1 22 (2022) | 256 | 244 | 196.5 | 65.2 | 38 |
| Call of Duty Modern Warfare 2 2022 (2022) | 88 | 60 | |||
| Returnal (2023) | 84.4 | 77.9 | 72.6 | 67 | 59.4 |
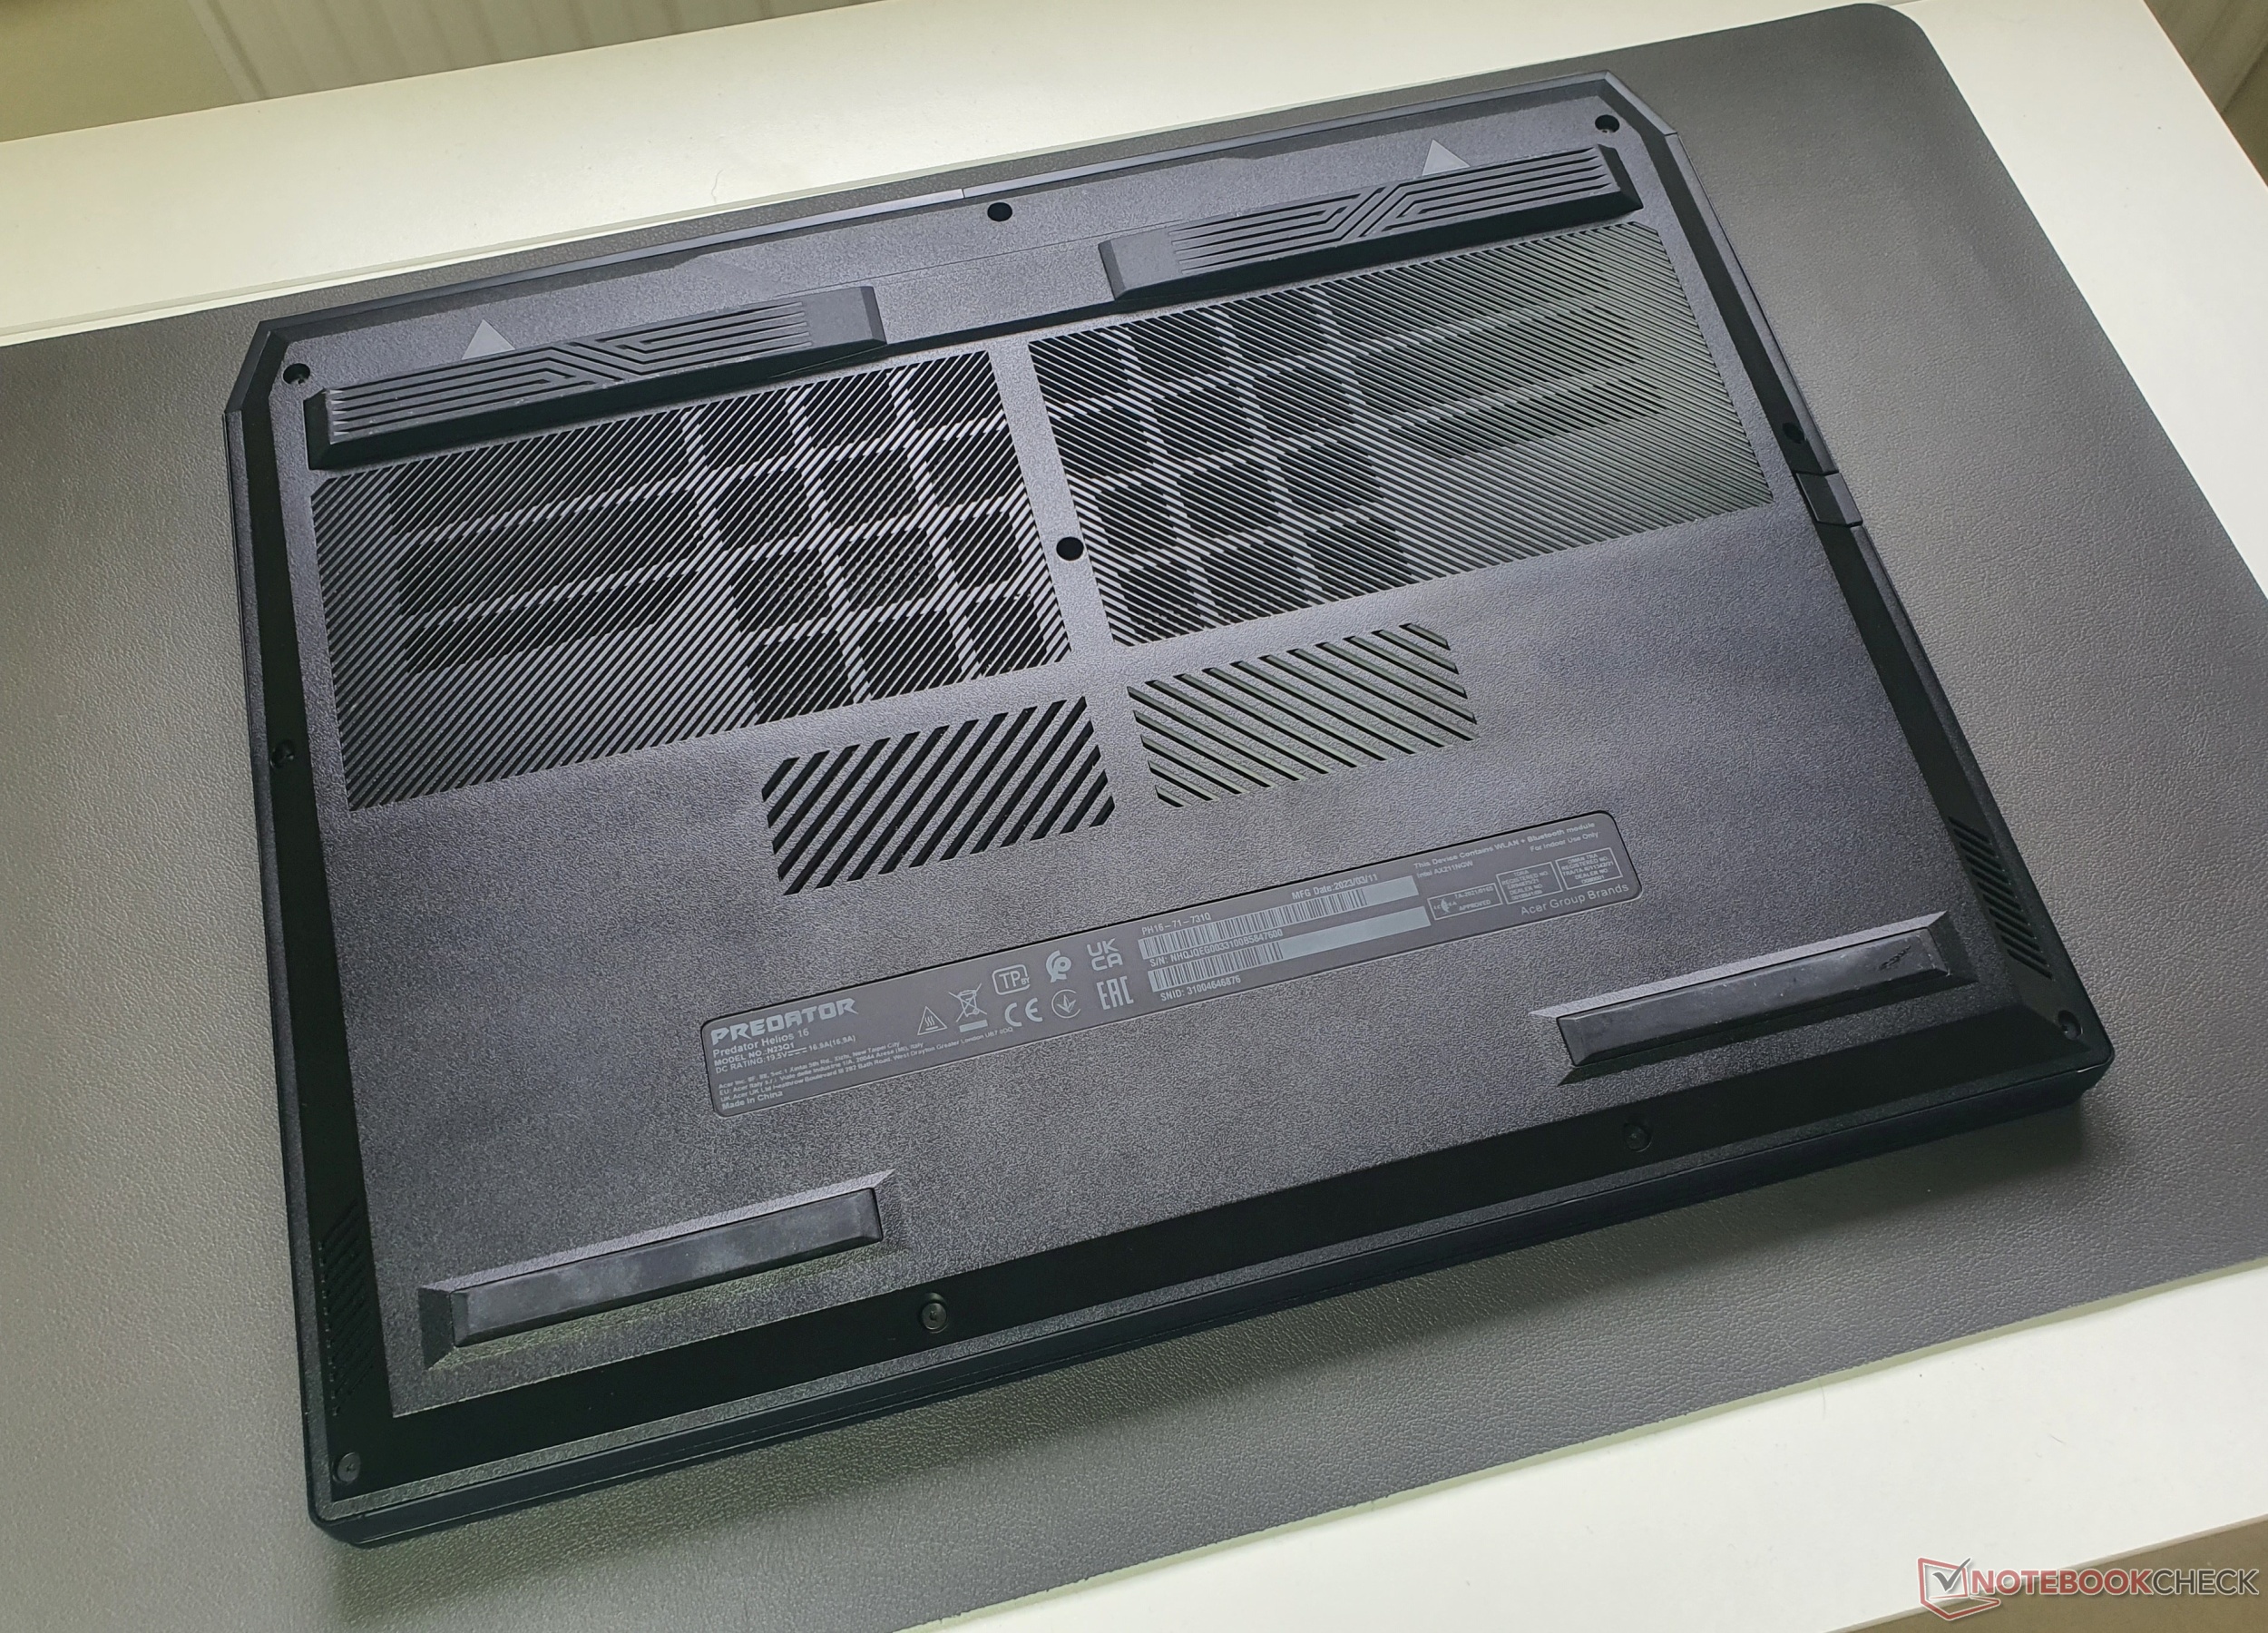
Emissions: The Acer Predator Helios 16 has a powerful cooling system

Noise emissions
In idle use when surfing the internet and undertaking simple office tasks, the Predator Helios 16 is almost always pleasantly silent and, it goes without saying, in quiet mode or battery operation.
In terms of pure CPU load, 36.6 dB(A) was reached but was also not very annoying. When gaming, the performance mode gets very loud at 49 dB(A) which is the average for gaming laptops. In turbo mode, it gets unbearably loud without any real added value. By contrast, the balanced mode achieves almost pleasant background noise while very little performance is lost. Finally, the quiet mode is easy on the ears with drops of around 30 % in 3D applications.
However, charging our review model resulted in a clearly audible whining noise.
Noise level
| Idle |
| 24 / 24 / 32.32 dB(A) |
| Load |
| 36.66 / 49.49 dB(A) |
 | ||
30 dB silent 40 dB(A) audible 50 dB(A) loud |
||
min: | ||
| Acer Predator Helios 16 PH16-71-731Q GeForce RTX 4060 Laptop GPU, i7-13700HX, Micron 3400 1TB MTFDKBA1T0TFH | Acer Nitro 16 AN16-41 GeForce RTX 4070 Laptop GPU, R7 7735HS, Samsung PM9A1 MZVL21T0HCLR | Lenovo Legion Pro 5 16IRX8 GeForce RTX 4060 Laptop GPU, i7-13700HX, SK hynix PC801 HFS512GEJ9X115N | Aorus 15X ASF GeForce RTX 4070 Laptop GPU, i7-13700HX, Gigabyte AG470S1TB-SI B10 | Asus TUF Gaming A16 FA617 Radeon RX 7600S, R7 7735HS, Micron 2400 MTFDKBA1T0QFM | Dell G15 5530 GeForce RTX 4060 Laptop GPU, i7-13650HX, SSTC CL4-3D512-Q11 | |
|---|---|---|---|---|---|---|
| Noise | -3% | 4% | -17% | -1% | 5% | |
| off / environment * (dB) | 24 | 25.7 -7% | 23 4% | 25 -4% | 24 -0% | 20.41 15% |
| Idle Minimum * (dB) | 24 | 25.7 -7% | 23.1 4% | 28 -17% | 24 -0% | 26.85 -12% |
| Idle Average * (dB) | 24 | 25.7 -7% | 23.1 4% | 29 -21% | 25 -4% | 26.85 -12% |
| Idle Maximum * (dB) | 32.32 | 26.3 19% | 26.6 18% | 36 -11% | 28 13% | 26.85 17% |
| Load Average * (dB) | 36.66 | 33.9 8% | 34.7 5% | 50 -36% | 42 -15% | 27.65 25% |
| Witcher 3 ultra * (dB) | 49.06 | 47.6 3% | 54 -10% | 50 -2% | 47.9 2% | |
| Load Maximum * (dB) | 49.49 | 62 -25% | 54.8 -11% | 58 -17% | 50 -1% | 47.86 3% |
* ... smaller is better
Temperature
Acer's gaming laptop remains astonishingly cool and, during gaming sessions, most of the surfaces don't even reach 40 °C. The heat is only concentrated on the protruding cooling system on the rear where hot spots can reach 55 °C when gaming. Only in the combined stress test, we measured a hot spot of 66 °C, although this doesn't happen during everyday use. Users will mostly never come into contact with the rear bar but, when placed on the lap, occasional contact with the device will be unpleasant when gaming.
(±) The maximum temperature on the upper side is 41 °C / 106 F, compared to the average of 40.4 °C / 105 F, ranging from 21.2 to 68.8 °C for the class Gaming.
(-) The bottom heats up to a maximum of 66 °C / 151 F, compared to the average of 43.2 °C / 110 F
(±) In idle usage, the average temperature for the upper side is 32.4 °C / 90 F, compared to the device average of 33.9 °C / 93 F.
(±) Playing The Witcher 3, the average temperature for the upper side is 33.1 °C / 92 F, compared to the device average of 33.9 °C / 93 F.
(+) The palmrests and touchpad are reaching skin temperature as a maximum (32 °C / 89.6 F) and are therefore not hot.
(-) The average temperature of the palmrest area of similar devices was 28.8 °C / 83.8 F (-3.2 °C / -5.8 F).
| Acer Predator Helios 16 PH16-71-731Q Intel Core i7-13700HX, NVIDIA GeForce RTX 4060 Laptop GPU | Acer Nitro 16 AN16-41 AMD Ryzen 7 7735HS, NVIDIA GeForce RTX 4070 Laptop GPU | Lenovo Legion Pro 5 16IRX8 Intel Core i7-13700HX, NVIDIA GeForce RTX 4060 Laptop GPU | Aorus 15X ASF Intel Core i7-13700HX, NVIDIA GeForce RTX 4070 Laptop GPU | Asus TUF Gaming A16 FA617 AMD Ryzen 7 7735HS, AMD Radeon RX 7600S | Dell G15 5530 Intel Core i7-13650HX, NVIDIA GeForce RTX 4060 Laptop GPU | |
|---|---|---|---|---|---|---|
| Heat | 10% | 12% | 19% | -6% | -2% | |
| Maximum Upper Side * (°C) | 41 | 41.5 -1% | 42.8 -4% | 42 -2% | 54 -32% | 54 -32% |
| Maximum Bottom * (°C) | 66 | 51.8 22% | 50 24% | 51 23% | 47 29% | 62.2 6% |
| Idle Upper Side * (°C) | 36 | 31.6 12% | 29.6 18% | 27 25% | 40 -11% | 33.4 7% |
| Idle Bottom * (°C) | 37 | 34.5 7% | 34 8% | 26 30% | 40 -8% | 33.4 10% |
* ... smaller is better
Stress test
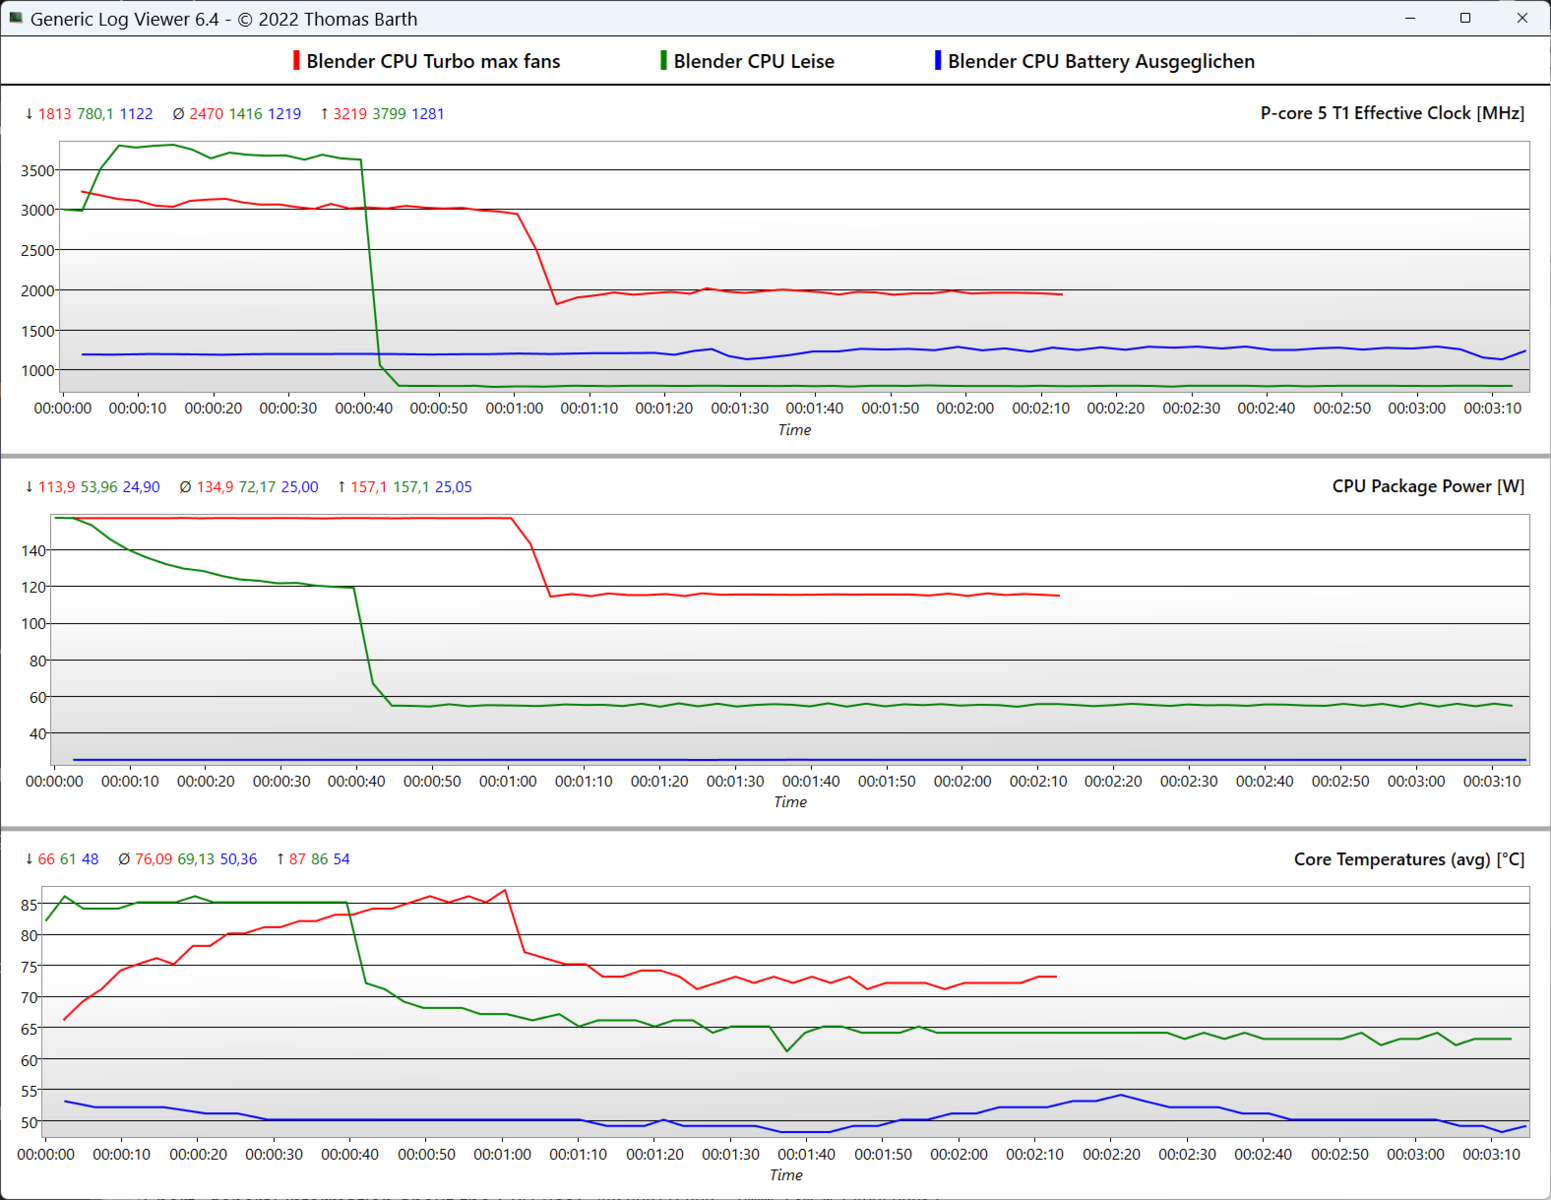
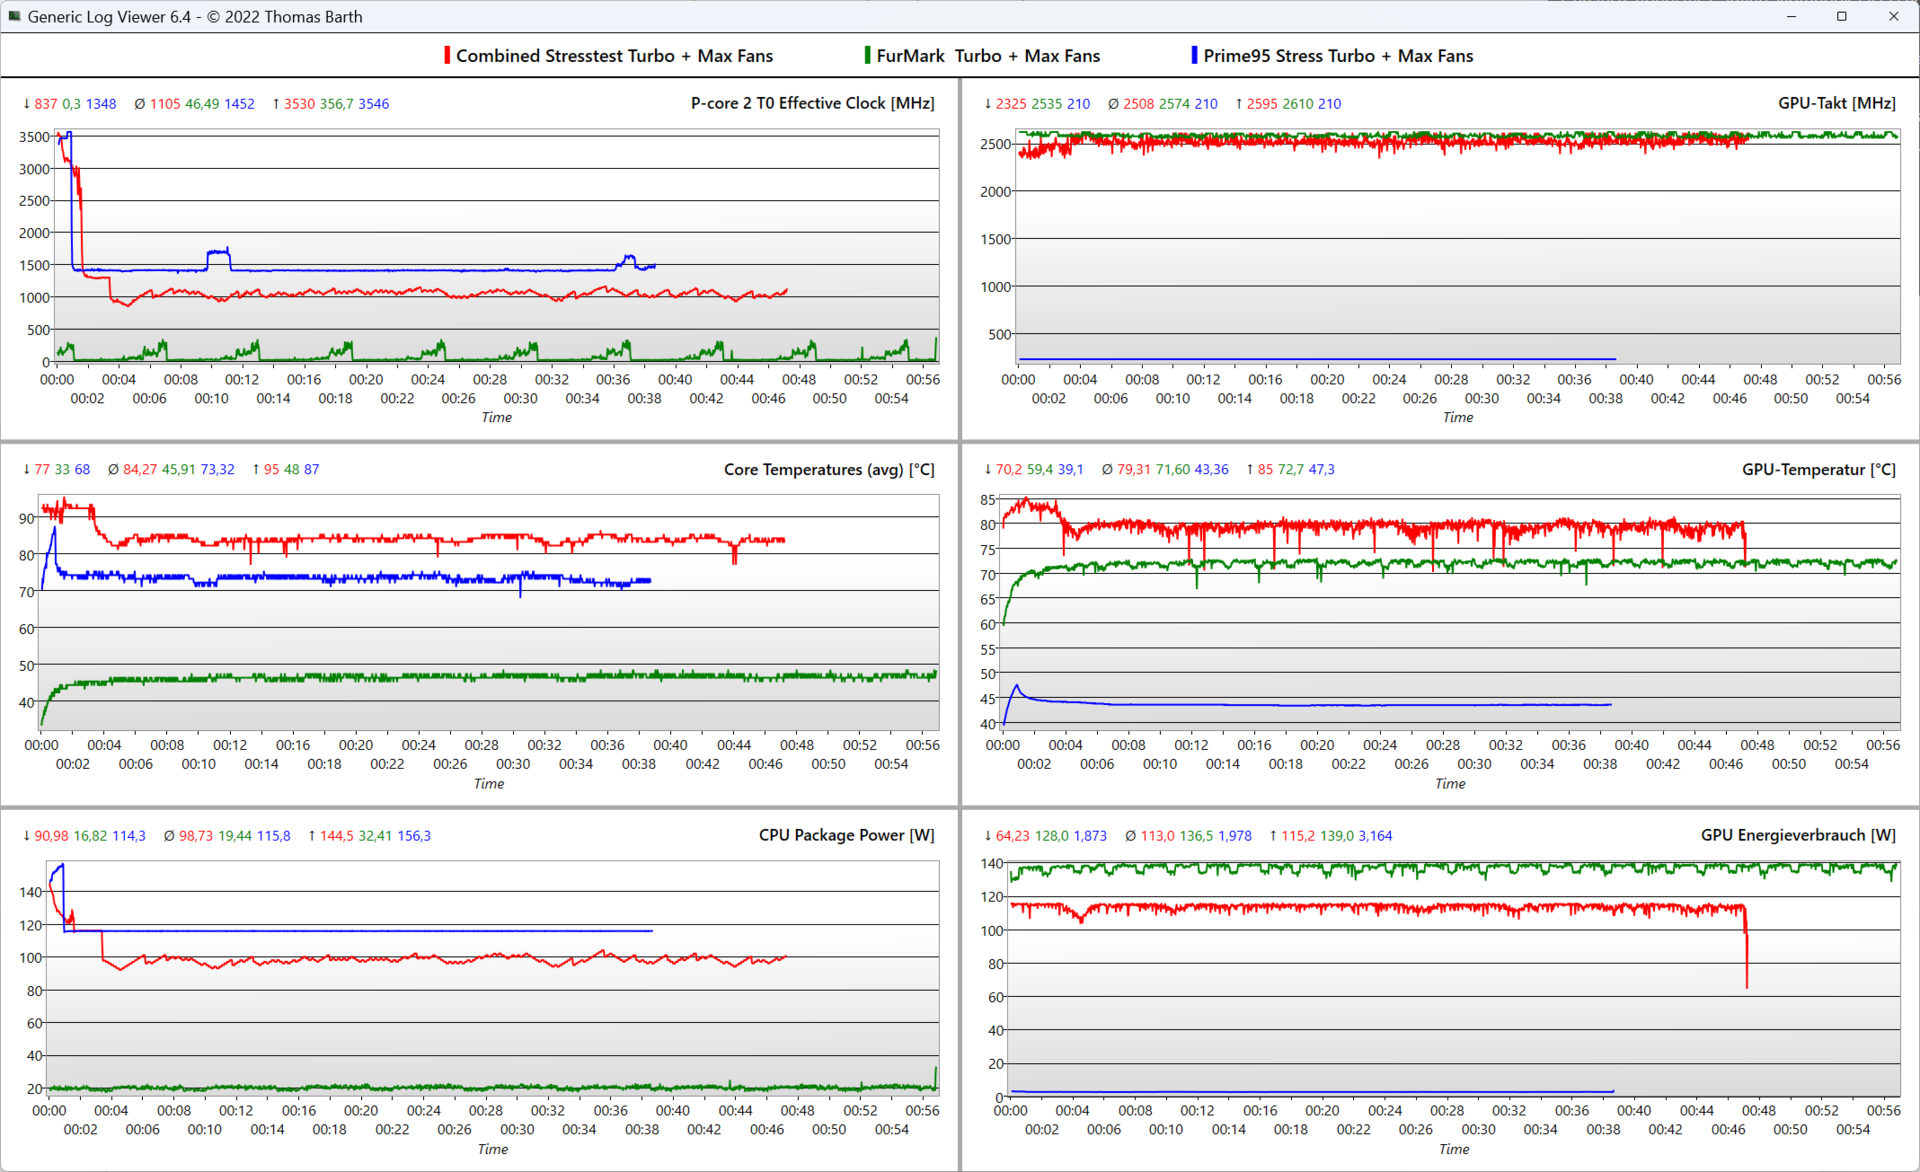
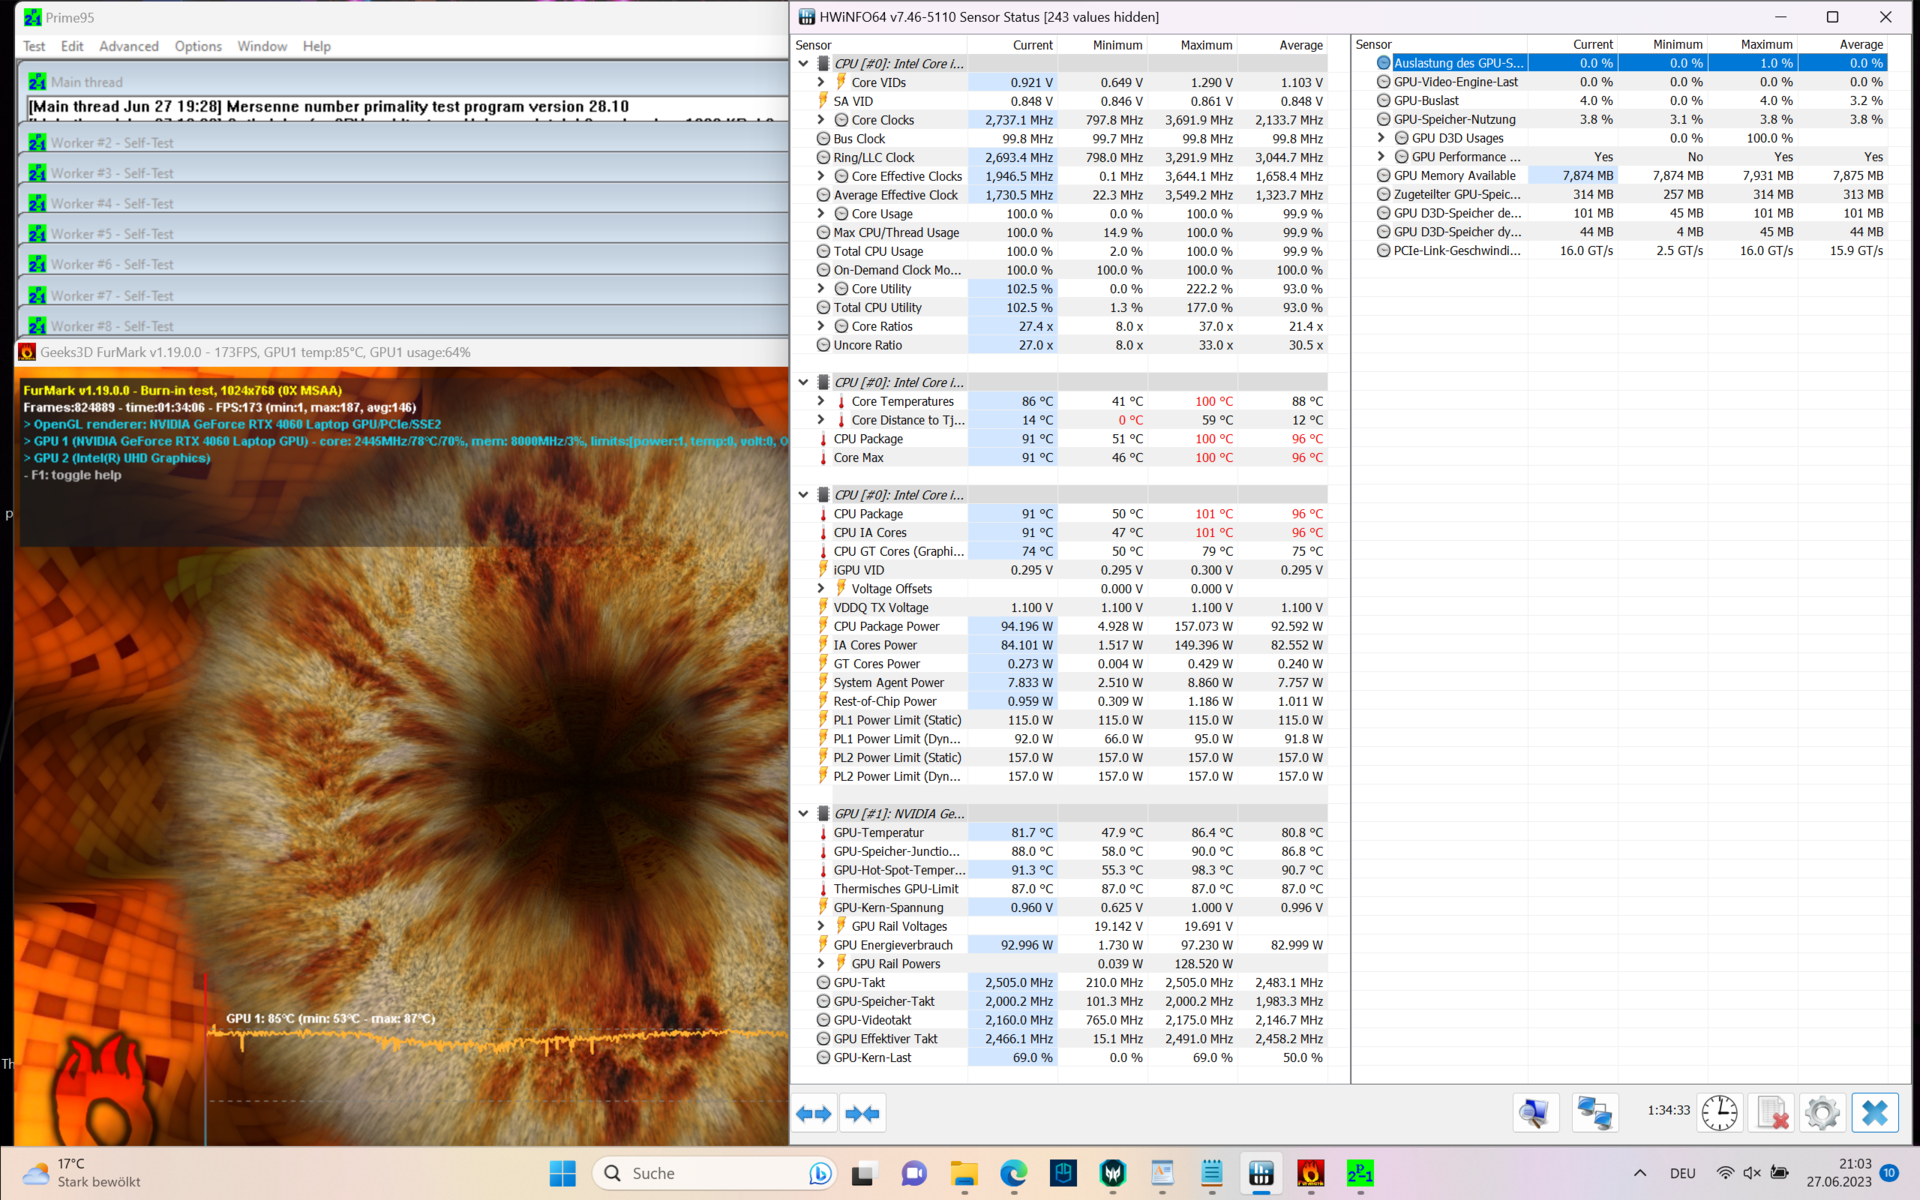
In the stress test (FurMark + Prime95), after one minute, the P-cores clock rate dropped from 3.6 GHz to only 0.85 GHz, significantly below the base clock rate of 2.1 GHz. On activating the turbo mode and "max fans", the clock rate only dropped after 3 minutes (to ~1.1 GHz). The CPU heats up to 86 °C (and 83 °C, respectively) and continuously draws 100 watts.
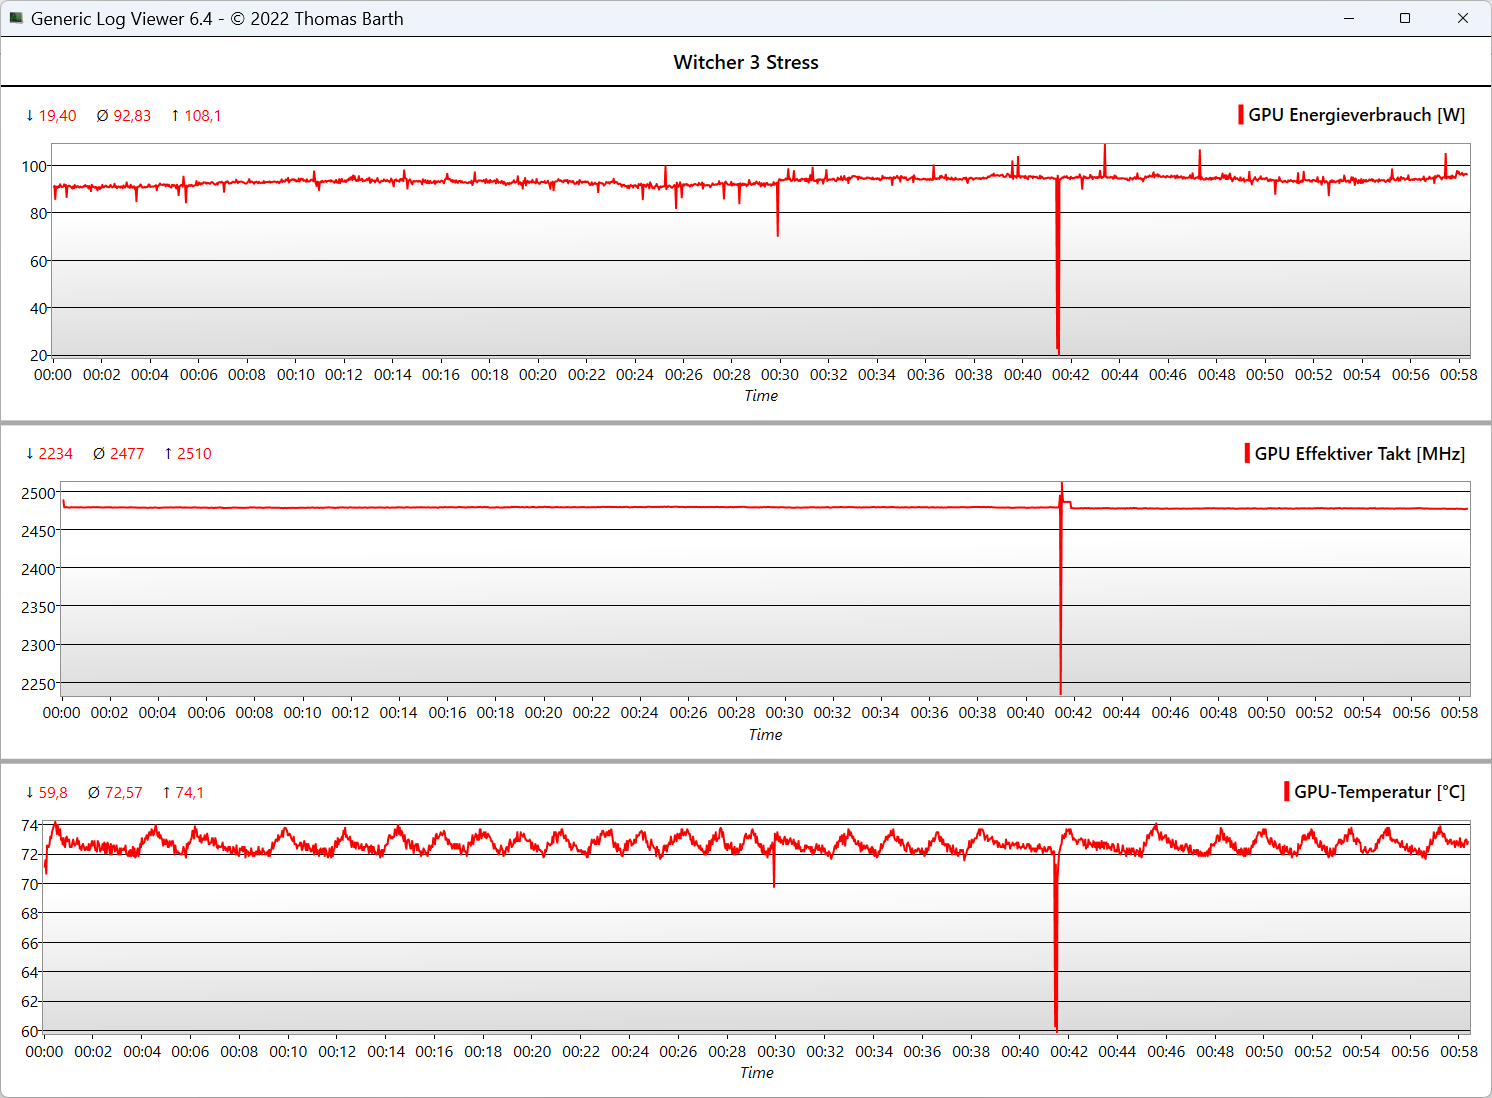
The GPU more or less maintains its clock speed at 2,500 to 2,600 MHz, doesn't get too warm (81 °C) and draws 115 watts. In the Witcher 3 stress test and in nearly all games, the RTX 4060 only requires 100 watts to reach its maximum clock speed. However, in models with an RTX 4080 that ought to look different.
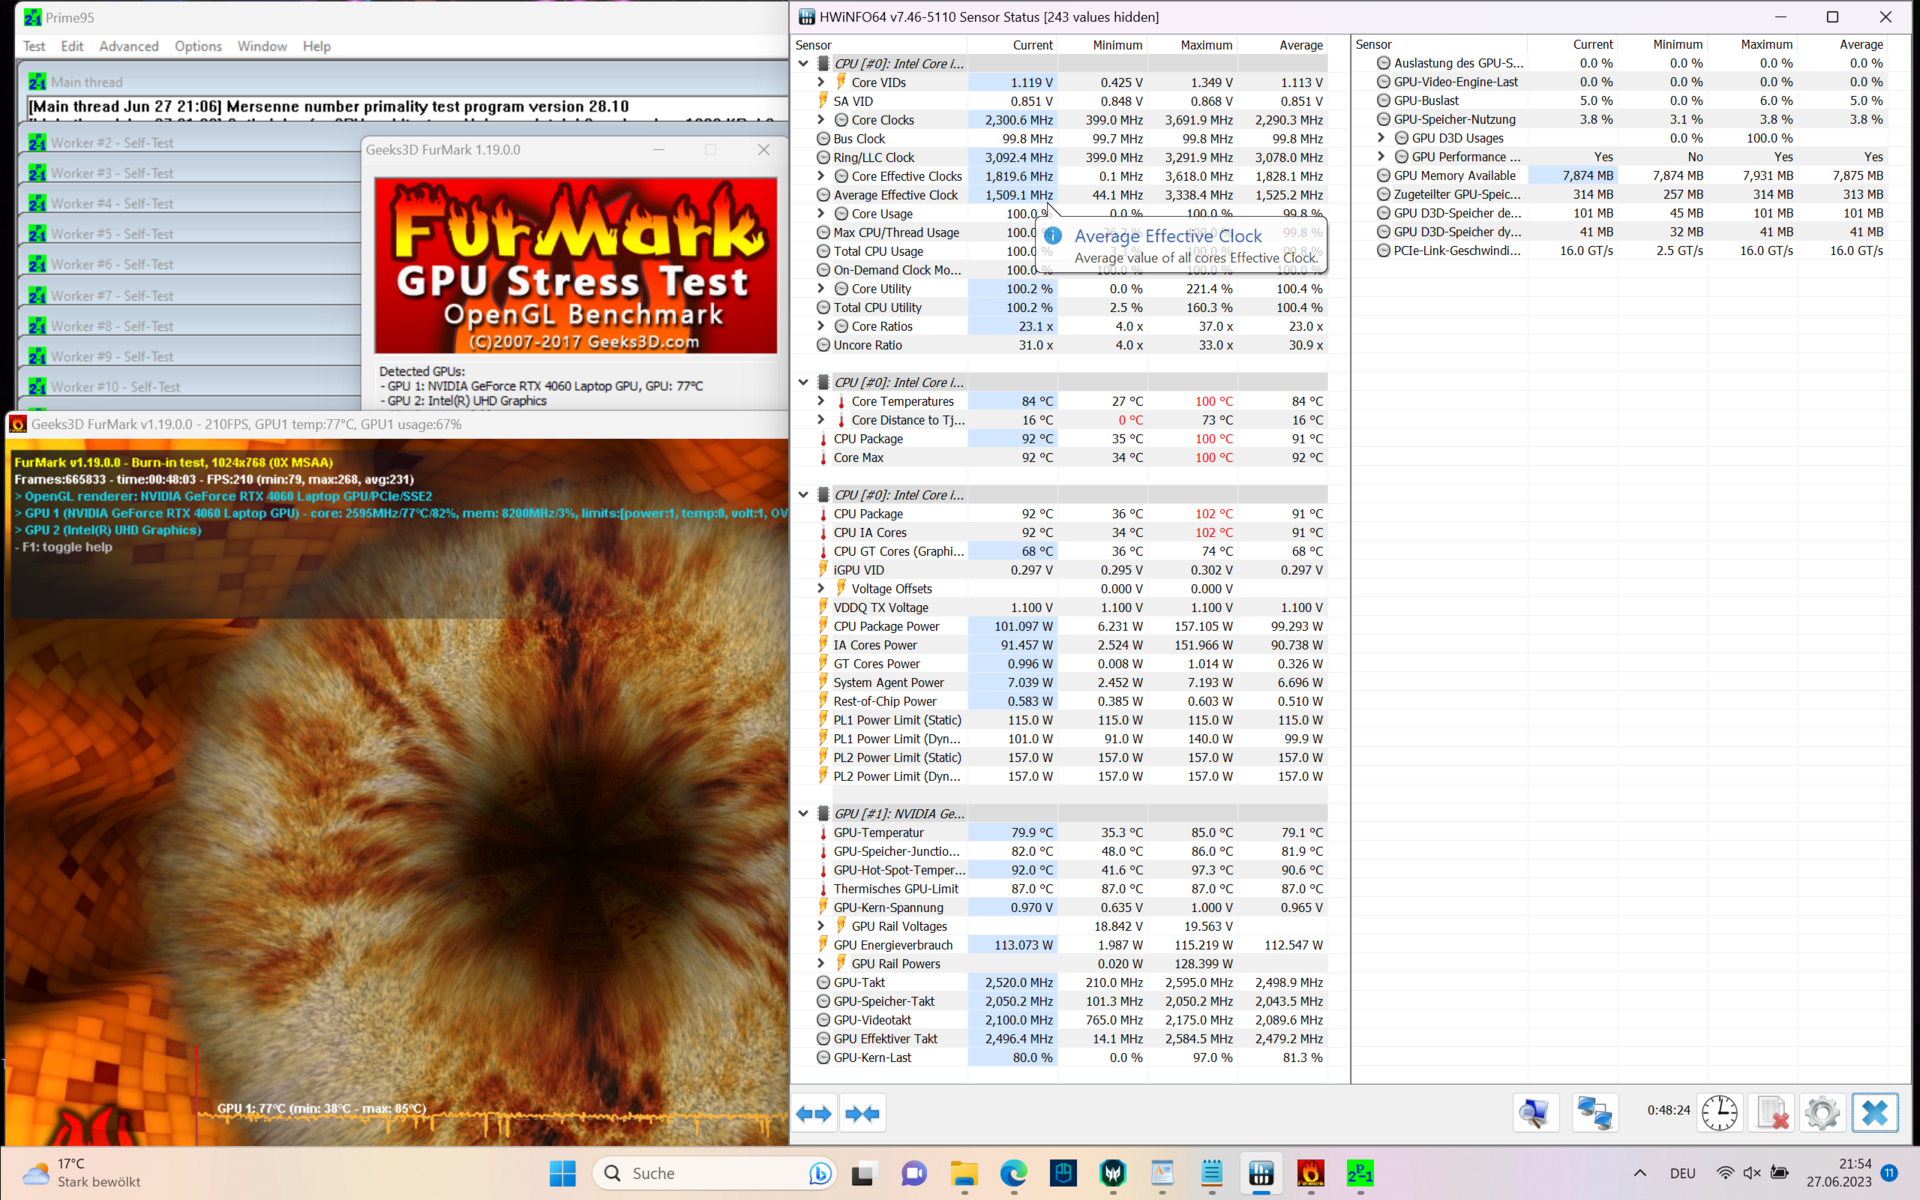
In the pure GPU stress test (FurMark), the GPU continued to almost reach the maximum clock speed of around 2,430 MHz, drawing 129 watts and heating up to 76 °C. In turbo mode + max fans, up to 2,625 MHz is reached (slight overclocking), drawing 136 watts (a peak of 139 watts), while the GPU remains relatively cool at 71.5 °C.
Even during the pure CPU stress, after one minute, the P-cores only clock in at 0.92 GHz as it is limited to 100 watts, although the CPU only reaches 70 °C. The cooling system could clearly manage more. If turbo mode + max fans are activated, it is still 1.45 GHz at 115 watts and 73 °C. The ability to select the PL limits would have been sensible, especially when choosing an SKU with a Core i9-13900HX.
| @Performance Mode | P-Cores / E-Cores Clock (GHz) | GPU Clock (MHz) | Average CPU Temperature (°C) | Average GPU Temperature (°C) |
| System Idle | 0.07 / 0.07 | - | 33 | 37 |
| Prime95 Stress | 0.95 / 3.5 | 10 | 71 | 49 |
| Prime95 + FurMark | 0.85 / 3.4 | 2,500 | 86 | 81 |
| FurMark Stress | 0.55 / 0.02 | 2,450 | 54 | 76 |
| Witcher 3 Stress | 1.6 / 0.02 | 2,475 | 61 | 73 |
Speakers
The downward-firing 2-watt stereo speakers produce balanced mids and highs but the bass is almost completely absent, while the maximum volume of 76.1 dB(A) is rather average. The gaming laptops in our comparison field don't do any better.
As an alternative, either the Asus ROG Strix G16 or Lenovo's Legion Pro 7 offer better sound or you could use a headset or sound system via the audio jack or Bluetooth.
Acer Predator Helios 16 PH16-71-731Q audio analysis
(±) | speaker loudness is average but good (76.12 dB)
Bass 100 - 315 Hz
(-) | nearly no bass - on average 15% lower than median
(-) | bass is not linear (15% delta to prev. frequency)
Mids 400 - 2000 Hz
(+) | balanced mids - only 2.5% away from median
(+) | mids are linear (5.9% delta to prev. frequency)
Highs 2 - 16 kHz
(+) | balanced highs - only 2.9% away from median
(±) | linearity of highs is average (8.4% delta to prev. frequency)
Overall 100 - 16.000 Hz
(+) | overall sound is linear (13.6% difference to median)
Compared to same class
» 20% of all tested devices in this class were better, 7% similar, 73% worse
» The best had a delta of 6%, average was 18%, worst was 132%
Compared to all devices tested
» 15% of all tested devices were better, 4% similar, 82% worse
» The best had a delta of 4%, average was 24%, worst was 134%
Lenovo Legion Pro 5 16IRX8 audio analysis
(±) | speaker loudness is average but good (72.7 dB)
Bass 100 - 315 Hz
(-) | nearly no bass - on average 23.7% lower than median
(±) | linearity of bass is average (10.7% delta to prev. frequency)
Mids 400 - 2000 Hz
(+) | balanced mids - only 3.8% away from median
(±) | linearity of mids is average (7.1% delta to prev. frequency)
Highs 2 - 16 kHz
(+) | balanced highs - only 3.7% away from median
(+) | highs are linear (6.7% delta to prev. frequency)
Overall 100 - 16.000 Hz
(±) | linearity of overall sound is average (21.9% difference to median)
Compared to same class
» 79% of all tested devices in this class were better, 6% similar, 16% worse
» The best had a delta of 6%, average was 18%, worst was 132%
Compared to all devices tested
» 63% of all tested devices were better, 7% similar, 31% worse
» The best had a delta of 4%, average was 24%, worst was 134%
Energy management: High idle consumption, shorter battery life
Power consumption
At 20 watts, the idle power consumption is very high, even for an Intel HX system while the AMD HS systems deliver the best results among Acer's competitors.
175 watts when gaming is relatively low, however, nearly all of the RTX 4060 laptops record this value since the GPU reaches its maximum clock speed at 100 watts. 240 watts to 276 watts are only reached in the all-day long (and not typical) stress test with this being easily absorbed by the 330-watt PSU.
| Off / Standby | |
| Idle | |
| Load |
|
Key:
min: | |
| Acer Predator Helios 16 PH16-71-731Q i7-13700HX, GeForce RTX 4060 Laptop GPU, Micron 3400 1TB MTFDKBA1T0TFH, IPS-LED, 2560x1600, 16" | Acer Nitro 16 AN16-41 R7 7735HS, GeForce RTX 4070 Laptop GPU, Samsung PM9A1 MZVL21T0HCLR, IPS, 2560x1600, 16" | Lenovo Legion Pro 5 16IRX8 i7-13700HX, GeForce RTX 4060 Laptop GPU, SK hynix PC801 HFS512GEJ9X115N, IPS, 2560x1600, 16" | Aorus 15X ASF i7-13700HX, GeForce RTX 4070 Laptop GPU, Gigabyte AG470S1TB-SI B10, IPS, 2560x1440, 15.6" | Asus TUF Gaming A16 FA617 R7 7735HS, Radeon RX 7600S, Micron 2400 MTFDKBA1T0QFM, IPS-Level, 1920x1200, 16" | Dell G15 5530 i7-13650HX, GeForce RTX 4060 Laptop GPU, SSTC CL4-3D512-Q11, IPS, 1920x1080, 15.6" | Average NVIDIA GeForce RTX 4060 Laptop GPU | Average of class Gaming | |
|---|---|---|---|---|---|---|---|---|
| Power Consumption | 11% | -24% | 6% | 29% | 18% | 18% | 2% | |
| Idle Minimum * (Watt) | 15.9 | 11.6 27% | 24.5 -54% | 11 31% | 8 50% | 8.4 47% | 11.5 ? 28% | 13.3 ? 16% |
| Idle Average * (Watt) | 20.5 | 15.6 24% | 29.2 -42% | 16 22% | 11 46% | 14.98 27% | 16 ? 22% | 19 ? 7% |
| Idle Maximum * (Watt) | 20.9 | 16.5 21% | 34.3 -64% | 24 -15% | 16 23% | 15.56 26% | 20.3 ? 3% | 24.5 ? -17% |
| Load Average * (Watt) | 106 | 155 -46% | 98.7 7% | 104 2% | 97 8% | 96.8 9% | 92.9 ? 12% | 108.1 ? -2% |
| Witcher 3 ultra * (Watt) | 175 | 154.8 12% | 178.6 -2% | 185.4 -6% | 161.5 8% | 186 -6% | ||
| Load Maximum * (Watt) | 276 | 205 26% | 249.6 10% | 272 1% | 168 39% | 271.42 2% | 210 ? 24% | 254 ? 8% |
* ... smaller is better
Power consumption Witcher 3 / stress test
Power consumption with an external monitor
Battery life
With a brightness of 150 cd/m² while surfing the internet, and a variable refresh rate from 120 to 240 Hz, the Helios 16's battery life measures a little over 5.5 hours and is roughly the average for gaming laptops. The AMD systems, the Acer Nitro 16 and Asus TUF Gaming A16 have much longer staying power at 9 and 12 hours, respectively. At only 3.5 hours, the Legion Pro 5 16 brings up the rear.
After half an hour, the battery is once more charged to 50 % with 100 % taking around 1 hour 15 minutes. It's also possible to charge the laptop via USB-C, however, this is slower.
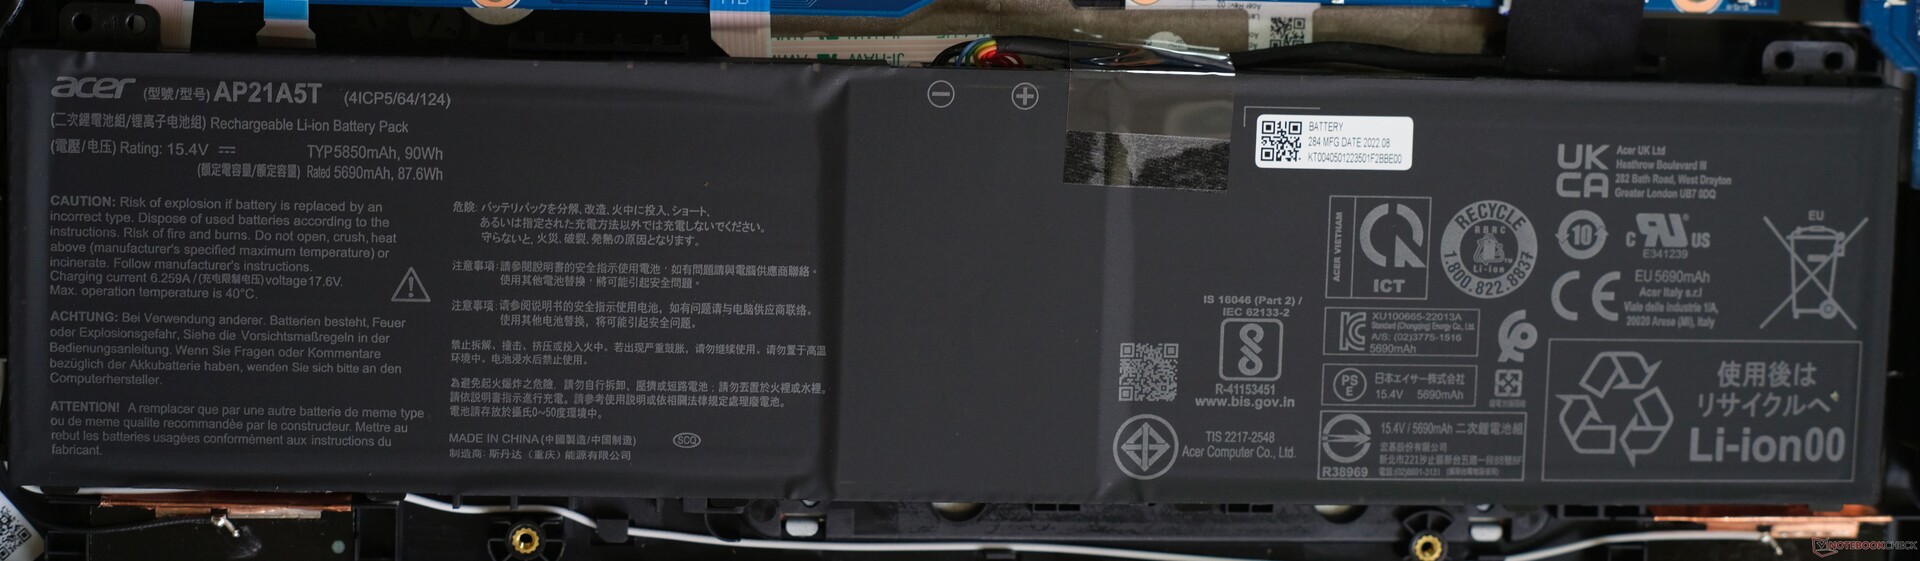
| Acer Predator Helios 16 PH16-71-731Q i7-13700HX, GeForce RTX 4060 Laptop GPU, 90 Wh | Acer Nitro 16 AN16-41 R7 7735HS, GeForce RTX 4070 Laptop GPU, 90 Wh | Lenovo Legion Pro 5 16IRX8 i7-13700HX, GeForce RTX 4060 Laptop GPU, 80 Wh | Aorus 15X ASF i7-13700HX, GeForce RTX 4070 Laptop GPU, 99 Wh | Asus TUF Gaming A16 FA617 R7 7735HS, Radeon RX 7600S, 90 Wh | Dell G15 5530 i7-13650HX, GeForce RTX 4060 Laptop GPU, 86 Wh | Average of class Gaming | |
|---|---|---|---|---|---|---|---|
| Battery runtime | 65% | -46% | 48% | 58% | -9% | 32% | |
| H.264 (h) | 4.8 | 10.2 113% | 7.9 65% | 6.8 42% | 8.26 ? 72% | ||
| WiFi v1.3 (h) | 5.6 | 9 61% | 3.4 -39% | 8.2 46% | 12.1 116% | 6.5 16% | 7.01 ? 25% |
| Witcher 3 ultra (h) | 1.5 | 0.8 -47% | |||||
| Load (h) | 1.5 | 1.8 20% | 0.7 -53% | 2 33% | 1.5 0% | 0.8 -47% | 1.47 ? -2% |
| Reader / Idle (h) | 12.2 | 6.7 | 11.3 | 20.2 | 8.71 ? |
Pros
Cons
Verdict: The solid RTX 4060 gaming laptop can also be quiet
The Acer Predator Helios 16 gaming laptop has many strengths but also some smaller trade-offs. We were positively surprised by the fast, vivid-color, 240 Hz QHD display with 97 % DCI P3 and Dolby Vision meaning nothing stands in the way of doing creative work.
Paired with the power of the Intel HX CPU and a similarly very powerful RTX 4060, you get a mid-range gaming laptop with many high-end elements.
We were also impressed by the metal case despite the keyboard deck flexing a little. The keys themselves could do with more feedback, but, conversely, we liked the particularly vivid-color and energy-saving mini-LED key lighting. Nevertheless, the battery life is mediocre and will probably be even shorter when using the optionally available mini-LED display - especially when combined with the most powerful SKU (Core i9-13900HX + RTX 4080).
High-level performance, a vivid 240 Hz QHD display and peace and quiet when gaming all sound like the ideal recipe for a gaming laptop and creative workstation. However, we have to accept some trade-offs.
The powerful cooling system helps keep the internal temperatures low, ensuring quiet and stable performance, particularly in either the balanced or quiet modes. What we missed was the individually customizable Power Limits in order to push the cooling system to its limits. The temperature-related SSD throttling appears to be a blemish on an otherwise positive overall picture with a seemingly excessive 25-watt CPU limitation in battery mode.
With its review variant SKU, the laptop currently costs around $1,700 but it is occasionally also possible to purchase a cheaper model for around $1,450 with a slightly less colorful 165 Hz display. However, it is often possible to find its main competitor, the Lenovo Legion Pro 5 16 for around $1,400 with the device offering nearly the same benefits. Differences can only be seen in the details such as the absence of Advanced Optimus, a better keyboard and a 165 Hz QHD display lacking DCI P3 coverage.
Additionally, the Asus ROG Strix G16 is an interesting option, comes with an RTX 4060 and also costs around $1,800. This investment will also get you better speakers, longer battery life, a keyboard with more pronounced feedback and faster display response times.
Price and availability
The Acer Predator Helios 16 with the model number PH16-71-74UU (Core i7-13700HX, RTX 4060 and a 165 Hz display) currently costs $1,650 on Amazon. The mini-LED model, combined with a Core i9-13900HX and the RTX 4080, is currently out of stock.
Acer Predator Helios 16 PH16-71-731Q
- 07/05/2023 v7 (old)
Marvin Gollor
Transparency
The selection of devices to be reviewed is made by our editorial team. The test sample was provided to the author as a loan by the manufacturer or retailer for the purpose of this review. The lender had no influence on this review, nor did the manufacturer receive a copy of this review before publication. There was no obligation to publish this review. As an independent media company, Notebookcheck is not subjected to the authority of manufacturers, retailers or publishers.
This is how Notebookcheck is testing
Every year, Notebookcheck independently reviews hundreds of laptops and smartphones using standardized procedures to ensure that all results are comparable. We have continuously developed our test methods for around 20 years and set industry standards in the process. In our test labs, high-quality measuring equipment is utilized by experienced technicians and editors. These tests involve a multi-stage validation process. Our complex rating system is based on hundreds of well-founded measurements and benchmarks, which maintains objectivity. Further information on our test methods can be found here.
Price comparison

