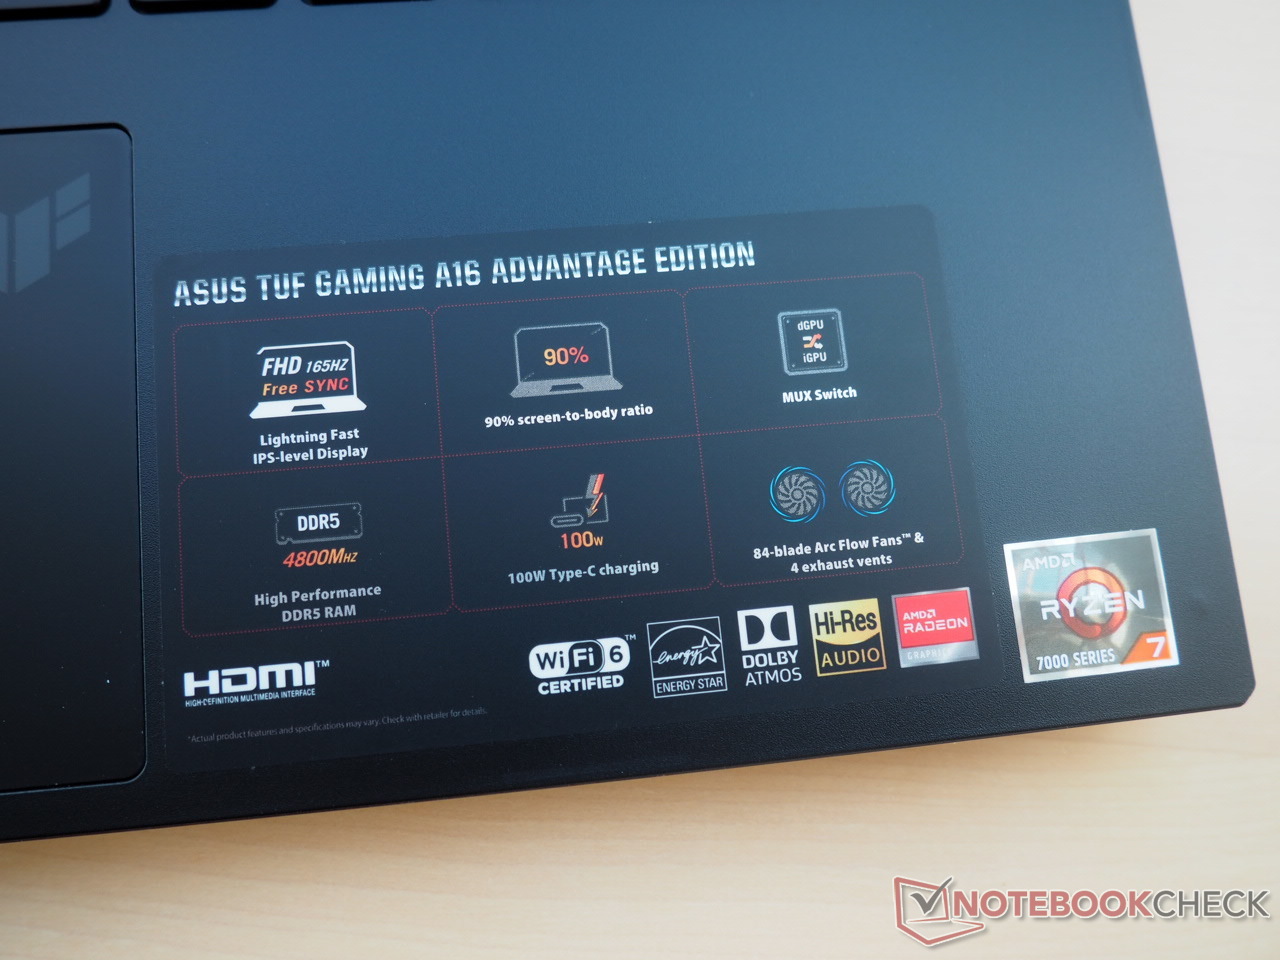
Asus TUF Gaming A16 Advantage Edition in review: AMD notebook under the auspices of the 7

Unsurprisingly, the brand new TUF Gaming A16 will be available in several variants. Depending on the model, a Ryzen 7 7735HS or a Ryzen 9 7940HS serves as the CPU, while either a Radeon RX 7600S or a Radeon RX 7700S is used as the graphics card. As in the past, the S denotes moderate power consumption. The 16-inch display also lives on: either as a FHD+ panel (1920x1200) with 165 Hz and 100% sRGB coverage, or as a QHD+ panel (2560x1600) with 240 Hz and 100% DCI-P3 coverage. According to the Asus website, the DDR5 RAM ranges from 8 to 32 GB, the storage capacity from 512 GB to 2 TB.
Our review device is one of the cheaper versions and comes equipped with the Ryzen 7 7735HS, the Radeon RX 7600S, an FHD+ panel, 16 GB of RAM and a 1 TB SSD.
Competitors of the TUF Gaming A16 primarily include other mid-range notebooks with AMD hardware such as the Asus ROG Zephyrus G14 GA402RJ (R7 6800HS & RX 6700S) or the Lenovo Legion S7 16ARHA7 (R9 6900HX & RX 6800S). On the Nvidia side, devices with a GeForce RTX 3060 should be regarded as the main opponents. While the HP Envy 16 h0112nr has an identical maximum TGP of 95 watts, the Asus TUF Gaming F15 FX507ZM, for example, boasts a significantly higher TGP of 140 watts - at the expense of energy consumption, of course.
Possible Competitors in Comparison
Rating | Date | Model | Weight | Height | Size | Resolution | Price |
|---|---|---|---|---|---|---|---|
| 86.2 % v7 (old) | 02 / 2023 | Asus TUF Gaming A16 FA617 R7 7735HS, Radeon RX 7600S | 2.2 kg | 27 mm | 16.00" | 1920x1200 | |
| 86.9 % v7 (old) | 09 / 2022 | HP Envy 16 h0112nr i7-12700H, GeForce RTX 3060 Laptop GPU | 2.3 kg | 19.8 mm | 16.00" | 3840x2400 | |
| 87.2 % v7 (old) | 03 / 2022 | Asus TUF Gaming F15 FX507ZM i7-12700H, GeForce RTX 3060 Laptop GPU | 2.1 kg | 24.95 mm | 15.60" | 1920x1080 | |
| 86.4 % v7 (old) | 10 / 2022 | Asus ROG Zephyrus G14 GA402RJ R7 6800HS, Radeon RX 6700S | 1.7 kg | 19.5 mm | 14.00" | 2560x1600 | |
| 89.3 % v7 (old) | 11 / 2022 | Lenovo Legion S7 16ARHA7 R9 6900HX, Radeon RX 6800S | 2.2 kg | 16.9 mm | 16.00" | 2560x1600 |
Case
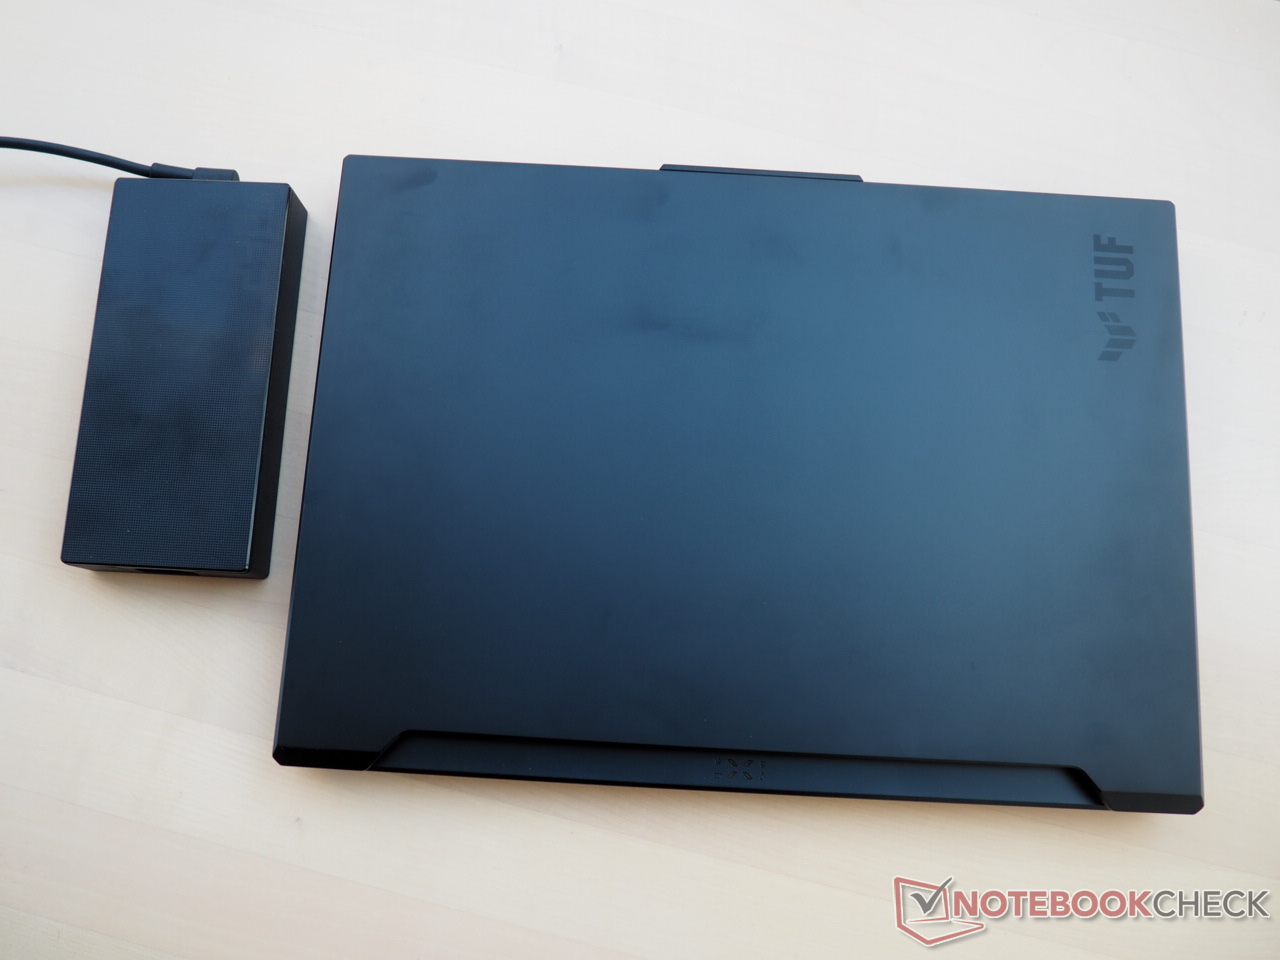
The case gets a good score. Asus has opted for a combination of plastic (base unit) and metal (cover) and a decent material strength/thickness. The chassis only yields noticeably under heavy pressure. Compared to other devices, the lid is also quite torsion-resistant, although fingerprints quickly collect on the metal cover.
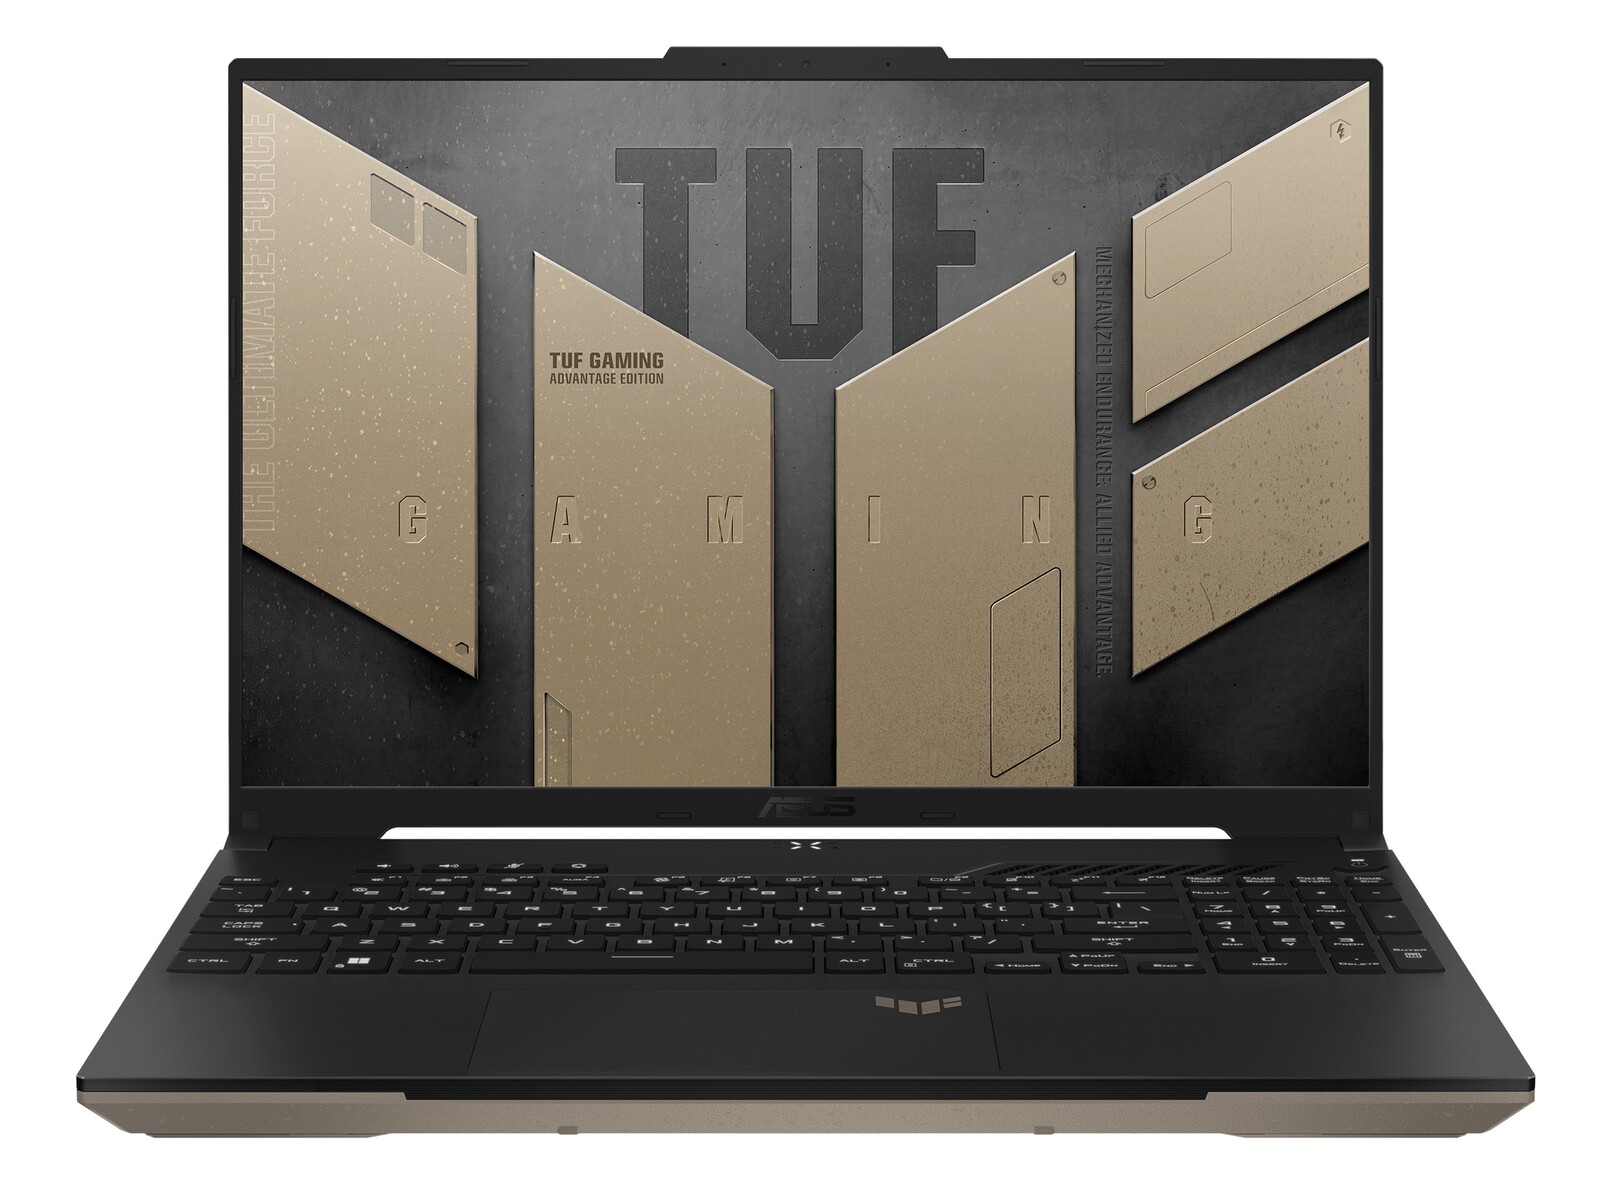
As for the design, Asus manages a successful compromise between subtle and playful. While the dark coloring is rather plain, the manufacturer has been quite creative with some details (power button, function lights, lid shape). The workmanship also leaves no room for criticism. In the case of our review sample, all design elements come together very cleanly.

The A16 is not necessarily one of the lightest and most compact gaming notebooks. At a weight of 2.2 kg, the 16-incher is limited in its suitability for frequent trips, but most competing devices have comparable values here. The height is also a similar story at a maximum of 2.7 cm.
Equipment
Connectivity
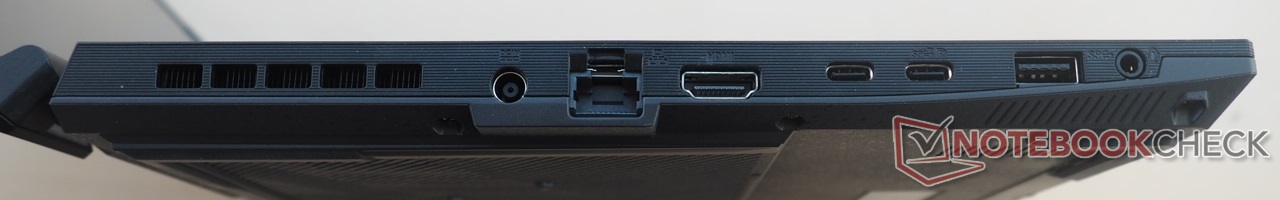
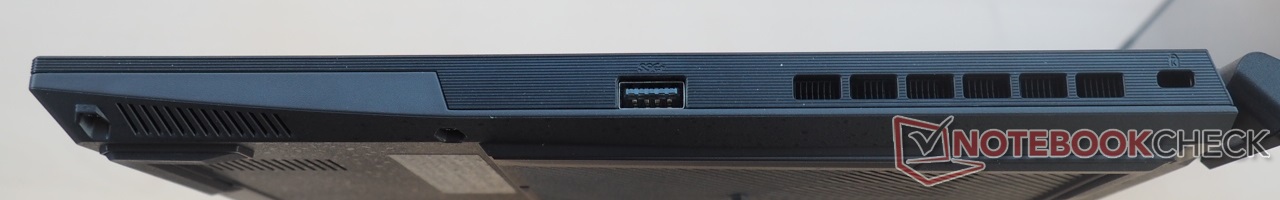
According to the Asus homepage, the range of ports varies depending on the model. For example, a USB 4 port is not on board as standard, but only installed in the better or more expensive variants. Our review device has to make do with two USB-A 3.2 Gen1 ports and two USB-C 3.2 Gen2 ports (with the latter supporting DisplayPort). A positive aspect: Power Delivery at up to 100 watts is possible on one of the Type-C ports. The A16 also has an HDMI 2.1 output, an RJ45 port, an audio jack and an opening for Kensington locks. Only a card reader is missing.
The distribution of the connections is designed more for right-handers. Due to the many ports placed on the left, using a mouse on the left side may result in limitations.
Communication
In terms of WLAN performance, the laptop lands in the midfield with send and receive rates of up to 900 MBit/s, which we measured from a distance of one meter to our new Asus Rapture GT-AXE11000 reference router. This is clearly surpassed by the Zephyrus G14 despite a similar MediaTek chip.
| Networking | |
| iperf3 receive AXE11000 | |
| Asus ROG Zephyrus G14 GA402RJ | |
| Average of class Gaming (680 - 1745, n=87, last 2 years) | |
| Asus TUF Gaming A16 FA617 | |
| Average MediaTek MT7921 (104.2 - 968, n=18) | |
| iperf3 transmit AXE11000 | |
| Average of class Gaming (560 - 1862, n=87, last 2 years) | |
| Asus TUF Gaming A16 FA617 | |
| Average MediaTek MT7921 (47.8 - 985, n=18) | |
| iperf3 receive AX12 | |
| Asus TUF Gaming F15 FX507ZM | |
| Average MediaTek MT7921 (90 - 972, n=16) | |
| iperf3 transmit AX12 | |
| Asus TUF Gaming F15 FX507ZM | |
| Average MediaTek MT7921 (548 - 985, n=16) | |
Webcam
The webcam also delivers mediocre performance. As in most notebooks, it lacks both image sharpness and color accuracy.


Accessories
The only accessories included with our review sample were a few information booklets. The 240-watt power supply unit weighs just over 500 g and measures approx. 16 x 7.5 x 2 cm, so it is neither small nor particularly bulky.
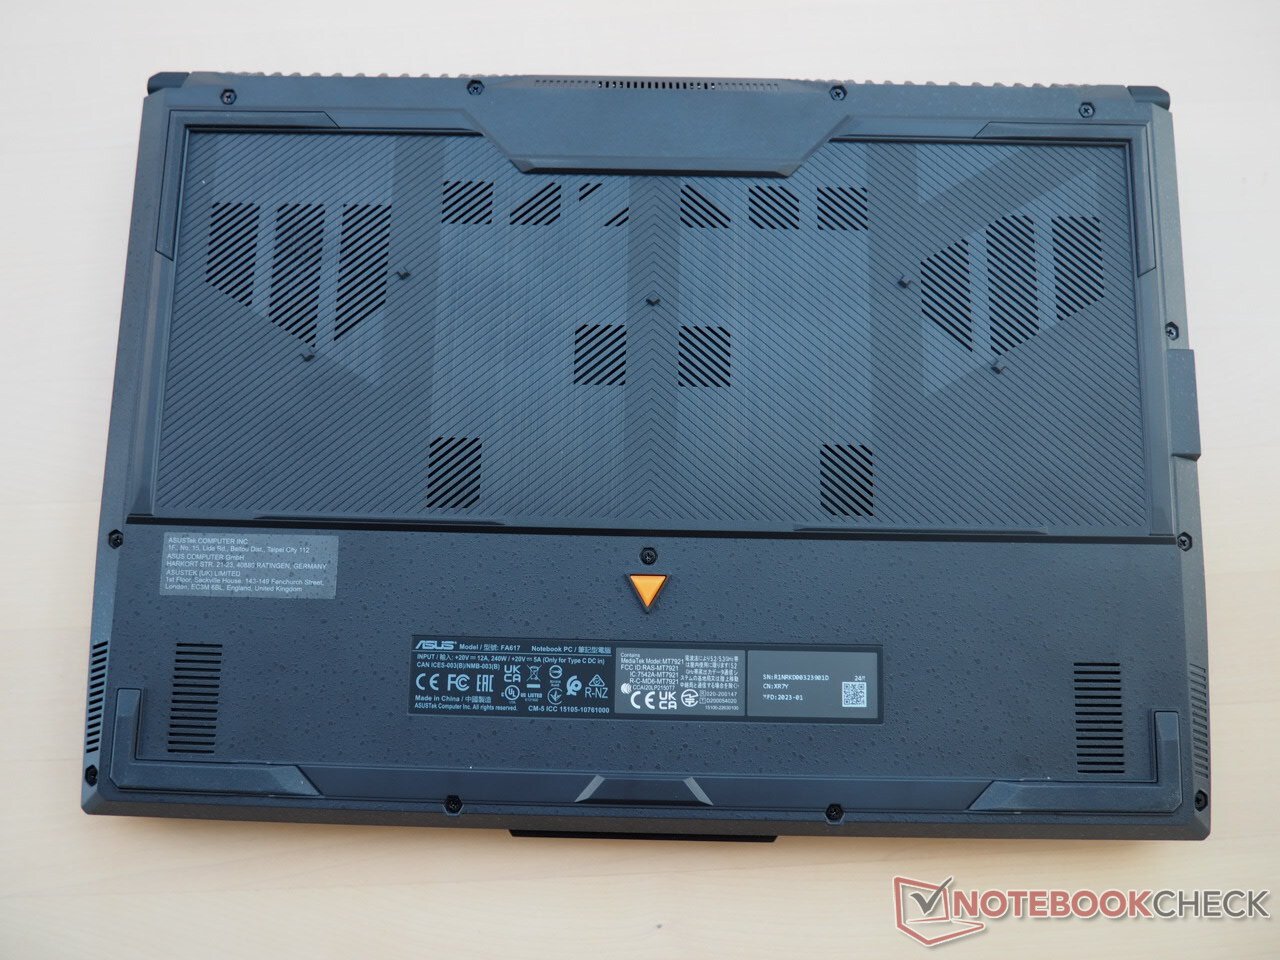
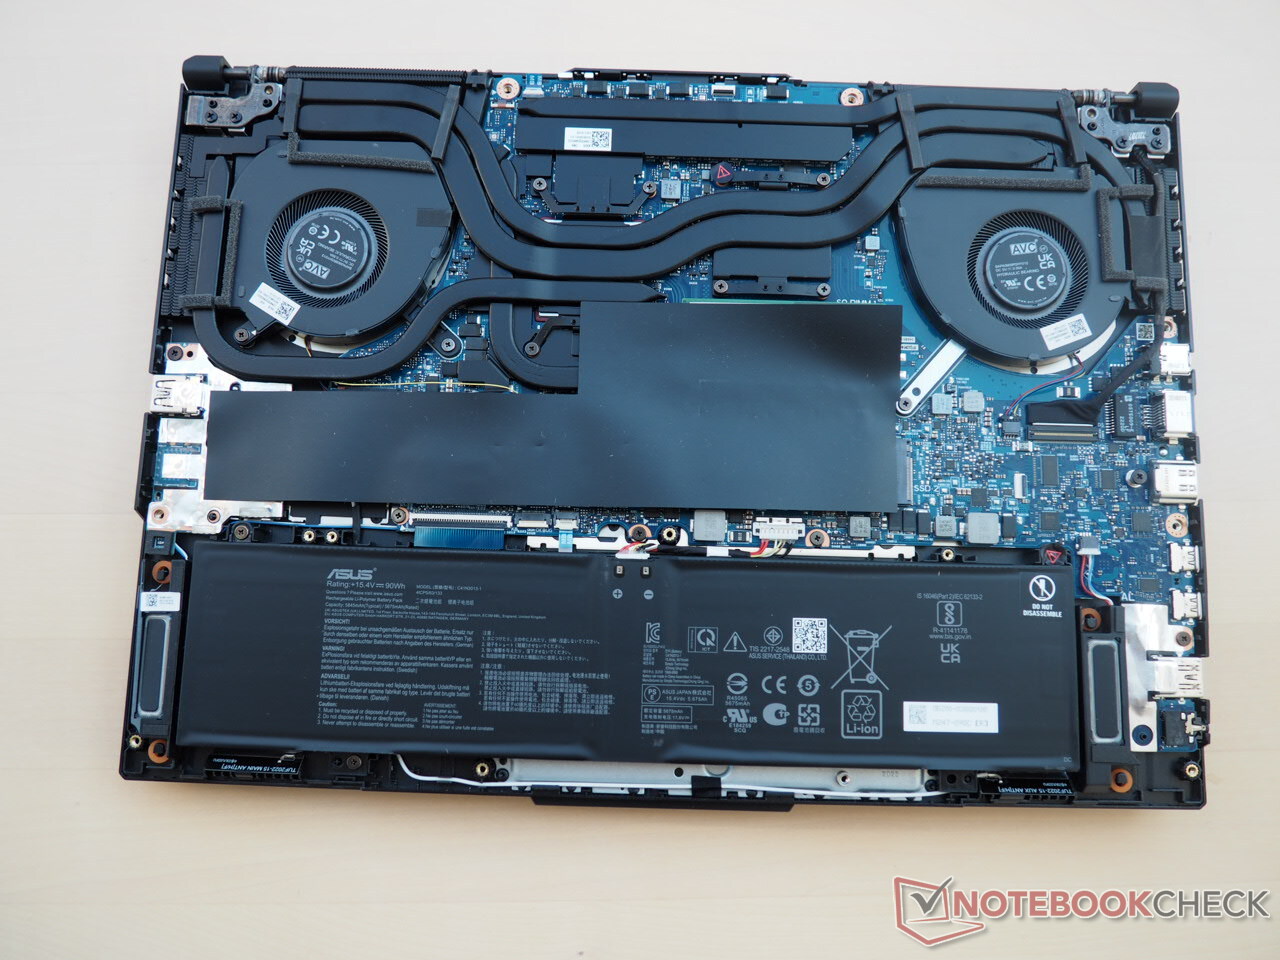
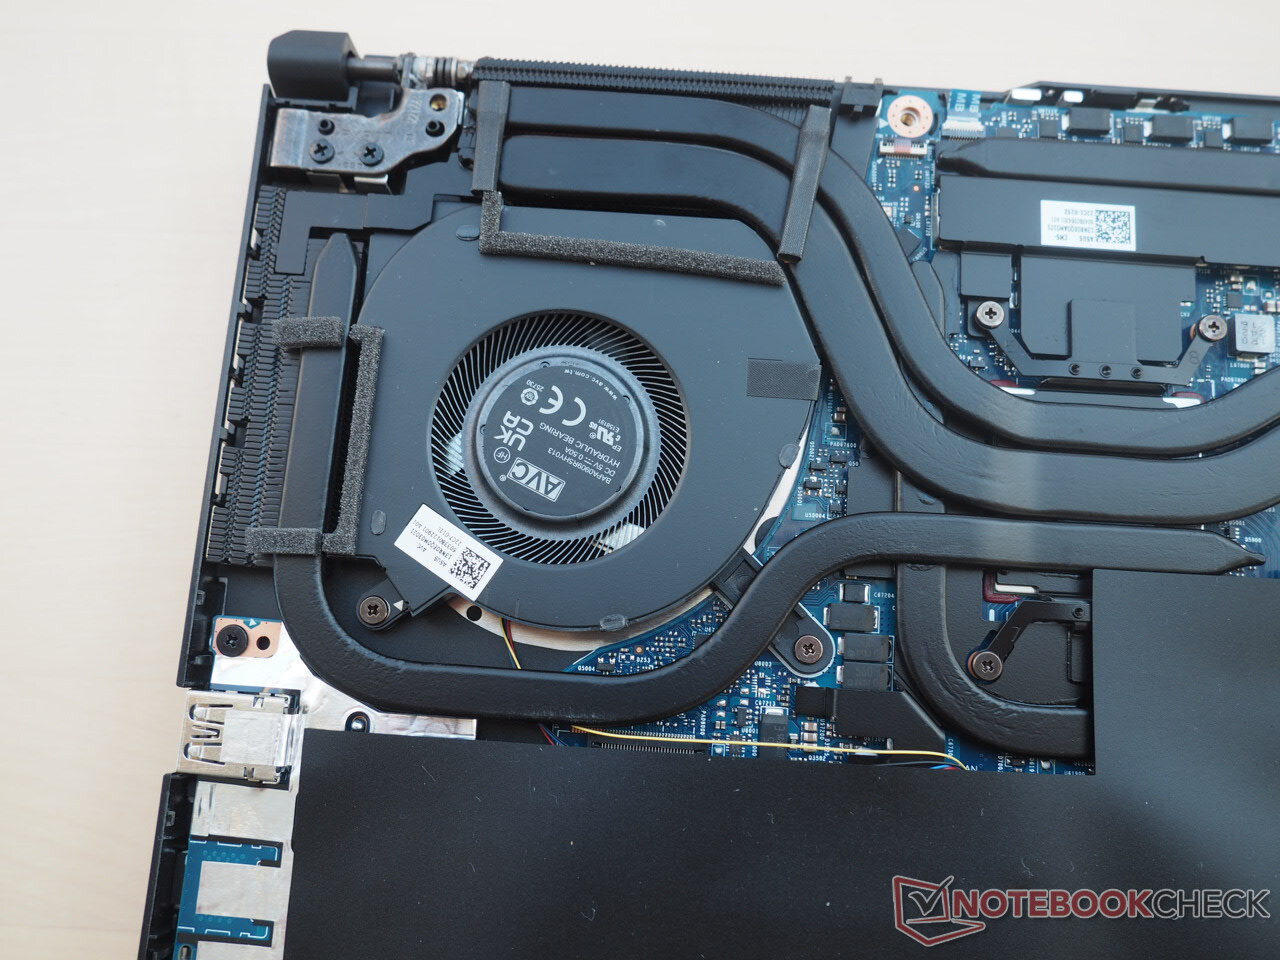
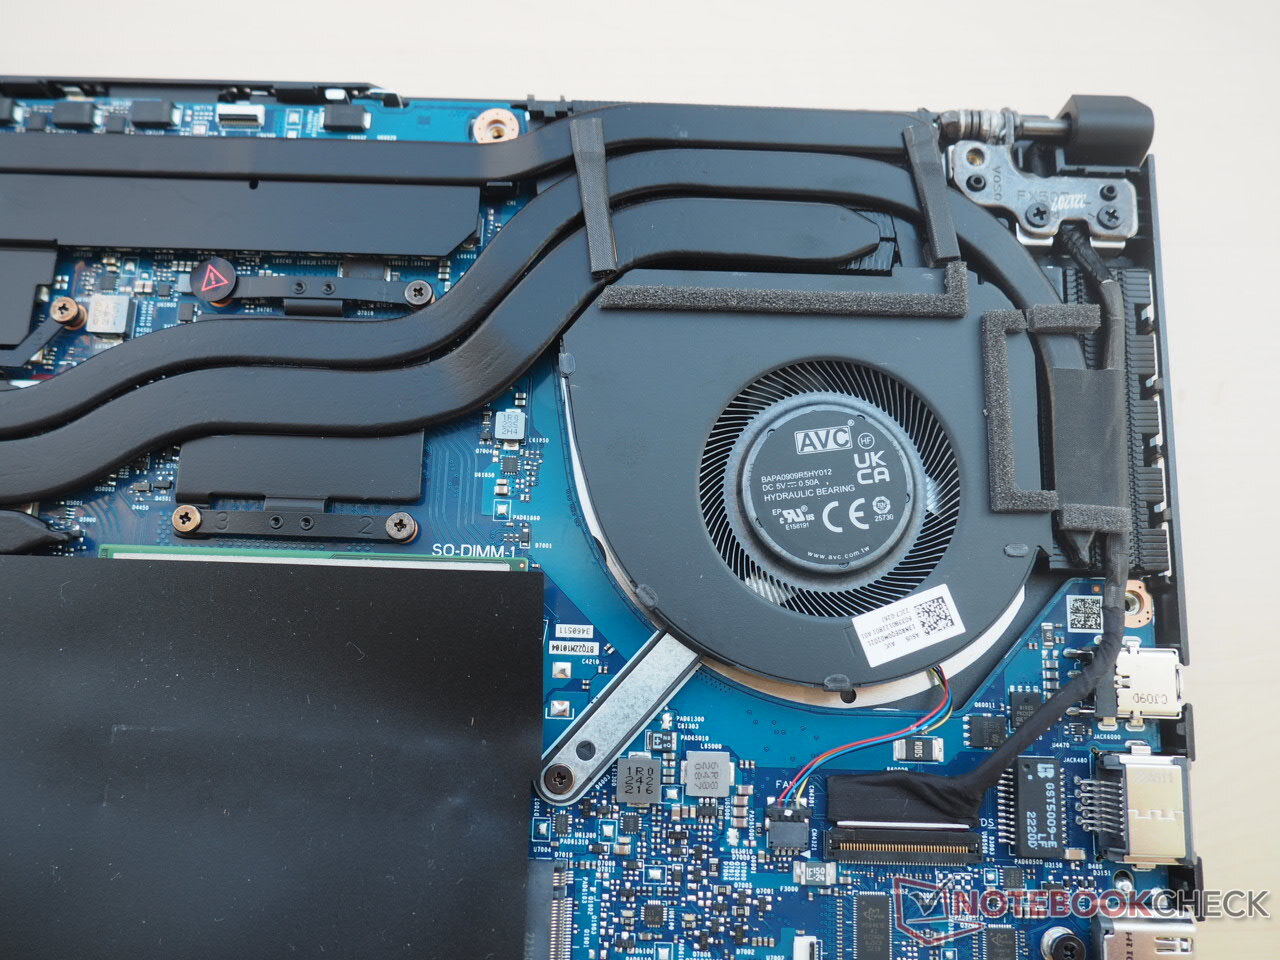
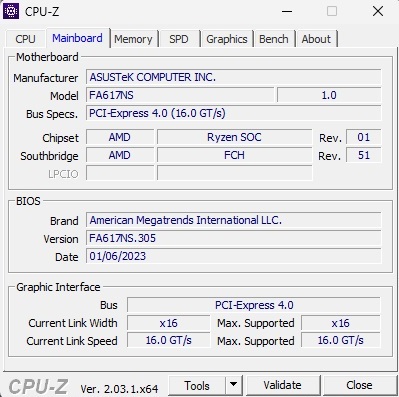
Maintenance
To access the internals of the TUF Gaming A16, a little more than 10 Phillips screws have to be removed from the underside. Then the entire base plate can be levered out of its anchorage with a good deal of effort. Almost all components can be seen, whereby the SSD and RAM modules are hidden behind a plastic film (see photos).
Warranty
In Germany, the warranty extends beyond 24 months. This may differ in other countries, so buyers should double-check with the seller before purchasing.
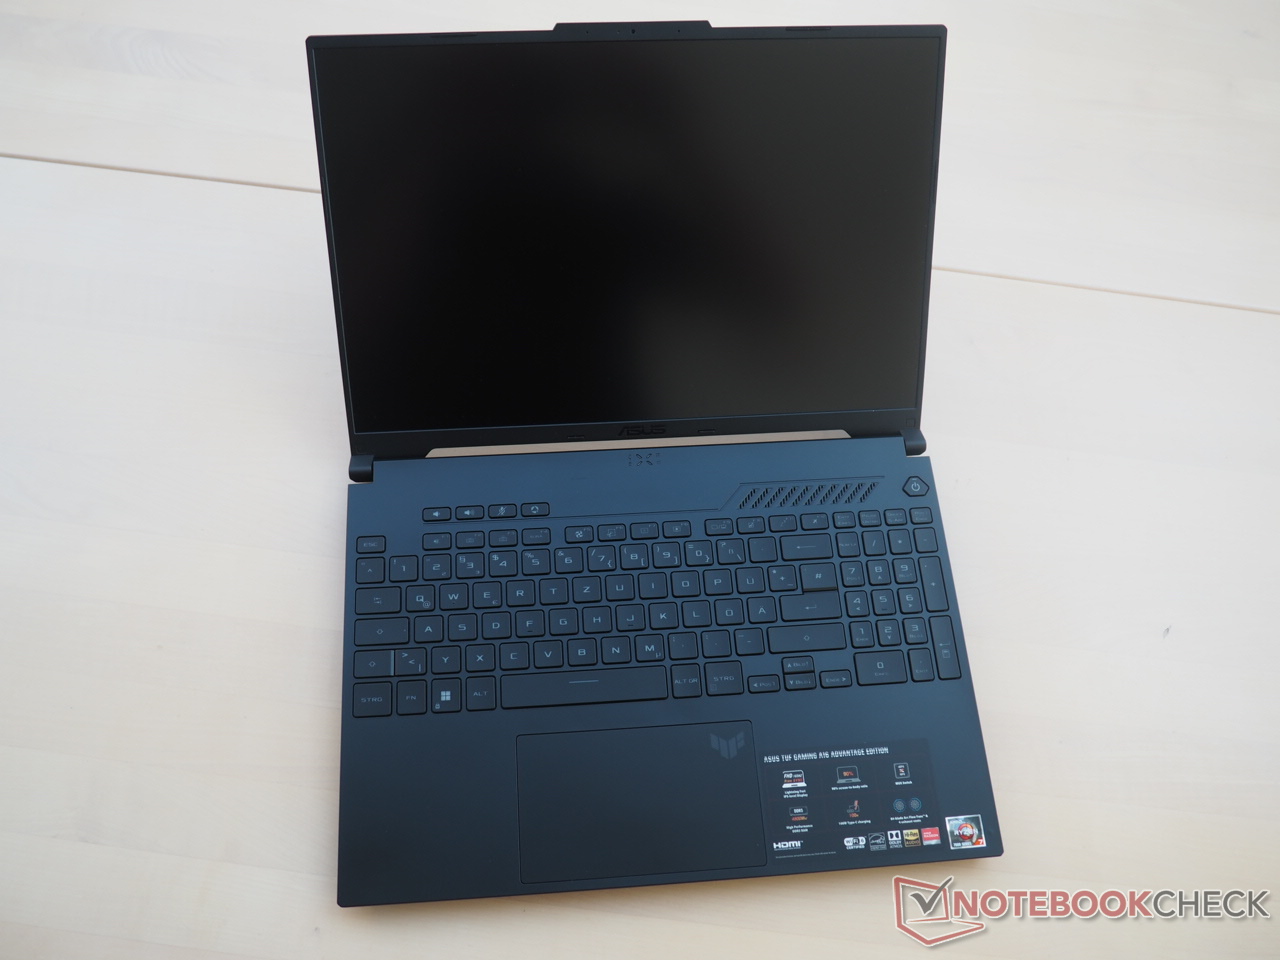
Input Devices
Keyboard
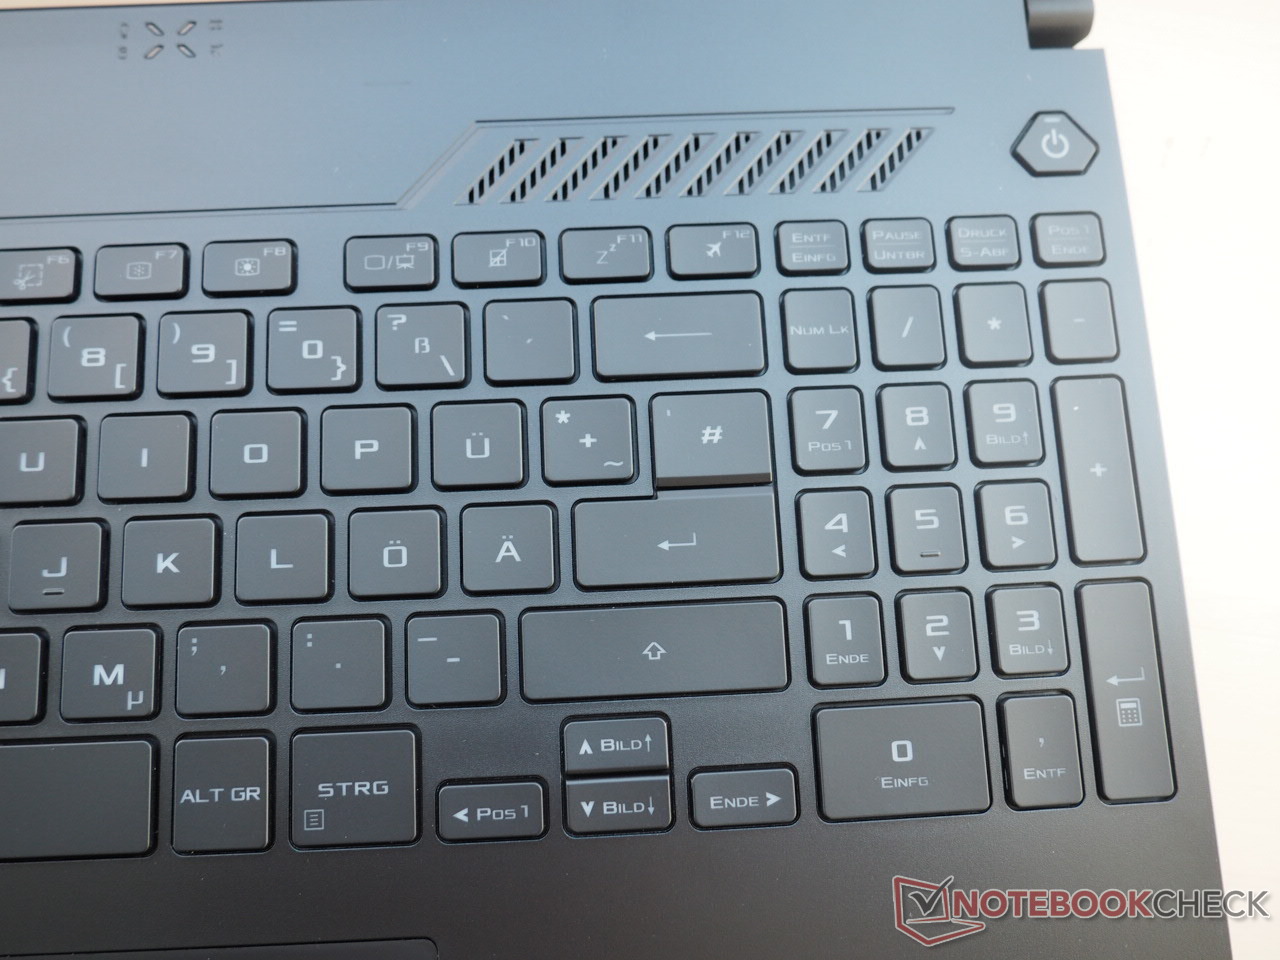
Asus could improve the keyboard a little. Although the keyboard generally cuts a decent figure, a few weaknesses and inconsistencies appear upon closer inspection. Starting with the typing feel, which feels a little spongy in terms of pressure point and stroke. We would have preferred crisper or harder feedback here.
The layout is also debatable. In addition to the F keys, the directional arrows are also very small. The fact that some functions (e.g. Enter/Del) are combined is, in the author's opinion, inconvenient. In addition, the lettering is relatively weak, so that the white backlight, which can be adjusted in several steps, should also remain active during the day. The full numpad and the four special keys, including volume control, should be regarded as plus points.
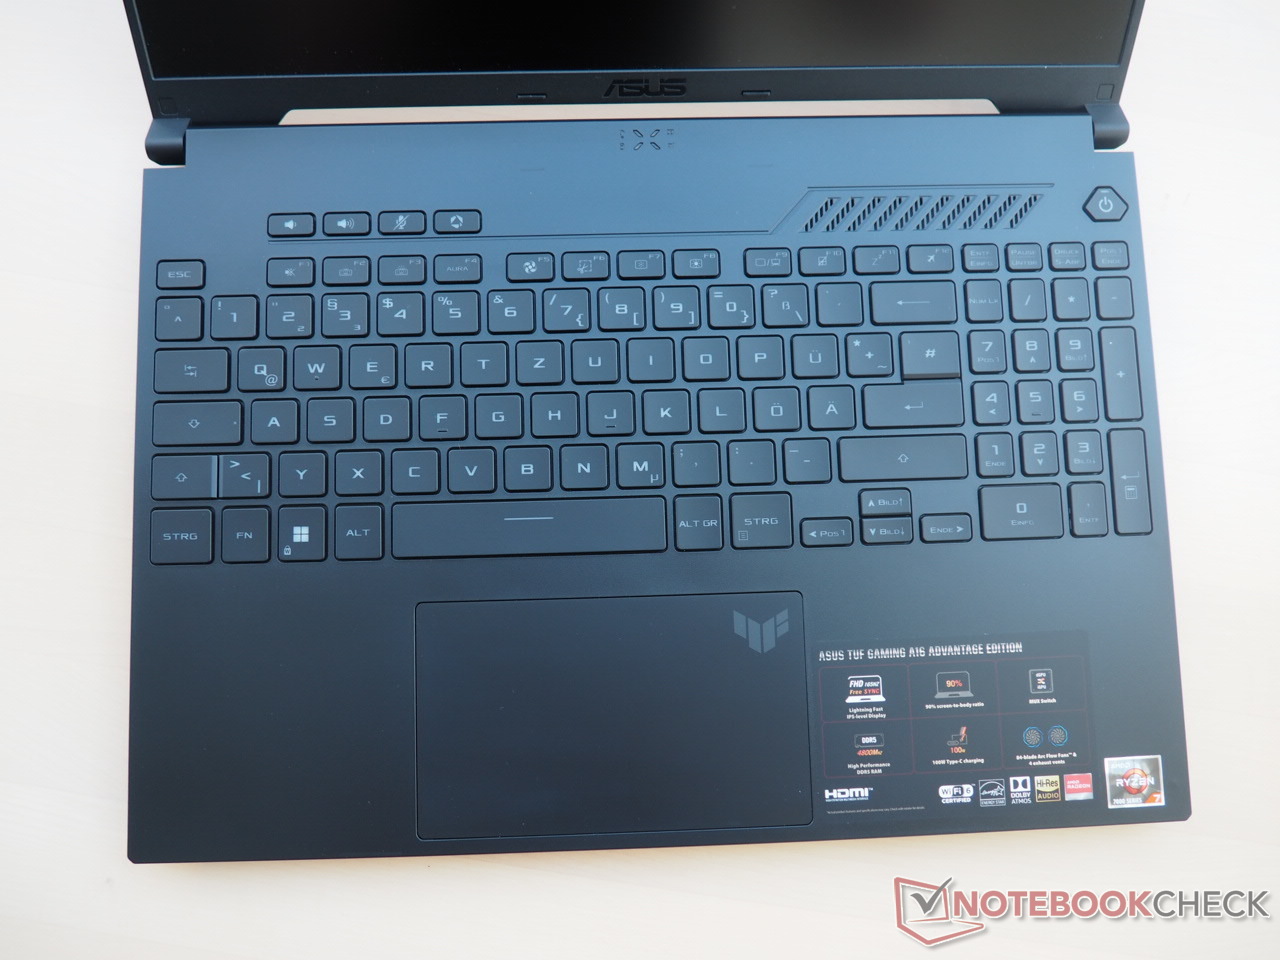
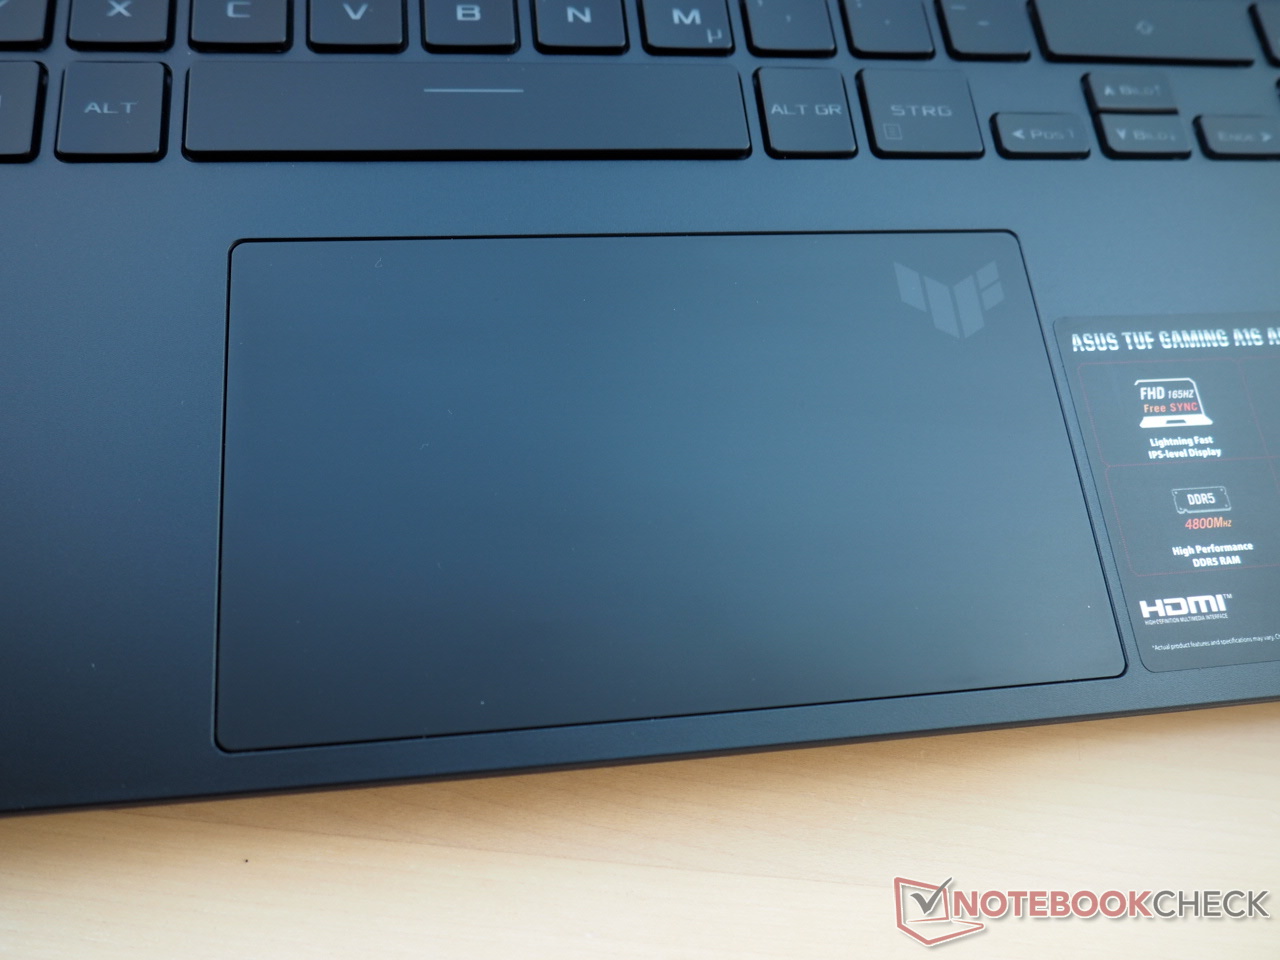
Touchpad
The touchpad is impressive almost all across the board. In addition to its dimensions (approx. 13 x 7.5 cm), its gliding properties are also pleasing. Extremely fast inputs are possible thanks to the smooth surface. Further praise goes to the touchpad for its precision and clean gesture support. However, the click buttons at the bottom are not quite perfect. These could be a little more stable and less rickety
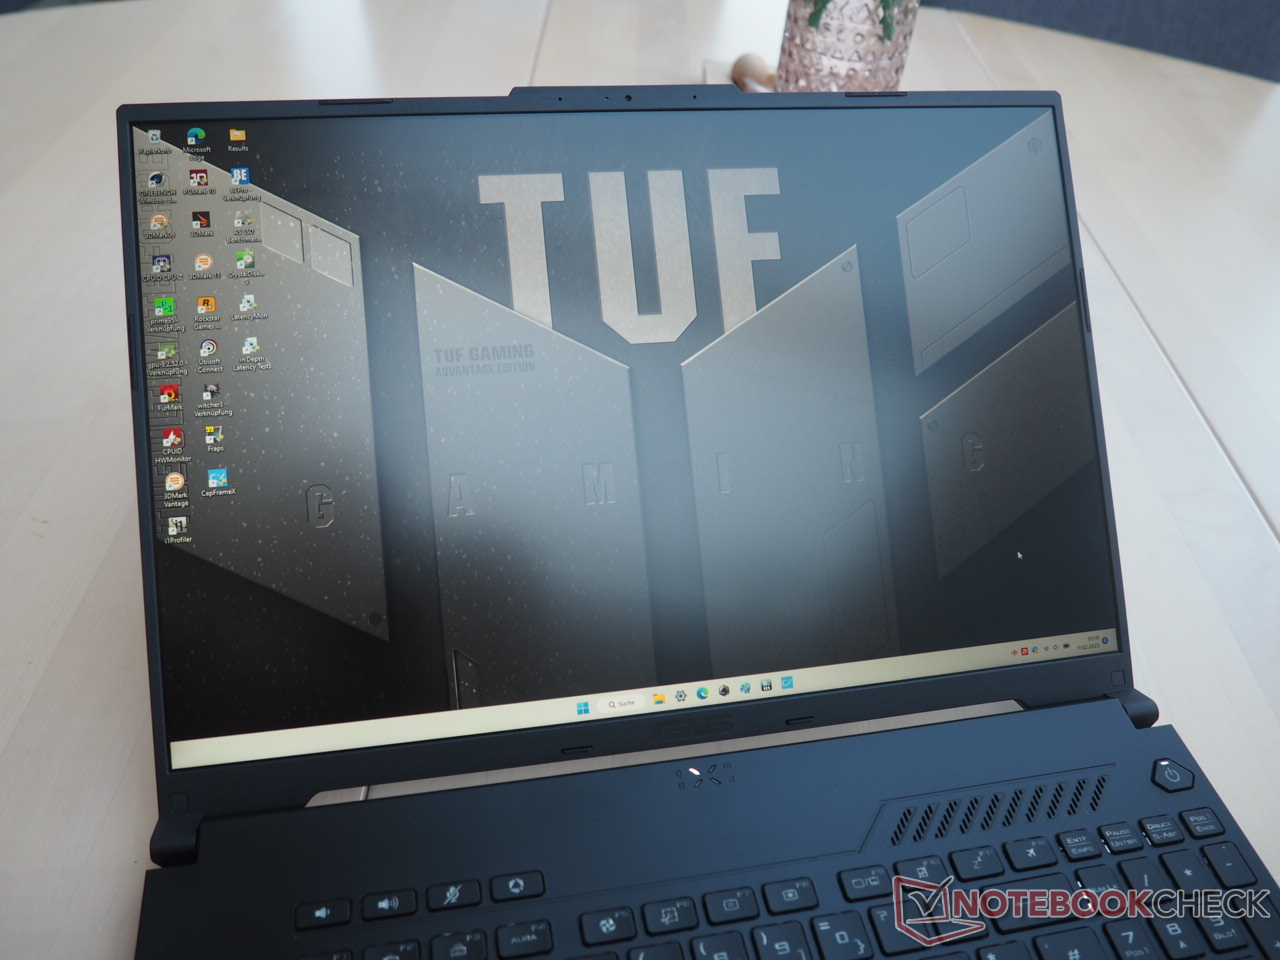
Display
The TUF Gaming A16 offers a matte 16-inch display in 16:10 format. Our review model was powered by a 165 Hz panel with a resolution of 1,920 x 1,200.
| |||||||||||||||||||||||||
Brightness Distribution: 90 %
Center on Battery: 308 cd/m²
Contrast: 1339:1 (Black: 0.23 cd/m²)
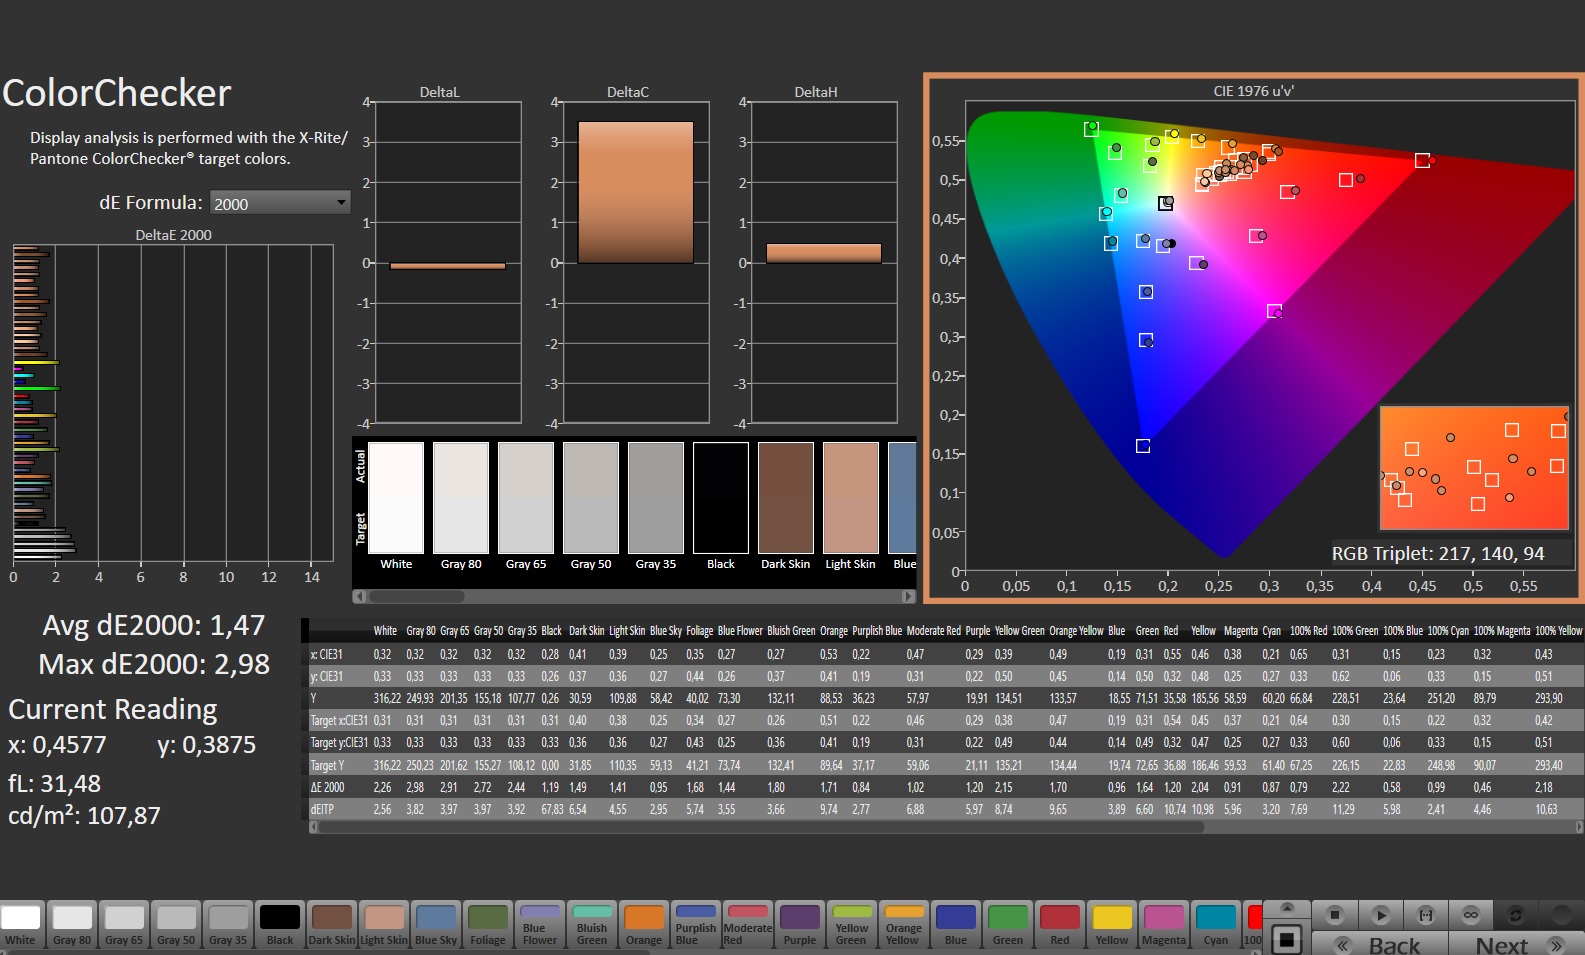
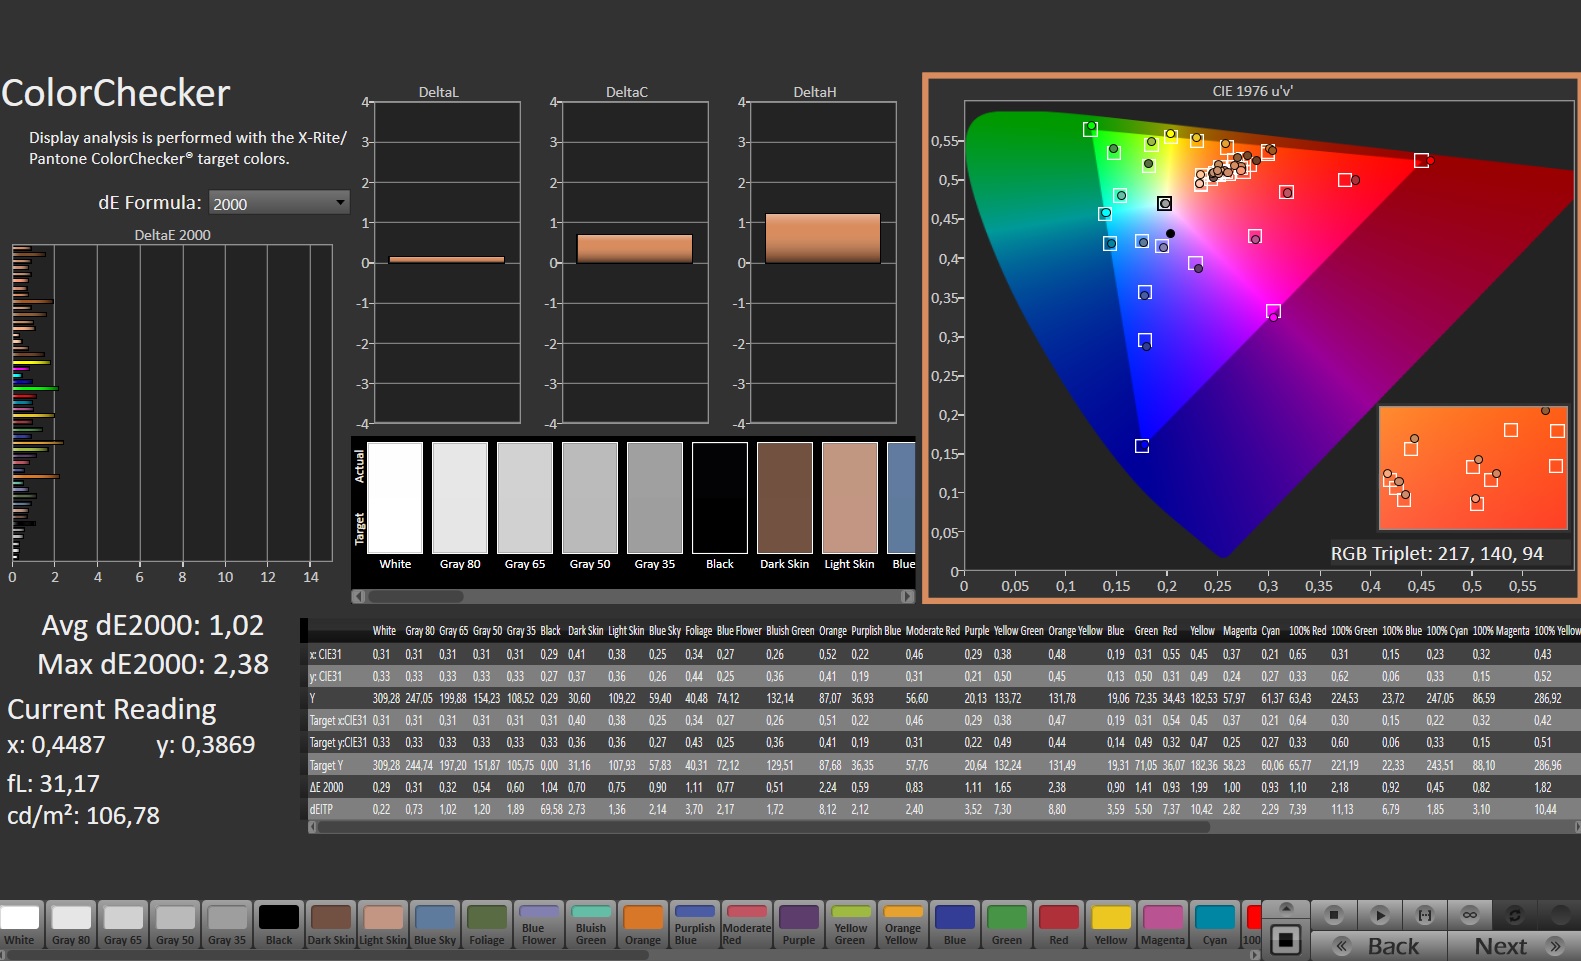
ΔE ColorChecker Calman: 1.47 | ∀{0.5-29.43 Ø4.71}
calibrated: 1.02
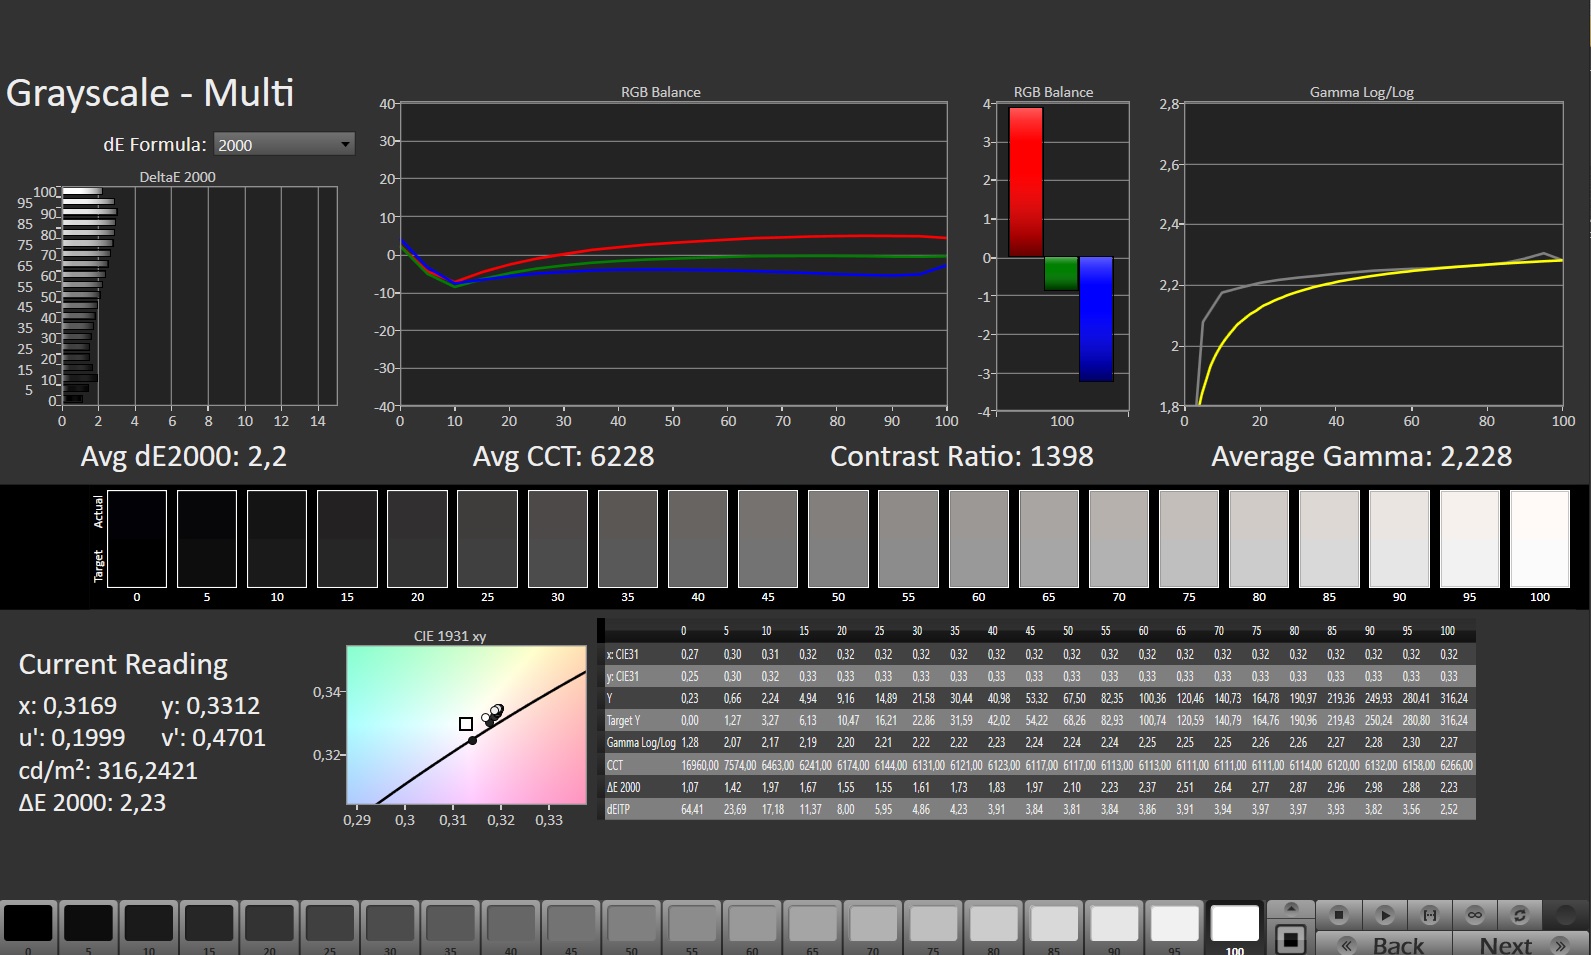
ΔE Greyscale Calman: 2.2 | ∀{0.09-98 Ø4.96}
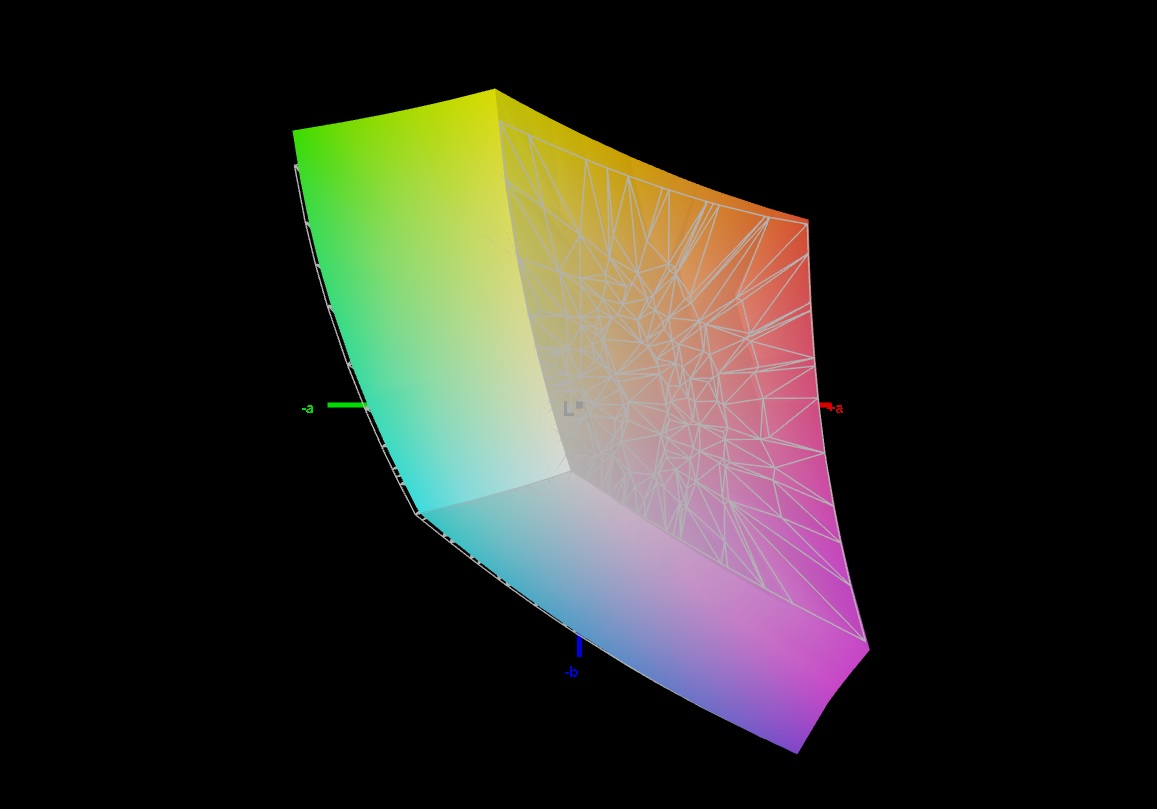
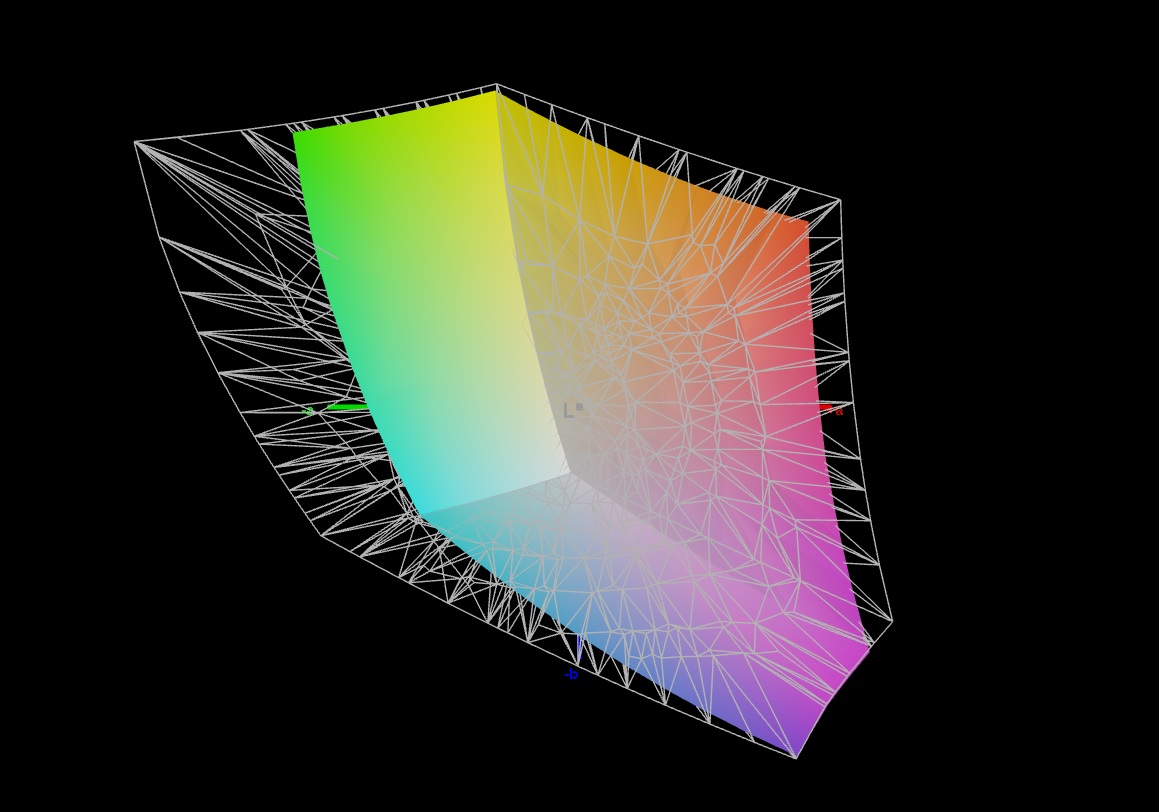
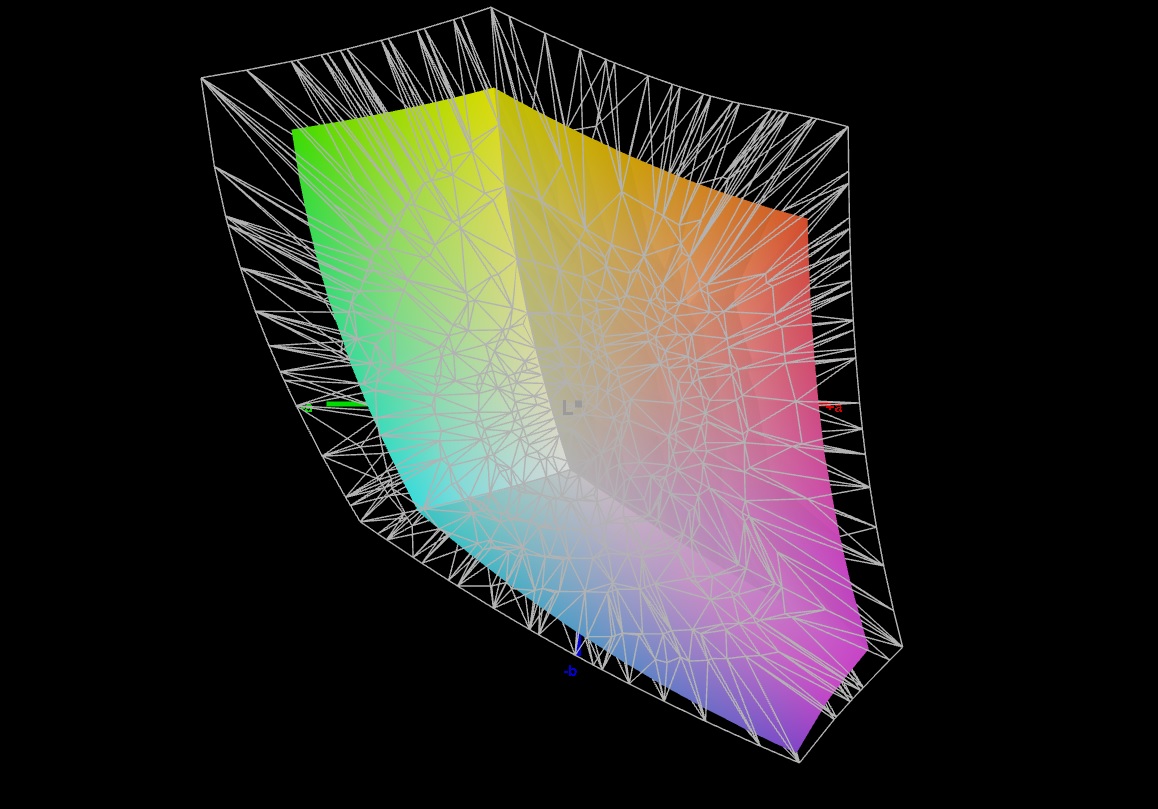
70.9% AdobeRGB 1998 (Argyll 3D)
97.8% sRGB (Argyll 3D)
69.4% Display P3 (Argyll 3D)
Gamma: 2.228
CCT: 6228 K
| Asus TUF Gaming A16 FA617 NE160WUM-NX2 (BOE0B33), IPS-Level, 1920x1200, 16" | HP Envy 16 h0112nr Samsung SDC4174, OLED, 3840x2400, 16" | Asus TUF Gaming F15 FX507ZM TL156VDXP0101, IPS, 1920x1080, 15.6" | Asus ROG Zephyrus G14 GA402RJ BOEhydis NE140QDM-NX1, IPS, 2560x1600, 14" | Lenovo Legion S7 16ARHA7 BOE CQ NE160QDM-NY1, IPS, 2560x1600, 16" | |
|---|---|---|---|---|---|
| Display | 23% | -3% | 21% | 1% | |
| Display P3 Coverage (%) | 69.4 | 99.3 43% | 66.4 -4% | 97.6 41% | 69.8 1% |
| sRGB Coverage (%) | 97.8 | 100 2% | 97 -1% | 99.9 2% | 98.1 0% |
| AdobeRGB 1998 Coverage (%) | 70.9 | 88 24% | 68.5 -3% | 85.6 21% | 71.9 1% |
| Response Times | 85% | 20% | 46% | 7% | |
| Response Time Grey 50% / Grey 80% * (ms) | 17 ? | 2 ? 88% | 5.6 ? 67% | 8.3 ? 51% | 10 ? 41% |
| Response Time Black / White * (ms) | 10.1 ? | 1.9 ? 81% | 12.8 ? -27% | 6 ? 41% | 12.8 ? -27% |
| PWM Frequency (Hz) | 240.4 ? | 26191 ? | |||
| Screen | -6% | -3% | -20% | 1% | |
| Brightness middle (cd/m²) | 308 | 328.8 7% | 353.7 15% | 500 62% | 492.4 60% |
| Brightness (cd/m²) | 293 | 332 13% | 340 16% | 470 60% | 471 61% |
| Brightness Distribution (%) | 90 | 97 8% | 89 -1% | 85 -6% | 90 0% |
| Black Level * (cd/m²) | 0.23 | 0.34 -48% | 0.42 -83% | 0.4 -74% | |
| Contrast (:1) | 1339 | 1040 -22% | 1190 -11% | 1231 -8% | |
| Colorchecker dE 2000 * | 1.47 | 1.53 -4% | 1.74 -18% | 2.45 -67% | 1.9 -29% |
| Colorchecker dE 2000 max. * | 2.98 | 6.04 -103% | 3.63 -22% | 5.34 -79% | 3.81 -28% |
| Colorchecker dE 2000 calibrated * | 1.02 | 0.5 51% | 1.2 -18% | 0.99 3% | |
| Greyscale dE 2000 * | 2.2 | 1.3 41% | 2.1 5% | 3.1 -41% | 1.7 23% |
| Gamma | 2.228 99% | 2.18 101% | 2.3 96% | 2.213 99% | 2.36 93% |
| CCT | 6228 104% | 6362 102% | 6257 104% | 7251 90% | 6497 100% |
| Total Average (Program / Settings) | 34% /
18% | 5% /
1% | 16% /
-2% | 3% /
2% |
* ... smaller is better
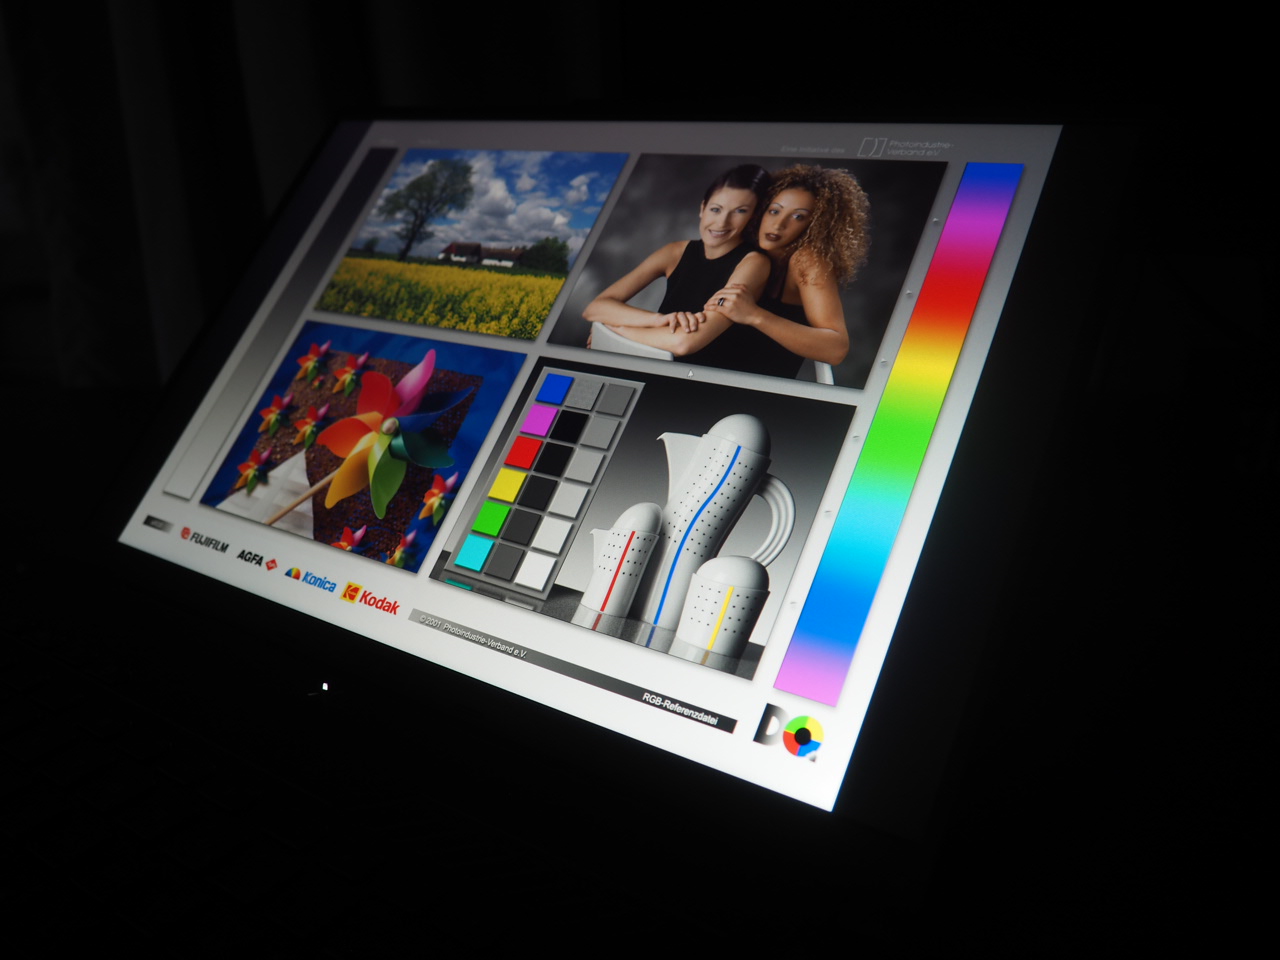
If you disregard the poor brightness (only 293 cd/m² on average), the IPS screen shows almost no weaknesses. A black value of 0.23 cd/m² should satisfy most buyers, as should a contrast ratio of more than 1,300:1. In addition, response times (10 ms black-to-white, 17 ms grey-to-grey) are decent, and the good color reproduction does not require calibration.
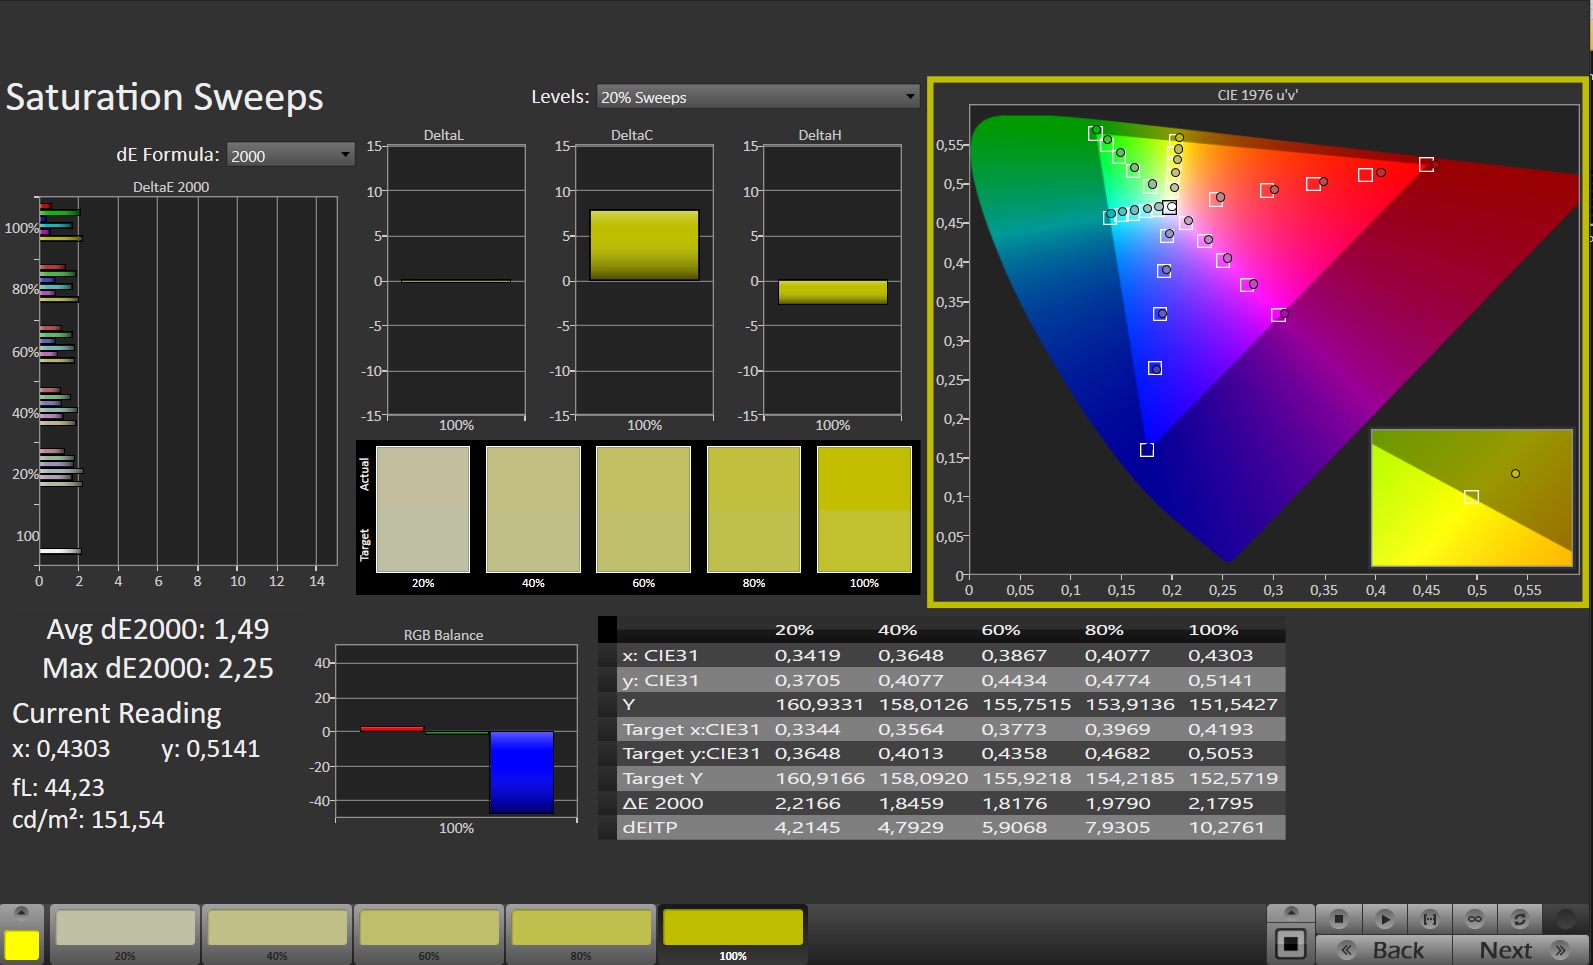
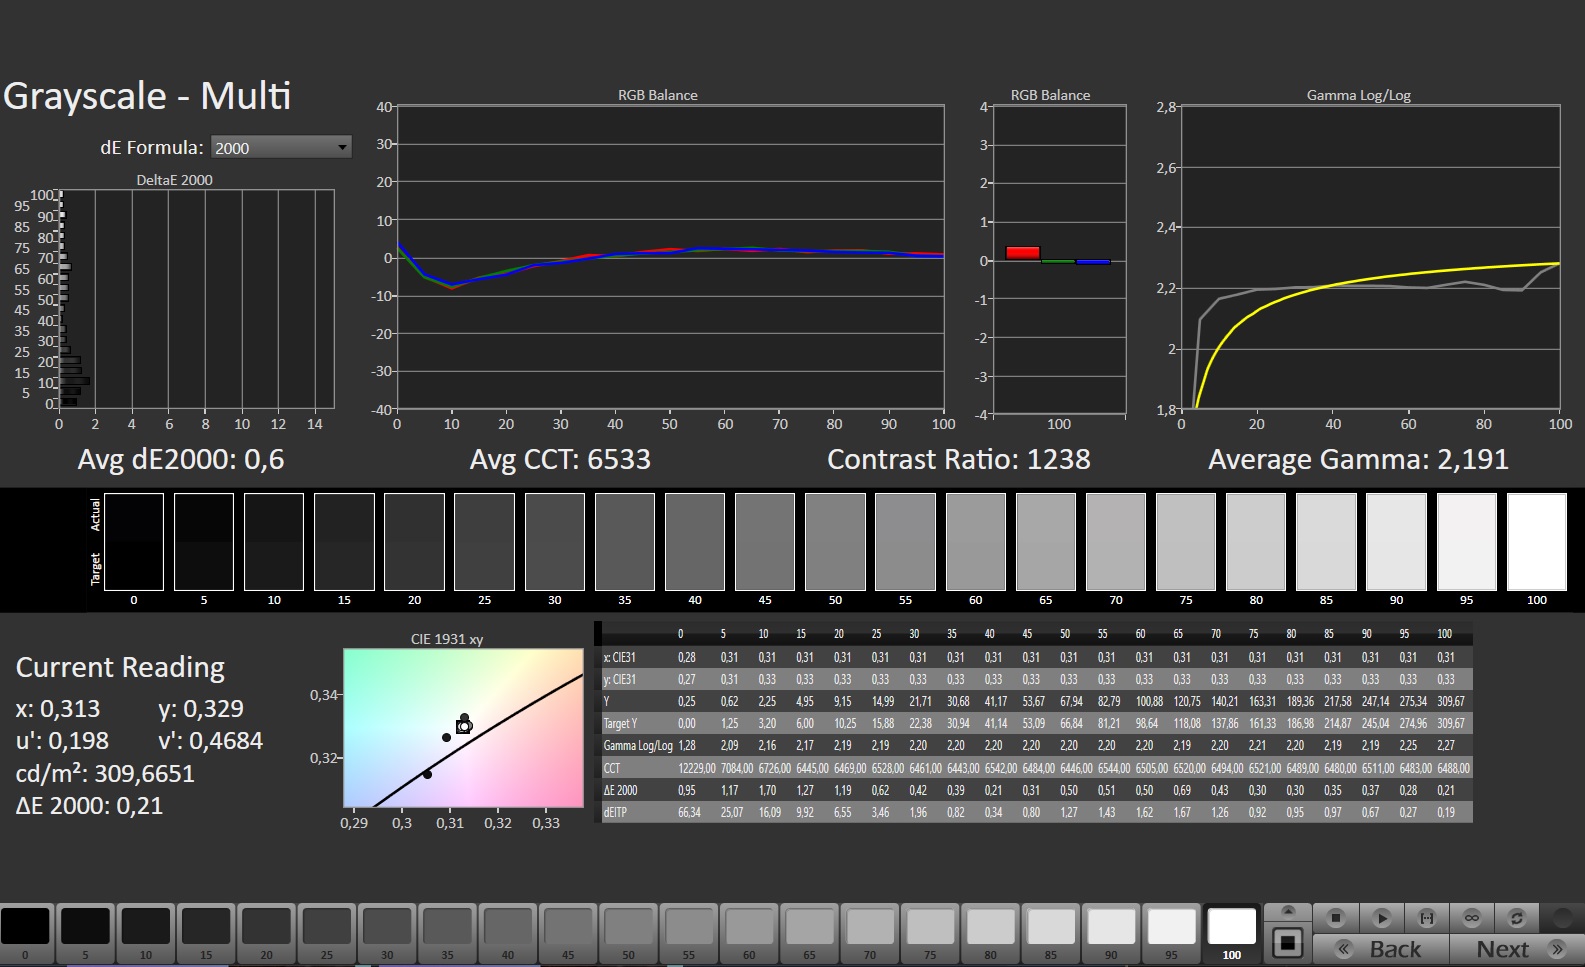
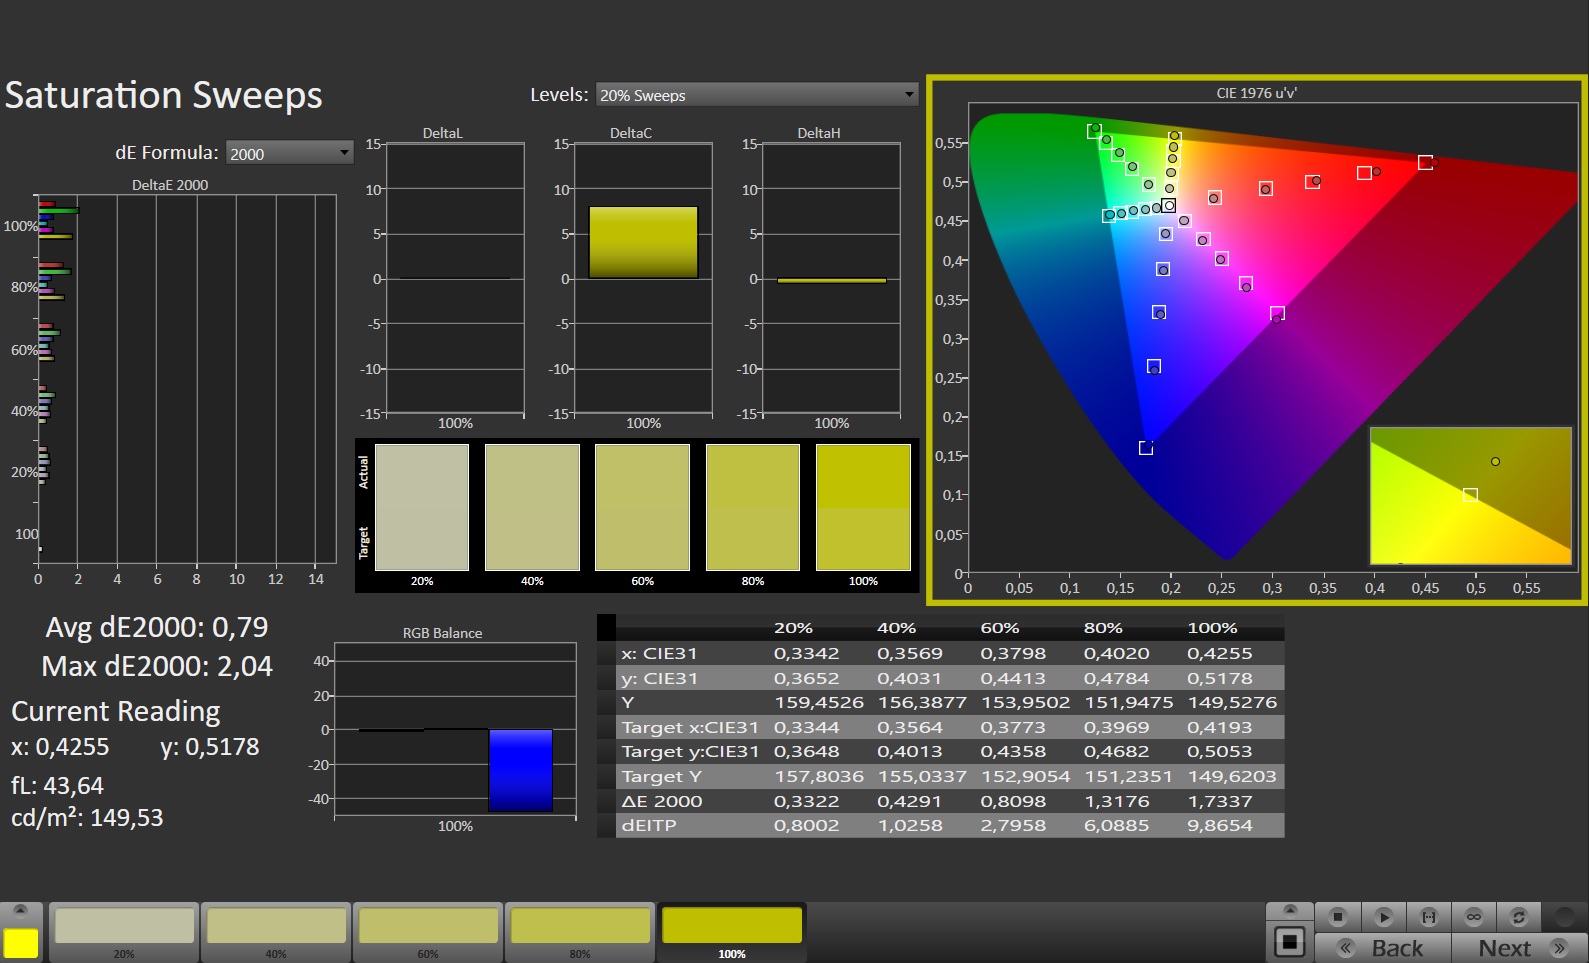
For the color spaces, our measuring device registered 98% for sRGB, 71% for AdobeRGB and 69% for P3 - usable values for a gaming notebook. The viewing angles conform to the typical IPS standard, so they are quite good, even from steep angles.
For outdoor use, higher brightness levels would be desirable. In addition, our review device struggled with halos at the bottom edge (only visible with dark content).
Display Response Times
| ↔ Response Time Black to White | ||
|---|---|---|
| 10.1 ms ... rise ↗ and fall ↘ combined | ↗ 5.4 ms rise | 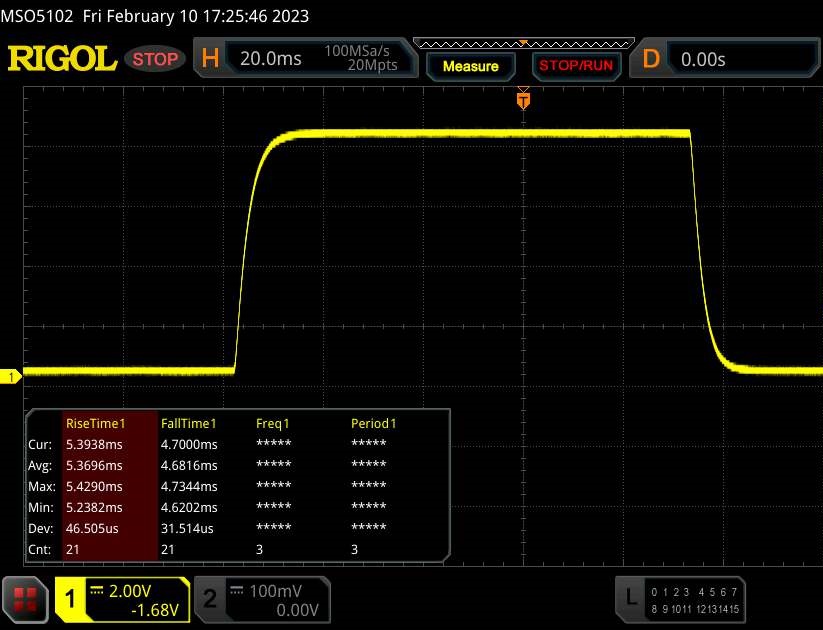 |
| ↘ 4.7 ms fall | ||
| The screen shows good response rates in our tests, but may be too slow for competitive gamers. In comparison, all tested devices range from 0.1 (minimum) to 240 (maximum) ms. » 28 % of all devices are better. This means that the measured response time is better than the average of all tested devices (19.8 ms). | ||
| ↔ Response Time 50% Grey to 80% Grey | ||
| 17 ms ... rise ↗ and fall ↘ combined | ↗ 8 ms rise | 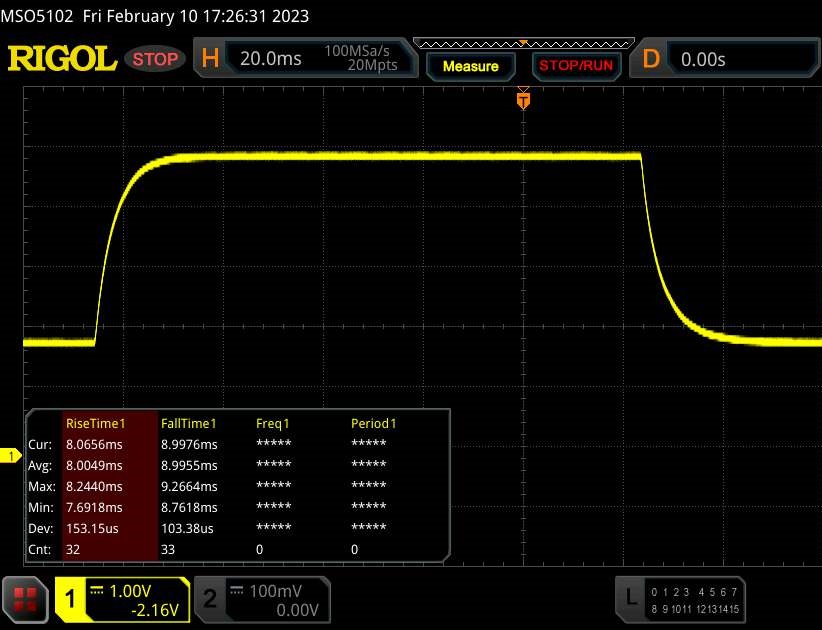 |
| ↘ 9 ms fall | ||
| The screen shows good response rates in our tests, but may be too slow for competitive gamers. In comparison, all tested devices range from 0.165 (minimum) to 636 (maximum) ms. » 31 % of all devices are better. This means that the measured response time is better than the average of all tested devices (30.9 ms). | ||
Screen Flickering / PWM (Pulse-Width Modulation)
| Screen flickering / PWM not detected | 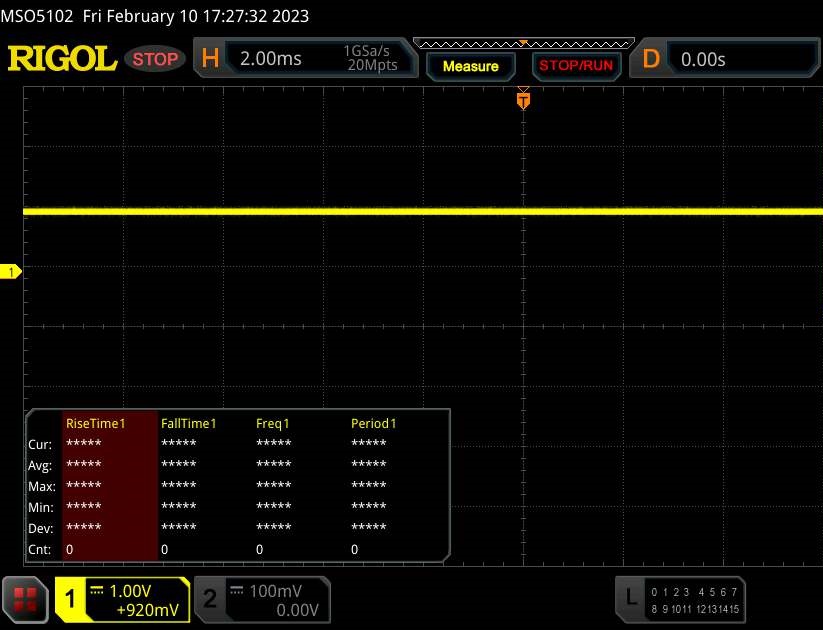 | ||
In comparison: 52 % of all tested devices do not use PWM to dim the display. If PWM was detected, an average of 7741 (minimum: 5 - maximum: 343500) Hz was measured. | |||
Performance
The TUF Gaming A16 is in the mid-range segment in terms of equipment. Passionate gamers who want to play at maximum details for years should look elsewhere for more powerful hardware.
Testing Conditions
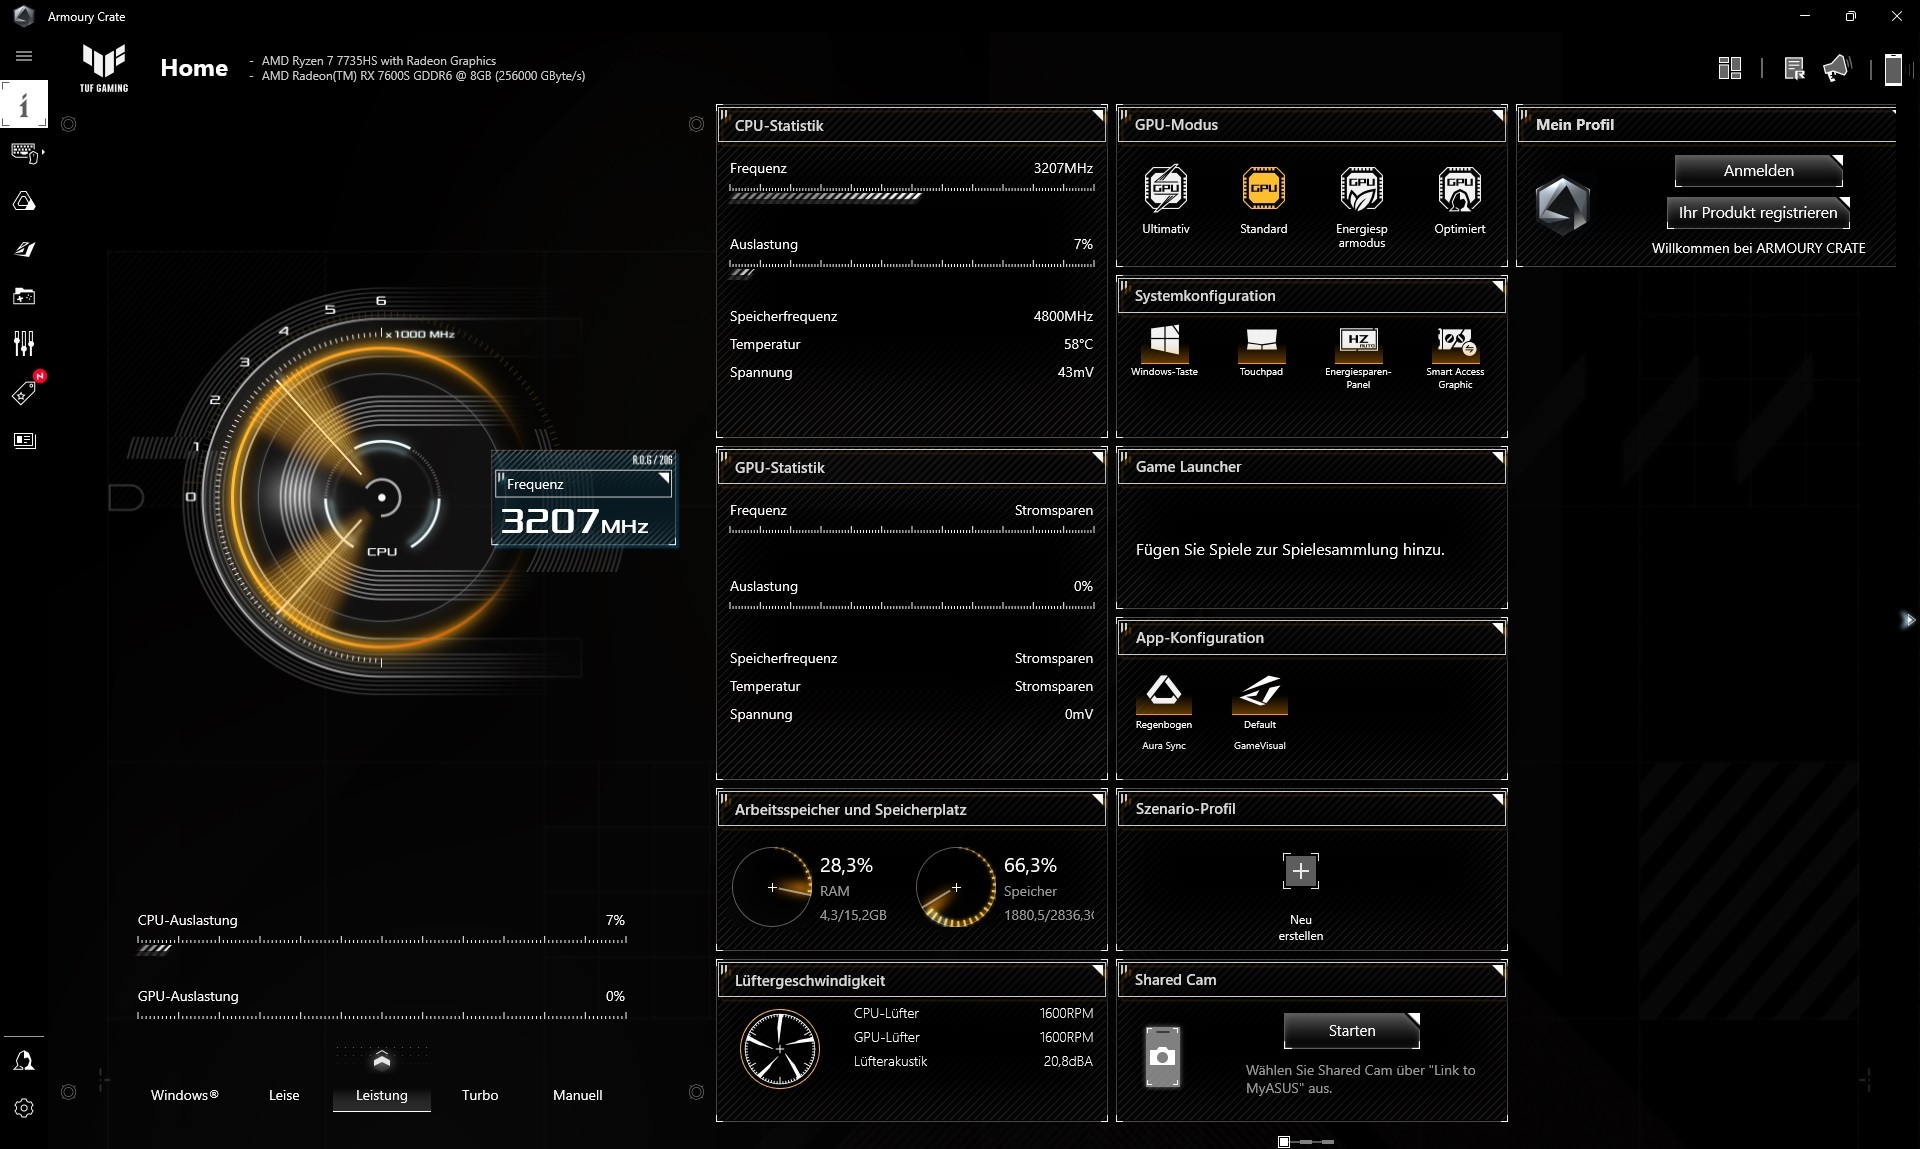
Various performance profiles and GPU modes can be selected in the pre-installed Armory Crate, which sometimes appears overloaded and confusing due to the many functions. Unless otherwise stated, all our tests were carried out in Performance mode with the GPU mode set to Standard. Although Turbo mode would tease out a few more percentage points (note the Cinebench loop and the 3DMark scores), this comes at the cost of disproportionately higher noise levels.
| Silent Mode | Performance Mode | Turbo Mode | |
| CPU PL1 | 75 watts | 105 watts | 120 watts |
| CPU PL2 | 90 watts | 114 watts | 144 watts |
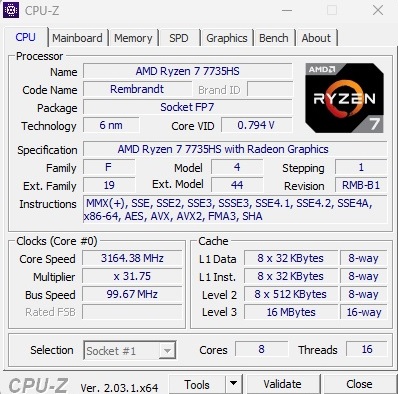
Processor
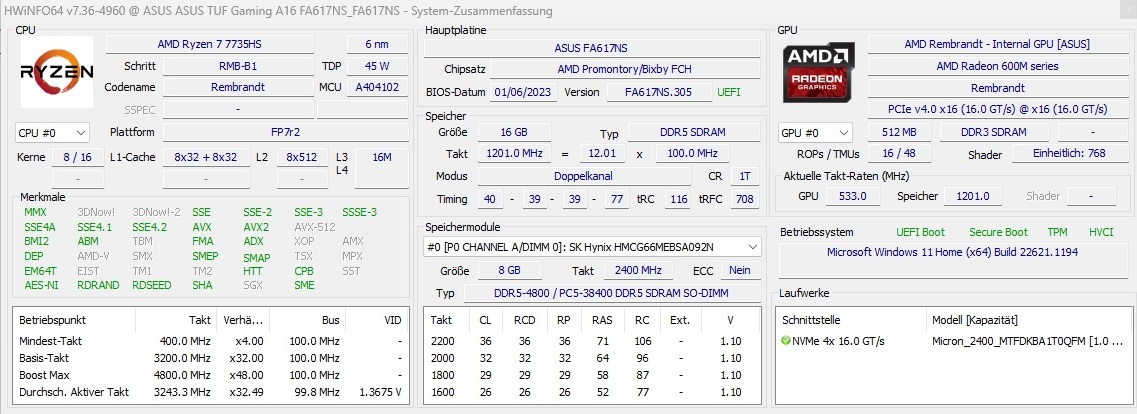
The Ryzen 7 7735HS is an eight-core processor equipped with 16 MB of L3 cache, is manufactured via the 6 nm process and can process up to 16 threads in parallel via SMT. The base clock is 3.2 GHz, with up to 4.75 GHz possible under load. The TDP ranges from 35 to 54 watts, depending on the notebook. Thanks to graphics switching, the TUF A16 can automatically switch between the dGPU and the Radeon 680M integrated in the processor, which is definitely sufficient for less demanding games.
In the long-term test with Cinebench R15, the Ryzen 7 7735HS delivers pleasingly stable performance values without drops, which also applies to most of the competitors. The speed is consistently on par with the Lenovo Legion S7 (R9 6900HX) and HP Envy 16 (Core i7-12700H).
Cinebench R15 Multi Sustained Load
* ... smaller is better
AIDA64: FP32 Ray-Trace | FPU Julia | CPU SHA3 | CPU Queen | FPU SinJulia | FPU Mandel | CPU AES | CPU ZLib | FP64 Ray-Trace | CPU PhotoWorxx
| Performance rating | |
| Average of class Gaming | |
| Lenovo Legion S7 16ARHA7 | |
| Asus TUF Gaming A16 FA617 | |
| Asus ROG Zephyrus G14 GA402RJ | |
| Average AMD Ryzen 7 7735HS | |
| HP Envy 16 h0112nr | |
| Asus TUF Gaming F15 FX507ZM | |
| AIDA64 / FP32 Ray-Trace | |
| Average of class Gaming (10227 - 85542, n=102, last 2 years) | |
| Asus TUF Gaming A16 FA617 | |
| Lenovo Legion S7 16ARHA7 | |
| Average AMD Ryzen 7 7735HS (11831 - 17161, n=16) | |
| Asus ROG Zephyrus G14 GA402RJ | |
| HP Envy 16 h0112nr | |
| Asus TUF Gaming F15 FX507ZM | |
| AIDA64 / FPU Julia | |
| Average of class Gaming (51376 - 372155, n=102, last 2 years) | |
| Lenovo Legion S7 16ARHA7 | |
| Asus TUF Gaming A16 FA617 | |
| Average AMD Ryzen 7 7735HS (75370 - 105483, n=16) | |
| Asus ROG Zephyrus G14 GA402RJ | |
| HP Envy 16 h0112nr | |
| Asus TUF Gaming F15 FX507ZM | |
| AIDA64 / CPU SHA3 | |
| Average of class Gaming (2180 - 10115, n=102, last 2 years) | |
| Lenovo Legion S7 16ARHA7 | |
| Asus TUF Gaming A16 FA617 | |
| Asus TUF Gaming F15 FX507ZM | |
| Average AMD Ryzen 7 7735HS (2499 - 3494, n=16) | |
| Asus ROG Zephyrus G14 GA402RJ | |
| HP Envy 16 h0112nr | |
| AIDA64 / CPU Queen | |
| Average of class Gaming (49785 - 173351, n=86, last 2 years) | |
| Lenovo Legion S7 16ARHA7 | |
| Asus TUF Gaming A16 FA617 | |
| HP Envy 16 h0112nr | |
| Asus ROG Zephyrus G14 GA402RJ | |
| Average AMD Ryzen 7 7735HS (87486 - 108729, n=15) | |
| Asus TUF Gaming F15 FX507ZM | |
| AIDA64 / FPU SinJulia | |
| Average of class Gaming (4424 - 33636, n=102, last 2 years) | |
| Lenovo Legion S7 16ARHA7 | |
| Asus TUF Gaming A16 FA617 | |
| Average AMD Ryzen 7 7735HS (11233 - 13097, n=16) | |
| Asus ROG Zephyrus G14 GA402RJ | |
| Asus TUF Gaming F15 FX507ZM | |
| HP Envy 16 h0112nr | |
| AIDA64 / FPU Mandel | |
| Average of class Gaming (25115 - 196829, n=102, last 2 years) | |
| Lenovo Legion S7 16ARHA7 | |
| Asus TUF Gaming A16 FA617 | |
| Average AMD Ryzen 7 7735HS (41400 - 58232, n=16) | |
| Asus ROG Zephyrus G14 GA402RJ | |
| HP Envy 16 h0112nr | |
| Asus TUF Gaming F15 FX507ZM | |
| AIDA64 / CPU AES | |
| Lenovo Legion S7 16ARHA7 | |
| Asus ROG Zephyrus G14 GA402RJ | |
| Average of class Gaming (39258 - 247074, n=102, last 2 years) | |
| HP Envy 16 h0112nr | |
| Average AMD Ryzen 7 7735HS (44013 - 137629, n=16) | |
| Asus TUF Gaming F15 FX507ZM | |
| Asus TUF Gaming A16 FA617 | |
| AIDA64 / CPU ZLib | |
| Average of class Gaming (574 - 2531, n=102, last 2 years) | |
| Asus TUF Gaming F15 FX507ZM | |
| Asus TUF Gaming A16 FA617 | |
| Lenovo Legion S7 16ARHA7 | |
| HP Envy 16 h0112nr | |
| Average AMD Ryzen 7 7735HS (651 - 906, n=16) | |
| Asus ROG Zephyrus G14 GA402RJ | |
| AIDA64 / FP64 Ray-Trace | |
| Average of class Gaming (5509 - 45446, n=102, last 2 years) | |
| Lenovo Legion S7 16ARHA7 | |
| Asus TUF Gaming A16 FA617 | |
| Average AMD Ryzen 7 7735HS (1459 - 9094, n=16) | |
| Asus ROG Zephyrus G14 GA402RJ | |
| HP Envy 16 h0112nr | |
| Asus TUF Gaming F15 FX507ZM | |
| AIDA64 / CPU PhotoWorxx | |
| Average of class Gaming (12271 - 89891, n=102, last 2 years) | |
| HP Envy 16 h0112nr | |
| Asus TUF Gaming F15 FX507ZM | |
| Lenovo Legion S7 16ARHA7 | |
| Asus TUF Gaming A16 FA617 | |
| Asus ROG Zephyrus G14 GA402RJ | |
| Average AMD Ryzen 7 7735HS (17524 - 30542, n=16) | |
System Performance
In the system tests, the Gaming A16 comes in last place in the comparison field (just behind the Zephyrus G14), but 7,332 points in PCMark 10 is still a good result. Somewhat annoying is the fact that the system, in its delivery state, sometimes freezes or hangs for seconds when opening programs. This is due to the Smart Access Graphic option in the Armoury Crate software, which is responsible for the GPU switch.
CrossMark: Overall | Productivity | Creativity | Responsiveness
| PCMark 10 / Score | |
| Average of class Gaming (5828 - 12414, n=93, last 2 years) | |
| Lenovo Legion S7 16ARHA7 | |
| HP Envy 16 h0112nr | |
| Asus TUF Gaming F15 FX507ZM | |
| Asus ROG Zephyrus G14 GA402RJ | |
| Asus TUF Gaming A16 FA617 | |
| Average AMD Ryzen 7 7735HS, AMD Radeon RX 7600S (n=1) | |
| PCMark 10 / Essentials | |
| HP Envy 16 h0112nr | |
| Lenovo Legion S7 16ARHA7 | |
| Average of class Gaming (8810 - 11935, n=97, last 2 years) | |
| Asus TUF Gaming A16 FA617 | |
| Average AMD Ryzen 7 7735HS, AMD Radeon RX 7600S (n=1) | |
| Asus TUF Gaming F15 FX507ZM | |
| Asus ROG Zephyrus G14 GA402RJ | |
| PCMark 10 / Productivity | |
| Average of class Gaming (6845 - 25323, n=95, last 2 years) | |
| Lenovo Legion S7 16ARHA7 | |
| Asus ROG Zephyrus G14 GA402RJ | |
| Asus TUF Gaming A16 FA617 | |
| Average AMD Ryzen 7 7735HS, AMD Radeon RX 7600S (n=1) | |
| HP Envy 16 h0112nr | |
| Asus TUF Gaming F15 FX507ZM | |
| PCMark 10 / Digital Content Creation | |
| Average of class Gaming (7602 - 19954, n=95, last 2 years) | |
| Asus TUF Gaming F15 FX507ZM | |
| Lenovo Legion S7 16ARHA7 | |
| Asus ROG Zephyrus G14 GA402RJ | |
| Asus TUF Gaming A16 FA617 | |
| Average AMD Ryzen 7 7735HS, AMD Radeon RX 7600S (n=1) | |
| HP Envy 16 h0112nr | |
| CrossMark / Overall | |
| Average of class Gaming (1366 - 2409, n=94, last 2 years) | |
| HP Envy 16 h0112nr | |
| Average AMD Ryzen 7 7735HS, AMD Radeon RX 7600S (n=1) | |
| Lenovo Legion S7 16ARHA7 | |
| CrossMark / Productivity | |
| Average of class Gaming (1386 - 2254, n=94, last 2 years) | |
| HP Envy 16 h0112nr | |
| Lenovo Legion S7 16ARHA7 | |
| Average AMD Ryzen 7 7735HS, AMD Radeon RX 7600S (n=1) | |
| CrossMark / Creativity | |
| Average of class Gaming (1343 - 2786, n=94, last 2 years) | |
| HP Envy 16 h0112nr | |
| Average AMD Ryzen 7 7735HS, AMD Radeon RX 7600S (n=1) | |
| Lenovo Legion S7 16ARHA7 | |
| CrossMark / Responsiveness | |
| Average of class Gaming (1226 - 2334, n=94, last 2 years) | |
| HP Envy 16 h0112nr | |
| Lenovo Legion S7 16ARHA7 | |
| Average AMD Ryzen 7 7735HS, AMD Radeon RX 7600S (n=1) | |
| PCMark 10 Score | 7332 points | |
Help | ||
| AIDA64 / Memory Copy | |
| Average of class Gaming (21750 - 129946, n=102, last 2 years) | |
| HP Envy 16 h0112nr | |
| Asus TUF Gaming F15 FX507ZM | |
| Lenovo Legion S7 16ARHA7 | |
| Asus TUF Gaming A16 FA617 | |
| Asus ROG Zephyrus G14 GA402RJ | |
| Average AMD Ryzen 7 7735HS (30324 - 52012, n=16) | |
| AIDA64 / Memory Read | |
| Average of class Gaming (22956 - 118858, n=102, last 2 years) | |
| HP Envy 16 h0112nr | |
| Asus TUF Gaming F15 FX507ZM | |
| Lenovo Legion S7 16ARHA7 | |
| Asus ROG Zephyrus G14 GA402RJ | |
| Asus TUF Gaming A16 FA617 | |
| Average AMD Ryzen 7 7735HS (33938 - 51856, n=16) | |
| AIDA64 / Memory Write | |
| Average of class Gaming (22297 - 135096, n=102, last 2 years) | |
| HP Envy 16 h0112nr | |
| Asus TUF Gaming F15 FX507ZM | |
| Lenovo Legion S7 16ARHA7 | |
| Asus TUF Gaming A16 FA617 | |
| Asus ROG Zephyrus G14 GA402RJ | |
| Average AMD Ryzen 7 7735HS (33175 - 55284, n=16) | |
| AIDA64 / Memory Latency | |
| Average of class Gaming (75.3 - 165.4, n=102, last 2 years) | |
| HP Envy 16 h0112nr | |
| Average AMD Ryzen 7 7735HS (78.2 - 109.8, n=16) | |
| Asus ROG Zephyrus G14 GA402RJ | |
| Asus TUF Gaming A16 FA617 | |
| Lenovo Legion S7 16ARHA7 | |
| Asus TUF Gaming F15 FX507ZM | |
* ... smaller is better
DPC Latency
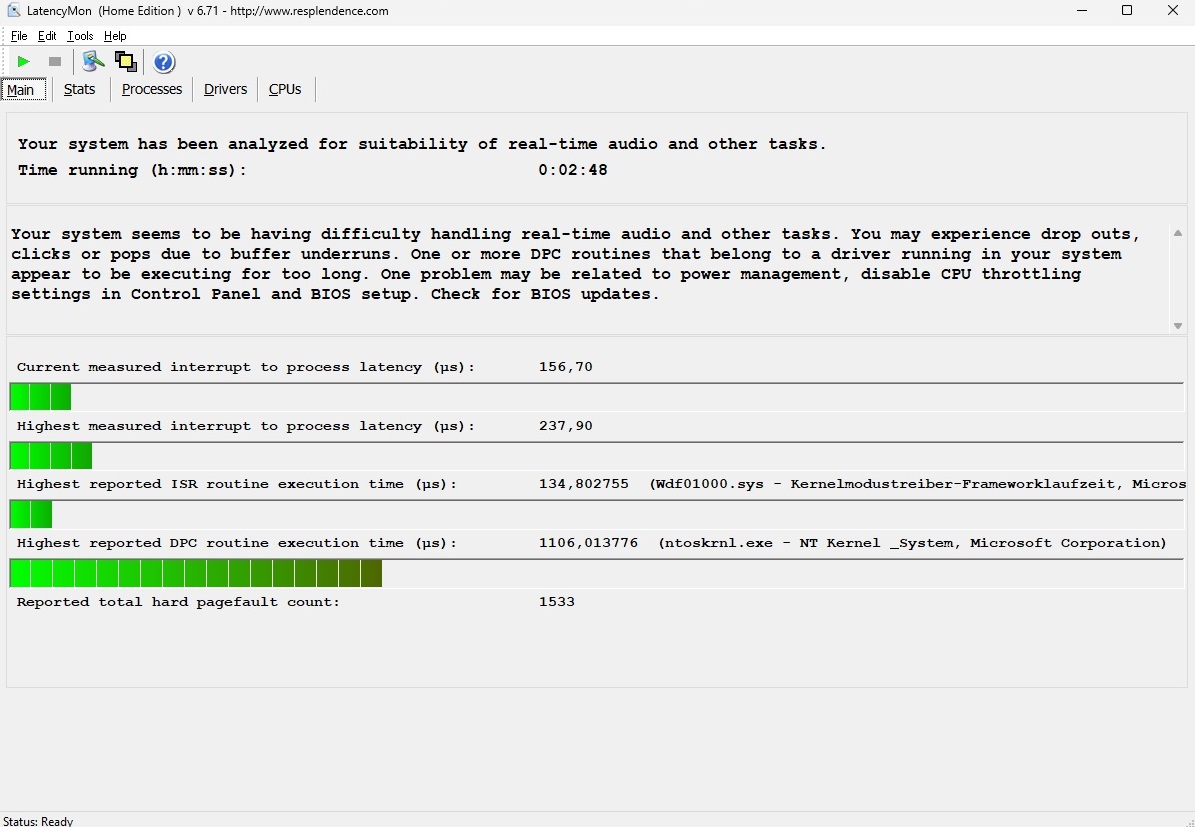
Although the latencies are by far the best in the test field, the LatencyMon tool foresees possible problems in real-time processing of audio content or the like, which should only affect a fraction of buyers.
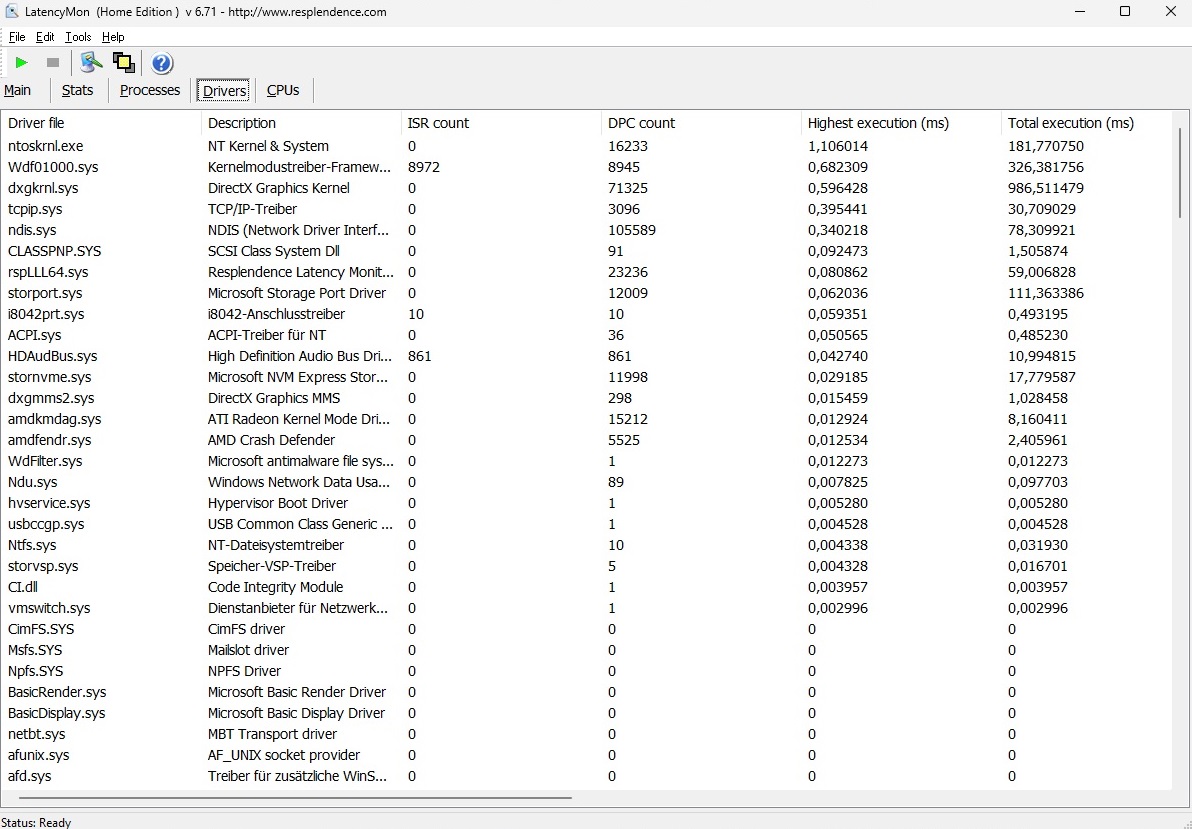
| DPC Latencies / LatencyMon - interrupt to process latency (max), Web, Youtube, Prime95 | |
| Asus ROG Zephyrus G14 GA402RJ | |
| Lenovo Legion S7 16ARHA7 | |
| HP Envy 16 h0112nr | |
| Asus TUF Gaming F15 FX507ZM | |
| Asus TUF Gaming A16 FA617 | |
* ... smaller is better
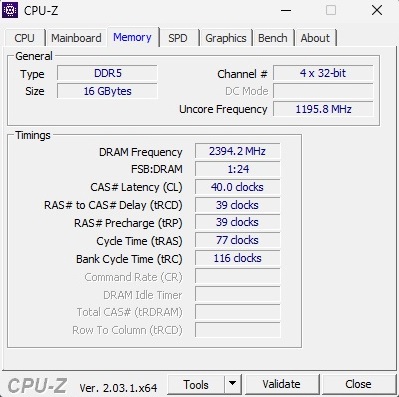
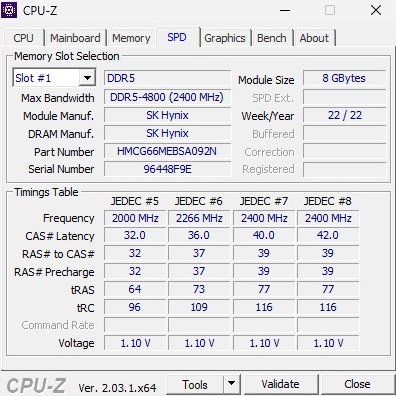
Storage Devices
Asus provides our review configuration with a M.2-based 1 TB SSD. The NVMe drive offers a solid performance for PCIe standards with almost 4,000 MB/s in sequential read and around 3,000 MB/s in sequential write (AS SSD benchmark). A bonus: One M.2 slot is still free in the case.

* ... smaller is better
Sustained Read Performance: DiskSpd Read Loop, Queue Depth 8
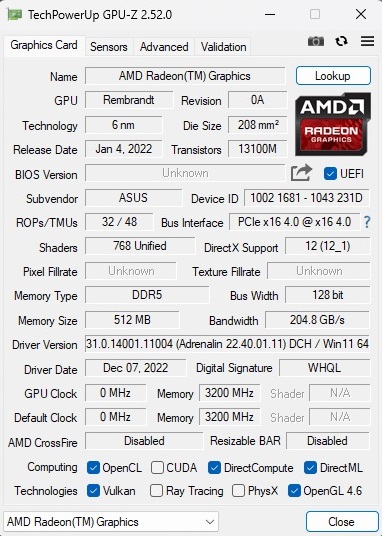
Graphics Card
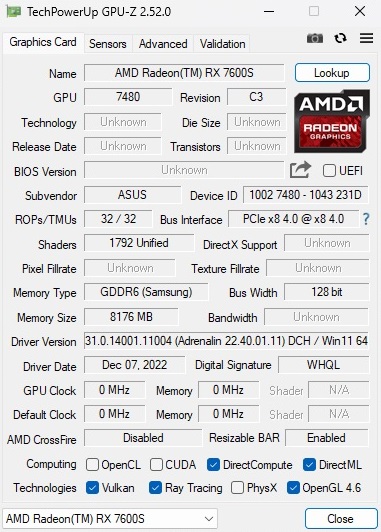
Asus installs a mid-range GPU to match the mid-range CPU. The Radeon RX 7600S offers 1,792 shader units and a game clock of 1,865 MHz. The 8 GB GDDR6 video memory is only 128 bits, which is a bit tight by today's standards.
The RX 7600S performs more than well enough in the benchmark chart. In 3DMarks, the graphics card is roughly on the same level as the old RX 6800S (but with better ray tracing performance). An RTX 3060 with identical TGP is occasionally greatly outperformed.
| 3DMark Performance rating - Percent | |
| Average of class Gaming | |
| Asus TUF Gaming A16 FA617 (Turbo Mode) | |
| Average AMD Radeon RX 7600S | |
| Lenovo Legion S7 16ARHA7 | |
| Asus TUF Gaming A16 FA617 | |
| Asus ROG Zephyrus G14 GA402RJ | |
| Asus TUF Gaming F15 FX507ZM | |
| HP Envy 16 h0112nr -1! | |
| 3DMark 11 - 1280x720 Performance GPU | |
| Average of class Gaming (21841 - 80022, n=103, last 2 years) | |
| Asus TUF Gaming A16 FA617 (Turbo Mode) | |
| Lenovo Legion S7 16ARHA7 | |
| Average AMD Radeon RX 7600S (33037 - 35278, n=4) | |
| Asus TUF Gaming A16 FA617 | |
| Asus ROG Zephyrus G14 GA402RJ | |
| Asus TUF Gaming F15 FX507ZM | |
| HP Envy 16 h0112nr | |
| 3DMark 06 Standard Score | 46893 points | |
| 3DMark Vantage P Result | 79339 points | |
| 3DMark 11 Performance | 26235 points | |
| 3DMark Ice Storm Standard Score | 233845 points | |
| 3DMark Cloud Gate Standard Score | 59913 points | |
| 3DMark Fire Strike Score | 22642 points | |
| 3DMark Time Spy Score | 9261 points | |
Help | ||
* ... smaller is better
Gaming Performance
The gaming benchmarks do not present a uniform picture. Sometimes the RX 7600S performs slightly below the level of a GeForce RTX 3060, sometimes slightly above. Analogous to the synthetic benchmarks, the RX 7600S hardly distinguishes itself from its RX 6700S and RX 6800S predecessors, which is somewhat disappointing for a new model series (for more in-depth comparisons, see our gaming list.)
Nevertheless, the TUF Gaming A16 is fast enough to run almost all games in FHD at more than 60 FPS. The graphics card would also be reasonably suitable for QHD displays at frame rates of 40+. Only in the 4K range does the RX 7600S quickly run out of steam. Here, current titles rarely exceed 40 FPS if maximum settings are selected.
| Performance rating - Percent | |
| Average of class Gaming | |
| Asus TUF Gaming F15 FX507ZM | |
| HP Envy 16 h0112nr | |
| Lenovo Legion S7 16ARHA7 | |
| Asus TUF Gaming A16 FA617 | |
| Asus ROG Zephyrus G14 GA402RJ | |
| GTA V - 1920x1080 Highest AA:4xMSAA + FX AF:16x | |
| Average of class Gaming (67.1 - 186.9, n=90, last 2 years) | |
| HP Envy 16 h0112nr | |
| Asus TUF Gaming F15 FX507ZM | |
| Lenovo Legion S7 16ARHA7 | |
| Asus TUF Gaming A16 FA617 | |
| Asus ROG Zephyrus G14 GA402RJ | |
| Final Fantasy XV Benchmark - 1920x1080 High Quality | |
| Average of class Gaming (64.2 - 215, n=91, last 2 years) | |
| Asus TUF Gaming F15 FX507ZM | |
| Lenovo Legion S7 16ARHA7 | |
| HP Envy 16 h0112nr | |
| Asus ROG Zephyrus G14 GA402RJ | |
| Asus TUF Gaming A16 FA617 | |
| Strange Brigade - 1920x1080 ultra AA:ultra AF:16 | |
| Average of class Gaming (113.6 - 458, n=83, last 2 years) | |
| Lenovo Legion S7 16ARHA7 | |
| Asus TUF Gaming A16 FA617 | |
| Asus TUF Gaming F15 FX507ZM | |
| Asus ROG Zephyrus G14 GA402RJ | |
| HP Envy 16 h0112nr | |
| Dota 2 Reborn - 1920x1080 ultra (3/3) best looking | |
| Average of class Gaming (84.8 - 252, n=104, last 2 years) | |
| Asus TUF Gaming F15 FX507ZM | |
| HP Envy 16 h0112nr | |
| Asus TUF Gaming A16 FA617 | |
| Asus ROG Zephyrus G14 GA402RJ | |
| Lenovo Legion S7 16ARHA7 | |
| X-Plane 11.11 - 1920x1080 high (fps_test=3) | |
| Asus TUF Gaming F15 FX507ZM | |
| HP Envy 16 h0112nr | |
| Average of class Gaming (55.5 - 148.5, n=106, last 2 years) | |
| Asus TUF Gaming A16 FA617 | |
| Lenovo Legion S7 16ARHA7 | |
| Asus ROG Zephyrus G14 GA402RJ | |
| The Witcher 3 | |
| 1920x1080 High Graphics & Postprocessing (Nvidia HairWorks Off) | |
| Average of class Gaming (341 - 404, n=2, last 2 years) | |
| Asus TUF Gaming F15 FX507ZM | |
| Lenovo Legion S7 16ARHA7 | |
| HP Envy 16 h0112nr | |
| Average AMD Radeon RX 7600S (152 - 166.5, n=2) | |
| Asus TUF Gaming A16 FA617 | |
| Asus ROG Zephyrus G14 GA402RJ | |
| 1920x1080 Ultra Graphics & Postprocessing (HBAO+) | |
| Average of class Gaming (104.7 - 240, n=7, last 2 years) | |
| Average AMD Radeon RX 7600S (91 - 98.1, n=2) | |
| Asus TUF Gaming F15 FX507ZM | |
| Asus TUF Gaming A16 FA617 | |
| Lenovo Legion S7 16ARHA7 | |
| Asus ROG Zephyrus G14 GA402RJ | |
| HP Envy 16 h0112nr | |
In our 60-minute test with The Witcher 3, there were no abnormalities in performance (e.g. frame rate drops), apart from minor fluctuations, as our chart shows. However, AMD still needs to tweak the drivers: there were one or two crashes during the test. F1 22 usually crashed with an error message upon start-up.
Witcher 3 FPS Chart
| low | med. | high | ultra | QHD | 4K | |
|---|---|---|---|---|---|---|
| GTA V (2015) | 169 | 154.1 | 85.5 | |||
| The Witcher 3 (2015) | 186.7 | 152 | 91 | |||
| Dota 2 Reborn (2015) | 131.4 | 112.5 | 110 | |||
| Final Fantasy XV Benchmark (2018) | 103.4 | 78.2 | ||||
| X-Plane 11.11 (2018) | 68.2 | 55 | ||||
| Far Cry 5 (2018) | 102 | 99 | 96 | |||
| Strange Brigade (2018) | 227 | 190 | 162.7 | |||
| Outriders (2021) | 115.2 | 103.2 | 89.1 | 59.7 | 32.9 | |
| Resident Evil Village (2021) | 165.4 | 159.1 | 141.5 | 92.3 | 45.7 | |
| Days Gone (2021) | 131.3 | 111.7 | 79.9 | 56.5 | 30.6 | |
| Deathloop (2021) | 112.1 | 93.2 | 69.4 | 48.7 | 23 | |
| Back 4 Blood (2021) | 186.9 | 155.2 | 146 | 94.7 | 48.4 | |
| Guardians of the Galaxy (2021) | 110 | 108 | 102 | 75 | 42 | |
| Riders Republic (2021) | 91 | 87 | 83 | 68 | 35 | |
| Farming Simulator 22 (2021) | 163.8 | 139.5 | 125.5 | 110.3 | 68.6 | |
| Halo Infinite (2021) | 101.3 | 83.7 | 79.6 | 59.5 | 34.1 | |
| God of War (2022) | 93.7 | 80.9 | 57.7 | 45.8 | 28 | |
| Rainbow Six Extraction (2022) | 156 | 154 | 125 | 76 | 37 | |
| Dying Light 2 (2022) | 79.1 | 65.7 | 43.2 | 20.8 | ||
| Elden Ring (2022) | 59.7 | 59.6 | 59.5 | 58.2 | 34.8 | |
| Cyberpunk 2077 1.6 (2022) | 103 | 84 | 69.7 | 42.9 | 18.4 | |
| Elex 2 (2022) | 111.7 | 100.3 | 86.7 | 59.9 | 31.3 | |
| Ghostwire Tokyo (2022) | 125.1 | 122.7 | 115.3 | 75.4 | 35.8 | |
| Vampire Bloodhunt (2022) | 177.6 | 169.4 | 147.4 | 104.1 | 51.7 | |
| F1 22 (2022) | 0 () | 0 () | 0 () | 0 () | 0 () | |
| The Quarry (2022) | 95 | 77.9 | 57.1 | 37.9 | 12.8 | |
| A Plague Tale Requiem (2022) | 53.7 | 46 | 39.7 | 28.2 | 15.2 | |
| Uncharted Legacy of Thieves Collection (2022) | 75 | 68.6 | 65.9 | 47.4 | 17.3 | |
| Call of Duty Modern Warfare 2 2022 (2022) | 135 | 99 | 94 | 65 | 37 | |
| Spider-Man Miles Morales (2022) | 96 | 86.7 | 79.8 | 55.9 | 30 | |
| The Callisto Protocol (2022) | 79.4 | 48.6 | 48.4 | 35.6 | 20.9 | |
| Need for Speed Unbound (2022) | 103.6 | 81.8 | 66.5 | 51.1 | 29.9 | |
| High On Life (2023) | 138.7 | 103.7 | 80.5 | 49.1 | 21 | |
| The Witcher 3 v4 (2023) | 156.7 | 129.5 | 103.1 | 69.3 | 36.3 | |
| Dead Space Remake (2023) | 62.2 | 52.6 | 52.3 | 34.8 | 11.3 |
Emissions
Noise
For a mid-range gamer, the A16 gets quite loud under load. In both the Witcher 3 test and under full load, we detected a very clearly audible and annoyingly loud 50 dB(A) from the 16-incher without headphones. In idle mode and during simple activities such as office applications, video playback and web surfing, the fans are comfortably restrained. In normal circumstances, the notebook is silent. If you want it to be as quiet as possible in every situation, simply activate Silent mode.
Noise level
| Idle |
| 24 / 25 / 28 dB(A) |
| Load |
| 42 / 50 dB(A) |
 | ||
30 dB silent 40 dB(A) audible 50 dB(A) loud |
||
min: | ||
| Asus TUF Gaming A16 FA617 R7 7735HS, Radeon RX 7600S | HP Envy 16 h0112nr i7-12700H, GeForce RTX 3060 Laptop GPU | Asus TUF Gaming F15 FX507ZM i7-12700H, GeForce RTX 3060 Laptop GPU | Asus ROG Zephyrus G14 GA402RJ R7 6800HS, Radeon RX 6700S | Lenovo Legion S7 16ARHA7 R9 6900HX, Radeon RX 6800S | |
|---|---|---|---|---|---|
| Noise | 1% | 1% | 0% | 8% | |
| off / environment * (dB) | 24 | 22.8 5% | 23.2 3% | 25 -4% | 23.1 4% |
| Idle Minimum * (dB) | 24 | 22.9 5% | 23.6 2% | 25 -4% | 23.1 4% |
| Idle Average * (dB) | 25 | 22.9 8% | 23.6 6% | 26 -4% | 23.1 8% |
| Idle Maximum * (dB) | 28 | 30.5 -9% | 25.4 9% | 29 -4% | 23.1 17% |
| Load Average * (dB) | 42 | 41.4 1% | 38 10% | 45 -7% | 31.4 25% |
| Witcher 3 ultra * (dB) | 50 | 51.1 -2% | 54.1 -8% | 43 14% | 51.4 -3% |
| Load Maximum * (dB) | 50 | 51.4 -3% | 57.2 -14% | 45 10% | 51.2 -2% |
* ... smaller is better
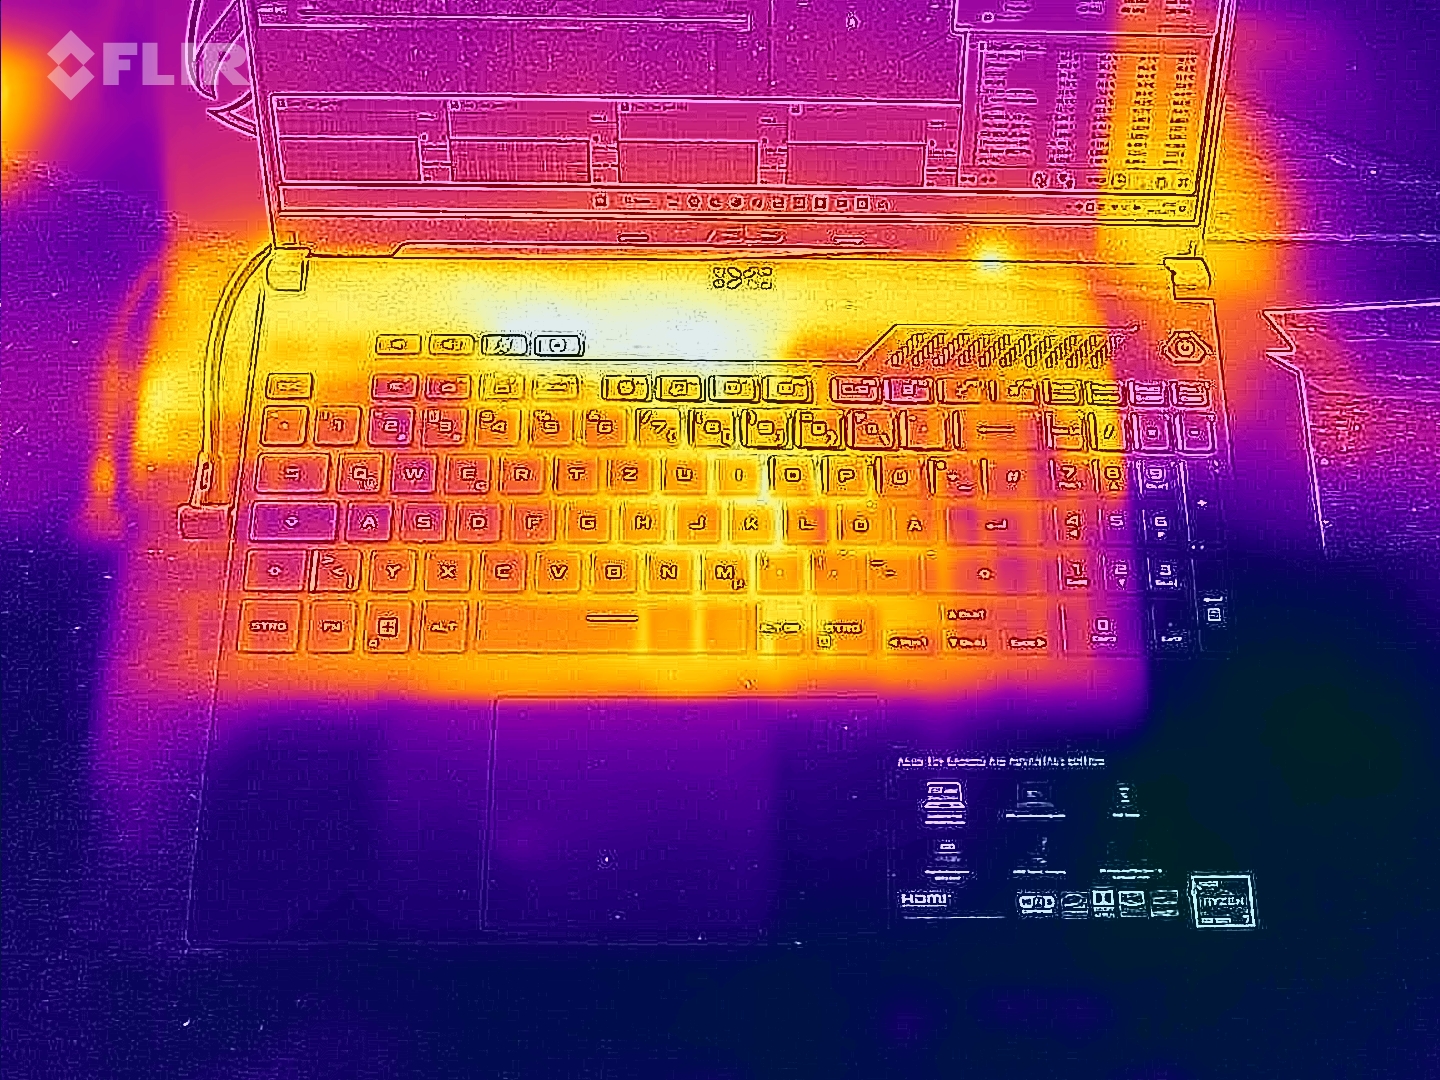
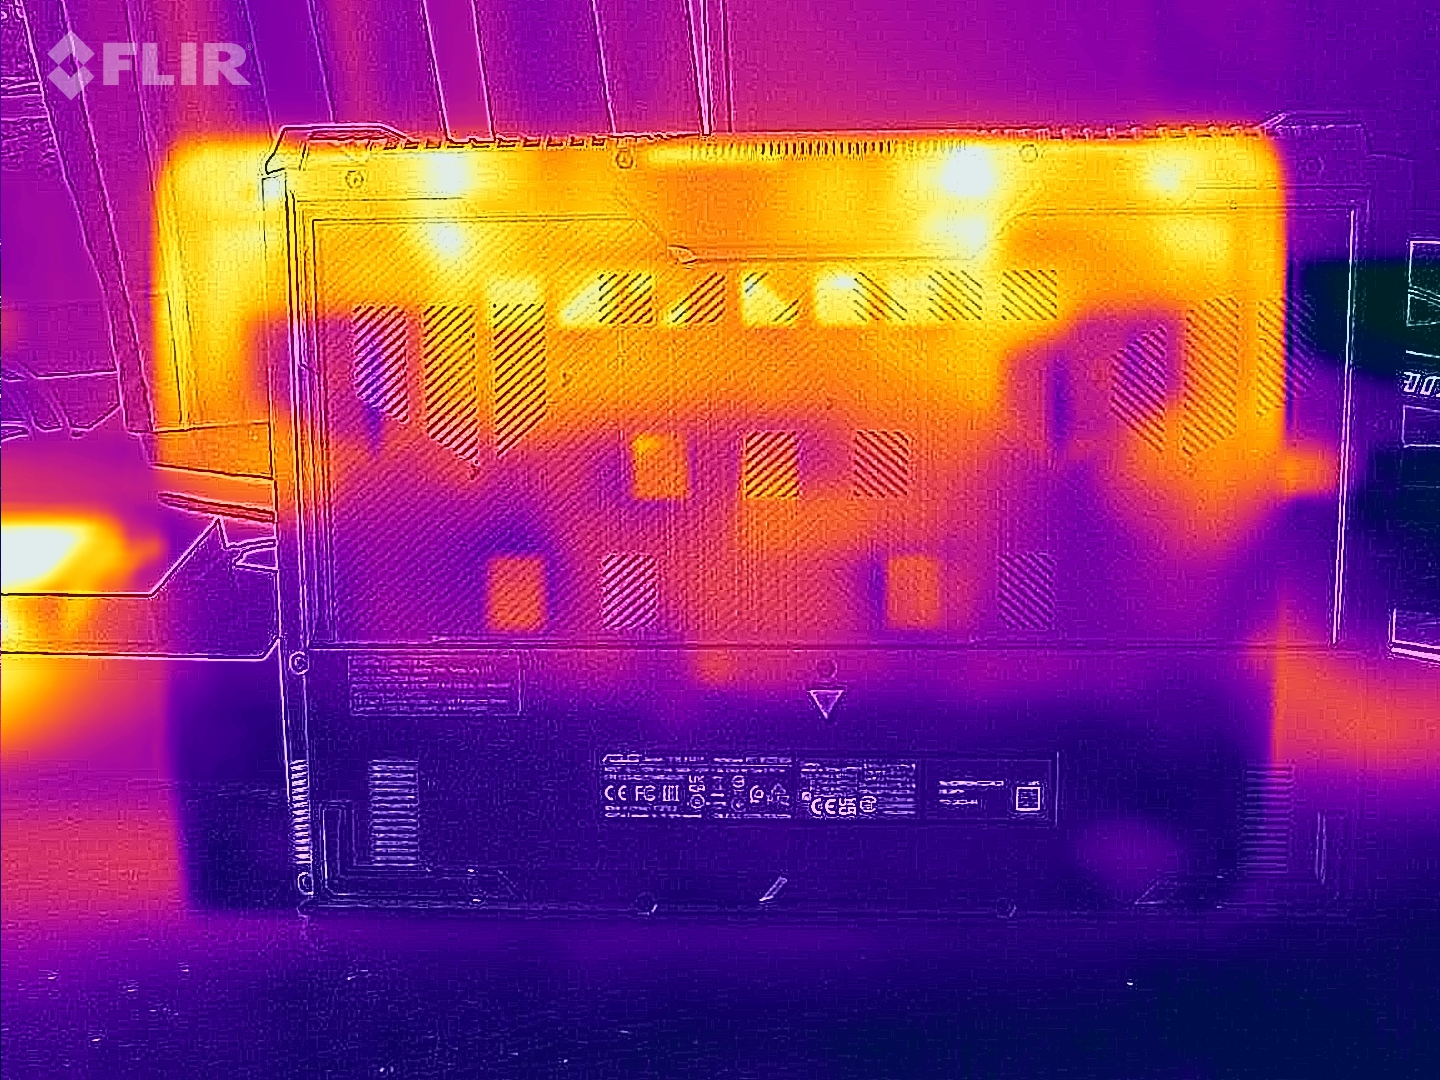
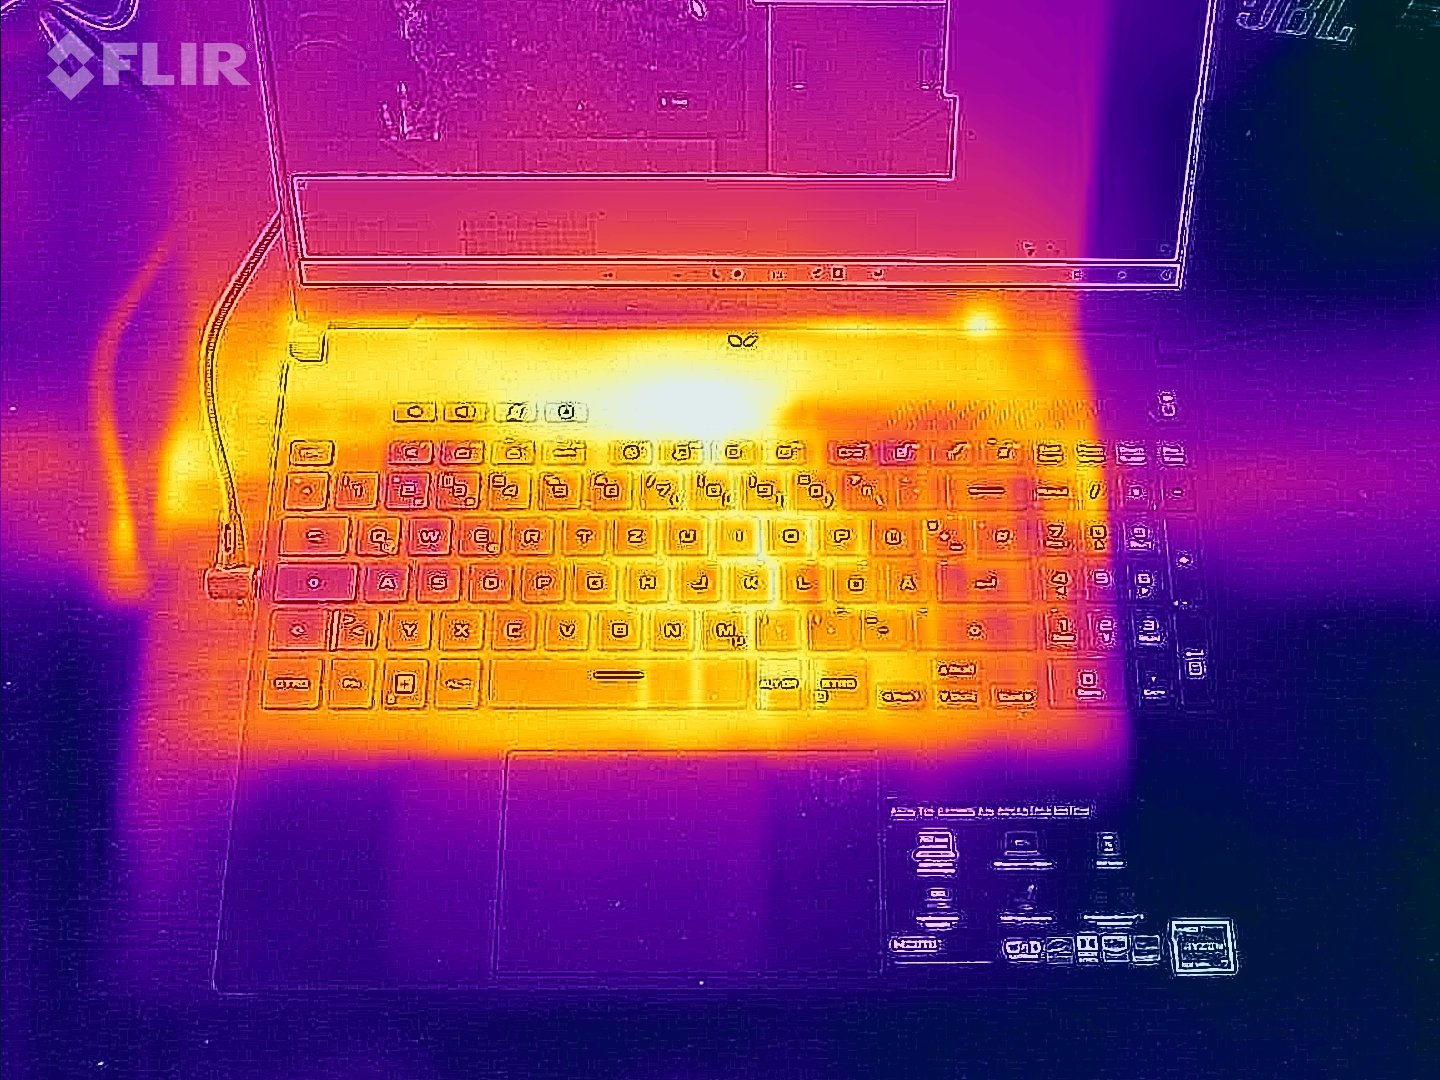
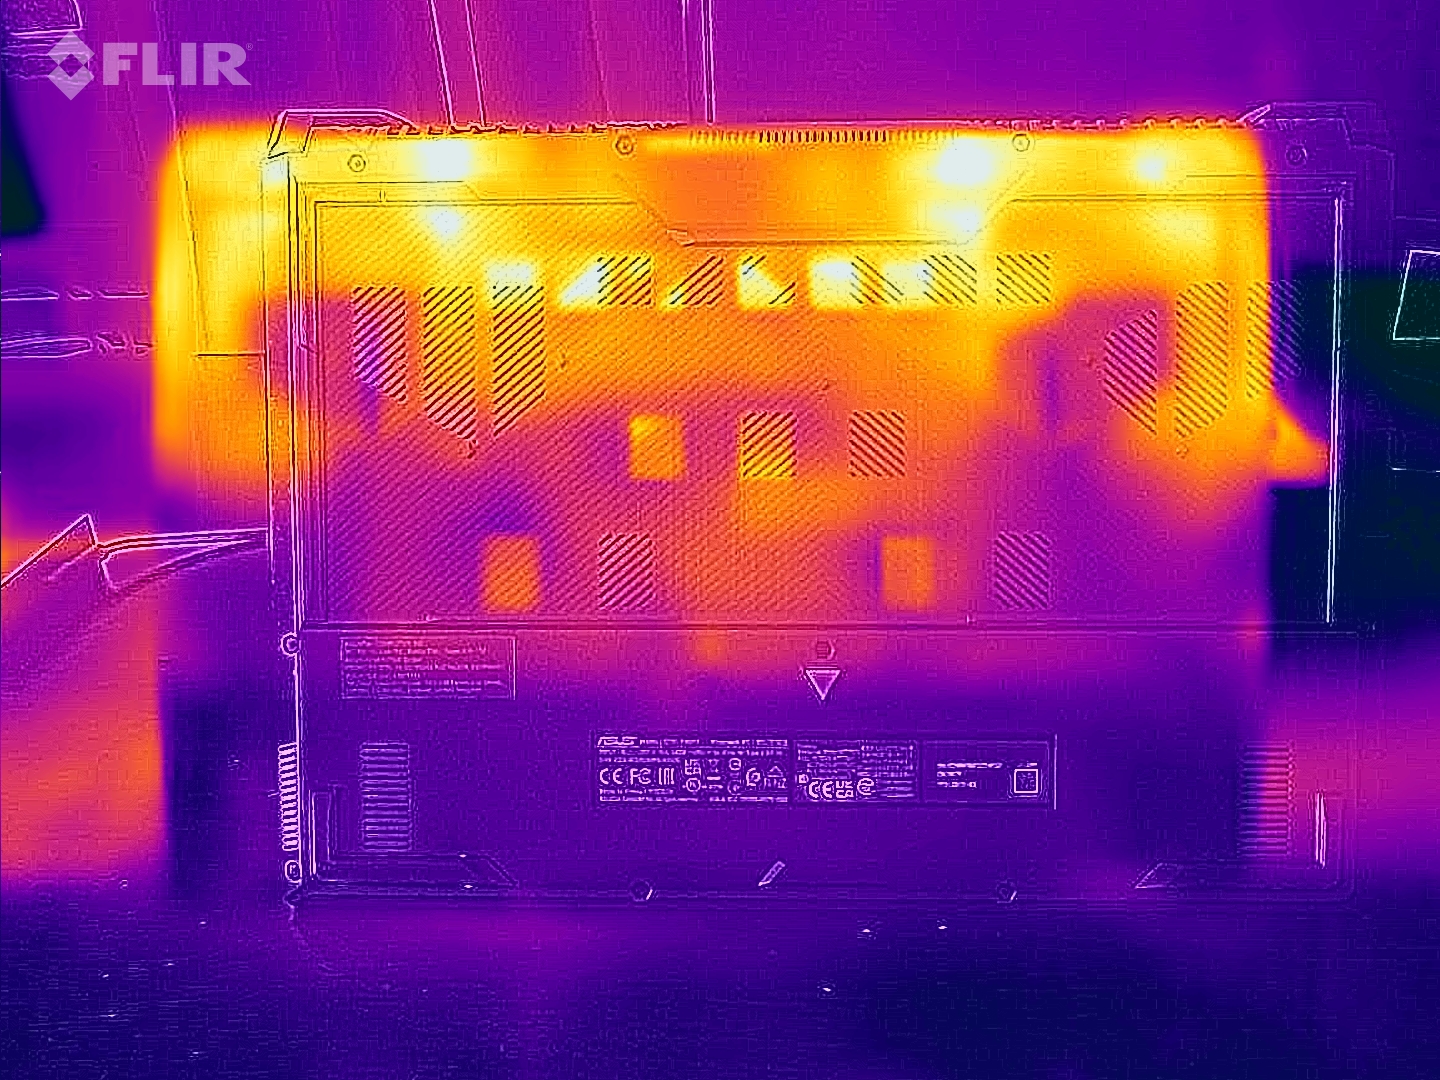
Temperature
In addition to the noise, the temperature development is also quite high. Even in idle mode, the chassis heats up to 40 °C in some places, which is the highest value in the test field. Anyone who spends a lot of time with the notebook on their lap will not be happy with the A16. Under load, the upper side also gets warmer than the class average at a maximum of 54 °C.
(-) The maximum temperature on the upper side is 54 °C / 129 F, compared to the average of 40.4 °C / 105 F, ranging from 21.2 to 68.8 °C for the class Gaming.
(-) The bottom heats up to a maximum of 47 °C / 117 F, compared to the average of 43.2 °C / 110 F
(±) In idle usage, the average temperature for the upper side is 36.3 °C / 97 F, compared to the device average of 33.9 °C / 93 F.
(-) Playing The Witcher 3, the average temperature for the upper side is 40.7 °C / 105 F, compared to the device average of 33.9 °C / 93 F.
(±) The palmrests and touchpad can get very hot to the touch with a maximum of 36 °C / 96.8 F.
(-) The average temperature of the palmrest area of similar devices was 28.8 °C / 83.8 F (-7.2 °C / -13 F).
| Asus TUF Gaming A16 FA617 R7 7735HS, Radeon RX 7600S | HP Envy 16 h0112nr i7-12700H, GeForce RTX 3060 Laptop GPU | Asus TUF Gaming F15 FX507ZM i7-12700H, GeForce RTX 3060 Laptop GPU | Asus ROG Zephyrus G14 GA402RJ R7 6800HS, Radeon RX 6700S | Lenovo Legion S7 16ARHA7 R9 6900HX, Radeon RX 6800S | |
|---|---|---|---|---|---|
| Heat | 14% | 5% | 2% | 18% | |
| Maximum Upper Side * (°C) | 54 | 45.2 16% | 44.4 18% | 53 2% | 46.6 14% |
| Maximum Bottom * (°C) | 47 | 44 6% | 48.8 -4% | 54 -15% | 50.8 -8% |
| Idle Upper Side * (°C) | 40 | 33.6 16% | 37.8 5% | 34 15% | 26.4 34% |
| Idle Bottom * (°C) | 40 | 32.6 18% | 39.6 1% | 38 5% | 27.2 32% |
* ... smaller is better
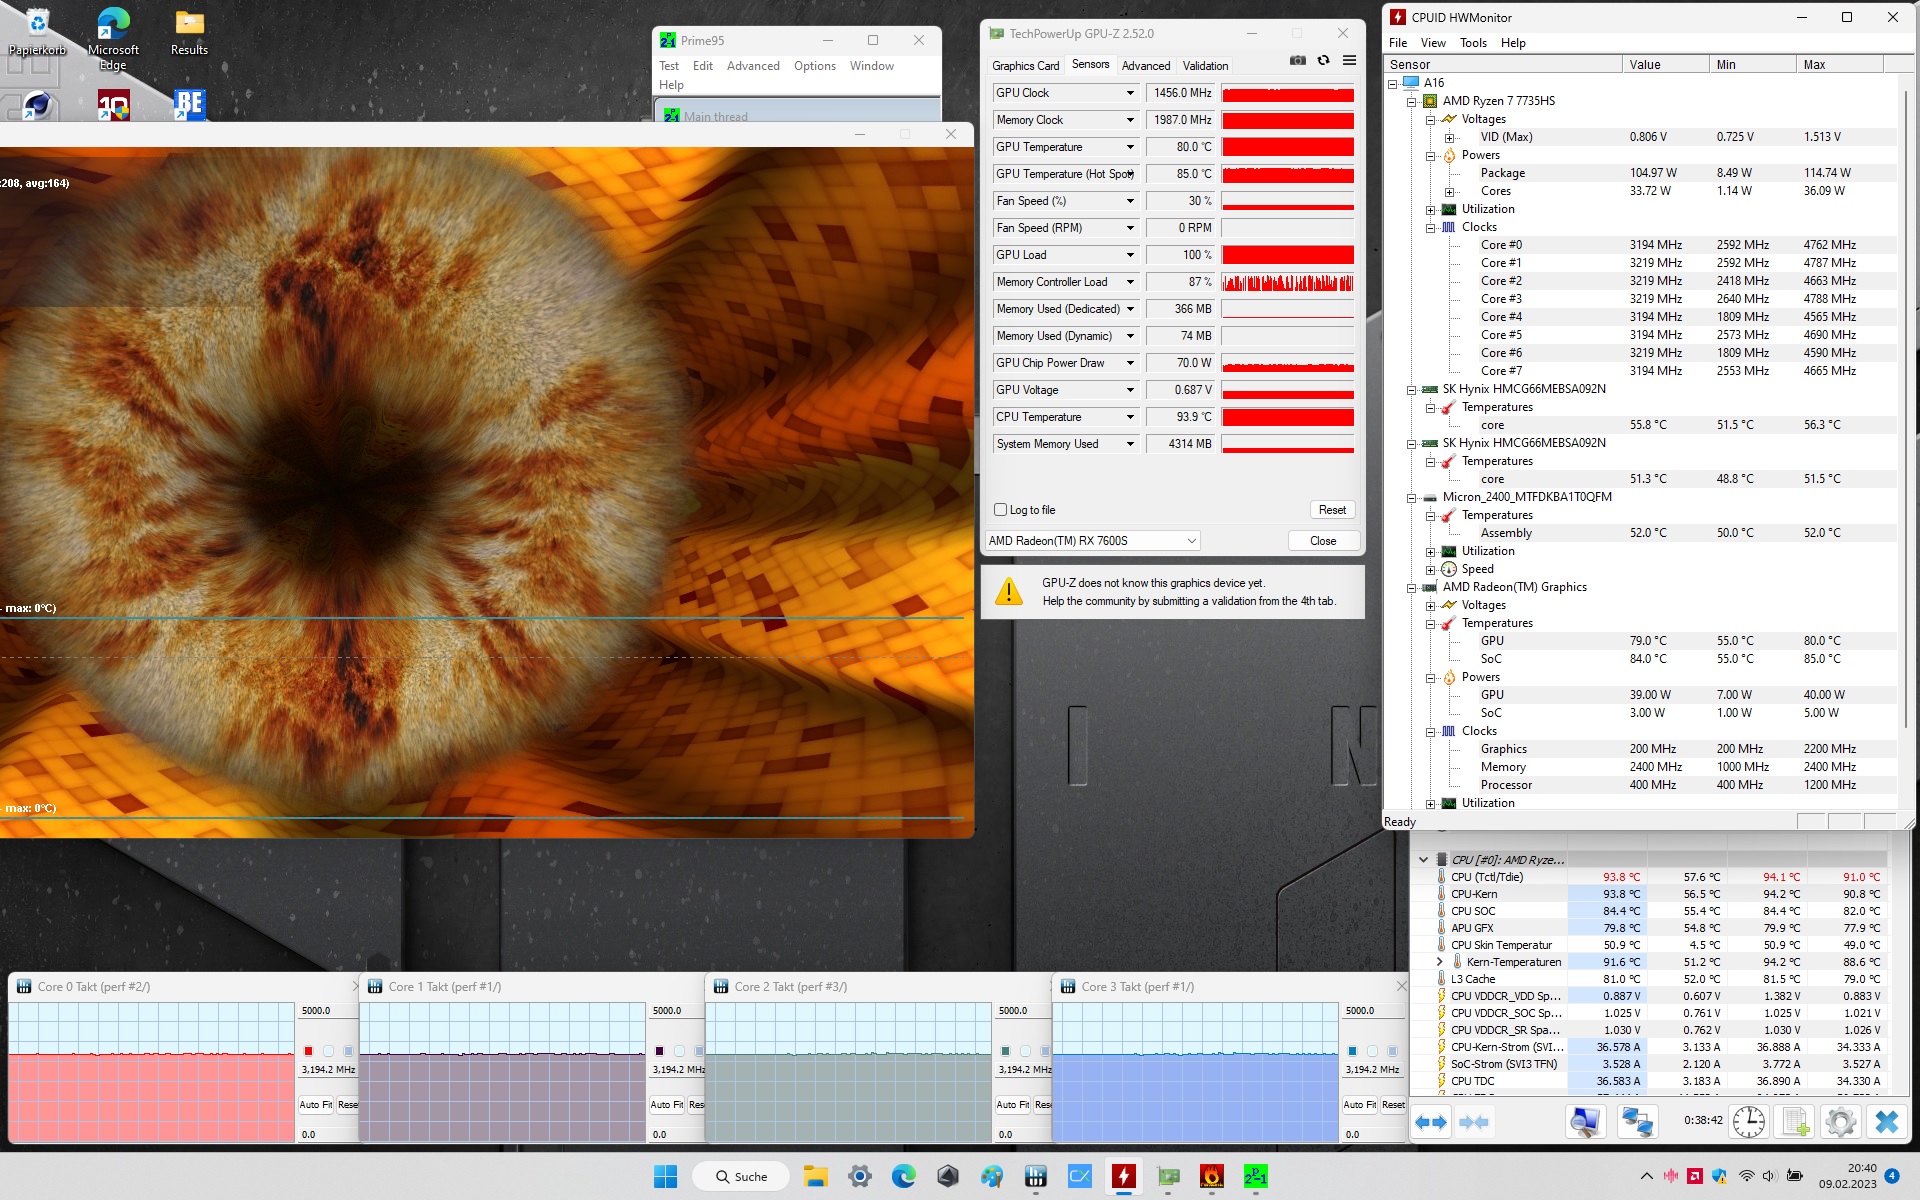
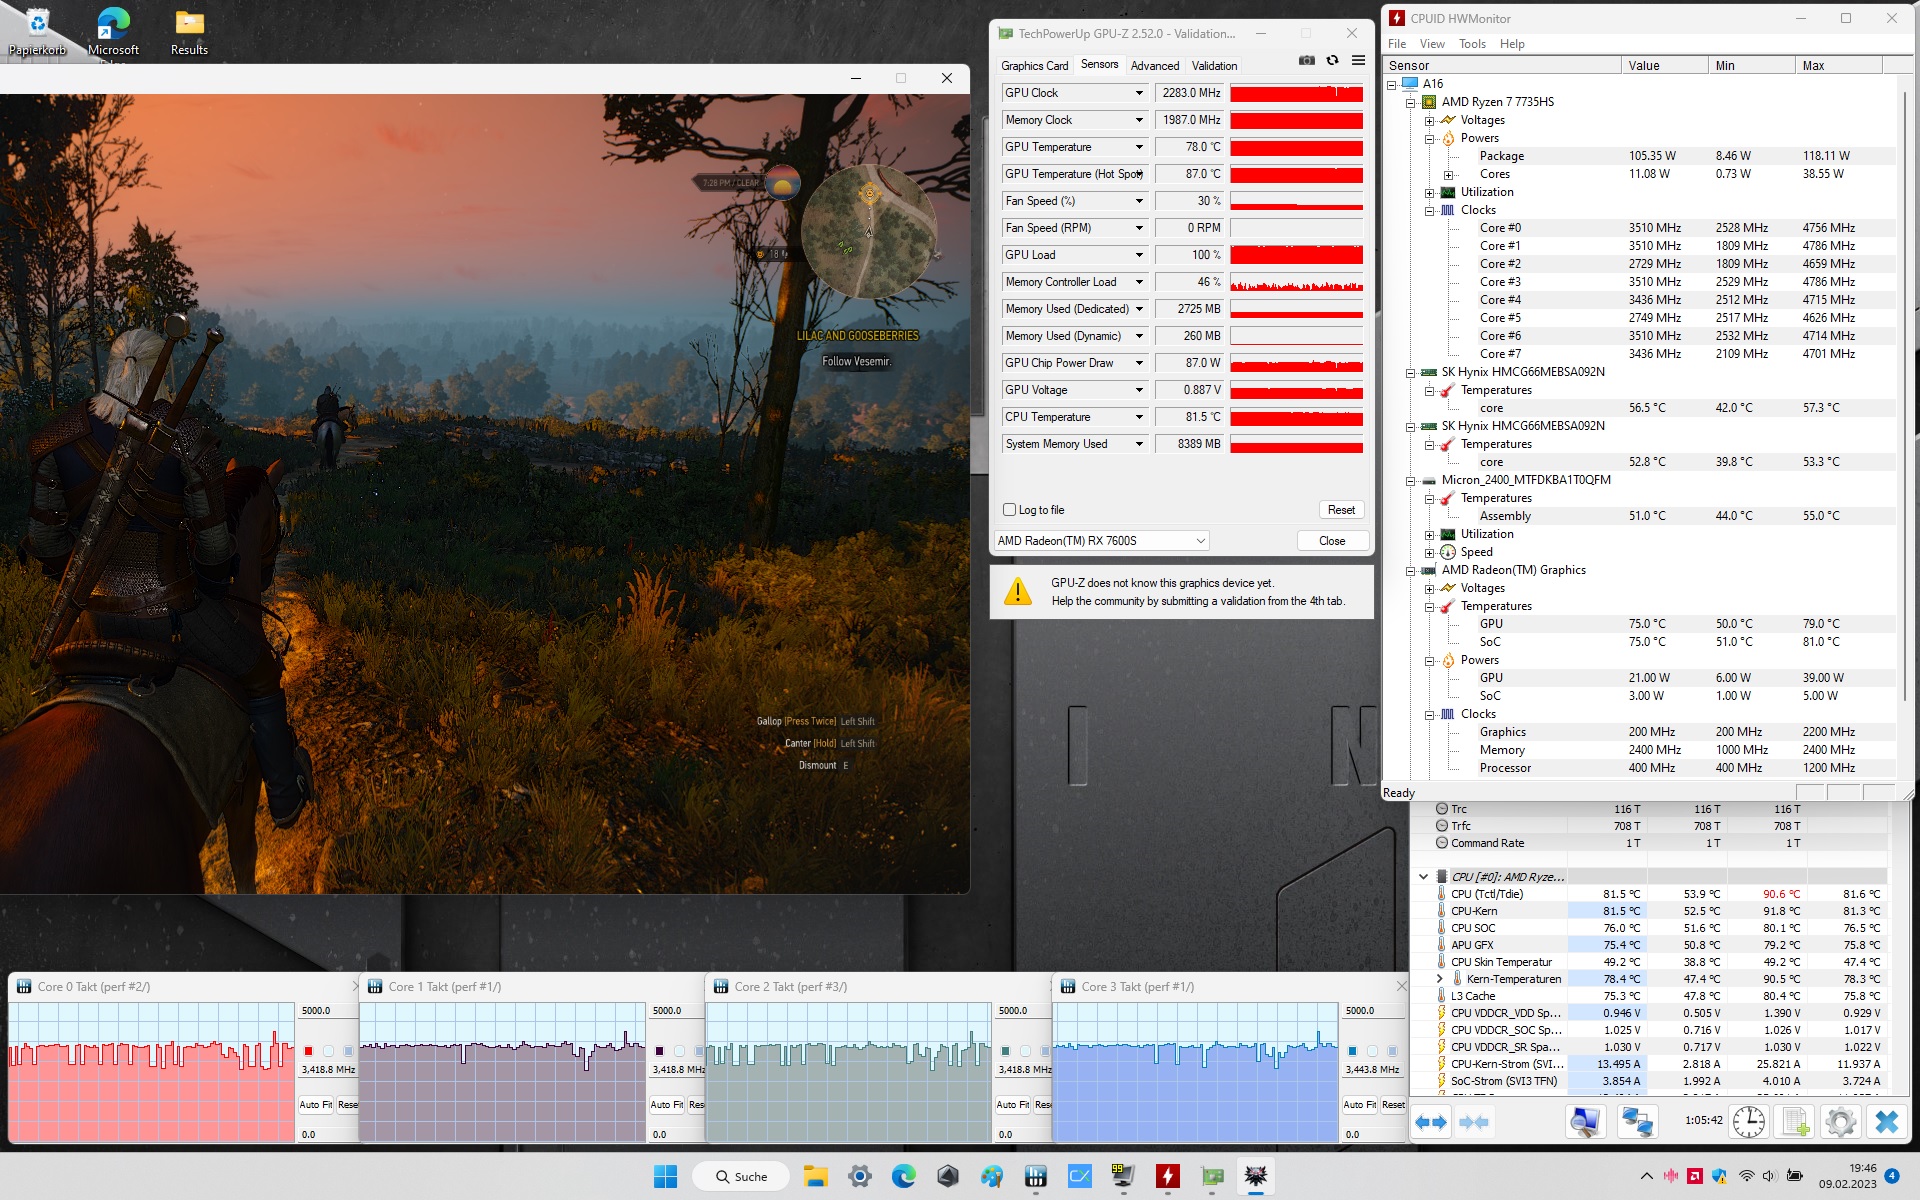
Stress Test
No wonder, since the components reach high temperatures under load. After 60 minutes of stress testing with Furmark and Prime95, the processor heated up to more than 90 °C (GPU: approx. 80 °C). In The Witcher 3, the Ryzen 7 7735HS remained only slightly cooler at around 80 °C (GPU again approx. 80 °C).
Speakers
The speakers are mediocre at best. Our audio analysis found weaknesses mostly in the intensity of the bass - most notebooks don't fare better here. At least the maximum volume of 82 dB(A) is reasonably high.
Asus TUF Gaming A16 FA617 audio analysis
(+) | speakers can play relatively loud (82 dB)
Bass 100 - 315 Hz
(±) | reduced bass - on average 14.4% lower than median
(±) | linearity of bass is average (8.3% delta to prev. frequency)
Mids 400 - 2000 Hz
(±) | higher mids - on average 6.5% higher than median
(+) | mids are linear (3.8% delta to prev. frequency)
Highs 2 - 16 kHz
(±) | reduced highs - on average 6% lower than median
(±) | linearity of highs is average (10.4% delta to prev. frequency)
Overall 100 - 16.000 Hz
(±) | linearity of overall sound is average (18.8% difference to median)
Compared to same class
» 62% of all tested devices in this class were better, 8% similar, 30% worse
» The best had a delta of 6%, average was 18%, worst was 132%
Compared to all devices tested
» 44% of all tested devices were better, 8% similar, 49% worse
» The best had a delta of 4%, average was 23%, worst was 134%
Asus TUF Gaming F15 FX507ZM audio analysis
(±) | speaker loudness is average but good (76.7 dB)
Bass 100 - 315 Hz
(±) | reduced bass - on average 13.7% lower than median
(±) | linearity of bass is average (10.1% delta to prev. frequency)
Mids 400 - 2000 Hz
(±) | higher mids - on average 5.2% higher than median
(+) | mids are linear (4.9% delta to prev. frequency)
Highs 2 - 16 kHz
(+) | balanced highs - only 4.1% away from median
(±) | linearity of highs is average (8.6% delta to prev. frequency)
Overall 100 - 16.000 Hz
(±) | linearity of overall sound is average (15.9% difference to median)
Compared to same class
» 38% of all tested devices in this class were better, 7% similar, 56% worse
» The best had a delta of 6%, average was 18%, worst was 132%
Compared to all devices tested
» 25% of all tested devices were better, 5% similar, 70% worse
» The best had a delta of 4%, average was 23%, worst was 134%
Power Management
Power Consumption
On the positive side, the A16 stands out from the competition in terms of power consumption. If you take all values together, the 16-incher is somewhat more economical than its counterparts. 8 to 16 watts of idle consumption and 97 to 168 watts of load consumption are acceptable for the performance offered. The 240-watt power supply (280 watts for more powerful configurations) is more than adequate.
| Off / Standby | |
| Idle | |
| Load |
|
Key:
min: | |
| Asus TUF Gaming A16 FA617 R7 7735HS, Radeon RX 7600S | HP Envy 16 h0112nr i7-12700H, GeForce RTX 3060 Laptop GPU | Asus TUF Gaming F15 FX507ZM i7-12700H, GeForce RTX 3060 Laptop GPU | Asus ROG Zephyrus G14 GA402RJ R7 6800HS, Radeon RX 6700S | Lenovo Legion S7 16ARHA7 R9 6900HX, Radeon RX 6800S | Average of class Gaming | |
|---|---|---|---|---|---|---|
| Power Consumption | -21% | -17% | -30% | -16% | -52% | |
| Idle Minimum * (Watt) | 8 | 10 -25% | 6.3 21% | 12 -50% | 8.8 -10% | 13.1 ? -64% |
| Idle Average * (Watt) | 11 | 10.9 1% | 9.8 11% | 18 -64% | 14.7 -34% | 19 ? -73% |
| Idle Maximum * (Watt) | 16 | 27.8 -74% | 26.5 -66% | 26 -63% | 19.8 -24% | 24.6 ? -54% |
| Load Average * (Watt) | 97 | 116.4 -20% | 103.8 -7% | 88 9% | 85.3 12% | 111.3 ? -15% |
| Witcher 3 ultra * (Watt) | 161.5 | 133.7 17% | 189 -17% | 157.7 2% | 167.5 -4% | |
| Load Maximum * (Watt) | 168 | 209.8 -25% | 241.9 -44% | 194 -15% | 230.7 -37% | 260 ? -55% |
* ... smaller is better
Power Consumption Witcher 3 / Stress test
Power Consumption with an External Monitor
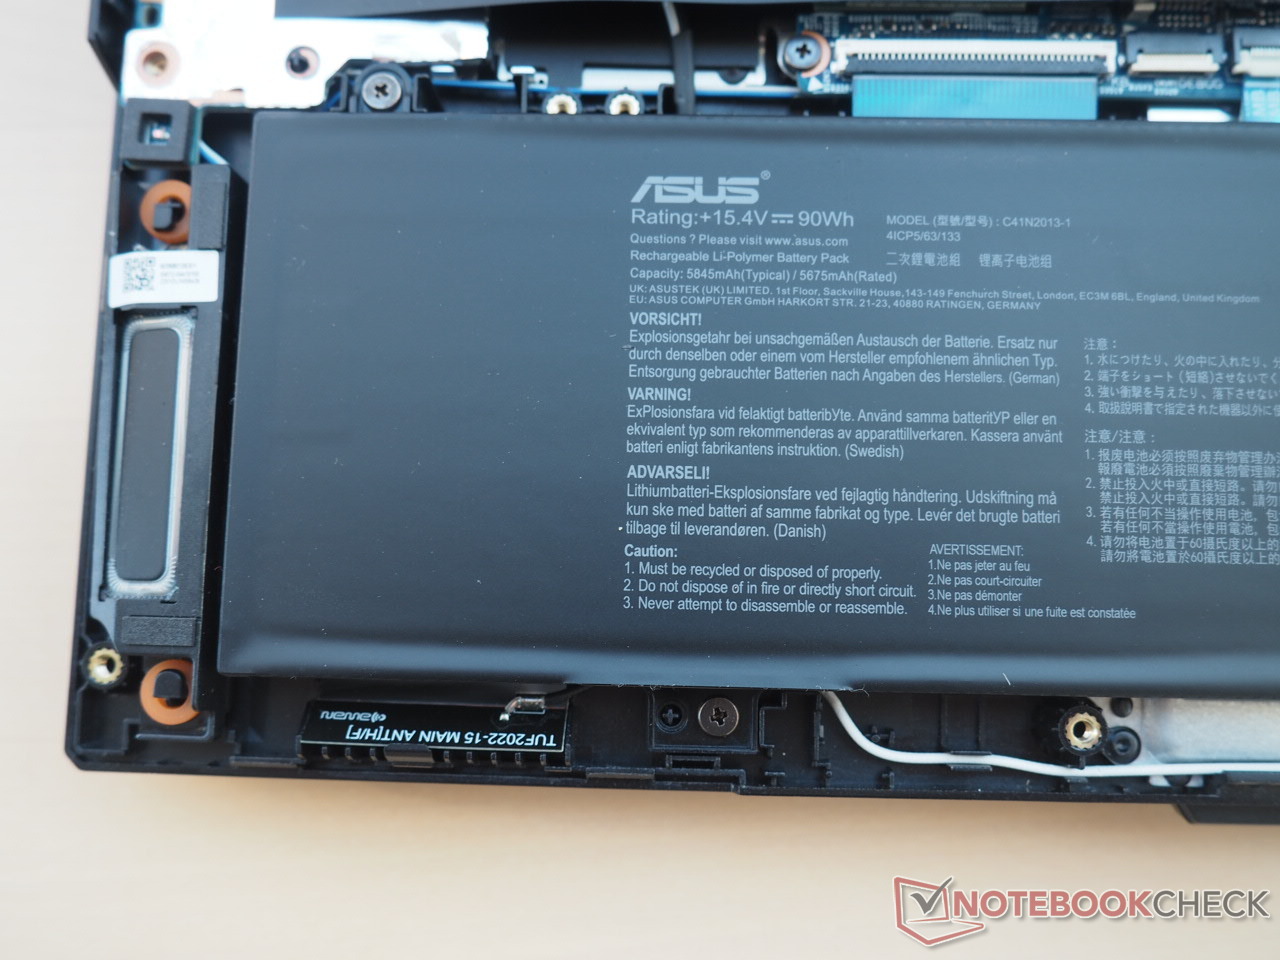
Battery Life
The biggest highlight of the TUF Gaming A16 is the ample battery life. Thanks to the powerful 90 Wh battery, the 16-incher lasts up to 20 hours under ideal conditions (no load, minimum display brightness), which is the best value in the test field. In realistic scenarios, such as internet surfing via WLAN in medium brightness, the notebook lasts around 12 hours - also very commendable (measurements in Silent mode).
| Asus TUF Gaming A16 FA617 R7 7735HS, Radeon RX 7600S, 90 Wh | HP Envy 16 h0112nr i7-12700H, GeForce RTX 3060 Laptop GPU, 83 Wh | Asus TUF Gaming F15 FX507ZM i7-12700H, GeForce RTX 3060 Laptop GPU, 90 Wh | Asus ROG Zephyrus G14 GA402RJ R7 6800HS, Radeon RX 6700S, 76 Wh | Lenovo Legion S7 16ARHA7 R9 6900HX, Radeon RX 6800S, 71 Wh | Average of class Gaming | |
|---|---|---|---|---|---|---|
| Battery runtime | -13% | -36% | -16% | -49% | -34% | |
| Reader / Idle (h) | 20.2 | 17.8 -12% | 15.8 -22% | 7.84 ? -61% | ||
| WiFi v1.3 (h) | 12.1 | 7.9 -35% | 4.8 -60% | 10.2 -16% | 6.2 -49% | 7.08 ? -41% |
| Load (h) | 1.5 | 1.6 7% | 1.1 -27% | 1.496 ? 0% |
Pros
Cons
Verdict
If steep temperature and noise development in 3D operations don't bother you, the TUF Gaming A16 FA617 is a successful mid-range gaming notebook.
The Ryzen 7 7735HS and the Radeon RX 7600S in our review configuration provide enough power for the native resolution of 1920x1200, even in modern titles. The 16-inch screen offers good contrast, clean colors and solid response times, although the brightness could be a little better.
The case is unobtrusive in appearance and boasts quite good connectivity and a great touchpad. Keyboard feedback is a little spongy, which Asus should improve in the future. The sound and webcam could also do with some optimization.
The battery life (up to 20 hours) is an absolute selling point. Hardly any other gaming notebook achieves such high results.
Overall, the laptop is good enough for a rating of 86%. As an alternative, readers should consider the 16-inch Legion S7 with a Ryzen 9 6900HX and a Radeon RX 6800S, which achieved a slightly higher rating of 89%. Meanwhile, Intel and Nvidia fans can go for the TUF Gaming F15 with its Core i7-12700H and GeForce RTX 3060 or a comparable notebook (although the successor to the RTX 3060 is already on the horizon).
Price and Availability
The Asus TUF Gaming A16 Advantage Edition FA617 does not yet appear to be available for sale in the US or anywhere else. Interested buyers should check regularly via Asus' official website for changes in availability.
Asus TUF Gaming A16 FA617
- 02/13/2023 v7 (old)
Florian Glaser
Transparency
The selection of devices to be reviewed is made by our editorial team. The test sample was provided to the author as a loan by the manufacturer or retailer for the purpose of this review. The lender had no influence on this review, nor did the manufacturer receive a copy of this review before publication. There was no obligation to publish this review. As an independent media company, Notebookcheck is not subjected to the authority of manufacturers, retailers or publishers.
This is how Notebookcheck is testing
Every year, Notebookcheck independently reviews hundreds of laptops and smartphones using standardized procedures to ensure that all results are comparable. We have continuously developed our test methods for around 20 years and set industry standards in the process. In our test labs, high-quality measuring equipment is utilized by experienced technicians and editors. These tests involve a multi-stage validation process. Our complex rating system is based on hundreds of well-founded measurements and benchmarks, which maintains objectivity. Further information on our test methods can be found here.
Price comparison

