Reviews for the AMD Ryzen 9 6900HX processor
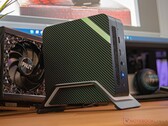
Geekom AS 6 review: The ultimate mini PC for pros and gamers with a Ryzen 9 6900HX and a Radeon 680M
The Geekom AS 6 has entered the arena as the successor to the AS 5 and this small device packs a real punch. The AMD Ryzen 9 6900HX brings the power and its strong iGPU is enough for the occasional gaming session. But that's not all - the Geekom AS 6 has lots more to offer. You can read about everything that's important in this review.
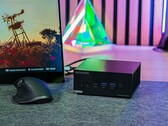
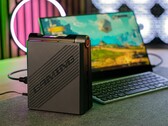
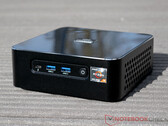
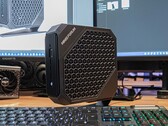
AMD Ryzen 9 6900HX, Radeon 680M, 753 gAce Magician AM08 Pro gaming mini PC with Radeon 680M and Ryzen 9 6900HX in our extensive test!
The Ace Magician AM08 Pro is the ultimate mini PC for gamers and all those who are looking for maximum performance in a very compact case. With its modern and powerful AMD Ryzen 9 6900HX processor and the AMD Radeon 680M, it offers a lot of gaming performance, while still being small enough to fit into any bag. Find out in this extensive review with numerous benchmarks what else the Ace Magician AM08 Pro has to offer.
AMD Ryzen 9 6900HX, Radeon 680M, 874 gMorefine M600 desktop PC review: Modern mini PC with AMD Ryzen 9 6900HX, 32 GB DDR5 and USB4
The Morefine M600, which has an AMD Ryzen 9 6900HX, is based on AMD's up-to-date Rembrandt SoC. We took a closer look at the model and compared its performance to its competitors, which in part feature similar hardware. The winner of the race can be found out by reading this detailed review, which features a range of benchmarks and measurements.
AMD Ryzen 9 6900HX, Radeon 680M, 779 gMinisforum Neptune Series HX99G review: Compact gaming PC with AMD Ryzen 9 6900HX and AMD Radeon RX 6600M also includes USB4 and Thunderbolt
Those who are currently looking for a compact gaming PC should definitely take a closer look at the Neptune Series HX99G from Minisforum. Find out in this review what the small desktop PC with the AMD Ryzen 9 6900HX and a dedicated AMD Radeon RX 6600M is able to do. In terms of the connections, with USB4 and Thunderbolt the most current standards are also included.
AMD Ryzen 9 6900HX, Radeon RX 6600M, 1.6 kgMinisforum Venus Series UM690 desktop review: small office PC with Ryzen 9 6900HX and USB4
Chinese system manufacturer Minisforum offers a plethora of compact desktop PCs tailored to a wide range of applications. The UM690 from the Venus series uses AMD's latest Rembrandt SoC, with support for USB4 and Thunderbolt. In this in-depth review with lots of benchmarks and measurements, we'll tell you what advantages this device offers and how it stacks up against the competition.
AMD Ryzen 9 6900HX, Radeon 680M, 621 gAlienware m17 R5 (R9 6900HX, RX 6850M XT): AMD Radeon RX 6850M XT, 17.00", 3.4 kg
Review » Alienware m17 R5 laptop review: All-AMD gamer with great potential, but driver problems
Beelink GTR6: AMD Radeon 680M, 0.8 kg
Review » Beelink GTR6 Ryzen 9 6900HX mini PC review: Faster than most Intel NUCs
Lenovo Legion S7 16ARHA7: AMD Radeon RX 6800S, 16.00", 2.2 kg
Review » No Intel or Nvidia required: Lenovo Legion Slim 7 16ARHA7 Gen 7 laptop review
Schenker XMG Neo 15 (Ryzen 9 6900HX, RTX 3070 Ti): NVIDIA GeForce RTX 3070 Ti Laptop GPU, 15.60", 2.3 kg
Review » Schenker XMG Neo 15 gaming laptop review: Ryzen 6000 with liquid cooling ports
Lenovo ThinkBook 16p G3 ARH: NVIDIA GeForce RTX 3060 Laptop GPU, 16.00", 2.1 kg
Review » Lenovo ThinkBook 16p Gen 3 ARH laptop review: The Dell XPS 15 challenger
Lenovo Legion 7 16ARHA7: AMD Radeon RX 6850M XT, 16.00", 2.6 kg
Review » Radeon RX 6850M XT performance debut: Lenovo Legion 7 16ARHA7 laptop review
Schenker XMG Neo 17 M22: NVIDIA GeForce RTX 3080 Ti Laptop GPU, 17.00", 2.8 kg
Review » Schenker XMG Neo 17 M22 in review: High performance gaming laptop with mechanical Cherry MX keys
Asus ROG Zephyrus Duo 16 GX650RX: NVIDIA GeForce RTX 3080 Ti Laptop GPU, 16.00", 2.6 kg
Review » Asus ROG Zephyrus Duo 16 review: An unusual gaming laptop with a good battery life
Razer Blade 14 Ryzen 9 6900HX: NVIDIA GeForce RTX 3070 Ti Laptop GPU, 14.00", 1.8 kg
Review » AMD Ryzen 9 6900HX debut: Razer Blade 14 laptop review
Alienware m17 R5 (R9 6900HX, RX 6850M XT): AMD Radeon RX 6850M XT, 17.00", 3.4 kg
External Review » Alienware m17 R5 (R9 6900HX, RX 6850M XT)
HP Omen 16-n0007ns: NVIDIA GeForce RTX 3070 Ti Laptop GPU, 16.10", 2.3 kg
External Review » HP Omen 16-n0007ns
HP Omen 16-n0598nd: NVIDIA GeForce RTX 3070 Ti Laptop GPU, 16.00", 2.3 kg
External Review » HP Omen 16-n0598nd
Asus VivoBook Pro 16X M7600RE: NVIDIA GeForce RTX 3050 Ti Laptop GPU, 16.00", 2 kg
External Review » Asus VivoBook Pro 16X M7600RE
Lenovo Legion S7 16ARHA7: AMD Radeon RX 6800S, 16.00", 2.2 kg
External Review » Lenovo Legion S7 16ARHA7
Lenovo ThinkBook 16p G3 ARH: NVIDIA GeForce RTX 3060 Laptop GPU, 16.00", 2.1 kg
External Review » Lenovo ThinkBook 16p G3 ARH
Asus ROG Strix G17 G713RW-LL009: NVIDIA GeForce RTX 3070 Ti Laptop GPU, 17.30", 2.8 kg
External Review » Asus ROG Strix G17 G713RW-LL009
Lenovo Legion 7 16ARHA7: AMD Radeon RX 6850M XT, 16.00", 2.6 kg
External Review » Lenovo Legion 7 16ARHA7
Alienware m17 R5, 6900HX RX 6850M XT: AMD Radeon RX 6850M XT, 17.30", 3.3 kg
External Review » Alienware m17 R5, 6900HX RX 6850M XT
Schenker XMG Neo 17 M22: NVIDIA GeForce RTX 3080 Ti Laptop GPU, 17.00", 2.8 kg
External Review » Schenker XMG Neo 17 M22
Razer Blade 14 Ryzen 9 RTX 3080 Ti: NVIDIA GeForce RTX 3080 Ti Laptop GPU, 14.00", 1.8 kg
External Review » Razer Blade 14 Ryzen 9 RTX 3080 Ti
Alienware m17 R5, 6900HX RTX 3070 Ti : NVIDIA GeForce RTX 3070 Ti Laptop GPU, 17.30", 3.3 kg
External Review » Alienware m17 R5, 6900HX RTX 3070 Ti
Razer Blade 14 Ryzen 9 6900HX: NVIDIA GeForce RTX 3070 Ti Laptop GPU, 14.00", 1.8 kg
External Review » Razer Blade 14 Ryzen 9 6900HX
Asus ROG Zephyrus Duo 16 GX650RX: NVIDIA GeForce RTX 3080 Ti Laptop GPU, 16.00", 2.6 kg
External Review » Asus ROG Zephyrus Duo 16 GX650RX
Asus ROG Strix G17 G713RW-LL103W: NVIDIA GeForce RTX 3070 Ti Laptop GPU, 17.30", 2.8 kg
External Review » Asus ROG Strix G17 G713RW-LL103W
Asus ROG Strix G15 G513RW-HQ021W: NVIDIA GeForce RTX 3070 Ti Laptop GPU, 15.60", 2.3 kg
External Review » Asus ROG Strix G15 G513RW-HQ021W
Alienware m17 R5, 6900HX RTX 3060: NVIDIA GeForce RTX 3060 Laptop GPU, 17.30", 3.3 kg
External Review » Alienware m17 R5, 6900HX RTX 3060
Lenovo Legion 7 16ARHA7: AMD Radeon RX 6850M XT, 16.00", 2.6 kg
» Highly rated Lenovo Legion 7i Gen 9 (2024) with RTX 4070 is now on sale at $500 discount
» All-AMD Lenovo Legion 7 16-inch gaming laptop with Ryzen 9, 32GB RAM and 2TB SSD is 37% off today
ACEMagician Ace Magician AM08 Pro: AMD Radeon 680M, 0.9 kg
» Chatreey AM08: Mini-PC refreshed with AMD Ryzen 9 6900HX and Ryzen 7 7735HS options
Minisforum Venus Series UM690: AMD Radeon 680M, 0.6 kg
» MINISFORUM Venus UM690: AMD Ryzen 9 6900HX mini-PC drops below US$700 with RAM and storage in new money off deal
Beelink GTR6: AMD Radeon 680M, 0.8 kg
» Beelink GTR6: AMD Ryzen 9 6900HX mini-PC reduced by over US$200 in new deal
Alienware m17 R5 (R9 6900HX, RX 6850M XT): AMD Radeon RX 6850M XT, 17.00", 3.4 kg
» All-AMD Alienware m17 R5 now 36% off in gaming laptop sale
» Alienware m17 R5 with AMD hardware reviewed: Suboptimal drivers unnecessarily slow down strong AMD gamer
Lenovo Legion 7 16ARHA7: AMD Radeon RX 6850M XT, 16.00", 2.6 kg
» Radeon RX 6850M XT is faster than many GeForce RTX 3080 Ti laptops, but power consumption can be off the charts
Asus ROG Zephyrus Duo 16 GX650RX: NVIDIA GeForce RTX 3080 Ti Laptop GPU, 16.00", 2.6 kg
» Asus ROG Zephyrus Duo 16 GX650RX: Gaming racer with two displays
Razer Blade 14 Ryzen 9 6900HX: NVIDIA GeForce RTX 3070 Ti Laptop GPU, 14.00", 1.8 kg
» AMD Ryzen 9 6900HX vs. Core i7-12800H: Intel still has the edge