Thanks to its decent cooling solution and a long-term CPU power limit of 134 W, the Alienware x17 R2 P48E is among the fastest laptops built around the 12900HK that we know of. It can be more than 40% faster in CPU-bound workloads than the slowest system featuring the same chip in our database, as of August 2023.
The integrated memory controller supports various memory types up to DDR5-4800, DDR4-3200, LPDDR5-5200, and LPDDR4x-4267. The Thread Director (in hardware) can support the operating system to decide which thread to use on the performance or efficient cores for the best performance. For AI tasks, the CPU also integrates GNA 3.0 and DL Boost (via AVX2). Quick Sync in version 8 is the same as in the Rocket Lake CPUs and supports MPEG-2, AVC, VC-1 decode, JPEG, VP8 decode, VP9, HEVC, and AV1 decode in hardware. The CPU only supports PCIe 4.0 (x8 for a GPU and two x4 for SSDs).
The integrated graphics card is based on the Xe-architecture and offers 96 EUs (Execution Units) operating at up to 1.45 GHz.
This Core i9 series chip has a "minimum assured" power consumption of 35 W, with 45 W being its Base power consumption. The maximum Intel-recommended Turbo power consumption sits at 115 W.
The i9-12900HK is manufactured on Intel's 4th generation 10 nm process marketed as Intel 7 for lower-than-average, as of mid-2023, energy efficiency.
Codename Alder Lake-H Series Intel Alder Lake-P Series: Alder Lake-P Alder Lake-H Clock Rate 1800 - 5000 MHz Level 1 Cache 1.2 MB Level 2 Cache 11.5 MB Level 3 Cache 24 MB Number of Cores / Threads 14 / 20 Power Consumption (TDP = Thermal Design Power) 45 Watt Manufacturing Technology 10 nm Max. Temperature 100 °C Socket BGA1744 Features DDR4-3200/LPDDR4x-4266/DDR5-4800/LPDDR5-5200 RAM, PCIe 4, Thr. Director, DL Boost, GNA, vPro Ess., MMX, SSE, SSE2, SSE3, SSSE3, SSE4.1, SSE4.2, AES, AVX, AVX2, FMA3, SHA GPU Intel Iris Xe Graphics G7 96EUs ( - 1450 MHz)64 Bit 64 Bit support Architecture x86 Announcement Date 01/04/2022 Product Link (external) ark.intel.com
Performance Rating - CB R15 + R20 + 7-Zip + X265 + Blender + 3DM11 CPU
Cinebench 2024 - Cinebench 2024 CPU Single Core
min: 77 avg: 98.5 median: 101.5 (1%) max: 114 Points
CPU TDP ? TDP 45 W 100% 92%
Cinebench 2024 - Cinebench 2024 CPU Multi Core
min: 708 avg: 763 median: 734 (14%) max: 876 Points
CPU TDP ? TDP 45 W 100% 83%
Cinebench R23 - Cinebench R23 Multi Core
min: 11694 avg: 16712 median: 18288 (17%) max: 19282 Points
CPU TDP ? TDP 45 W TDP 65 W TDP 86 W TDP 110 W TDP 120 W TDP 134 W 77% 74% 71% 96% 97% 100% 100%
Cinebench R23 - Cinebench R23 Single Core
min: 1266 avg: 1732 median: 1673 (68%) max: 1940 Points
Cinebench R20 - Cinebench R20 CPU (Single Core)
min: 487 avg: 657 median: 643 (70%) max: 739 Points
CPU TDP ? TDP 45 W TDP 65 W TDP 86 W TDP 110 W TDP 120 W TDP 134 W 81% 88% 83% 93% 100% 81% 99%
...
...
max:
Intel Core Ultra 7 270K Plus
Cinebench R20 - Cinebench R20 CPU (Multi Core)
min: 4842 avg: 6417 median: 6941 (17%) max: 7366 Points
CPU TDP ? TDP 45 W TDP 65 W TDP 86 W TDP 110 W TDP 120 W TDP 134 W 77% 76% 72% 96% 95% 100% 100%
Cinebench R15 - Cinebench R15 CPU Multi 64 Bit
min: 1975 avg: 2580 median: 2786 (18%) max: 2944 Points
CPU TDP ? TDP 45 W TDP 65 W TDP 86 W TDP 110 W TDP 120 W TDP 134 W 72% 77% 68% 95% 100% 98% 100%
0 60 120 180 240 300 360 420 480 540 600 660 720 780 840 900 960 1020 1080 1140 1200 1260 1320 1380 1440 1500 1560 1620 1680 1740 1800 1860 1920 1980 2040 2100 2160 2220 2280 2340 2400 2460 2520 2580 2640 2700 2760 2820 2880 2940 Tooltip Medion Erazer Beast X30 Office Mode: Ø959 (921.02-965.69)
Gigabyte Aero 16 YE5 Silence Mode: Ø730 (712.31-1010.15)
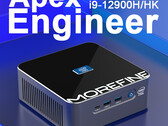
Morefine S600-Apex Engineer: Ø1986 (1882.53-2086.59)
Minisforum Venus Series NAB9: Ø1981 (1895.47-2262.7)
MSI Raider GE66 12UHS: Ø2467 (2423.65-2668.98)
Gigabyte Aero 16 YE5: Ø2616 (2562.79-2779.9)
Gigabyte Aero 16 YE5 Turbo Mode: Ø2627 (2586.15-2785.9)
Medion Erazer Beast X30 Turbo Mode: Ø2756 (2735.6-2835.67)
Medion Erazer Beast X30: Ø2761 (2697.24-2854.49)
MSI GE76 Raider: Ø2722 (2660.99-2908.88)
Alienware x17 R2 P48E: Ø2889 (2849.61-2917.79)
Medion Erazer Beast X30 PL 140W: Ø2814 (2658.87-2943.56)
Cinebench R15 - Cinebench R15 CPU Single 64 Bit
min: 185 avg: 249.3 median: 242 (67%) max: 279 Points
CPU TDP ? TDP 45 W TDP 65 W TDP 86 W TDP 110 W TDP 120 W TDP 134 W 79% 86% 81% 100% 99% 86% 97%
Cinebench R11.5 - Cinebench R11.5 CPU Multi 64 Bit
min: 23.44 avg: 26.5 median: 25.2 (31%) max: 33 Points
CPU TDP 45 W TDP 65 W TDP 110 W 77% 71% 100%
...
...
max:
Intel Core Ultra 7 270K Plus
Cinebench R11.5 - Cinebench R11.5 CPU Single 64 Bit
min: 2.22 avg: 2.9 median: 2.8 (67%) max: 3.28 Points
CPU TDP 45 W TDP 65 W TDP 110 W 84% 82% 100%
Cinebench R10 - Cinebench R10 Rend. Single (32bit)
min: 6388 avg: 8158 median: 7884 (48%) max: 9412 points
CPU TDP 45 W TDP 65 W TDP 110 W 84% 82% 100%
AMD Geode LX 800
...
...
max:
Cinebench R10 - Cinebench R10 Rend. Multi (32bit)
min: 42338 avg: 48599 median: 48838 (35%) max: 57202 points
CPU TDP 45 W TDP 65 W TDP 110 W 80% 85% 100%
Cinebench R10 - Cinebench R10 Rend. Multi (64bit)
min: 66662 avg: 71594 median: 71882.5 (45%) max: 75947 Points
CPU TDP 45 W TDP 65 W 94% 100%
...
...
max:
Intel Core Ultra 7 270K Plus
Cinebench R10 - Cinebench R10 Rend. Single (64bit)
min: 10299 avg: 12716 median: 12631.5 (15%) max: 15303 Points
CPU TDP 45 W TDP 65 W 100% 96%
...
...
max:
Intel Core Ultra 7 270K Plus
wPrime 2.10 - wPrime 2.0 1024m *
min: 186.394 avg: 317.5 median: 225.7 (3%) max: 632.336 s
CPU TDP 45 W TDP 65 W 100% 102%
wPrime 2.10 - wPrime 2.0 32m *
min: 3.375 avg: 3.8 median: 3.8 (1%) max: 4.209 s
CPU TDP 45 W TDP 65 W 100% 100%
WinRAR - WinRAR 4.0
min: 7387 avg: 8097 median: 7402 (12%) max: 9573 points
CPU TDP 45 W TDP 65 W TDP 110 W 82% 77% 100%
7-Zip 18.03 - 7-Zip 18.03 Multi Thread 4 runs
min: 51249 avg: 65829 median: 69146 (40%) max: 75564 MIPS
CPU TDP ? TDP 45 W TDP 65 W TDP 86 W TDP 110 W TDP 120 W TDP 134 W 82% 78% 77% 93% 99% 100% 94%
7-Zip 18.03 - 7-Zip 18.03 Single Thread 4 runs
min: 4240 avg: 5592 median: 5442 (62%) max: 6186 MIPS
CPU TDP ? TDP 45 W TDP 65 W TDP 86 W TDP 110 W TDP 120 W TDP 134 W 82% 88% 86% 100% 99% 85% 94%
...
...
max:
AMD Ryzen 7 9850X3D
X264 HD Benchmark 4.0 - x264 Pass 2
min: 109.9 avg: 126.4 median: 123.9 (3%) max: 159.6 fps
CPU TDP 45 W TDP 65 W TDP 110 W 75% 71% 100%
X264 HD Benchmark 4.0 - x264 Pass 1
min: 250 avg: 281.4 median: 276 (7%) max: 317.5 fps
CPU TDP 45 W TDP 65 W TDP 110 W 92% 92% 100%
HWBOT x265 Benchmark v2.2 - HWBOT x265 4k Preset
min: 13.6 avg: 18.5 median: 19.9 (35%) max: 21.6 fps
CPU TDP ? TDP 45 W TDP 65 W TDP 86 W TDP 110 W TDP 120 W TDP 134 W 77% 74% 73% 85% 93% 96% 100%
0 5 10 15 20 25 30 35 Tooltip Gigabyte Aero 16 YE5 Silence Mode: Ø6.36 (0.74-17.3)
Medion Erazer Beast X30 Office Mode: Ø14 (1.32-23)
Alliwava GH9, i9-12900HK: Ø12.7 (0.15-13.6)
BMAX B9 Power: Ø15.8 (1.11-24.2)
Morefine S600-Apex Engineer: Ø16.8 (1.42-28.2)
Minisforum Venus Series NAB9: Ø17.2 (1.28-26.8)
Gigabyte Aero 16 YE5: Ø19.7 (1.6-32.2)
MSI Raider GE66 12UHS: Ø19.2 (1.66-32.3)
MSI GE76 Raider: Ø20.8 (2.26-35.3)
Medion Erazer Beast X30: Ø21 (1.47-33.2)
Medion Erazer Beast X30 Turbo Mode: Ø21.2 (1.51-33.5)
Gigabyte Aero 16 YE5 Turbo Mode: Ø22 (1.64-34.4)
Alienware x17 R2 P48E: Ø22.1 (1.56-33.8)
Medion Erazer Beast X30 PL 140W: Ø22.2 (1.53-33.7)
TrueCrypt - TrueCrypt Serpent
min: 1.1 avg: 1.2 median: 1.2 (35%) max: 1.5 GB/s
CPU TDP 45 W TDP 65 W TDP 110 W 76% 87% 100%
TrueCrypt - TrueCrypt Twofish
min: 1.8 avg: 2.2 median: 2.2 (38%) max: 2.6 GB/s
CPU TDP 45 W TDP 65 W TDP 110 W 77% 88% 100%
TrueCrypt - TrueCrypt AES
min: 12.2 avg: 13.6 median: 13 (34%) max: 16.3 GB/s
CPU TDP 45 W TDP 65 W TDP 110 W 77% 87% 100%
Blender - Blender 3.3 Classroom CPU *
min: 413 avg: 439.3 median: 430 (5%) max: 475 Seconds
Blender - Blender 2.79 BMW27 CPU *
min: 172.5 avg: 203.5 median: 185 (1%) max: 266 Seconds
CPU TDP ? TDP 45 W TDP 65 W TDP 86 W TDP 110 W TDP 120 W TDP 134 W 100% 100% 100% 100% 101% 101% 101%
R Benchmark 2.5 - R Benchmark 2.5 *
min: 0.4155 avg: 0.5 median: 0.5 (10%) max: 0.637 sec
CPU TDP ? TDP 45 W TDP 65 W TDP 86 W TDP 110 W TDP 120 W TDP 134 W 100% 102% 102% 104% 104% 102% 104%
3DMark 06 - CPU - 3DMark 06 - CPU
min: 11679 avg: 14567 median: 14439 (24%) max: 16864 Points
CPU TDP 45 W TDP 65 W TDP 86 W TDP 110 W 77% 78% 100% 99%
VIA C7-M C7-M-1200
...
...
max:
Super Pi mod 1.5 XS 1M - Super Pi mod 1.5 XS 1M *
min: 7.281 avg: 8.4 median: 8.1 (2%) max: 10.896 s
CPU TDP 45 W TDP 65 W TDP 110 W 100% 100% 100%
Super Pi mod 1.5 XS 2M - Super Pi mod 1.5 XS 2M *
min: 16.1 avg: 18.8 median: 18.1 (1%) max: 24.152 s
CPU TDP 45 W TDP 65 W TDP 110 W 100% 100% 100%
Super Pi Mod 1.5 XS 32M - Super Pi mod 1.5 XS 32M *
min: 383.9 avg: 405.7 median: 397.4 (2%) max: 435.936 s
CPU TDP 45 W TDP 65 W TDP 110 W 100% 100% 100%
3DMark Vantage - 3DM Vant. Perf. CPU no Physx
min: 59631 avg: 64239 median: 59969 (44%) max: 77386 Points
CPU TDP 45 W TDP 65 W TDP 110 W 77% 77% 100%
...
...
max:
Intel Core Ultra 7 270K Plus
3DMark 11 - 3DM11 Performance Physics
min: 16492 avg: 21190 median: 21008 (52%) max: 25556 Points
CPU TDP ? TDP 45 W TDP 65 W TDP 86 W TDP 110 W TDP 120 W TDP 134 W 73% 76% 70% 98% 94% 84% 100%
3DMark - 3DMark Ice Storm Physics
min: 64571 avg: 76919 median: 73220.5 (59%) max: 96663 Points
CPU TDP 45 W TDP 65 W 100% 82%
3DMark - 3DMark Ice Storm Extreme Physics
min: 63938 avg: 77709 median: 74583.5 (61%) max: 97730 Points
CPU TDP 45 W TDP 65 W 100% 80%
3DMark - 3DMark Ice Storm Unlimited Physics
min: 66915 avg: 86516 median: 88770 (71%) max: 102779 Points
CPU TDP 45 W TDP 65 W TDP 86 W TDP 120 W 94% 80% 100% 88%
...
...
max:
Intel Core Ultra 5 250K Plus
3DMark - 3DMark Cloud Gate Physics
min: 14717 avg: 17828 median: 17626.5 (45%) max: 21231 Points
CPU TDP 45 W TDP 65 W TDP 86 W TDP 110 W TDP 120 W TDP 134 W 80% 76% 92% 94% 83% 100%
...
...
max:
Intel Core Ultra 7 270K Plus
3DMark - 3DMark Fire Strike Standard Physics
min: 21092 avg: 26767 median: 27257 (49%) max: 31045 Points
CPU TDP ? TDP 45 W TDP 65 W TDP 86 W TDP 110 W TDP 120 W TDP 134 W 73% 77% 75% 94% 100% 86% 97%
...
...
max:
Intel Core Ultra 7 270K Plus
3DMark - 3DMark Time Spy CPU
min: 9145 avg: 11773 median: 11928.5 (50%) max: 14252 Points
CPU TDP ? TDP 45 W TDP 65 W TDP 86 W TDP 110 W TDP 120 W TDP 134 W 69% 75% 66% 90% 98% 82% 100%
...
...
max:
Intel Core Ultra 7 270K Plus
Geekbench 6.6 - Geekbench 6.6 Single-Core
min: 1797 avg: 2237 median: 2304 (53%) max: 2611 points
Geekbench 6.6 - Geekbench 6.6 Multi-Core
min: 9804 avg: 10270 median: 10285 (35%) max: 10721 points
Geekbench 6.0 - Geekbench 6.0 Single-Core
min: 1705 avg: 2131 median: 2161.5 (68%) max: 2494 points
CPU TDP ? TDP 45 W 100% 97%
...
...
max:
Intel Core Ultra 7 270K Plus
Geekbench 6.0 - Geekbench 6.0 Multi-Core
min: 9067 avg: 10336 median: 10115 (42%) max: 12046 points
CPU TDP ? TDP 45 W 100% 81%
Geekbench 5.5 - Geekbench 5.1 - 5.5 64 Bit Single-Core
min: 1298 avg: 1732 median: 1774.5 (60%) max: 1918 points
CPU TDP ? TDP 45 W TDP 86 W TDP 110 W TDP 120 W TDP 134 W 80% 87% 97% 100% 83% 98%
Geekbench 5.5 - Geekbench 5.1 - 5.5 64 Bit Multi-Core
min: 9969 avg: 12547 median: 13333 (24%) max: 14294 points
CPU TDP ? TDP 45 W TDP 86 W TDP 110 W TDP 120 W TDP 134 W 76% 80% 100% 98% 91% 99%
Geekbench 5.0 - Geekbench 5.0 64 Bit Single-Core
min: 1257 avg: 1674 median: 1795 (8%) max: 1859 points
CPU TDP 45 W TDP 86 W TDP 134 W 84% 100% 99%
...
...
max:
AMD Ryzen 7 9850X3D
Geekbench 5.0 - Geekbench 5.0 64 Bit Multi-Core
min: 9934 avg: 11502 median: 10276 (32%) max: 13757 points
CPU TDP 45 W TDP 86 W TDP 134 W 73% 100% 98%
Geekbench 4.4 - Geekbench 4.1 - 4.4 64 Bit Single-Core
min: 5823 avg: 7378 median: 7925 (72%) max: 8015 points
CPU TDP 45 W TDP 86 W TDP 110 W 87% 99% 100%
Geekbench 4.4 - Geekbench 4.1 - 4.4 64 Bit Multi-Core
min: 38751 avg: 43856 median: 39617 (38%) max: 51184 points
CPU TDP 45 W TDP 86 W TDP 110 W 77% 98% 100%
...
...
max:
Intel Core Ultra 7 270K Plus
Mozilla Kraken 1.1 - Kraken 1.1 Total Score *
min: 490 avg: 548 median: 520 (1%) max: 737 ms
Sunspider - Sunspider 1.0 Total Score *
min: 102.4 avg: 107.1 median: 107.1 (1%) max: 111.7 ms
Octane V2 - Octane V2 Total Score
WebXPRT 4 - WebXPRT 4 Score
min: 191.4 avg: 237.4 median: 244.5 (61%) max: 269 Points
CPU TDP 45 W TDP 65 W 94% 100%
WebXPRT 3 - WebXPRT 3 Score
min: 216 avg: 287.8 median: 293 (49%) max: 331 Points
PCMark for Android - PCM f. Android Storage 2.0 random write internal
PCMark for Android - PCM f. Android Storage 2.0 seq write internal
PCMark for Android - PCM f. Android Storage 2.0 random read internal
PCMark for Android - PCM f. Android Storage 2.0 seq read internal
PCMark for Android - PCM f. Android Work Score 3.0
CrossMark - CrossMark Overall
min: 1418 avg: 1841 median: 1853.5 (65%) max: 2138 Points
CPU TDP ? TDP 45 W TDP 65 W TDP 86 W TDP 120 W TDP 134 W 74% 80% 85% 100% 82% 90%
Power Consumption - Prime95 Power Consumption - external Monitor *
min: 66.1 avg: 109.7 median: 114 (20%) max: 174.7 Watt
CPU TDP 45 W TDP 65 W TDP 86 W TDP 110 W TDP 120 W TDP 134 W 124% 122% 112% 115% 113% 100%
0 5 10 15 20 25 30 35 40 45 50 55 60 65 70 75 80 85 90 95 100 105 110 115 120 125 130 135 140 145 150 155 160 165 170 175 180 185 190 195 Tooltip Alliwava GH9, i9-12900HK: Ø66.1 (53.4-84.2)
Minisforum Venus Series NAB9: Ø82.3 (73.7-104.6)
Morefine S600-Apex Engineer: Ø83.8 (79.6-88.5)
MSI Raider GE66 12UHS: Ø87 (78.2-92.6)
MSI GE76 Raider: Ø113.6 (107-119)
Medion Erazer Beast X30: Ø121 (89.1-131)
Gigabyte Aero 16 YE5: Ø126.2 (124-134)
Alienware x17 R2 P48E: Ø174.7 (172.2-196.1)
Power Consumption - Cinebench R15 Multi Power Consumption - external Monitor *
min: 67.1 avg: 121.5 median: 134 (24%) max: 166 Watt
CPU TDP 45 W TDP 65 W TDP 86 W TDP 110 W TDP 120 W TDP 134 W 120% 123% 106% 108% 100% 100%
0 5 10 15 20 25 30 35 40 45 50 55 60 65 70 75 80 85 90 95 100 105 110 115 120 125 130 135 140 145 150 155 160 165 170 175 180 Tooltip Alliwava GH9, i9-12900HK: Ø67.1 (63.2-72.5)
Morefine S600-Apex Engineer: Ø77.7 (75.1-84.3)
Minisforum Venus Series NAB9: Ø97.2 (95-98.2)
MSI Raider GE66 12UHS: Ø106.1 (102-113)
MSI GE76 Raider: Ø133.5 (128-145)
Gigabyte Aero 16 YE5: Ø142.6 (139-150)
Alienware x17 R2 P48E: Ø165.5 (135.7-170.9)
Medion Erazer Beast X30: Ø166.3 (156-183)
Power Consumption - Idle Power Consumption - external Monitor *
min: 11.3 avg: 29.2 median: 13.2 (9%) max: 63 Watt
CPU TDP 45 W TDP 65 W 158% 100%
0 5 10 15 20 25 30 35 40 45 50 55 60 65 70 Tooltip Alliwava GH9, i9-12900HK: Ø11.3 (10.6-13.1)
Minisforum Venus Series NAB9: Ø13.2 (12-14.1)
Morefine S600-Apex Engineer: Ø63 (50.1-72.9)
Power Consumption - Power Efficiency - Cinebench R15 Multi external Monitor
min: 17.2 avg: 22.1 median: 21.7 (16%) max: 30.2 Points per Watt
CPU TDP 45 W TDP 65 W TDP 86 W TDP 110 W TDP 120 W TDP 134 W 100% 97% 74% 83% 66% 67%
- Range of benchmark values
- Average benchmark values
* Smaller numbers mean a higher performance
log 24. 20:39:21
#0 ran 0s before starting gpusingle class +0s ... 0s
#1 no ids found in url (should be separated by "_") +0s ... 0s
#2 not redirecting to Ajax server +0s ... 0s
#3 did not recreate cache, as it is less than 5 days old! Created at Fri, 22 May 2026 05:29:17 +0200 +0.003s ... 0.003s
#4 composed specs +0.037s ... 0.04s
#5 did output specs +0s ... 0.04s
#6 getting avg benchmarks for device 14041 +0.028s ... 0.069s
#7 got single benchmarks 14041 +0.033s ... 0.102s
#8 got avg benchmarks for devices +0s ... 0.102s
#9 min, max, avg, median took s +2.805s ... 2.907s
#10 return log +0.681s ... 3.587s