Reviews for the AMD Ryzen AI 7 350 processor
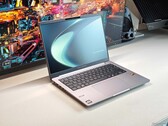
Maximum gaming experience on an 18-incher? Acer Nitro 18 AI gaming laptop review
While there are many gaming notebooks in the 15- to 17-inch range, the offerings in the massive 18-inch segment are rather limited. With the Nitro 18 AI, Acer is trying to take on the competition from Asus and MSI. How does the comparison turn out?
AMD Ryzen AI 7 350, NVIDIA GeForce RTX 5070 Laptop, 18", 3 kgAsus ExpertBook PM3 Review: Office laptop with AMD, long battery life, and Copilot+
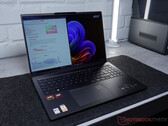
The Asus ExpertBook PM3 is an affordable office laptop with a fast AMD Ryzen processor and advanced AI functions. Many aspects were convincing in the test, but you shouldn't expect too much from the matte IPS display.
AMD Ryzen AI 7 350, Radeon 860M, 14", 1.4 kgHP OmniBook 7 Aero 13 review: World's lightest 13-inch laptop with over 40 TOPS NPU
The OmniBook 7 Aero 13 is an almost ideal subnotebook for constant travelers who want to carry as light as possible without sacrificing too much in terms of performance or quality. The AMD Zen 5 CPU in particular is excellent considering the size and weight of the system.
AMD Ryzen AI 7 350, Radeon 860M, 13.3", 1 kgSolid performance and colorful OLED: Acer Swift Go 16 AI review
The Acer Swift Go AI offers a good balance between performance and portability. With its OLED display, strong AMD Ryzen AI processor, and long battery life, it's well-suited for on-the-go use. Despite some limitations, it remains a compelling laptop, especially at the current price point under 1,000 euros.
AMD Ryzen AI 7 350, Radeon 860M, 16", 1.5 kgHP Omen 17z gaming laptop review: Hot performer with cool temperatures
The design may not be new, but its balanced specifications and relatively cool core temperatures when gaming give the Omen 17z a leg up against other midrange gaming machines.
AMD Ryzen AI 7 350, NVIDIA GeForce RTX 5070 Laptop, 17.3", 2.9 kgAsus ZenBook 14 OLED UM3406K, Ryzen AI 7 350: AMD Radeon 860M, 14.00", 1.2 kg
Review » AMD subnotebook in a tight three-way battle – Asus ZenBook 14 OLED UM3406K Review
Schenker XMG Core 15 (M25): NVIDIA GeForce RTX 5060 Laptop, 15.30", 1.9 kg
Review » German competitor to the Legion 5: XMG Core 15 (M25) gaming laptop review
Asus ExpertCenter PN54-S70012NN: AMD Radeon 860M, 0.7 kg
Review » Asus ExpertCenter PN54 - Business mini PC with AMD Ryzen AI 7 and modern features in the review
Dell 14 Plus 2-in-1: AMD Radeon 860M, 14.00", 1.6 kg
Review » Dell 14 Plus 2-in-1 convertible review: AMD offers key advantage over Intel
Gigabyte Aero X16 1WH: NVIDIA GeForce RTX 5070 Laptop, 16.00", 2 kg
Review » Gigabyte Aero X16 Review: Sleek AMD Zen 5 gaming machine with Nvidia RTX 5070 Laptop and upgradeable RAM
MSI Stealth A16 5060 Engineering Sample: NVIDIA GeForce RTX 5060 Laptop, 16.00"
Review » Nvidia GeForce RTX 5060 Laptop Performance Preview - Almost at the level of the RTX 5070 Laptop
Lenovo Yoga Slim 7 14AKP G10: AMD Radeon 860M, 14.00", 1.2 kg
Review » Brilliant 1,100-nit OLED, but unexpected quality issues - Lenovo Yoga Slim 7 14 G10 review
Lenovo IdeaPad 5 2-in-1 14AKP10 83KT0033GE: AMD Radeon 860M, 14.00", 1.5 kg
Review » Strong AMD Zen5 CPU with pen and OLED for a low price: Lenovo IdeaPad 5 2-in-1 14AKP10 laptop review
Gigabyte Aero X16 1WH: NVIDIA GeForce RTX 5070 Laptop, 16.00", 2 kg
Review » GeForce RTX 5070 Ti Laptop vs. RTX 5070 Laptop - The successors to the RTX 4070 Laptop in review
Lenovo Yoga Pro 7 14AKP G10: AMD Radeon 860M, 14.50", 1.6 kg
Review » 90 Hz OLED with AdobeRGB - Lenovo Yoga Pro 7 14 G10 laptop review
Lenovo IdeaPad Pro 5 14AKP G10: AMD Radeon 860M, 14.00", 1.4 kg
Review » A 1,100 nit OLED and AMD Zen 5 in a creator‘s laptop - The Lenovo IdeaPad Pro 5 14 G10 review
Asus Vivobook 16 M1606K: AMD Radeon 860M, 16.00", 1.9 kg
Review » Asus Vivobook 16 laptop review: AI features at the forefront – genuine productivity boost or marketing hype?
Acer Swift X 14 AI SFX14-61G, Ryzen AI 7 350: NVIDIA GeForce RTX 5060 Laptop, 14.50", 1.6 kg
External Review » Acer Swift X 14 AI SFX14-61G, Ryzen AI 7 350
Gigabyte Aero X16 1WH: NVIDIA GeForce RTX 5060 Laptop, 16.00"
External Review » Gigabyte Aero X16 1WH
HP EliteBook 6 G1a 14: AMD Radeon 860M, 14.00", 1.4 kg
External Review » HP EliteBook 6 G1a 14
Acer Swift Go 16 AI SFG16-61-R5Y5: AMD Radeon 860M, 16.00", 1.5 kg
External Review » Acer Swift Go 16 AI SFG16-61-R5Y5
Acer Nitro 16S AI AN16S-61: NVIDIA GeForce RTX 5060 Laptop, 16.00", 2.2 kg
External Review » Acer Nitro 16S AI AN16S-61
Acer Aspire 14 AI A14-61M: AMD Radeon 860M, 14.00", 1.2 kg
External Review » Acer Aspire 14 AI A14-61M
HP Victus 15-fb3000ng: NVIDIA GeForce RTX 5060 Laptop, 15.60", 2.3 kg
External Review » HP Victus 15-fb3000ng
Acer Nitro V 17 AI ANV17-61: NVIDIA GeForce RTX 5060 Laptop, 17.30", 2.7 kg
External Review » Acer Nitro V 17 AI ANV17-61
HP OmniBook X Flip NGAI 16-ar0000: AMD Radeon 860M, 16.00", 1.9 kg
External Review » HP OmniBook X Flip NGAI 16-ar0000
Acer Aspire 16 AI A16-61M: AMD Radeon 860M, 16.00", 1.6 kg
External Review » Acer Aspire 16 AI A16-61M
HP OmniBook 7 Aero 13-bg1077nr: AMD Radeon 860M, 13.30", 1 kg
External Review » HP OmniBook 7 Aero 13-bg1077nr
Acer Nitro V 16S AI ANV16S-61: NVIDIA GeForce RTX 5060 Laptop, 16.00", 2.2 kg
External Review » Acer Nitro V 16S AI ANV16S-61
Lenovo Yoga Pro 7 14AKP G10: AMD Radeon 860M, 14.50", 1.6 kg
External Review » Lenovo Yoga Pro 7 14AKP G10
HP Omen 16-ap0000ng: NVIDIA GeForce RTX 5060 Laptop, 16.00", 2.4 kg
External Review » HP Omen 16-ap0000ng
HP EliteBook 8 G1a 14, Ryzen AI 7 350: AMD Radeon 860M, 14.00", 1.4 kg
External Review » HP EliteBook 8 G1a 14, Ryzen AI 7 350
Asus Zephyrus G16 GA605KM: NVIDIA GeForce RTX 5060 Laptop, 16.00", 1.9 kg
External Review » Asus Zephyrus G16 GA605KM
Asus ExpertBook PM3606: AMD Radeon 860M, 16.00", 1.9 kg
External Review » Asus ExpertBook PM3606
Asus Vivobook S14 M3407KA: AMD Radeon 860M, 14.00", 1.4 kg
External Review » Asus Vivobook S14 M3407KA
LG gram 15Z80T (2025): AMD Radeon 860M, 15.60", 1.2 kg
External Review » LG gram 15Z80T (2025)
Lenovo Legion 5 15AKP10: NVIDIA GeForce RTX 5070 Laptop, 15.10", 2 kg
External Review » Lenovo Legion 5 15AKP10
Dell 14 Plus 2-in-1: AMD Radeon 860M, 14.00", 1.6 kg
External Review » Dell 14 Plus 2-in-1
Asus ExpertBook PM3406: AMD Radeon 860M, 14.00", 1.4 kg
External Review » Asus ExpertBook PM3406
Asus Vivobook S14 M5406KA: AMD Radeon 860M, 14.00", 1.3 kg
External Review » Asus Vivobook S14 M5406KA
Gigabyte Aero X16 1VH: NVIDIA GeForce RTX 5060 Laptop, 16.00", 1.9 kg
External Review » Gigabyte Aero X16 1VH
Lenovo Legion 5 15AHP10: NVIDIA GeForce RTX 5070 Laptop, 15.10", 1.9 kg
External Review » Lenovo Legion 5 15AHP10
Lenovo IdeaPad Slim 5 14AKP10: AMD Radeon 860M, 14.00", 1.4 kg
External Review » Lenovo IdeaPad Slim 5 14AKP10
Lenovo IdeaPad Pro 5 14AKP G10: AMD Radeon 860M, 14.00", 1.4 kg
External Review » Lenovo IdeaPad Pro 5 14AKP G10
Acer Swift Go 14 AI OLED SFG14-64: AMD Radeon 860M, 14.00", 1.3 kg
External Review » Acer Swift Go 14 AI OLED SFG14-64
HP OmniBook X Flip NGAI 14-fk0000: AMD Radeon 860M, 14.00", 1.4 kg
External Review » HP OmniBook X Flip Next Gen AI 14-fk0000
Asus VivoBook S 14 OLED M5406WA, Ryzen AI 7 350: AMD Radeon 860M, 14.00", 1.3 kg
External Review » Asus VivoBook S 14 OLED M5406WA, Ryzen AI 7 350
Acer Nitro V14 AI ANV14-62: NVIDIA GeForce RTX 5060 Laptop, 14.50", 1.7 kg
External Review » Acer Nitro V14 AI ANV14-62
HP Omnibook 7 Aero 13-bg: AMD Radeon 860M, 13.30", 1 kg
External Review » HP Omnibook 7 Aero 13-bg
Asus TUF Gaming A14 FA401KM: NVIDIA GeForce RTX 5060 Laptop, 14.00", 1.5 kg
External Review » Asus TUF Gaming A14 FA401KM
Acer Nitro V16 AI ANV16-61: NVIDIA GeForce RTX 4060 Laptop GPU, 16.00", 2.4 kg
External Review » Acer Nitro V16 AI ANV16-61
MSI Venture A16 AI+ A3HMG: AMD Radeon 860M, 16.00", 1.9 kg
External Review » MSI Venture A16 AI+ A3HMG
Asus Vivobook 16 M1607KA: AMD Radeon 860M, 16.00", 1.9 kg
External Review » Asus Vivobook 16 M1607KA
Gigabyte Aero X16 1WH: NVIDIA GeForce RTX 5070 Laptop, 16.00", 2 kg
External Review » Gigabyte Aero X16 1WH
Asus Zenbook S 16 UM5606, Ryzen AI 7 350: AMD Radeon 860M, 16.00", 1.5 kg
External Review » Asus Zenbook S 16 UM5606, Ryzen AI 7 350
Asus Zenbook 14 OLED UM3406KA: AMD Radeon 860M, 14.00", 1.2 kg
External Review » Asus Zenbook 14 OLED UM3406KA
Asus ExpertBook PM3406: AMD Radeon 860M, 14.00", 1.4 kg
» Review verdict Asus ExpertBook PM3 - Good office laptop with long warranty and update security
» The Asus ExpertBook PM3 is a good alternative for the Lenovo ThinkPad E14
HP OmniBook 7 Aero 13-bg1077nr: AMD Radeon 860M, 13.30", 1 kg
» HP OmniBook 7 Aero 13 is barely 4 months old and already almost 40 percent off
» The 1 kg HP OmniBook 7 Aero 13 is impressive, but there are some compromises
Acer Swift Go 16 AI SFG16-61-R5Y5: AMD Radeon 860M, 16.00", 1.5 kg
» Running AI locally: Acer Swift Go 16 AI tested with Stable Diffusion, ChatGPT, Gemma3 and others
HP Omen 17z-db100: NVIDIA GeForce RTX 5070 Laptop, 17.30", 2.9 kg
» HP Omen 17 with AMD Zen 5 is only slightly faster than last year's Zen 4 options
» 2025 HP Omen 17 with AMD Zen 5 runs cooler and quieter than the average gaming laptop
Asus ZenBook 14 OLED UM3406K, Ryzen AI 7 350: AMD Radeon 860M, 14.00", 1.2 kg
» Intel ZenBook 14 OLED features Wi-Fi 7 — but the AMD version delivers faster transfer speeds
» Is the ZenBook 14 better with Intel or AMD this year?
Asus ExpertCenter PN54-S70012NN: AMD Radeon 860M, 0.7 kg
» Asus ExpertCenter PN54 reviewed - what the mini PC with AMD Ryzen AI 7 350 can really do in everyday life
Gigabyte Aero X16 1WH: NVIDIA GeForce RTX 5070 Laptop, 16.00", 2 kg
» Compact 16-inch gamer at $450 off: Gigabyte Aero X16 with RTX 5070 drops to lowest price ever
Dell 14 Plus 2-in-1: AMD Radeon 860M, 14.00", 1.6 kg
» Dell 14 Plus 2-in-1 is missing some features found on the older Inspiron 14 7445 2-in-1
» Dell 14 Plus 2-in-1 AMD version is faster than Intel, but there's a catch
Lenovo Yoga Slim 7 14AKP G10: AMD Radeon 860M, 14.00", 1.2 kg
» Lenovo's new OLED screens are excellent but the Yoga Slim 7 14's chassis quality leaves much to be desired
Lenovo IdeaPad 5 2-in-1 14AKP10 83KT0033GE: AMD Radeon 860M, 14.00", 1.5 kg
» Careful with the affordable variant: Convertible laptop Lenovo IdeaPad 5 2-in-1 shows risks of cheaper configurations