Huawei MatePad SE 11 review - Pen support makes this tablet unique within its price class
The MatePad SE 11 is a very affordable tablet that still offers users the option to use a stylus. As a result, the MatePad SE 2024 sets itself apart from the entry-level competition and could be especially interesting for school and college students. Did the Huawei tablet manage to earn our purchase recommendation? Find out here.
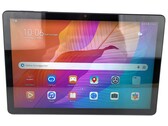
HiSilicon Kirin 710A, ARM Mali-G51 MP4, 11", 475 g