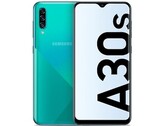
Samsung Exynos 7904
The Samsung Exynos 7904 (also called Exynos 7 Series ) is a upper mid-range system-on-a-chip (SoC) for smartphones and tablets. It was launched early 2019 and features two Cortex-A73 cores clocked at up to 1.8 GHz. Furthermore, there are six power efficient Cortex-A53 cores at up to 1.6 GHz, an ARM Mali-G71 MP2 GPU and a LPDDR4x memory controller. The integrated LTE modem supports LTE Cat.12 3CA 600 Mbps download speeds and Cat.13 2CA 150 Mbps upload. 802.11ac WiFi, Bluetooth 5.0 and FM Radio are also in the chip. Compared to the older and faster Exynos 7885 , the 7904 offers a slower clocked A73 cores (1.8 versus 2.2 GHz).
It is manufactured in 14nm FinFET at Samsung and therefore a rather power efficient SoC.
Series Samsung Exynos Codename Cortex-A73/-A53 Series: Exynos Cortex-A73/-A53 Clock Rate 1800 MHz Number of Cores / Threads 8 / 8 Manufacturing Technology 14 nm Features ARM Mali-G71 MP2, 2x Cortex-A73 (2.2 GHz) + 6x Cortex-A53 (1.6 GHz, big.LITTLE), 2x 32 Bit LPDDR4 Memory Controller GPU ARM Mali-G71 MP2 64 Bit 64 Bit support Architecture ARM Announcement Date 01/21/2019
Benchmarks Performance Rating - Geekbench 5.1, PCM Work, Sling Shot Physics, Antutu v8 CPU
0.2 pt (16%)
...
3DMark - 3DMark Ice Storm Extreme Physics
12500 Points (10%)
...
...
max:
Intel Core i5-14600K
3DMark - 3DMark Ice Storm Unlimited Physics
min: 12321 avg: 12706 median: 12747 (11%) max: 13009 Points
...
...
max:
Intel Core i5-14600K
3DMark - 3DMark Sling Shot Extreme (ES 3.1) Unlimited Physics
min: 1657 avg: 1708 median: 1710 (21%) max: 1755 Points
...
...
max:
3DMark - 3DMark Sling Shot (ES 3.0) Unlimited Physics
min: 1677 avg: 1712 median: 1713 (4%) max: 1745 Points
...
...
Geekbench 5.5 - Geekbench 5.1 - 5.4 64 Bit Single-Core
239 points (10%)
...
...
Geekbench 5.5 - Geekbench 5.1 - 5.4 64 Bit Multi-Core
596 points (1%)
...
...
Apple M3 Max 16-Core
max:
AMD Ryzen Threadripper PRO 7995WX
Geekbench 5.0 - Geekbench 5.0 64 Bit Single-Core
273 points (1%)
...
...
max:
Intel Core i9-14900K
Geekbench 5.0 - Geekbench 5.0 64 Bit Multi-Core
1010 points (3%)
...
max:
Geekbench 4.4 - Geekbench 4.1 - 4.4 64 Bit Single-Core
min: 1268 avg: 1306 median: 1320 (13%) max: 1329 points
...
...
max:
Intel Core i9-14900K
Geekbench 4.4 - Geekbench 4.1 - 4.4 64 Bit Multi-Core
min: 4017 avg: 4073 median: 4096 (5%) max: 4105 points
...
...
max:
Intel Core i9-14900K
Geekbench 4.0 - Geekbench 4.0 64 Bit Single-Core
1247 points (18%)
...
...
Geekbench 4.0 - Geekbench 4.0 64 Bit Multi-Core
3702 points (9%)
...
...
max:
Geekbench 3 - Geekbench 3 64 Bit Multi-Core
3799 points (6%)
...
...
max:
Geekbench 3 - Geekbench 3 64 Bit Single-Core
1263 points (19%)
...
...
Geekbench 2 - 32 Bit - Geekbench Stream
598 Points (5%)
...
...
max:
Geekbench 2 - 32 Bit - Geekbench Memory
1860 Points (17%)
...
...
max:
Geekbench 2 - 32 Bit - Geekbench Floating Point
7368 Points (14%)
...
...
max:
Geekbench 2 - 32 Bit - Geekbench Integer
3613 Points (7%)
...
...
max:
Geekbench 2 - 32 Bit - Geekbench Total Score
4275 Points (11%)
...
...
max:
Mozilla Kraken 1.1 - Kraken 1.1 Total Score *
min: 3703 avg: 4610 median: 4515.5 (5%) max: 5707 ms
...
...
Octane V2 - Octane V2 Total Score
min: 7798 avg: 8407 median: 8372 (8%) max: 9087 Points
...
...
Apple M3 Pro 11-Core
max:
WebXPRT 3 - WebXPRT 3 Score
min: 43 avg: 50.8 median: 52 (11%) max: 56 Points
...
...
Apple M3 Pro 11-Core
max:
AnTuTu v6 - AnTuTu v6 Total Score
min: 71303 avg: 73318 median: 73318 (25%) max: 75333 Points
...
...
AnTuTu v7 - AnTuTu v7 MEM
min: 2712 avg: 5838 median: 6029.5 (19%) max: 8580 Points
...
...
min: 27074 avg: 30317 median: 31150.5 (38%) max: 31891 Points
...
...
AnTuTu v7 - AnTuTu v7 GPU
min: 21269 avg: 22734 median: 23138.5 (7%) max: 23389 Points
...
...
AnTuTu v7 - AnTuTu v7 CPU
min: 45380 avg: 46822 median: 46737 (29%) max: 48432 Points
...
...
AnTuTu v7 - AnTuTu v7 Total Score
min: 101367 avg: 105710 median: 105782 (19%) max: 109906 Points
...
...
23506 Points (20%)
...
AnTuTu v8 - AnTuTu v8 MEM
27124 Points (22%)
...
...
AnTuTu v8 - AnTuTu v8 GPU
6105 Points (1%)
...
AnTuTu v8 - AnTuTu v8 CPU
49105 Points (18%)
...
...
AnTuTu v8 - AnTuTu v8 Total Score
105840 Points (10%)
...
...
PassMark PerformanceTest Mobile V1 - PerformanceTest Mobile V1 CPU Tests
min: 131628 avg: 133094 median: 133094 (18%) max: 134560 Points
...
...
PCMark for Android - PCM f. Android Storage 2.0 random write internal
4.5 MB/s (5%)
MediaTek Kompanio 520
...
PCMark for Android - PCM f. Android Storage 2.0 seq write internal
72.8 MB/s (3%)
MediaTek Kompanio 520
...
PCMark for Android - PCM f. Android Storage 2.0 random read internal
13.9 MB/s (27%)
...
PCMark for Android - PCM f. Android Storage 2.0 seq read internal
259.3 MB/s (9%)
...
PCMark for Android - PCM f. Android Storage 2.0 score
4843 Points (9%)
...
PCMark for Android - PCM f. Android Work Score 3.0
5089 Points (24%)
...
PCMark for Android - PCM f. Android Computer Vision
min: 2527 avg: 2548 median: 2547.5 (13%) max: 2568 Points
...
...
PCMark for Android - PCM f. Android Storage
min: 4371 avg: 5078 median: 5077.5 (11%) max: 5784 Points
...
...
PCMark for Android - PCM f. Android Work Score 2.0
min: 5269 avg: 5372 median: 5372.5 (35%) max: 5474 Points
...
...
PCMark for Android - PCM f. Android Work Score
min: 5802 avg: 6452 median: 6542 (33%) max: 6923 Points
...
...
max:
- Range of benchmark values for this graphics card
- Average benchmark values for this graphics card
* Smaller numbers mean a higher performance