Reviews for the Intel Atom Z3735F processor
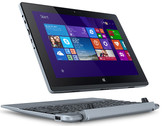
Acer One 10 S1002-17HU Convertible Review
The subtle differences. At a first glance, Acer's One 10 and the Aspire Switch 10E that we tested quite a while ago seem to be very similar. A closer look, however, reveals several (mostly sensible) modifications - but changing to a newer processor architecture is not one of them.
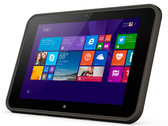
Intel Atom Z3735F, HD Graphics (Bay Trail), 10.1", 1.2 kgHP Pro Tablet 10 EE G1 Tablet Review
Robust. HP's tablet is designed for use in educational institutions. It is accordingly robust. The equipment is also in line with the intended purpose: A bright, high-contrast IPS screen and 3G modem are installed.
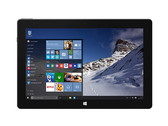
Intel Atom Z3735F, HD Graphics (Bay Trail), 10.1", 850 gLenovo IdeaPad Miix 300-10IBY Convertible Review
Windows 10 @Bay Trail. Lenovo demands an exorbitant 350 Euros (~$389) for the IdeaPad Miix 300-10IBY that was kindly provided to us. That is a lot of money for an older CPU and middling battery life. However, some lower-priced models also exist.
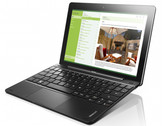
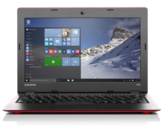
Intel Atom Z3735F, HD Graphics (Bay Trail), 10.1", 1.2 kgLenovo Ideapad 100S Notebook Review
Windows 10 netbook. Lenovo proves that you don't need to have fancy convertibles or detachables to make a good netbook. While a healthy number of features had to be cut, the super-light Ideapad 100S is a bargain for just under $200.
Intel Atom Z3735F, HD Graphics (Bay Trail), 11.6", 998 gOne Xcellent 10 v2 Tablet Review
Excellent? The in-house tablet from the online shop one.de is now available with Windows 10. We looked closer at the 10.1-inch device.
Intel Atom Z3735F, HD Graphics (Bay Trail), 10.1", 594 gAcer Aspire Switch 10E SW3-013: Intel HD Graphics (Bay Trail), 10.10", 1.2 kg
Review » Acer Aspire Switch 10E SW3-013 Convertible Review
Acer Iconia Tab 10 A3-A30: Intel HD Graphics (Bay Trail), 10.10", 0.5 kg
Review » Acer Iconia Tab 10 A3-A30 Tablet Review
Toshiba Satellite Click Mini L9W-B-102: Intel HD Graphics (Bay Trail), 8.90", 0.5 kg
Review » Toshiba Satellite Click Mini L9W-B Convertible Review
Dell Venue 10 Pro 5055: Intel HD Graphics (Bay Trail), 10.10", 0.7 kg
Review » Dell Venue 10 Pro 5055 Convertible Review
Lenovo Miix 3 8: Intel HD Graphics (Bay Trail), 7.85", 0.4 kg
Review » Lenovo Miix 3 8 Tablet Review
Prestigio Multipad Visconte 3 3G: Intel HD Graphics (Bay Trail), 10.10", 0.7 kg
Review » Prestigio Multipad Visconte 3 3G Notebook Review
Lenovo Miix 3 10: Intel HD Graphics (Bay Trail), 10.10", 0.6 kg
Review » Lenovo Miix 3 10 Convertible Review
Trekstor SurfTab Wintron 10.1: Intel HD Graphics (Bay Trail), 10.10", 0.7 kg
Review » Trekstor SurfTab Wintron 10.1 Tablet Review
Asus EeeBook X205TA-FD005BS: Intel HD Graphics (Bay Trail), 11.60", 1 kg
Review » Asus EeeBook X205TA-FD005BS Netbook Review
Review » First Impressions: Asus EeeBook X205TA-FD005BS in Review
Acer Aspire Switch 10 SW5-012-13DP: Intel HD Graphics (Bay Trail), 10.10", 1.1 kg
Review » Acer Aspire Switch 10 Full HD Convertible Review Update
Prestigio MultiPad Visconte A PMP1014TE: Intel HD Graphics (Bay Trail), 10.10", 0.6 kg
External Review » Prestigio MultiPad Visconte A PMP1014TE
Prestigio Smartbook 141A: Intel HD Graphics (Bay Trail), 14.10", 1.4 kg
External Review » Prestigio Smartbook 141A
ODYS Cosmo Windows X9: Intel HD Graphics (Bay Trail), 8.90", 0.4 kg
External Review » ODYS Cosmo Windows X9
Prestigio Smartbook 116A02: Intel HD Graphics (Bay Trail), 11.60", 1.6 kg
External Review » Prestigio Smartbook 116A02
Medion Akoya E1235T-MD99776: Intel HD Graphics (Bay Trail), 10.10", 1.2 kg
External Review » Medion Akoya E1235T-MD99776
Medion Lifetab P10325: Intel HD Graphics (Bay Trail), 10.10", 0.6 kg
External Review » Medion Lifetab P10325
Archos 90 Cesium: Intel HD Graphics (Bay Trail), 8.90", 0.8 kg
External Review » Archos 90 Cesium
Medion Akoya S1219T-MD99348: Intel HD Graphics (Bay Trail), 10.10", 1 kg
External Review » Medion Akoya S1219T-MD99348
Acer Iconia Tab 10 A3-A30-197H: Intel HD Graphics (Bay Trail), 10.10", 0.5 kg
External Review » Acer Iconia Tab 10 A3-A30-197H
Asus EeeBook F205TA-FD0065TS: Intel HD Graphics (Bay Trail), 11.60", 1 kg
External Review » Asus EeeBook F205TA-FD0065TS
Acer Aspire Switch 10E SW3-013-100N: Intel HD Graphics (Bay Trail), 10.10", 1.2 kg
External Review » Acer Aspire Switch 10E SW3-013-100N
Lenovo IdeaPad 100S-11IBY: Intel HD Graphics (Bay Trail), 11.60", 1 kg
External Review » Lenovo IdeaPad 100S-11IBY
Lenovo IdeaPad Miix 300-10IBY: Intel HD Graphics (Bay Trail), 10.10", 1.2 kg
External Review » Lenovo IdeaPad Miix 300-10IBY
Lenovo IdeaPad 100s 11IBY 80R2002VFR: Intel HD Graphics (Bay Trail), 11.60", 1 kg
External Review » Lenovo IdeaPad 100s 11IBY 80R2002VFR
Acer Aspire Switch 10E SW5-012-11E6: Intel HD Graphics (Bay Trail), 10.10", 1.2 kg
External Review » Acer Aspire Switch 10E SW5-012-11E6
HP ProSlate 10 EE G1: Intel HD Graphics (Bay Trail), 7.00", 0.9 kg
External Review » HP ProSlate 10 EE G1
Lenovo Ideapad 100S 80R2: Intel HD Graphics (Bay Trail), 11.60", 1 kg
External Review » Lenovo Ideapad 100S 80R2
Acer Aspire Switch 10 Special Edition SW5-015-16Y3: Intel HD Graphics (Bay Trail), 10.10", 1.2 kg
External Review » Acer Aspire Switch 10 Special Edition SW5-015-16Y3
Acer Iconia Tab 10 A3-A30: Intel HD Graphics (Bay Trail), 10.10", 0.5 kg
External Review » Acer Iconia Tab 10 A3-A30
Acer Aspire Switch 10E SW3-013-11N8: Intel HD Graphics (Bay Trail), 10.10", 1.2 kg
External Review » Acer Aspire Switch 10E SW3-013-11N8
Acer Switch 10 SW5-015: Intel HD Graphics (Bay Trail), 10.10", 1.2 kg
External Review » Acer Switch 10 SW5-015
Acer Aspire Switch 10 SW3-013-12U1: Intel HD Graphics (Bay Trail), 10.10", 1.2 kg
External Review » Acer Aspire Switch 10 SW3-013-12U1
Toshiba Satellite Click Mini L9W-B-102: Intel HD Graphics (Bay Trail), 8.90", 0.5 kg
External Review » Toshiba Satellite Click Mini L9W-B-102
Acer Aspire Switch 10 SW5-012-14HK: Intel HD Graphics (Bay Trail), 10.10", 1.2 kg
External Review » Acer Aspire Switch 10 SW5-012-14HK
Dell Venue 10 Pro 5055: Intel HD Graphics (Bay Trail), 10.10", 0.7 kg
External Review » Dell Venue 10 Pro 5055
Acer Aspire Switch 10E SW3-013: Intel HD Graphics (Bay Trail), 10.10", 1.2 kg
External Review » Acer Aspire Switch 10E SW3-013
Toshiba Encore 2 WT10-A-106: Intel HD Graphics (Bay Trail), 10.10", 0.6 kg
External Review » Toshiba Encore 2 WT10-A-106
Lenovo Miix 3 10: Intel HD Graphics (Bay Trail), 10.10", 0.6 kg
External Review » Lenovo Miix 3 10
Medion Lifetab P8912: Intel HD Graphics (Bay Trail), 8.90", 0.5 kg
External Review » Medion Lifetab P8912
Medion Lifetab S10345-MD99042: Intel HD Graphics (Bay Trail), 10.10", 0.6 kg
External Review » Medion Lifetab S10345-MD99042
Medion Lifetab S10346-MD98992: Intel HD Graphics (Bay Trail), 10.10", 0.6 kg
External Review » Medion Lifetab S10346-MD98992
Asus EeeBook F205TA-FD018BS: Intel HD Graphics (Bay Trail), 11.60", 1 kg
External Review » Asus EeeBook F205TA-FD018BS
Prestigio Multipad Visconte 3 3G: Intel HD Graphics (Bay Trail), 10.10", 0.7 kg
External Review » Prestigio Multipad Visconte 3 3G
Asus EeeBook X205TA-FD005BS: Intel HD Graphics (Bay Trail), 11.60", 1 kg
External Review » Asus EeeBook X205TA-FD005BS
Acer Aspire Switch 10 SW5-012-13DP: Intel HD Graphics (Bay Trail), 10.10", 1.1 kg
External Review » Acer Aspire Switch 10 SW5-012-13DP
Acer Aspire Switch 10 SW5-012-17XE: Intel HD Graphics (Bay Trail), 10.10", 1.1 kg
External Review » Acer Aspire Switch 10 SW5-012-17XE
Toshiba Encore 2 WT8-B264: Intel HD Graphics (Bay Trail), 8.00", 0.4 kg
External Review » Toshiba Encore 2 WT8-B264