Reviews for the Mediatek MT6753 processor
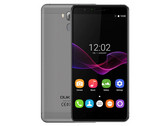
Oukitel U16 Max Smartphone Review
Chinese gold standard. The giant new smartphone from the Far East not only tries to impress with size and weight but also with features that are decent for the price of about 130 Euros (~$145). We ask ourselves where the Chinese took shortcuts this time.
Mediatek MT6753, ARM Mali-T720 MP2, 6", 223 gAcer Liquid Z6 Plus Smartphone Review
Acer's large smartphone. Acer's Liquid Z6 Plus is a middle-class smartphone with a large Full-HD display, fingerprint sensor and a huge battery. The middle class is highly contested, however - so is the Liquid z6 Plus able to stand out in any way?
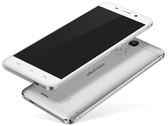
Mediatek MT6753, ARM Mali-T720 MP2, 5.5", 169 gUleFone Metal Smartphone Review
Well-designed penny pincher. The little-known Chinese manufacturer, UleFone, is offering a new entry-level smartphone. The device may be cheap, but as the name suggests, the UleFone Metal offers a metal finish and good technical features.
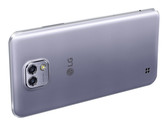
Mediatek MT6753, ARM Mali-T720, 5", 155 gLG X Cam Smartphone Review
Camera expert. LG's latest product line with an "X" in its name combines mid-range smartphones with handpicked features that are normally found in the smartphone premium range. LG's X Cam stands out with a special "x-tra" in the camera section. Find out whether the camera module's quality is also "x-tra" good.
Mediatek MT6753, ARM Mali-T720 MP4, 5.2", 118.2 gUHANS S1 Smartphone Review
The beautiful beast. The Chinese smartphone label UHANS advertises its S1 smartphone model with this teaser. And this teaser is dead-on: Besides attractive looks, the entry-level handset proves to be powerful and exceptionally well equipped for this price range.
Mediatek MT6753, ARM Mali-T720 MP4, 5", 153 gZTE Blade V7: ARM Mali-T720 MP4, 5.20", 0.1 kg
Review » ZTE Blade V7 Smartphone Review
UMI Touch: ARM Mali-T720 MP4, 5.50", 0.2 kg
Review » UMi Touch Smartphone Review
Leagoo Shark 1: ARM Mali-T720 MP2, 6.00", 0.2 kg
Review » Leagoo Shark 1 Smartphone Review
Acer Liquid Z630S: ARM Mali-T720 MP4, 5.50", 0.2 kg
Review » Acer Liquid Z630S Smartphone Review
Archos Diamond S: ARM Mali-T720 MP4, 5.00", 0.1 kg
Review » Archos Diamond S Smartphone Review
Bluboo Xtouch: ARM Mali-T720 MP2, 5.00", 0.2 kg
Review » Bluboo Xtouch Smartphone Review
Elephone P8000: ARM Mali-T720 MP4, 5.50", 0.2 kg
Review » Elephone P8000 Smartphone Review
Panasonic Eluga Ray 700: ARM Mali-T720 MP4, 5.50", 0.2 kg
External Review » Panasonic Eluga Ray 700
TP-Link Neffos C5 Max: ARM Mali-T720 MP4, 5.50", 0.1 kg
External Review » TP-Link Neffos C5 Max
Oukitel K10000 Max: ARM Mali-T720 MP4, 5.50", 0.3 kg
External Review » Oukitel K10000 Max
Zopo Speed X: ARM Mali-T720 MP4, 5.00", 0.1 kg
External Review » Zopo Speed X
Panasonic Eluga A3 Pro: ARM Mali-T720 MP4, 5.20", 0.2 kg
External Review » Panasonic Eluga A3 Pro
Alcatel Idol 5: ARM Mali-T720 MP4, 5.20", 0.2 kg
External Review » Alcatel Idol 5
Vernee Thor Plus: ARM Mali-T720 MP4, 5.50", 0.2 kg
External Review » Vernee Thor Plus
BQ RU BQ-5201 SPACE: ARM Mali-T720 MP4, 5.20", 0.2 kg
External Review » BQ BQ-5201 SPACE
Panasonic Eluga Mark 2: ARM Mali-T720 MP4, 5.50", 0.2 kg
External Review » Panasonic Eluga Mark 2
Vernee Thor E: ARM Mali-T720 MP4, 5.00", 0.1 kg
External Review » Vernee Thor E
Blackview P2 Lite: ARM Mali-T720 MP4, 5.50", 0.2 kg
External Review » Blackview P2 Lite
Zopo Flash X Plus: ARM Mali-T720 MP4, 5.50", 0.2 kg
External Review » Zopo Flash X Plus
Vernee Thor: ARM Mali-T720 MP4, 5.00", 0.1 kg
External Review » Vernee Thor
Ulefone Power: ARM Mali-T720 MP4, 5.50", 0.2 kg
External Review » Ulefone Power
Wiko Fever SE: ARM Mali-T720 MP4, 5.20", 0.2 kg
External Review » Wiko Fever SE
Oukitel U16 Max: ARM Mali-T720 MP2, 6.00", 0.2 kg
External Review » Oukitel U16 Max
Huawei GR3 2017: ARM Mali-T720 MP4, 5.00", 0.1 kg
External Review » Huawei GR3 2017
ZTE Blade V7 Plus: ARM Mali-T720 MP4, 5.20", 0.1 kg
External Review » ZTE Blade V7 Plus
Alcatel A5 LED: ARM Mali-T720 MP4, 5.20", 0.2 kg
External Review » Alcatel A5 LED
Phicomm Energy 3+: ARM Mali-T720 MP4, 5.50", 0.2 kg
External Review » Phicomm Energy 3+
Oukitel U13: ARM Mali-T720 MP4, 5.50", 0.2 kg
External Review » Oukitel U13
Ulefone Armor: ARM Mali-T720 MP4, 4.70", 0.2 kg
External Review » Ulefone Armor
Allview X3 Soul: ARM Mali-T720 MP4, 5.50", 0.1 kg
External Review » Allview X3 Soul
Leagoo V1: ARM Mali-T720 MP4, 5.00", 0.2 kg
External Review » Leagoo V1
UMI Diamond: ARM Mali-T720 MP4, 5.00", 0.2 kg
External Review » UMI Diamond
Doogee F5: ARM Mali-T720 MP4, 5.50", 0.2 kg
External Review » Doogee F5
Doogee F3: ARM Mali-T720 MP4, 5.00", 0.2 kg
External Review » Doogee F3
Archos Diamond Plus: ARM Mali-T720 MP4, 5.50", 0.2 kg
External Review » Archos Diamond Plus
Oukitel U15 Pro: ARM Mali-T720 MP4, 5.50", 0.2 kg
External Review » Oukitel U15 Pro
Lenovo A7010: ARM Mali-T720 MP4, 5.50", 0.2 kg
External Review » Lenovo A7010
Doogee T5: ARM Mali-T720 MP4, 5.00", 0.2 kg
External Review » Doogee T5
HTC Desire 830: ARM Mali-T720 MP4, 5.50", 0.2 kg
External Review » HTC Desire 830
Doogee T6 Pro : ARM Mali-T720, 5.50", 0.2 kg
External Review » Doogee T6 Pro
Acer Liquid Z6 Plus: ARM Mali-T720 MP2, 5.50", 0.2 kg
External Review » Acer Liquid Z6 Plus
UMI Rome: ARM Mali-T720 MP4, 5.50", 0.2 kg
External Review » UMI Rome
Ulefone Vienna: ARM Mali-T720 MP4, 5.50", 0.2 kg
External Review » Ulefone Vienna
THL T7: ARM Mali-T720 MP4, 5.50", 0.2 kg
External Review » THL T7
Oukitel K6000 Pro: ARM Mali-T720 MP4, 5.50", 0.2 kg
External Review » Oukitel K6000 Pro
Leagoo Elite 1: ARM Mali-T720 MP4, 5.00", 0.1 kg
External Review » Leagoo Elite 1
Ulefone Metal: ARM Mali-T720, 5.00", 0.2 kg
External Review » Ulefone Metal
UHANS S1: ARM Mali-T720 MP4, 5.00", 0.2 kg
External Review » UHANS S1
Leagoo Shark 1: ARM Mali-T720 MP2, 6.00", 0.2 kg
External Review » Leagoo Shark 1
UMI Touch: ARM Mali-T720 MP4, 5.50", 0.2 kg
External Review » UMI Touch
LG X Cam: ARM Mali-T720 MP4, 5.20", 0.1 kg
External Review » LG X Cam
Acer Liquid Z630S: ARM Mali-T720 MP4, 5.50", 0.2 kg
External Review » Acer Liquid Z630S
Lenovo Vibe S1 Lite: ARM Mali-T720 MP4, 5.00", 0.1 kg
External Review » Lenovo Vibe S1 Lite
HTC Desire 628: ARM Mali-T720 MP4, 5.00", 0.1 kg
External Review » HTC Desire 628
Elephone S3: ARM Mali-T720 MP4, 5.20", 0.1 kg
External Review » Elephone S3
Lenovo K4 Note: ARM Mali-T720 MP4, 5.50", 0.2 kg
External Review » Lenovo K4 Note
Acer Liquid X2: ARM Mali-T720 MP4, 5.50", 0.2 kg
External Review » Acer Liquid X2
ZTE Blade V7: ARM Mali-T720 MP4, 5.20", 0.1 kg
External Review » ZTE Blade V7
Wiko Fever: ARM Mali-T720 MP4, 5.20", 0.1 kg
External Review » Wiko Fever
HTC Desire 828: ARM Mali-T720 MP4, 5.50", 0.1 kg
External Review » HTC Desire 828
Elephone M2: ARM Mali-T720 MP4, 5.50", 0.2 kg
External Review » Elephone M2
Elephone P8000: ARM Mali-T720 MP4, 5.50", 0.2 kg
External Review » Elephone P8000