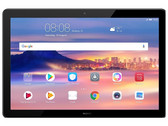
Huawei MediaPad M5 lite Tablet Review
Huawei has equipped the MediaPad M5 lite with four speakers, certified by harman/kardon. Buyers will receive a fancy-looking mid-range tablet with LTE support. Find out what else you can expect in exchange for about £270 (~$350) in our review.
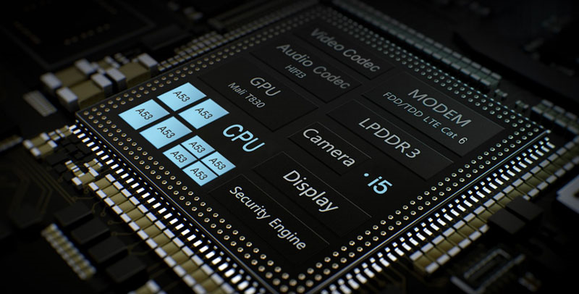
HiSilicon Kirin 659, ARM Mali-T830 MP2, 10.1", 475 g