
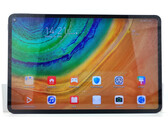
Huawei MatePad Pro (5G) 10.8 tablet review - An Android alternative to the Apple iPad Pro 11?
The MatePad Pro offers plenty of features, a modern design, and high-quality materials. But is that enough to stand up to the top dogs in the tablet field, the Apple iPad Pro and Samsung Galaxy Tab S6? Our review of the Huawei tablet casts some doubts...
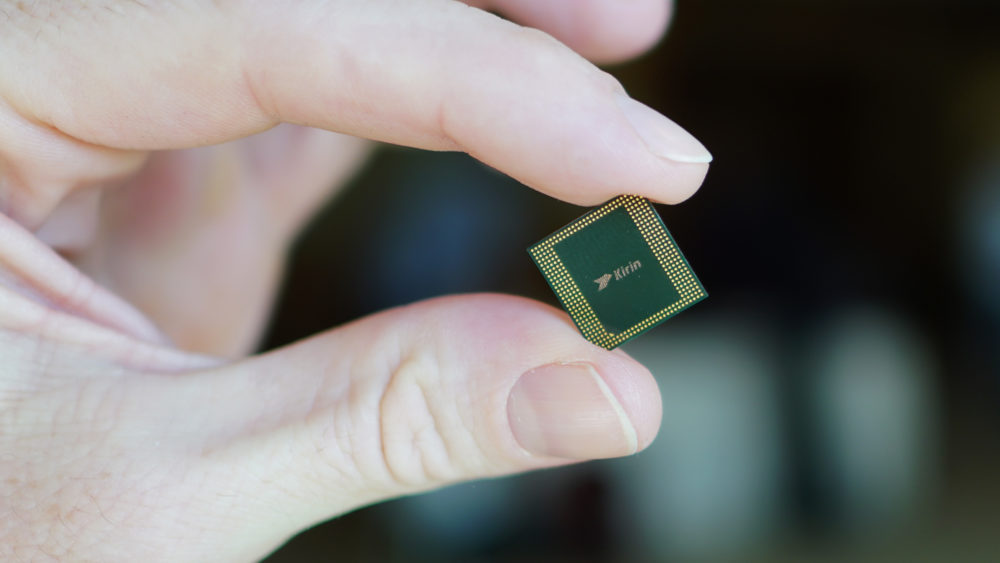
HiSilicon Kirin 990, ARM Mali-G76 MP16, 10.8", 460 g