
Samsung Galaxy Tab A7 LTE 2022 tablet review – Update with improved battery life
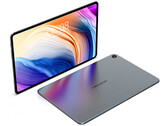
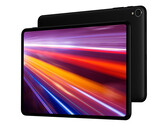
Three years ago, the Samsung Galaxy Tab A7 was one of the best affordable tablets for us. Now the Korean manufacturer brings an updated version with a new SoC to the market. Find out in our test what has changed and whether the 10.4-inch tablet is still worthwhile.
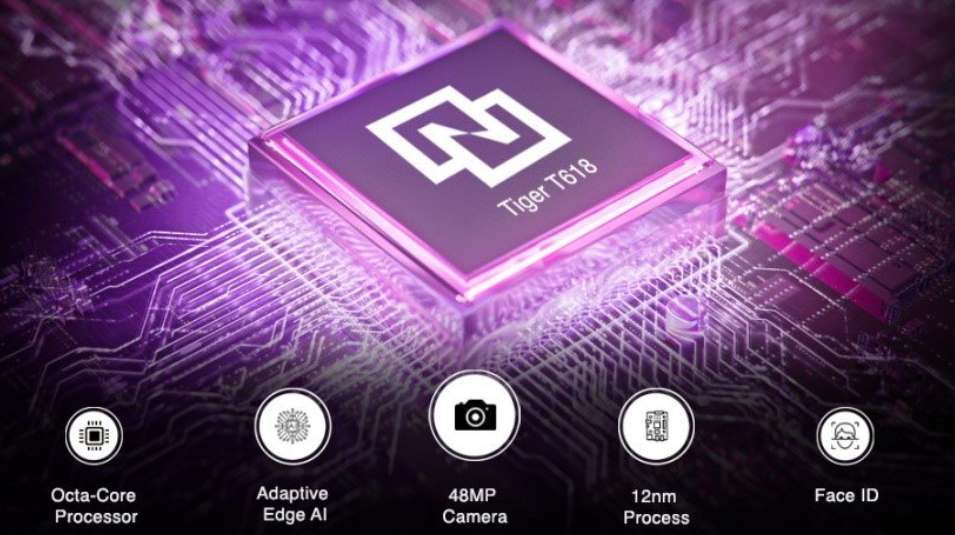
UNISOC T618, ARM Mali-G52 MP2, 10.4", 477 g