

Dell Venue 8 Pro 5855 Tablet Review
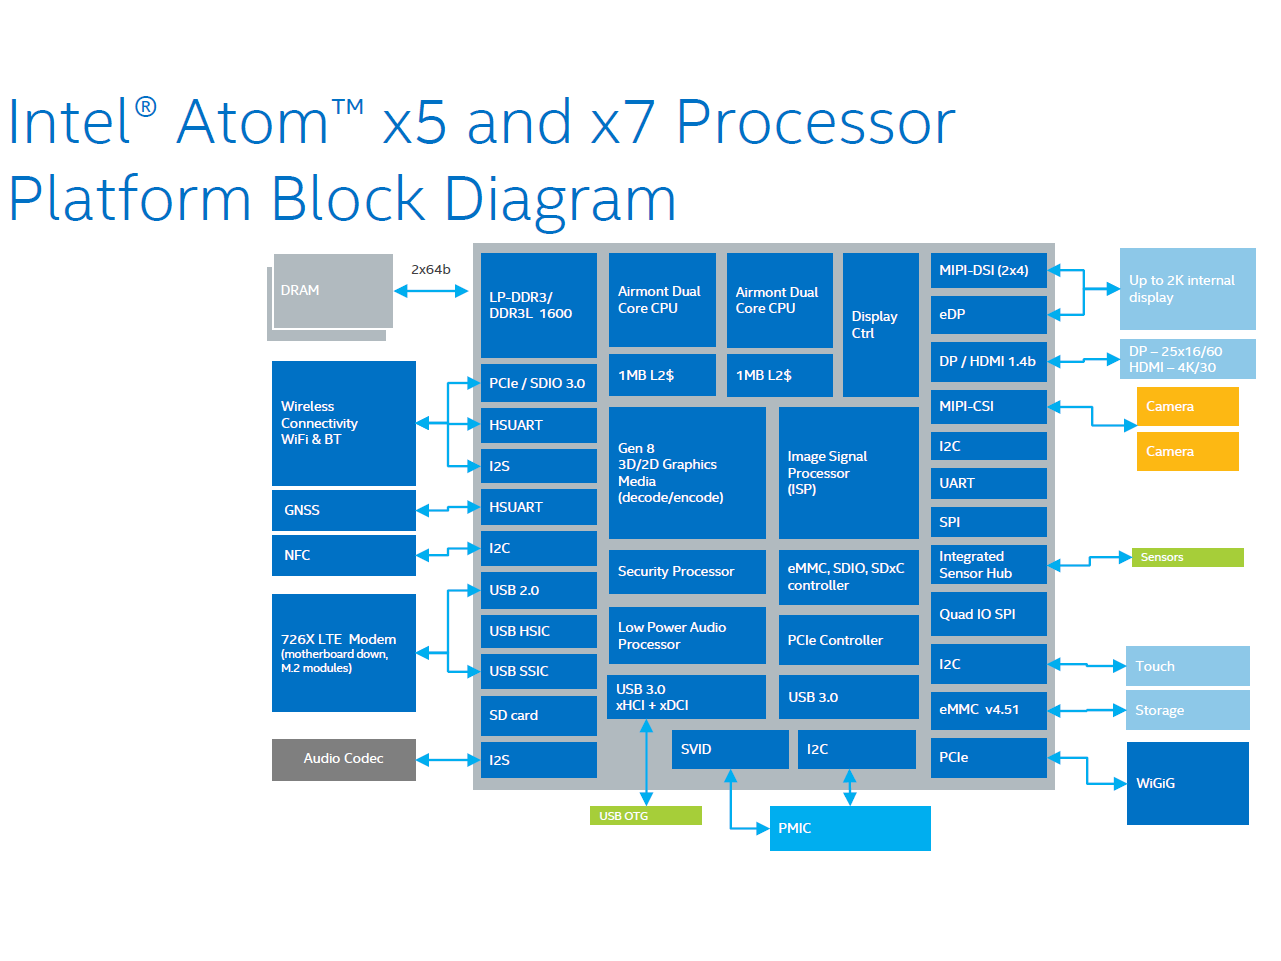
Back to business. The latest edition of Dell's Venue 8 Pro presents itself as an extremely strong teammate in our test - thanks to the latest Cherry Trail platform in conjunction with generous dual-channel working memory. However, the colleague is not prepared to work overtime.
Intel Atom x5-Z8500, HD Graphics (Cherry Trail), 8", 377 g