Durabook R8 review: World's first fanless rugged tablet with Intel 12th gen
The easy-to-use Durabook R8 is one of the few fanless tablets equipped with an Intel Core U-series CPU. Performance is pared back due to the lack of active cooling, but auxiliary features remain excellent.
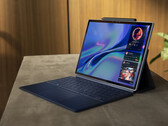
Intel Core i5-1230U, Iris Xe G7 80EUs, 8", 856 g