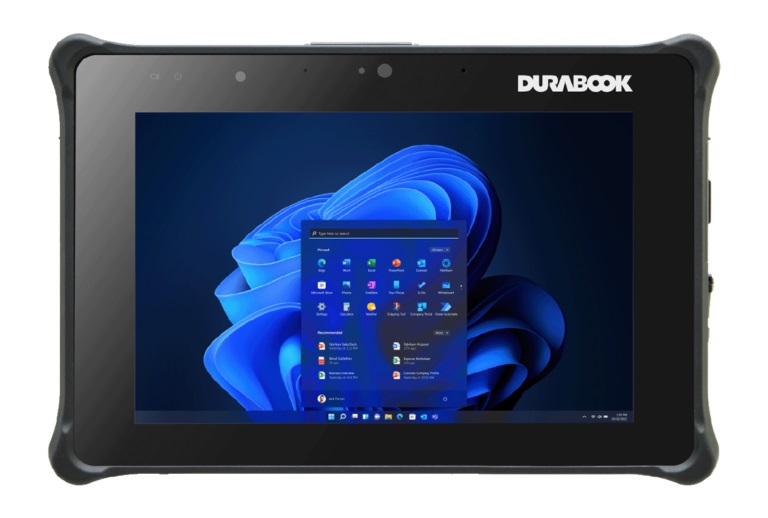
Durabook R8 review: World's first fanless rugged tablet with Intel 12th gen

Durabook specializes in rugged laptop PCs and tablets designed for demanding environments like manufacturing, law enforcement, field research, government agencies, and other industries outside of the traditional office space. The latest model is the fully rugged Durabook R8 which is one of the first in its size category to sport 12th gen Alder Lake-U CPUs wrapped in a fanless design.
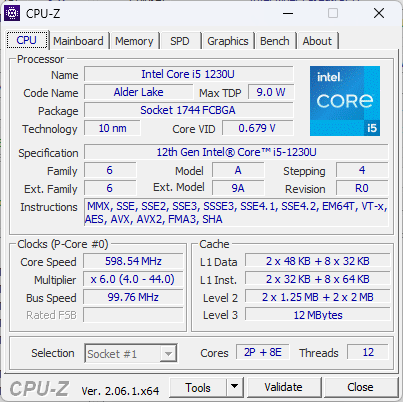
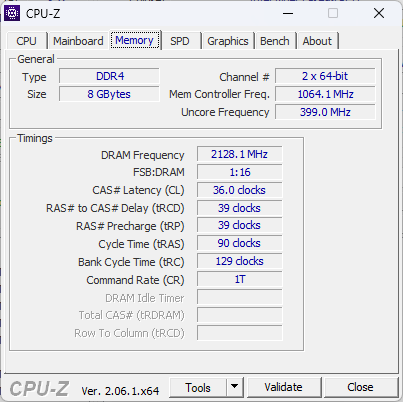
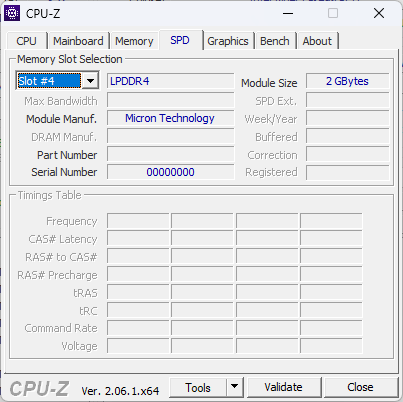
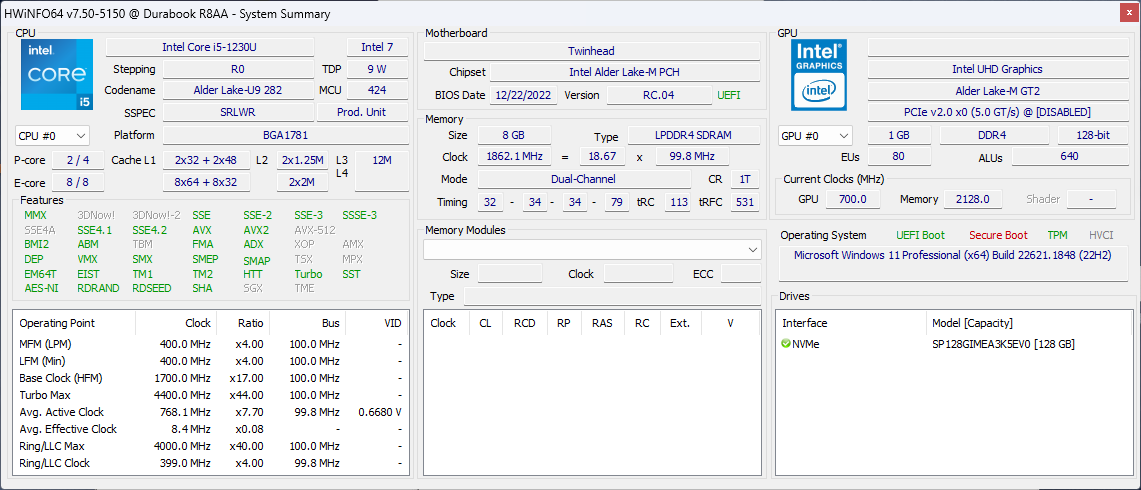
Our test unit sports a Core i5-1230U, 8 GB of soldered LPDDR4x-2133 RAM, and a 128 GB SSD. Other SKUs are available with the Pentium 8500, Core i7-1250U, 16 GB RAM or 1 TB SSD, but all options ship with the same 8-inch 1280 x 800 resolution touchscreen.
Alternatives to the Durabook R8 include other rugged tablets like the Acer Enduro T1, Dell Latitude 7230 Rugged Extreme, or the Panasonic Toughbook FZ-G2.
More Durabook reviews:

Potential Competitors in Comparison
Rating | Date | Model | Weight | Height | Size | Resolution | Price |
|---|---|---|---|---|---|---|---|
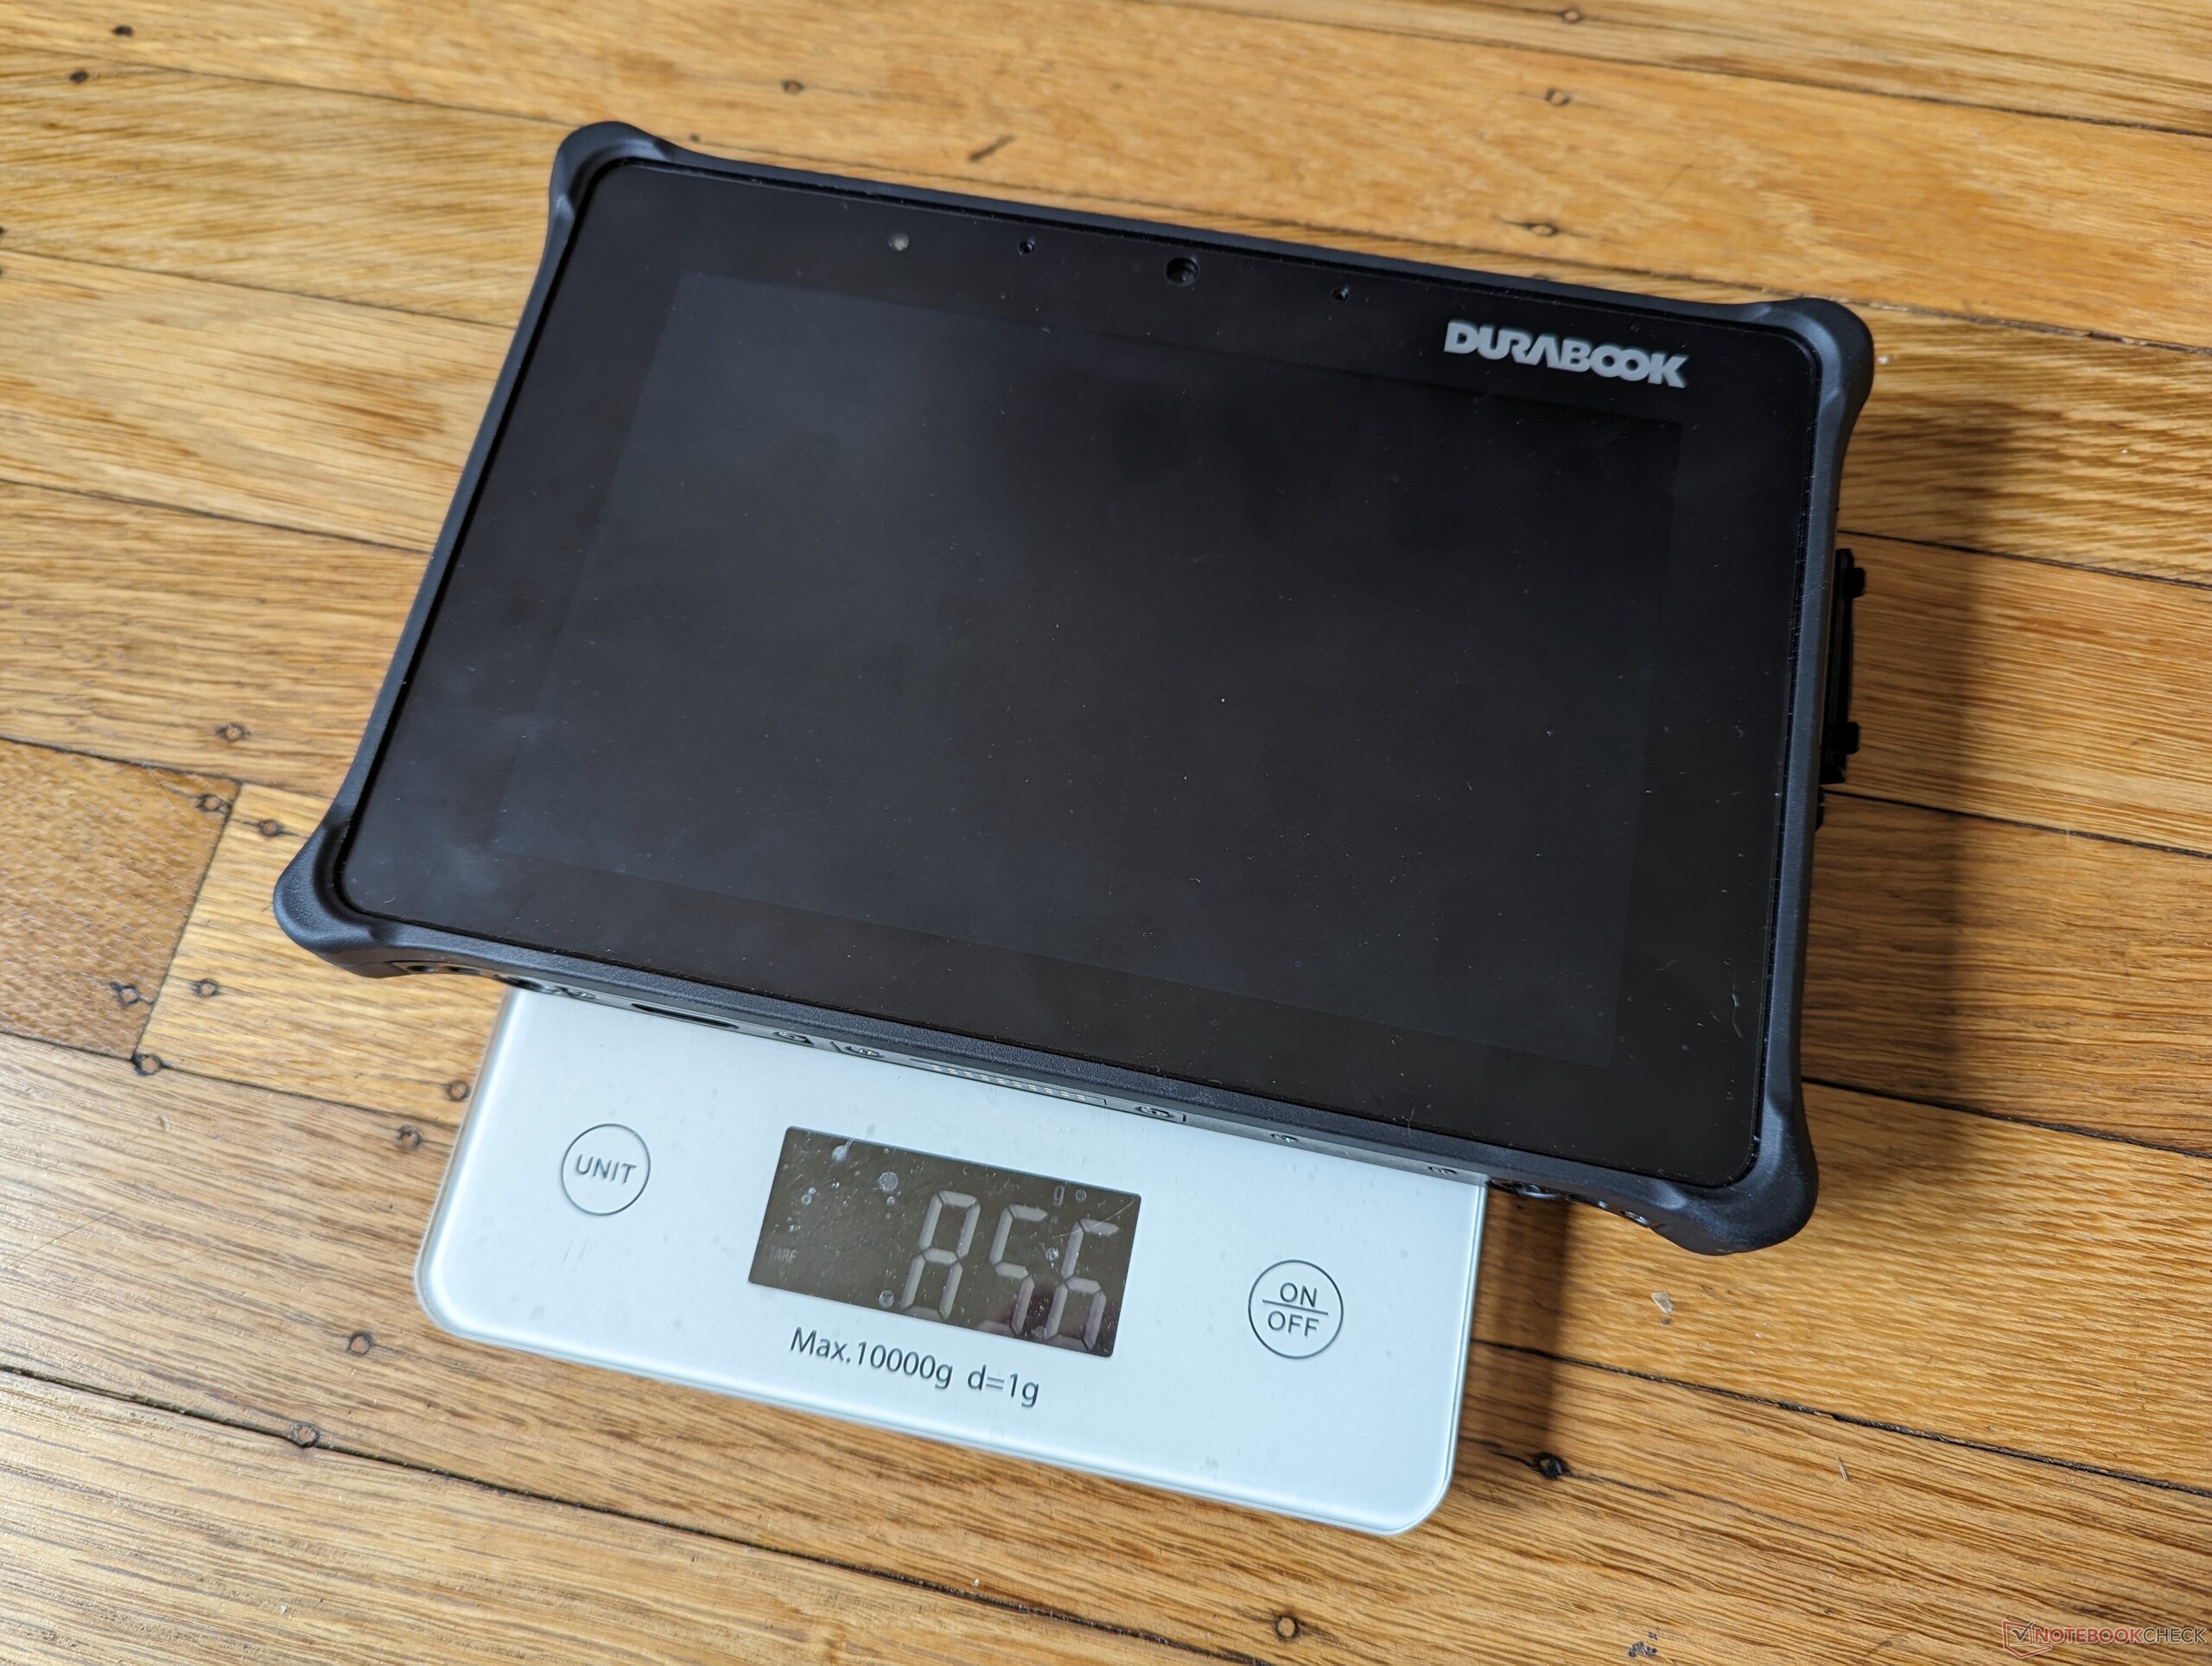
| 79.6 % v7 (old) | 07 / 2023 | Durabook R8 Tablet i5-1230U, Iris Xe G7 80EUs | 856 g | 20.6 mm | 8.00" | 1280x800 | |
v (old) | 09 / 2020 | Acer Enduro T1 ET108-11A A9001 | 499 g | 10.9 mm | 8.00" | 1280x800 | |
| 79.5 % v7 (old) | 05 / 2023 | Lenovo Tab M8 (Gen 4) Helio A22 MT6761, PowerVR GE8300 | 320 g | 9 mm | 8.00" | 1280x800 | |
| 83.9 % v7 (old) | 04 / 2023 | Dell Latitude 7230 Rugged Extreme i5-1240U, Iris Xe G7 80EUs | 1.6 kg | 23.9 mm | 12.00" | 1920x1200 | |
v (old) | 08 / 2021 | Panasonic Toughbook FZ-G2 i5-10310U, UHD Graphics 620 | 1.5 kg | 28 mm | 10.10" | 1920x1200 |
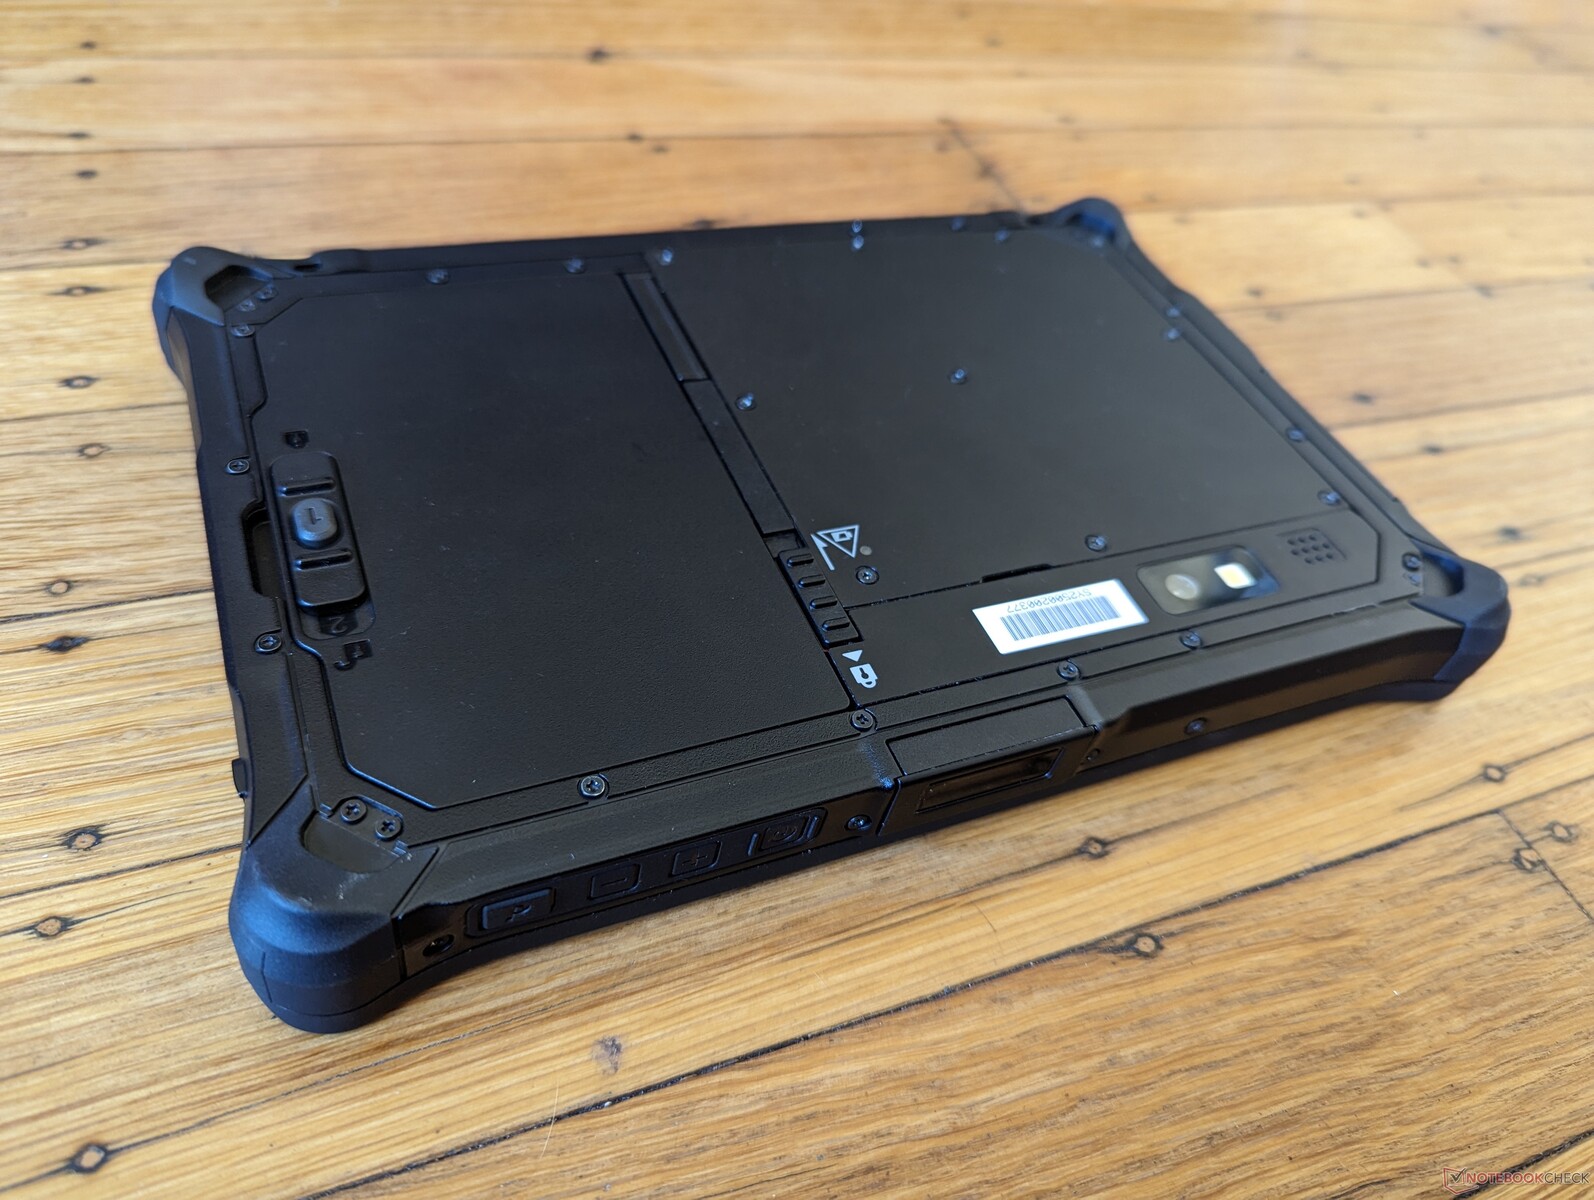
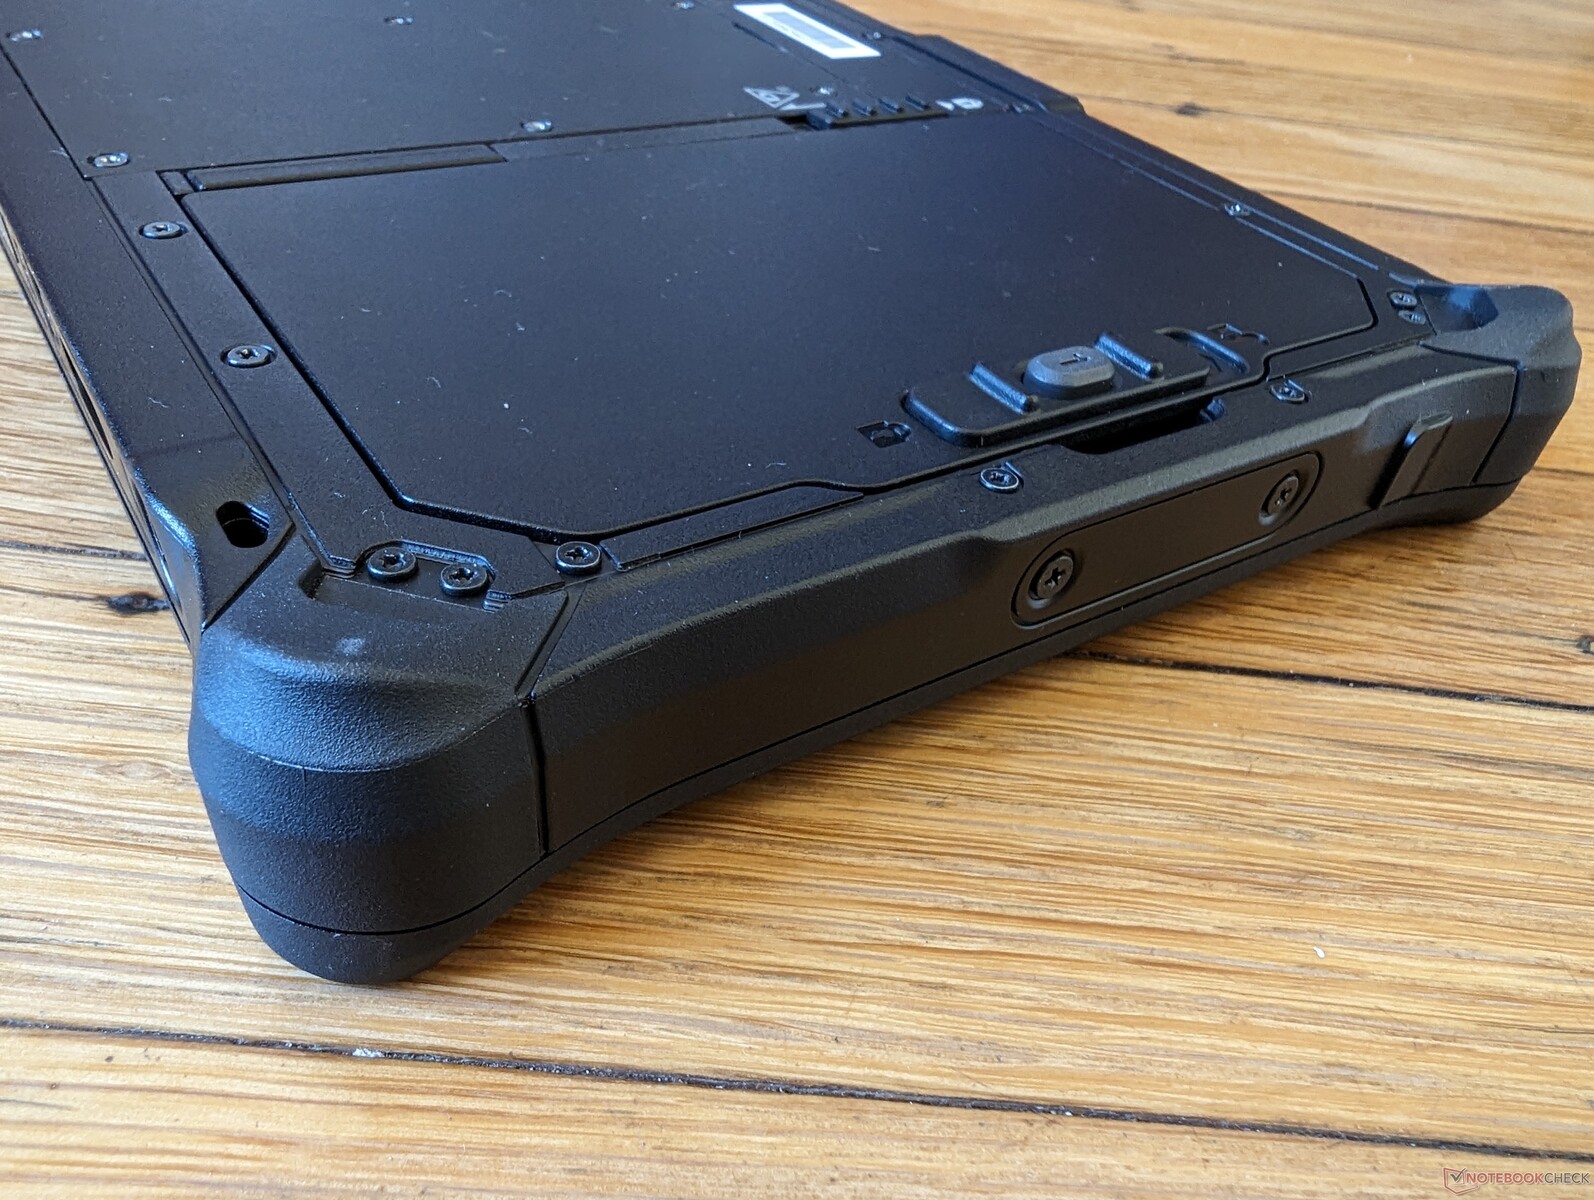
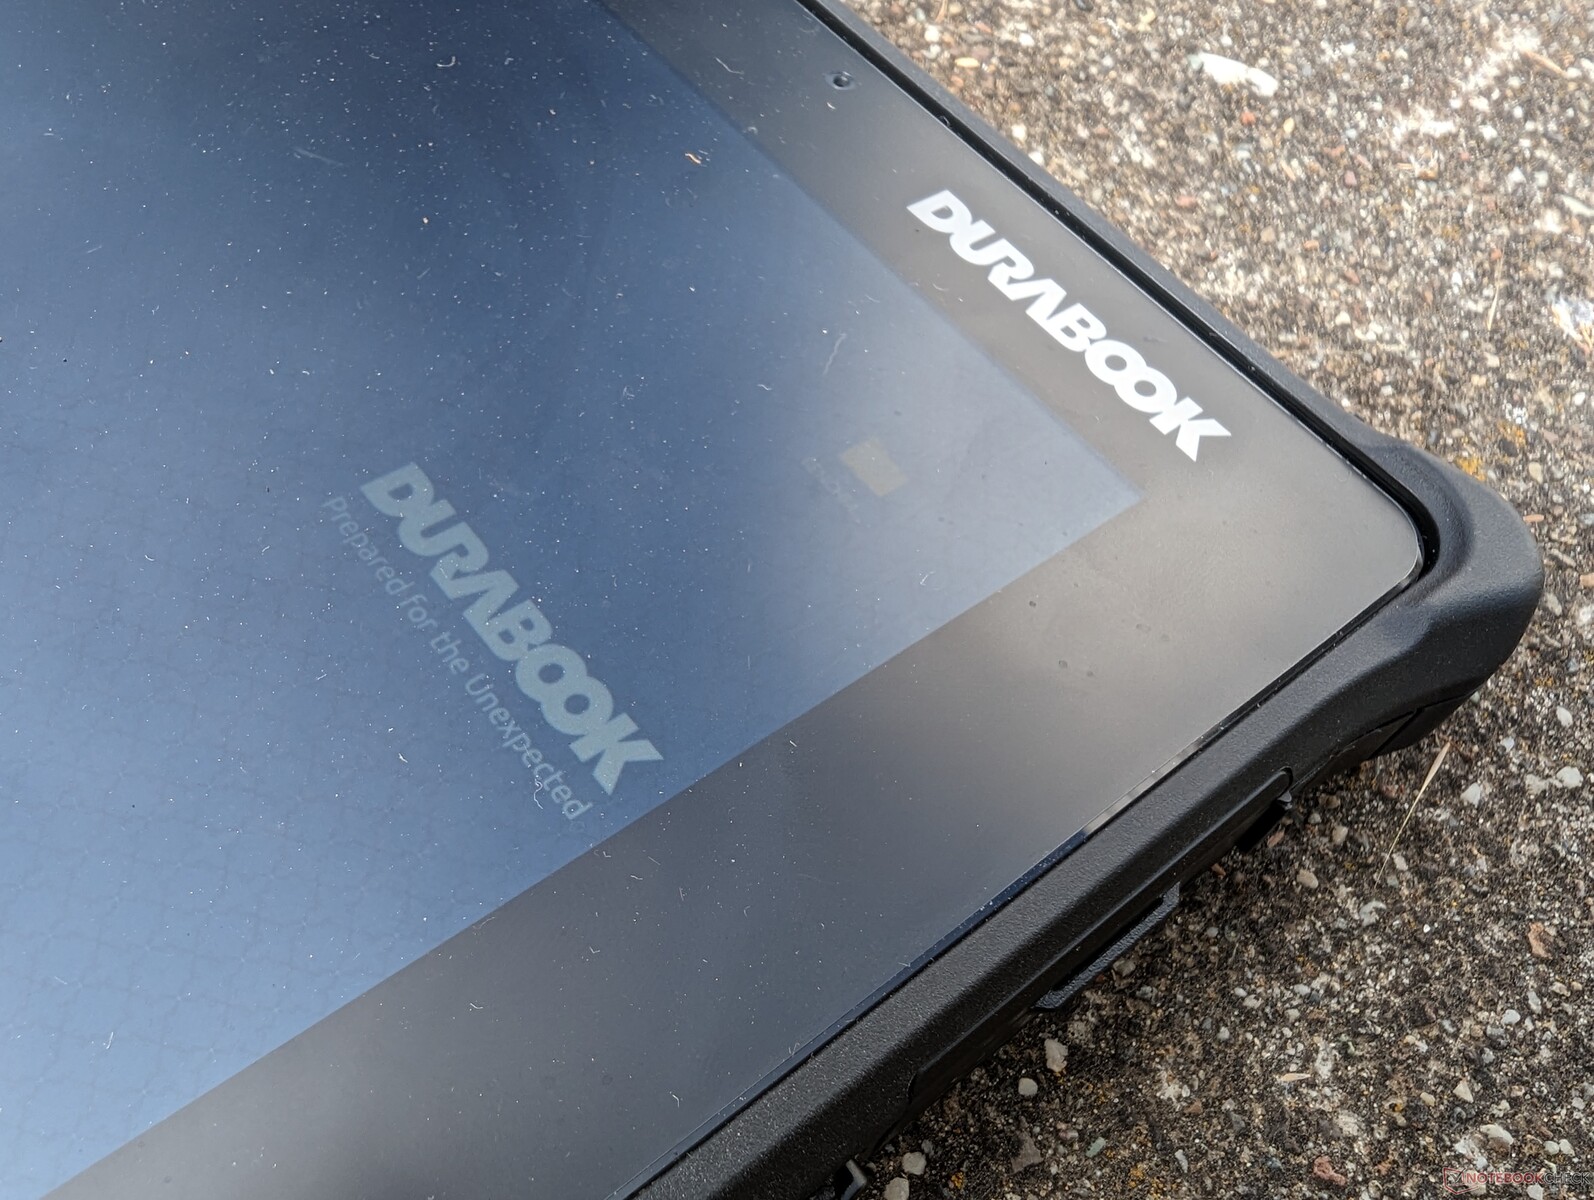
Case — Durable Durabook
The chassis is MIL-STD 810H, MIL-STD 461G, and IP66 certified against a wide range of environmental elements. Attempting to twist the tablet from its corners or depress the center of the screen would result in no noticeable creaking or warping for solid first impressions.
The fully rugged specification indubitably adds weight and thickness to the design. When compared to the competing Acer Enduro T1, for example, our Durabook is almost twice as thick and heavy even though both have 8-inch touchscreens.
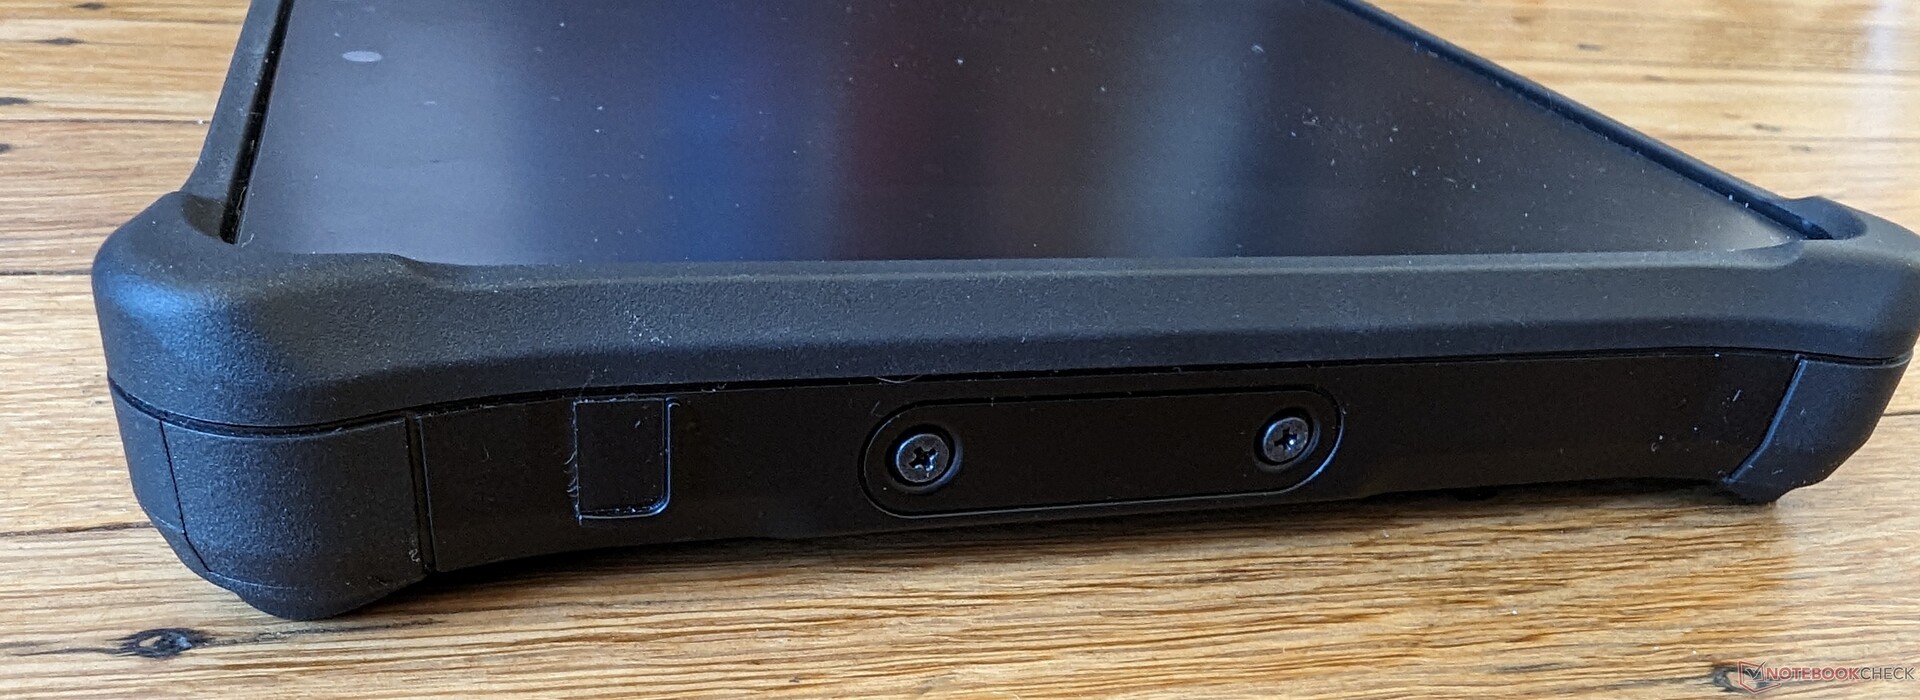
Connectivity — Thunderbolt 4 Support
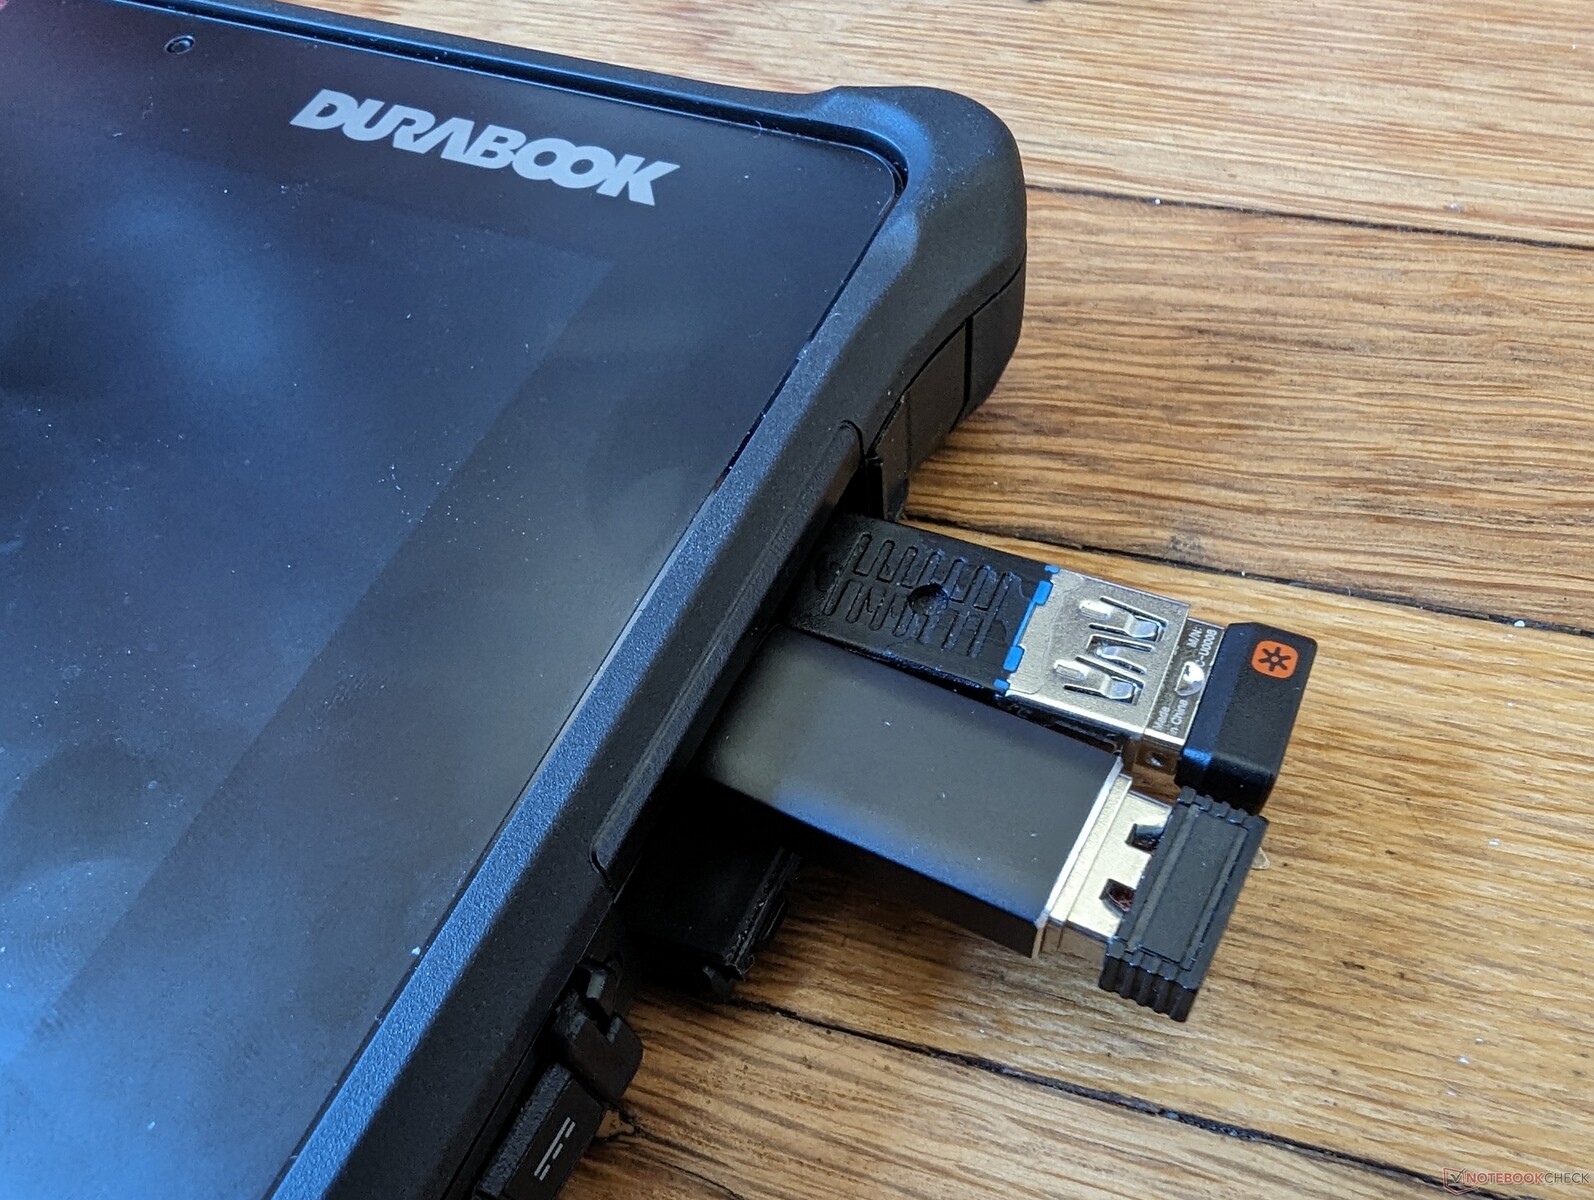
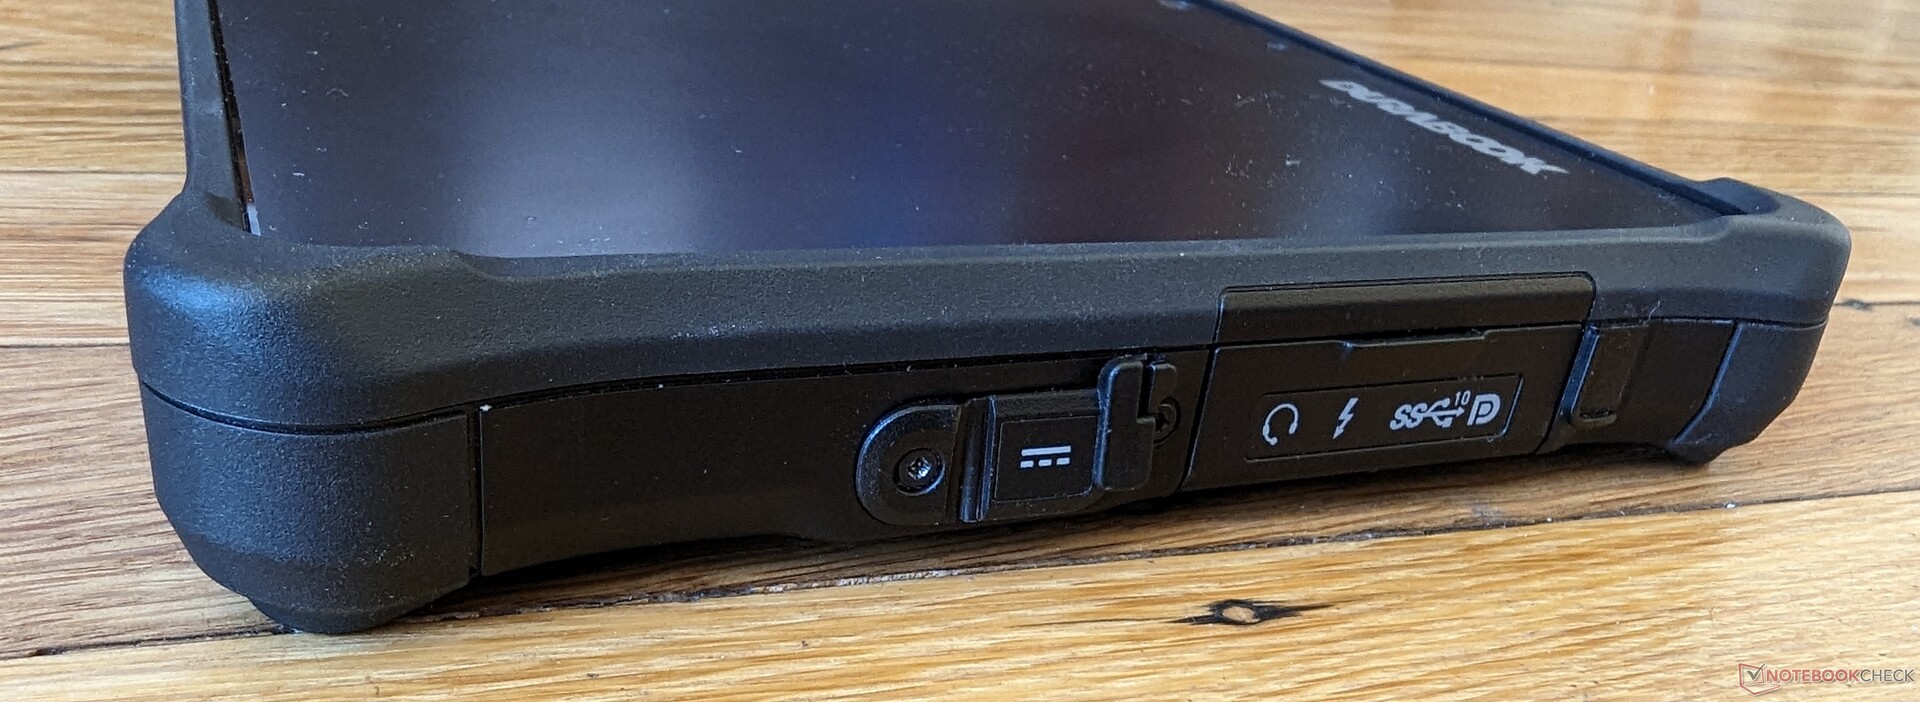
A few ports are standard on all SKUs while some can be added for an additional cost including USB-A, Gigabit RJ-45, RS232, or a barcode reader.
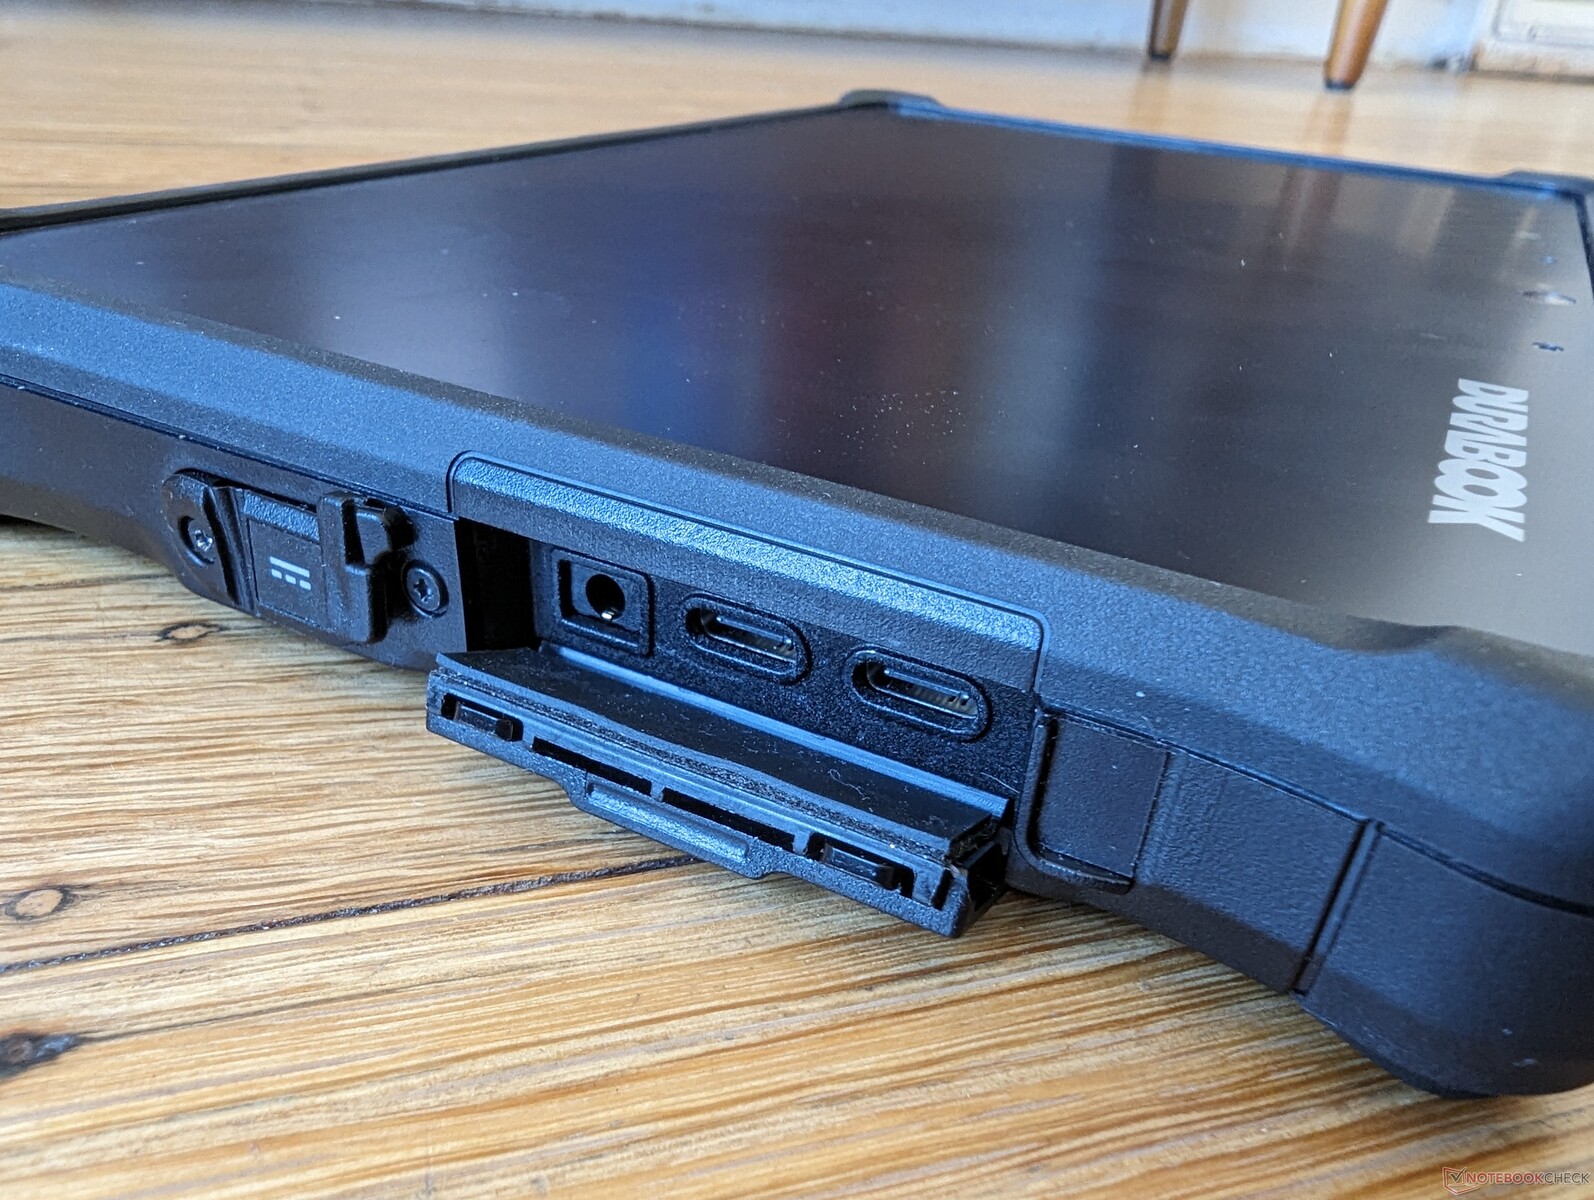
One of the two USB-C ports supports Thunderbolt 4 for a wide range of compatible external devices. However, only one of the ports supports Power Delivery. The ports are packed too tightly together and so some thicker USB-C cables or adapters may partially block access to the other ports as shown by the image to the right.
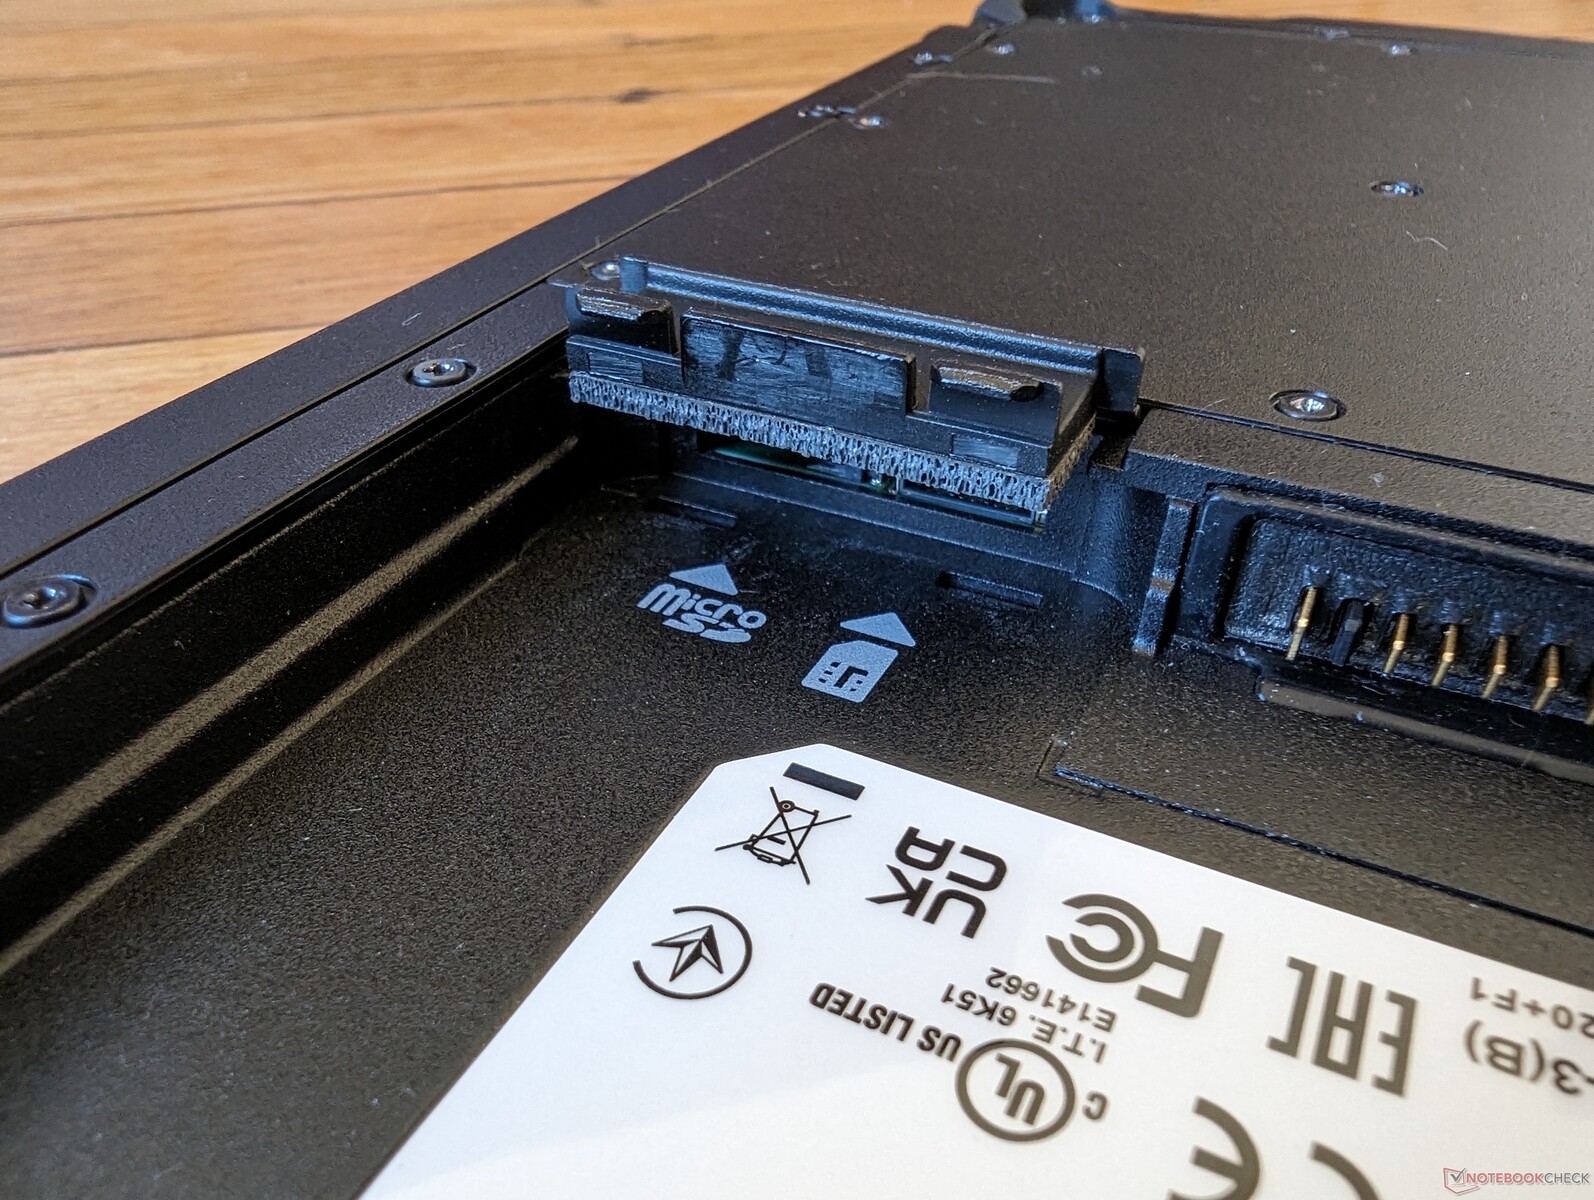
SD Card Reader — Your MicroSD Card Will Get Stuck
The spring-release for the integrated SD card reader is very weak when compared to the card readers on most other laptops and tablets. Our MicroSD test card would become stuck and require tweezers to carefully remove.
| SD Card Reader | |
| average JPG Copy Test (av. of 3 runs) | |
| Dell Latitude 7230 Rugged Extreme (AV Pro V60) | |
| Durabook R8 Tablet (AV Pro V60) | |
| Lenovo Tab M8 (Gen 4) (Angelbird V60) | |
| maximum AS SSD Seq Read Test (1GB) | |
| Dell Latitude 7230 Rugged Extreme (AV Pro V60) | |
| Durabook R8 Tablet (AV Pro V60) | |
Communication
An Intel AX211 comes standard for Wi-Fi 6E and Bluetooth 5.3 connectivity. Transfer rates are steady with no issues.
| Networking | |
| iperf3 transmit AX12 | |
| Panasonic Toughbook FZ-G2 | |
| Acer Enduro T1 ET108-11A A9001 | |
| iperf3 receive AX12 | |
| Panasonic Toughbook FZ-G2 | |
| Acer Enduro T1 ET108-11A A9001 | |
| iperf3 transmit AXE11000 | |
| Durabook R8 Tablet | |
| Dell Latitude 7230 Rugged Extreme | |
| Lenovo Tab M8 (Gen 4) | |
| iperf3 receive AXE11000 | |
| Durabook R8 Tablet | |
| Dell Latitude 7230 Rugged Extreme | |
| Lenovo Tab M8 (Gen 4) | |
| iperf3 transmit AXE11000 6GHz | |
| Dell Latitude 7230 Rugged Extreme | |
| Durabook R8 Tablet | |
| iperf3 receive AXE11000 6GHz | |
| Durabook R8 Tablet | |
| Dell Latitude 7230 Rugged Extreme | |
Webcam
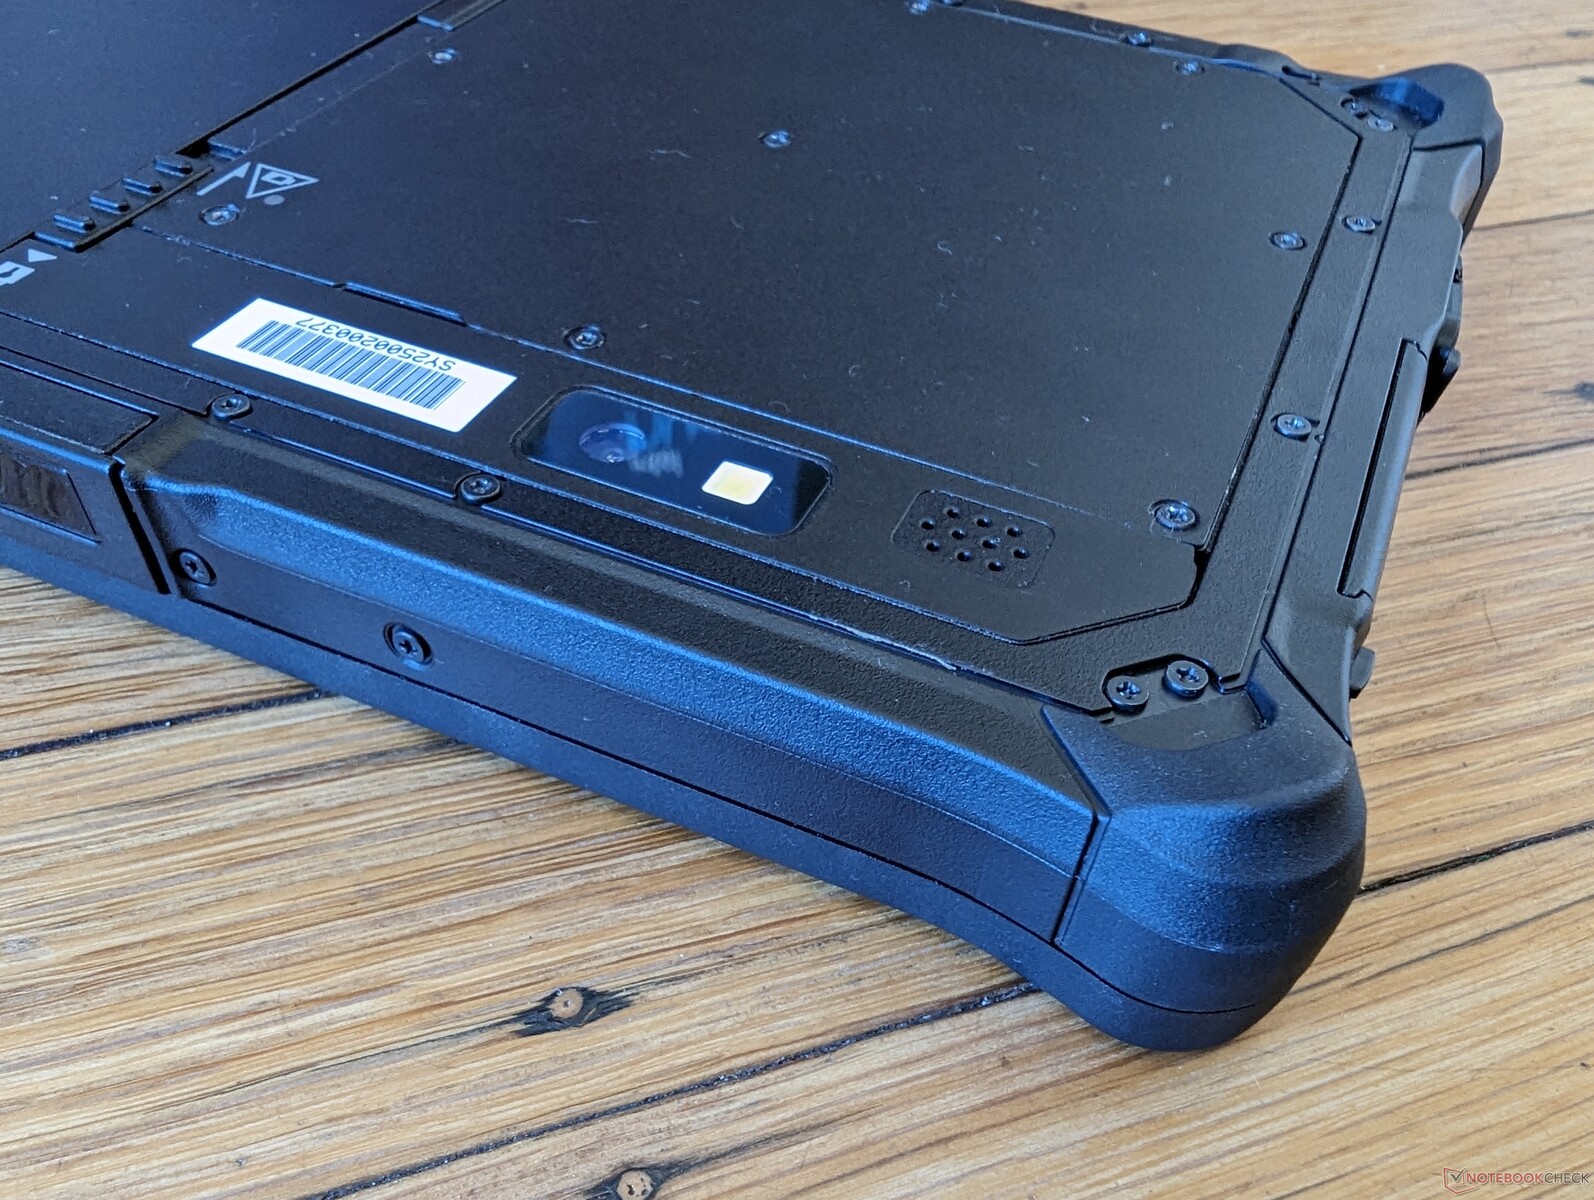
The 2 MP front camera comes standard while the rear 8 MP camera with flash is an optional upgrade. Image quality is sharper than the webcams on laptops, but video quality is limited to 1080p and 30 FPS despite the higher resolution sensor.


Maintenance
Accessories And Warranty
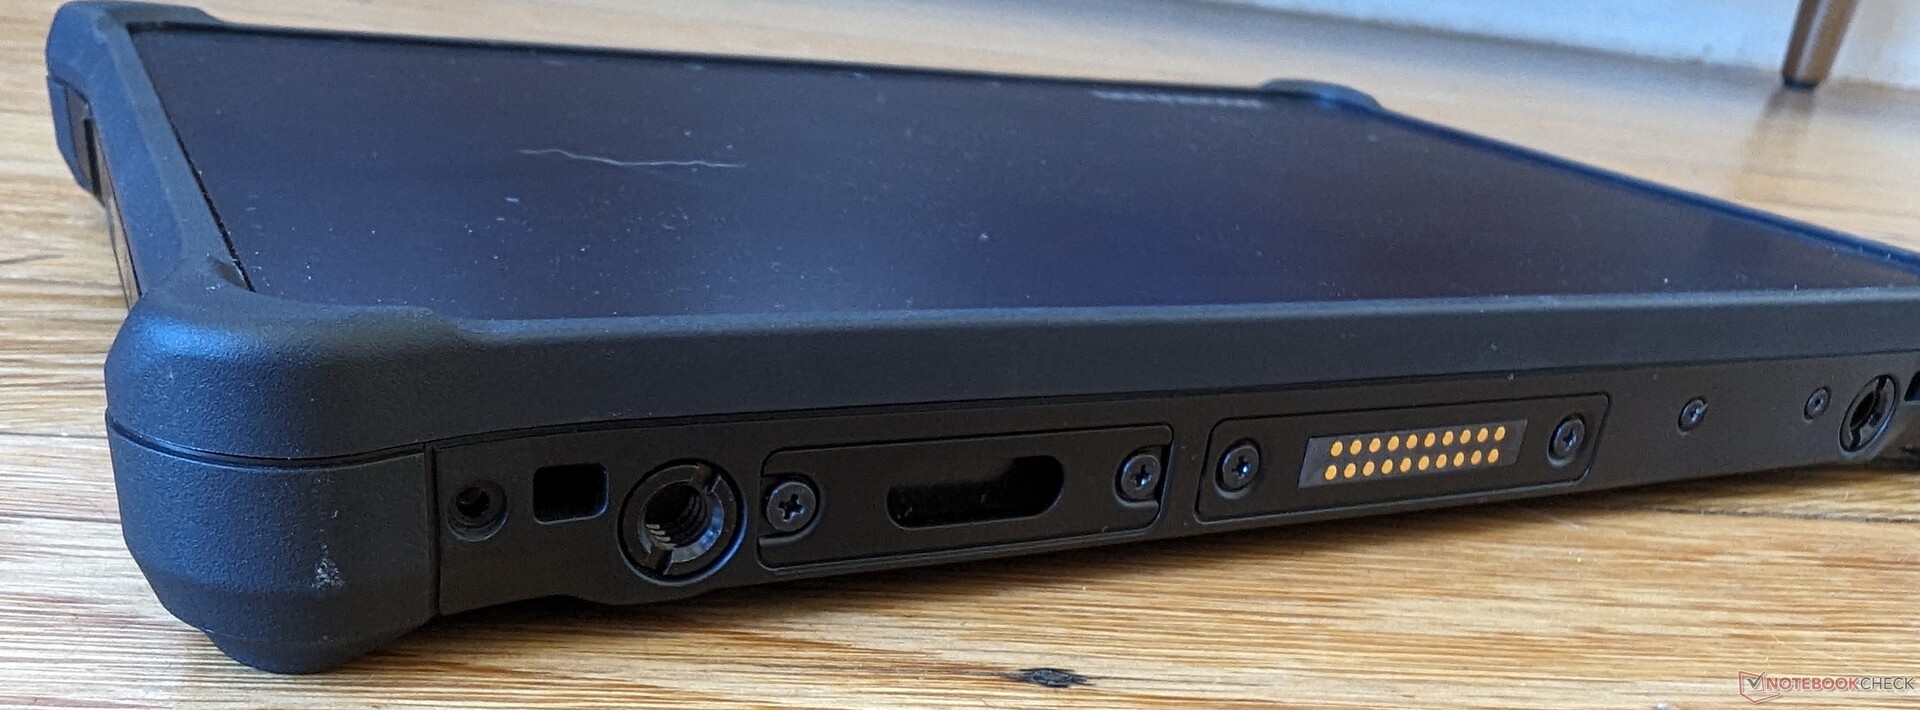
The retail box includes a passive stylus and a wrist lanyard. Optional accessories are wide-reaching such as a specialized docking station stand with additional ports, higher capacity spare battery, battery charging bays, smart card readers, different types of AC adapters, and much more as detailed here.
A three-year accidental damage warranty comes standard.
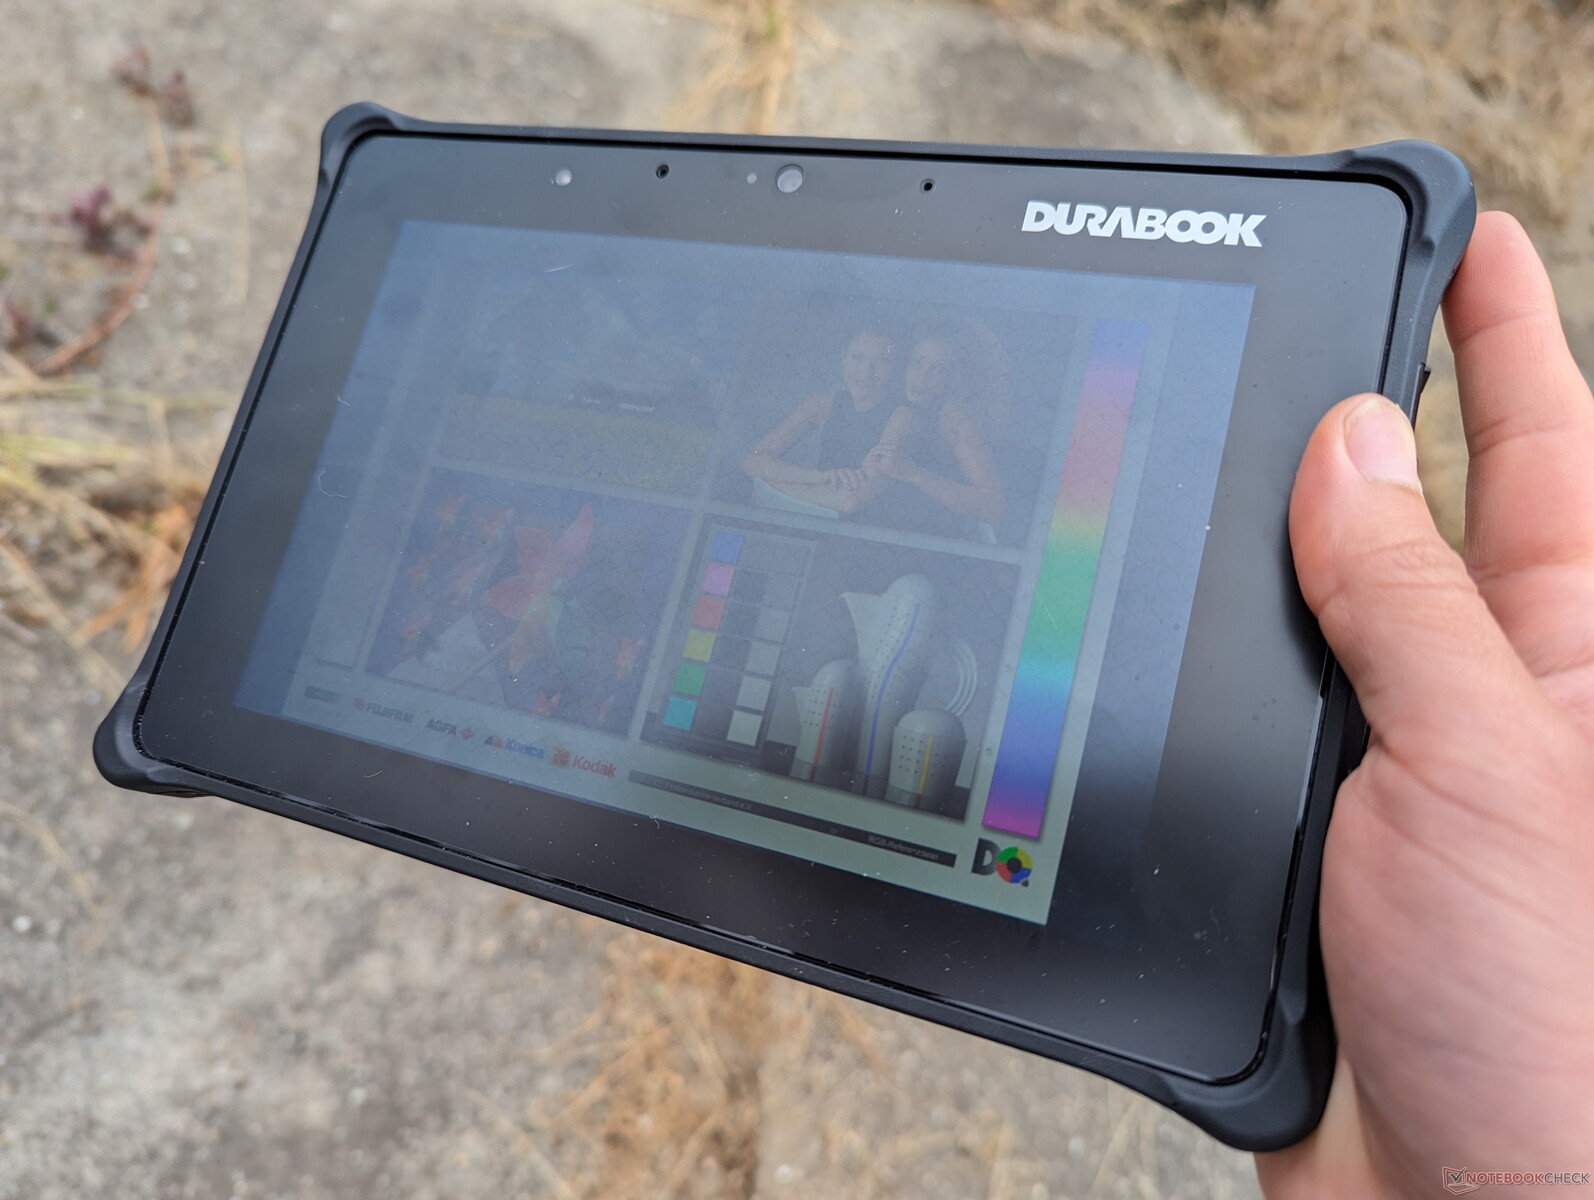
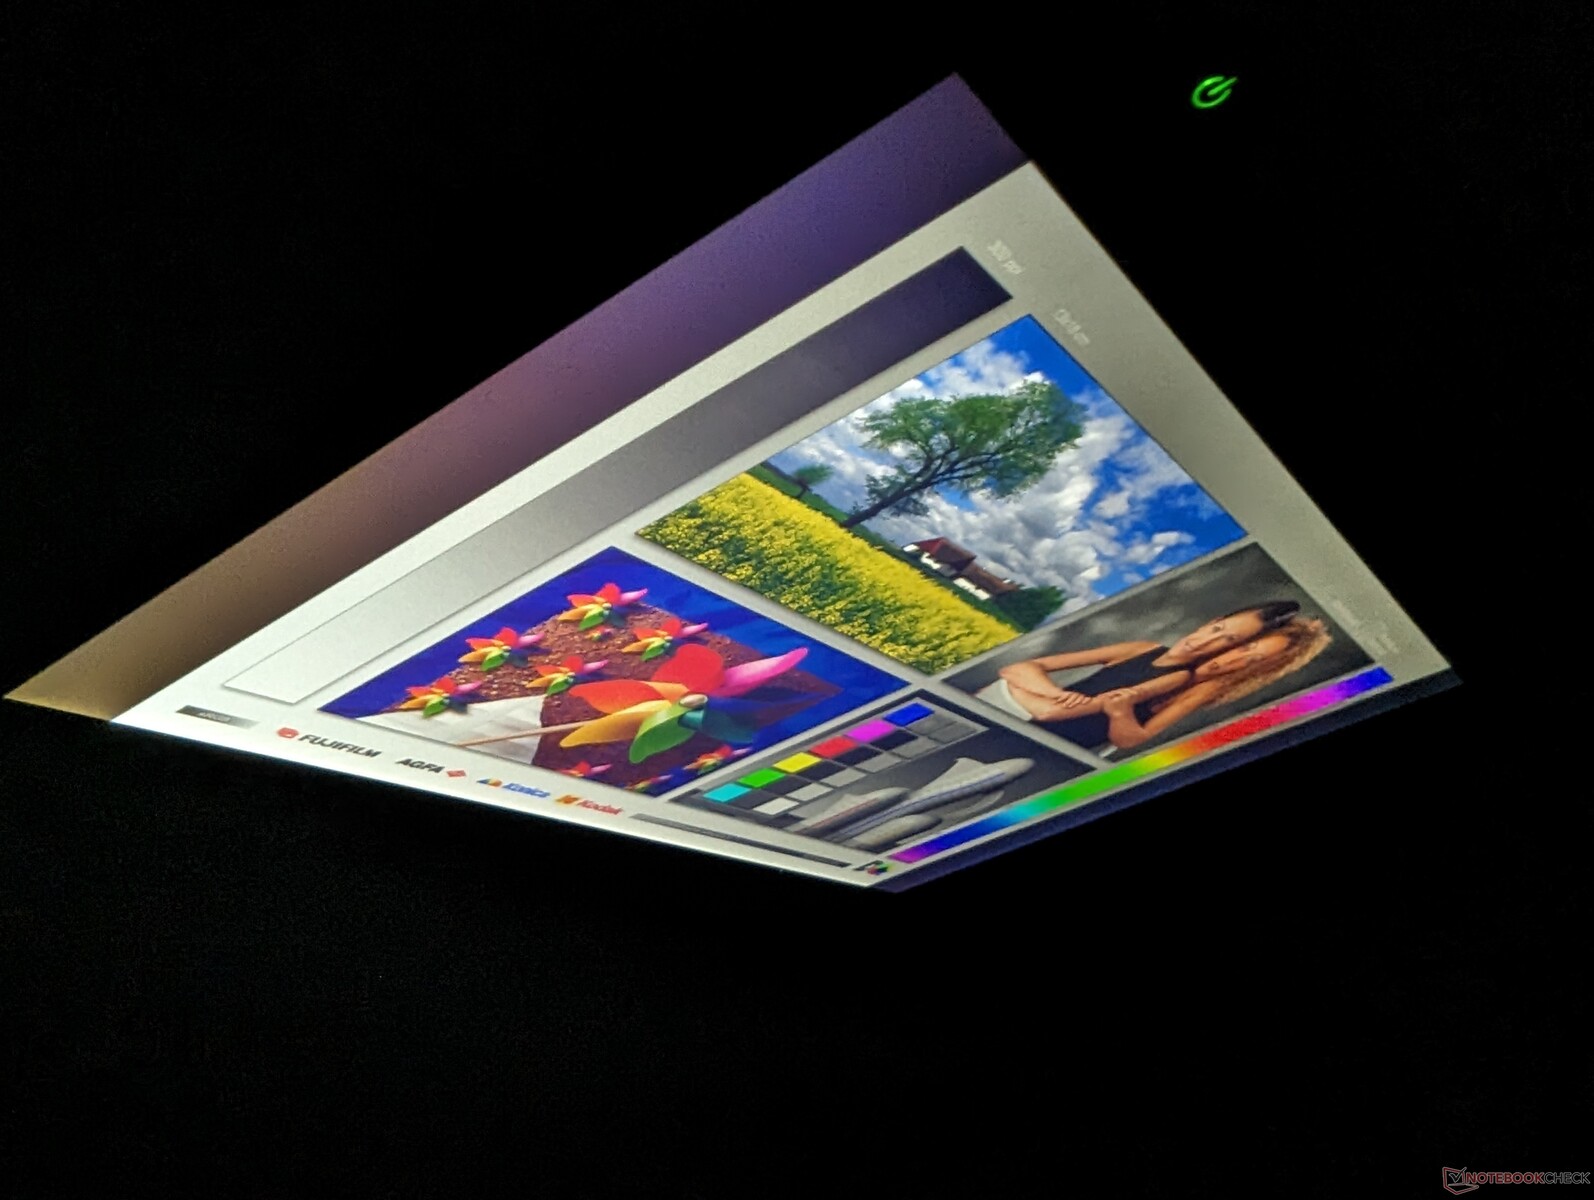
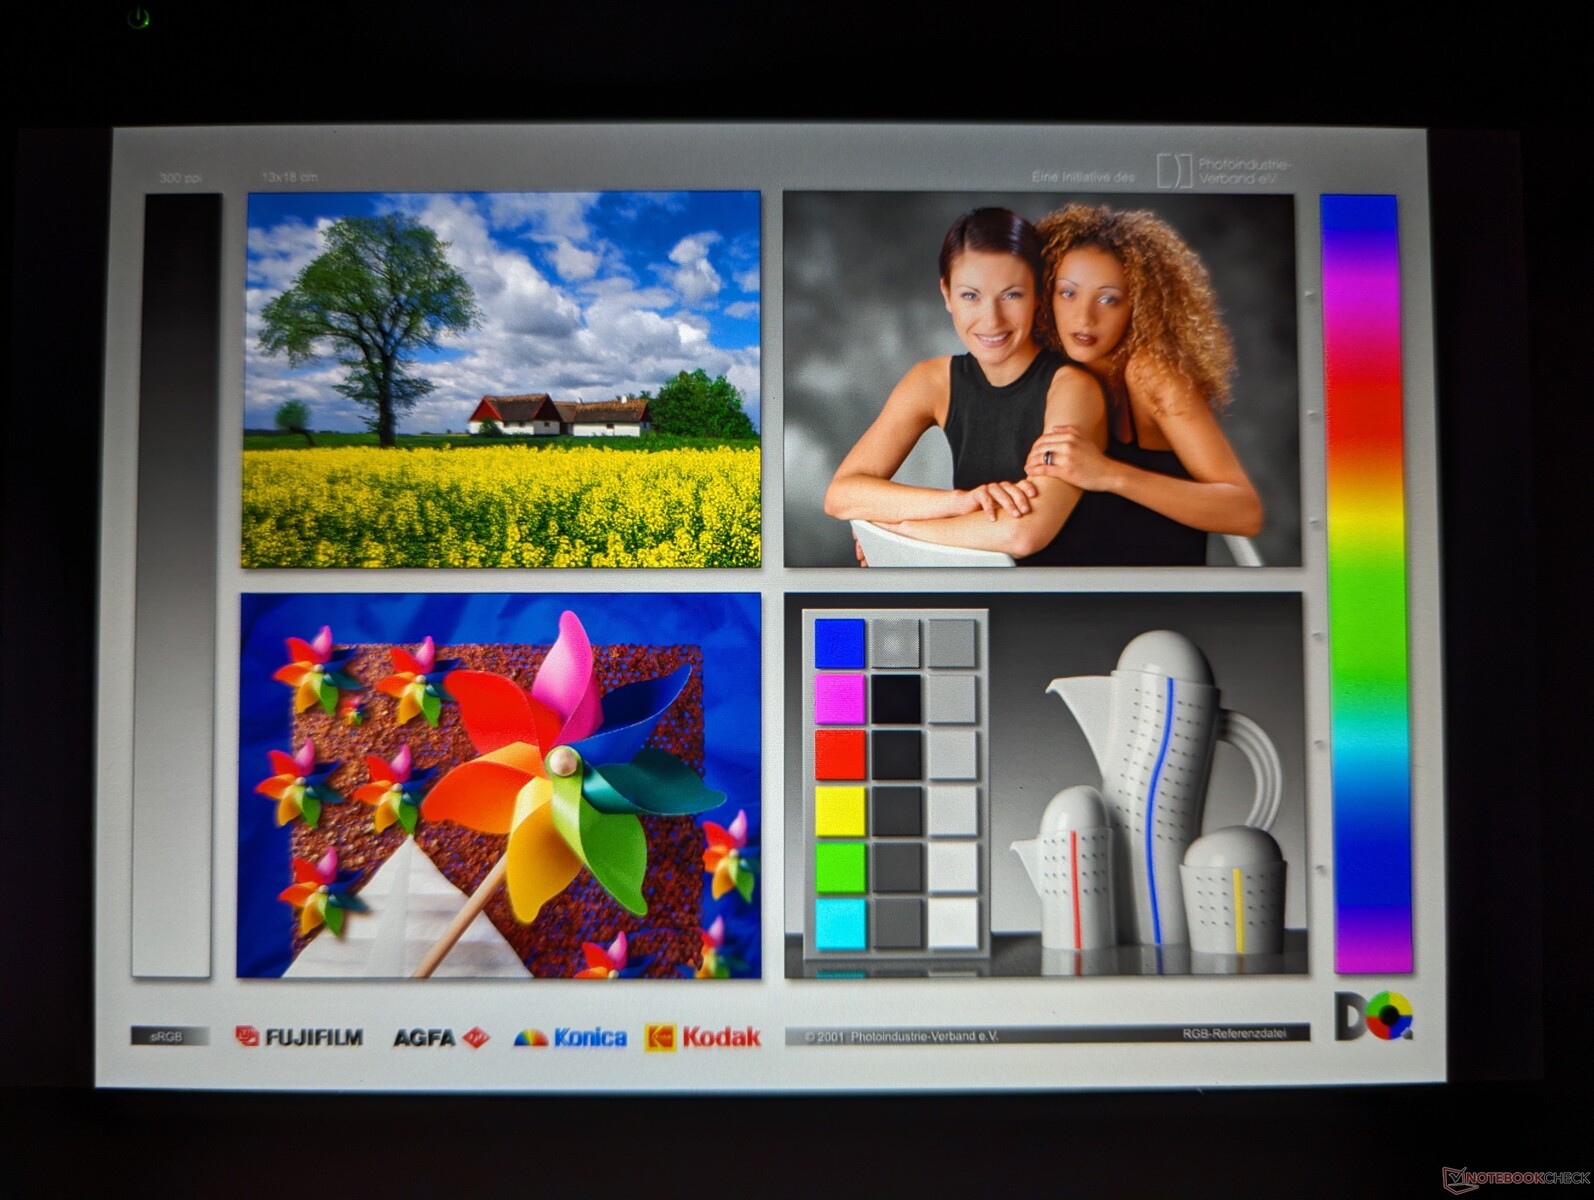
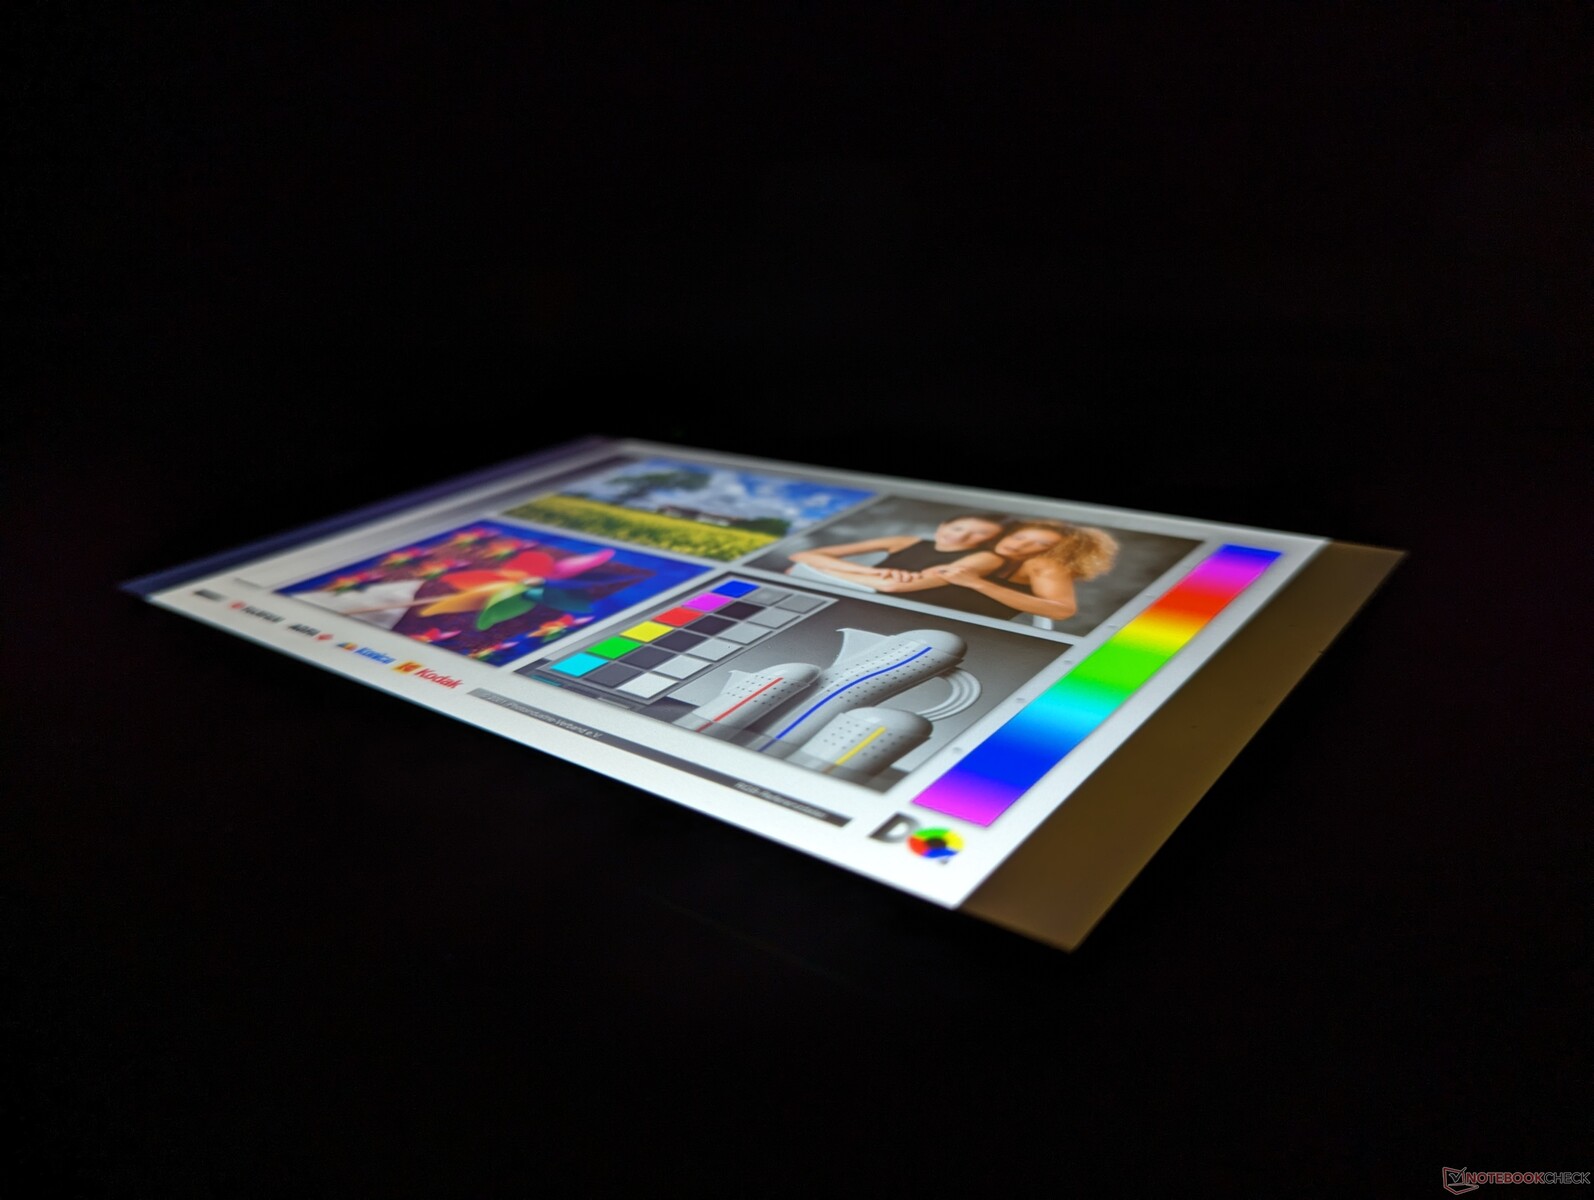
Display — Bright 800-nit Touchscreen
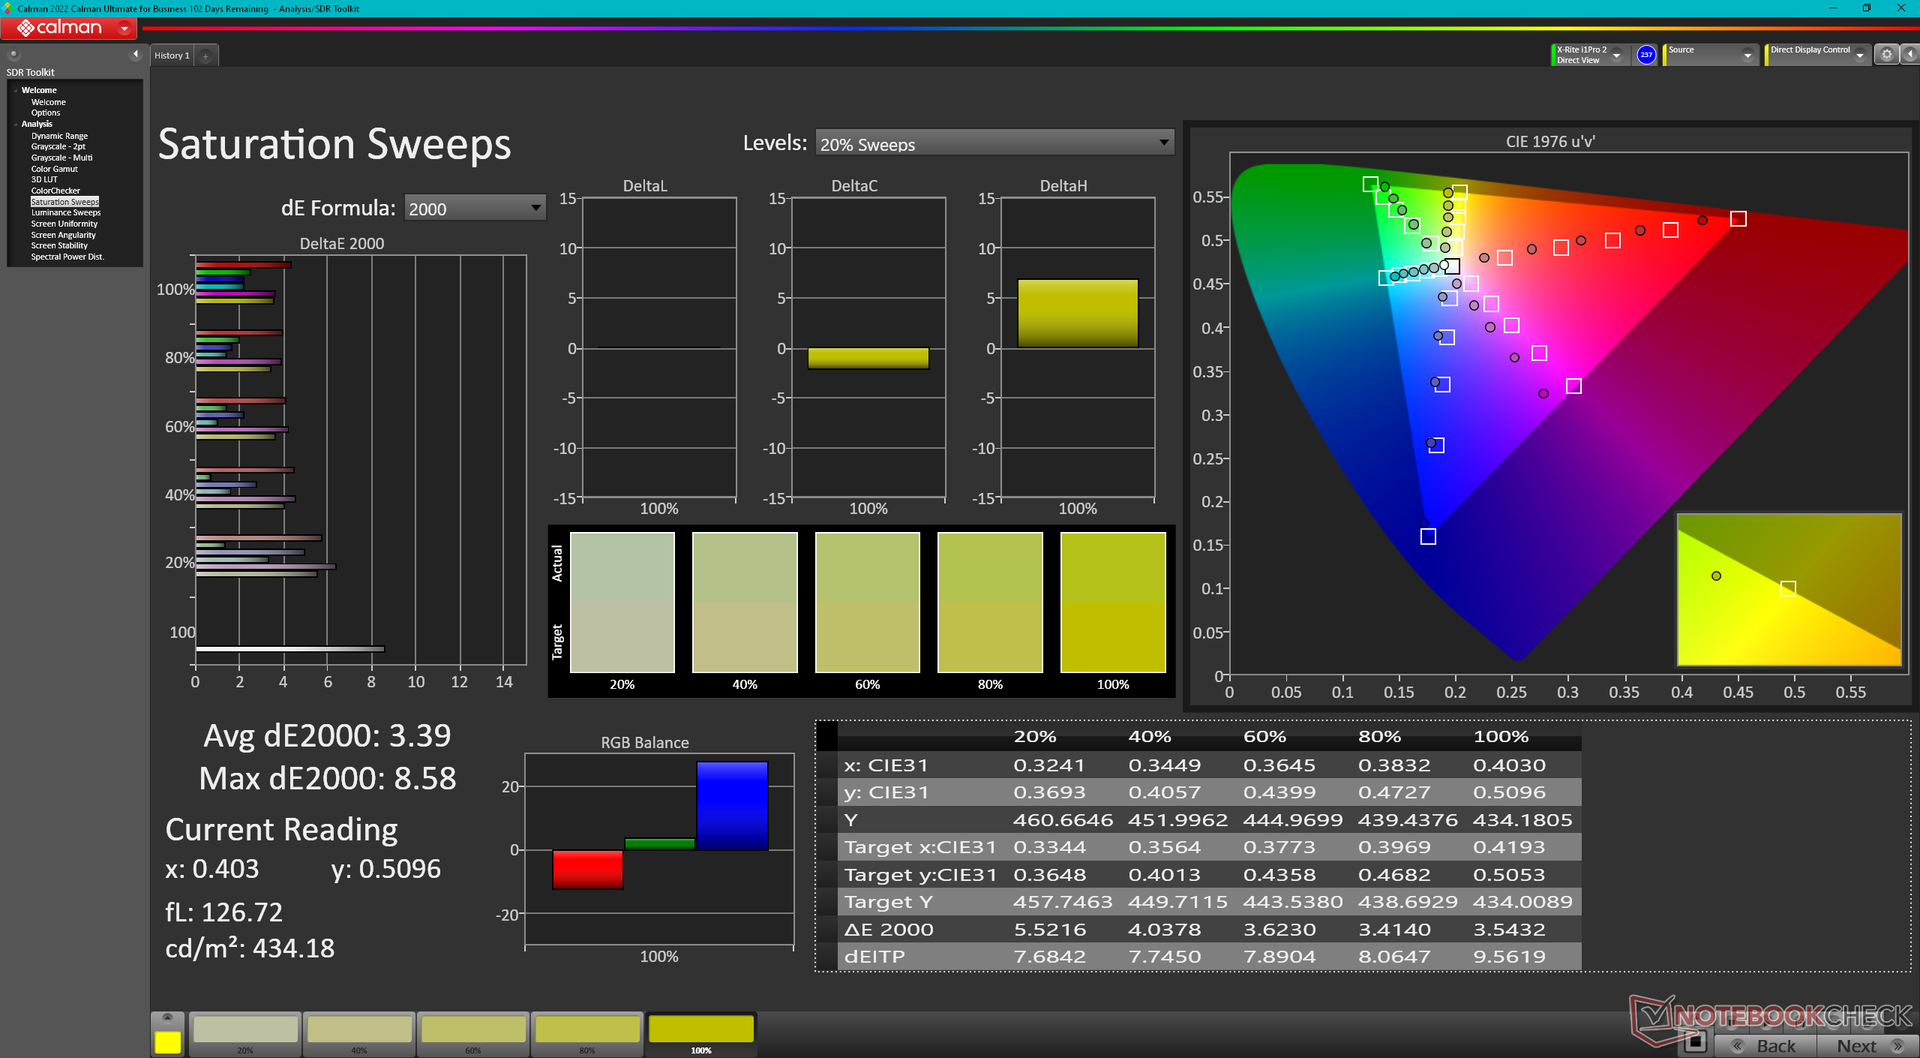
The manufacturer advertises a maximum brightness of 800 nits which we can confirm with our own independent measurements. Contrast ratio is also respectable at just over 1000:1 to be similar to the displays on most consumer laptops. Unfortunately, other aspects of the display are mediocre including the limited color coverage, average response times, and somewhat grainy pixels. If your workloads require images and small texts to be as sharp as possible, then the Durabook R8 may not be for you.
The multi-touch touchscreen can be toggled between capacitive mode for finger inputs or resistive mode for glove or stylus inputs.


| |||||||||||||||||||||||||
Brightness Distribution: 85 %
Center on Battery: 943.7 cd/m²
Contrast: 1110:1 (Black: 0.85 cd/m²)
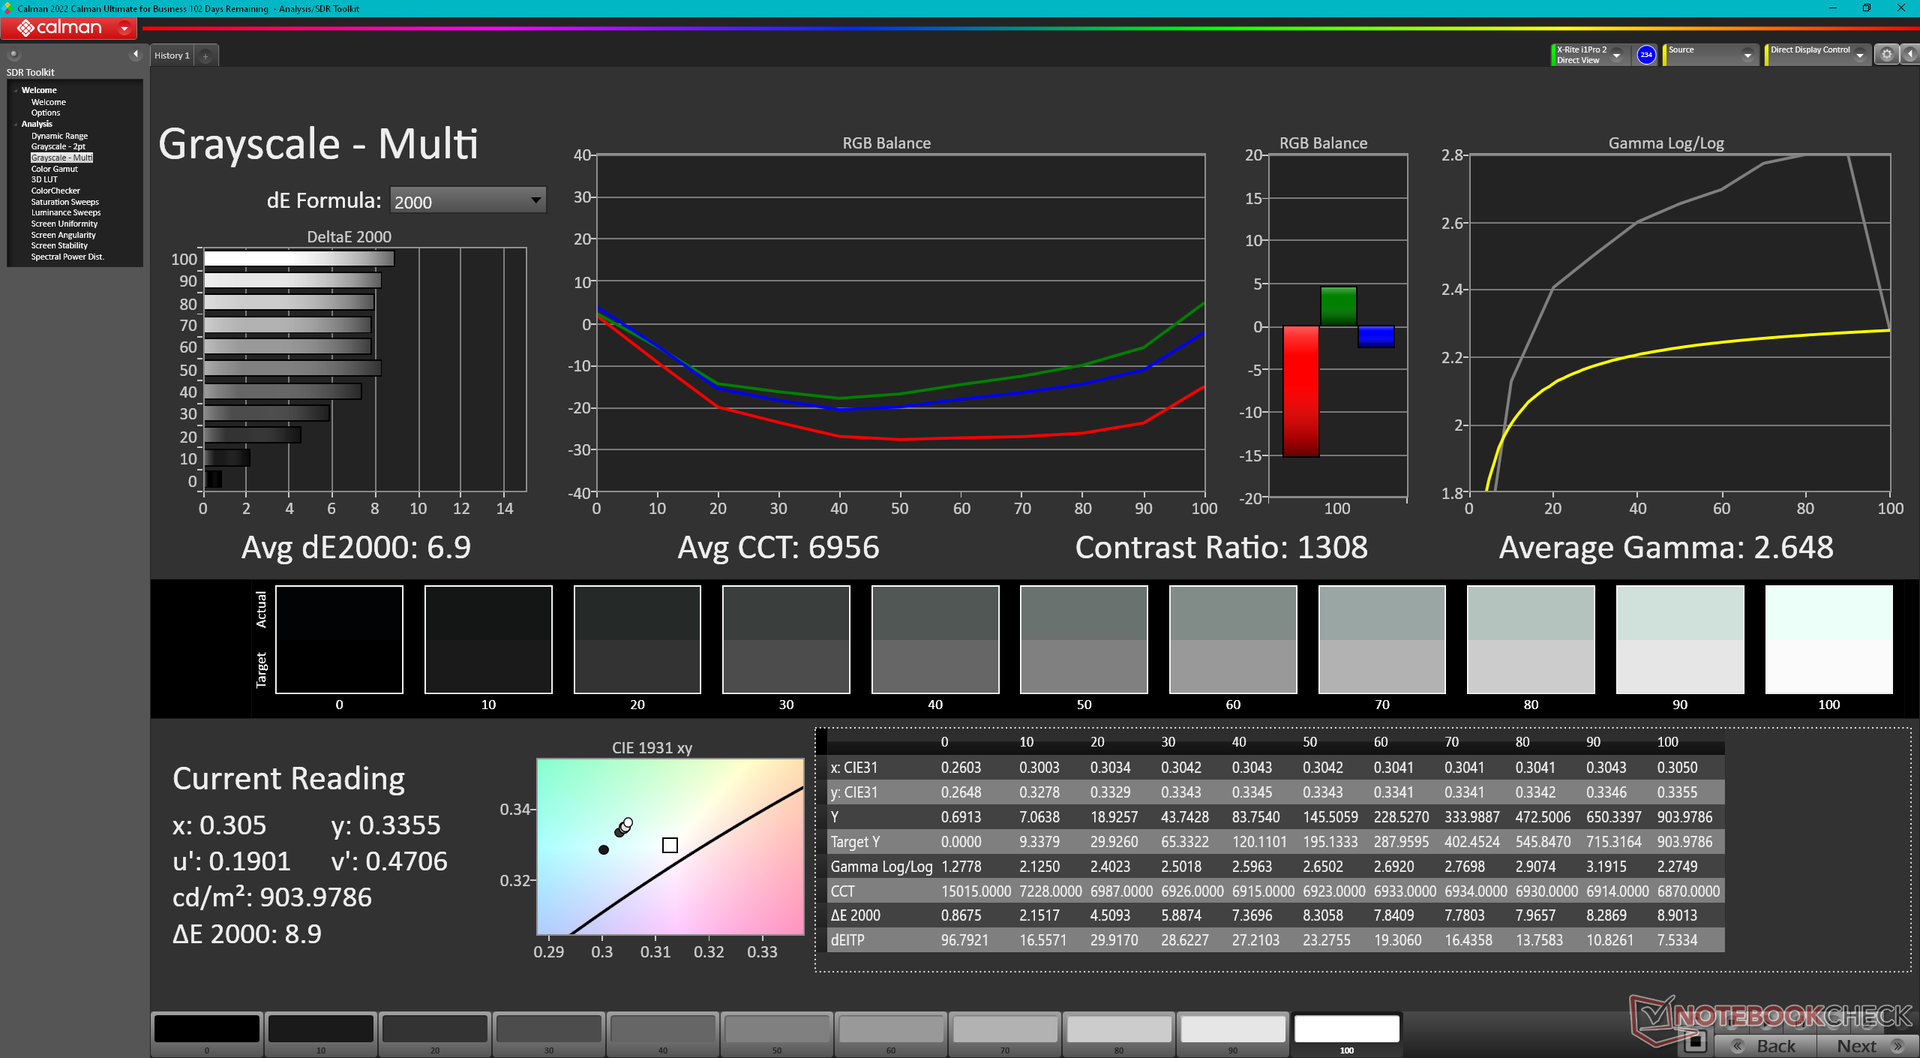
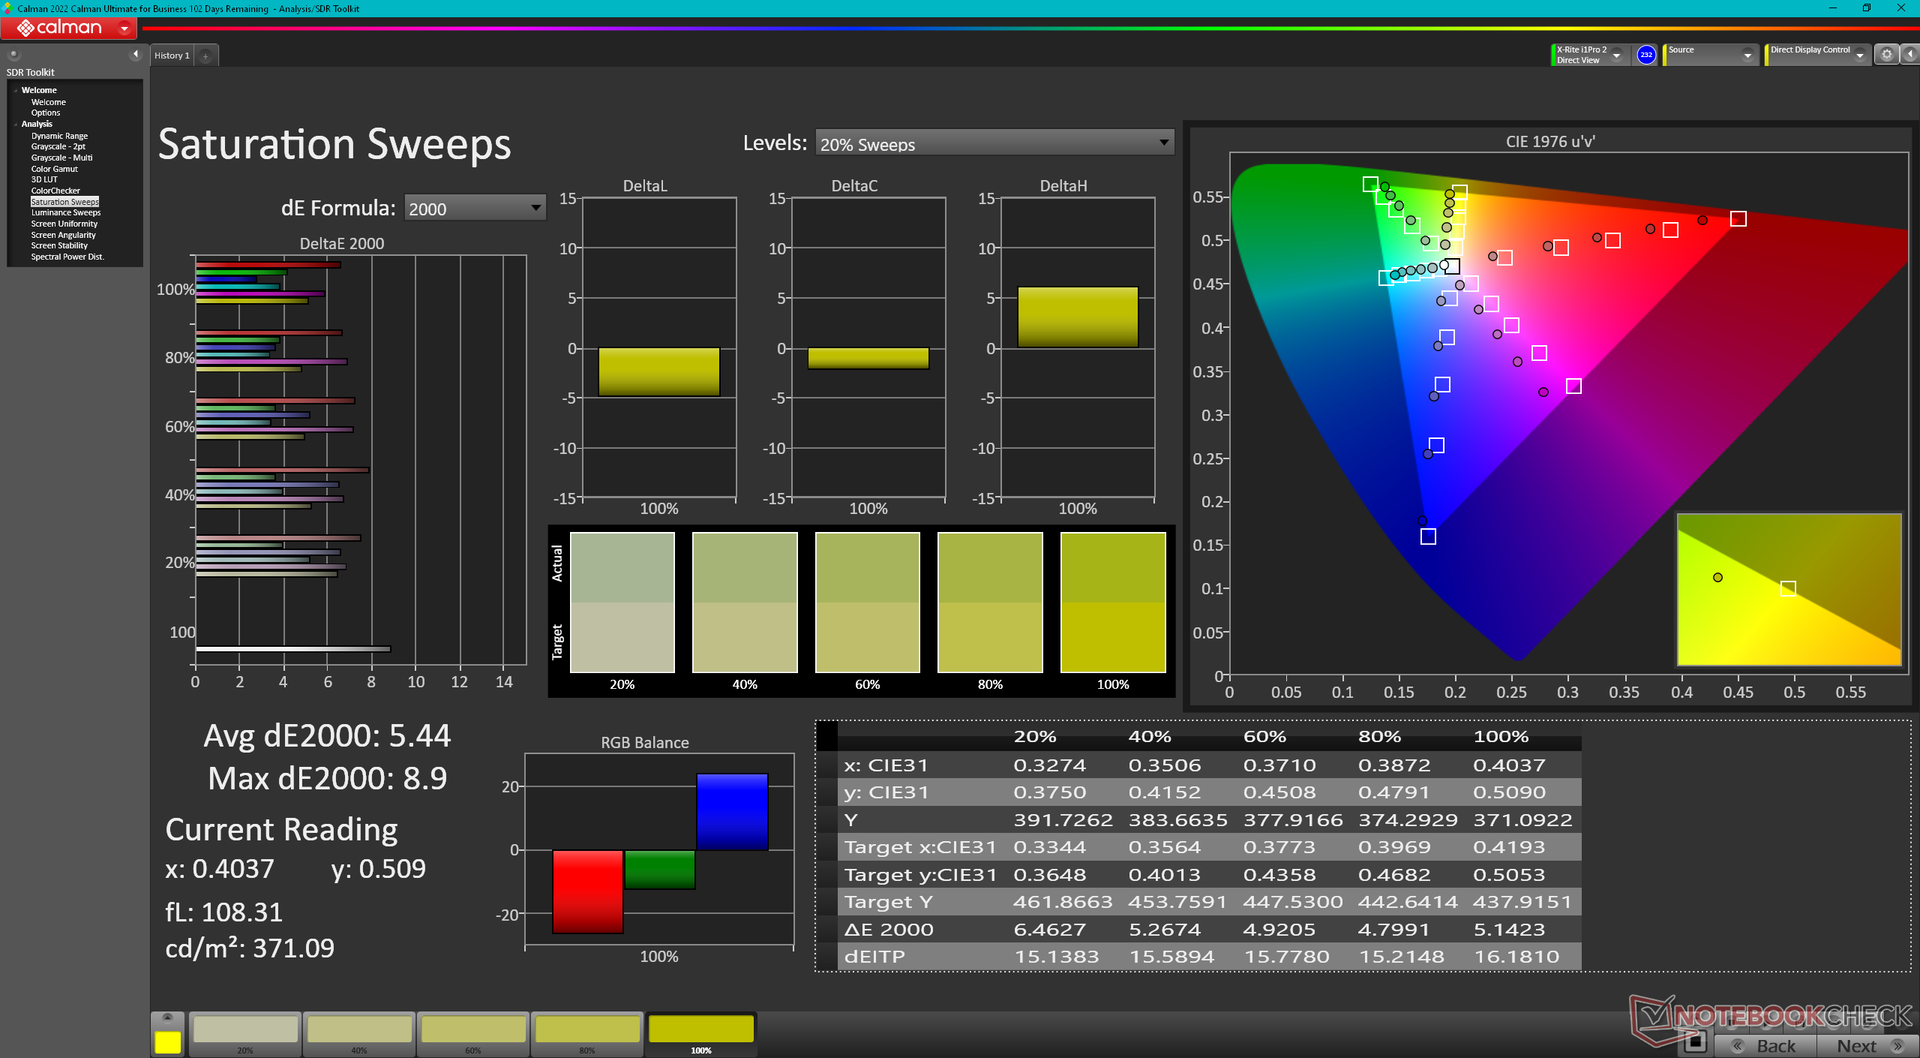
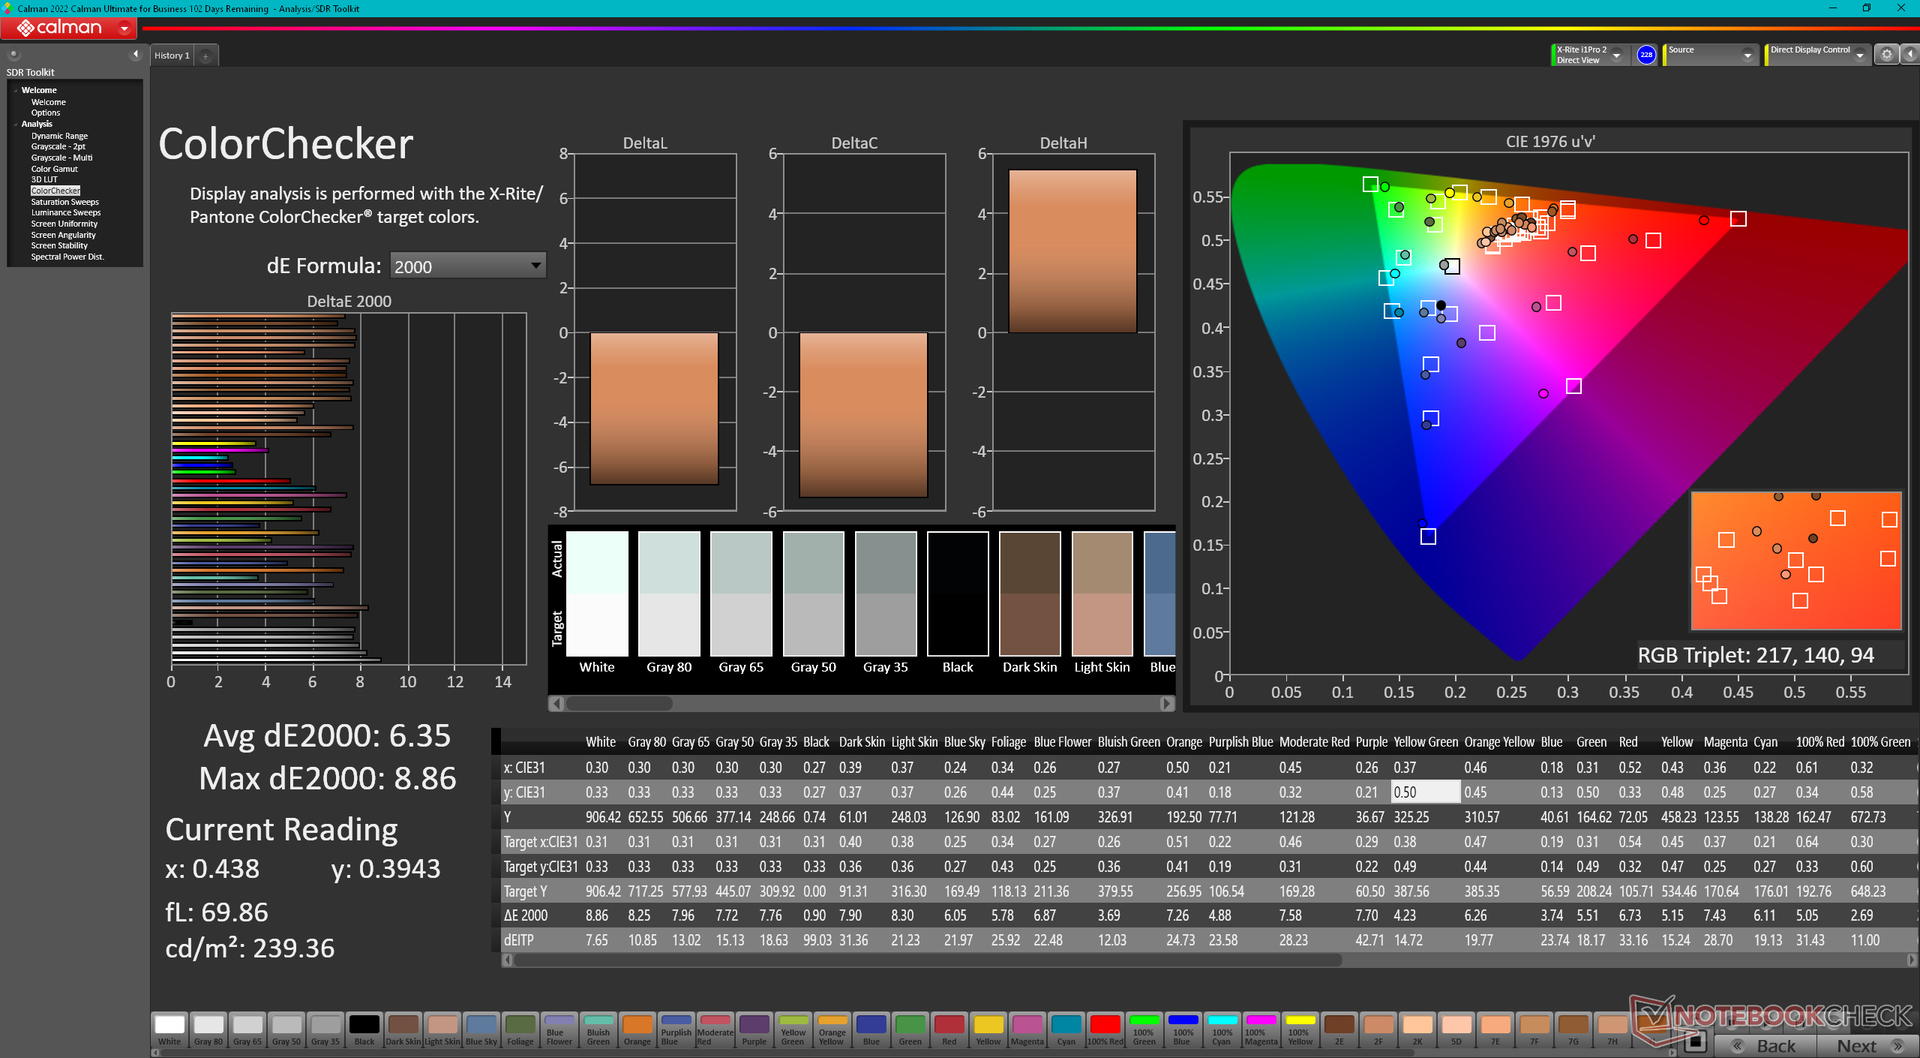
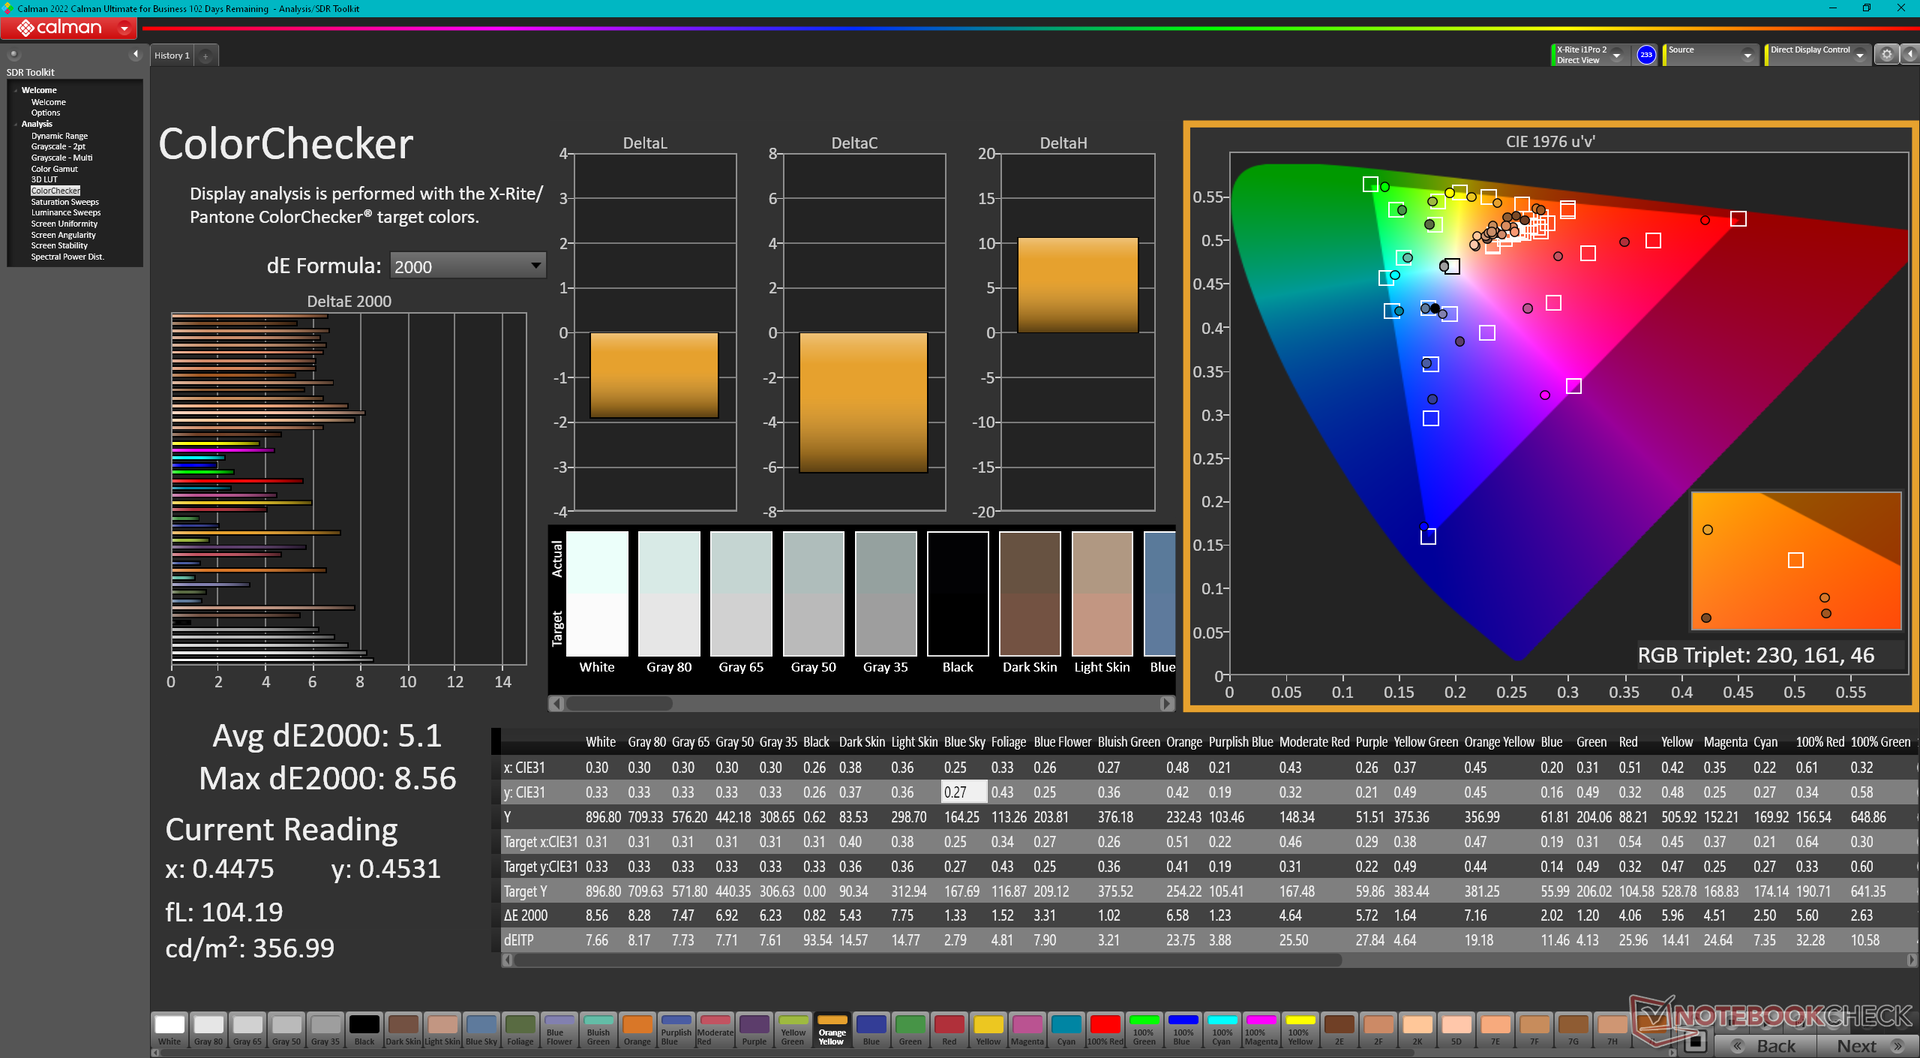
ΔE ColorChecker Calman: 6.35 | ∀{0.5-29.43 Ø4.71}
calibrated: 5.1
ΔE Greyscale Calman: 6.9 | ∀{0.09-98 Ø4.96}
53.1% AdobeRGB 1998 (Argyll 3D)
77.4% sRGB (Argyll 3D)
51.5% Display P3 (Argyll 3D)
Gamma: 2.65
CCT: 6956 K
| Durabook R8 Tablet Digital Flat Panel, IPS, 1280x800, 8" | Acer Enduro T1 ET108-11A A9001 IPS, 1280x800, 8" | Lenovo Tab M8 (Gen 4) IPS, 1280x800, 8" | Dell Latitude 7230 Rugged Extreme Sharp LQ120N1, IPS, 1920x1200, 12" | Panasonic Toughbook FZ-G2 InfoVision M133NWFD R1, IPS, 1920x1200, 10.1" | |
|---|---|---|---|---|---|
| Display | 27% | 1% | |||
| Display P3 Coverage (%) | 51.5 | 66.2 29% | 52.1 1% | ||
| sRGB Coverage (%) | 77.4 | 96.1 24% | 78.5 1% | ||
| AdobeRGB 1998 Coverage (%) | 53.1 | 68.4 29% | 53.8 1% | ||
| Response Times | -20% | -34% | 12% | -63% | |
| Response Time Grey 50% / Grey 80% * (ms) | 32.4 ? | 33.6 ? -4% | 29.2 ? 10% | 28.4 ? 12% | 54.4 ? -68% |
| Response Time Black / White * (ms) | 21.9 ? | 29.6 ? -35% | 39 ? -78% | 19.4 ? 11% | 34.4 ? -57% |
| PWM Frequency (Hz) | 300 ? | 211.9 ? | |||
| Screen | 2% | 17% | 47% | 38% | |
| Brightness middle (cd/m²) | 943.7 | 350 -63% | 410 -57% | 1326.7 41% | 1078.6 14% |
| Brightness (cd/m²) | 870 | 353 -59% | 380 -56% | 1193 37% | 1056 21% |
| Brightness Distribution (%) | 85 | 92 8% | 86 1% | 82 -4% | 90 6% |
| Black Level * (cd/m²) | 0.85 | 0.21 75% | 0.16 81% | 0.85 -0% | 0.48 44% |
| Contrast (:1) | 1110 | 1667 50% | 2563 131% | 1561 41% | 2247 102% |
| Colorchecker dE 2000 * | 6.35 | 5.68 11% | 4.6 28% | 1.06 83% | 4.18 34% |
| Colorchecker dE 2000 max. * | 8.86 | 10.51 -19% | 9.03 -2% | 3.78 57% | 6.2 30% |
| Colorchecker dE 2000 calibrated * | 5.1 | 0.71 86% | 1.95 62% | ||
| Greyscale dE 2000 * | 6.9 | 6.3 9% | 6.3 9% | 1.5 78% | 4.8 30% |
| Gamma | 2.65 83% | 2.12 104% | 2.519 87% | 2.19 100% | 2.05 107% |
| CCT | 6956 93% | 7390 88% | 7707 84% | 6804 96% | 7565 86% |
| Total Average (Program / Settings) | -9% /
-3% | -9% /
7% | 29% /
37% | -8% /
16% |
* ... smaller is better

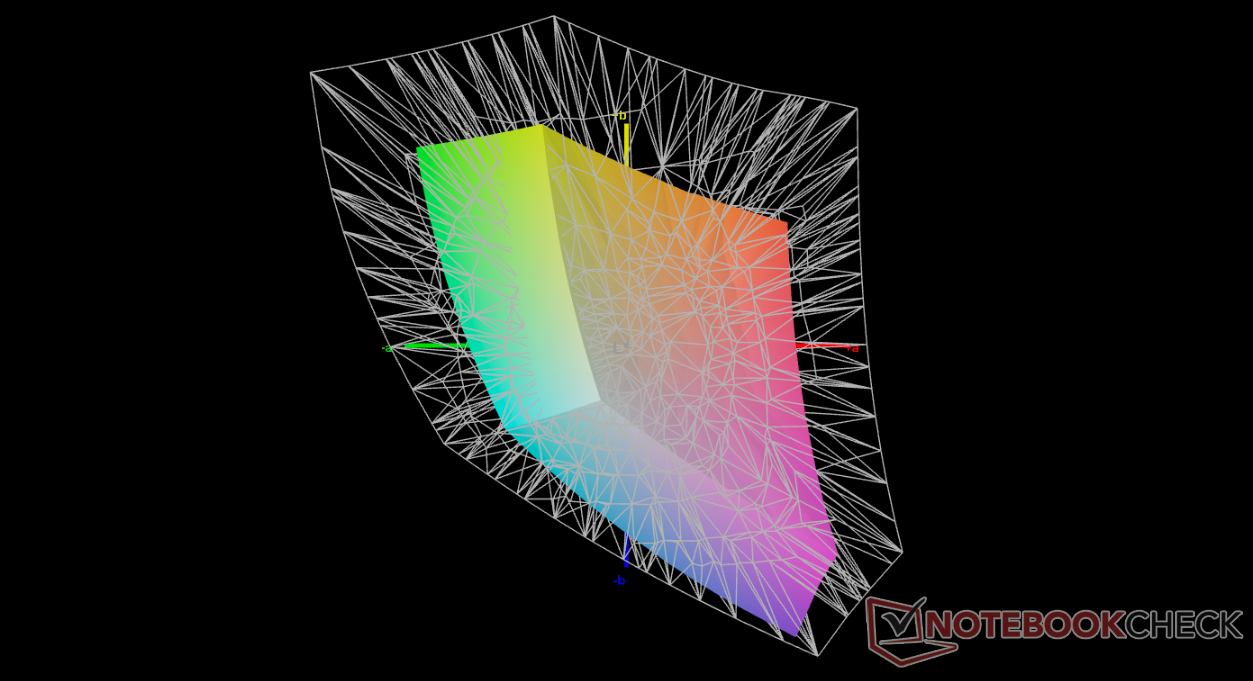
Color temperature is on the cool side by default. Calibrating the display with our X-Rite colorimeter would not result in significant improvements due to the limited gamut of the panel mentioned above.
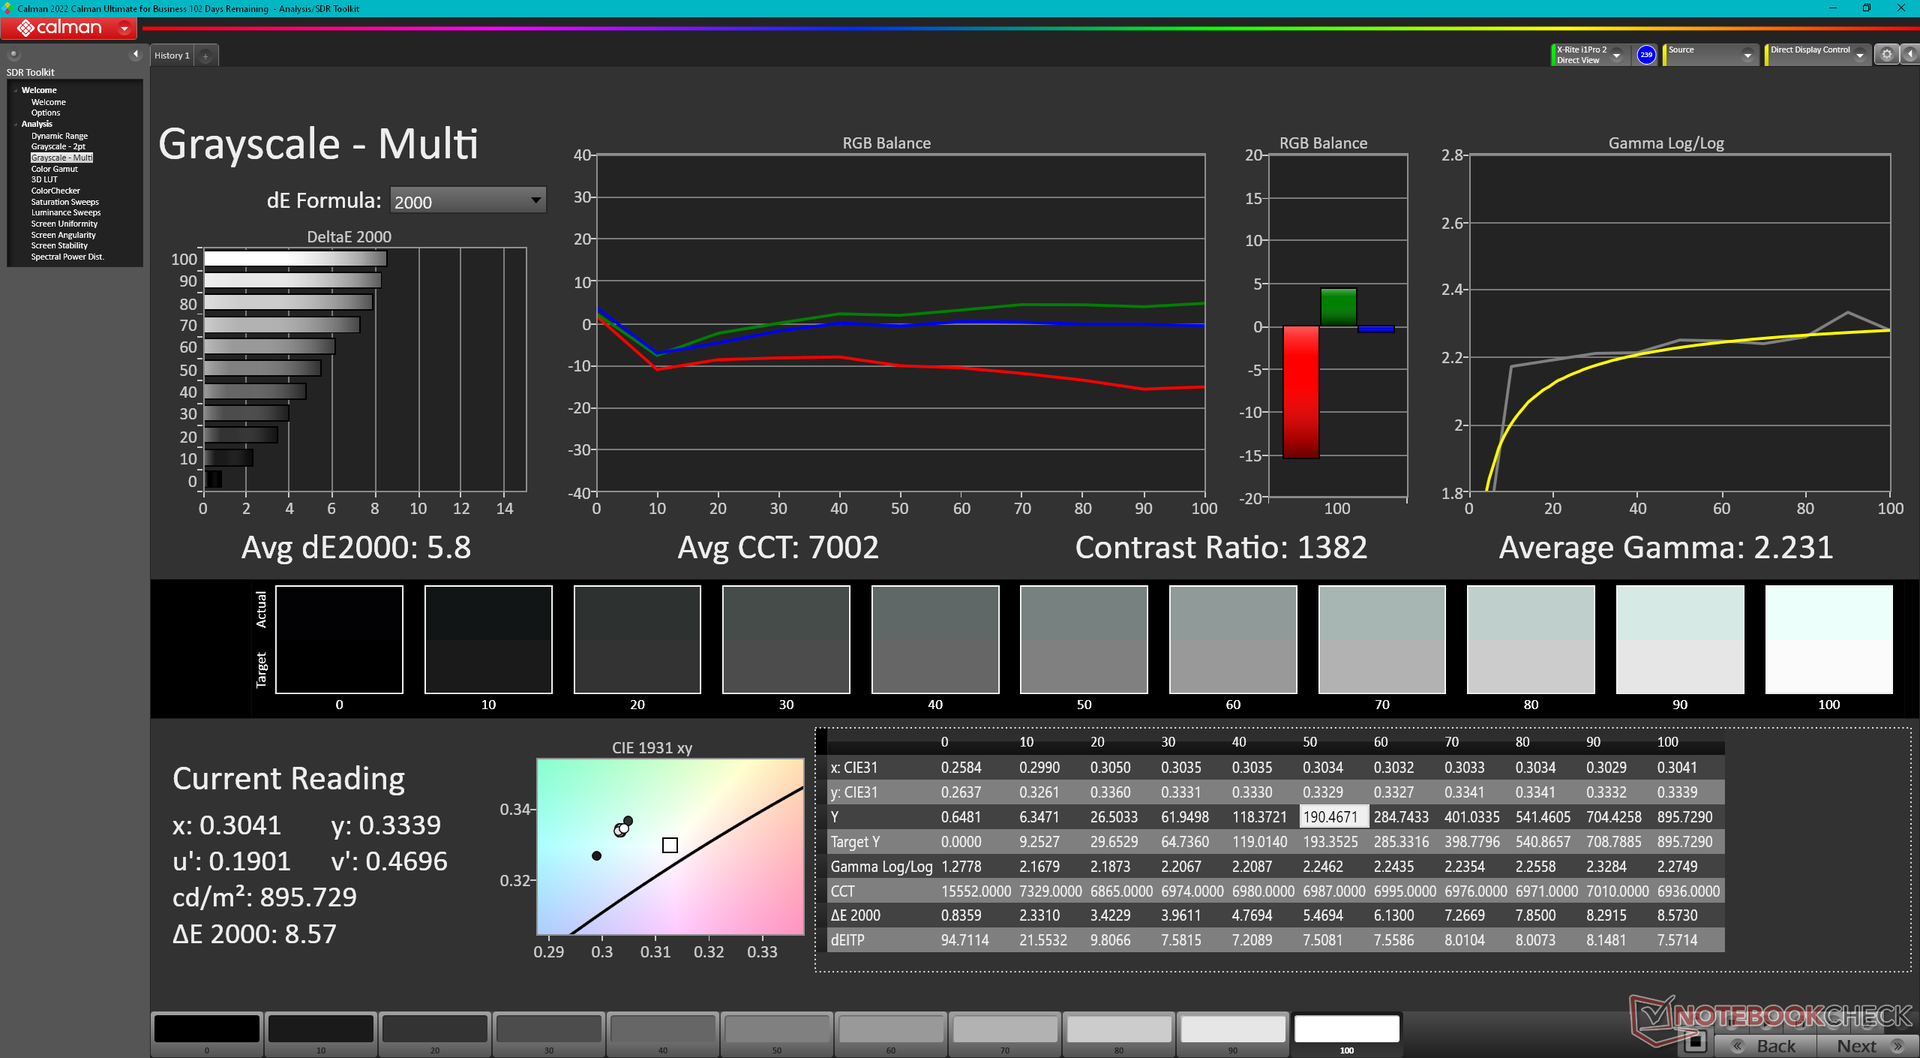
Display Response Times
| ↔ Response Time Black to White | ||
|---|---|---|
| 21.9 ms ... rise ↗ and fall ↘ combined | ↗ 14.2 ms rise | 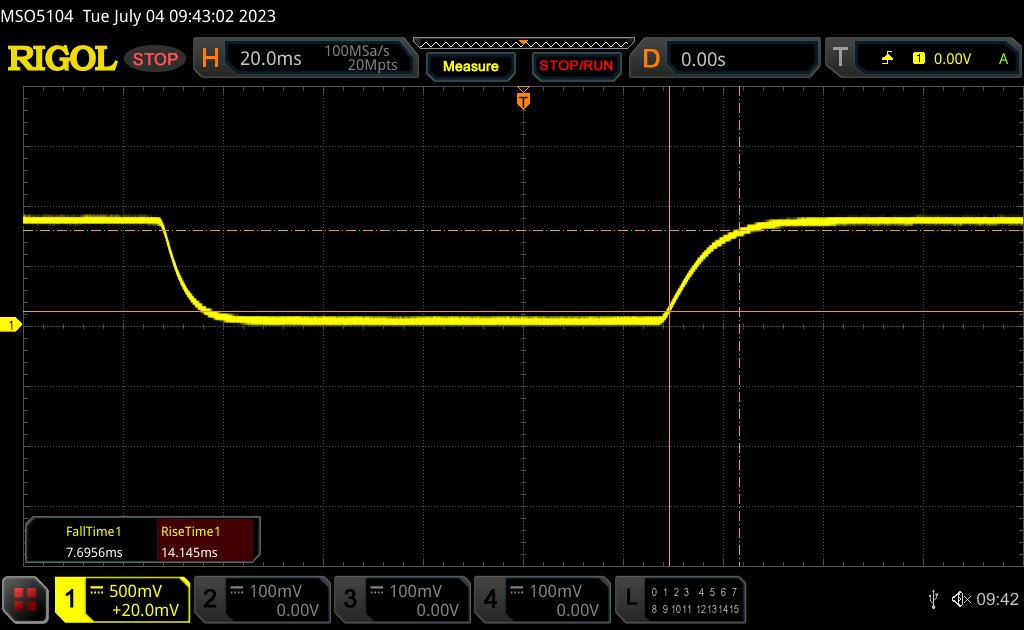 |
| ↘ 7.7 ms fall | ||
| The screen shows good response rates in our tests, but may be too slow for competitive gamers. In comparison, all tested devices range from 0.1 (minimum) to 240 (maximum) ms. » 49 % of all devices are better. This means that the measured response time is worse than the average of all tested devices (19.8 ms). | ||
| ↔ Response Time 50% Grey to 80% Grey | ||
| 32.4 ms ... rise ↗ and fall ↘ combined | ↗ 16.4 ms rise | 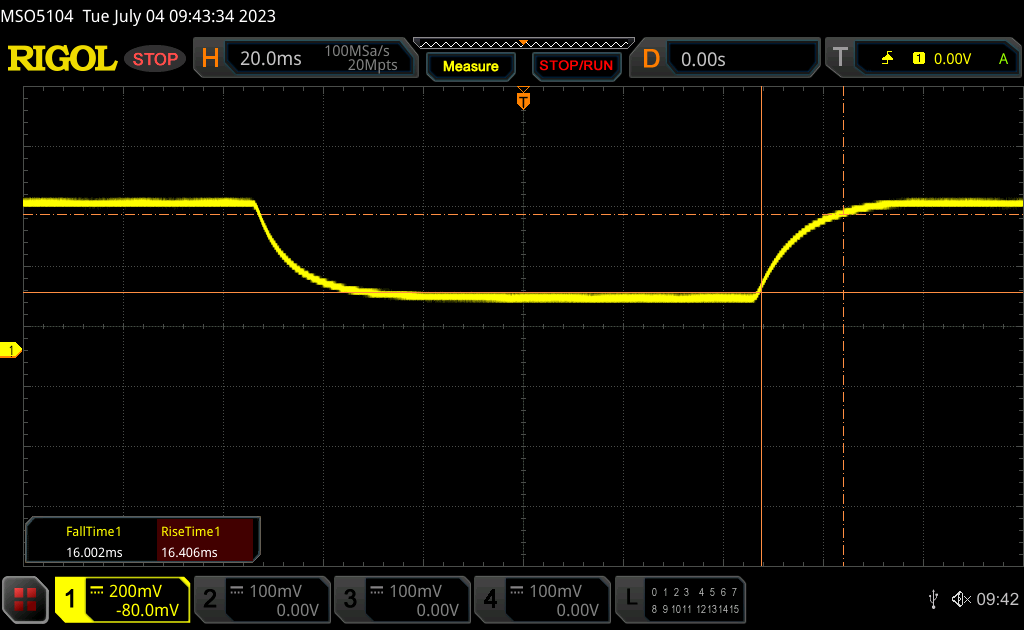 |
| ↘ 16 ms fall | ||
| The screen shows slow response rates in our tests and will be unsatisfactory for gamers. In comparison, all tested devices range from 0.165 (minimum) to 636 (maximum) ms. » 44 % of all devices are better. This means that the measured response time is similar to the average of all tested devices (31 ms). | ||
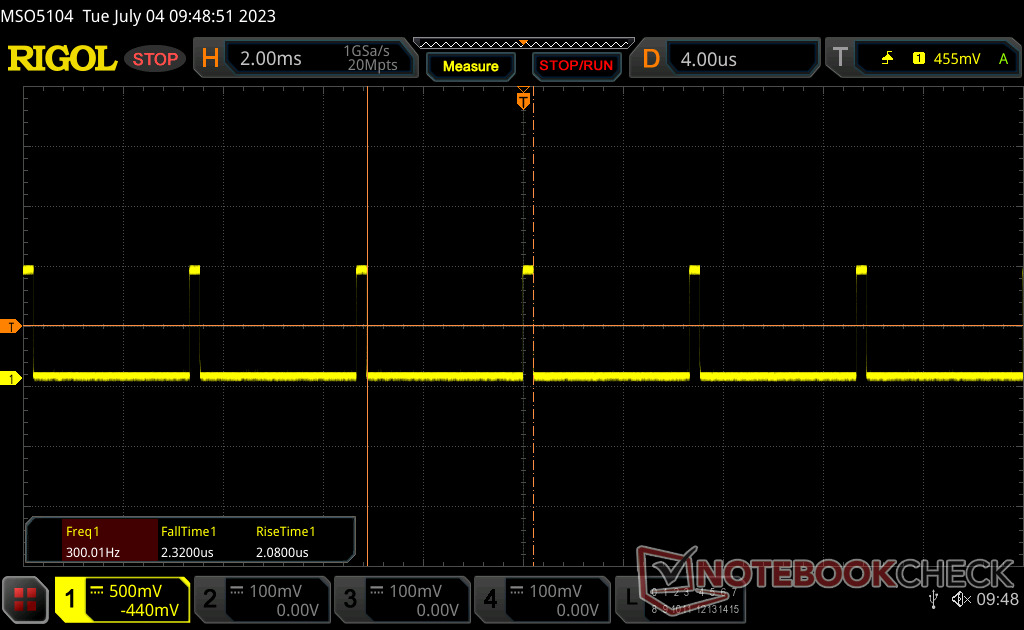
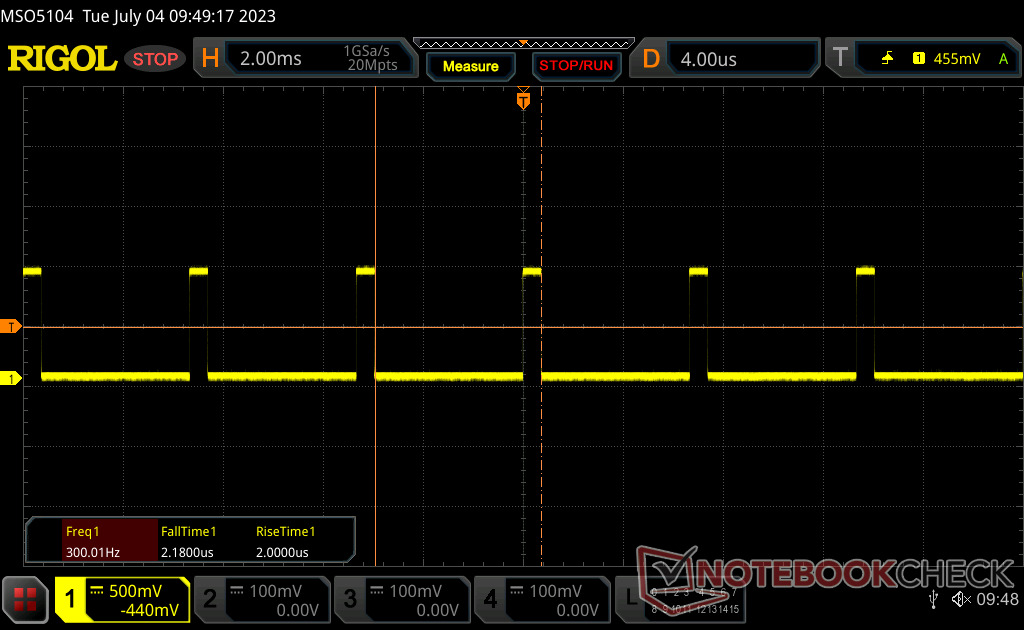
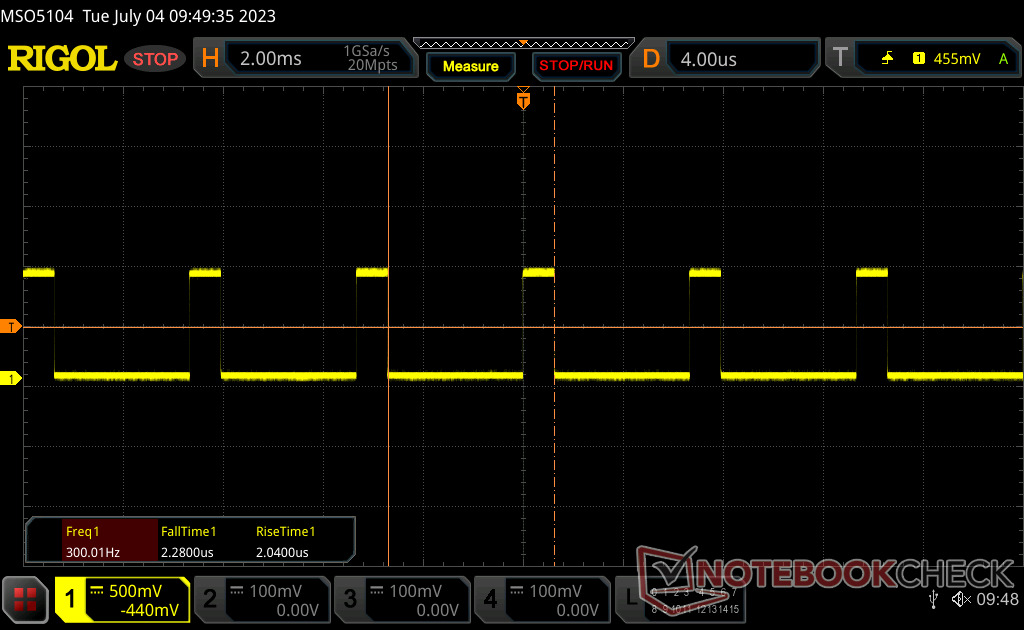
Screen Flickering / PWM (Pulse-Width Modulation)
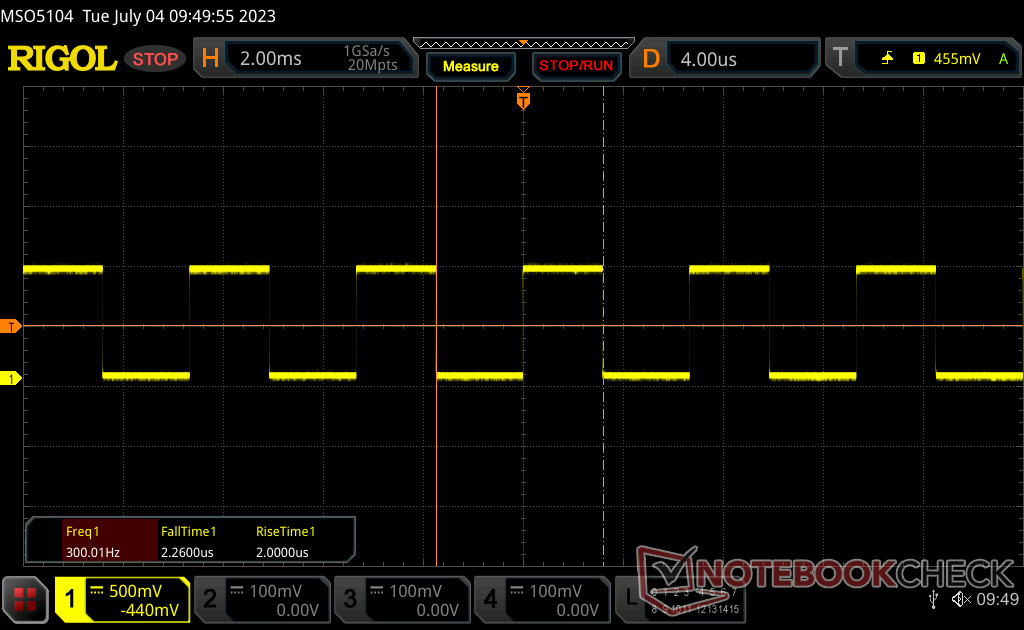
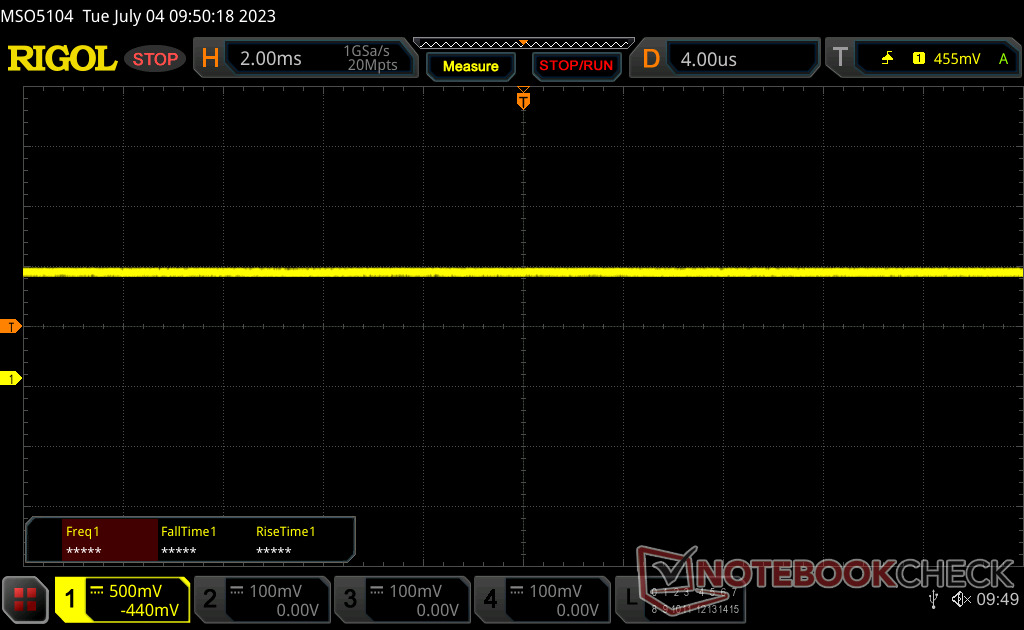
| Screen flickering / PWM detected | 300 Hz | ≤ 99 % brightness setting |  |
The display backlight flickers at 300 Hz (worst case, e.g., utilizing PWM) Flickering detected at a brightness setting of 99 % and below. There should be no flickering or PWM above this brightness setting. The frequency of 300 Hz is relatively high, so most users sensitive to PWM should not notice any flickering. However, there are reports that some users are still sensitive to PWM at 500 Hz and above, so be aware. In comparison: 52 % of all tested devices do not use PWM to dim the display. If PWM was detected, an average of 7751 (minimum: 5 - maximum: 343500) Hz was measured. | |||
Pulse-width modulation or flickering of 300 Hz is present on all brightness levels up to 99 percent.
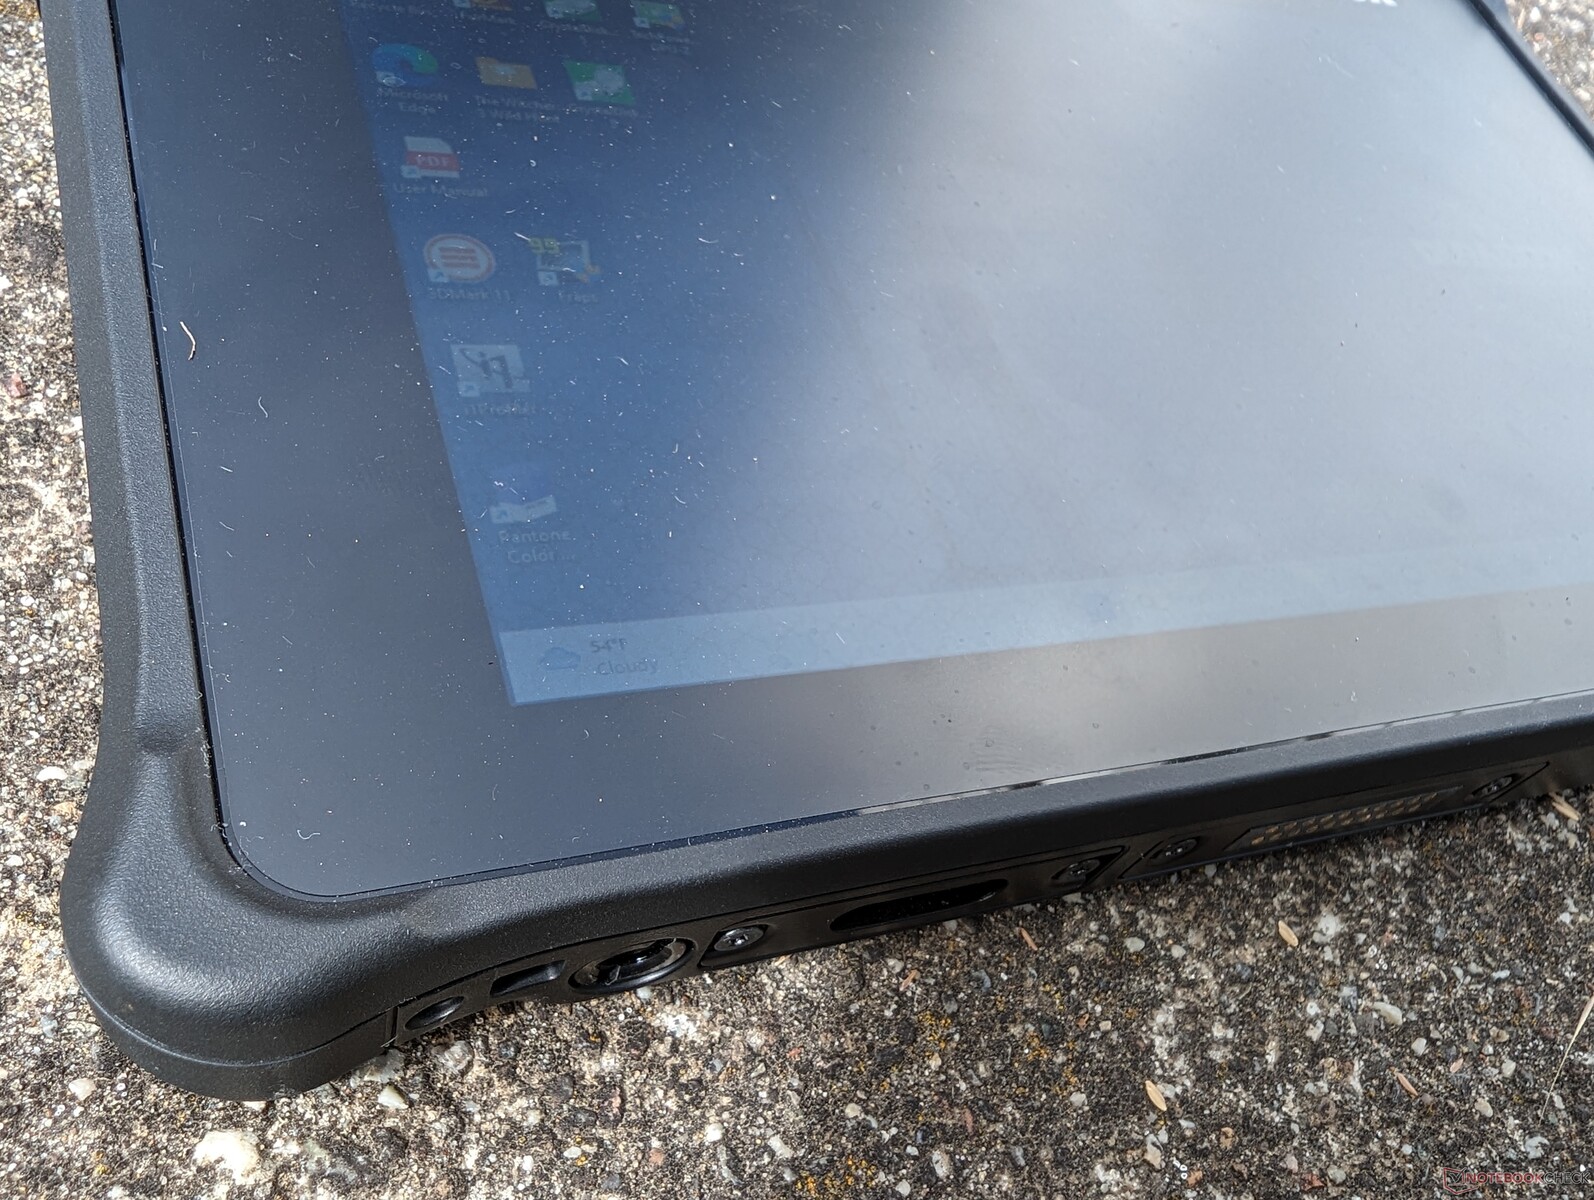
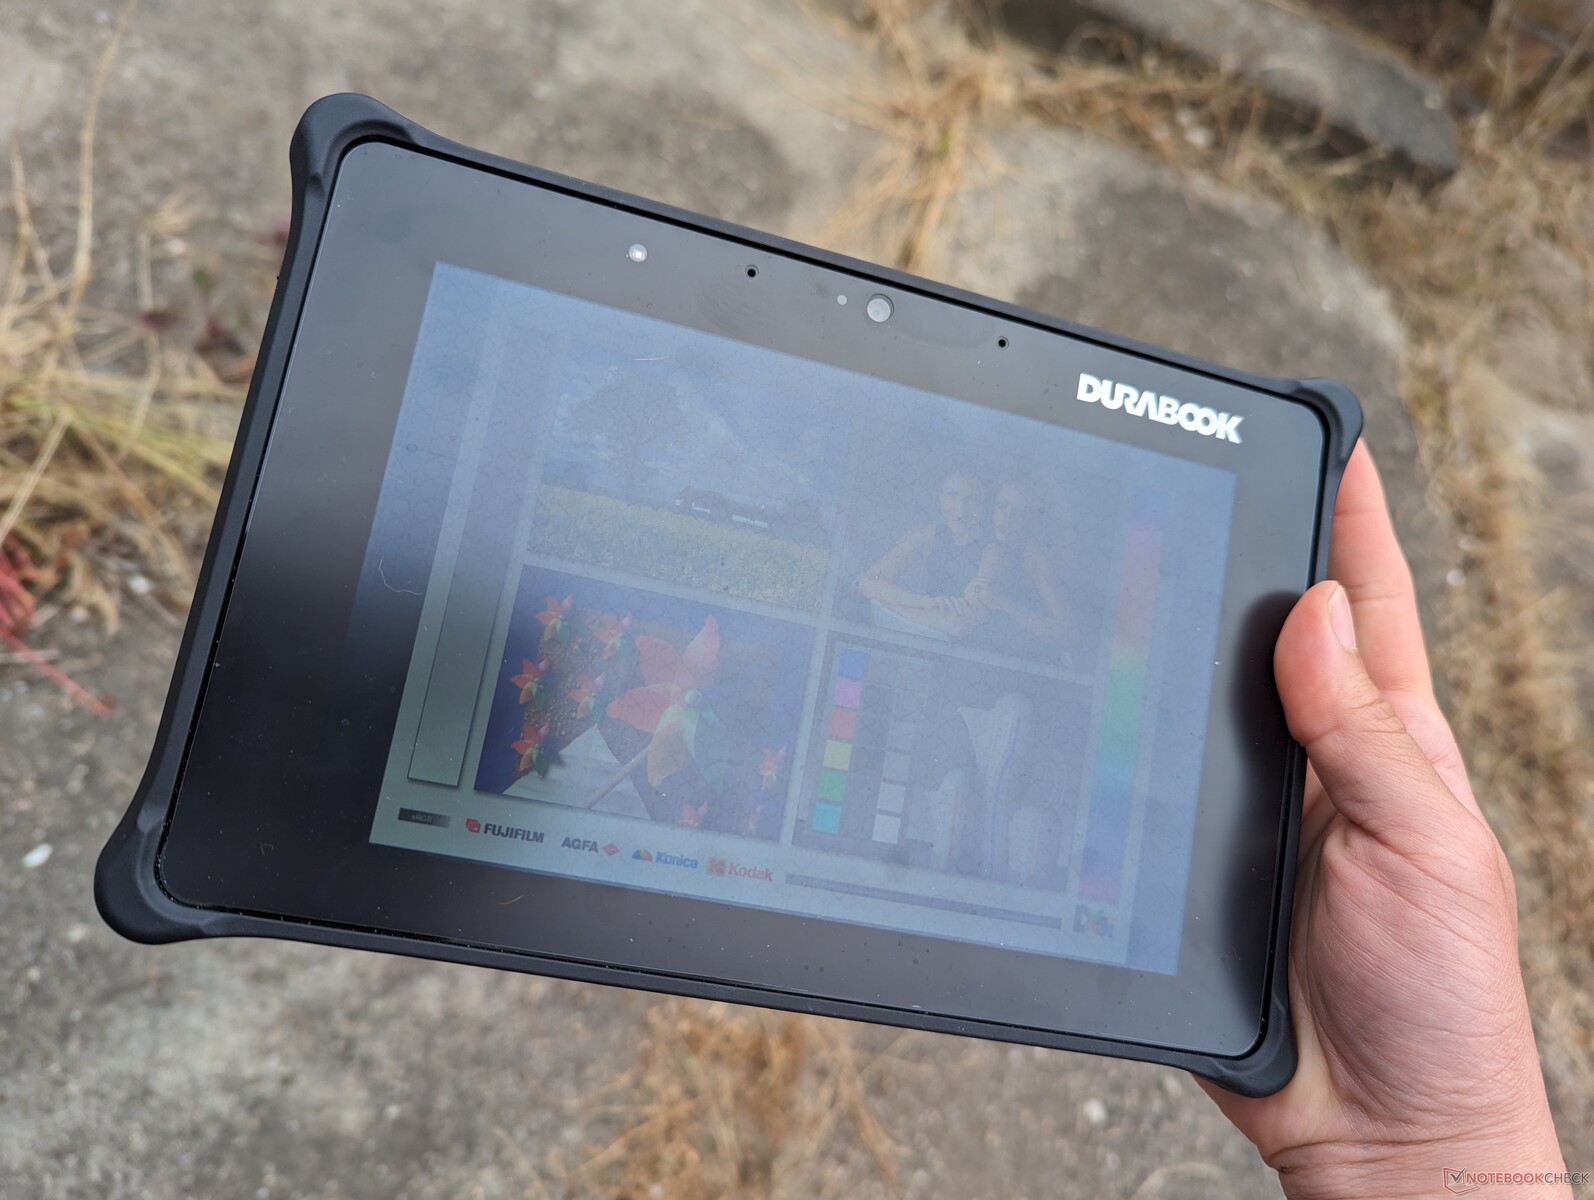
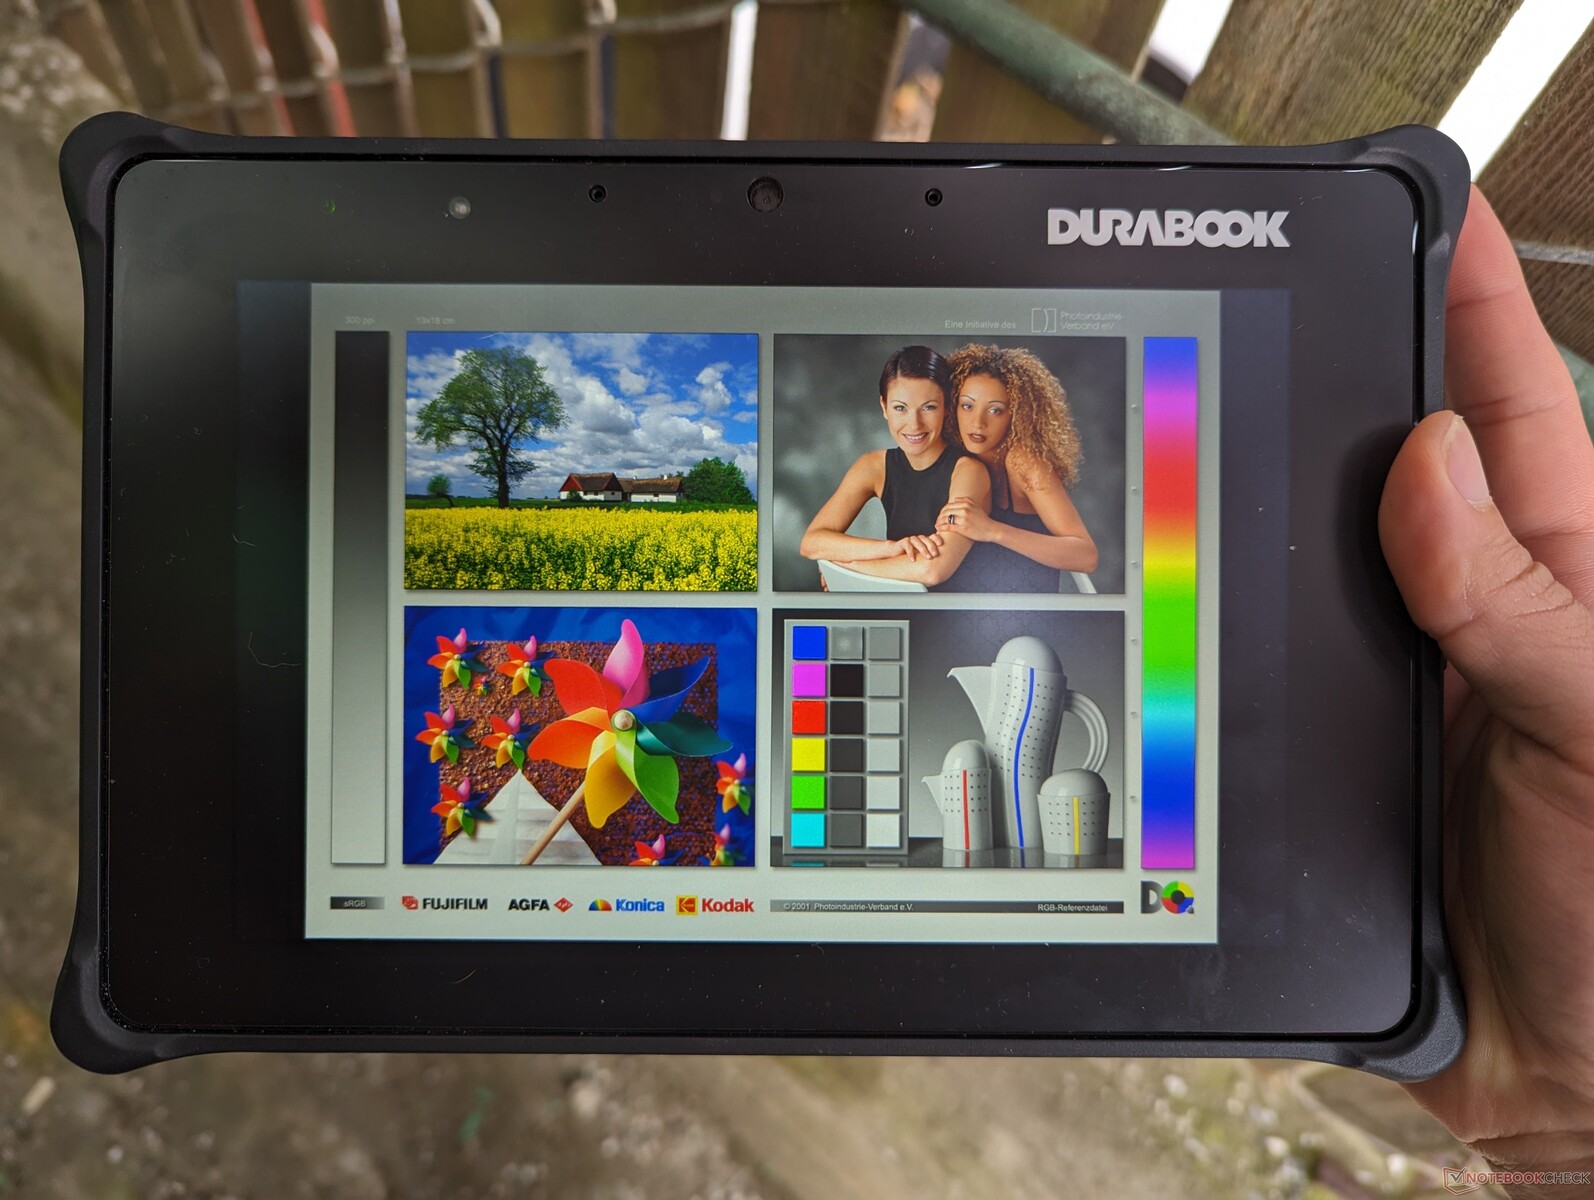
Outdoor visibility is excellent when under shade due to the extra-bright display. Glare can still wash out colors and be an issue when under brighter conditions.
Performance — Underclocked Intel 12th Gen
Testing Conditions
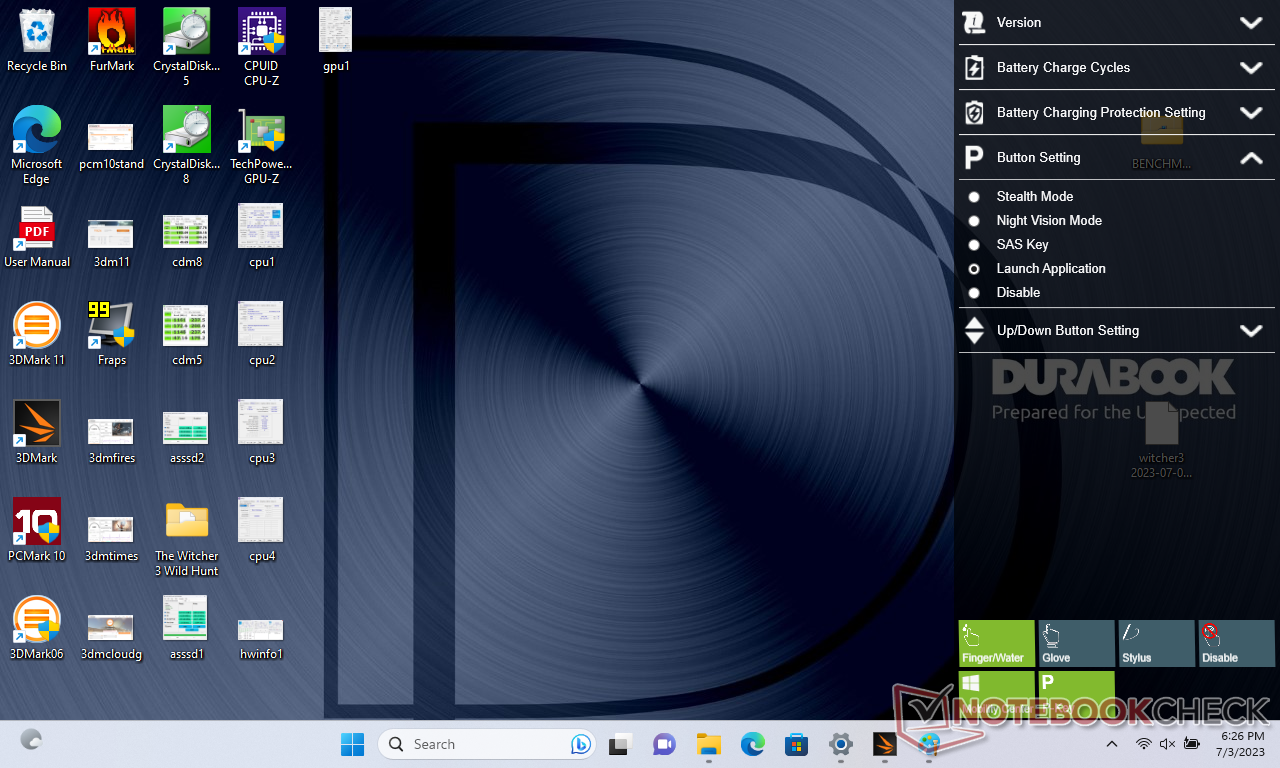
We set Windows to Performance mode prior to running the benchmarks below.
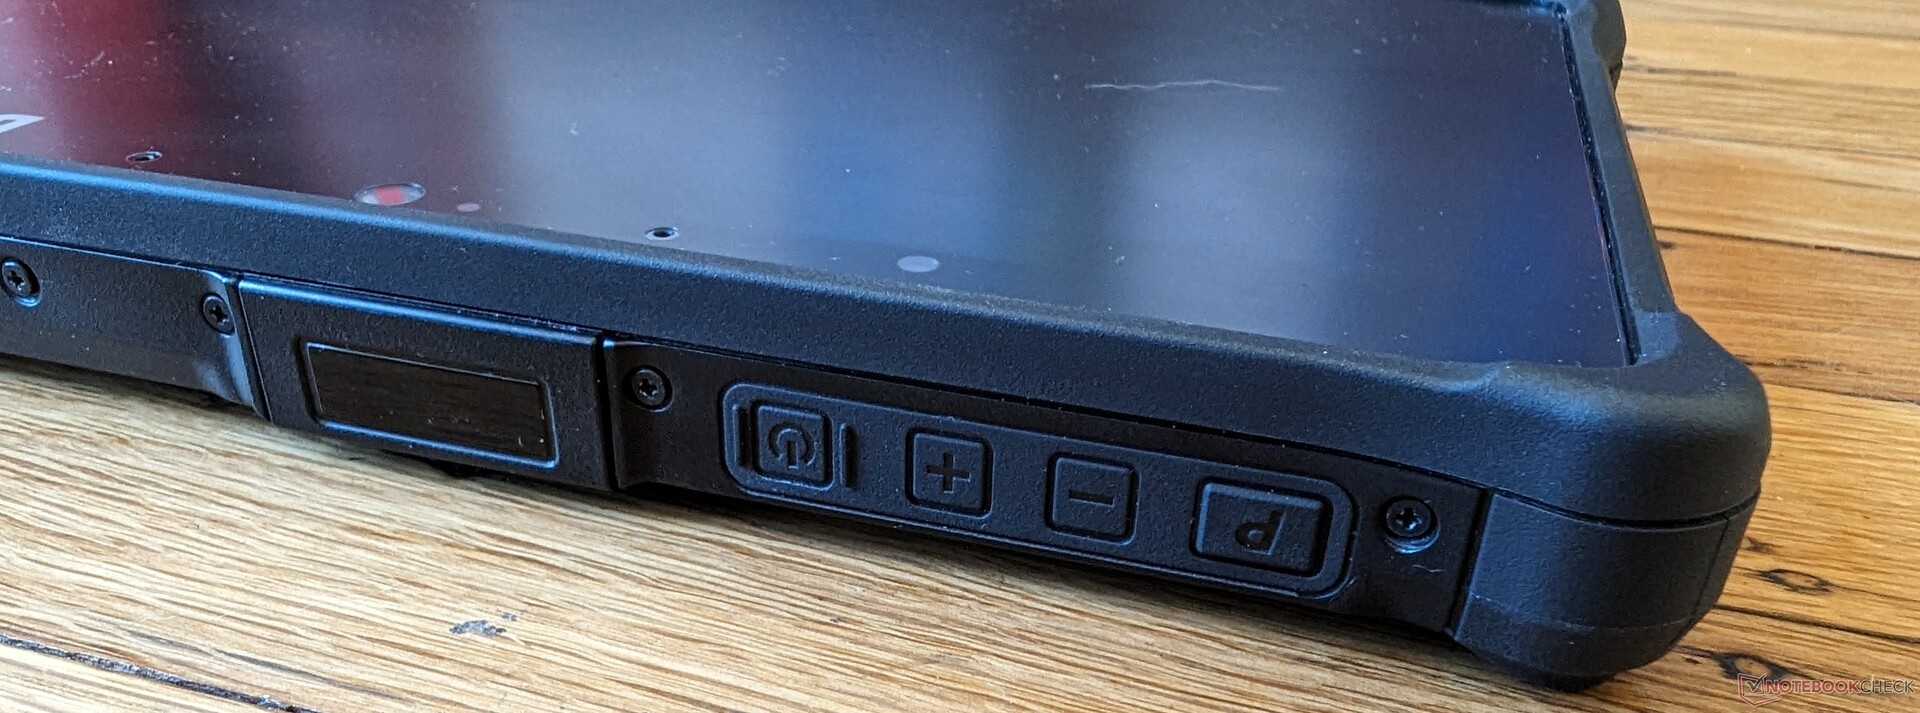
Pressing the "P" button on top launches the control center menu for adjusting different aspects of the tablet such as battery charging behavior, button actions, and glove/finger touchscreen modes.
Processor
Our review unit utilizes the same Core i5-1230U processor as found on the Dell XPS 13 9315 and XPS 9315 2-in-1. Performance, unfortunately, has been significantly underclocked likely to maximize stability. Single-thread and multi-thread performance is roughly 25 percent and 60 percent slower, respectively, than the same processor in the aforementioned Dell system. Overall performance is therefore closer to the three-year old 10th gen Core i5-10310U.
It's difficult to say how much of a performance boost users can expect if upgrading to the Core i7-1250U configuration since our Core i5-1230U unit is slower than expected. However, it is likely that the Core i7 SKU will be underclocked as well.
Cinebench R15 Multi Loop
Cinebench R23: Multi Core | Single Core
Cinebench R20: CPU (Multi Core) | CPU (Single Core)
Cinebench R15: CPU Multi 64Bit | CPU Single 64Bit
Blender: v2.79 BMW27 CPU
7-Zip 18.03: 7z b 4 | 7z b 4 -mmt1
Geekbench 5.5: Multi-Core | Single-Core
HWBOT x265 Benchmark v2.2: 4k Preset
LibreOffice : 20 Documents To PDF
R Benchmark 2.5: Overall mean
* ... smaller is better
* ... smaller is better
AIDA64: FP32 Ray-Trace | FPU Julia | CPU SHA3 | CPU Queen | FPU SinJulia | FPU Mandel | CPU AES | CPU ZLib | FP64 Ray-Trace | CPU PhotoWorxx
| Performance rating | |
| Dell Latitude 7230 Rugged Extreme | |
| Average Intel Core i5-1230U | |
| Panasonic Toughbook FZ-G2 | |
| Durabook R8 Tablet | |
| AIDA64 / FP32 Ray-Trace | |
| Dell Latitude 7230 Rugged Extreme | |
| Average Intel Core i5-1230U (2344 - 6360, n=3) | |
| Panasonic Toughbook FZ-G2 | |
| Durabook R8 Tablet | |
| AIDA64 / FPU Julia | |
| Dell Latitude 7230 Rugged Extreme | |
| Average Intel Core i5-1230U (11867 - 31714, n=3) | |
| Panasonic Toughbook FZ-G2 | |
| Durabook R8 Tablet | |
| AIDA64 / CPU SHA3 | |
| Dell Latitude 7230 Rugged Extreme | |
| Average Intel Core i5-1230U (772 - 1711, n=3) | |
| Panasonic Toughbook FZ-G2 | |
| Durabook R8 Tablet | |
| AIDA64 / CPU Queen | |
| Dell Latitude 7230 Rugged Extreme | |
| Average Intel Core i5-1230U (30824 - 52533, n=3) | |
| Panasonic Toughbook FZ-G2 | |
| Durabook R8 Tablet | |
| AIDA64 / FPU SinJulia | |
| Dell Latitude 7230 Rugged Extreme | |
| Panasonic Toughbook FZ-G2 | |
| Average Intel Core i5-1230U (2269 - 3947, n=3) | |
| Durabook R8 Tablet | |
| AIDA64 / FPU Mandel | |
| Dell Latitude 7230 Rugged Extreme | |
| Average Intel Core i5-1230U (6379 - 15896, n=3) | |
| Panasonic Toughbook FZ-G2 | |
| Durabook R8 Tablet | |
| AIDA64 / CPU AES | |
| Dell Latitude 7230 Rugged Extreme | |
| Durabook R8 Tablet | |
| Average Intel Core i5-1230U (18011 - 31941, n=3) | |
| Panasonic Toughbook FZ-G2 | |
| AIDA64 / CPU ZLib | |
| Dell Latitude 7230 Rugged Extreme | |
| Average Intel Core i5-1230U (229 - 495, n=3) | |
| Durabook R8 Tablet | |
| Panasonic Toughbook FZ-G2 | |
| AIDA64 / FP64 Ray-Trace | |
| Dell Latitude 7230 Rugged Extreme | |
| Average Intel Core i5-1230U (1328 - 3305, n=3) | |
| Panasonic Toughbook FZ-G2 | |
| Durabook R8 Tablet | |
| AIDA64 / CPU PhotoWorxx | |
| Dell Latitude 7230 Rugged Extreme | |
| Average Intel Core i5-1230U (17516 - 37042, n=3) | |
| Panasonic Toughbook FZ-G2 | |
| Durabook R8 Tablet | |
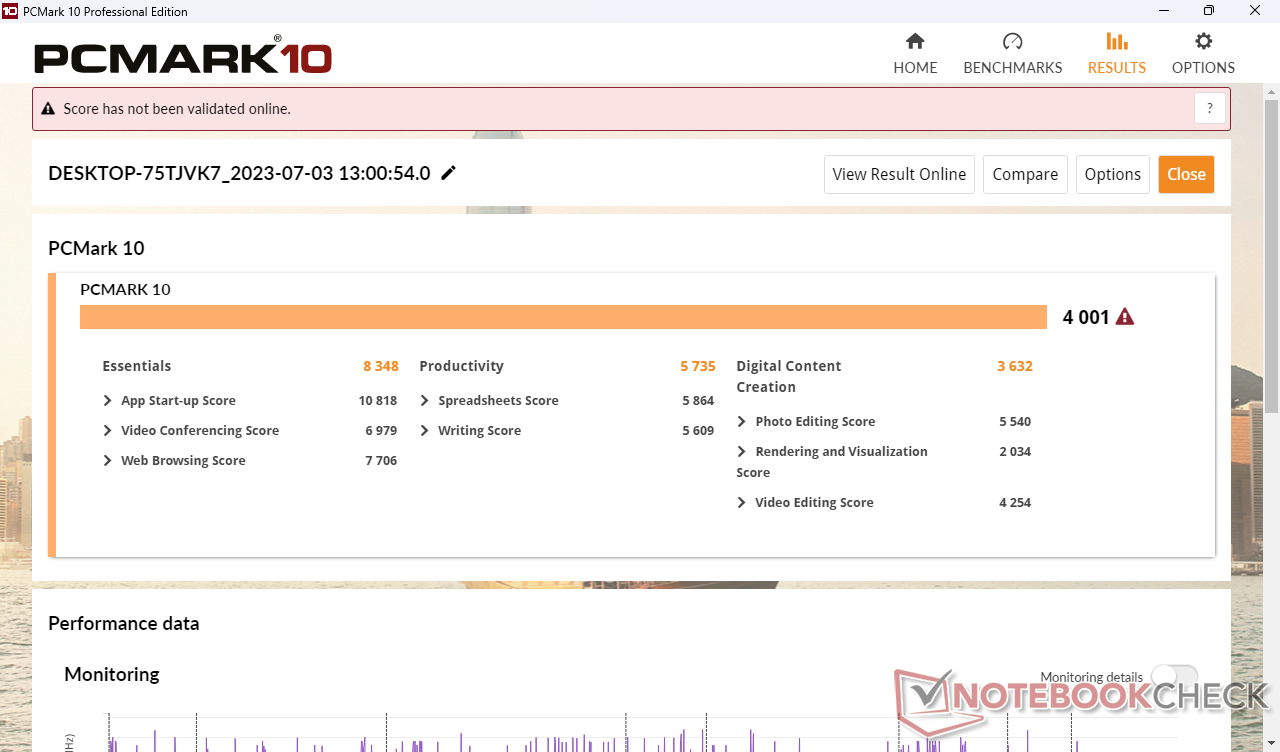
System Performance
PCMark results are comparable to the older Panasonic Toughbook FZ-G2 since the processor in our unit has been downclocked to run more similarly to the Toughbook.
CrossMark: Overall | Productivity | Creativity | Responsiveness
| PCMark 10 / Score | |
| Dell Latitude 7230 Rugged Extreme | |
| Average Intel Core i5-1230U, Intel Iris Xe Graphics G7 80EUs (4001 - 4943, n=3) | |
| Durabook R8 Tablet | |
| Panasonic Toughbook FZ-G2 | |
| PCMark 10 / Essentials | |
| Dell Latitude 7230 Rugged Extreme | |
| Average Intel Core i5-1230U, Intel Iris Xe Graphics G7 80EUs (8348 - 10139, n=3) | |
| Panasonic Toughbook FZ-G2 | |
| Durabook R8 Tablet | |
| PCMark 10 / Productivity | |
| Dell Latitude 7230 Rugged Extreme | |
| Average Intel Core i5-1230U, Intel Iris Xe Graphics G7 80EUs (5735 - 6692, n=3) | |
| Panasonic Toughbook FZ-G2 | |
| Durabook R8 Tablet | |
| PCMark 10 / Digital Content Creation | |
| Dell Latitude 7230 Rugged Extreme | |
| Average Intel Core i5-1230U, Intel Iris Xe Graphics G7 80EUs (3632 - 4833, n=3) | |
| Durabook R8 Tablet | |
| Panasonic Toughbook FZ-G2 | |
| CrossMark / Overall | |
| Dell Latitude 7230 Rugged Extreme | |
| Average Intel Core i5-1230U, Intel Iris Xe Graphics G7 80EUs (1117 - 1383, n=3) | |
| Durabook R8 Tablet | |
| Lenovo Tab M8 (Gen 4) | |
| CrossMark / Productivity | |
| Dell Latitude 7230 Rugged Extreme | |
| Average Intel Core i5-1230U, Intel Iris Xe Graphics G7 80EUs (1187 - 1356, n=3) | |
| Durabook R8 Tablet | |
| Lenovo Tab M8 (Gen 4) | |
| CrossMark / Creativity | |
| Dell Latitude 7230 Rugged Extreme | |
| Average Intel Core i5-1230U, Intel Iris Xe Graphics G7 80EUs (1095 - 1469, n=3) | |
| Durabook R8 Tablet | |
| Lenovo Tab M8 (Gen 4) | |
| CrossMark / Responsiveness | |
| Dell Latitude 7230 Rugged Extreme | |
| Average Intel Core i5-1230U, Intel Iris Xe Graphics G7 80EUs (990 - 1224, n=3) | |
| Durabook R8 Tablet | |
| Lenovo Tab M8 (Gen 4) | |
| PCMark 10 Score | 4001 points | |
Help | ||
| AIDA64 / Memory Copy | |
| Average of class Tablet (60613 - 110050, n=3, last 2 years) | |
| Average Intel Core i5-1230U (32539 - 60944, n=3) | |
| Durabook R8 Tablet | |
| AIDA64 / Memory Read | |
| Average of class Tablet (85395 - 122306, n=3, last 2 years) | |
| Average Intel Core i5-1230U (31342 - 60435, n=3) | |
| Durabook R8 Tablet | |
| AIDA64 / Memory Write | |
| Average of class Tablet (43045 - 117859, n=3, last 2 years) | |
| Average Intel Core i5-1230U (33224 - 65665, n=3) | |
| Durabook R8 Tablet | |
| AIDA64 / Memory Latency | |
| Durabook R8 Tablet | |
| Average of class Tablet (94.4 - 101.7, n=2, last 2 years) | |
| Average Intel Core i5-1230U (104.3 - 105.3, n=3) | |
* ... smaller is better
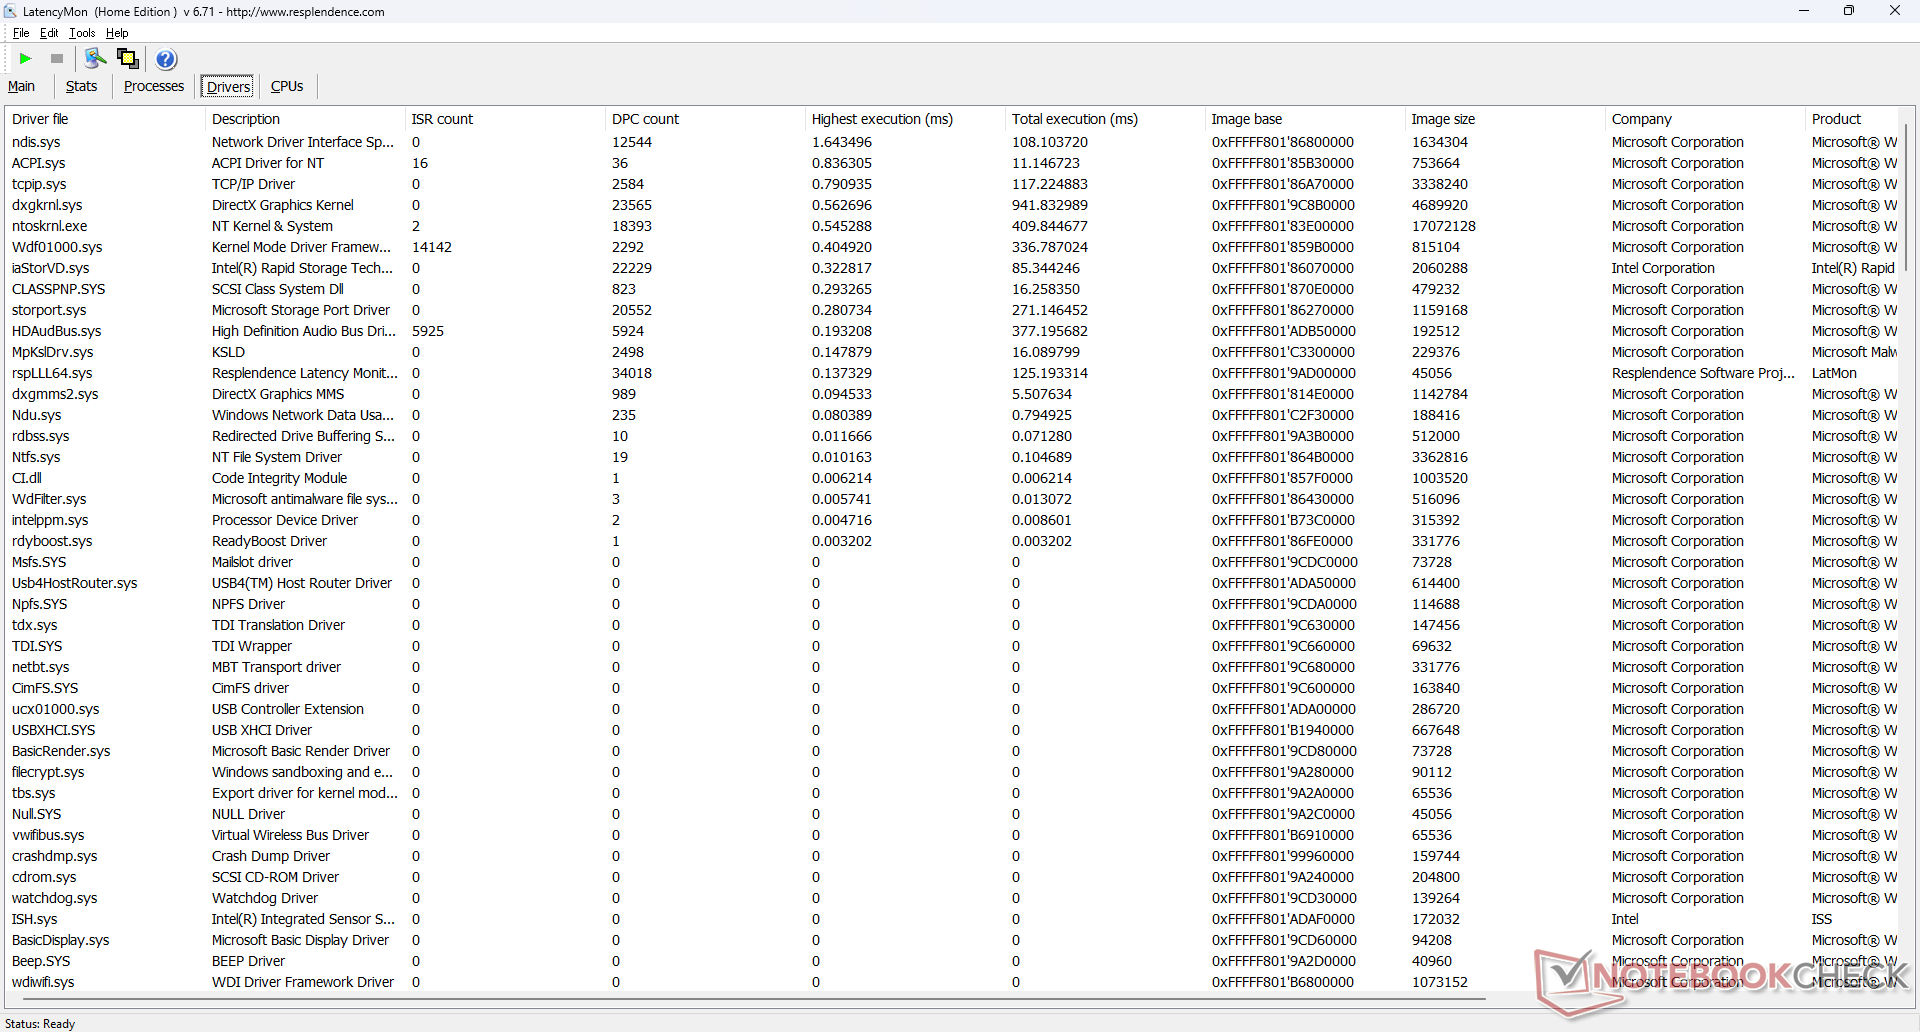
DPC Latency
LatencyMon reveals DPC issues when opening multiple browser tabs of our homepage. Additionally, 4K video playback at 60 FPS would also exhibit issues as we would record 195 dropped frames during our minute-long test video.

| DPC Latencies / LatencyMon - interrupt to process latency (max), Web, Youtube, Prime95 | |
| Dell Latitude 7230 Rugged Extreme | |
| Panasonic Toughbook FZ-G2 | |
| Durabook R8 Tablet | |
* ... smaller is better
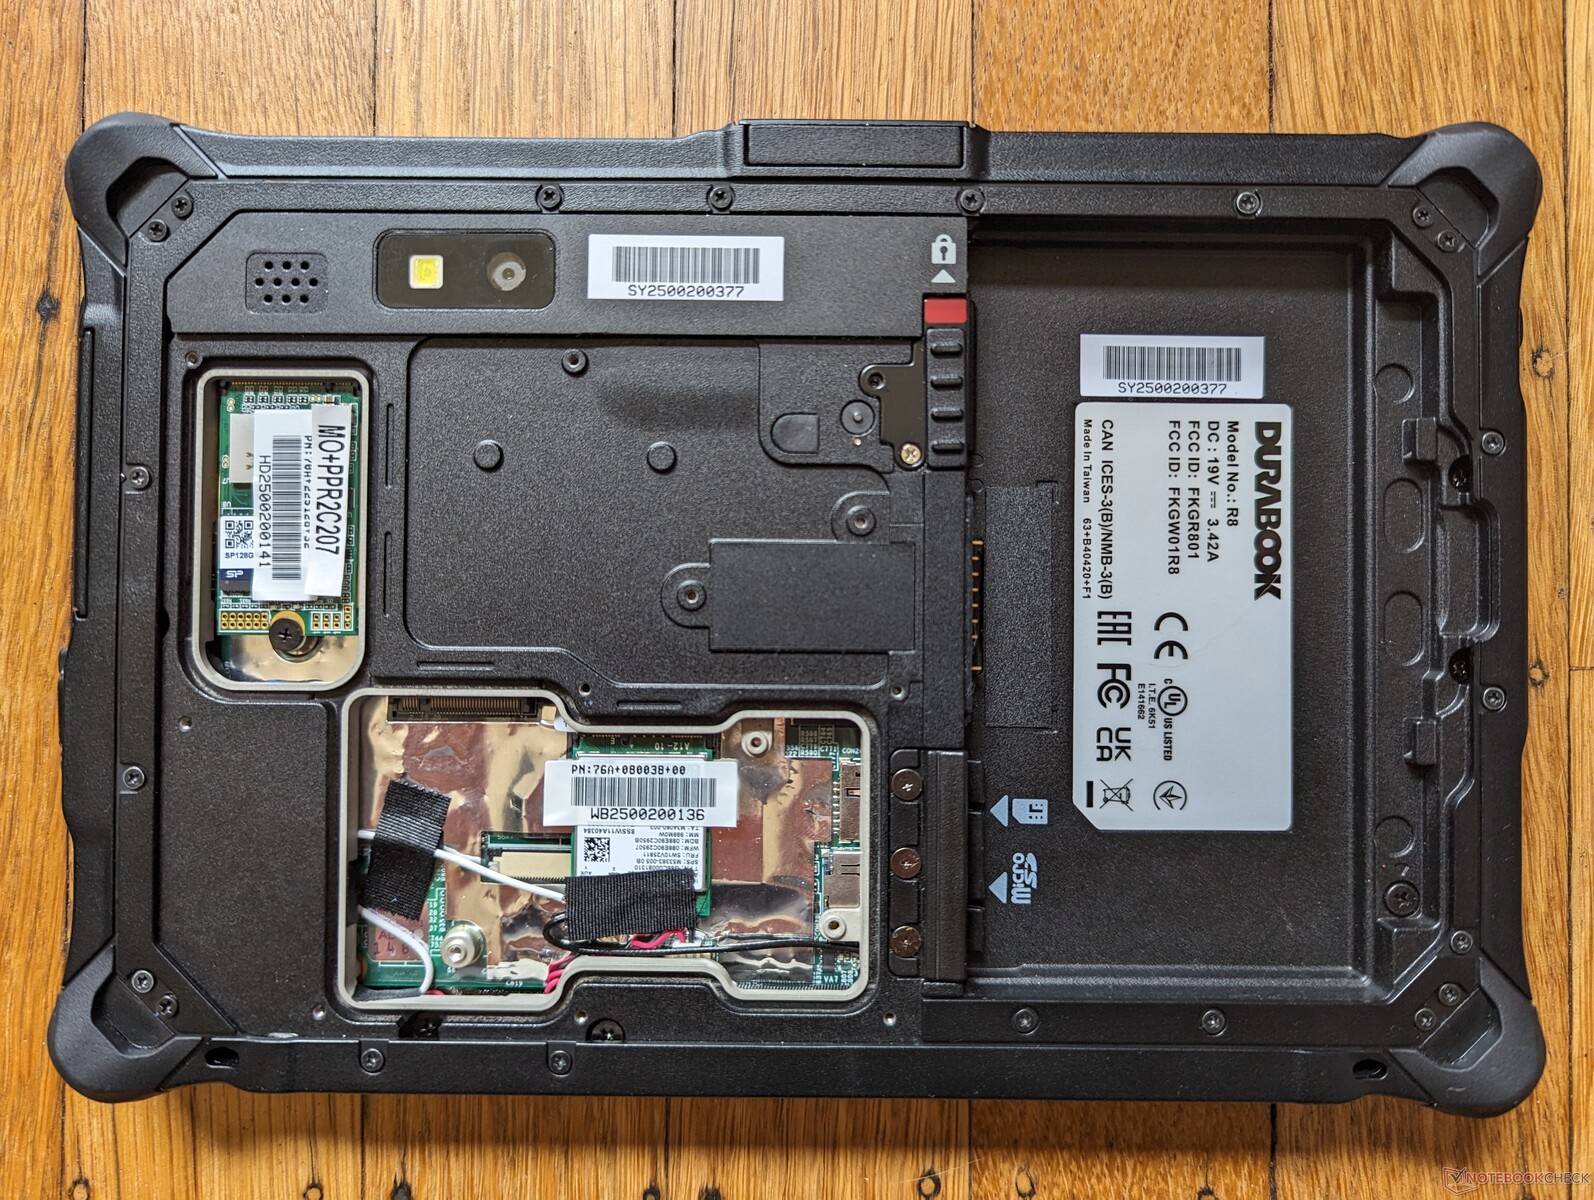
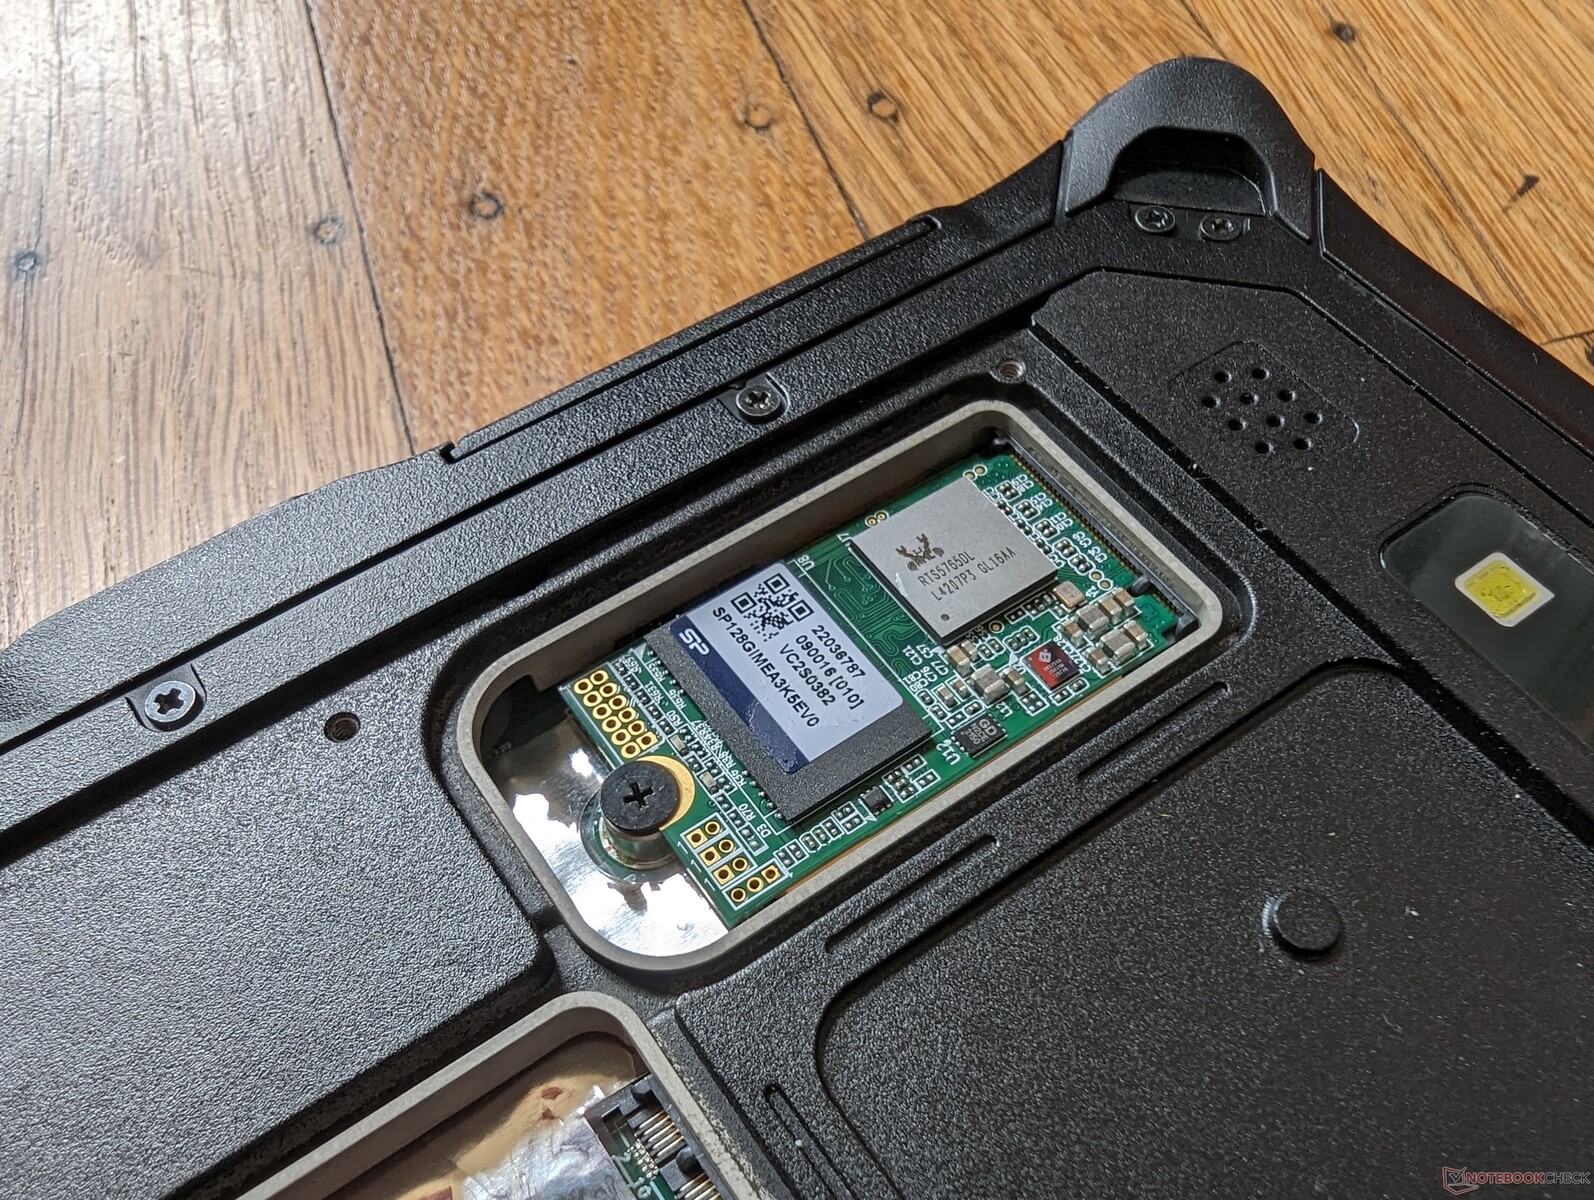
Storage Devices
The removable 128 GB NVMe SSD can sustain read and write rates of up to 1100 MB/s and 240 MB/s, respectively, for extended periods. Write rates are significantly slower which shouldn't be an issue for the target audience. The higher capacity 256 GB, 512 GB, or 1 TB options are expected to perform faster.


| Drive Performance rating - Percent | |
| Dell Latitude 7230 Rugged Extreme | |
| Panasonic Toughbook FZ-G2 | |
| Durabook R8 Tablet | |
* ... smaller is better
Disk Throttling: DiskSpd Read Loop, Queue Depth 8
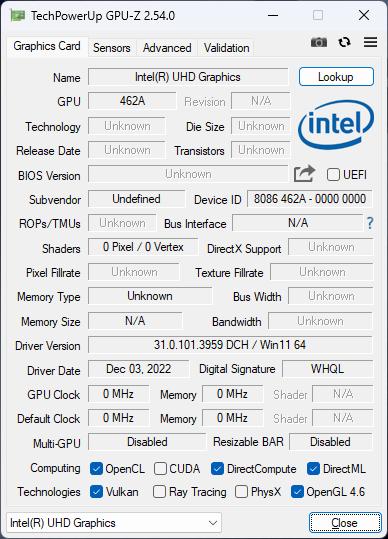
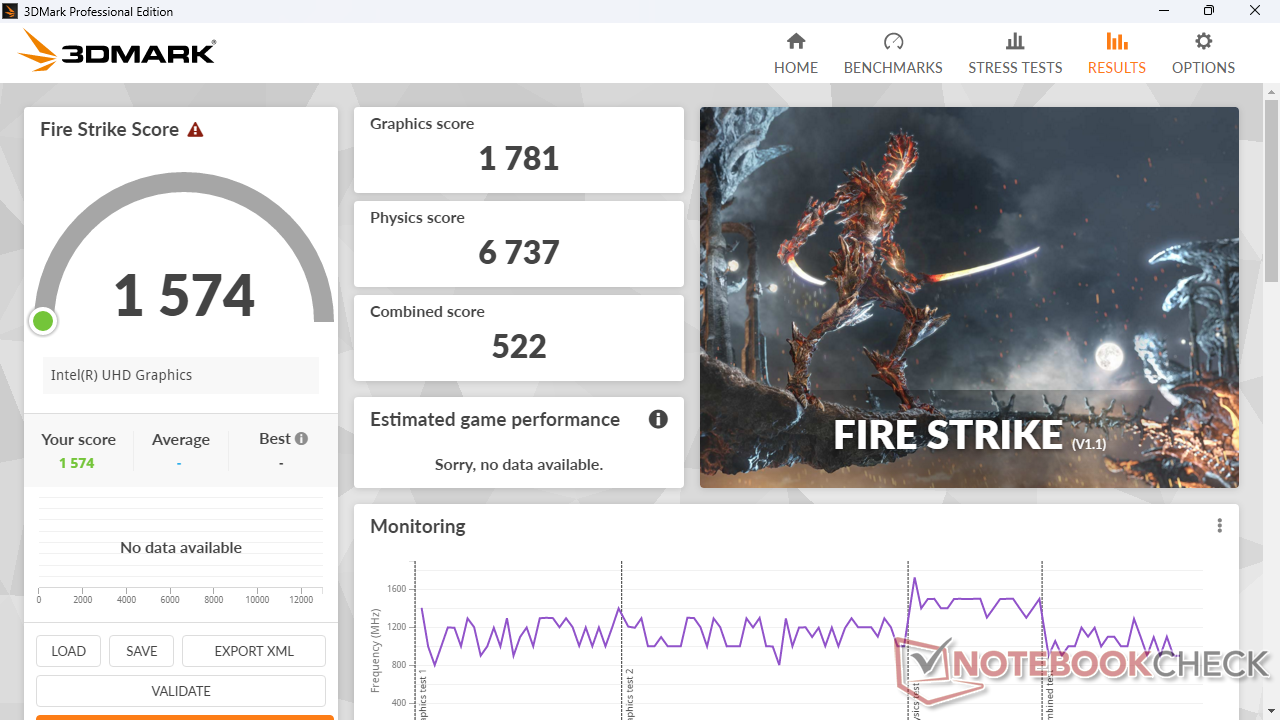
GPU Performance
Graphics performance is about 30 to 40 percent slower than the same Iris Xe 80 EUs GPU in the XPS 13 9315 due in part to the underclocked CPU and slower single-channel RAM. Nonetheless, overall performance is still faster than the much older UHD Graphics 620 by about 40 to 50 percent.
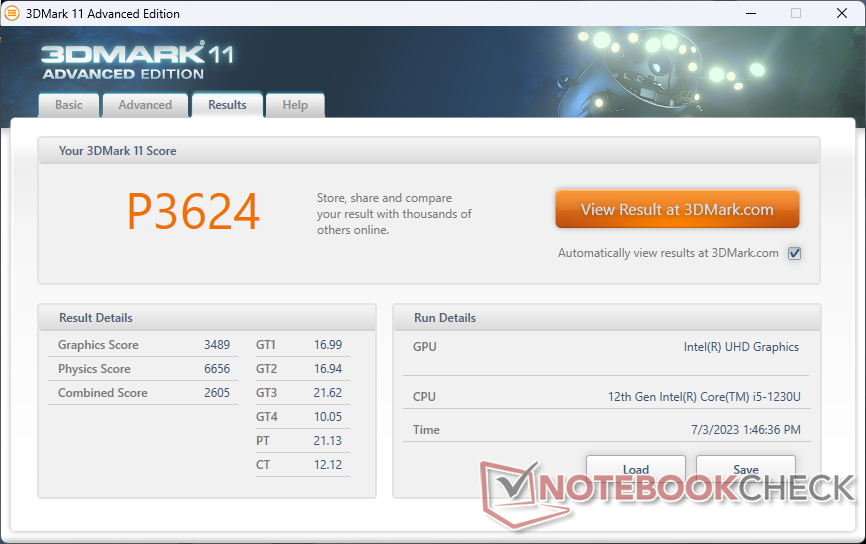

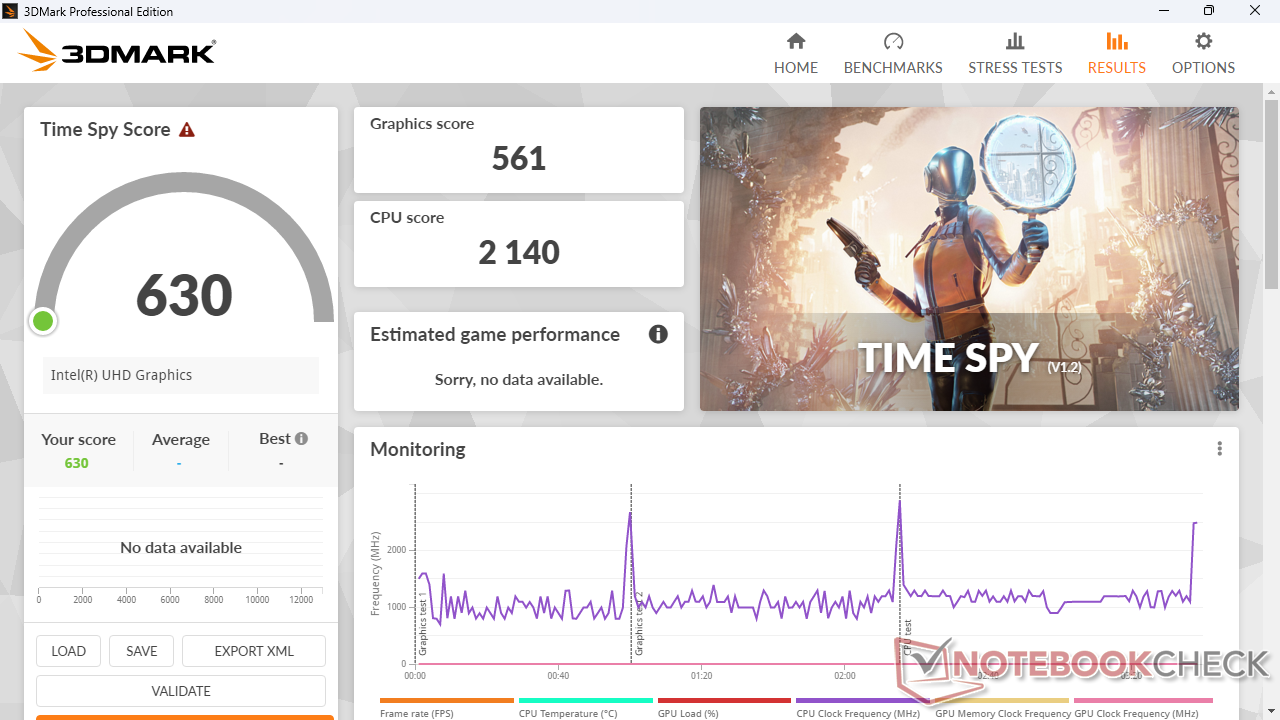
| 3DMark 11 Performance | 3624 points | |
| 3DMark Cloud Gate Standard Score | 9072 points | |
| 3DMark Fire Strike Score | 1574 points | |
| 3DMark Time Spy Score | 630 points | |
Help | ||
Witcher 3 FPS Chart
| low | med. | high | ultra | |
|---|---|---|---|---|
| The Witcher 3 (2015) | 30.2 | |||
| Dota 2 Reborn (2015) | 62.9 | 41.7 | 19.6 | 13.2 |
| Final Fantasy XV Benchmark (2018) | 12.1 | |||
| X-Plane 11.11 (2018) | 26.2 | 21.8 | 20.1 |
Emissions — Fanless Design
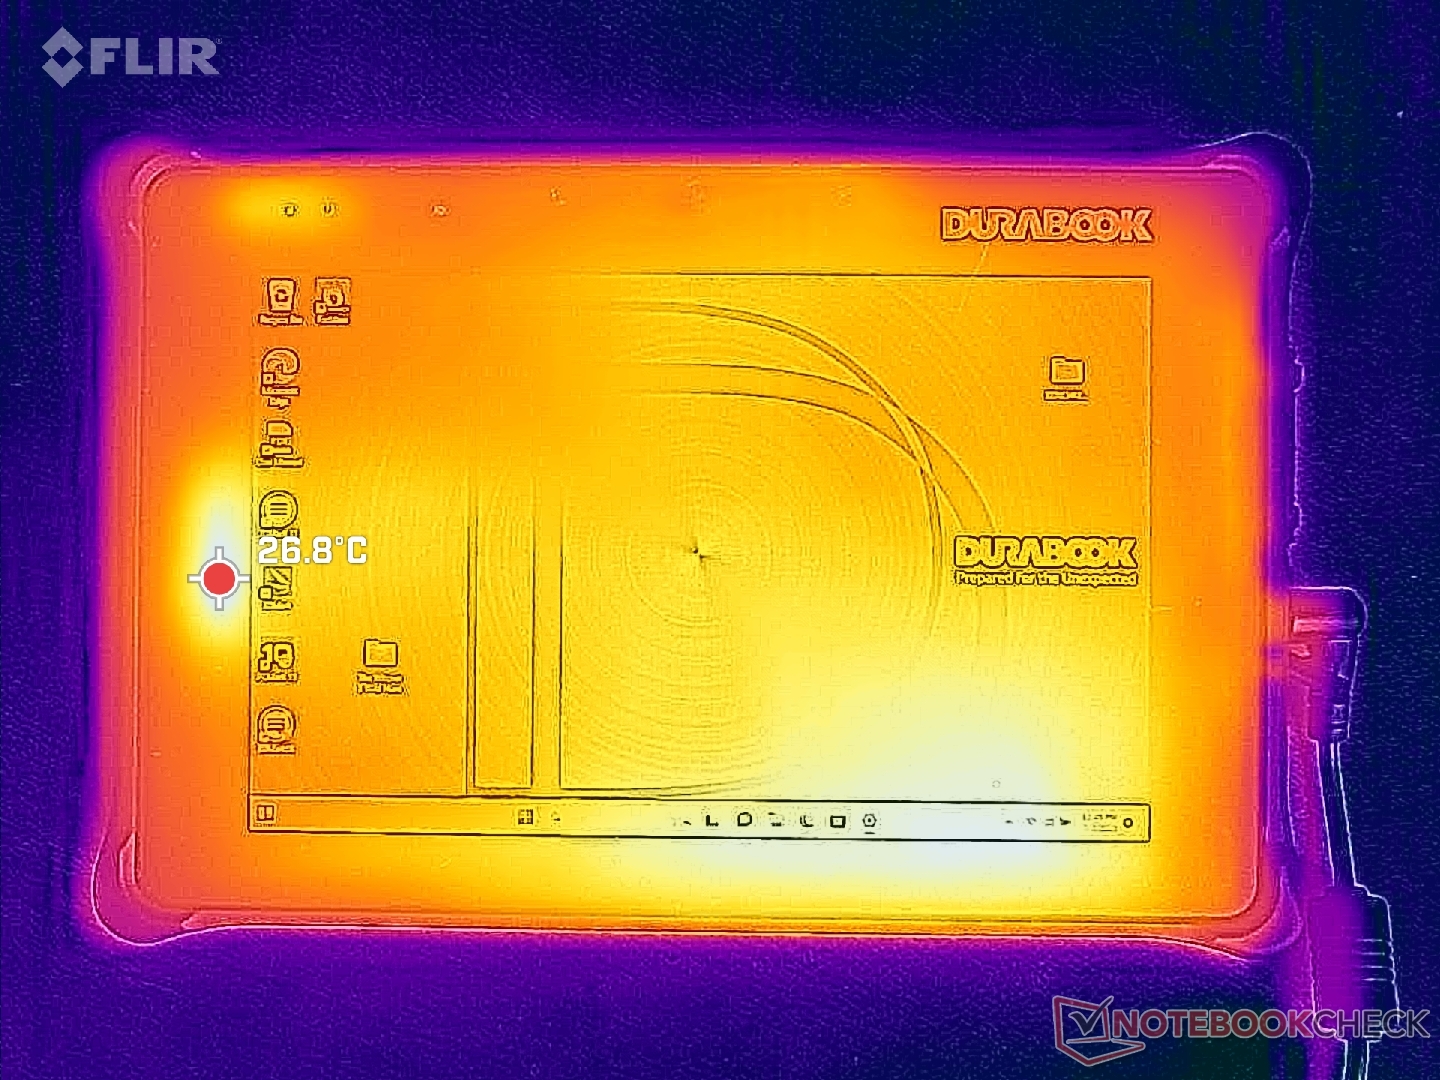
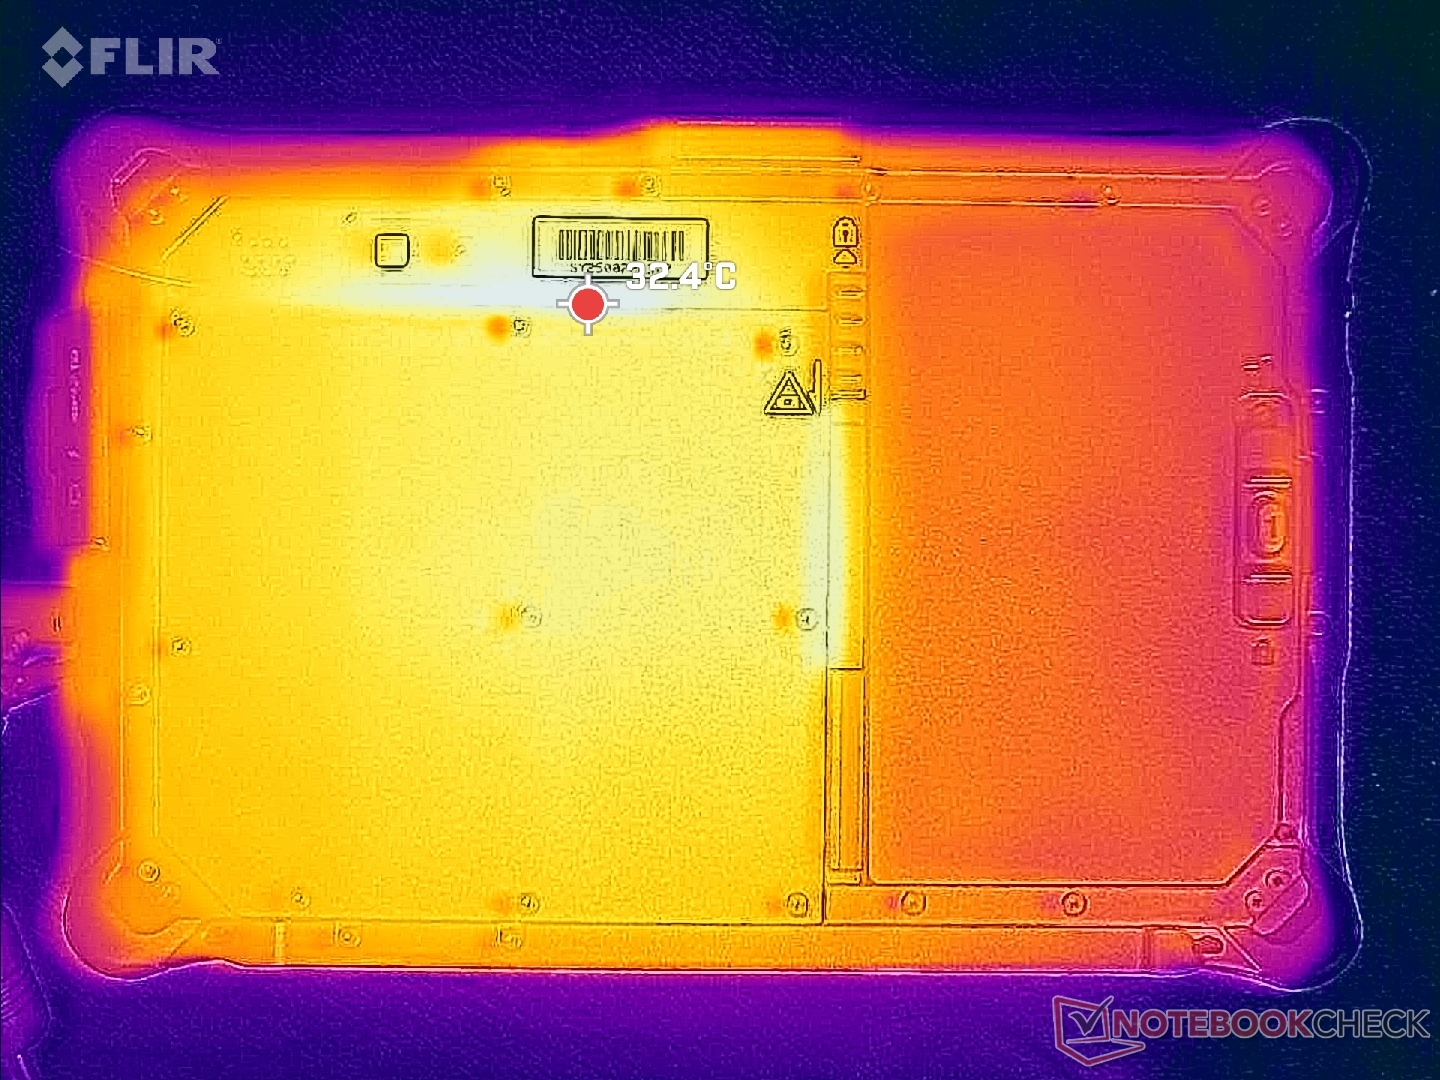
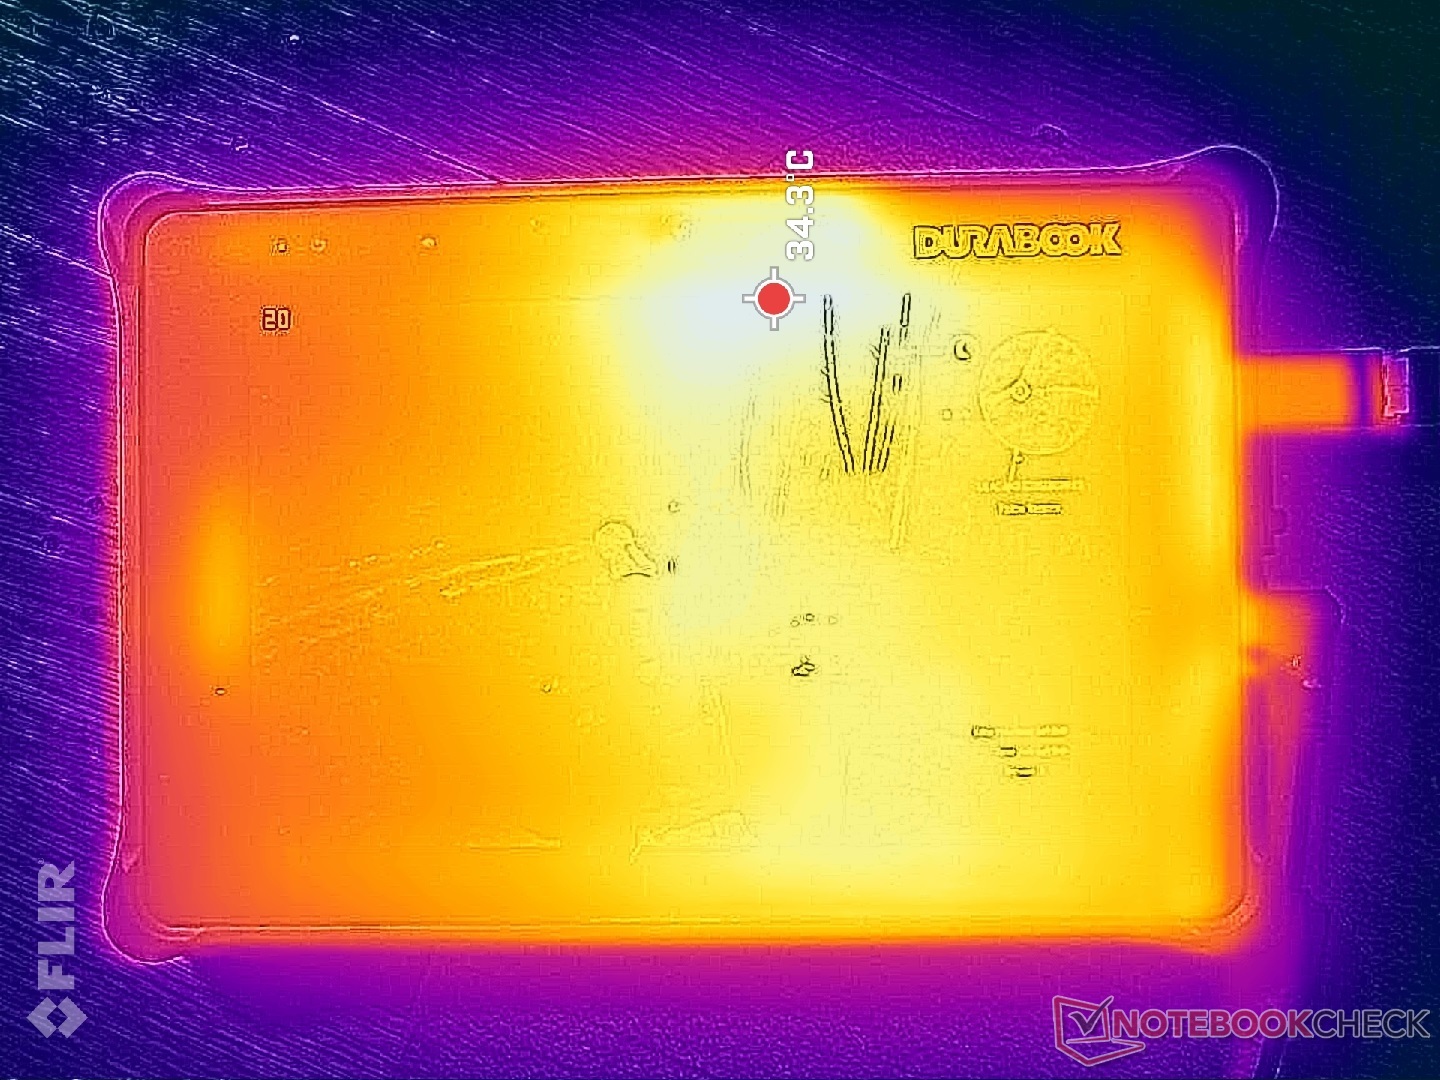
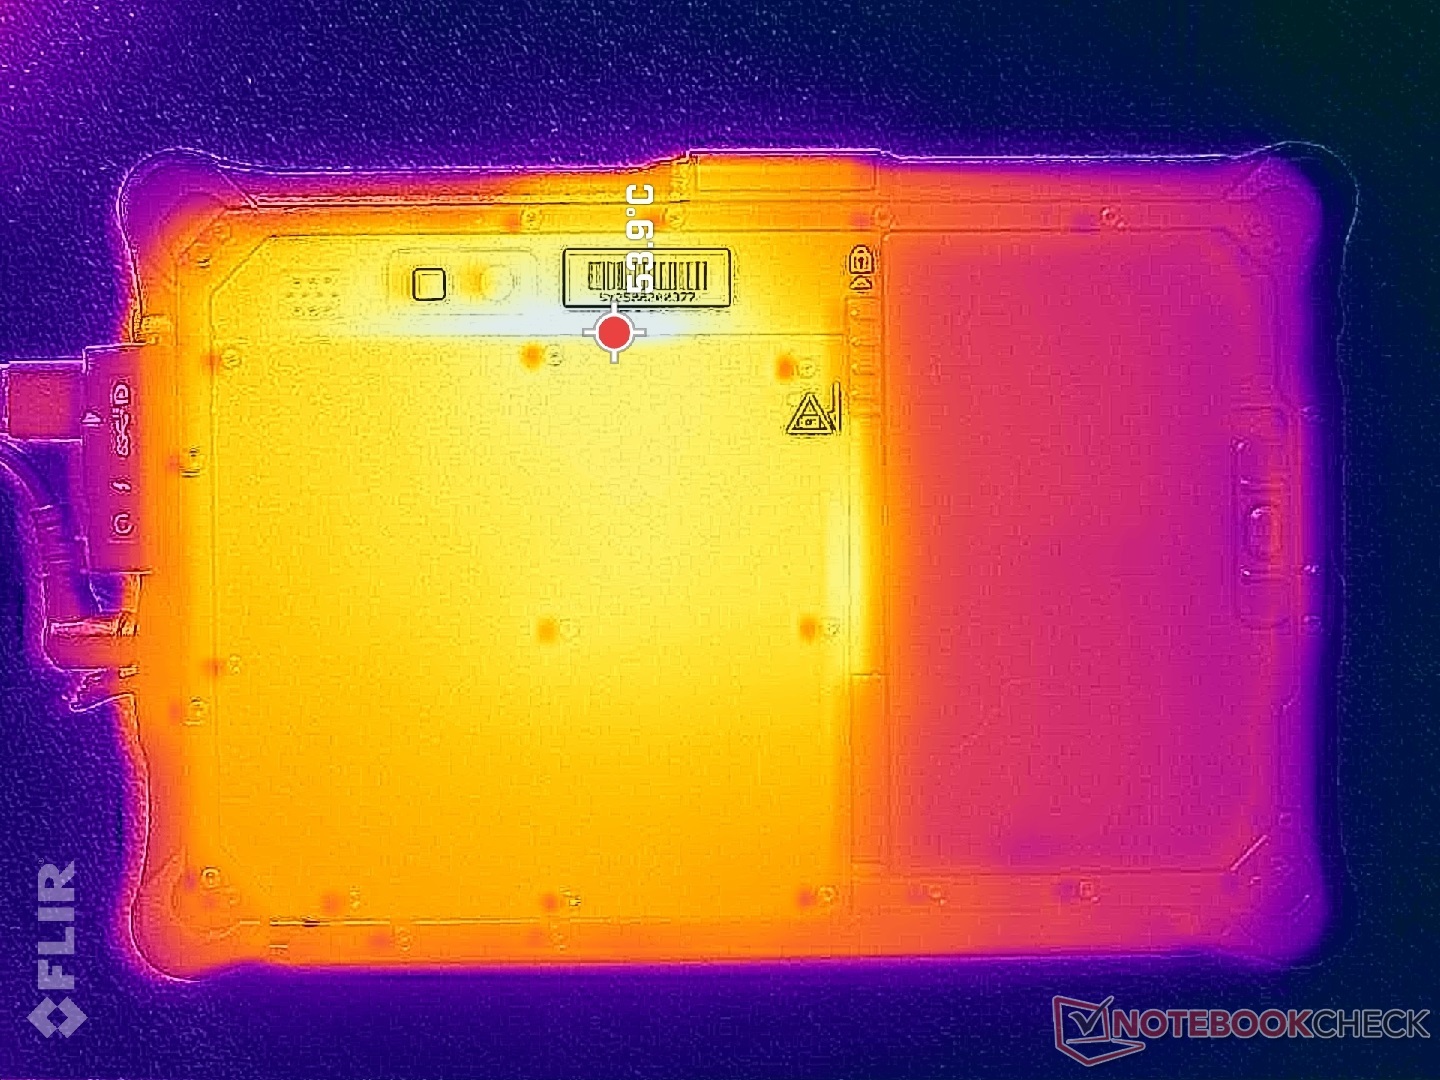
Temperature
Surface temperatures are warmer on the right half of the tablet than the left due to the positioning of the motherboard and battery pack. The backside can be very warm at up to 54 C when running demanding loads compared to just 40 C on the Android-based Acer Enduro T1.
(+) The maximum temperature on the upper side is 38.2 °C / 101 F, compared to the average of 33.7 °C / 93 F, ranging from 20.7 to 53.2 °C for the class Tablet.
(-) The bottom heats up to a maximum of 49.6 °C / 121 F, compared to the average of 33.2 °C / 92 F
(+) In idle usage, the average temperature for the upper side is 30.8 °C / 87 F, compared to the device average of 30 °C / 86 F.
| Durabook R8 Tablet Intel Core i5-1230U, Intel Iris Xe Graphics G7 80EUs | Acer Enduro T1 ET108-11A A9001 | Lenovo Tab M8 (Gen 4) Mediatek Helio A22 MT6761, PowerVR GE8300 | Dell Latitude 7230 Rugged Extreme Intel Core i5-1240U, Intel Iris Xe Graphics G7 80EUs | Panasonic Toughbook FZ-G2 Intel Core i5-10310U, Intel UHD Graphics 620 | |
|---|---|---|---|---|---|
| Heat | 7% | 29% | 9% | 19% | |
| Maximum Upper Side * (°C) | 38.2 | 37.8 1% | 28.6 25% | 32.6 15% | 37.4 2% |
| Maximum Bottom * (°C) | 49.6 | 39.4 21% | 30.1 39% | 40.2 19% | 36.6 26% |
| Idle Upper Side * (°C) | 32.2 | 32.8 -2% | 23.1 28% | 30.6 5% | 25.6 20% |
| Idle Bottom * (°C) | 33.4 | 31.2 7% | 25.1 25% | 35 -5% | 24 28% |
* ... smaller is better
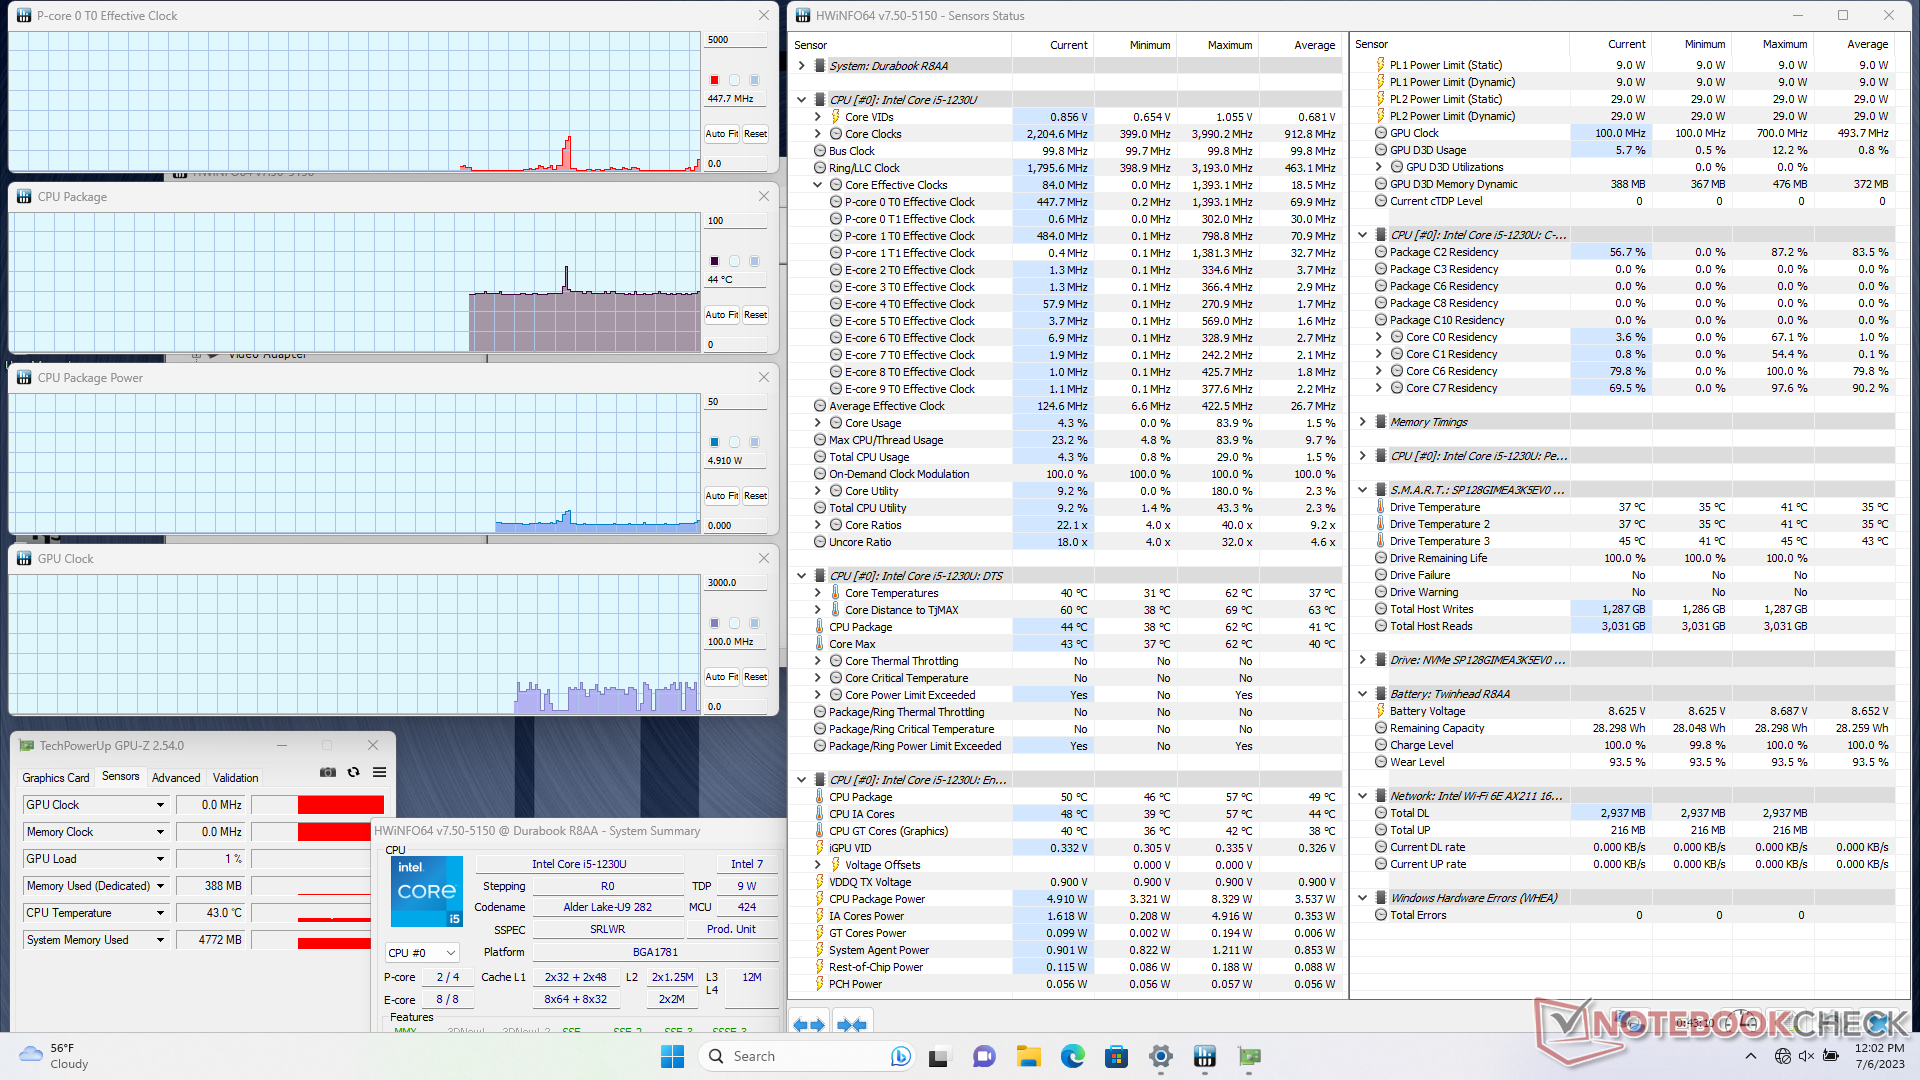
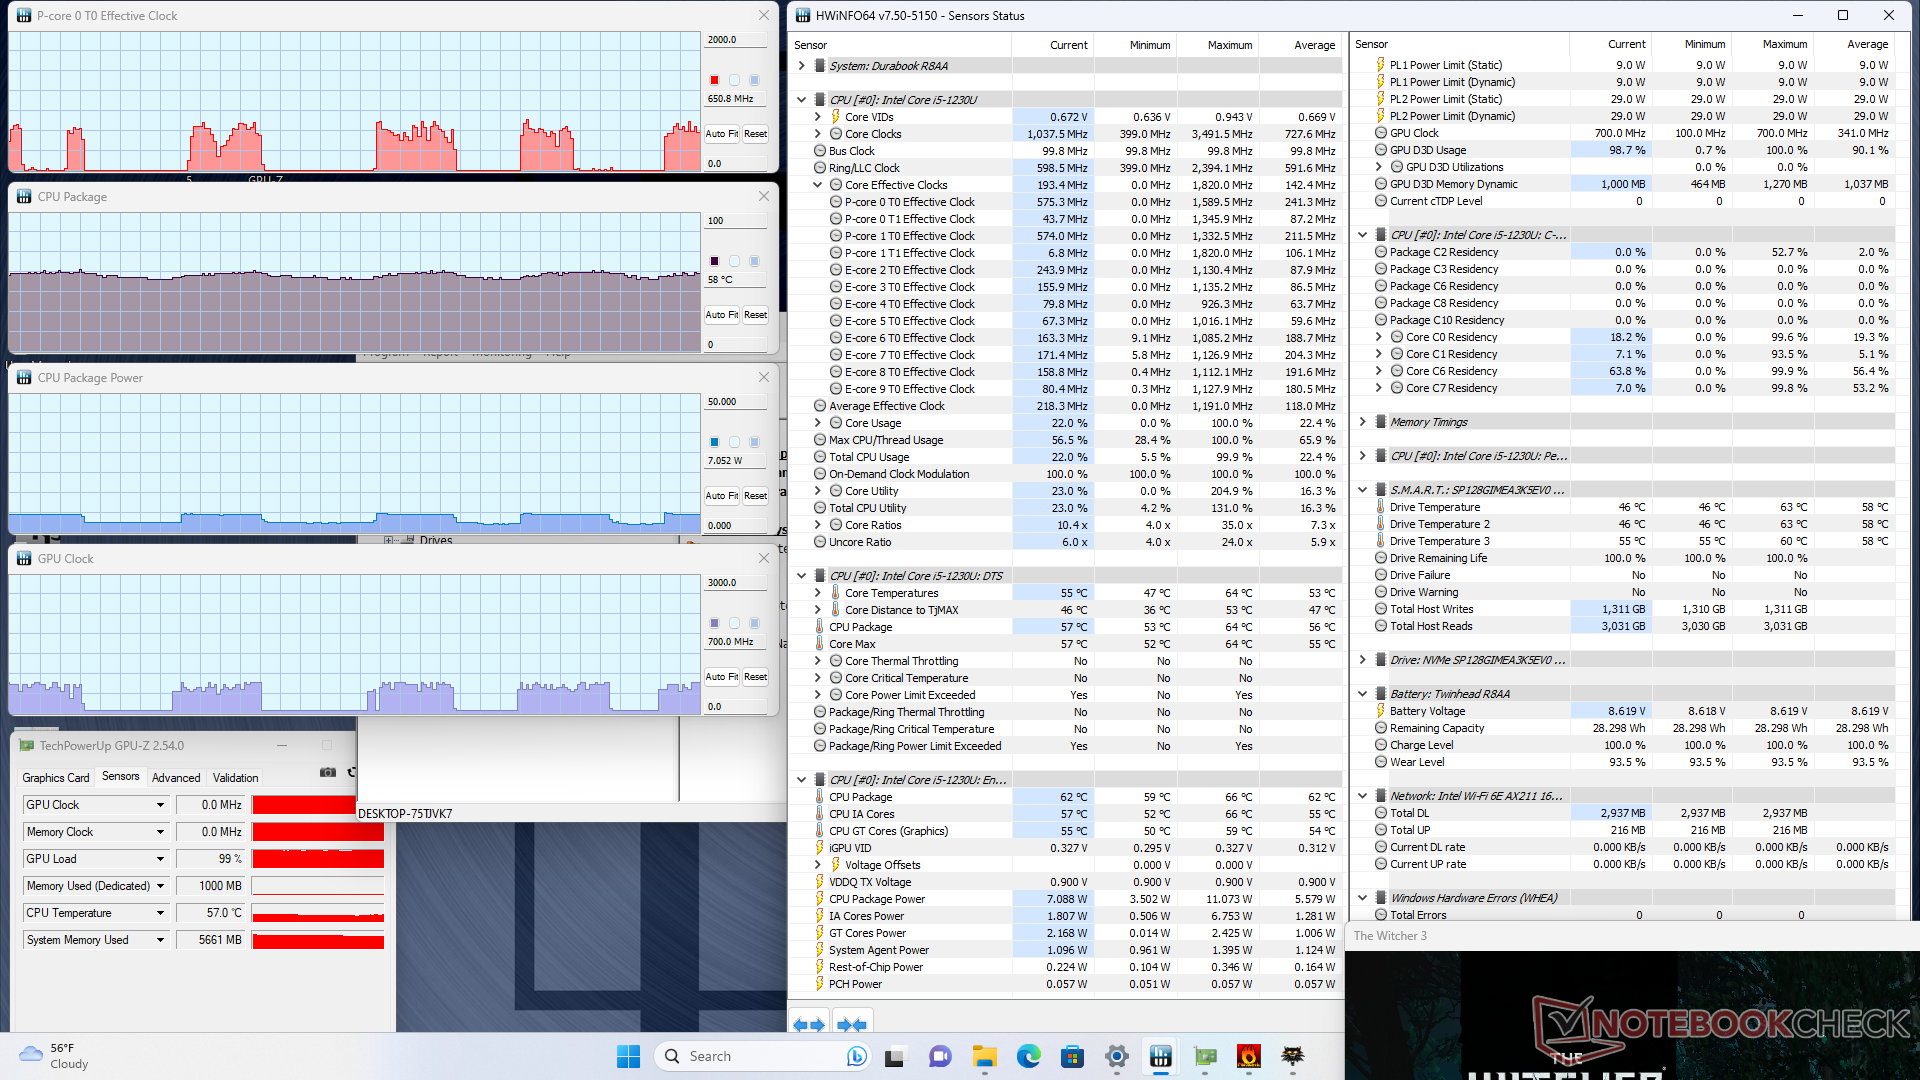
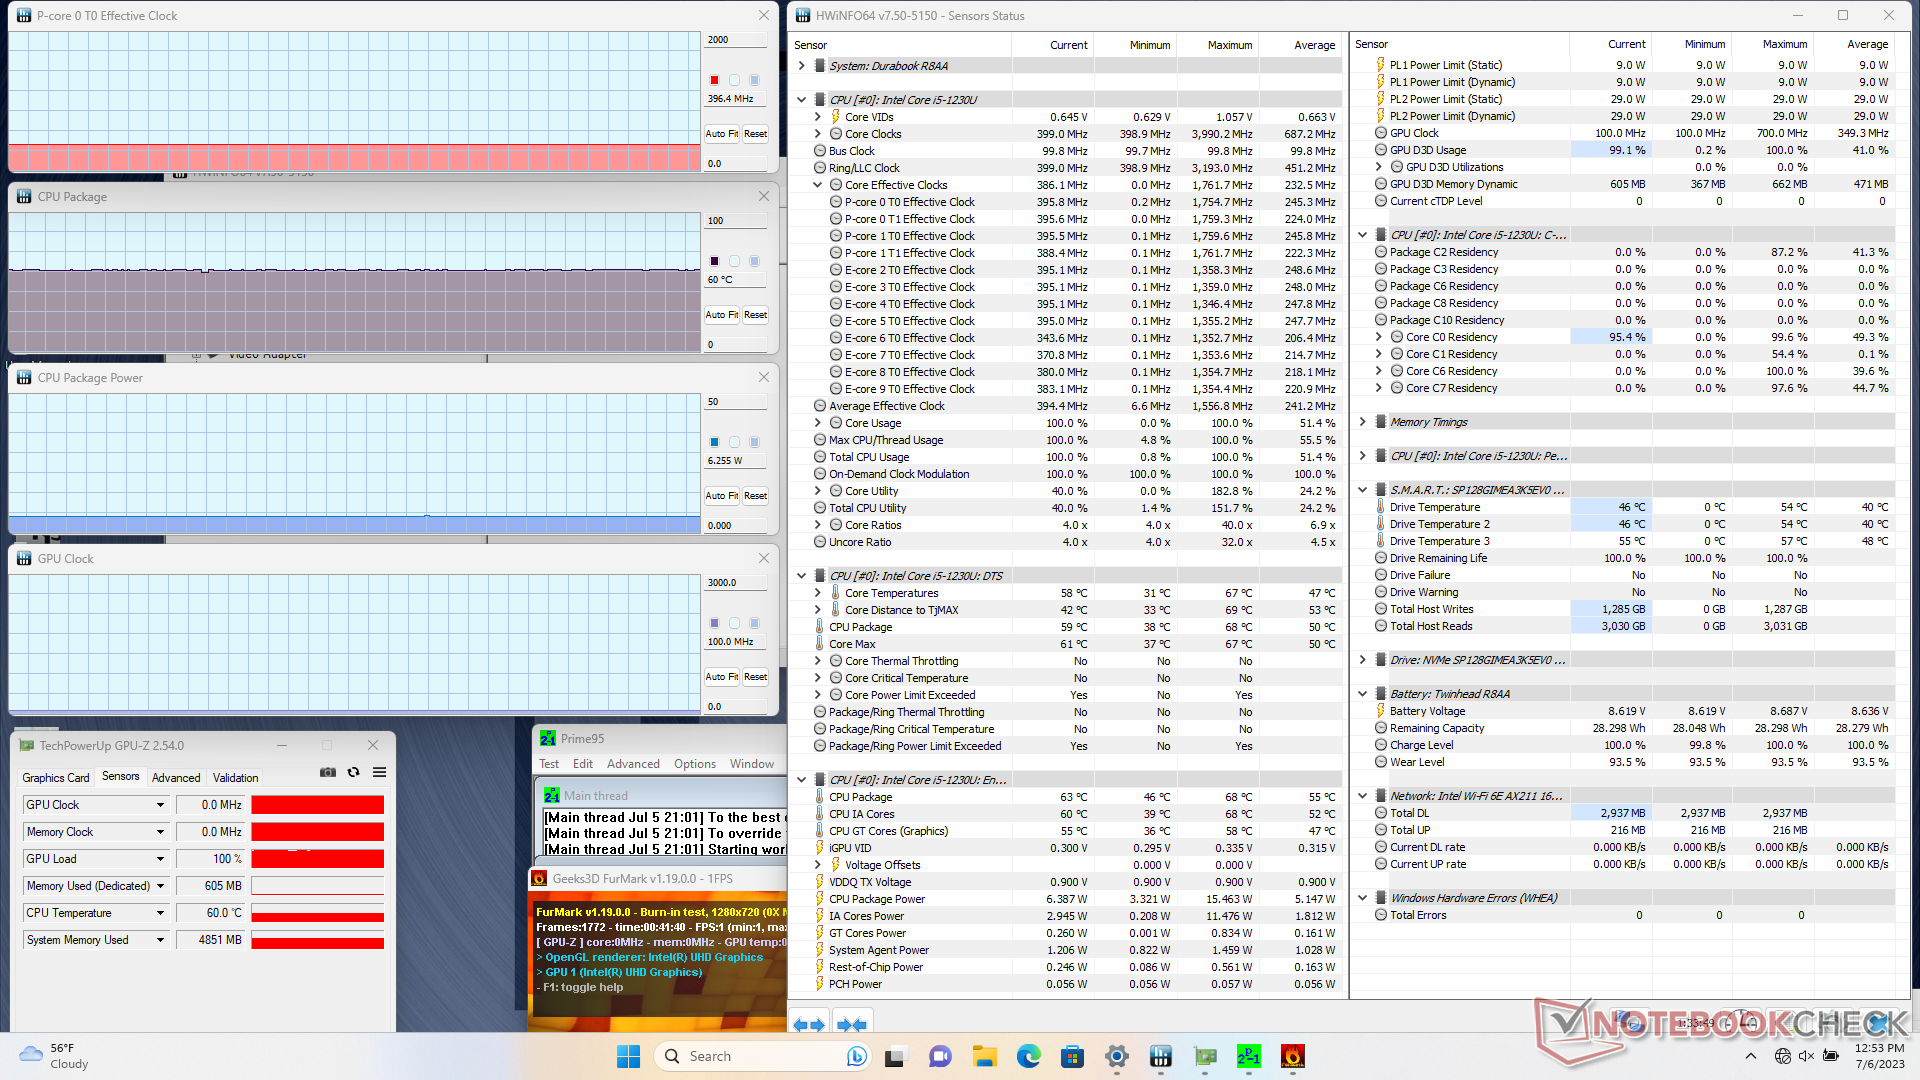
Stress Test
The CPU would boost to 1.8 GHz, 67 C, and 15 W for the first few seconds after initiating Prime95 stress before falling and stabilizing at just 400 MHz, 59 C, and 7 W. These results are significantly lower than on the Dell XPS 13 9315 which ships with the exact same CPU and it explains the lower-than-expected benchmark results in the CPU Performance section above.
Performance on battery power would remain identical.
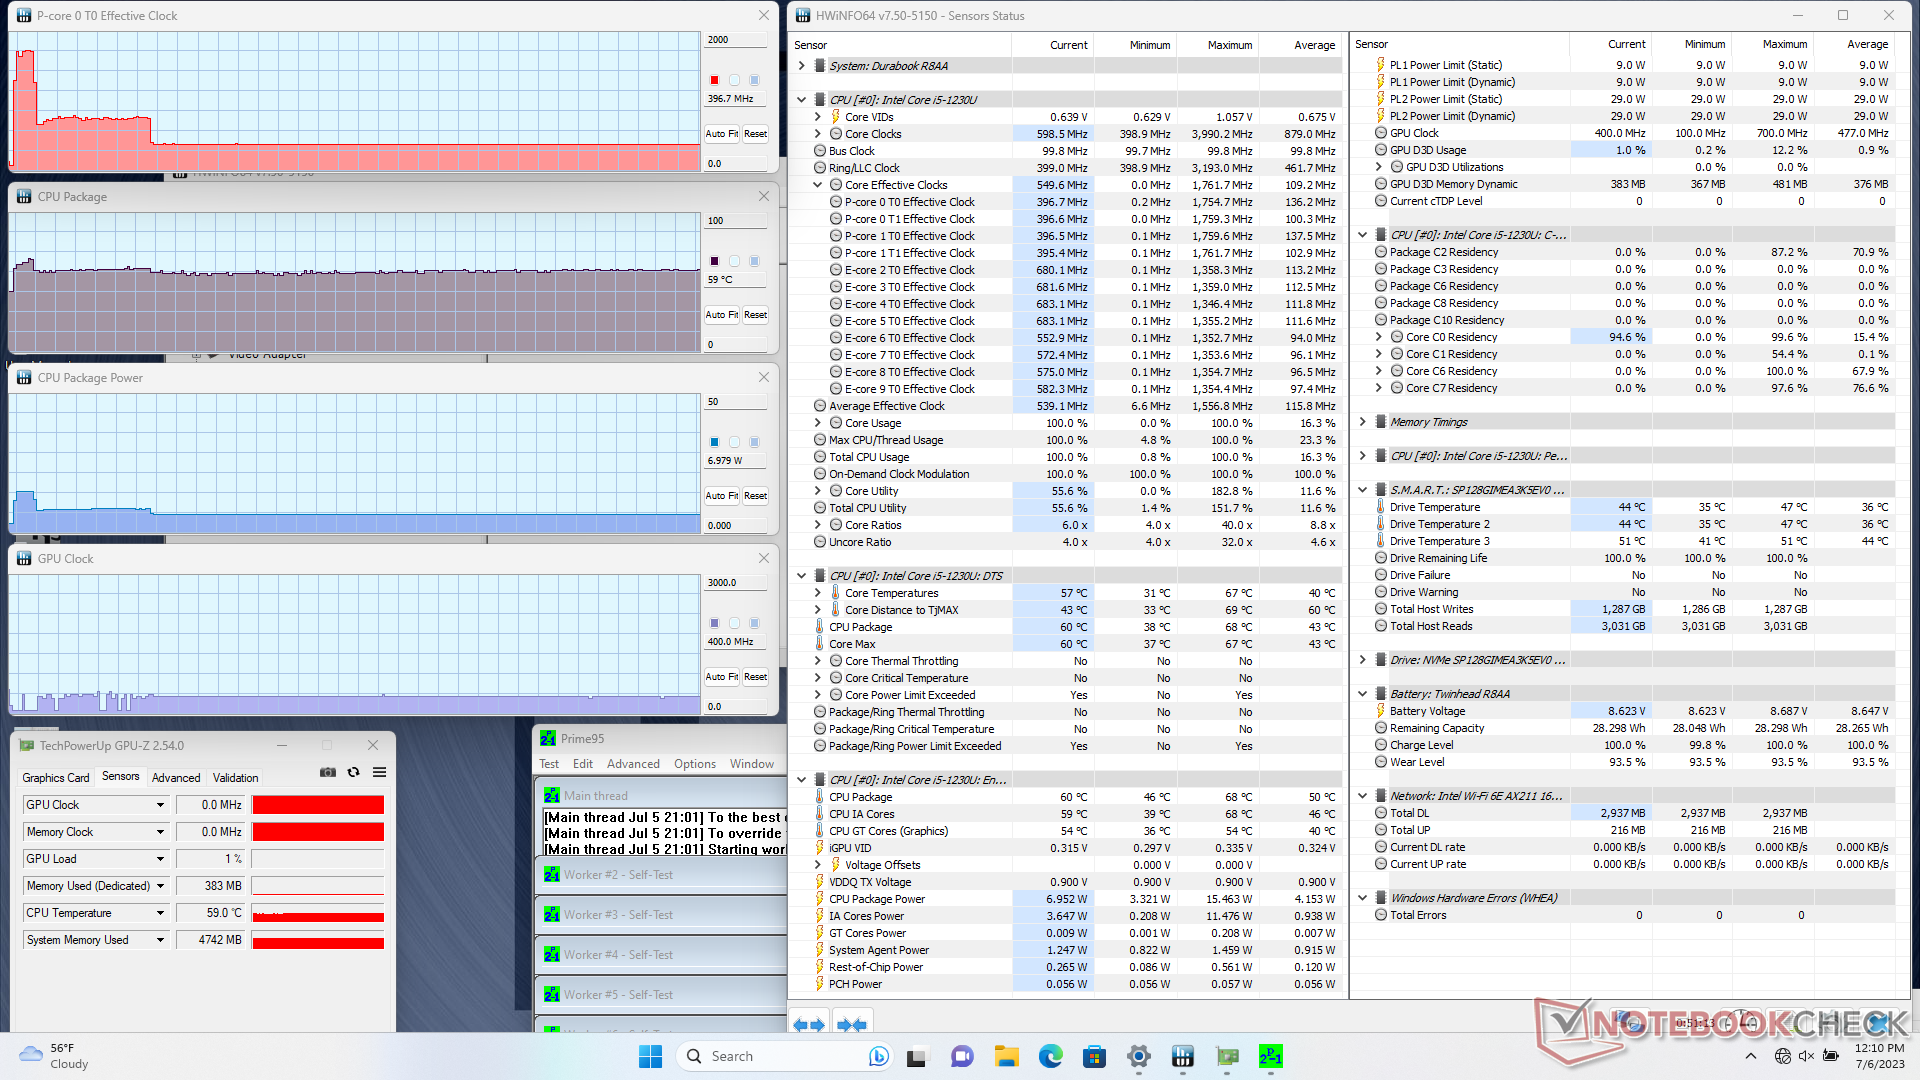
| CPU Clock (GHz) | GPU Clock (MHz) | Average CPU Temperature (°C) | |
| System Idle | -- | -- | 44 |
| Prime95 Stress | 0.4 | -- | 59 |
| Prime95 + FurMark Stress | 0.4 | 100 | 60 |
| Witcher 3 Stress | ~0.6 | ~700 | 58 |
Speakers
Bass is weak as to be expected, but maximum volume could have been louder at just 75 dB(A) compared to 88 dB(A) on the Acer Enduro T1. The speaker on the Durabook R8 faces the rear which is not optimal for the user.
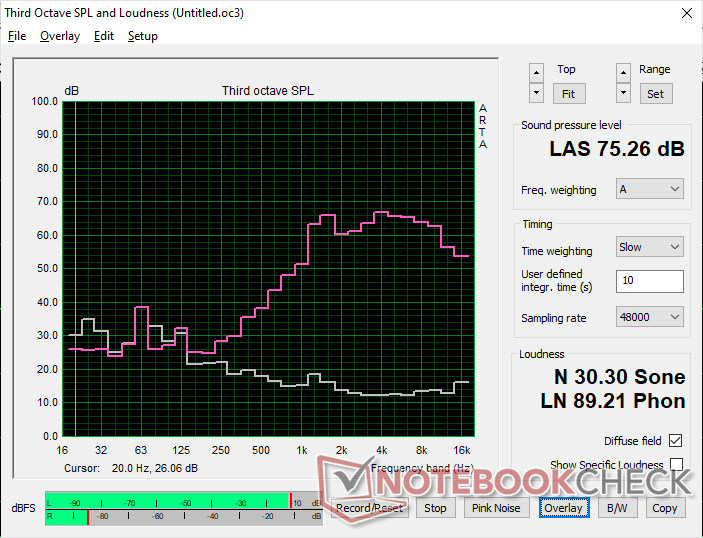
Durabook R8 Tablet audio analysis
(±) | speaker loudness is average but good (75.3 dB)
Bass 100 - 315 Hz
(-) | nearly no bass - on average 25.7% lower than median
(±) | linearity of bass is average (8.4% delta to prev. frequency)
Mids 400 - 2000 Hz
(±) | reduced mids - on average 10% lower than median
(±) | linearity of mids is average (13.9% delta to prev. frequency)
Highs 2 - 16 kHz
(±) | higher highs - on average 10.6% higher than median
(+) | highs are linear (4.1% delta to prev. frequency)
Overall 100 - 16.000 Hz
(-) | overall sound is not linear (38% difference to median)
Compared to same class
» 97% of all tested devices in this class were better, 1% similar, 2% worse
» The best had a delta of 7%, average was 20%, worst was 129%
Compared to all devices tested
» 95% of all tested devices were better, 1% similar, 5% worse
» The best had a delta of 4%, average was 23%, worst was 134%
Apple MacBook Pro 16 2021 M1 Pro audio analysis
(+) | speakers can play relatively loud (84.7 dB)
Bass 100 - 315 Hz
(+) | good bass - only 3.8% away from median
(+) | bass is linear (5.2% delta to prev. frequency)
Mids 400 - 2000 Hz
(+) | balanced mids - only 1.3% away from median
(+) | mids are linear (2.1% delta to prev. frequency)
Highs 2 - 16 kHz
(+) | balanced highs - only 1.9% away from median
(+) | highs are linear (2.7% delta to prev. frequency)
Overall 100 - 16.000 Hz
(+) | overall sound is linear (4.6% difference to median)
Compared to same class
» 0% of all tested devices in this class were better, 0% similar, 100% worse
» The best had a delta of 5%, average was 17%, worst was 45%
Compared to all devices tested
» 0% of all tested devices were better, 0% similar, 100% worse
» The best had a delta of 4%, average was 23%, worst was 134%
Energy Management — High Performance-Per-Watt
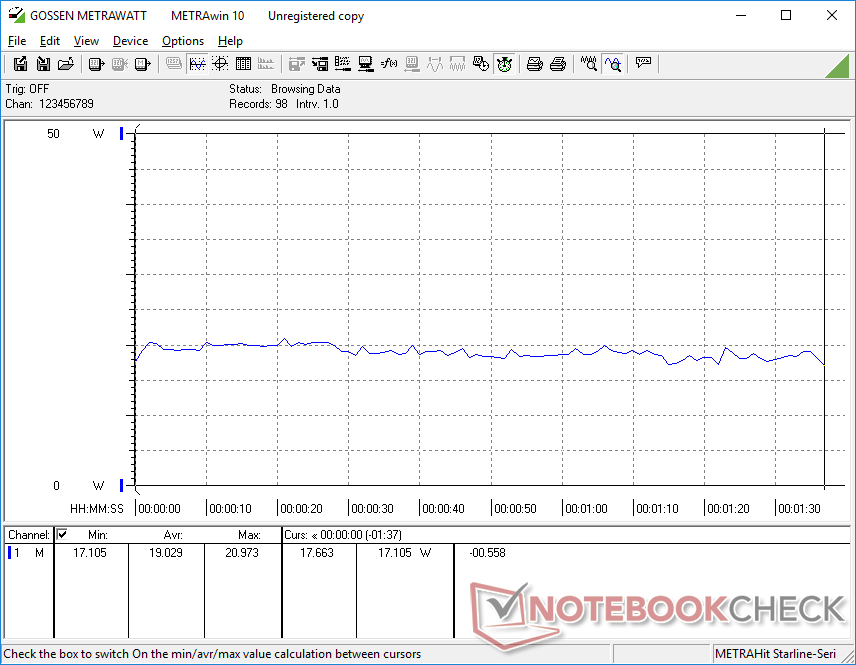
Power Consumption
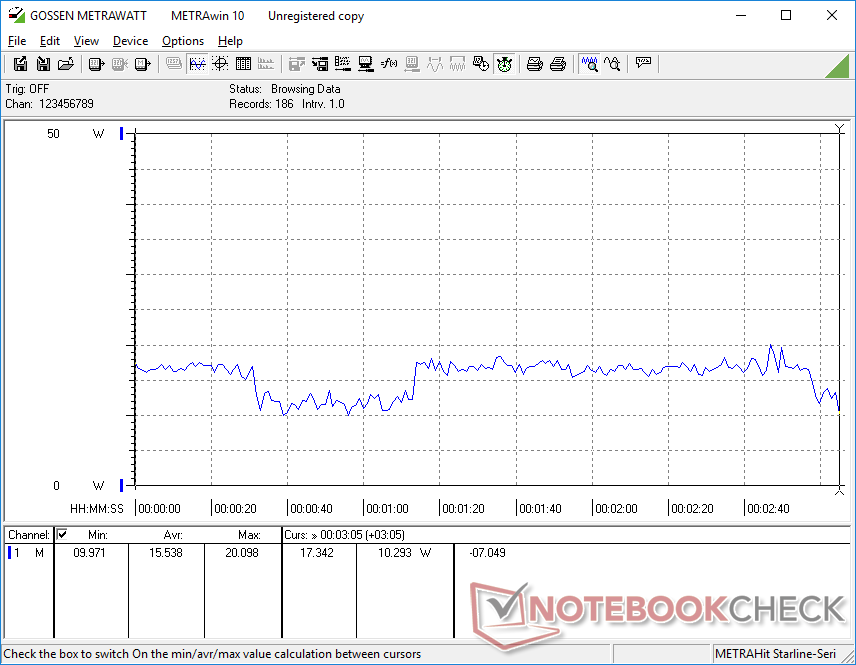
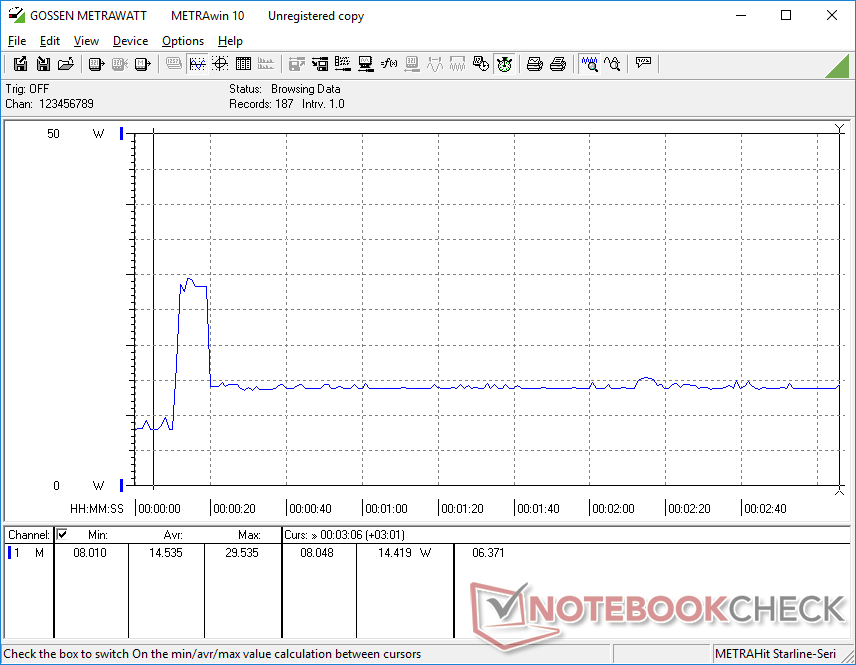
Power consumption can be as low as 3 W when idling on desktop at the lowest brightness setting or up to almost 7 W if the brightness is bumped up to maximum.
Overall consumption when under heavier loads is about half that of the older Panasonic Toughbook FZ-G2 even though processor performance is nearly the same between them. Thus, users can still benefit from the higher performance-per-watt of the newer Core i5-1230U.
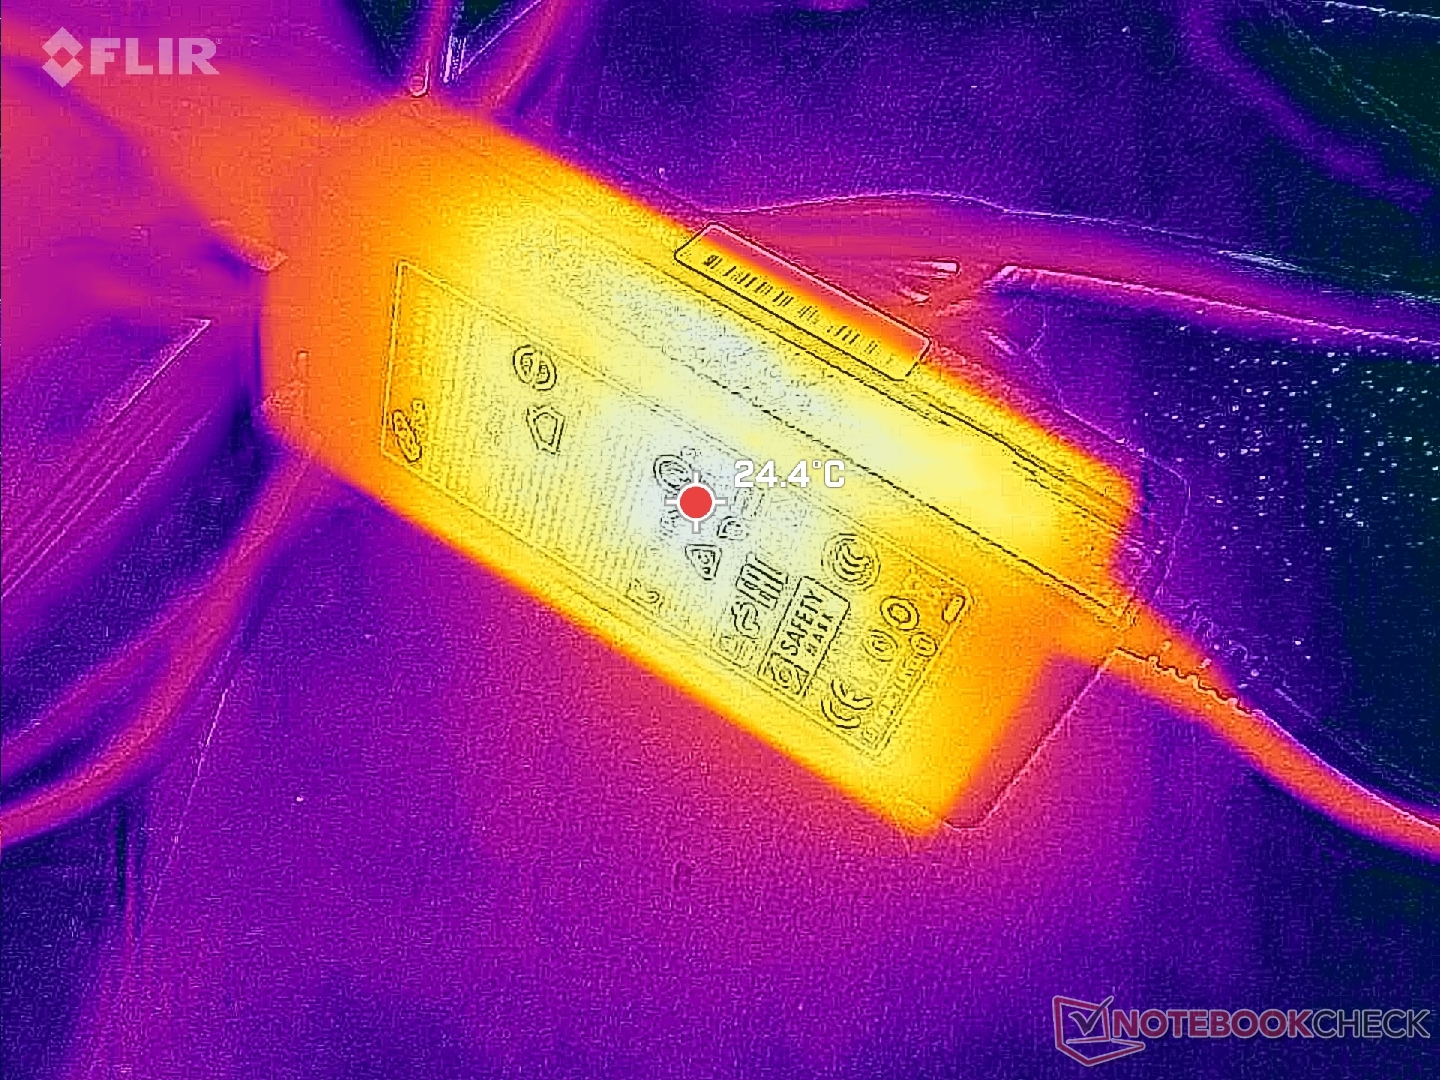
We're able to measure a maximum consumption of 30 W from the small (~10.5 x 4.5 x 3 cm) 65 W AC adapter.

| Off / Standby | |
| Idle | |
| Load |
|
Key:
min: | |
| Durabook R8 Tablet i5-1230U, Iris Xe G7 80EUs, Silicon Power SP128GIMEA3K5EV0, IPS, 1280x800, 8" | Acer Enduro T1 ET108-11A A9001 64 GB eMMC Flash, IPS, 1280x800, 8" | Lenovo Tab M8 (Gen 4) Helio A22 MT6761, PowerVR GE8300, 32 GB eMMC Flash, IPS, 1280x800, 8" | Dell Latitude 7230 Rugged Extreme i5-1240U, Iris Xe G7 80EUs, WD PC SN740 512GB SDDPMQD-512G-1101, IPS, 1920x1200, 12" | Panasonic Toughbook FZ-G2 i5-10310U, UHD Graphics 620, Toshiba KIOXIA KBG4AZNV512G M.2 2280 OPAL, IPS, 1920x1200, 10.1" | |
|---|---|---|---|---|---|
| Power Consumption | 73% | 71% | -102% | -65% | |
| Idle Minimum * (Watt) | 2.8 | 1.1 61% | 1.7 39% | 6.5 -132% | 3.5 -25% |
| Idle Average * (Watt) | 6.3 | 2.2 65% | 1.9 70% | 8.9 -41% | 8.1 -29% |
| Idle Maximum * (Watt) | 10.3 | 2.2 79% | 2.4 77% | 14.3 -39% | 8.2 20% |
| Load Average * (Watt) | 19 | 3.6 81% | 3 84% | 44.9 -136% | 34.7 -83% |
| Witcher 3 ultra * (Watt) | 15.5 | 43.2 -179% | 31.8 -105% | ||
| Load Maximum * (Watt) | 30.1 | 6.7 78% | 3.9 87% | 54.8 -82% | 79.7 -165% |
* ... smaller is better
Power Consumption Witcher 3 / Stresstest
Power Consumption external Monitor
Battery Life
Real-world WLAN runtime is just 5.5 hours from the removable 27 Wh battery pack. Users can upgrade to larger and heavier battery packs or carry multiple at a time for swapping purposes, but battery life is still on the disappointing nonetheless.
Charging the 27 Wh battery pack from empty to full is relatively slow at about 2 hours.
| Durabook R8 Tablet i5-1230U, Iris Xe G7 80EUs, 27.4 Wh | Acer Enduro T1 ET108-11A A9001 Wh | Lenovo Tab M8 (Gen 4) Helio A22 MT6761, PowerVR GE8300, Wh | Dell Latitude 7230 Rugged Extreme i5-1240U, Iris Xe G7 80EUs, 72 Wh | Panasonic Toughbook FZ-G2 i5-10310U, UHD Graphics 620, 68 Wh | |
|---|---|---|---|---|---|
| Battery runtime | 194% | 192% | 145% | 111% | |
| WiFi v1.3 (h) | 5.3 | 15.6 194% | 15.5 192% | 13 145% | 11.2 111% |
| Reader / Idle (h) | 37.1 | ||||
| H.264 (h) | 16.6 | ||||
| Load (h) | 3.8 | 3.6 |
Pros
Cons
Verdict — Strong Design With Some Annoyances
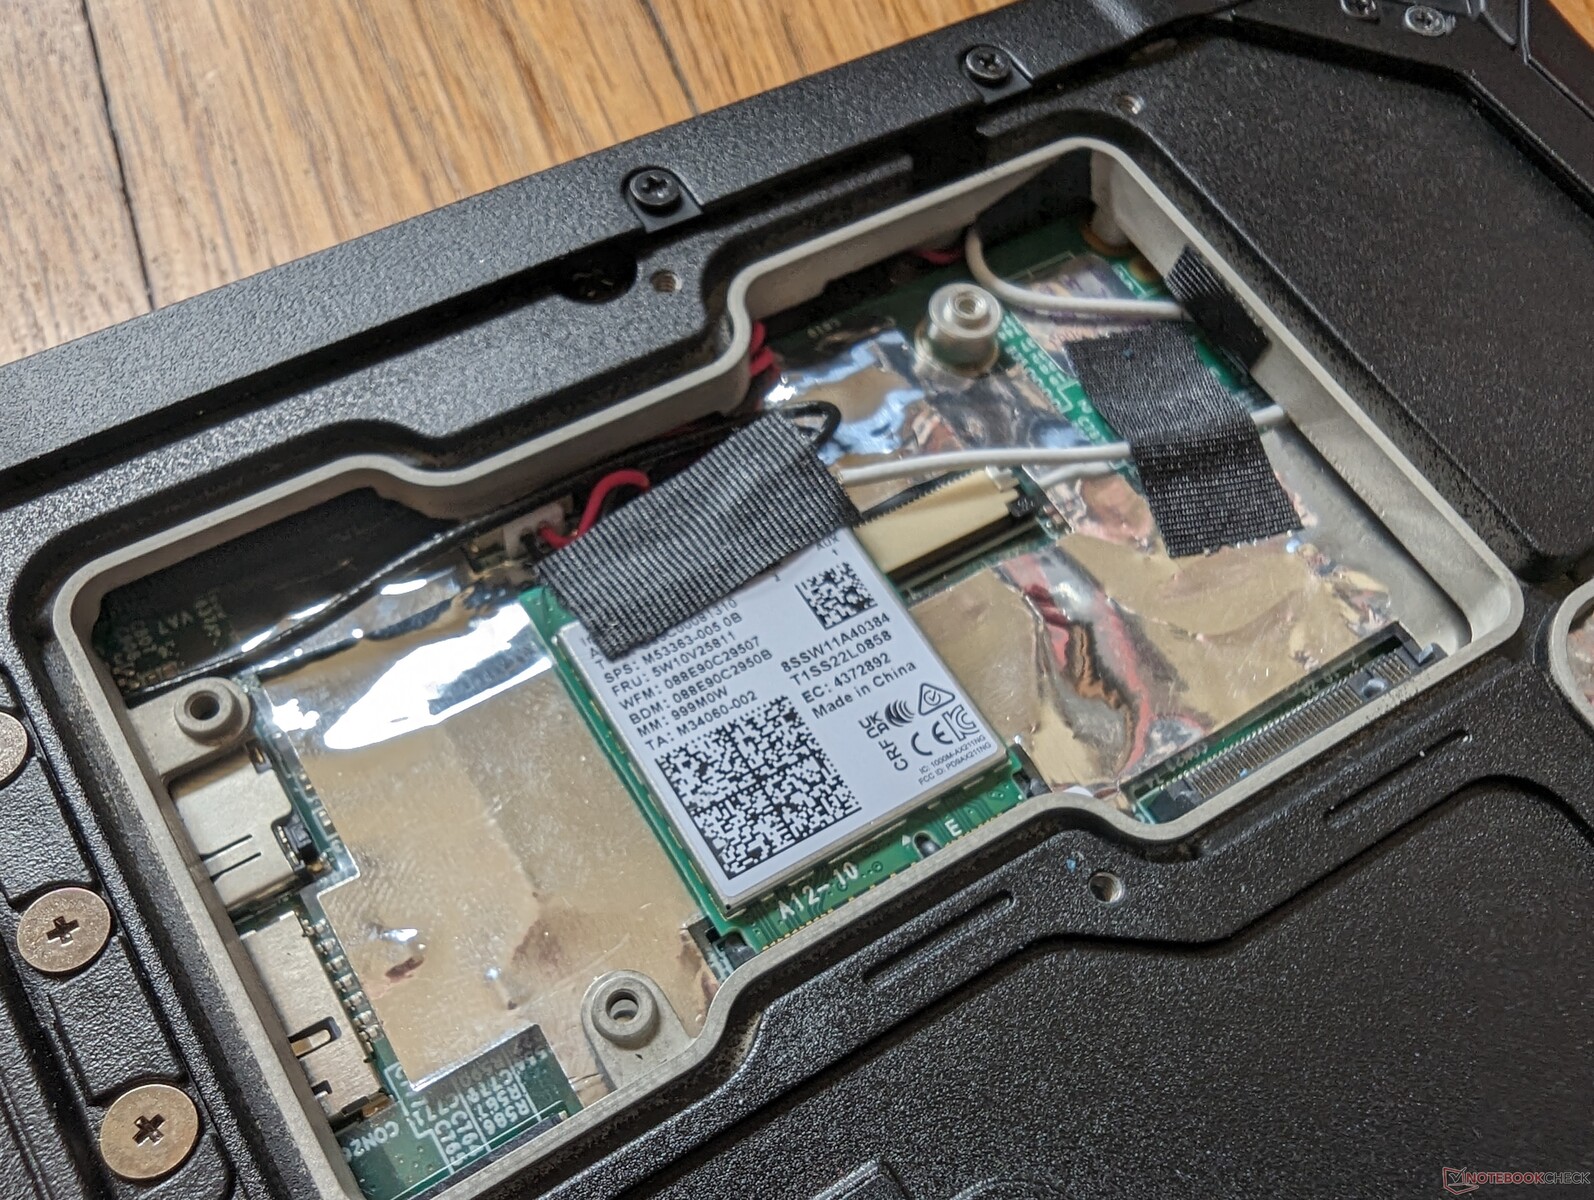
The greatest strengths of the Durabook R8 are in its fanless design, versatile configurable options, and Thunderbolt 4 support. It's an uncommon combination of features that may appeal to a certain category or professionals. We especially like the easily accessible SSD, WLAN, and WAN modules from the rear.
The fanless approach comes with the usual set of caveats, however. CPU performance has been reduced by quite the margin and surface temperatures can become very warm especially on the back. This isn't to say that the tablet is slow, but don't expect it to perform as fast as a laptop with the same processor.
You'll want the Durabook R8 primarily for its fanless design, ease-of-use, and wide peripheral support. Other aspects like battery life and colors could be better.
There are several minor aspects that could be improved upon for future revisions. The ejecting mechanism for the MicroSD reader, for example, needs to be stronger and more reliable. The speaker could be facing the front instead of the back to be more useful. The tight USB-C ports could be widened apart to reduce crowding. The proprietary AC barrel port could be removed in favor of universal USB-C charging. And finally, battery life on the default battery pack could be longer and PWM should be reduced or eliminated.
Price and Availability
Users can request a quote for the Durabook R8 Tablet directly from the manufacturer here.
Durabook R8 Tablet
- 07/12/2023 v7 (old)
Allen Ngo
Transparency
The selection of devices to be reviewed is made by our editorial team. The test sample was provided to the author as a loan by the manufacturer or retailer for the purpose of this review. The lender had no influence on this review, nor did the manufacturer receive a copy of this review before publication. There was no obligation to publish this review. As an independent media company, Notebookcheck is not subjected to the authority of manufacturers, retailers or publishers.
This is how Notebookcheck is testing
Every year, Notebookcheck independently reviews hundreds of laptops and smartphones using standardized procedures to ensure that all results are comparable. We have continuously developed our test methods for around 20 years and set industry standards in the process. In our test labs, high-quality measuring equipment is utilized by experienced technicians and editors. These tests involve a multi-stage validation process. Our complex rating system is based on hundreds of well-founded measurements and benchmarks, which maintains objectivity. Further information on our test methods can be found here.
Price comparison
