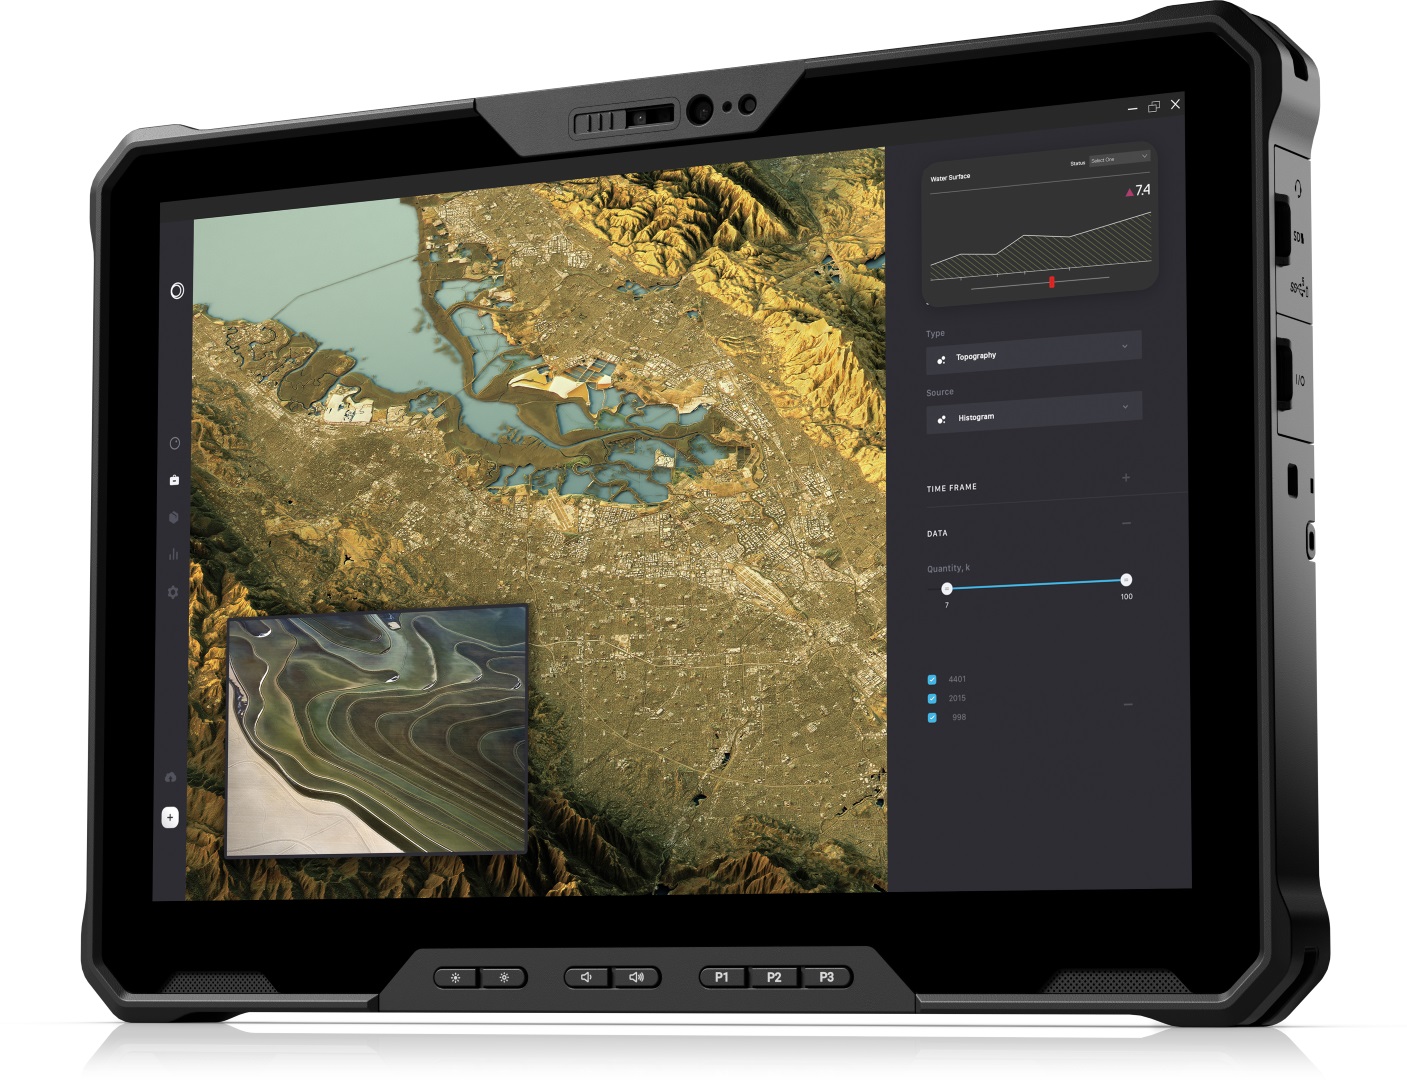
Dell Latitude 7230 Rugged Extreme tablet review: One of the best displays in its category

The Latitude 7230 Rugged Extreme was announced in October of last year as the successor to the Latitude 7220 Rugged Extreme. It introduces an updated chassis with a larger screen size (11.6-inch to 12-inch), faster Intel CPU options (8th gen to 12th gen), and faster connectivity options (Wi-Fi 6 to 6E, 5G).
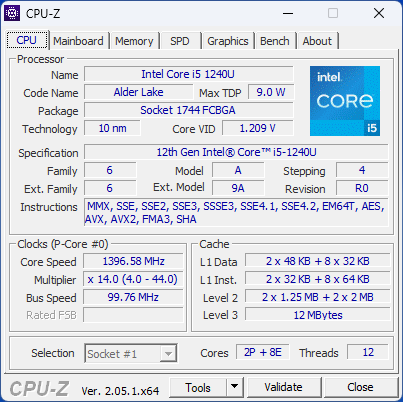
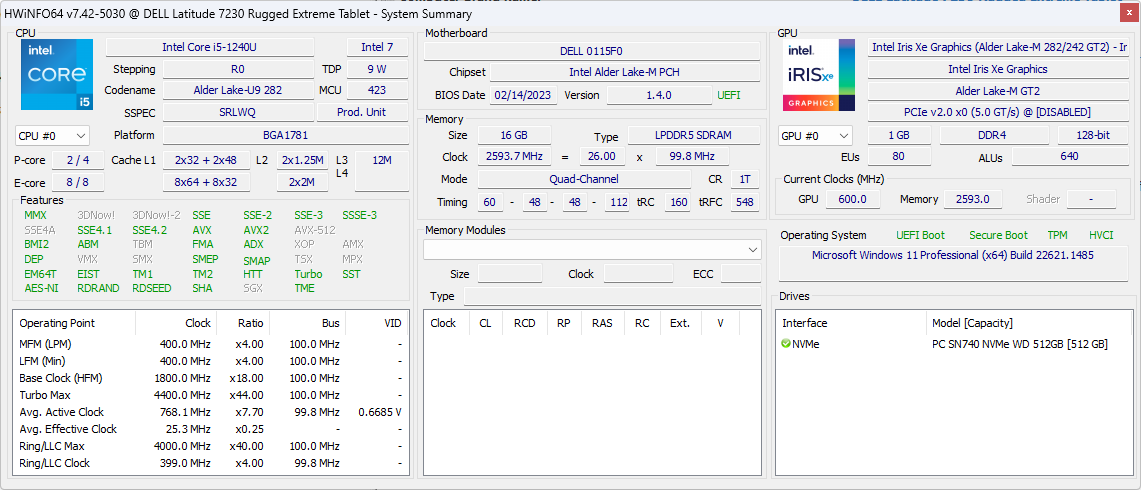
Our unit in review is a midrange SKU with the Core i5-1240U, 16 GB RAM, and 512 GB NVMe SSD for approximately $3200 USD. Other SKUs are available with the slower Core i3-1210U, faster i7-1260U, more RAM or storage, and other expansions. All configurations otherwise ship with the same 1920 x 1200 1200-nit IPS touchscreen. The full specifications sheet for the Latitude 7230 Rugged Extreme is publicly available through Dell here.
Alternatives include the Acer Enduro T1, the Samsung Galaxy Tab Active series, or the Panasonic Toughbook FZ-G2 series.
More Dell reviews:
Potential Competitors in Comparison
Rating | Date | Model | Weight | Height | Size | Resolution | Price |
|---|---|---|---|---|---|---|---|
| 83.9 % v7 (old) | 04 / 2023 | Dell Latitude 7230 Rugged Extreme i5-1240U, Iris Xe G7 80EUs | 1.6 kg | 23.9 mm | 12.00" | 1920x1200 | |
v (old) | 04 / 2022 | Dell Latitude 7330 Rugged Extreme i7-1185G7, Iris Xe G7 96EUs | 2.7 kg | 36.5 mm | 13.30" | 1920x1080 | |
v (old) | 07 / 2022 | Panasonic Toughbook 40 i7-1185G7, Iris Xe G7 96EUs | 3.9 kg | 53.4 mm | 14.00" | 1920x1080 | |
| 83.8 % v7 (old) | 01 / 2022 | Getac B360 i7-10710U, UHD Graphics 620 | 2.4 kg | 34.9 mm | 13.30" | 1920x1080 | |
| 82.4 % v7 (old) | 12 / 2021 | Acer Enduro Urban N3 EUN314 i7-1165G7, Iris Xe G7 96EUs | 1.8 kg | 21.95 mm | 14.00" | 1920x1080 | |
v (old) | 04 / 2021 | Durabook S14I i7-1165G7, Iris Xe G7 96EUs | 3 kg | 38.1 mm | 14.00" | 1920x1080 |
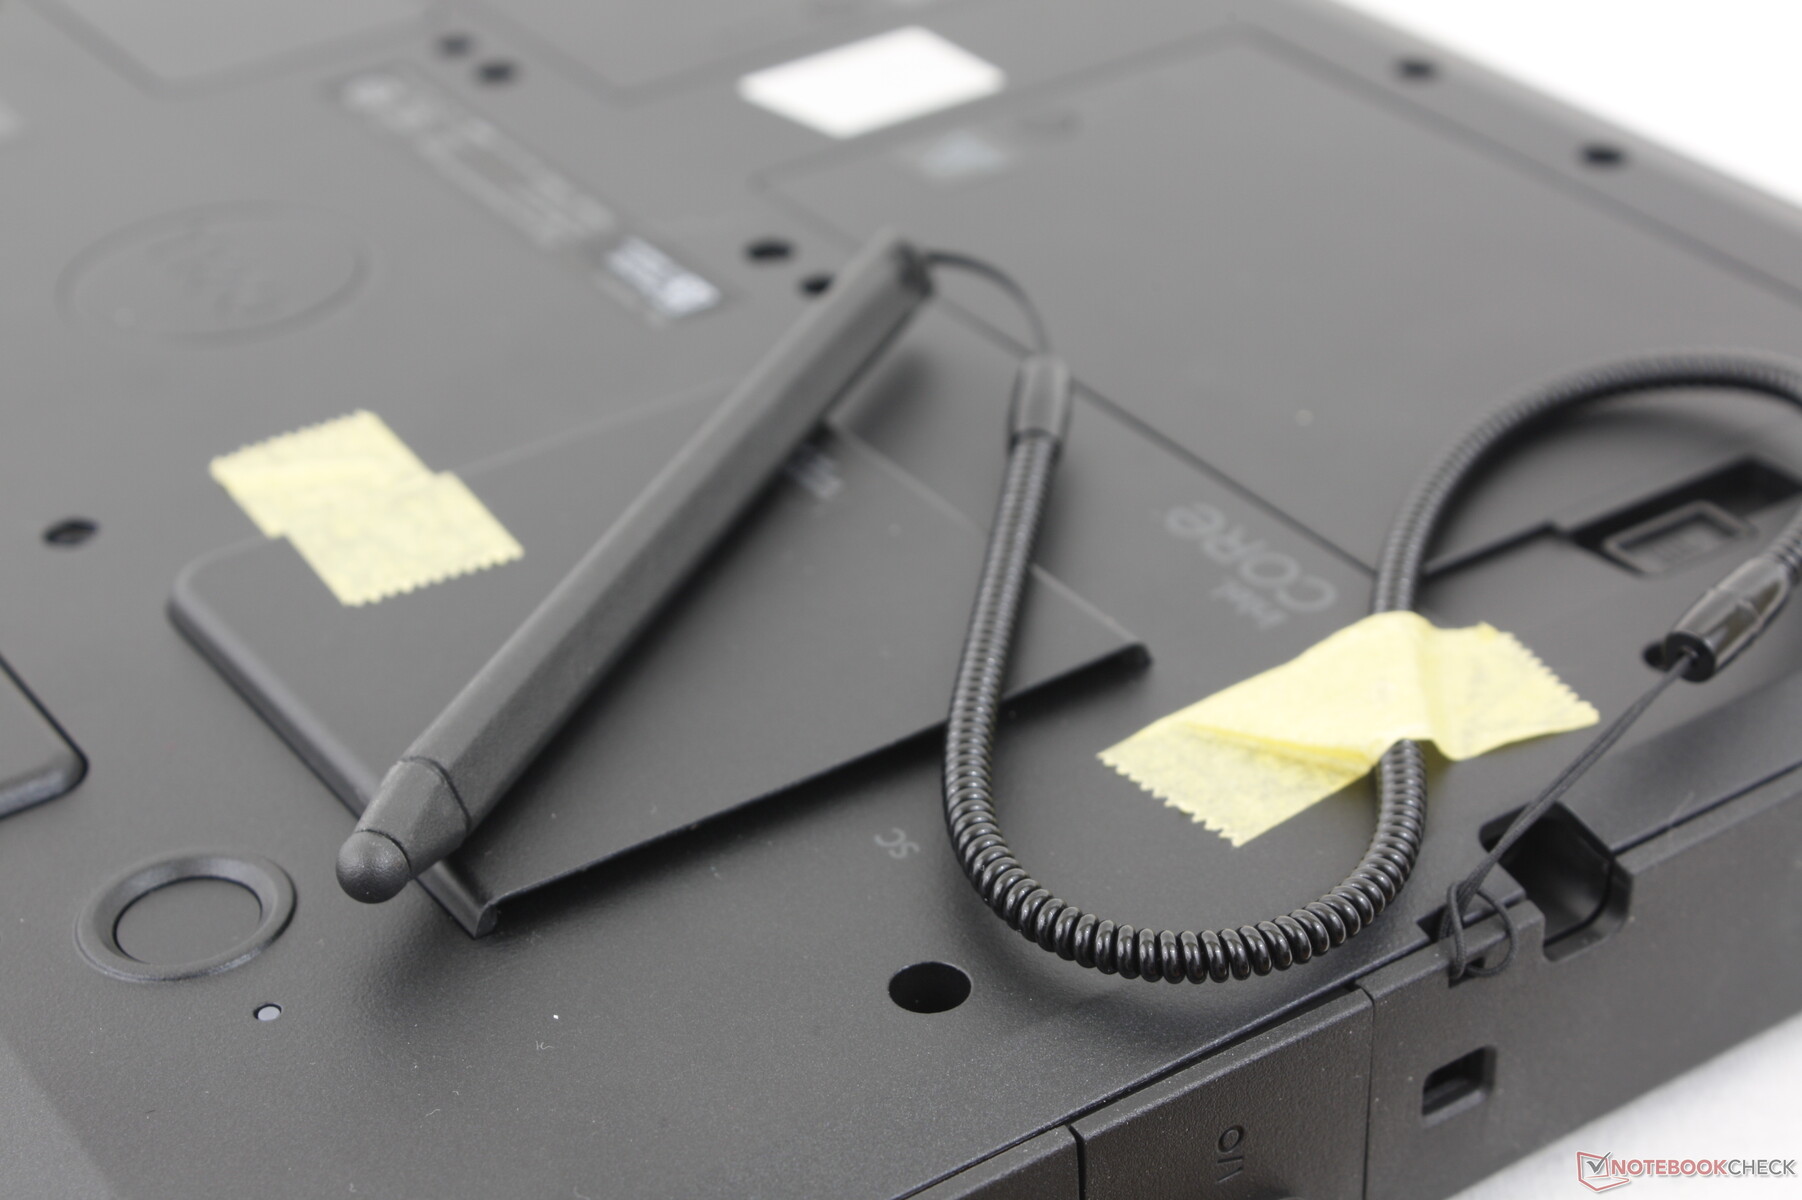
Case — Thick With Relatively Narrow Bezels
The chassis is sturdy from all angles especially along its rubberized edges and corners. Its weakest spot is directly on the center of the touchscreen where warping is noticeable when firmly pressing down on it with a finger. It's not a huge concern or anything, but any warping is worth mentioning nonetheless.
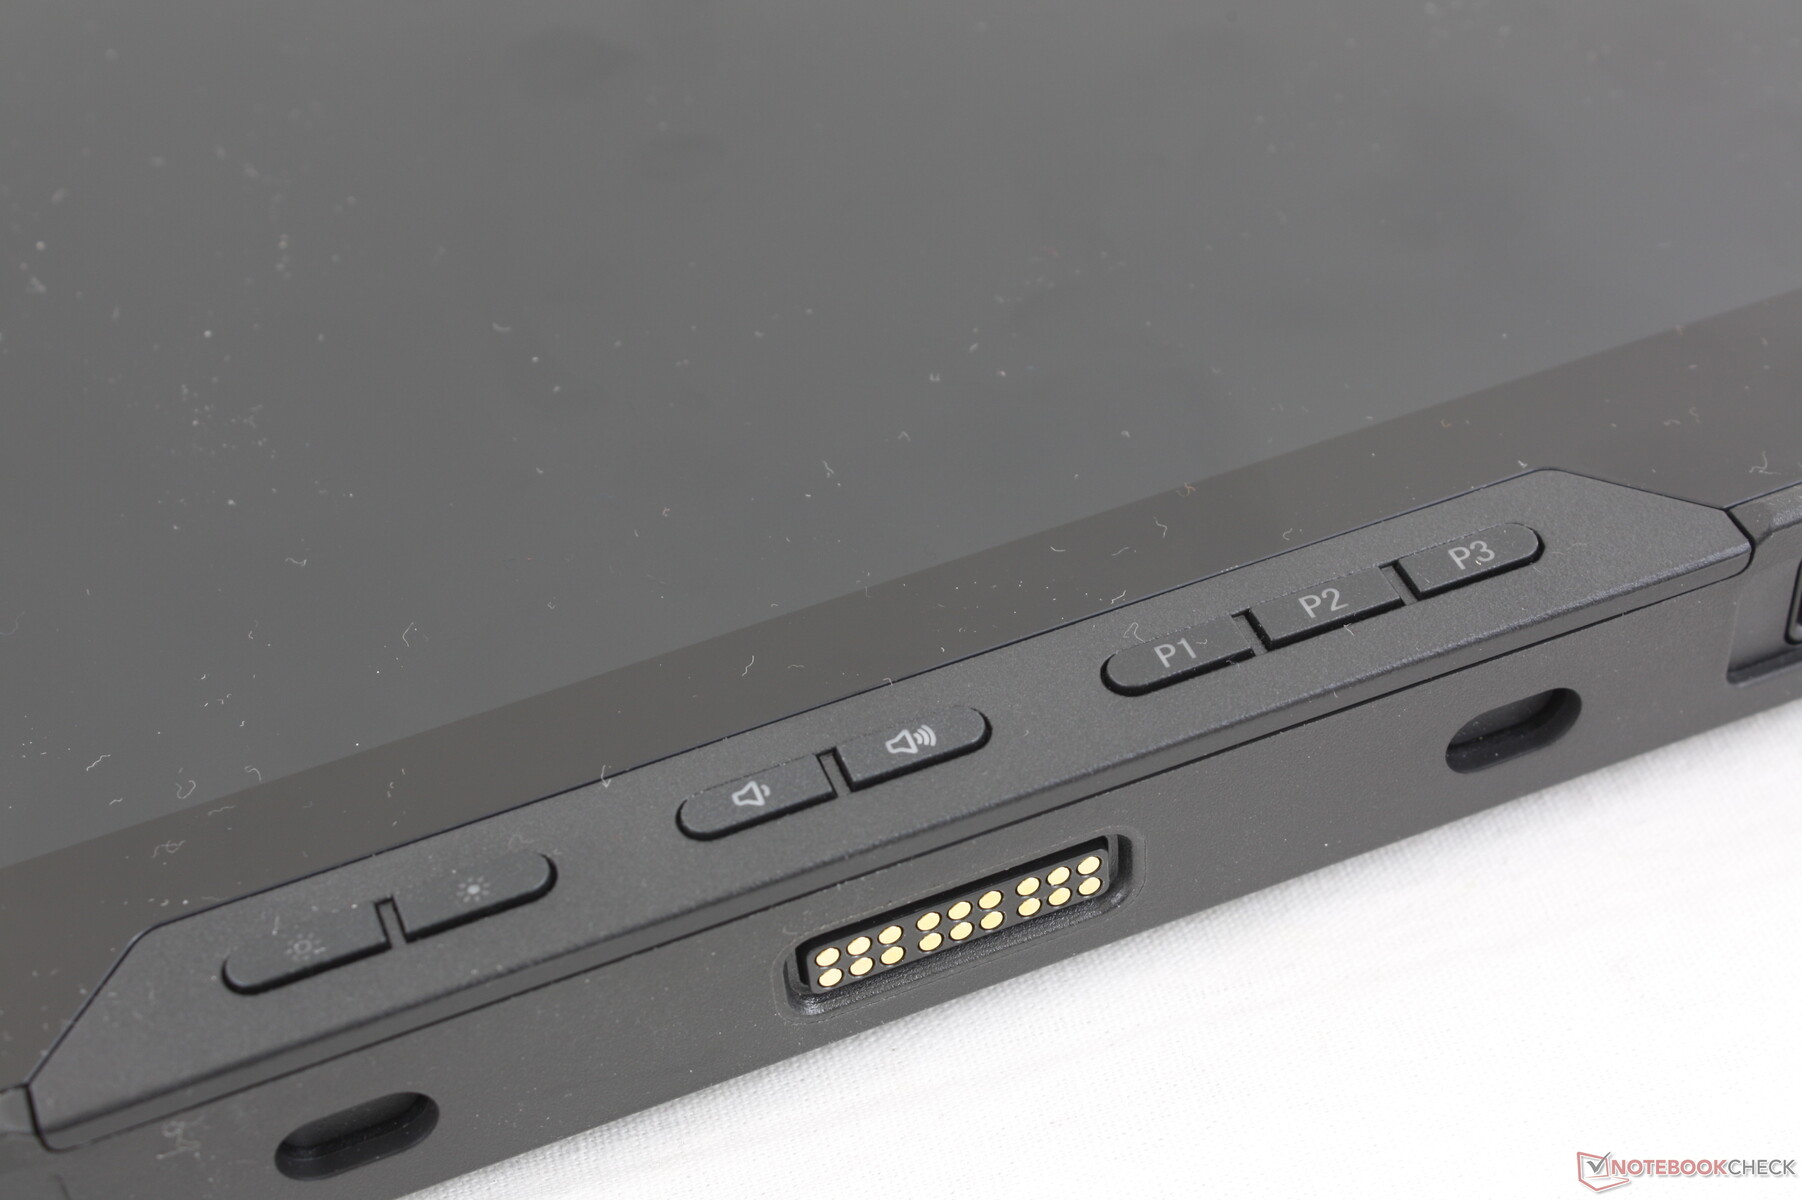
Some annoying aspects of the case include the fidgety covers for the ports and spongy front-facing buttons. The port covers are difficult to grip while the button shortcuts could use some more give when pressed. The competing Toughbook FZ-G2 does things a little better in this regard.
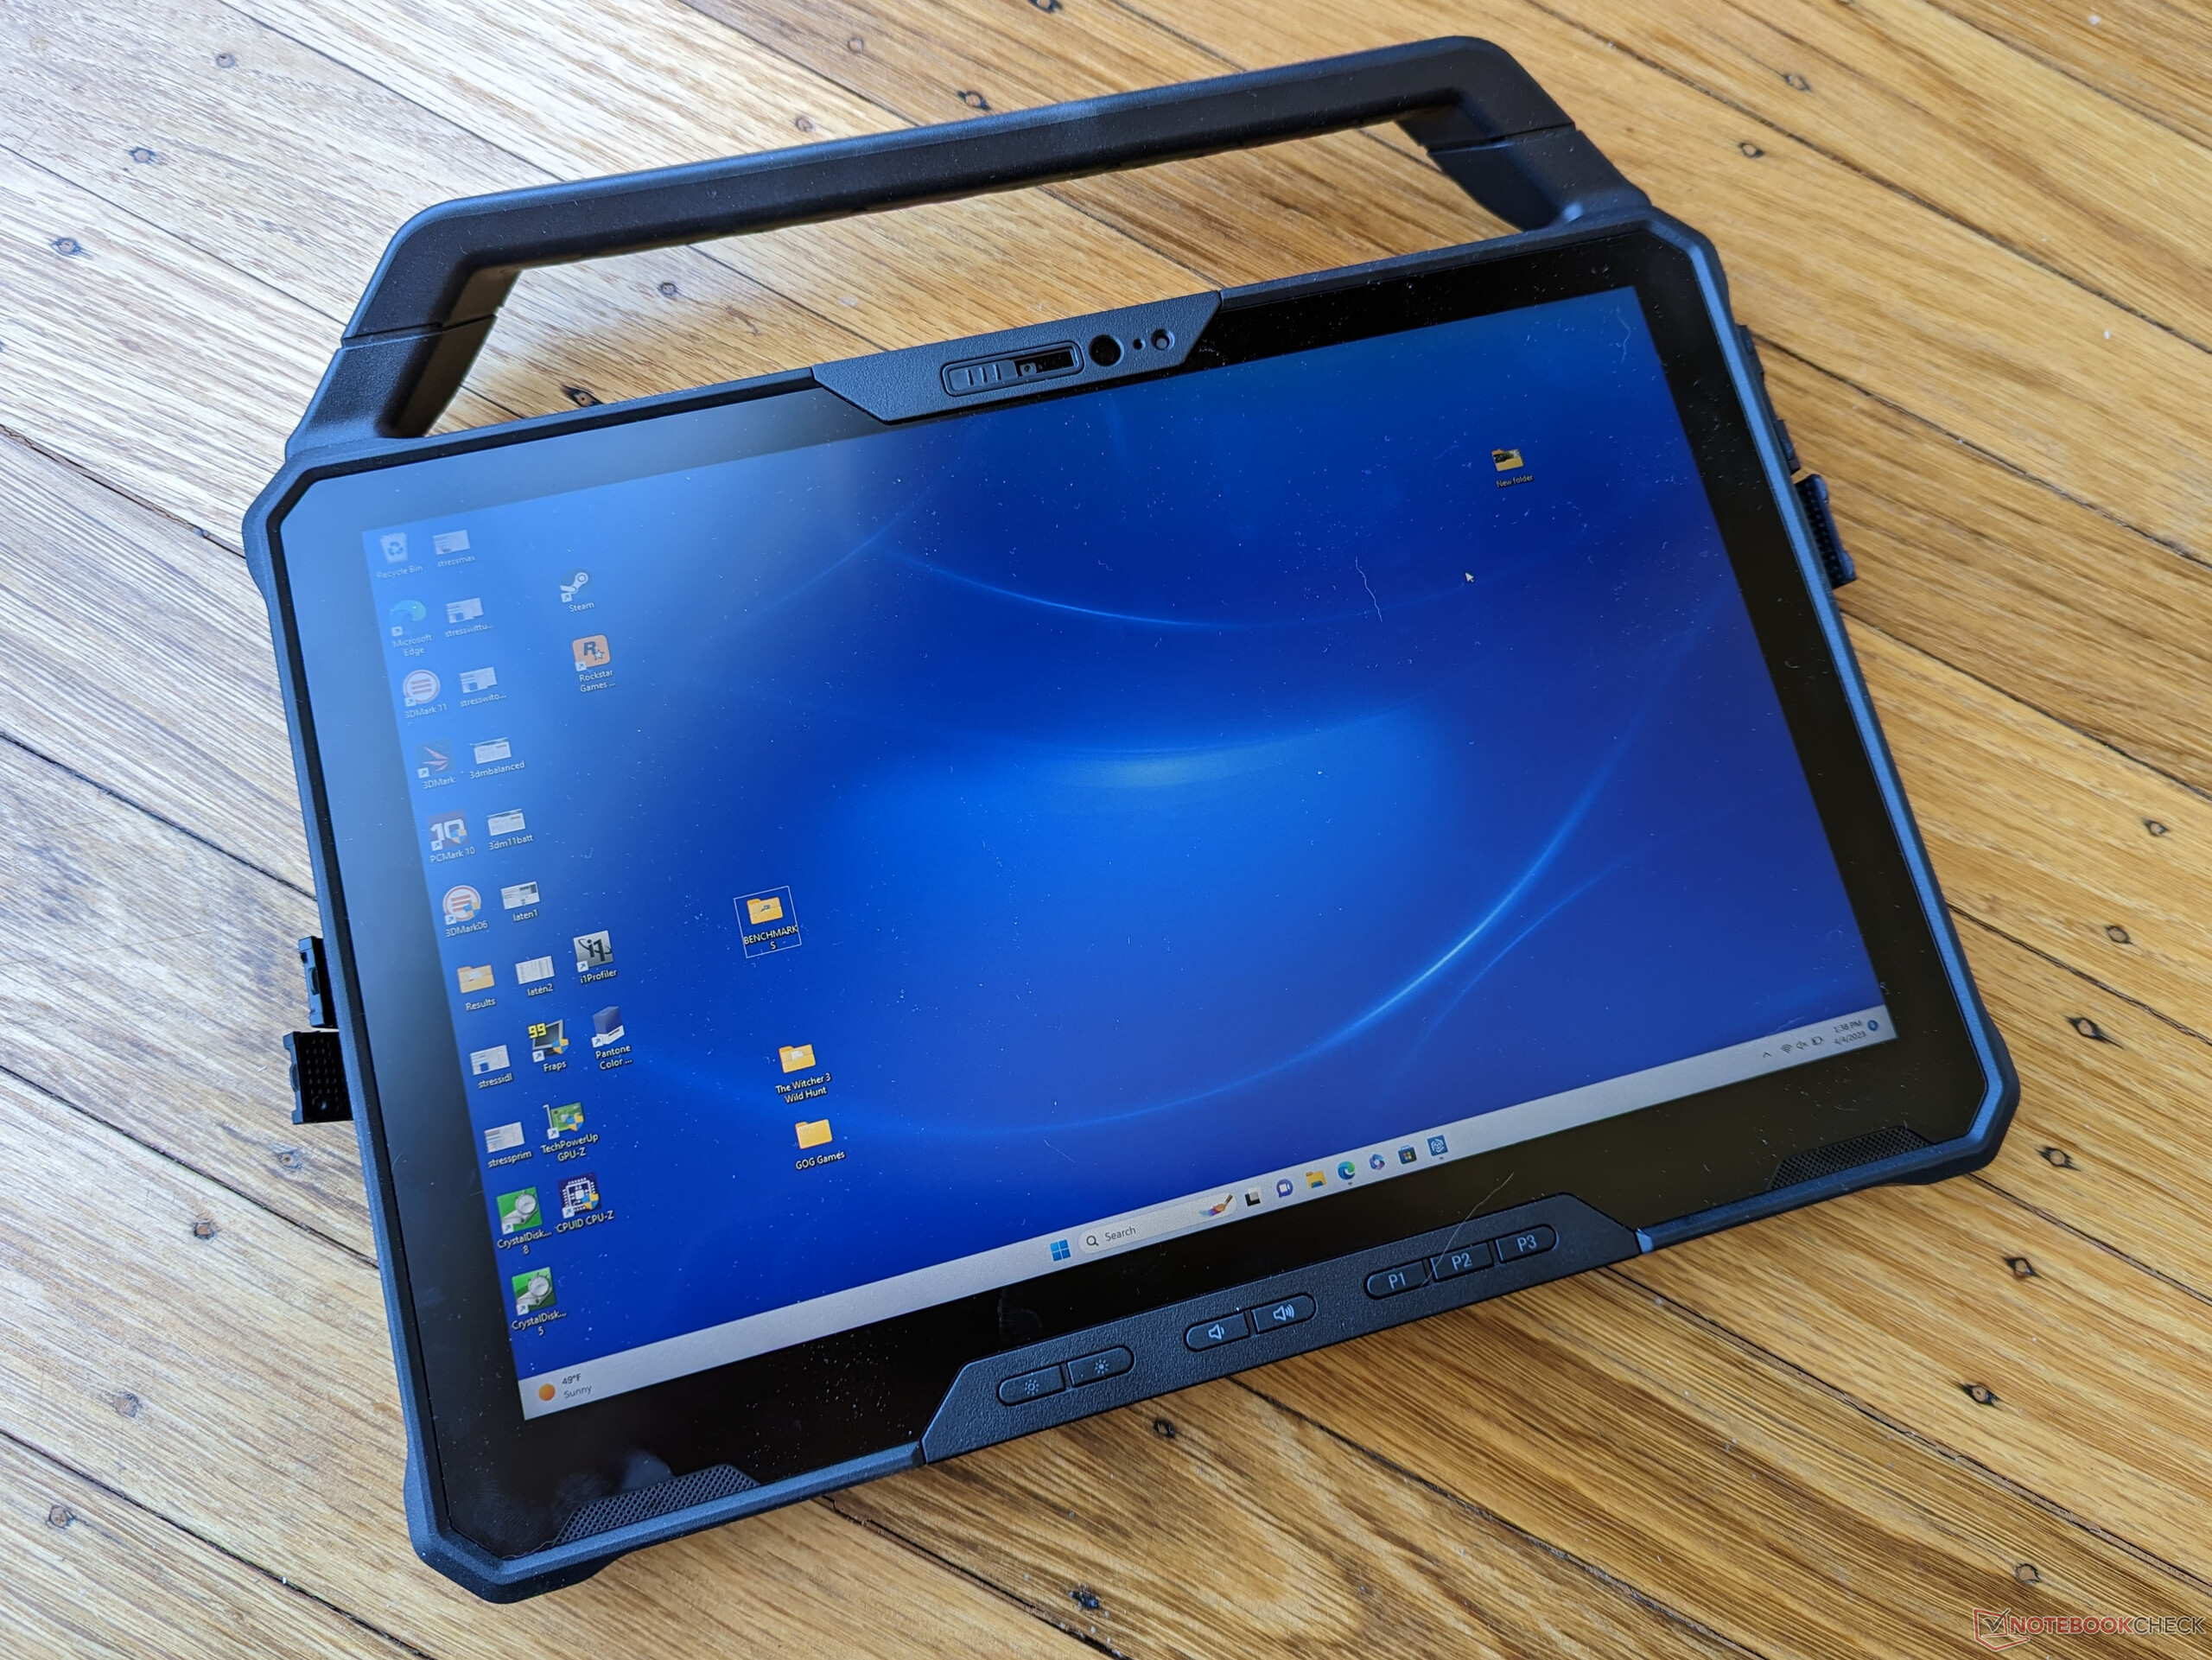
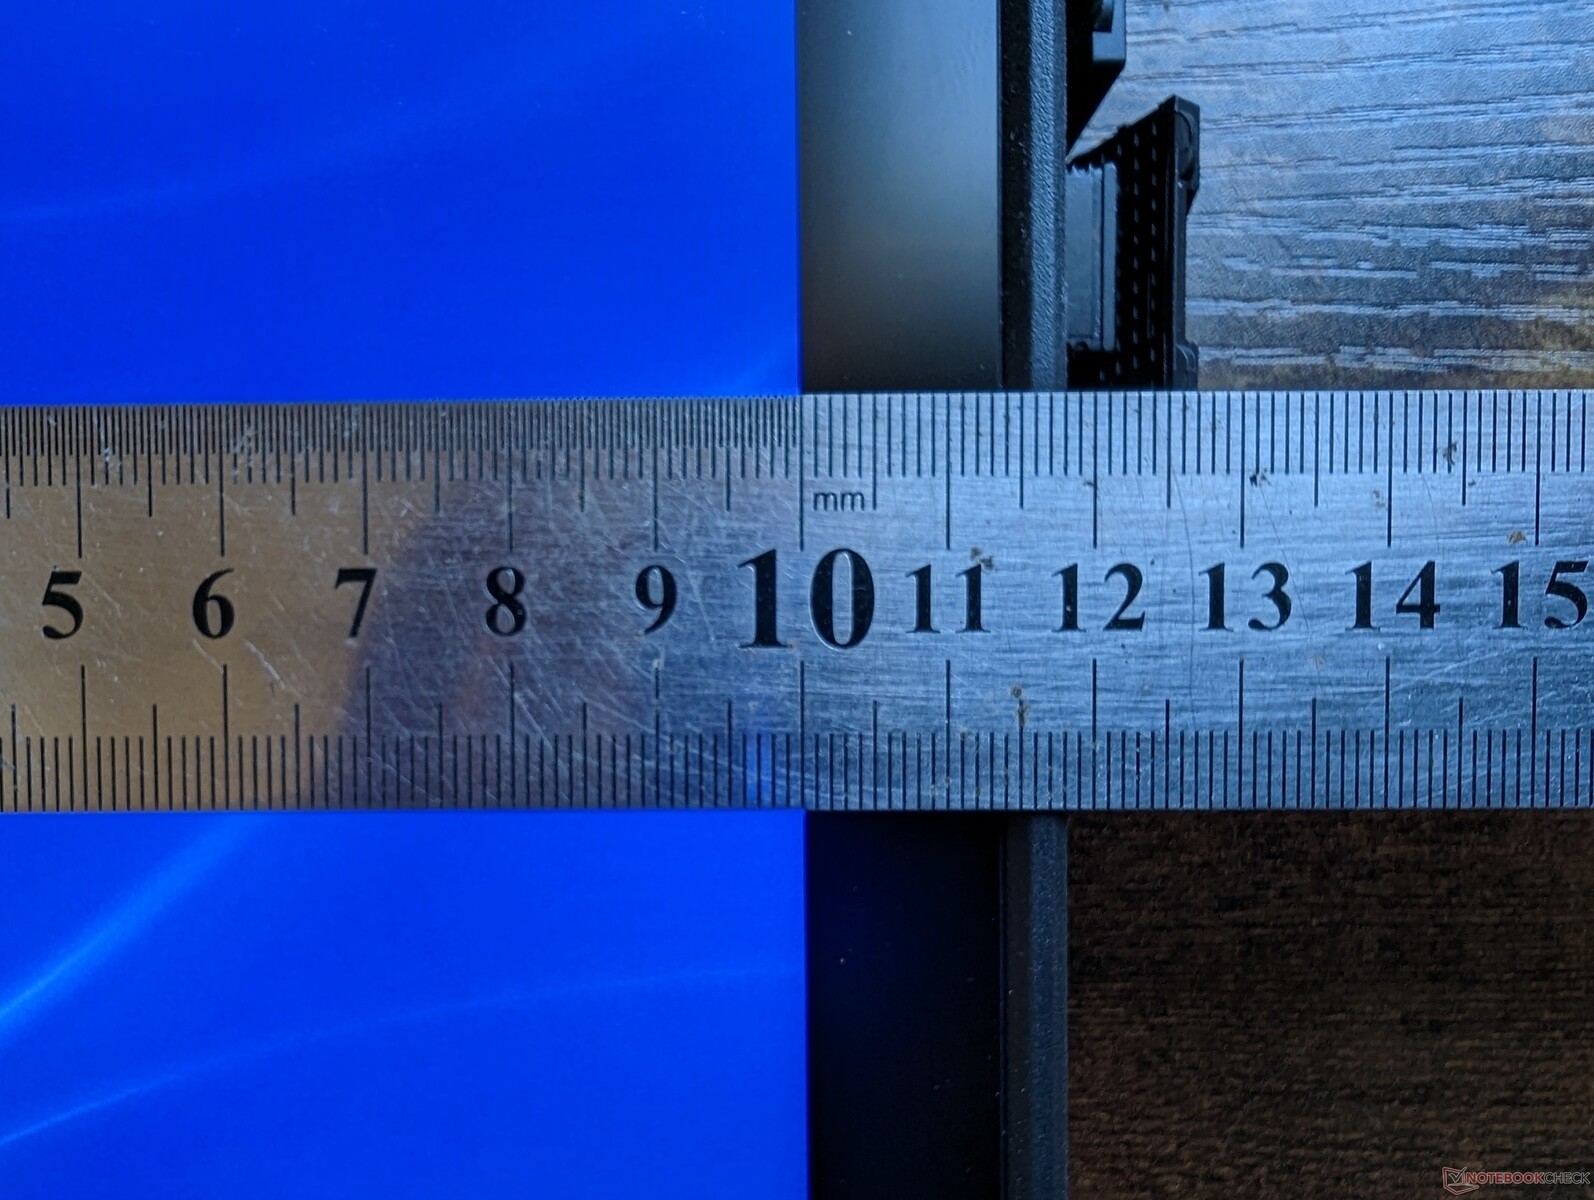
At about 1.6 kg including its two removable batteries, the unit is one of the lighter rugged tablets in its category. Length and width are conveniently very close to the DIN A4 standard when not taking into account the removable carrying handle.
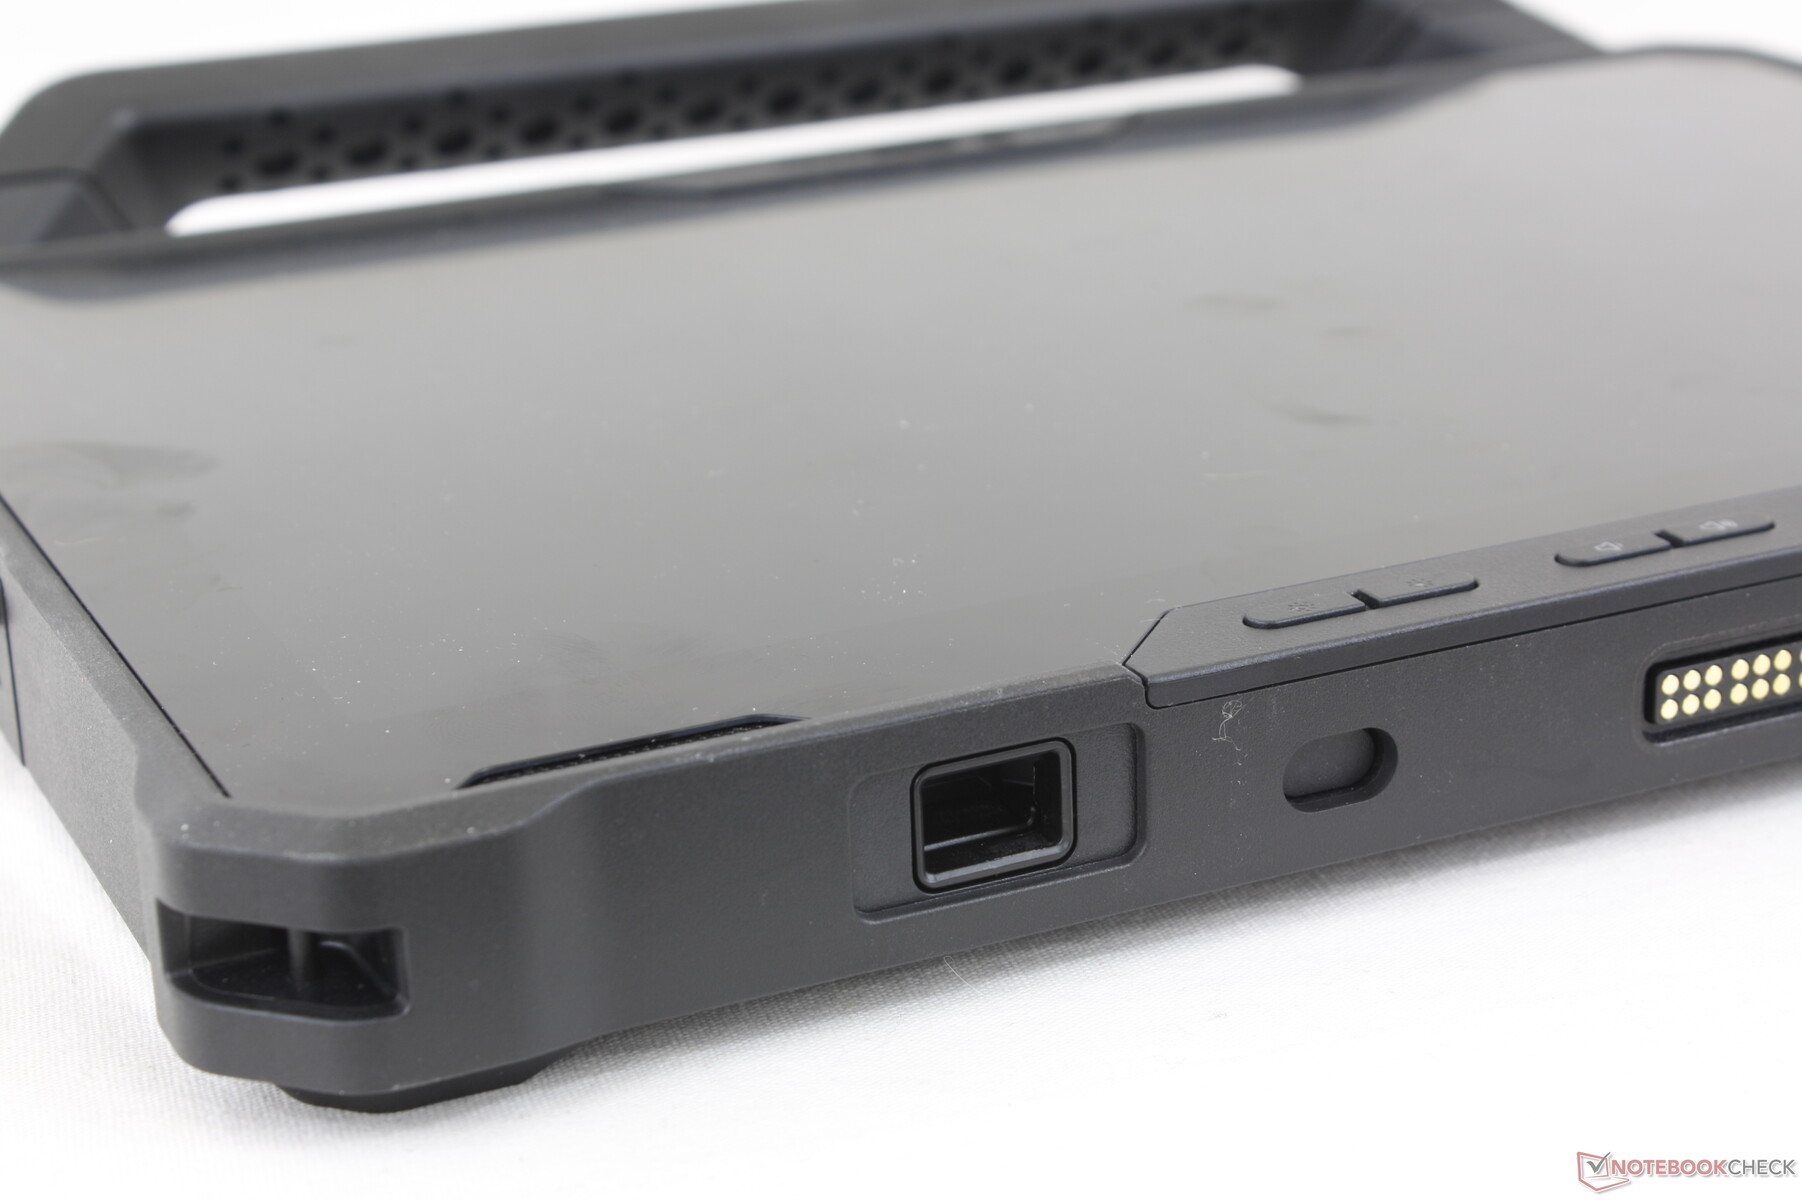

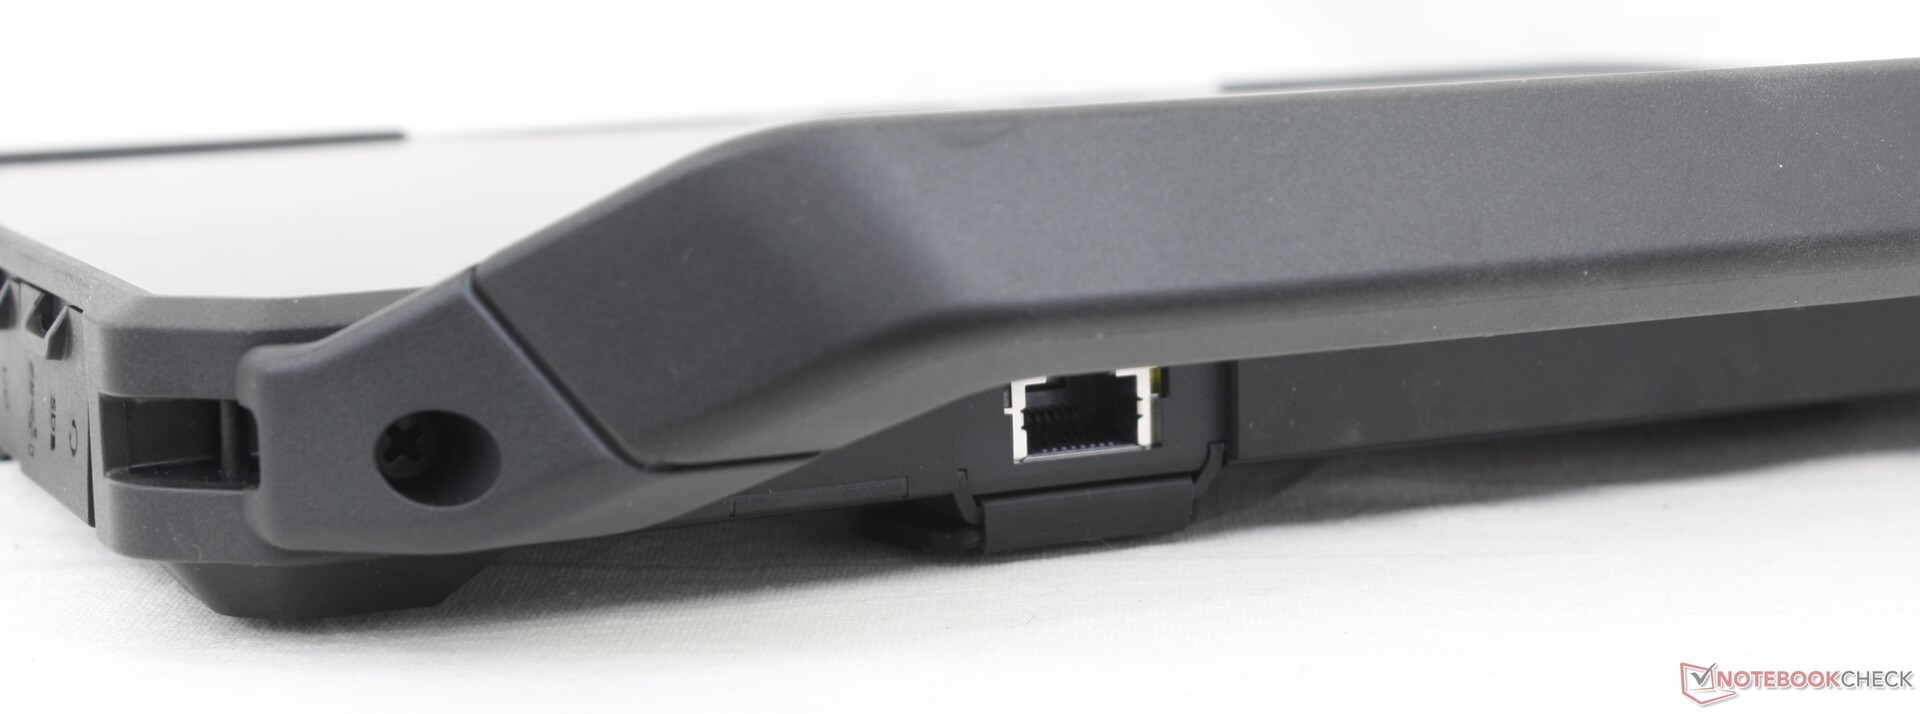
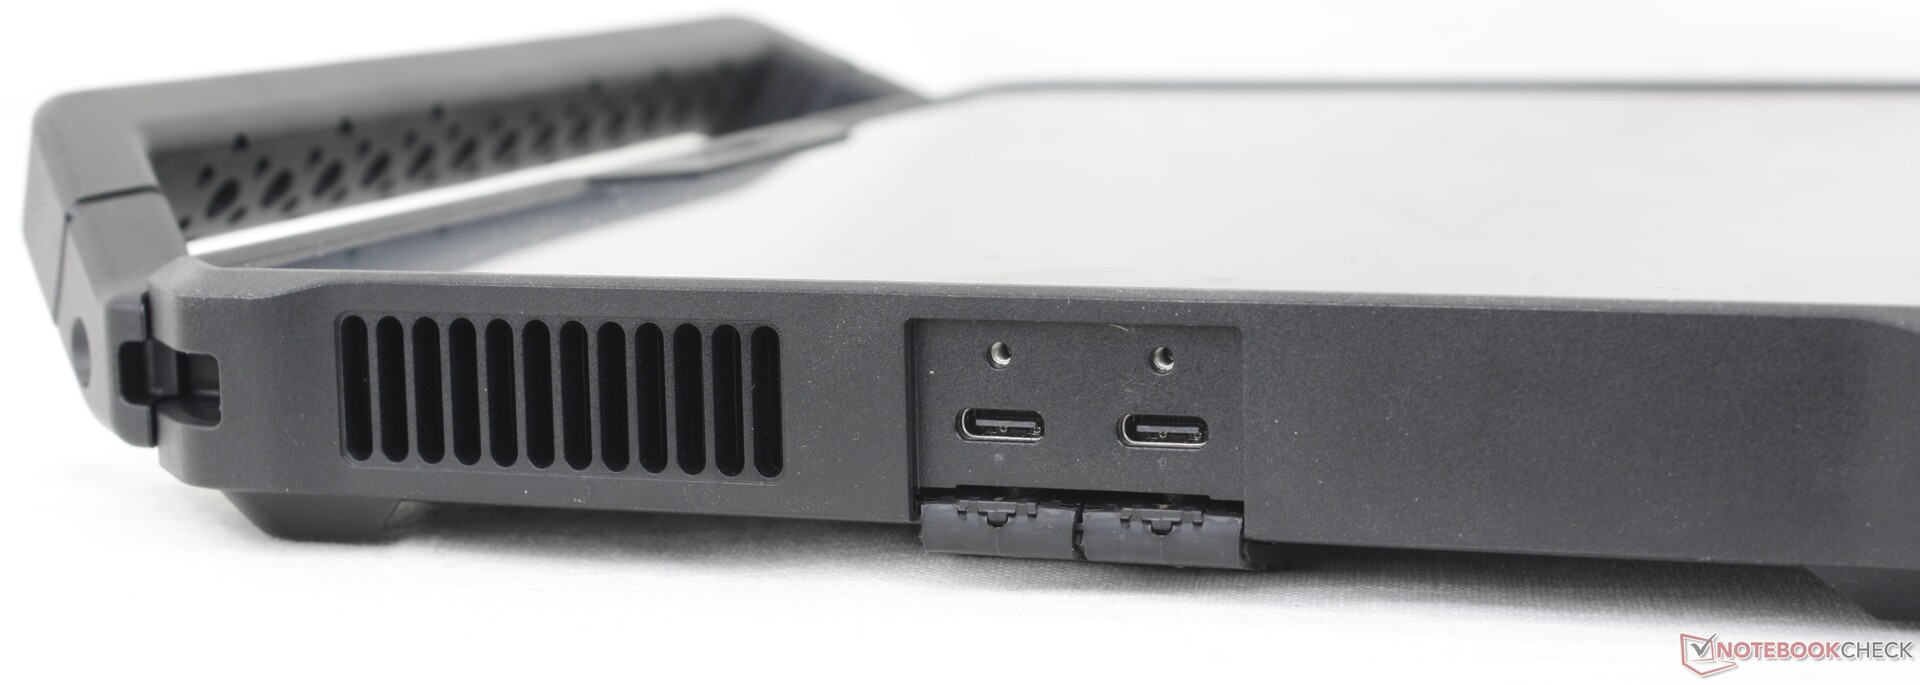
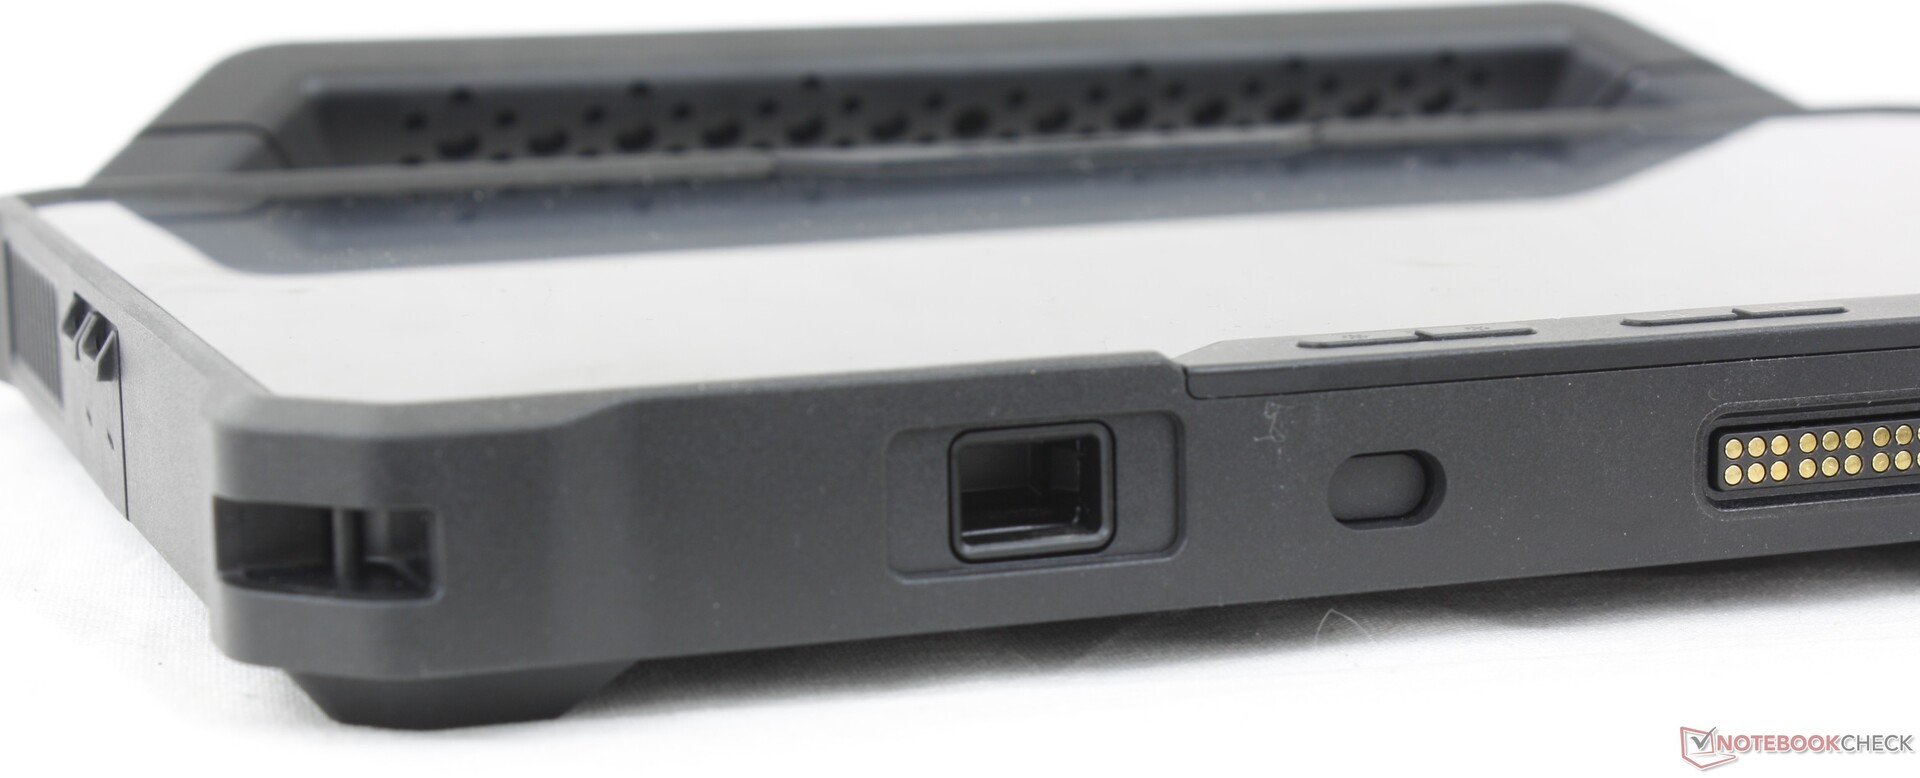
Connectivity — 2x Thunderbolt 4 Support
There is a healthy selection of integrated ports to select from. The two Thunderbolt 4 ports in particular are noteworthy as they allow for the same docking capabilities and external monitor support as modern consumer ultrabooks. Keep in mind that one will always be occupied for charging purposes, however.
Most of the other ports are optional and can be configured at checkout including HDMI 2.0, USB-A, RJ-45, RS-232, or a barcode scanner.
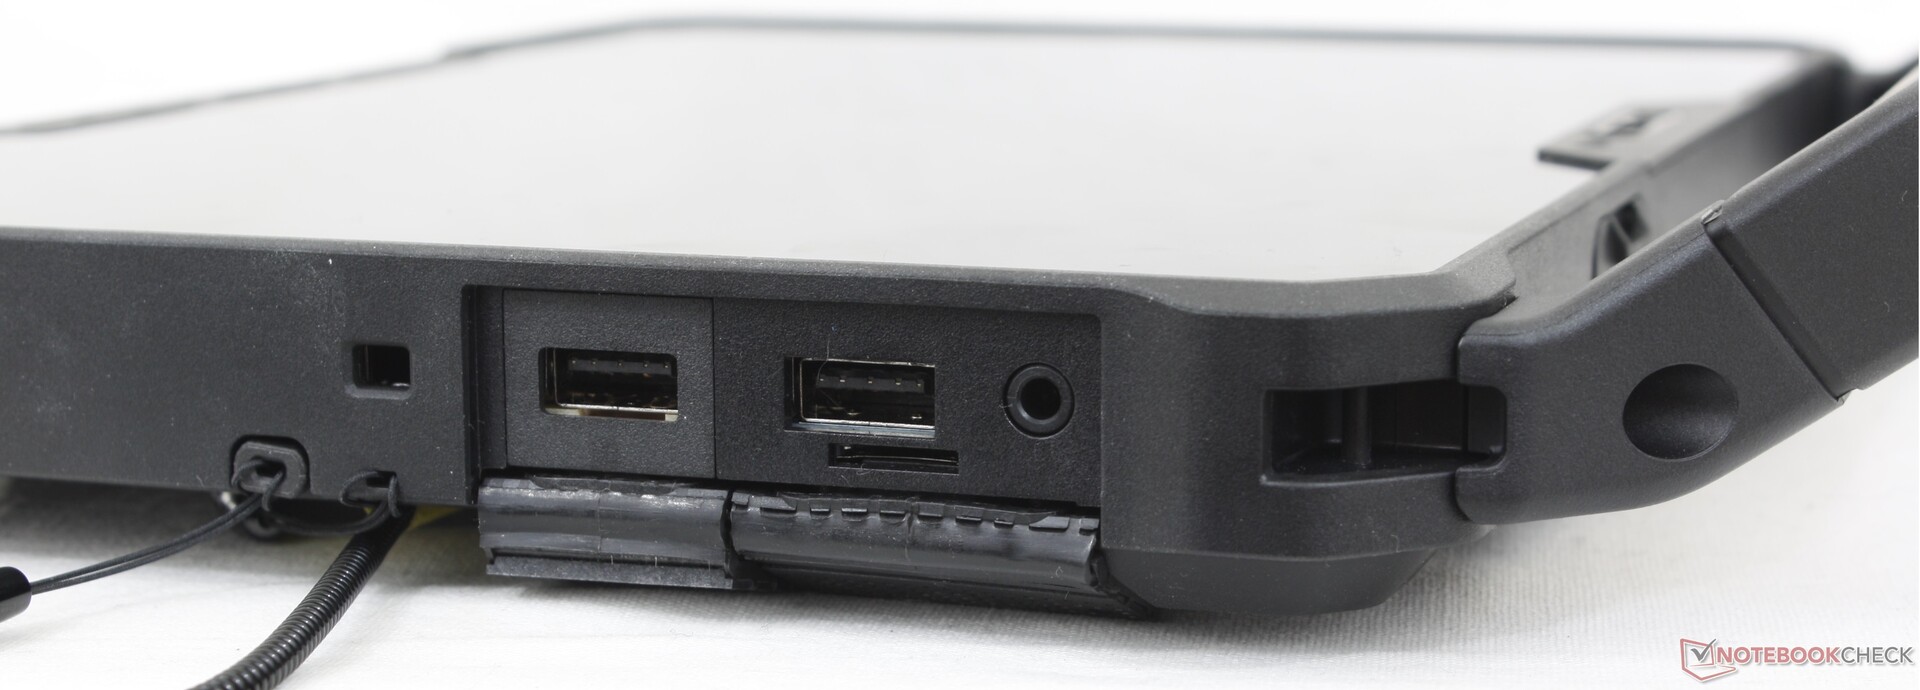
SD Card Reader
| SD Card Reader | |
| average JPG Copy Test (av. of 3 runs) | |
| Dell Latitude 7330 Rugged Extreme (AV Pro V60) | |
| Dell Latitude 7230 Rugged Extreme (AV Pro V60) | |
| Panasonic Toughbook 40 (AV Pro V60) | |
| Acer Enduro Urban N3 EUN314 (AV Pro V60) | |
| Durabook S14I (Angelbird 128GB AV Pro UHS-II) | |
| maximum AS SSD Seq Read Test (1GB) | |
| Dell Latitude 7330 Rugged Extreme (AV Pro V60) | |
| Dell Latitude 7230 Rugged Extreme (AV Pro V60) | |
| Panasonic Toughbook 40 (AV Pro V60) | |
| Durabook S14I (Angelbird 128GB AV Pro UHS-II) | |
| Acer Enduro Urban N3 EUN314 (AV Pro V60) | |
Communication
The Intel AX211 performs reliably when paired to our Wi-Fi 6E-enabled Asus AXE11000 test router. The model can be configured with no Wi-Fi at all, but we recommend choosing carefully as an end-user installation on the Latitude 7230 Rugged Extreme is much more involved than a typical ultrabook.
| Networking | |
| iperf3 transmit AX12 | |
| Acer Enduro Urban N3 EUN314 | |
| Durabook S14I | |
| Dell Latitude 7330 Rugged Extreme | |
| Getac B360 | |
| iperf3 receive AX12 | |
| Durabook S14I | |
| Acer Enduro Urban N3 EUN314 | |
| Getac B360 | |
| Dell Latitude 7330 Rugged Extreme | |
| iperf3 transmit AXE11000 | |
| Panasonic Toughbook 40 | |
| Dell Latitude 7230 Rugged Extreme | |
| iperf3 receive AXE11000 | |
| Panasonic Toughbook 40 | |
| Dell Latitude 7230 Rugged Extreme | |
| iperf3 transmit AXE11000 6GHz | |
| Dell Latitude 7230 Rugged Extreme | |
| iperf3 receive AXE11000 6GHz | |
| Dell Latitude 7230 Rugged Extreme | |
Webcam
The rear 11 MP webcam and even 5 MP front-facing webcam are both sharper than anything you'd find on a consumer clamshell laptop. Each webcam has its own physical privacy slider while the rear webcam has a built-in flash.
Windows Hello is supported with the front-facing webcam.


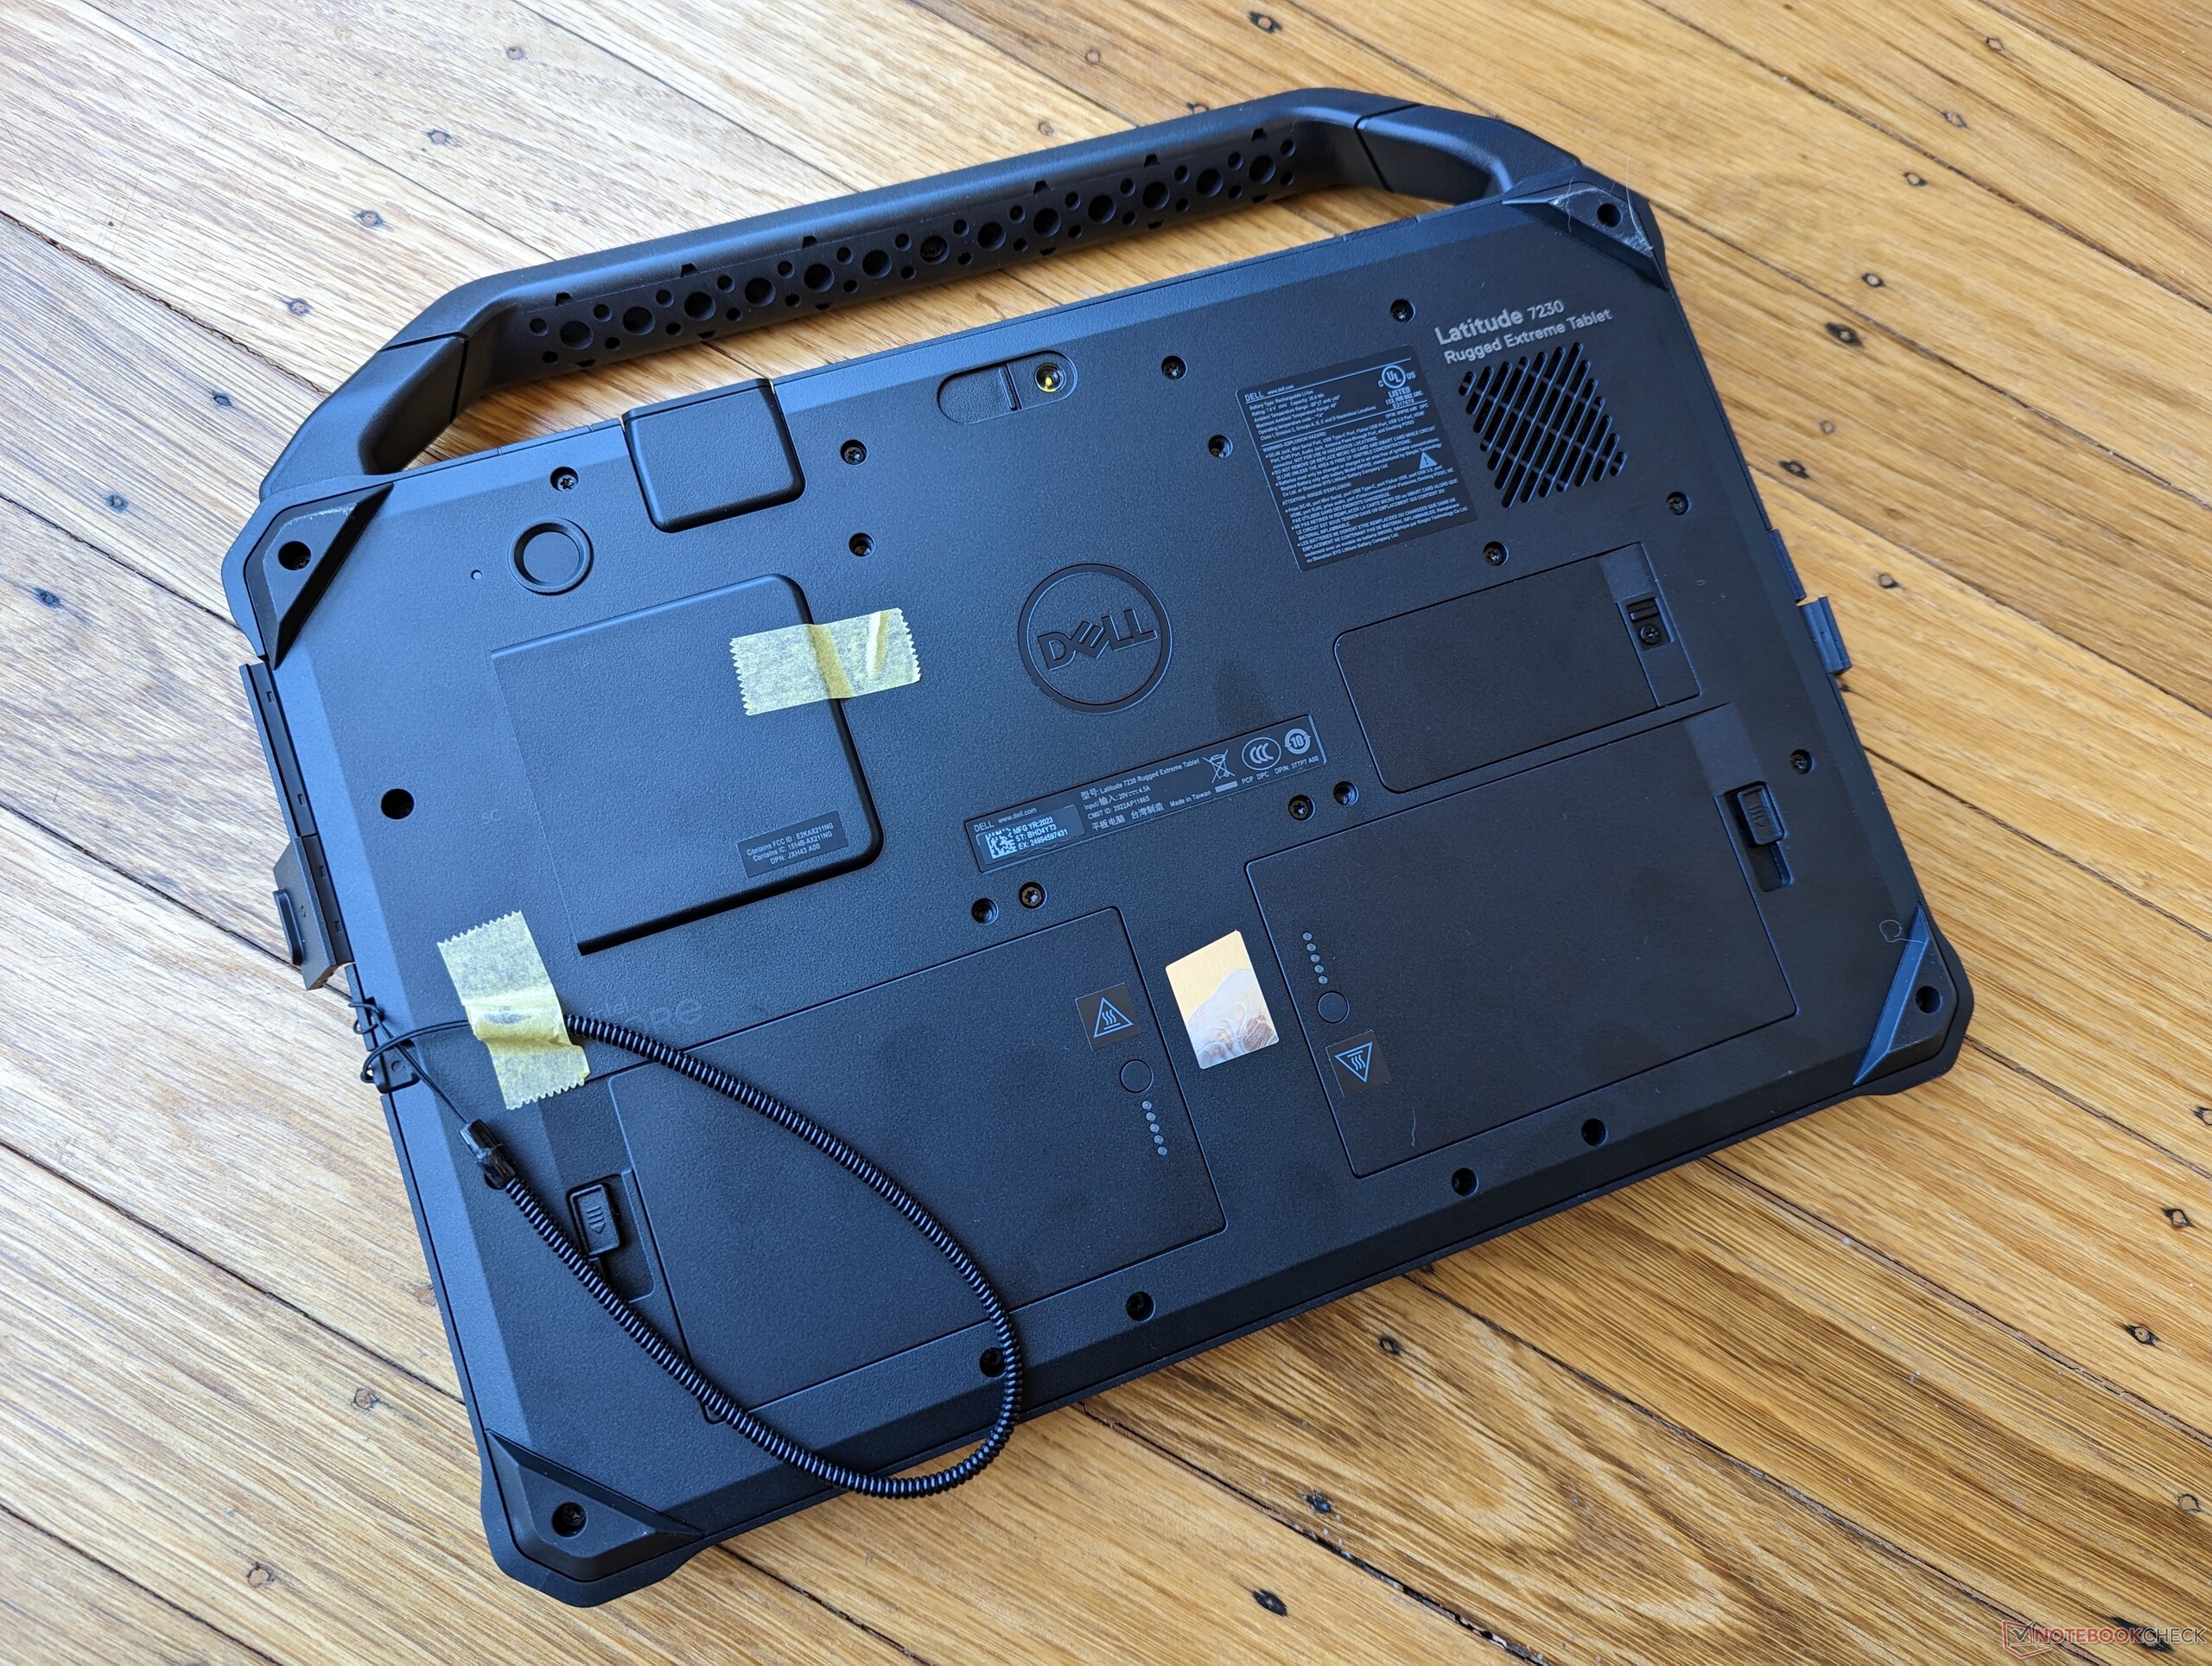
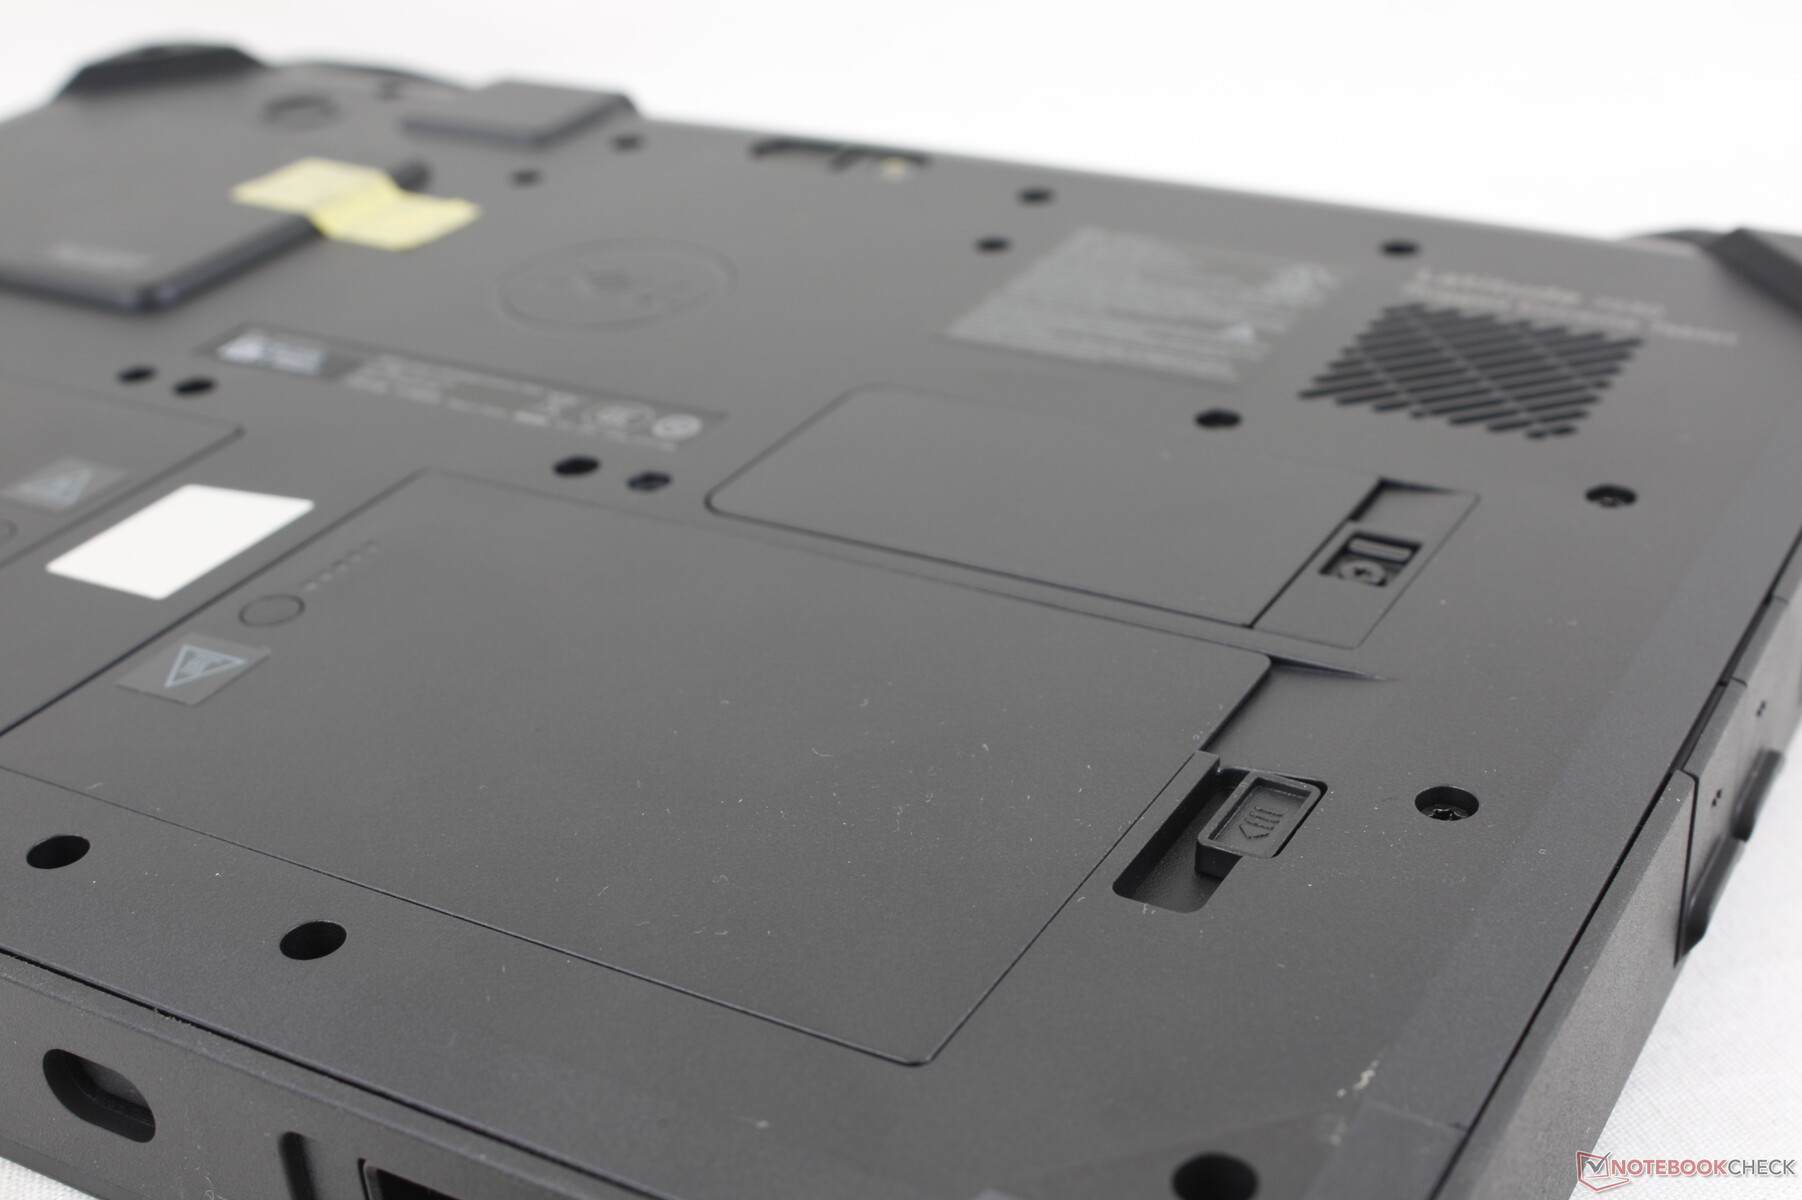
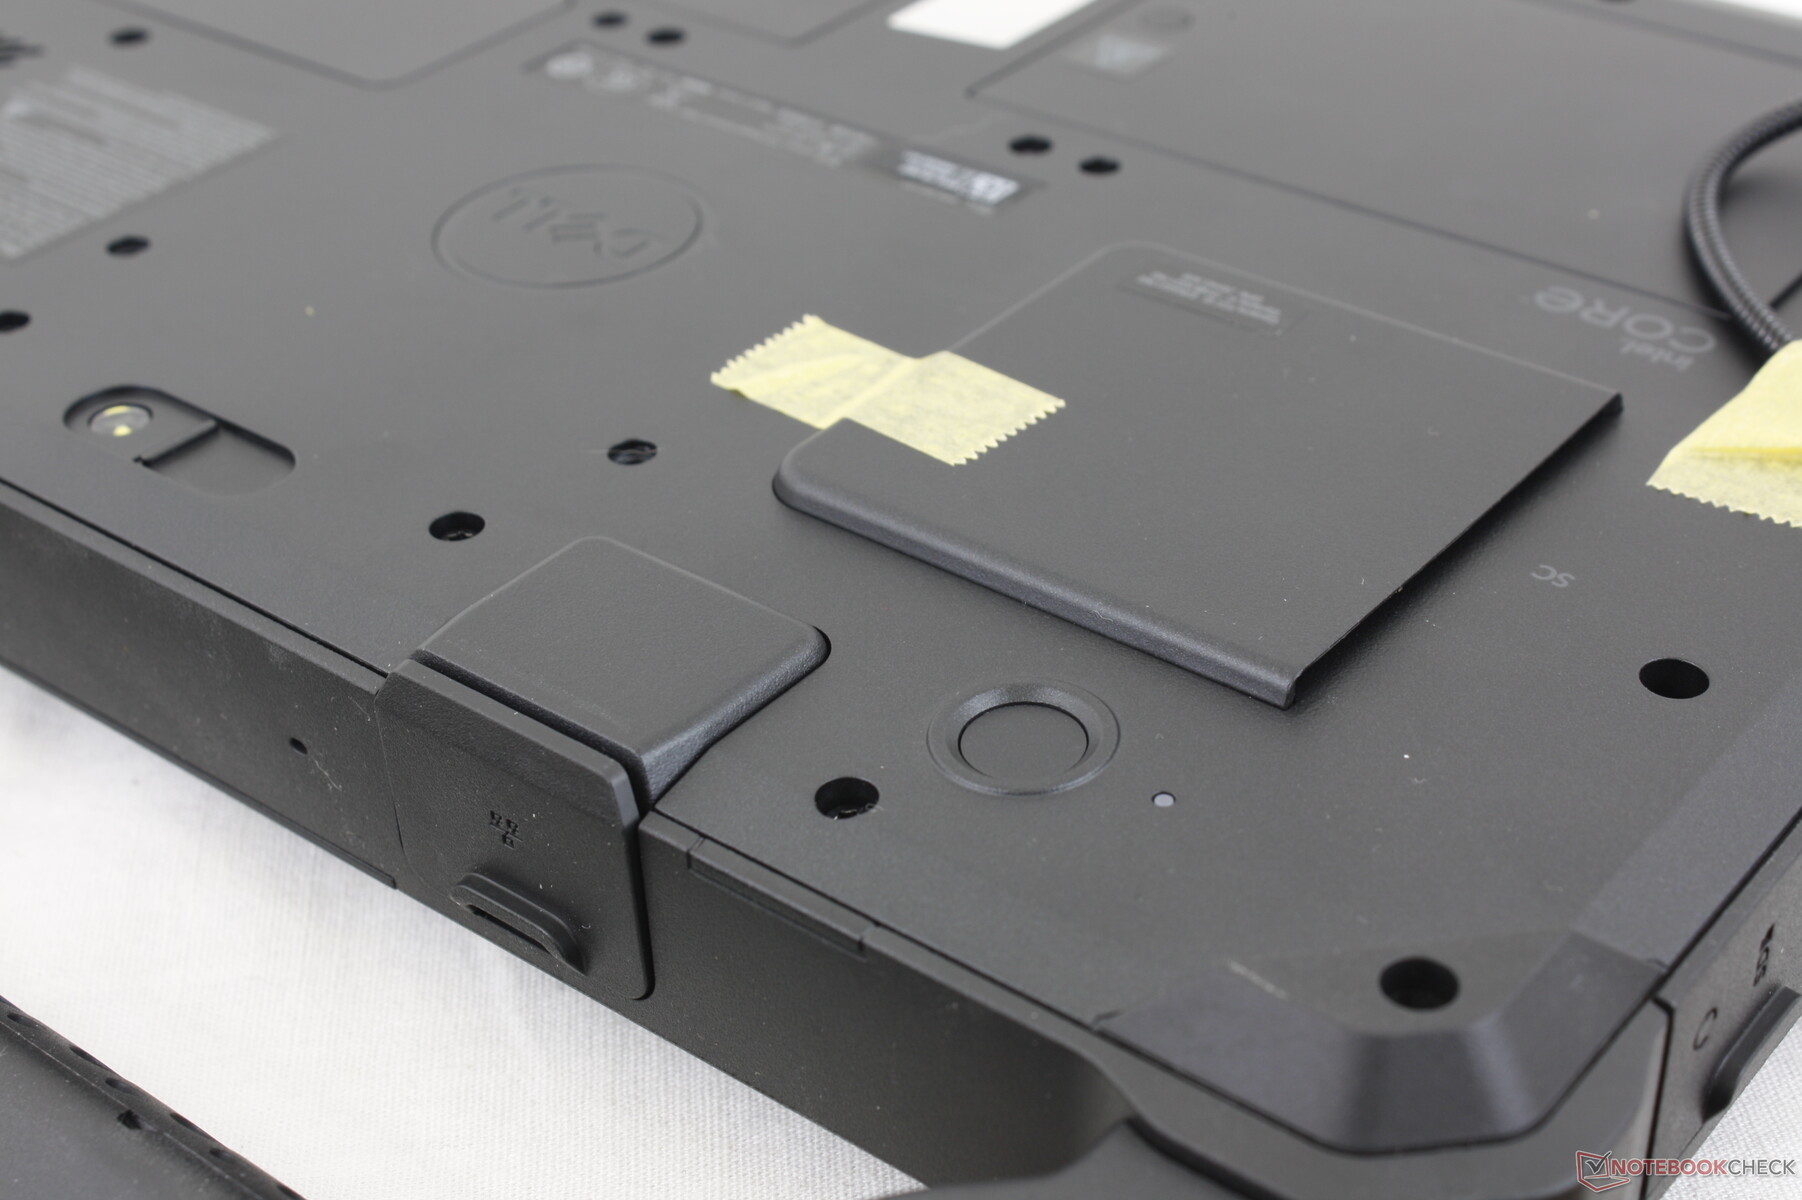
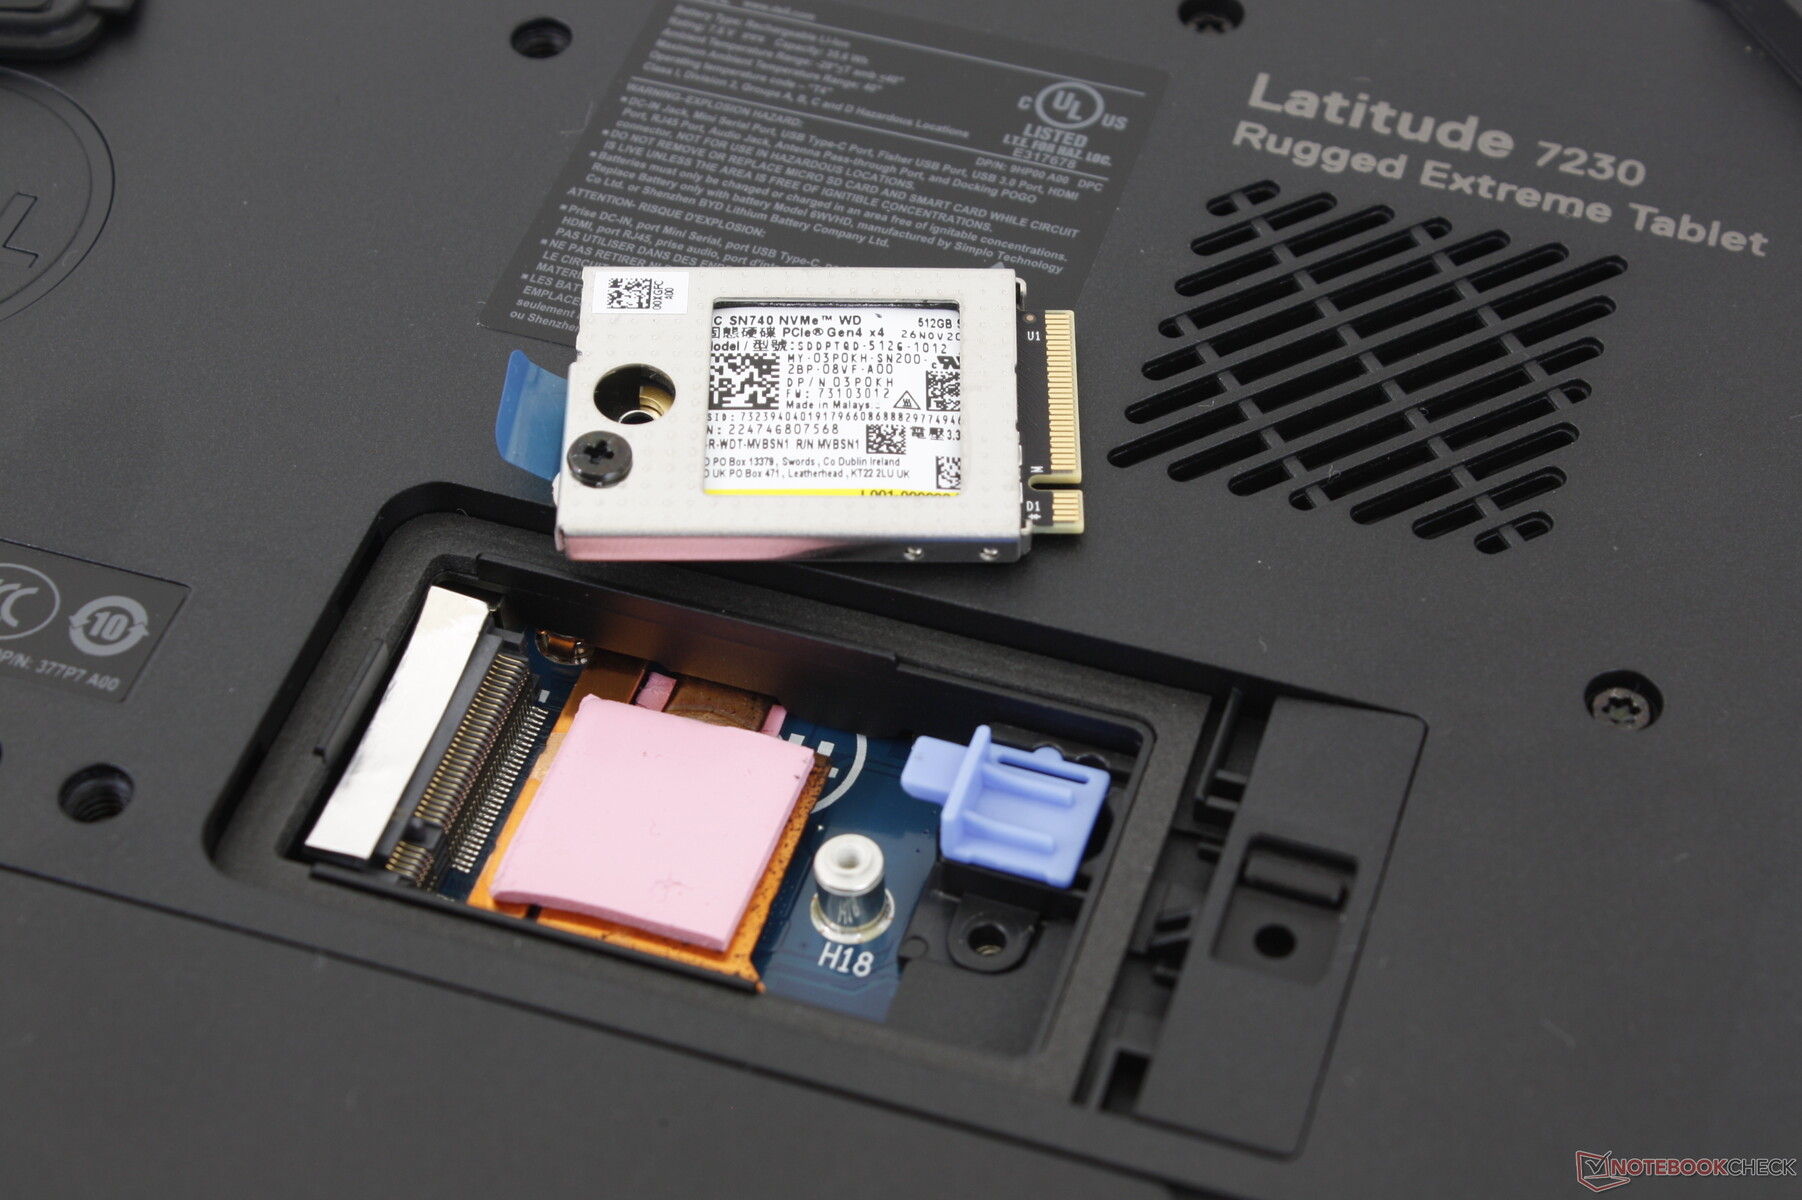
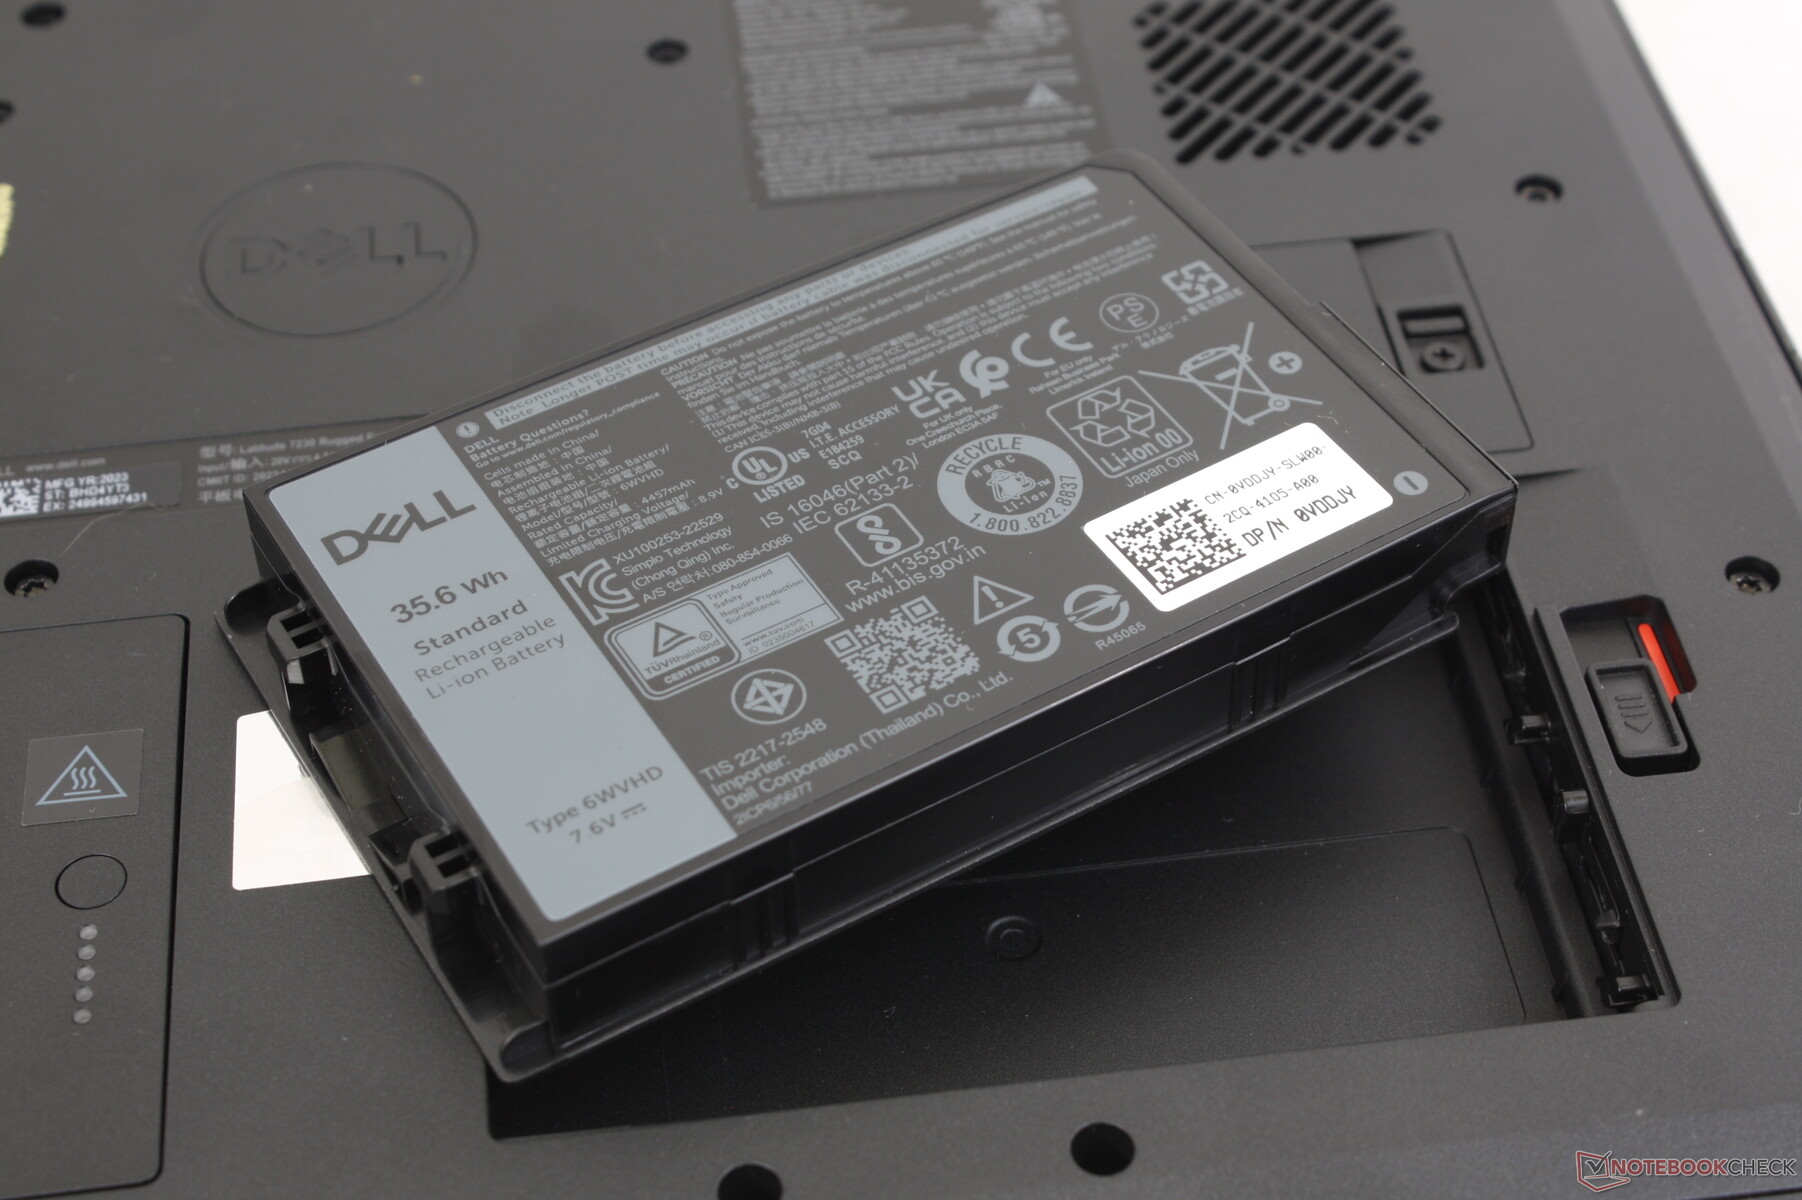
Maintenance
The back panel is secured by no less than two dozen Torx screws. Thankfully, the two batteries and single M.2 SSD slot are more easily accessible. RAM is soldered and only configurable at checkout.
An official service manual is available directly from Dell if further disassembly is required.
Accessories and Warranty
Optional accessories include the premium keyboard, hand strap, active pen, and many others. The retail box includes a passive pen and a rigid carrying handle already attached. A three-year limited warranty applies if purchased in the US.
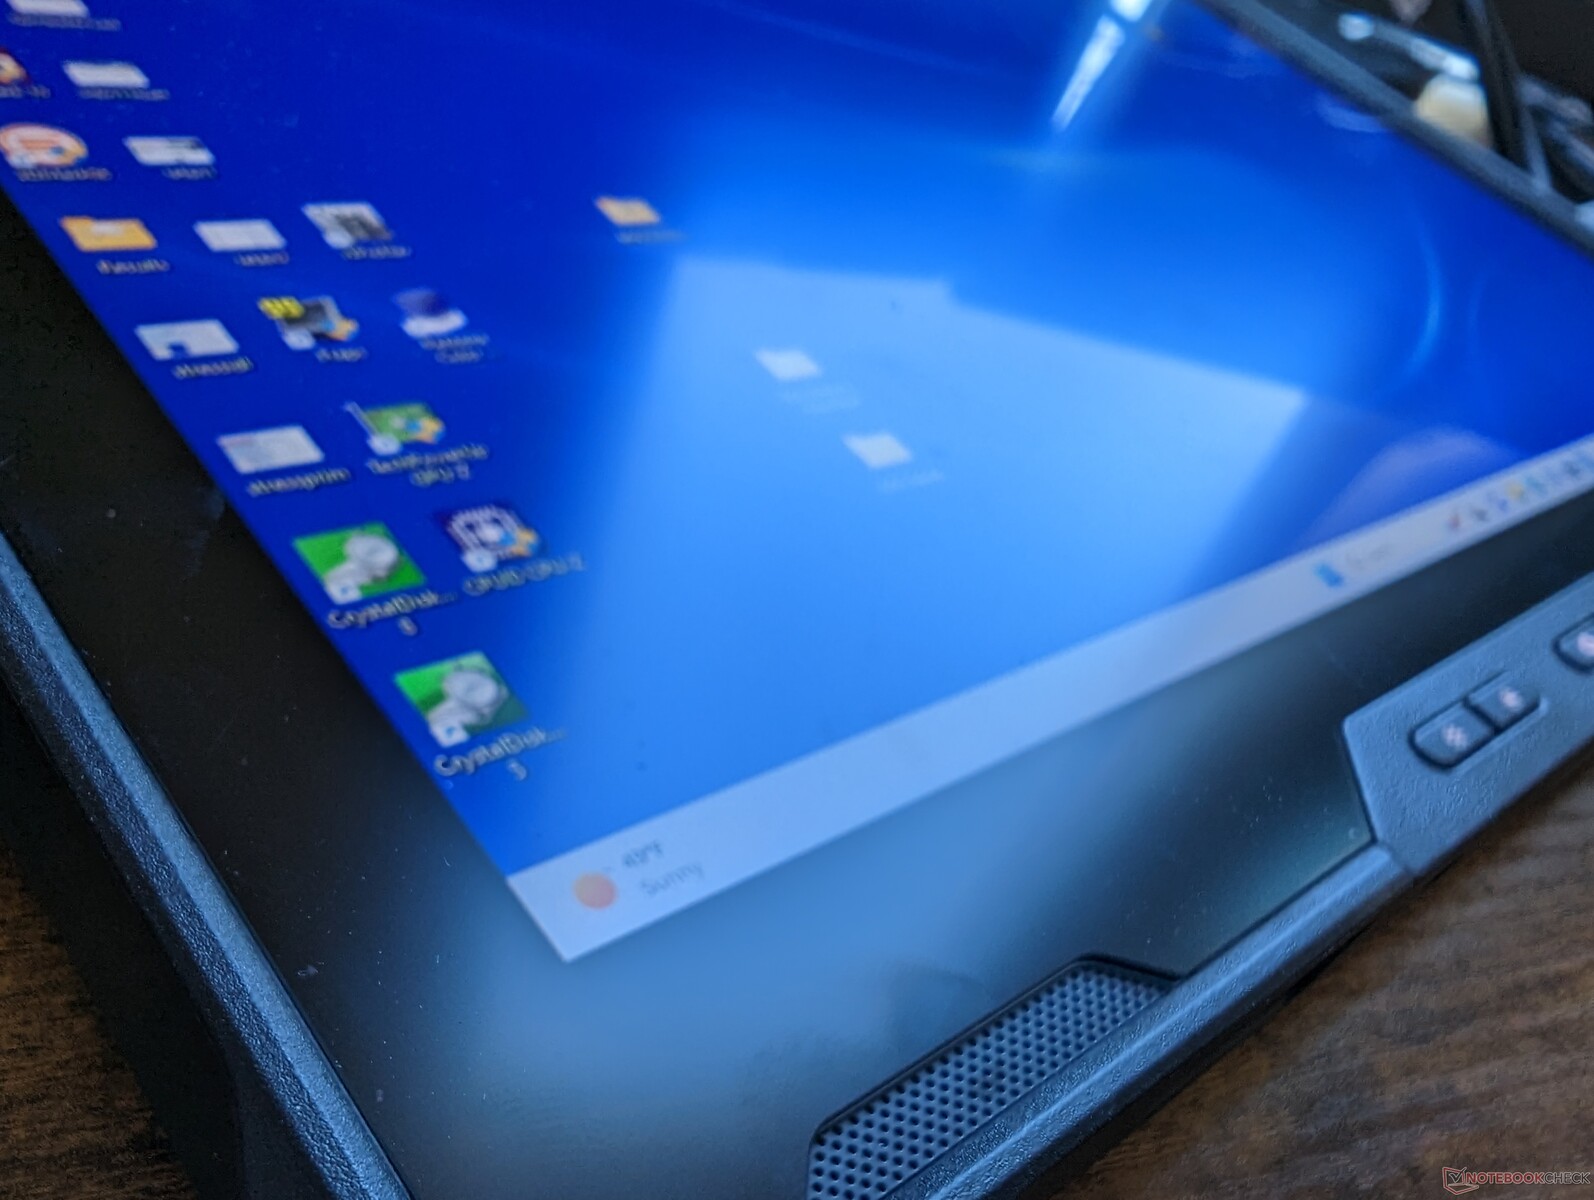
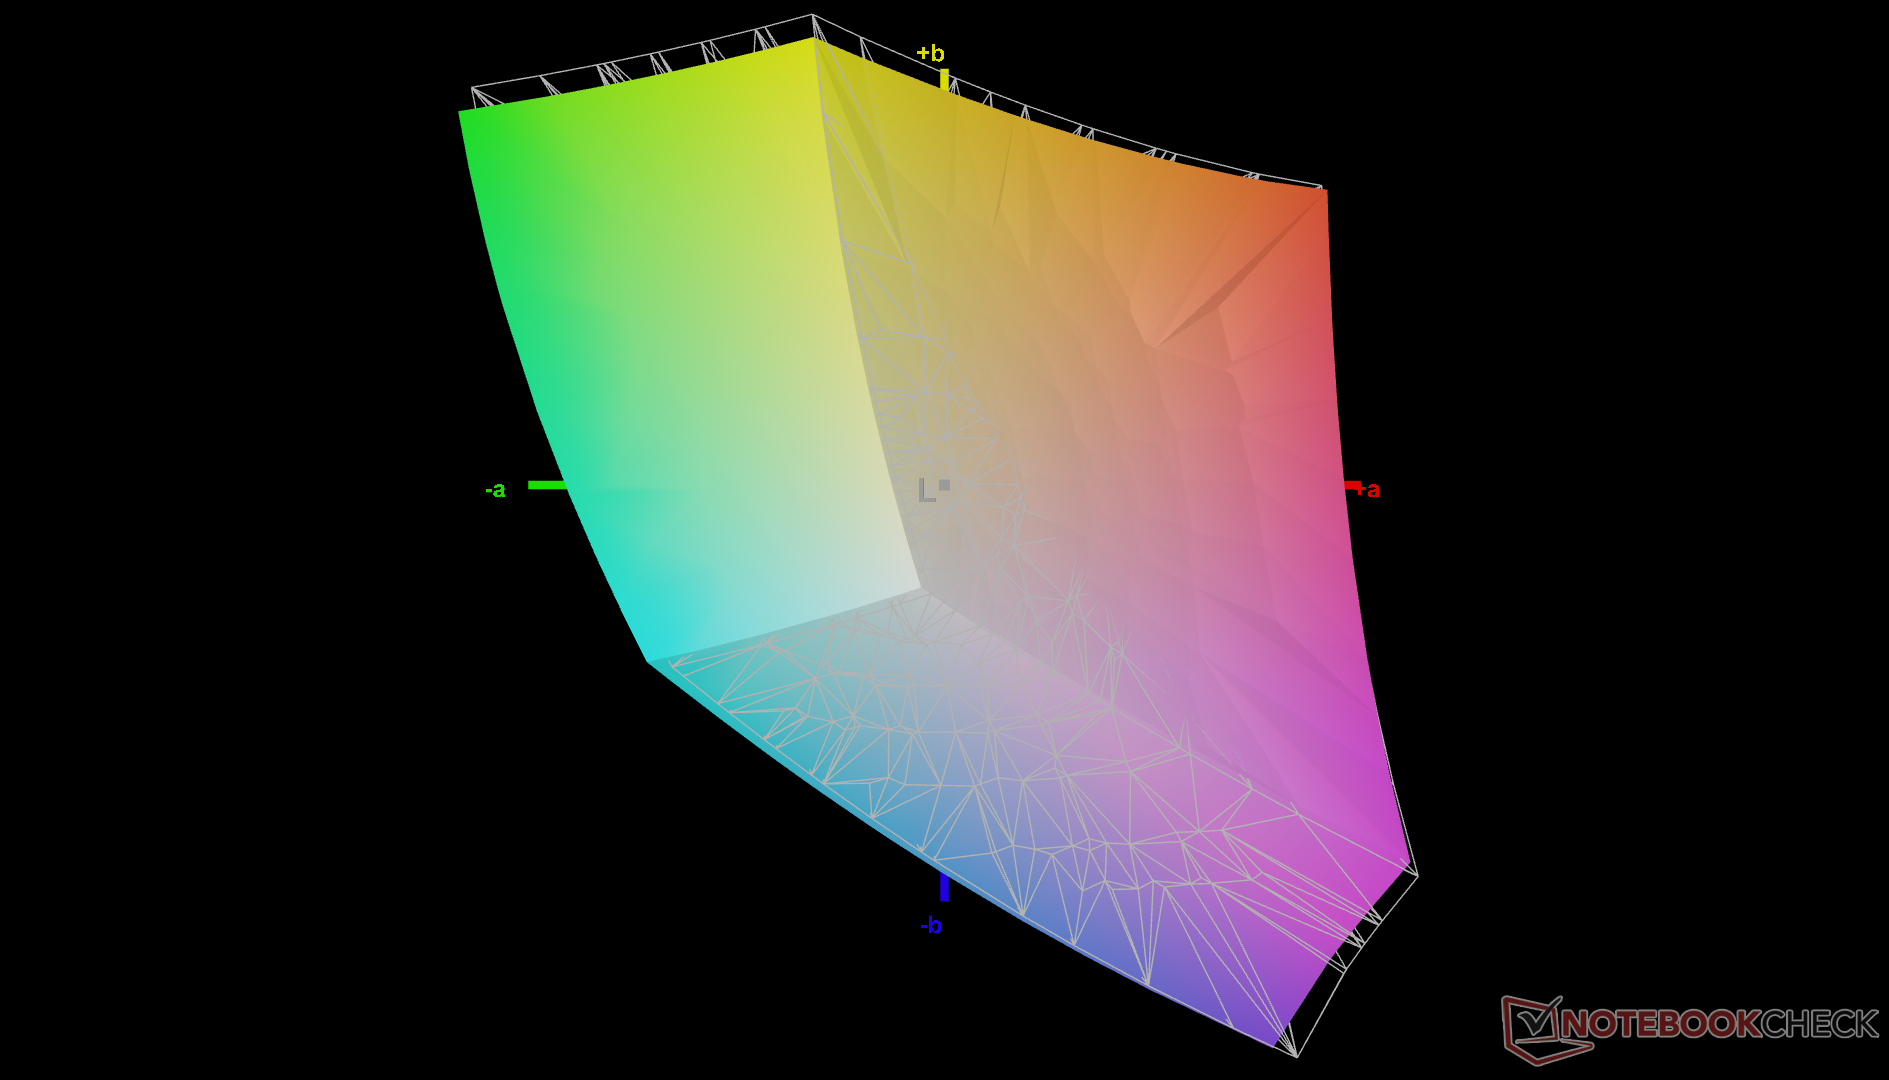
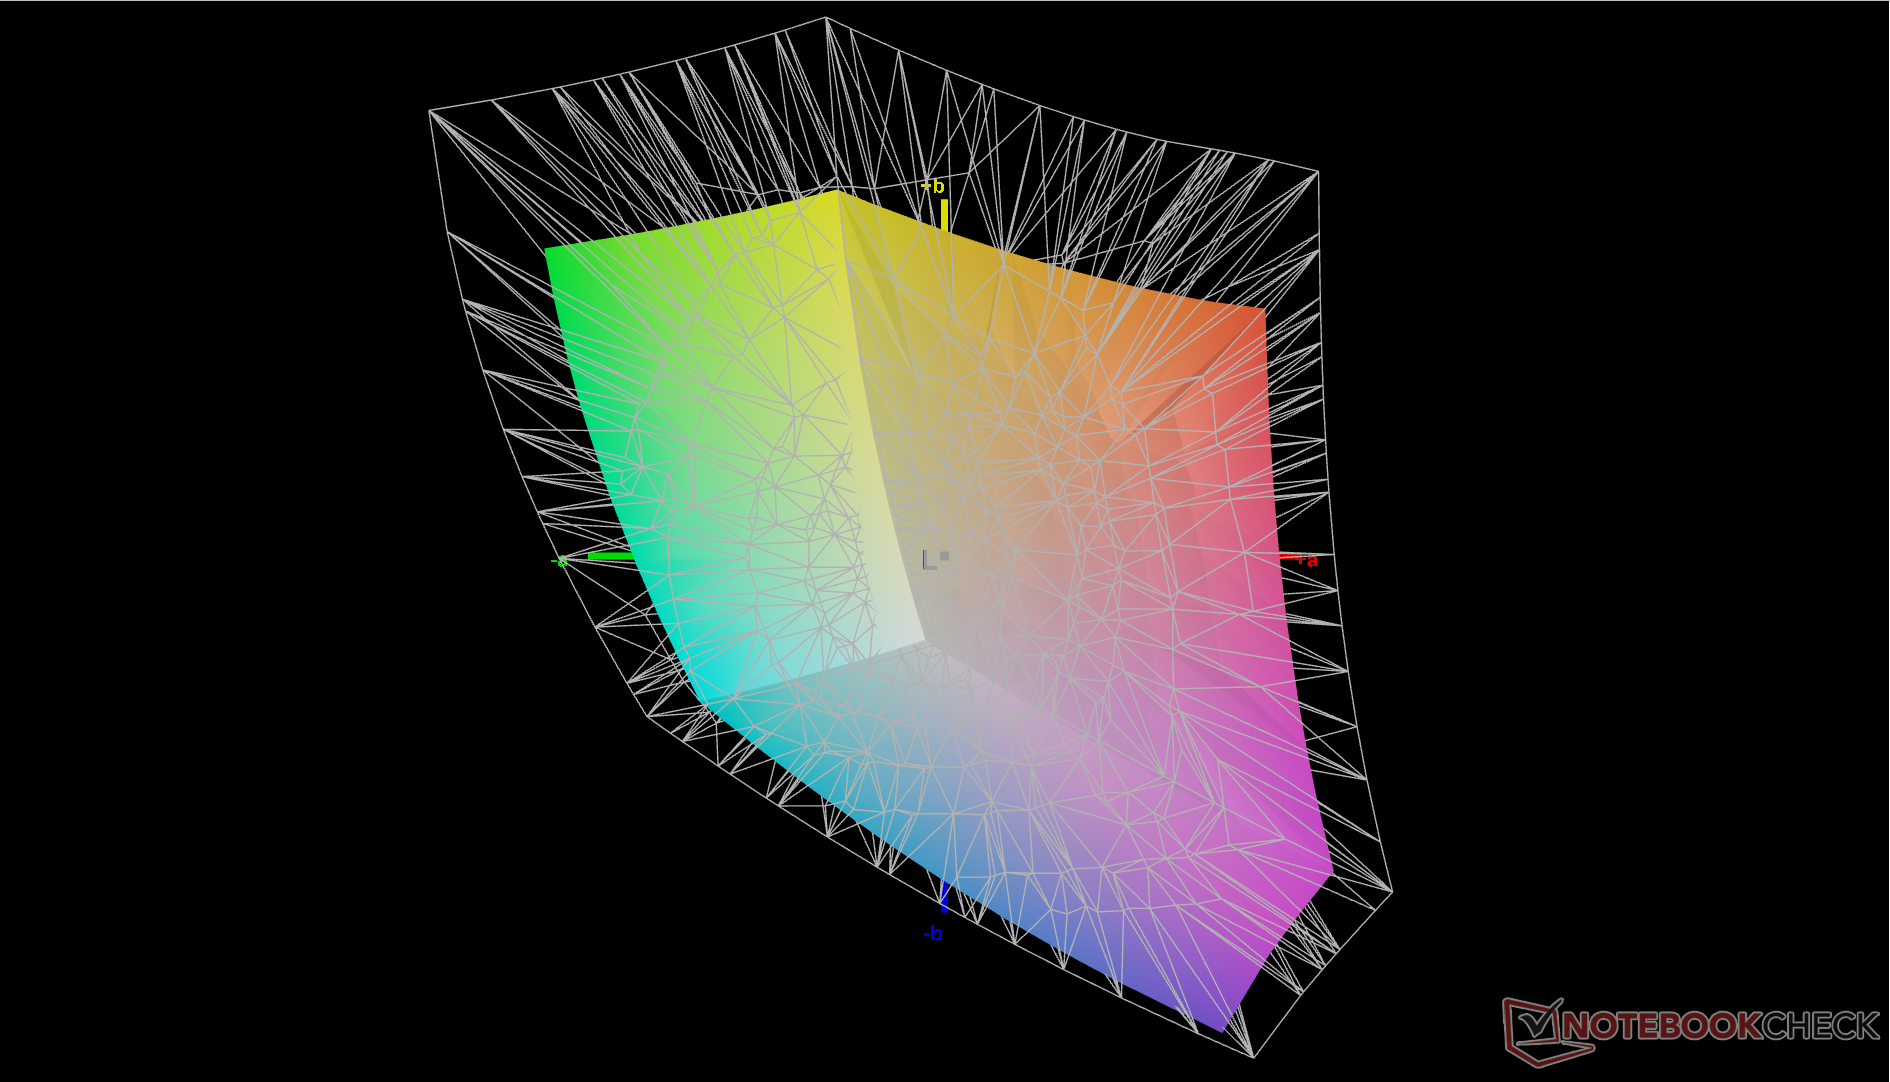
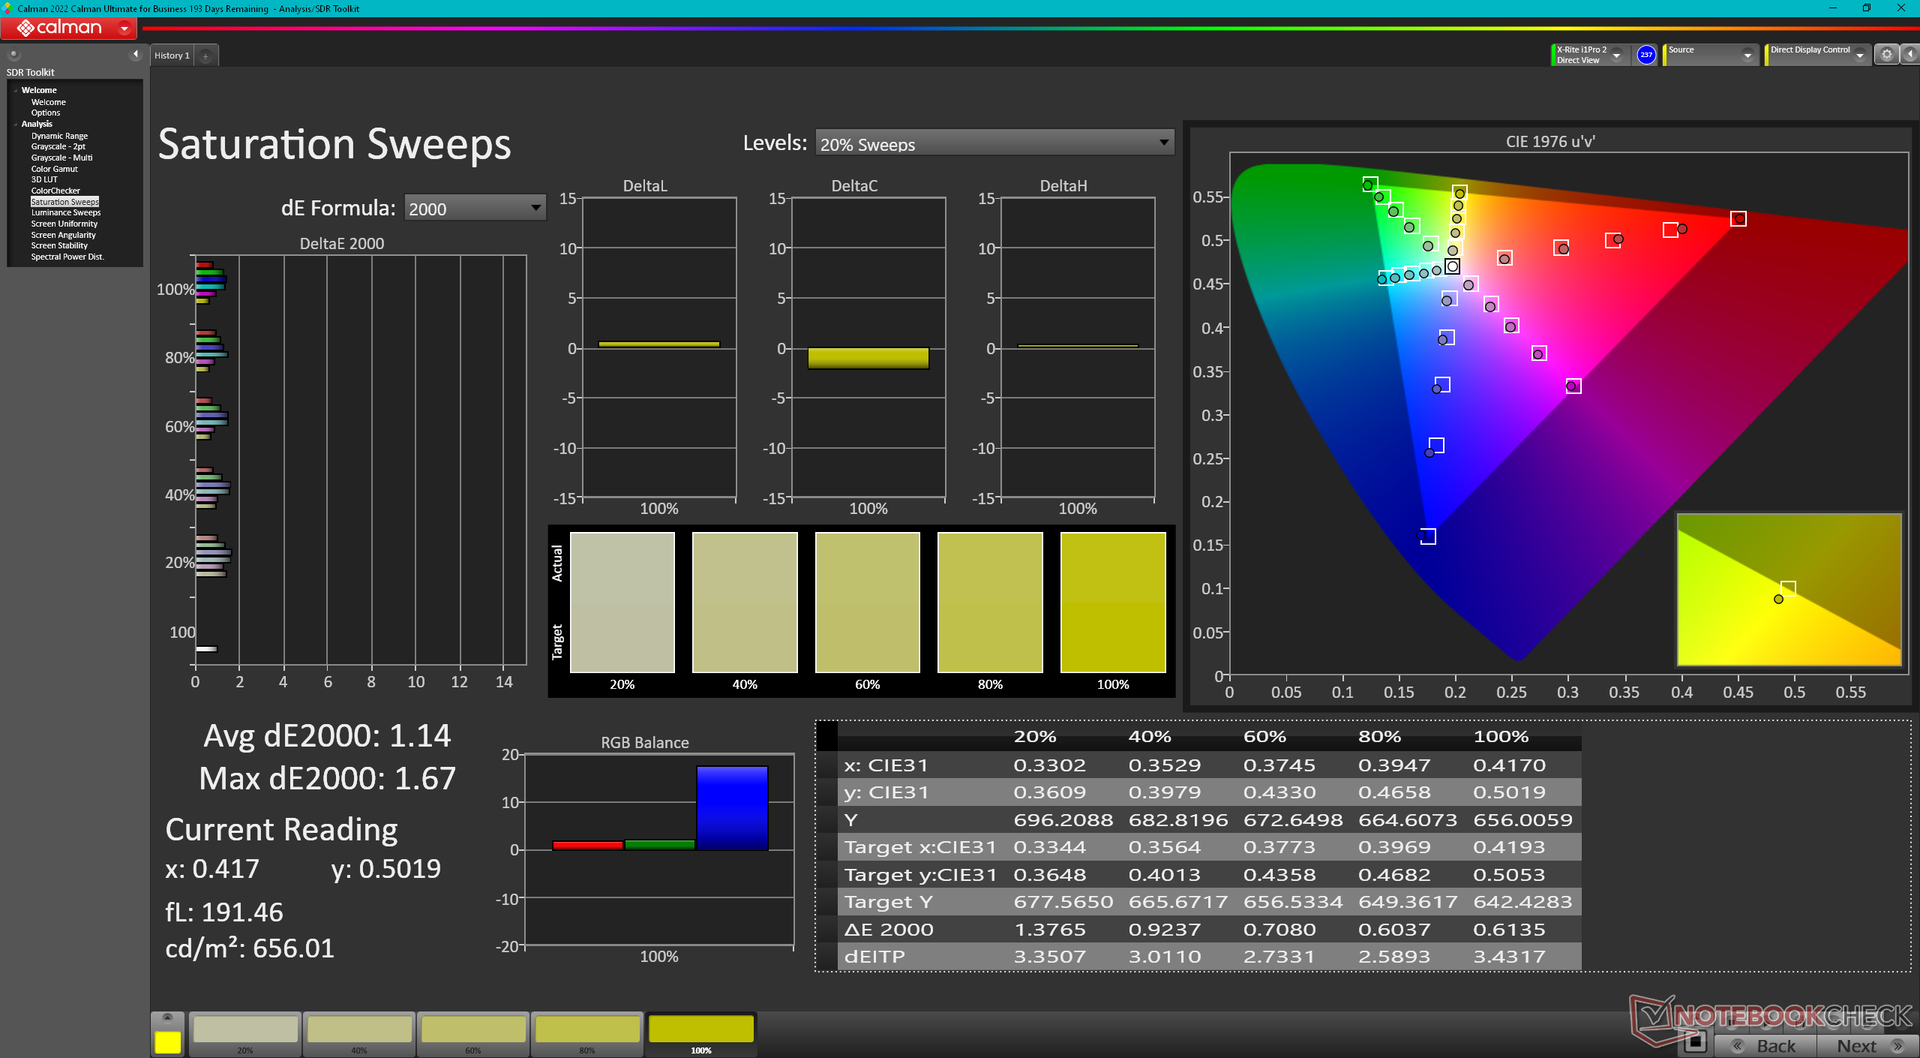
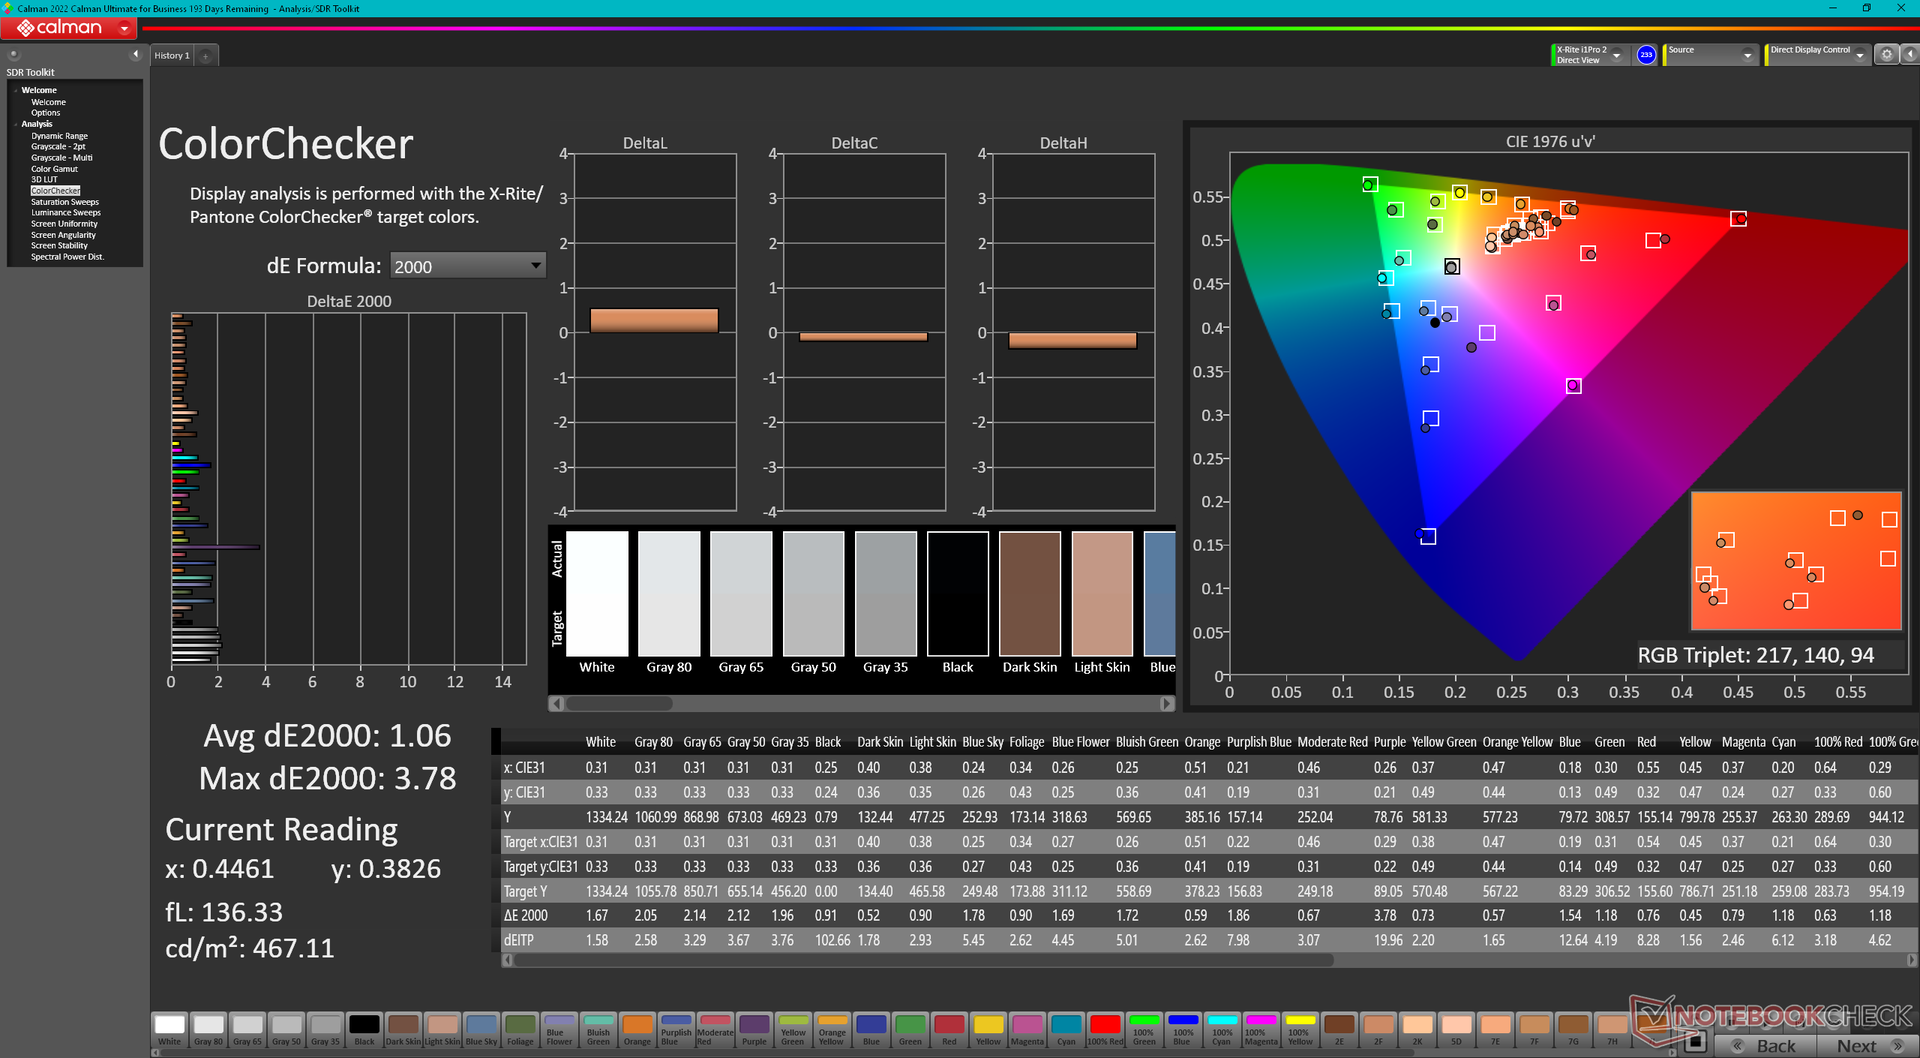
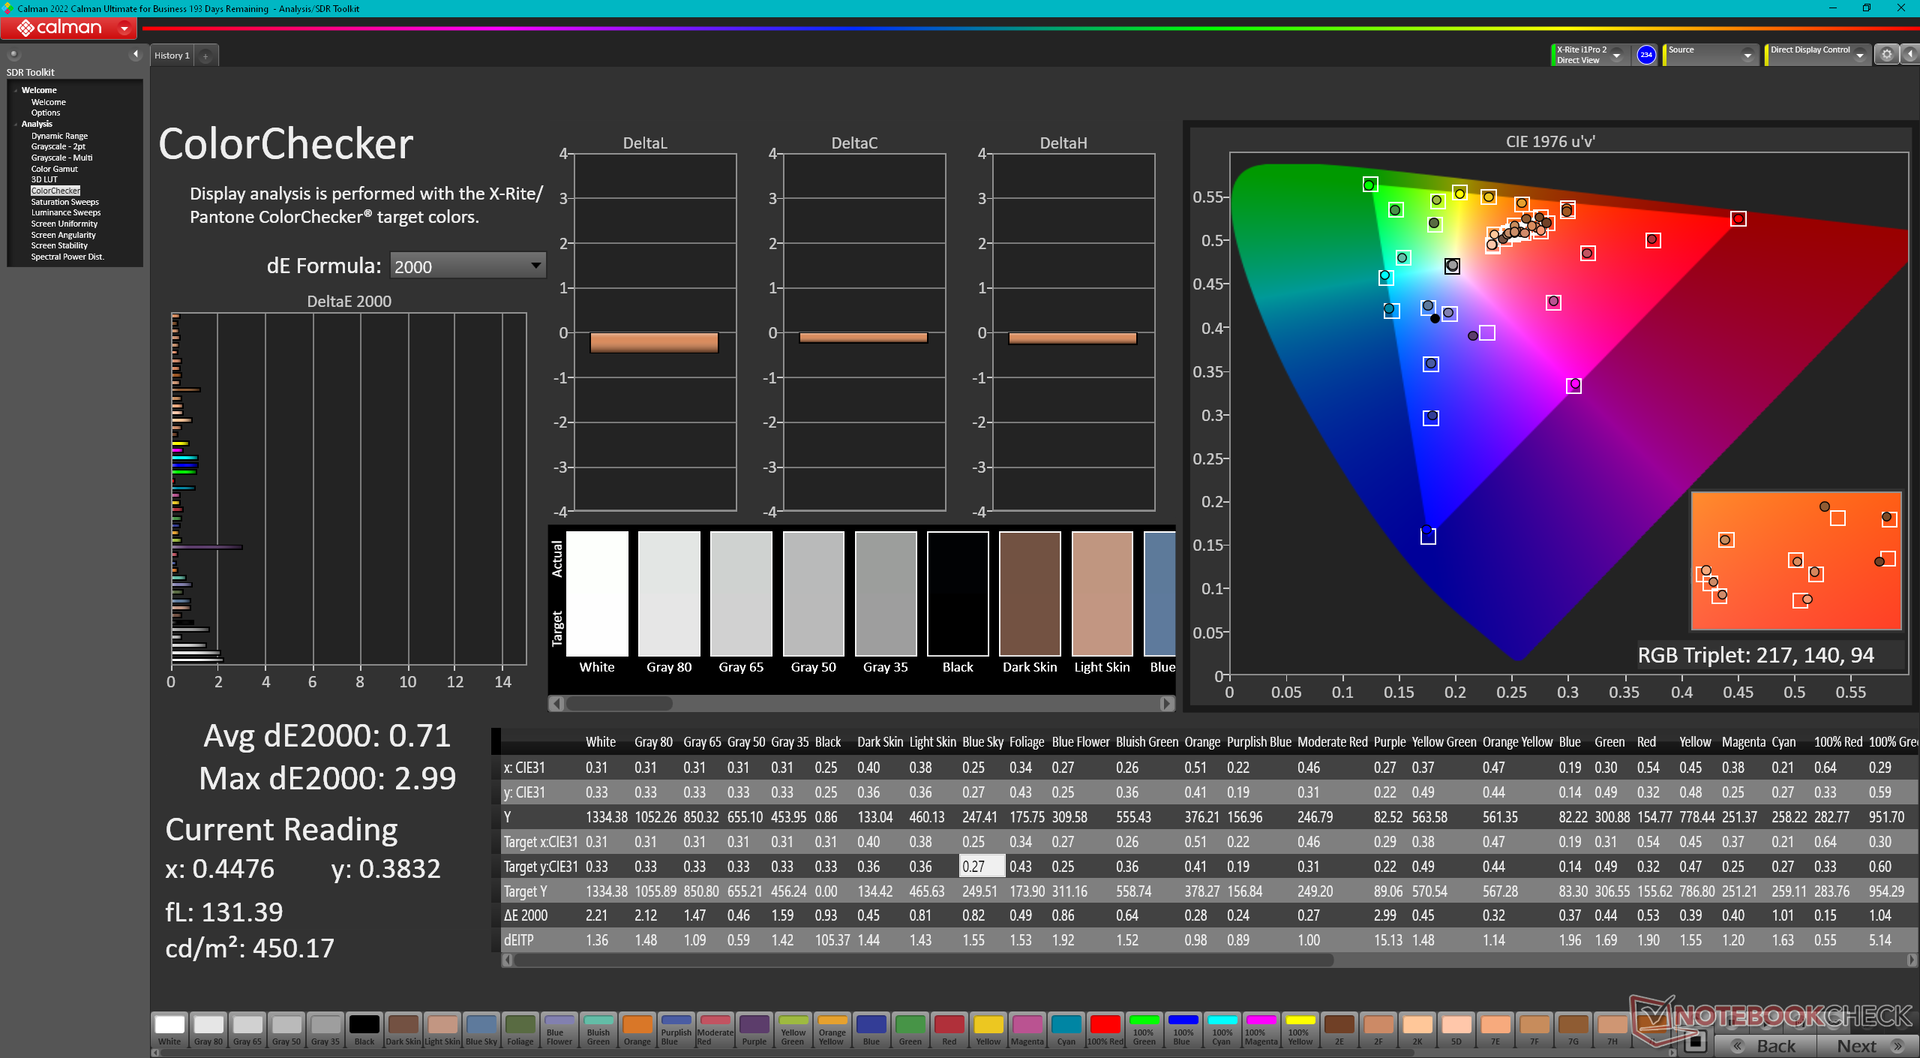
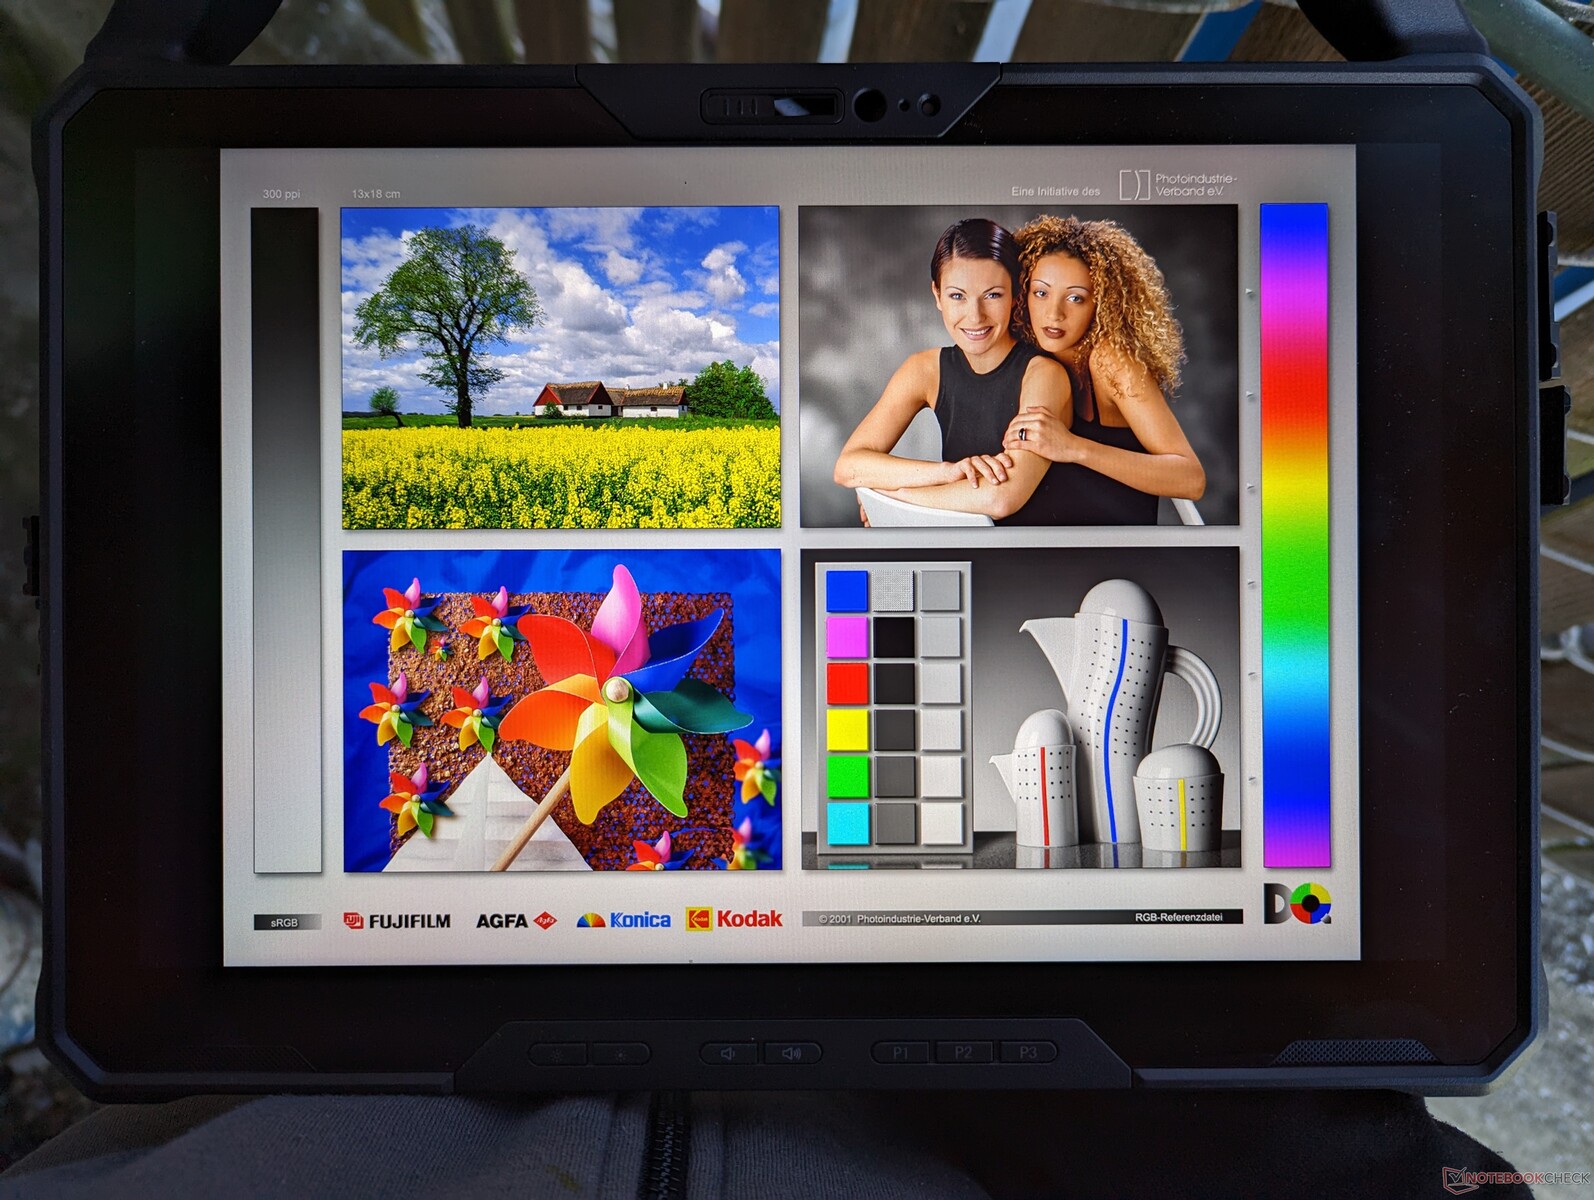
Display — 1200 Nits And Full sRGB Coverage
The Latitude 7230 Rugged is one of the few devices in its category and size to offer >95 percent sRGB for more accurate and vibrant colors. Black-white and gray-gray response times are also reasonably fast for less noticeable ghosting. There is no pulse-width modulation for brightness control as well meaning you can use the tablet at very low brightness levels without eyestrain or noticeable flickering. This is one of the best displays we've seen on a rugged tablet.
The biggest drawback to the display is its graininess despite the excellent colors and bright backlight. When compared to the sharper screens on consumer tablets or laptops, the touchscreen on the Latitude 7230 Rugged is under thicker layers of glass and protection which ultimately impacts image quality. For the target audience, however, super-crisp pictures are usually not a priority.


| |||||||||||||||||||||||||
Brightness Distribution: 82 %
Center on Battery: 1326.7 cd/m²
Contrast: 1561:1 (Black: 0.85 cd/m²)
ΔE ColorChecker Calman: 1.06 | ∀{0.5-29.43 Ø4.71}
calibrated: 0.71
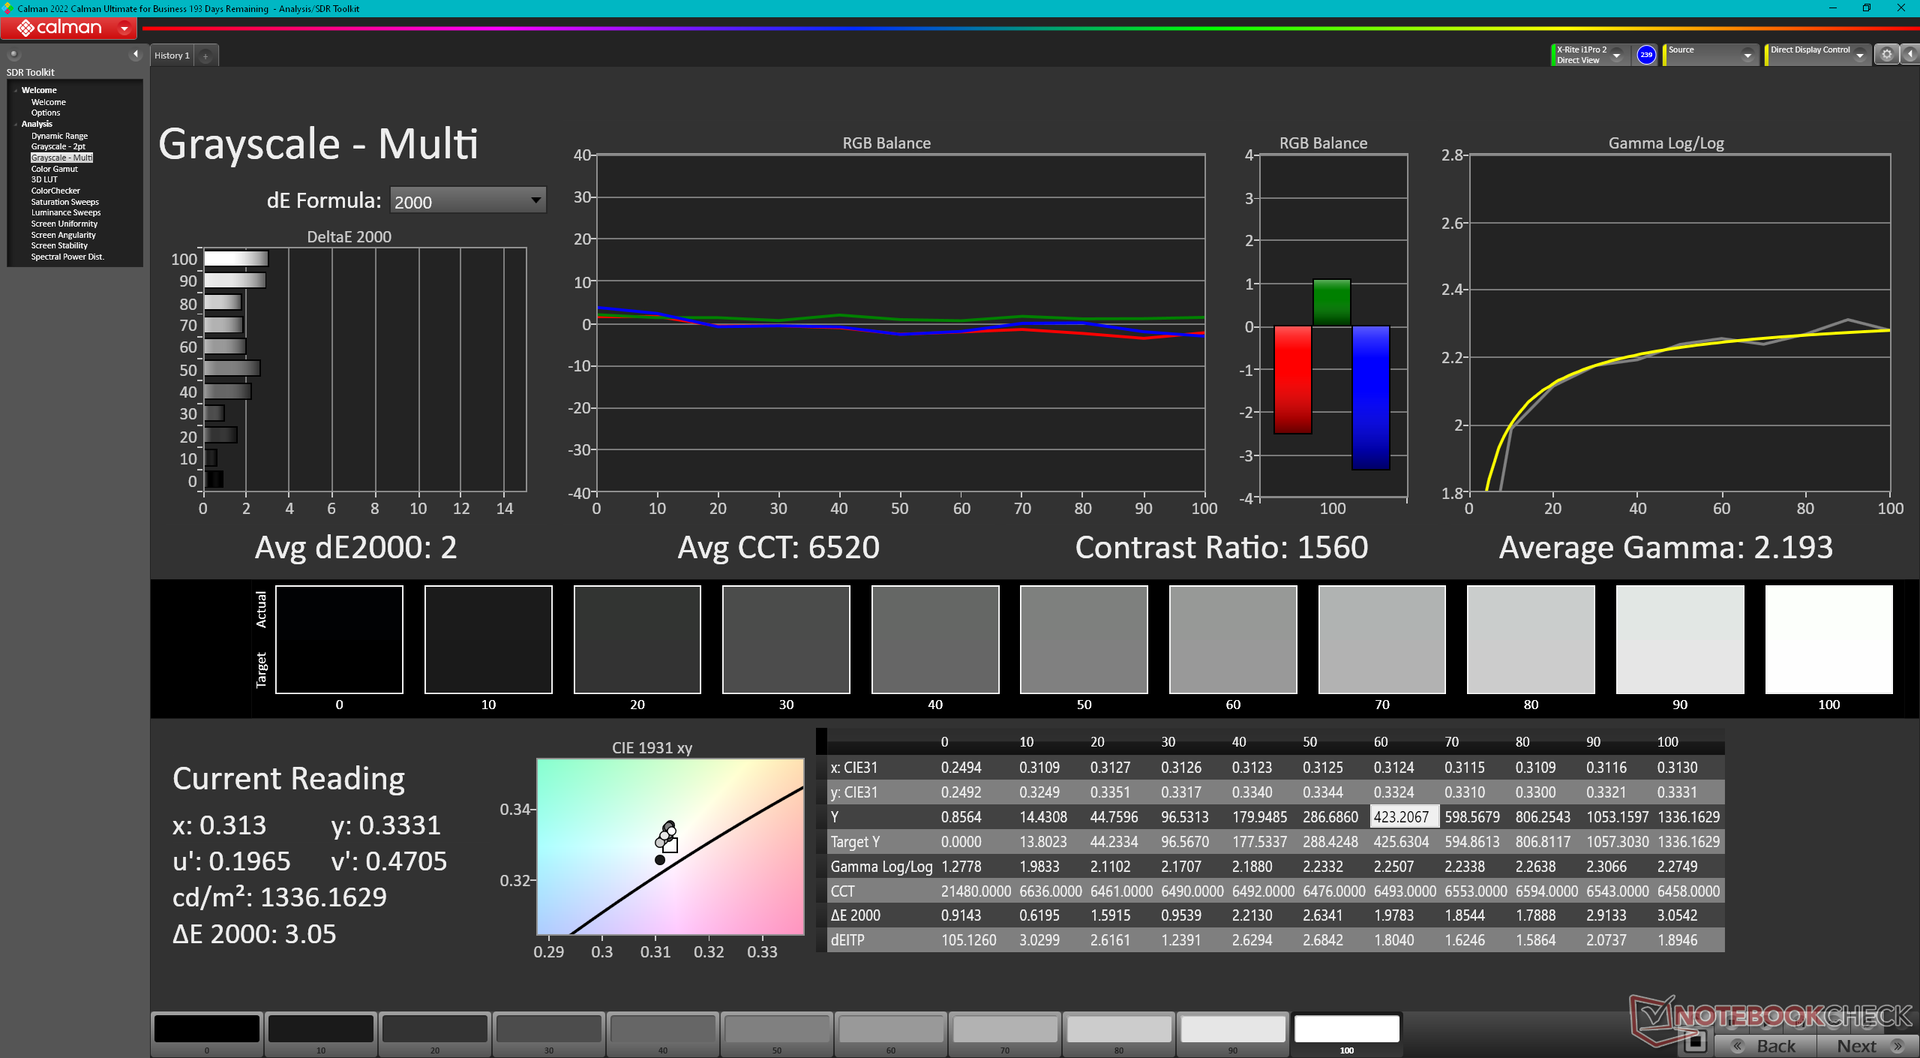
ΔE Greyscale Calman: 1.5 | ∀{0.09-98 Ø4.96}
68.4% AdobeRGB 1998 (Argyll 3D)
96.1% sRGB (Argyll 3D)
66.2% Display P3 (Argyll 3D)
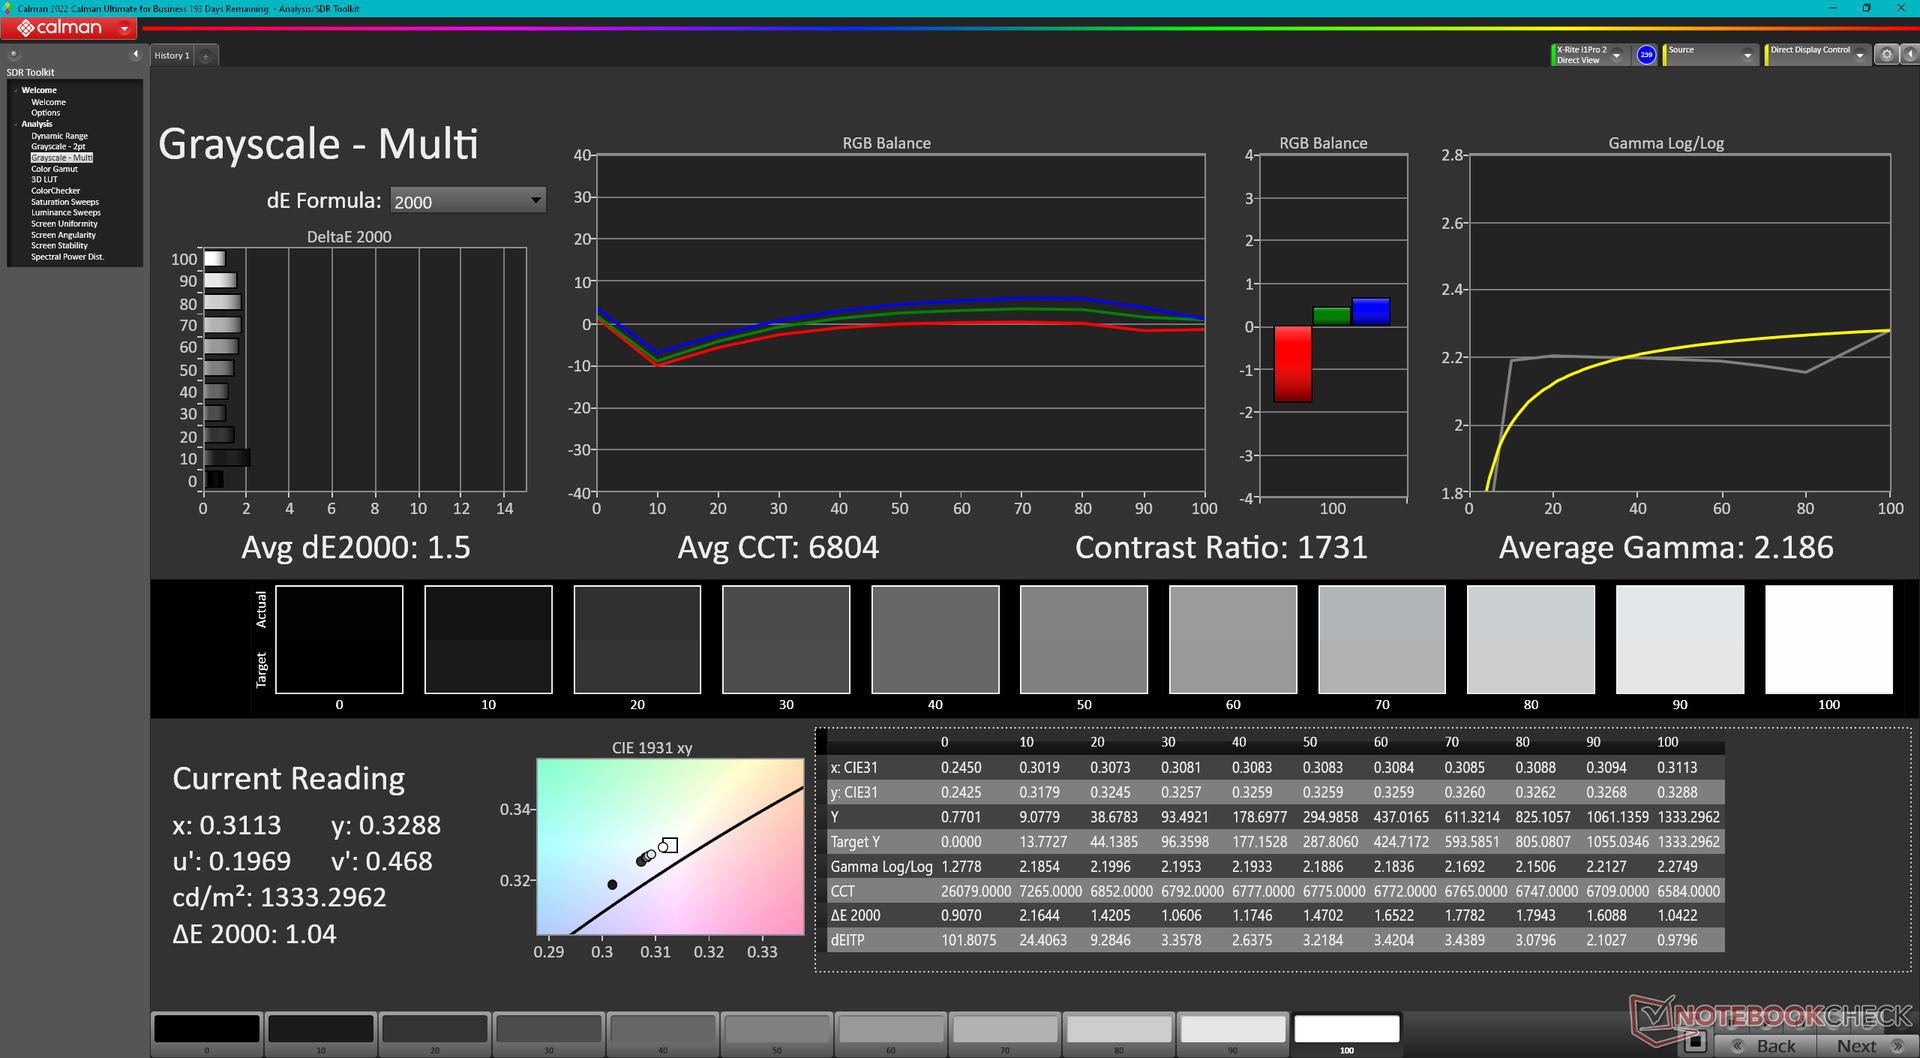
Gamma: 2.19
CCT: 6804 K
| Dell Latitude 7230 Rugged Extreme Sharp LQ120N1, IPS, 1920x1200, 12" | Dell Latitude 7330 Rugged Extreme Sharp LQ133M1, IPS, 1920x1080, 13.3" | Panasonic Toughbook 40 InfoVision M140NWF5 R3, IPS, 1920x1080, 14" | Getac B360 AU Optronics AUO572D, IPS, 1920x1080, 13.3" | Acer Enduro Urban N3 EUN314 XR140EA6T, IPS, 1920x1080, 14" | Durabook S14I KD140N0730A01, TN, 1920x1080, 14" | |
|---|---|---|---|---|---|---|
| Display | 1% | -45% | -24% | -4% | -33% | |
| Display P3 Coverage (%) | 66.2 | 67.1 1% | 35.8 -46% | 51.3 -23% | 63.5 -4% | 43.55 -34% |
| sRGB Coverage (%) | 96.1 | 98.2 2% | 53.8 -44% | 72 -25% | 91.9 -4% | 65.4 -32% |
| AdobeRGB 1998 Coverage (%) | 68.4 | 69 1% | 37 -46% | 52.2 -24% | 65.5 -4% | 45 -34% |
| Response Times | -141% | -60% | -58% | -89% | 16% | |
| Response Time Grey 50% / Grey 80% * (ms) | 28.4 ? | 74.4 ? -162% | 50.4 ? -77% | 33 ? -16% | 56 ? -97% | 30.4 ? -7% |
| Response Time Black / White * (ms) | 19.4 ? | 42.4 ? -119% | 27.6 ? -42% | 38.8 ? -100% | 35.2 ? -81% | 11.8 ? 39% |
| PWM Frequency (Hz) | 694.4 ? | 870 ? | 1000 ? | 304.9 ? | ||
| Screen | -16% | -118% | -216% | -154% | -348% | |
| Brightness middle (cd/m²) | 1326.7 | 1414.1 7% | 1284.3 -3% | 1505.6 13% | 487.8 -63% | 1180.7 -11% |
| Brightness (cd/m²) | 1193 | 1282 7% | 1289 8% | 1383 16% | 464 -61% | 1102 -8% |
| Brightness Distribution (%) | 82 | 84 2% | 82 0% | 86 5% | 89 9% | 89 9% |
| Black Level * (cd/m²) | 0.85 | 0.83 2% | 0.89 -5% | 0.95 -12% | 0.48 44% | 1.91 -125% |
| Contrast (:1) | 1561 | 1704 9% | 1443 -8% | 1585 2% | 1016 -35% | 618 -60% |
| Colorchecker dE 2000 * | 1.06 | 1.99 -88% | 4.67 -341% | 9.81 -825% | 6.51 -514% | 13.45 -1169% |
| Colorchecker dE 2000 max. * | 3.78 | 3.75 1% | 19.85 -425% | 16.64 -340% | 11.36 -201% | 22.52 -496% |
| Colorchecker dE 2000 calibrated * | 0.71 | 0.72 -1% | 2.21 -211% | 1.44 -103% | 1.77 -149% | 3.19 -349% |
| Greyscale dE 2000 * | 1.5 | 2.8 -87% | 2.7 -80% | 12 -700% | 7.8 -420% | 15.4 -927% |
| Gamma | 2.19 100% | 2.06 107% | 1.97 112% | 1.98 111% | 2.28 96% | 1.97 112% |
| CCT | 6804 96% | 6775 96% | 6222 104% | 4838 134% | 8102 80% | 21134 31% |
| Color Space (Percent of AdobeRGB 1998) (%) | 41.6 | |||||
| Color Space (Percent of sRGB) (%) | 65.5 | |||||
| Total Average (Program / Settings) | -52% /
-30% | -74% /
-94% | -99% /
-152% | -82% /
-113% | -122% /
-229% |
* ... smaller is better
The display is well-calibrated out of the box with average grayscale and color deltaE values of just 1.5 and 1.06, respectively. Attempting to calibrate it further ourselves with an X-Rite colorimeter would not significantly improve accuracy and so an end-user calibration is not necessary.

Display Response Times
| ↔ Response Time Black to White | ||
|---|---|---|
| 19.4 ms ... rise ↗ and fall ↘ combined | ↗ 9.7 ms rise | 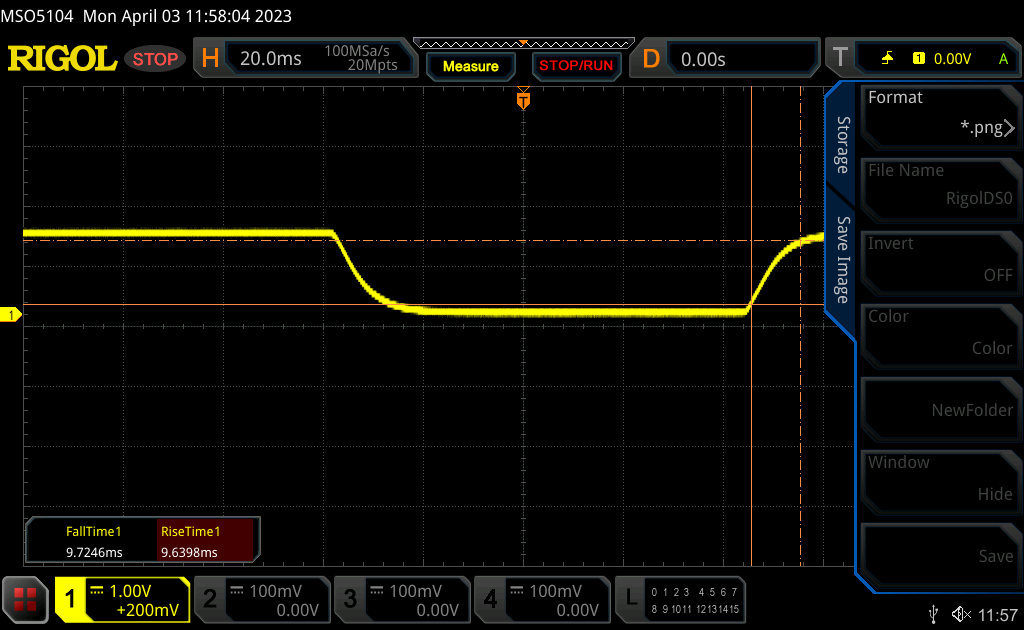 |
| ↘ 9.7 ms fall | ||
| The screen shows good response rates in our tests, but may be too slow for competitive gamers. In comparison, all tested devices range from 0.1 (minimum) to 240 (maximum) ms. » 43 % of all devices are better. This means that the measured response time is similar to the average of all tested devices (19.8 ms). | ||
| ↔ Response Time 50% Grey to 80% Grey | ||
| 28.4 ms ... rise ↗ and fall ↘ combined | ↗ 13.8 ms rise | 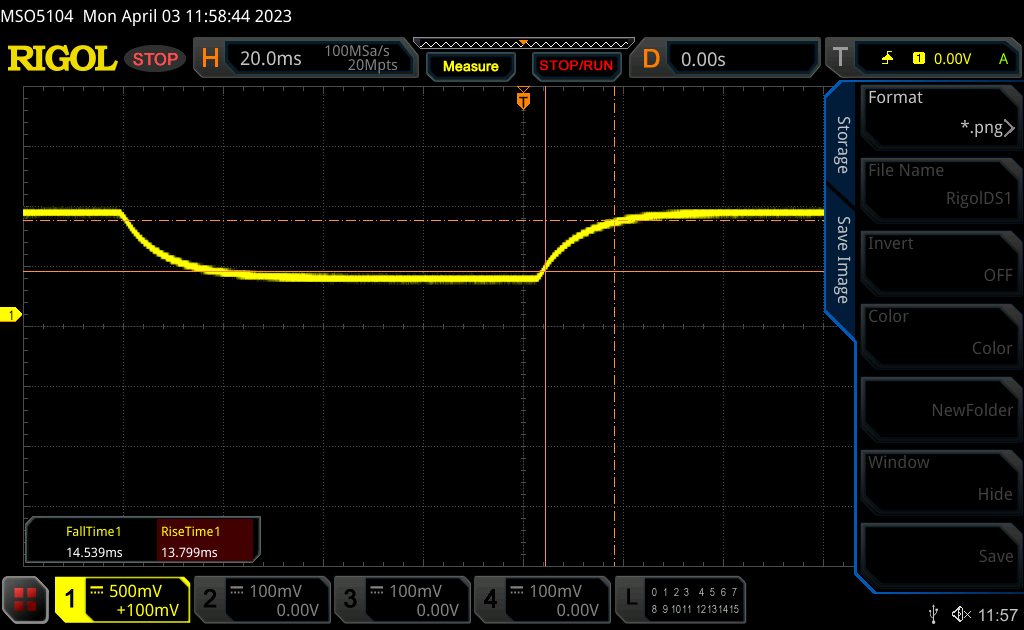 |
| ↘ 14.6 ms fall | ||
| The screen shows relatively slow response rates in our tests and may be too slow for gamers. In comparison, all tested devices range from 0.165 (minimum) to 636 (maximum) ms. » 38 % of all devices are better. This means that the measured response time is similar to the average of all tested devices (30.9 ms). | ||
Screen Flickering / PWM (Pulse-Width Modulation)
| Screen flickering / PWM not detected | 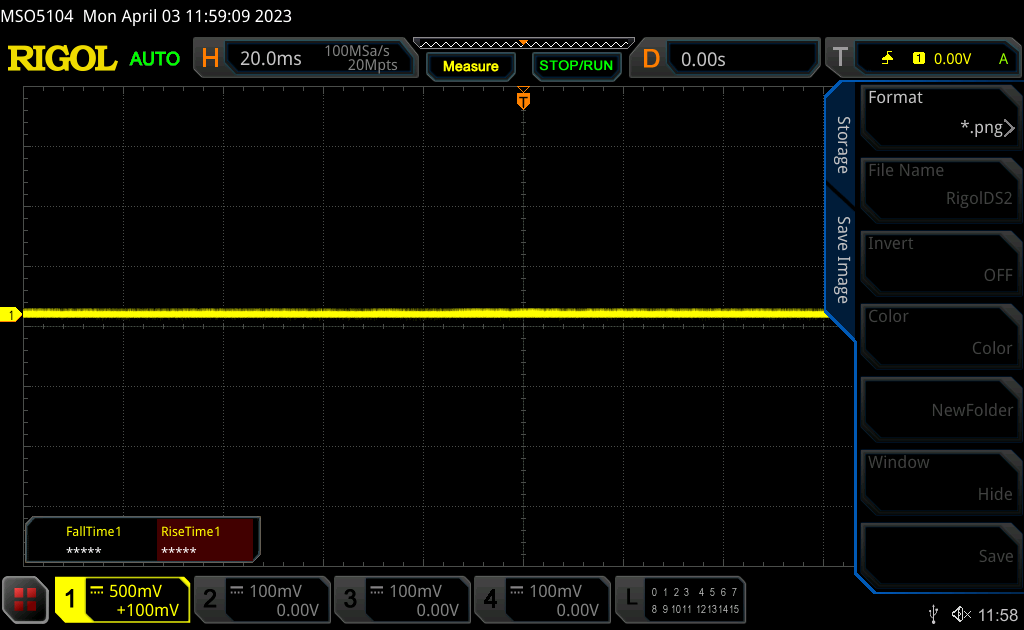 | ||
In comparison: 52 % of all tested devices do not use PWM to dim the display. If PWM was detected, an average of 7741 (minimum: 5 - maximum: 343500) Hz was measured. | |||
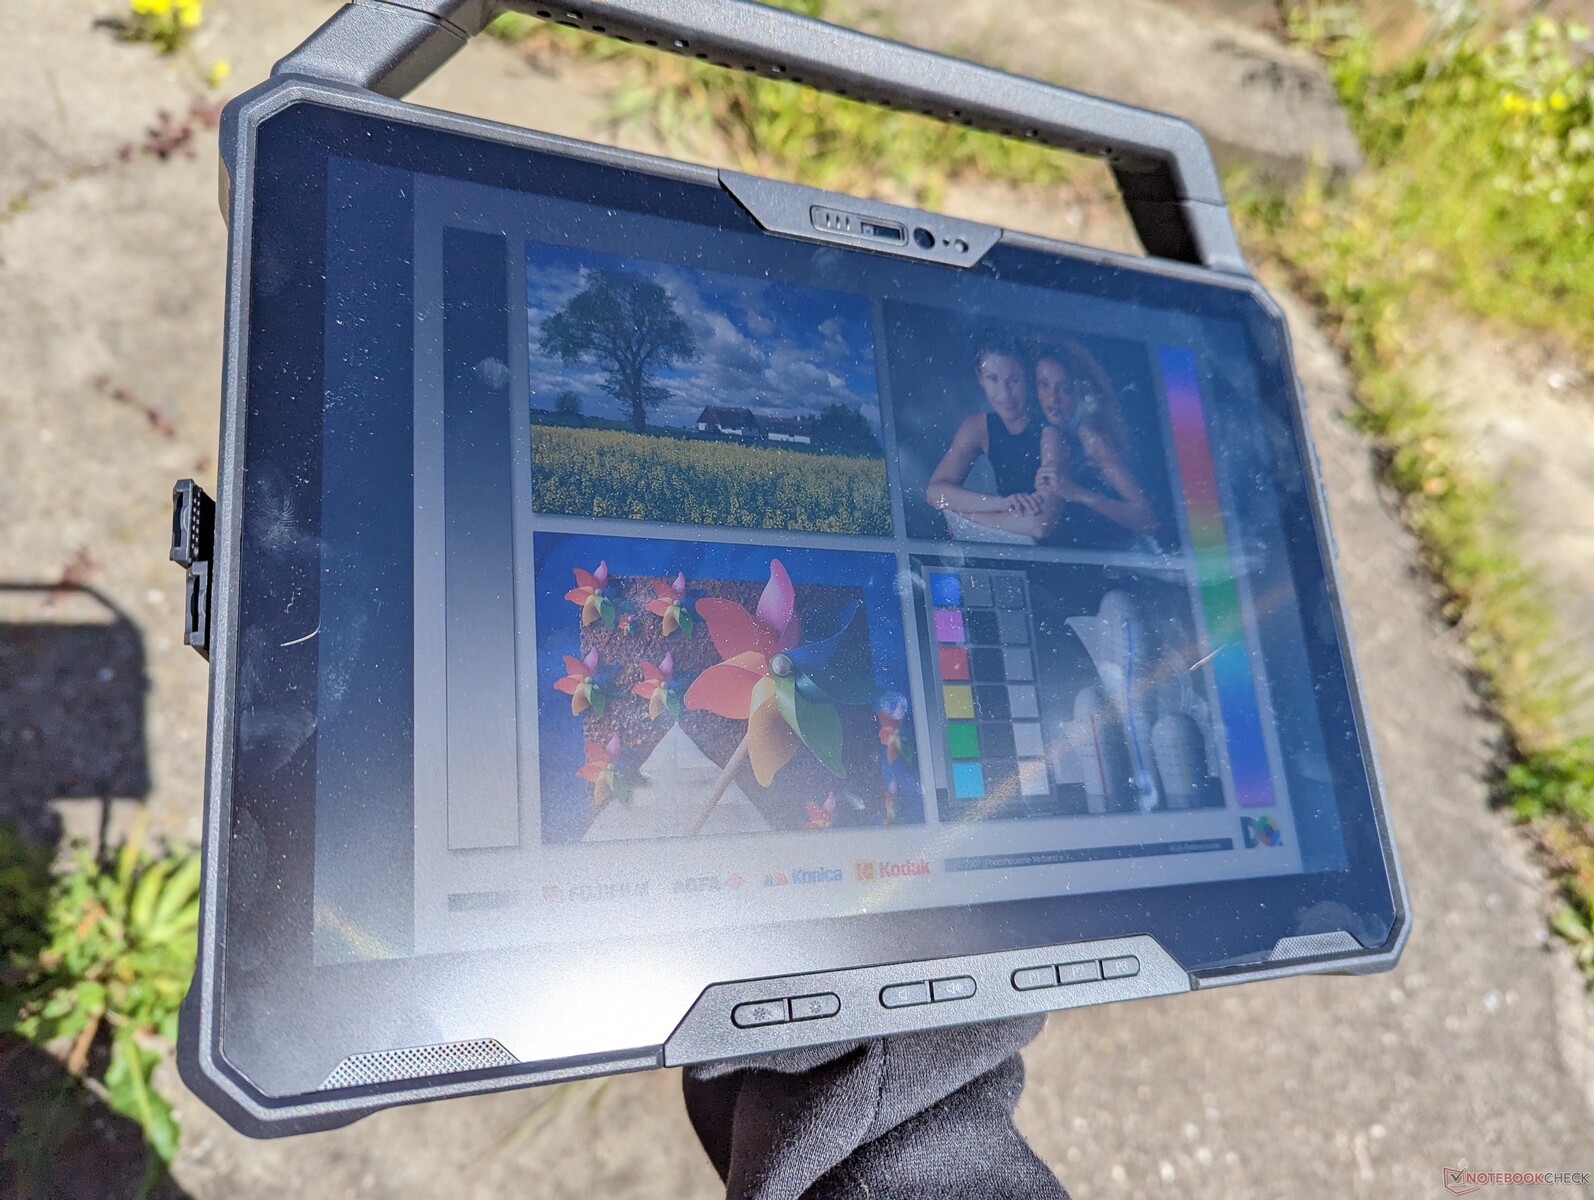
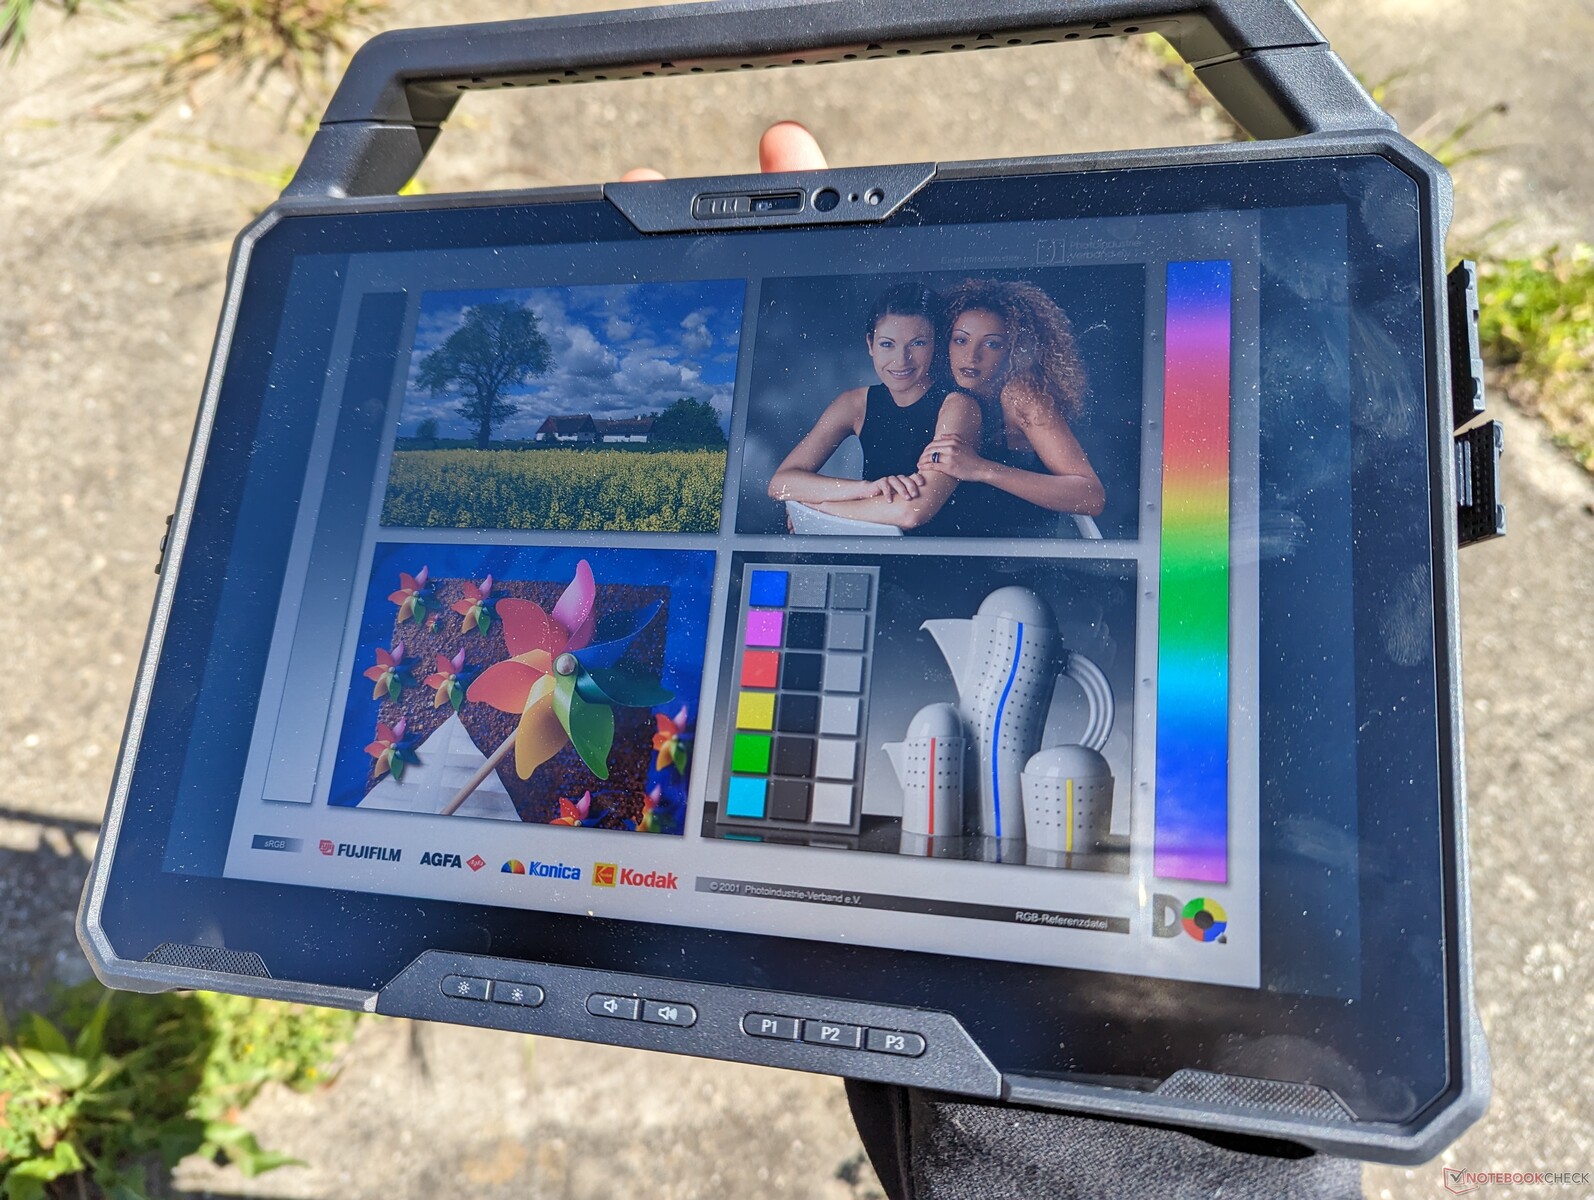
Outdoor visibility is excellent as the display is well over 1000 nits or over two times brighter than the typical consumer tablet or laptop. Some glare and washed out colors still occur, however, and so direct sunlight should be avoided whenever possible to maximize image quality.

Performance
Testing Conditions
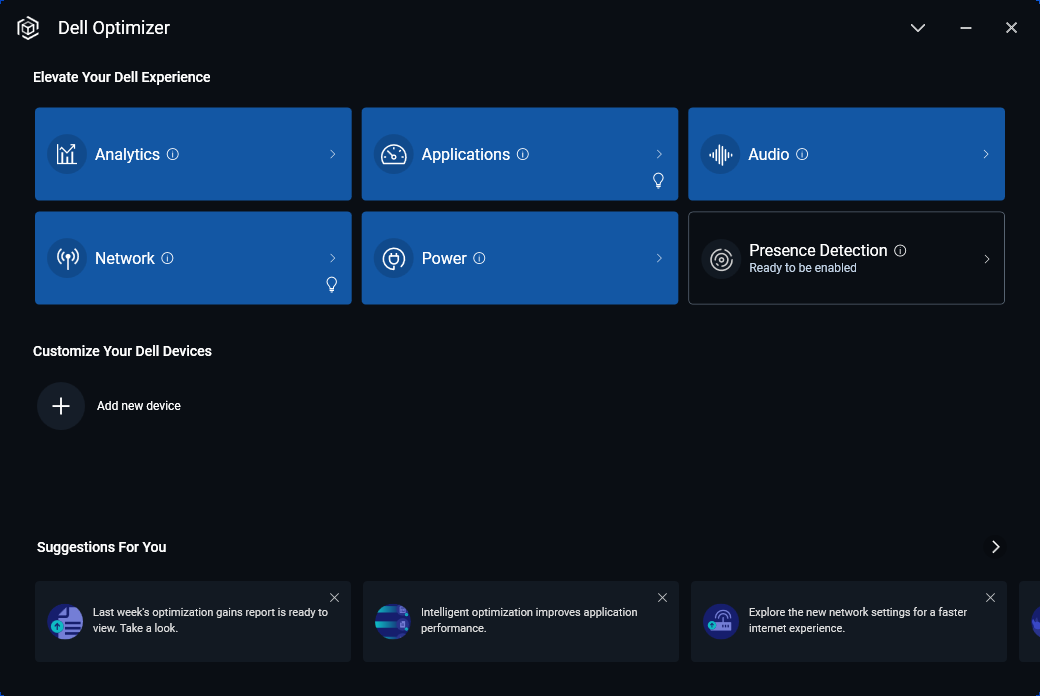
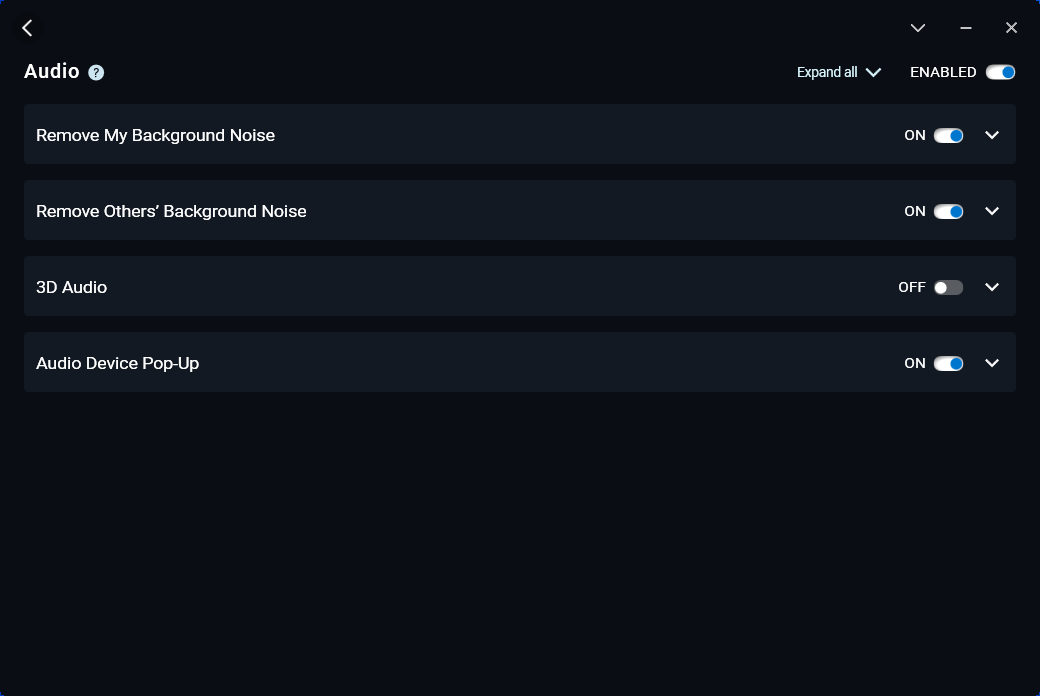
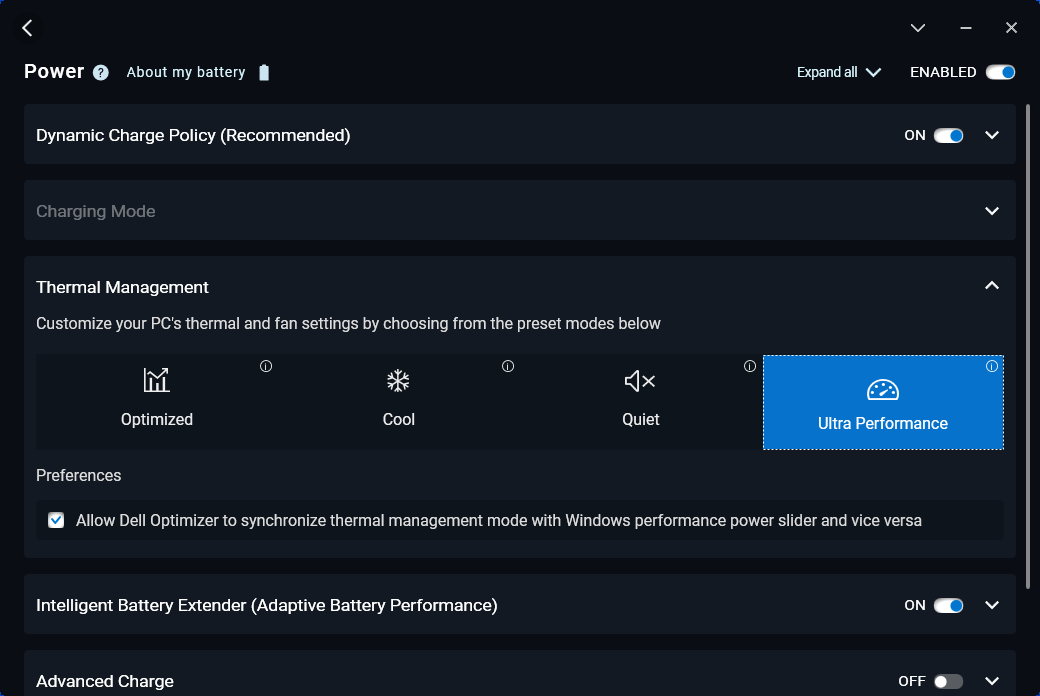
We set our unit to Ultra Performance mode via the pre-installed Dell Optimizer software prior to running any benchmarks below. Users should become accustomed to Optimizer as it controls key aspects of the model including power profiles, audio, microphone, and wireless connectivity.
Dell Presence Detection is not supported on the model.
Processor — As Fast As The Core i7-1260U
CPU performance is excellent especially after the underwhelming Core i7-1260U that we experienced on the Latitude 7330. Multi-thread performance is significantly faster than the popular Core i7-1165G7 or i7-1185G7 that powered most Ultrabooks and rugged devices of yesteryear.
Perhaps the most important aspect to keep in mind when choosing between the Core i5-1240U or Core i7-1260U is that the raw processor performances between them are nearly identical. Instead, they differ mostly in integrated graphics performance. If you need the additional GPU power, then the Core i7 option would be best. Otherwise, both processors are neck-to-neck when it comes to single- and multi-threaded CPU workloads.
Cinebench R15 Multi Loop
Cinebench R23: Multi Core | Single Core
Cinebench R20: CPU (Multi Core) | CPU (Single Core)
Cinebench R15: CPU Multi 64Bit | CPU Single 64Bit
Blender: v2.79 BMW27 CPU
7-Zip 18.03: 7z b 4 | 7z b 4 -mmt1
Geekbench 5.5: Multi-Core | Single-Core
HWBOT x265 Benchmark v2.2: 4k Preset
LibreOffice : 20 Documents To PDF
R Benchmark 2.5: Overall mean
* ... smaller is better
| Blender | |
| v3.3 Classroom HIP/AMD | |
| Lenovo ThinkPad P14s G3 AMD 21J6S05000 | |
| Lenovo ThinkPad P14s G3 AMD 21J6S05000 | |
| v3.3 Classroom OPTIX/RTX | |
| HP ZBook Firefly 14 G9-6B8A2EA | |
| v3.3 Classroom CUDA | |
| HP ZBook Firefly 14 G9-6B8A2EA | |
| v3.3 Classroom CPU | |
| Dell Latitude 7230 Rugged Extreme | |
| HP ProBook 440 G9-5Y3Z3EA | |
| HP ZBook Firefly 14 G9-6B8A2EA | |
| HP EliteBook 840 G9 | |
| Asus ExpertBook B5 Flip B5602FBN | |
| Lenovo ThinkPad P14s G3 AMD 21J6S05000 | |
* ... smaller is better
AIDA64: FP32 Ray-Trace | FPU Julia | CPU SHA3 | CPU Queen | FPU SinJulia | FPU Mandel | CPU AES | CPU ZLib | FP64 Ray-Trace | CPU PhotoWorxx
| Performance rating | |
| Dell Latitude 7330 Rugged Extreme | |
| Acer Enduro Urban N3 EUN314 | |
| Dell Latitude 7230 Rugged Extreme | |
| Average Intel Core i5-1240U | |
| Panasonic Toughbook 40 | |
| Getac B360 | |
| Durabook S14I | |
| AIDA64 / FP32 Ray-Trace | |
| Dell Latitude 7330 Rugged Extreme | |
| Acer Enduro Urban N3 EUN314 | |
| Dell Latitude 7230 Rugged Extreme | |
| Average Intel Core i5-1240U (n=1) | |
| Panasonic Toughbook 40 | |
| Durabook S14I | |
| Getac B360 | |
| AIDA64 / FPU Julia | |
| Dell Latitude 7230 Rugged Extreme | |
| Average Intel Core i5-1240U (n=1) | |
| Dell Latitude 7330 Rugged Extreme | |
| Acer Enduro Urban N3 EUN314 | |
| Getac B360 | |
| Panasonic Toughbook 40 | |
| Durabook S14I | |
| AIDA64 / CPU SHA3 | |
| Dell Latitude 7330 Rugged Extreme | |
| Acer Enduro Urban N3 EUN314 | |
| Dell Latitude 7230 Rugged Extreme | |
| Average Intel Core i5-1240U (n=1) | |
| Panasonic Toughbook 40 | |
| Durabook S14I | |
| Getac B360 | |
| AIDA64 / CPU Queen | |
| Getac B360 | |
| Dell Latitude 7330 Rugged Extreme | |
| Acer Enduro Urban N3 EUN314 | |
| Durabook S14I | |
| Dell Latitude 7230 Rugged Extreme | |
| Average Intel Core i5-1240U (n=1) | |
| Panasonic Toughbook 40 | |
| AIDA64 / FPU SinJulia | |
| Dell Latitude 7330 Rugged Extreme | |
| Acer Enduro Urban N3 EUN314 | |
| Getac B360 | |
| Panasonic Toughbook 40 | |
| Dell Latitude 7230 Rugged Extreme | |
| Average Intel Core i5-1240U (n=1) | |
| Durabook S14I | |
| AIDA64 / FPU Mandel | |
| Dell Latitude 7330 Rugged Extreme | |
| Acer Enduro Urban N3 EUN314 | |
| Dell Latitude 7230 Rugged Extreme | |
| Average Intel Core i5-1240U (n=1) | |
| Panasonic Toughbook 40 | |
| Durabook S14I | |
| Getac B360 | |
| AIDA64 / CPU AES | |
| Dell Latitude 7330 Rugged Extreme | |
| Acer Enduro Urban N3 EUN314 | |
| Durabook S14I | |
| Dell Latitude 7230 Rugged Extreme | |
| Average Intel Core i5-1240U (n=1) | |
| Panasonic Toughbook 40 | |
| Getac B360 | |
| AIDA64 / CPU ZLib | |
| Dell Latitude 7230 Rugged Extreme | |
| Average Intel Core i5-1240U (n=1) | |
| Dell Latitude 7330 Rugged Extreme | |
| Acer Enduro Urban N3 EUN314 | |
| Panasonic Toughbook 40 | |
| Getac B360 | |
| Durabook S14I | |
| AIDA64 / FP64 Ray-Trace | |
| Dell Latitude 7330 Rugged Extreme | |
| Acer Enduro Urban N3 EUN314 | |
| Dell Latitude 7230 Rugged Extreme | |
| Average Intel Core i5-1240U (n=1) | |
| Panasonic Toughbook 40 | |
| Durabook S14I | |
| Getac B360 | |
| AIDA64 / CPU PhotoWorxx | |
| Dell Latitude 7330 Rugged Extreme | |
| Dell Latitude 7230 Rugged Extreme | |
| Average Intel Core i5-1240U (n=1) | |
| Acer Enduro Urban N3 EUN314 | |
| Panasonic Toughbook 40 | |
| Getac B360 | |
| Durabook S14I | |
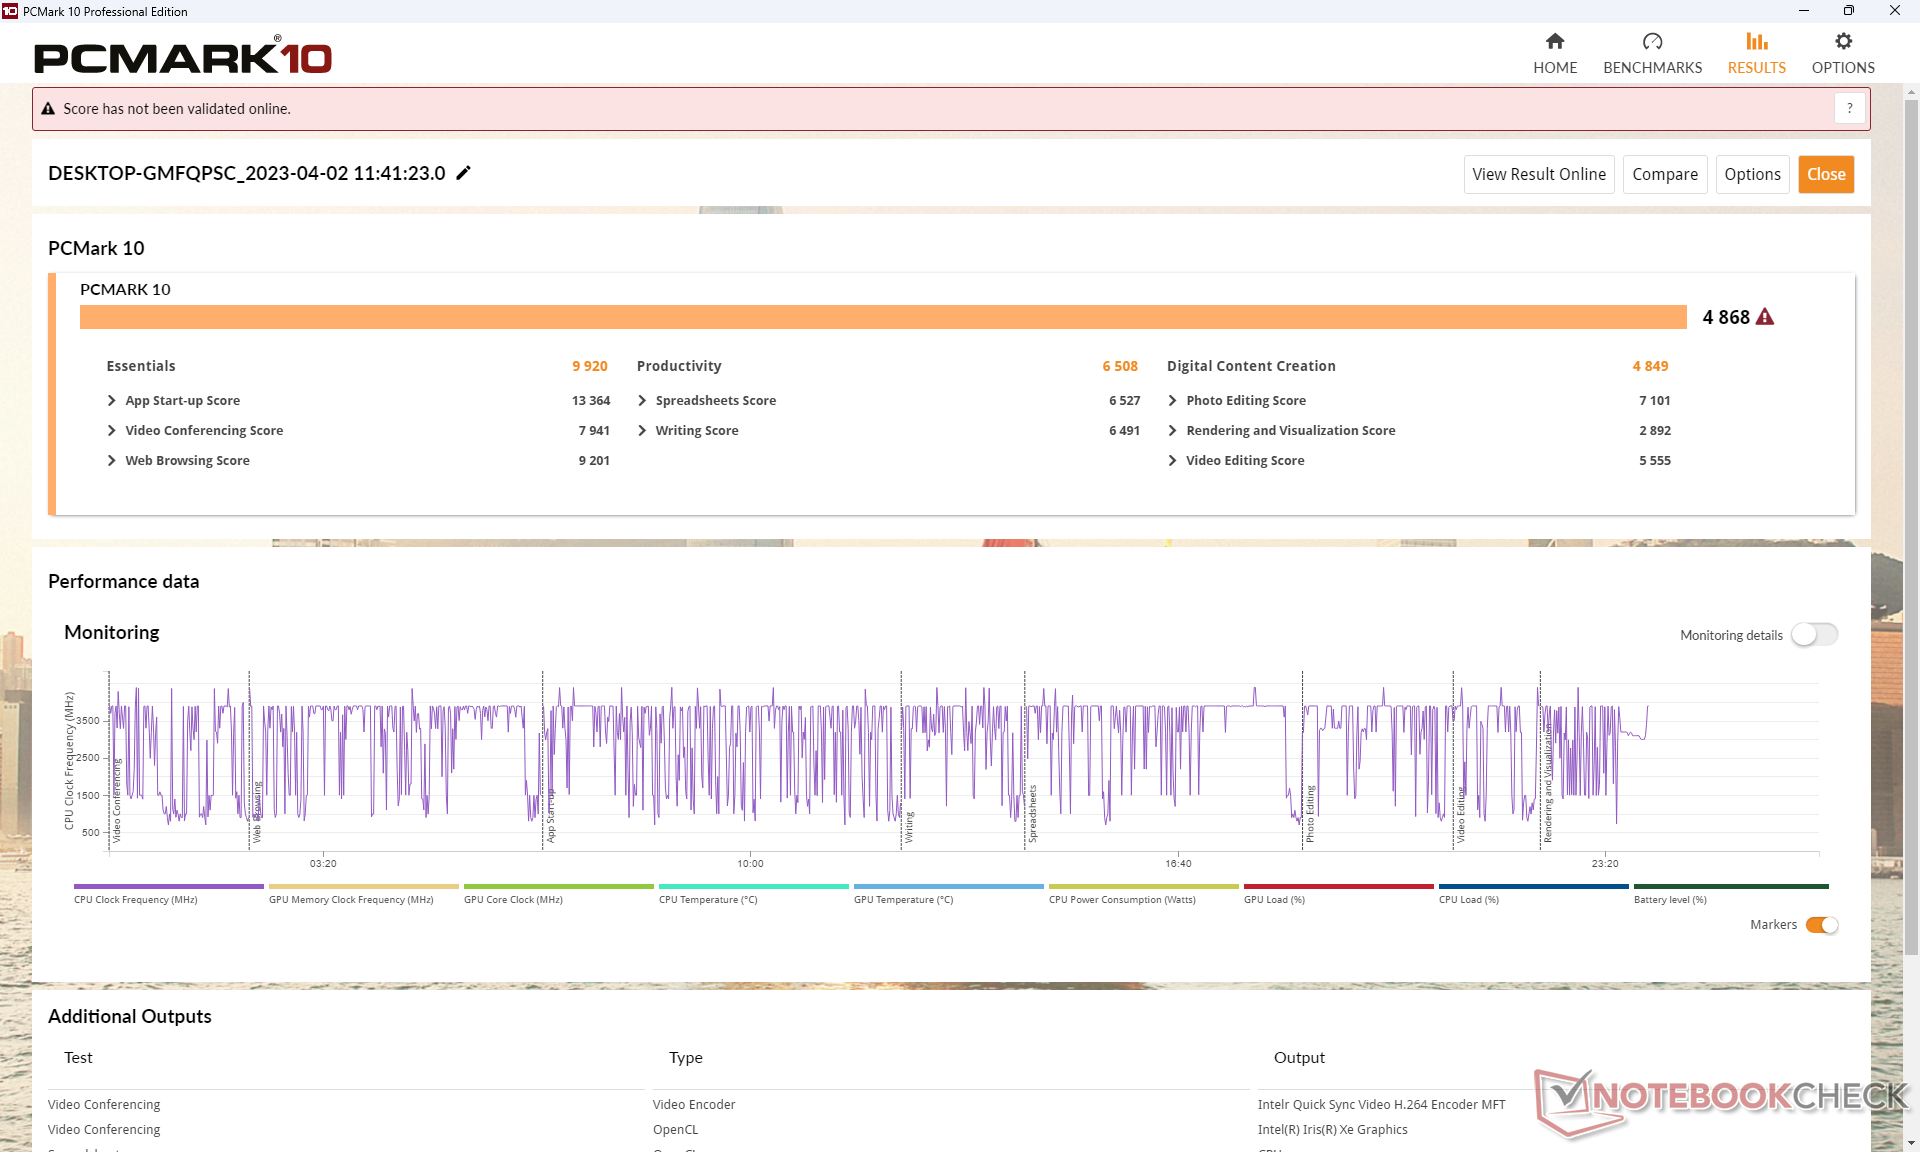
System Performance
CrossMark: Overall | Productivity | Creativity | Responsiveness
| PCMark 10 / Score | |
| Dell Latitude 7330 Rugged Extreme | |
| Panasonic Toughbook 40 | |
| Dell Latitude 7230 Rugged Extreme | |
| Average Intel Core i5-1240U, Intel Iris Xe Graphics G7 80EUs (n=1) | |
| Durabook S14I | |
| Acer Enduro Urban N3 EUN314 | |
| Getac B360 | |
| PCMark 10 / Essentials | |
| Dell Latitude 7330 Rugged Extreme | |
| Durabook S14I | |
| Dell Latitude 7230 Rugged Extreme | |
| Average Intel Core i5-1240U, Intel Iris Xe Graphics G7 80EUs (n=1) | |
| Panasonic Toughbook 40 | |
| Acer Enduro Urban N3 EUN314 | |
| Getac B360 | |
| PCMark 10 / Productivity | |
| Getac B360 | |
| Durabook S14I | |
| Dell Latitude 7330 Rugged Extreme | |
| Panasonic Toughbook 40 | |
| Dell Latitude 7230 Rugged Extreme | |
| Average Intel Core i5-1240U, Intel Iris Xe Graphics G7 80EUs (n=1) | |
| Acer Enduro Urban N3 EUN314 | |
| PCMark 10 / Digital Content Creation | |
| Dell Latitude 7330 Rugged Extreme | |
| Panasonic Toughbook 40 | |
| Acer Enduro Urban N3 EUN314 | |
| Dell Latitude 7230 Rugged Extreme | |
| Average Intel Core i5-1240U, Intel Iris Xe Graphics G7 80EUs (n=1) | |
| Durabook S14I | |
| Getac B360 | |
| CrossMark / Overall | |
| Dell Latitude 7230 Rugged Extreme | |
| Average Intel Core i5-1240U, Intel Iris Xe Graphics G7 80EUs (n=1) | |
| Panasonic Toughbook 40 | |
| CrossMark / Productivity | |
| Dell Latitude 7230 Rugged Extreme | |
| Average Intel Core i5-1240U, Intel Iris Xe Graphics G7 80EUs (n=1) | |
| Panasonic Toughbook 40 | |
| CrossMark / Creativity | |
| Dell Latitude 7230 Rugged Extreme | |
| Average Intel Core i5-1240U, Intel Iris Xe Graphics G7 80EUs (n=1) | |
| Panasonic Toughbook 40 | |
| CrossMark / Responsiveness | |
| Dell Latitude 7230 Rugged Extreme | |
| Average Intel Core i5-1240U, Intel Iris Xe Graphics G7 80EUs (n=1) | |
| Panasonic Toughbook 40 | |
| PCMark 10 Score | 4868 points | |
Help | ||
| AIDA64 / Memory Copy | |
| Dell Latitude 7230 Rugged Extreme | |
| Average Intel Core i5-1240U (n=1) | |
| Dell Latitude 7330 Rugged Extreme | |
| Acer Enduro Urban N3 EUN314 | |
| Panasonic Toughbook 40 | |
| Getac B360 | |
| Durabook S14I | |
| AIDA64 / Memory Read | |
| Dell Latitude 7330 Rugged Extreme | |
| Dell Latitude 7230 Rugged Extreme | |
| Average Intel Core i5-1240U (n=1) | |
| Acer Enduro Urban N3 EUN314 | |
| Panasonic Toughbook 40 | |
| Getac B360 | |
| Durabook S14I | |
| AIDA64 / Memory Write | |
| Dell Latitude 7330 Rugged Extreme | |
| Dell Latitude 7230 Rugged Extreme | |
| Average Intel Core i5-1240U (n=1) | |
| Acer Enduro Urban N3 EUN314 | |
| Getac B360 | |
| Panasonic Toughbook 40 | |
| Durabook S14I | |
| AIDA64 / Memory Latency | |
| Dell Latitude 7230 Rugged Extreme | |
| Average Intel Core i5-1240U (n=1) | |
| Panasonic Toughbook 40 | |
| Dell Latitude 7330 Rugged Extreme | |
| Acer Enduro Urban N3 EUN314 | |
| Durabook S14I | |
| Getac B360 | |
* ... smaller is better
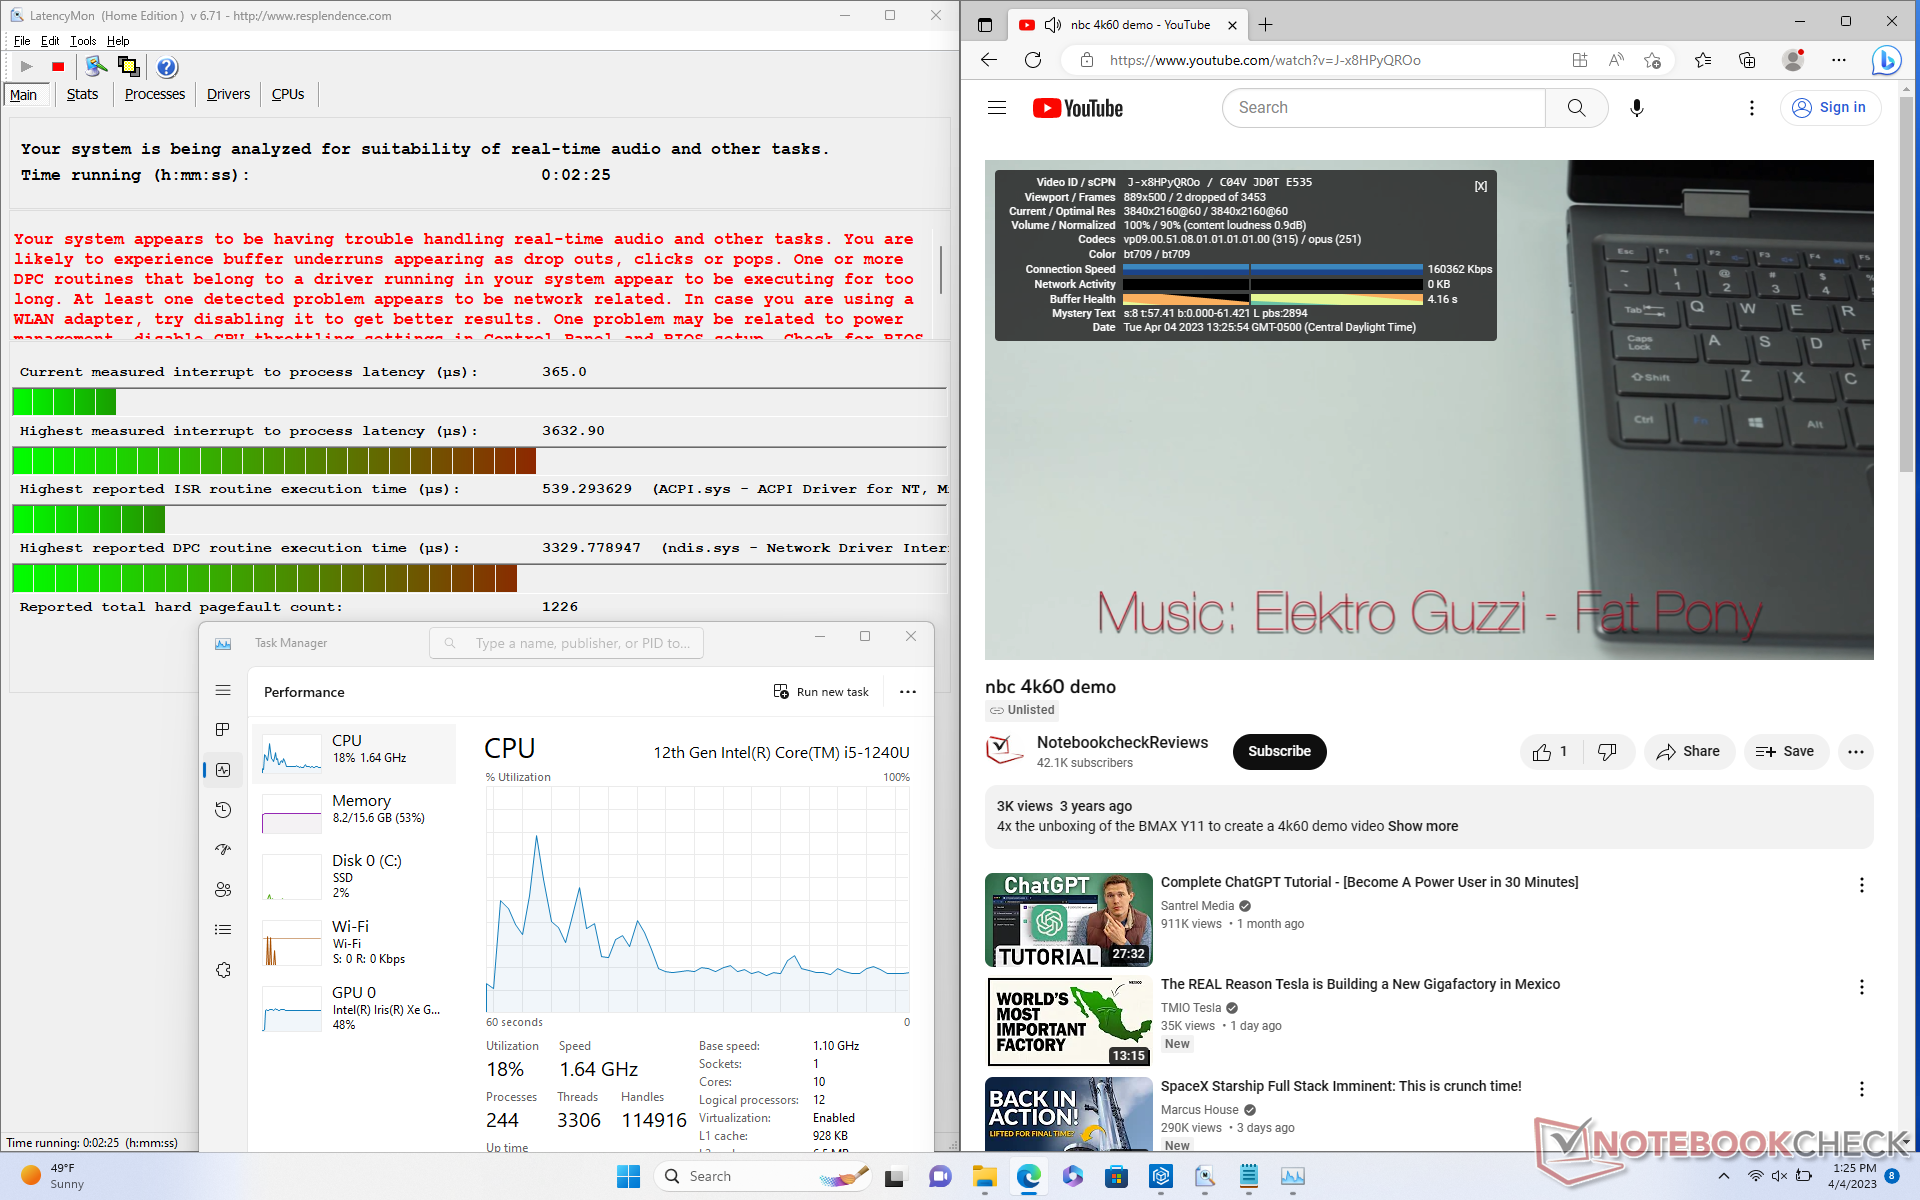
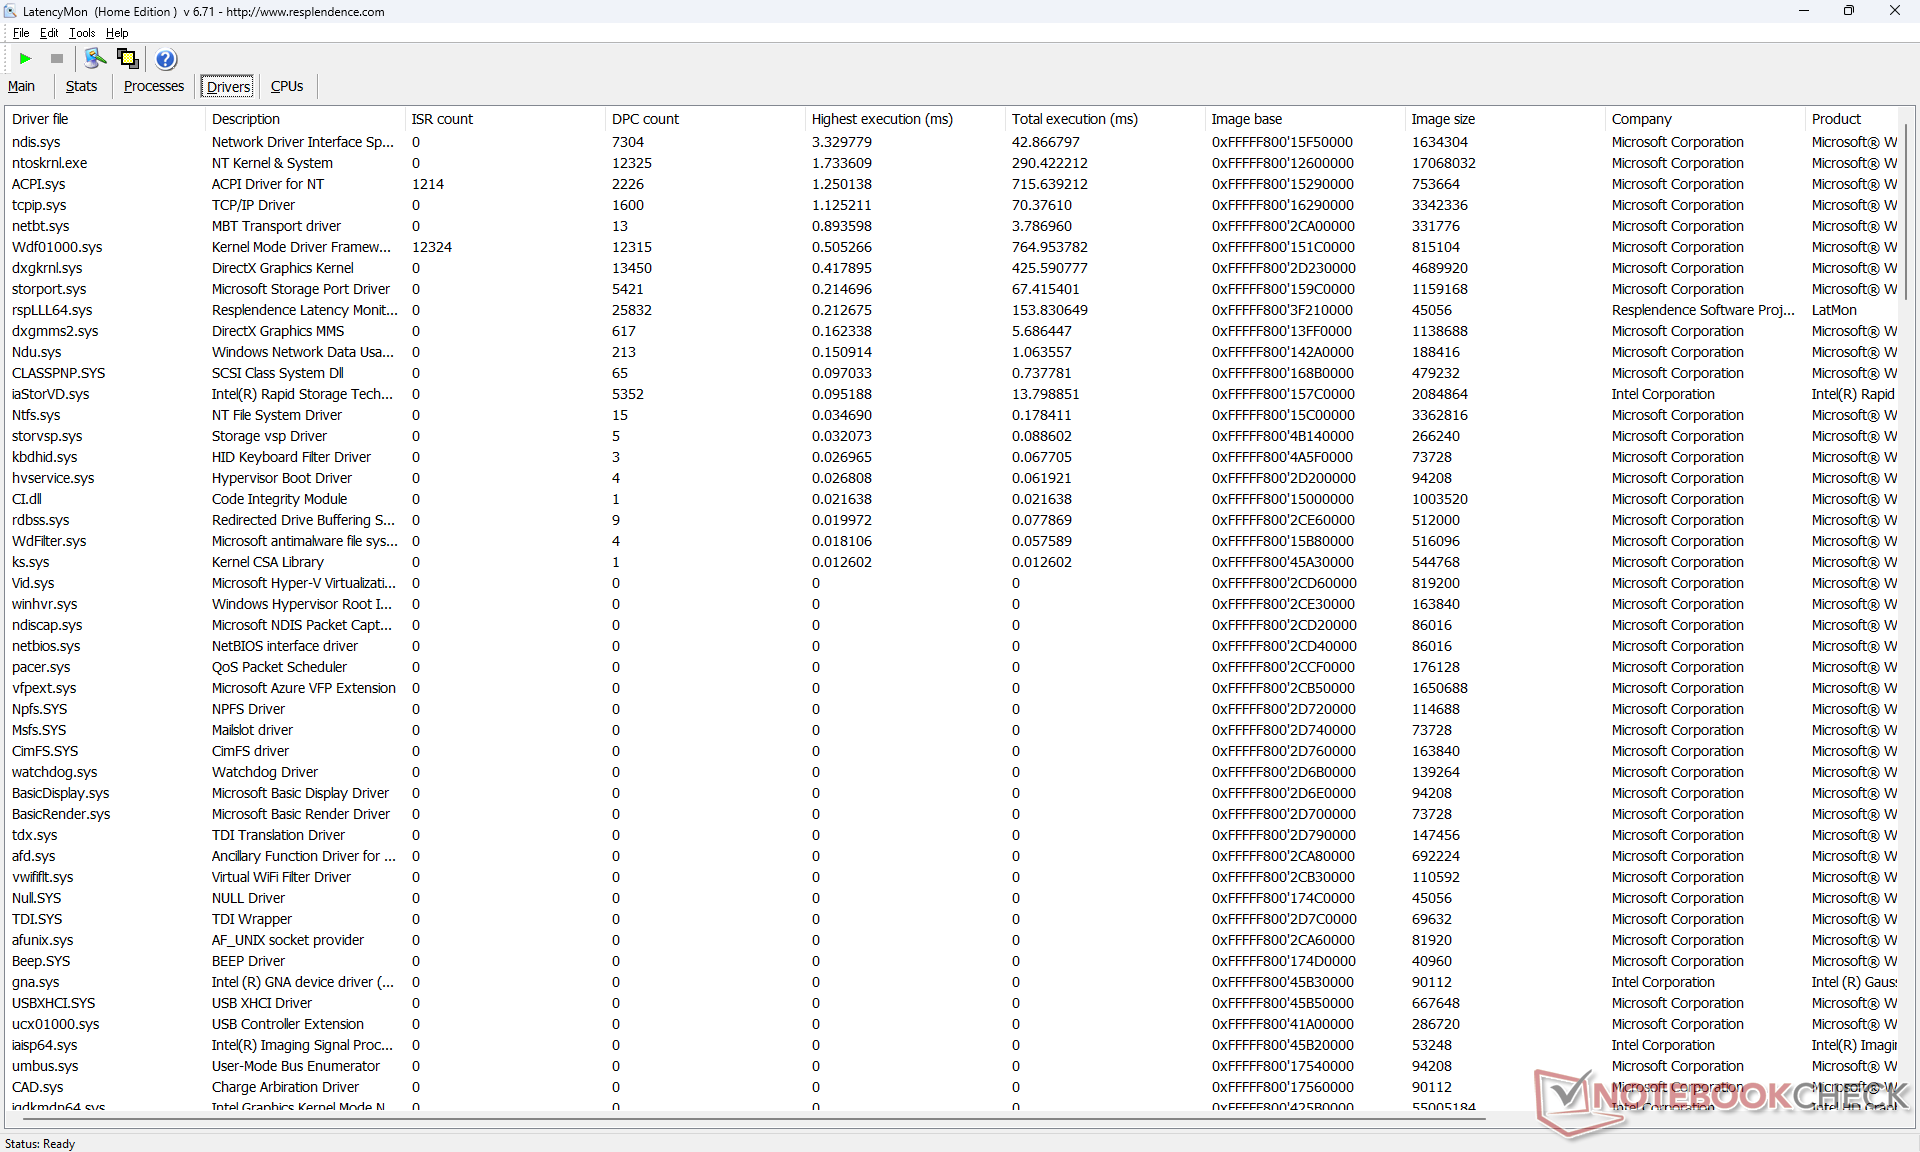
DPC Latency
LatencyMon reveals DPC issues when opening multiple browser tabs of our homepage which is disappointing to see on a rugged device where performance stability is paramount. 4K video playback at 60 FPS is imperfect as well with 2 dropped frames during our minute-long test video.
| DPC Latencies / LatencyMon - interrupt to process latency (max), Web, Youtube, Prime95 | |
| Acer Enduro Urban N3 EUN314 | |
| Dell Latitude 7230 Rugged Extreme | |
| Durabook S14I | |
| Panasonic Toughbook 40 | |
| Getac B360 | |
| Dell Latitude 7330 Rugged Extreme | |
* ... smaller is better
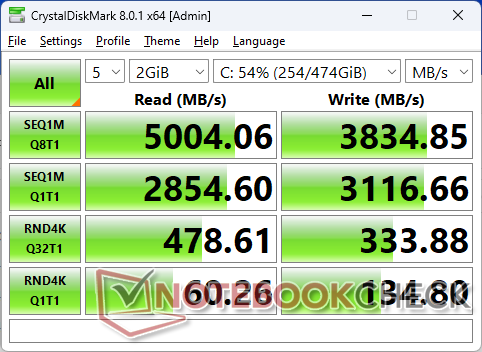
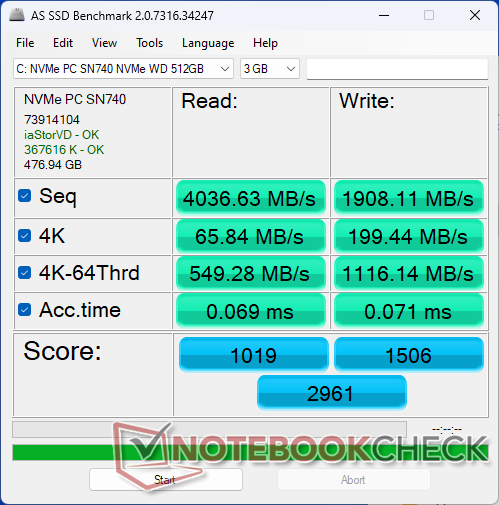
Storage Devices
Our test unit ships with a removable WD PC SN740 PCIe4 x4 NVMe SSD for sequential transfer rates of up to 4800 MB/s. Maximum performance is not sustainable, however, as transfer rates would throttle to as low as 2300 MB/s after just a few minutes as shown by the graph below.

| Drive Performance rating - Percent | |
| Dell Latitude 7330 Rugged Extreme | |
| Dell Latitude 7230 Rugged Extreme | |
| Acer Enduro Urban N3 EUN314 | |
| Getac B360 | |
| Durabook S14I | |
| Panasonic Toughbook 40 | |
* ... smaller is better
Disk Throttling: DiskSpd Read Loop, Queue Depth 8
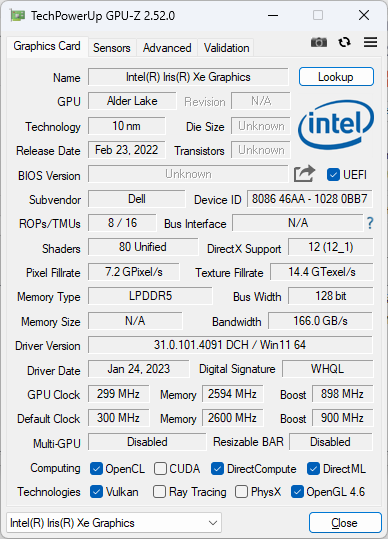
GPU Performance — Average Iris Xe 80 EUs
Graphics performance underperforms by about 5 to 15 percent when compared to the average PC in our database equipped with the same integrated Iris Xe 80 EUs GPU. Expect overall performance to be about 30 to 40 percent slower than the common Iris Xe 96 EUs. Fortunately, the model can be configured with the Core i7-1260U which comes with the faster Iris Xe 96 EUs for those who need it as mentioned earlier.
System performance appears to be identical between the Optimized and Ultra power profiles. A 3DMark 11 test on both power modes would result in nearly the same final scores between them.
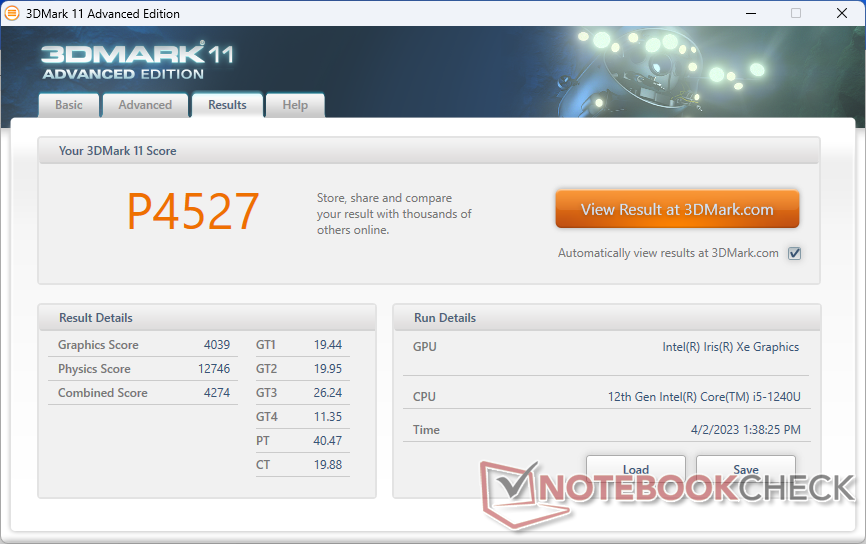
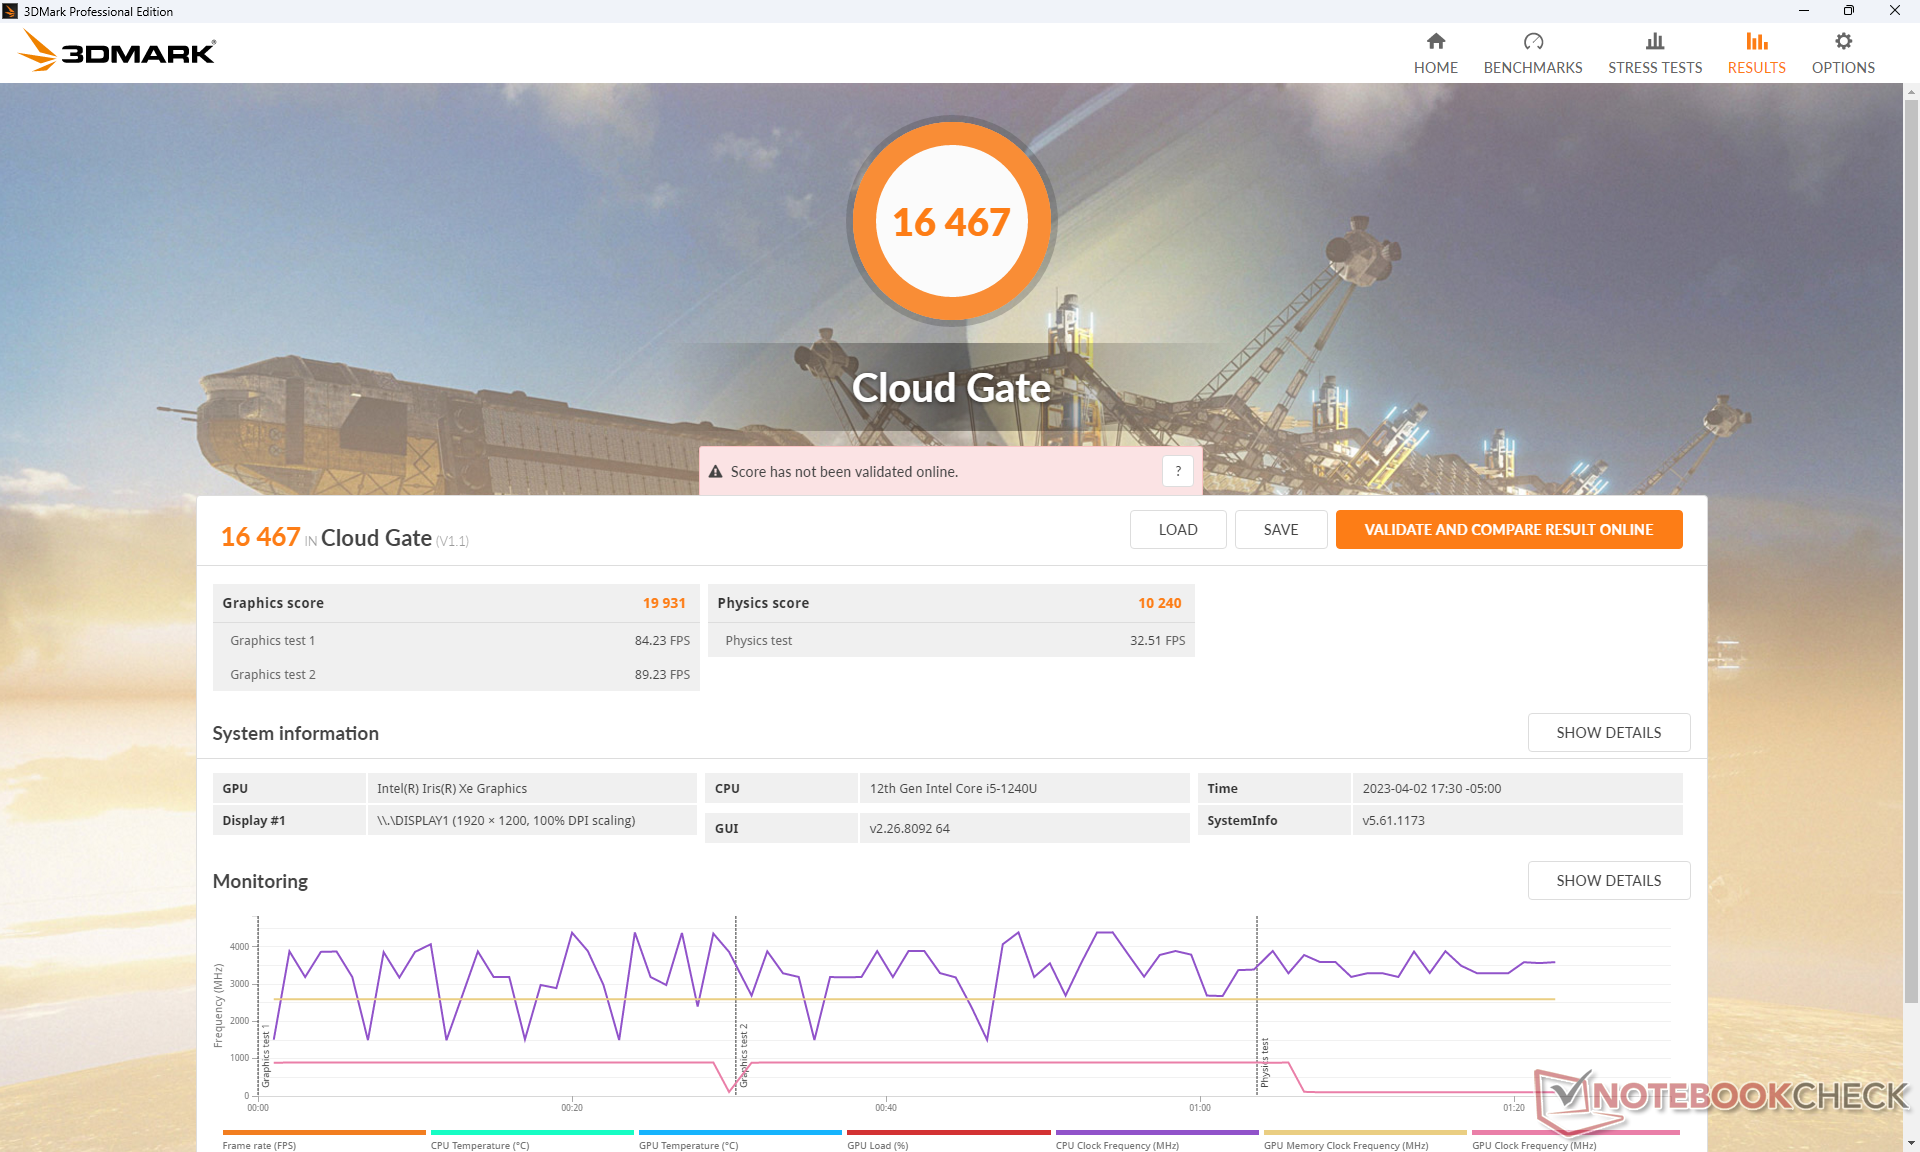
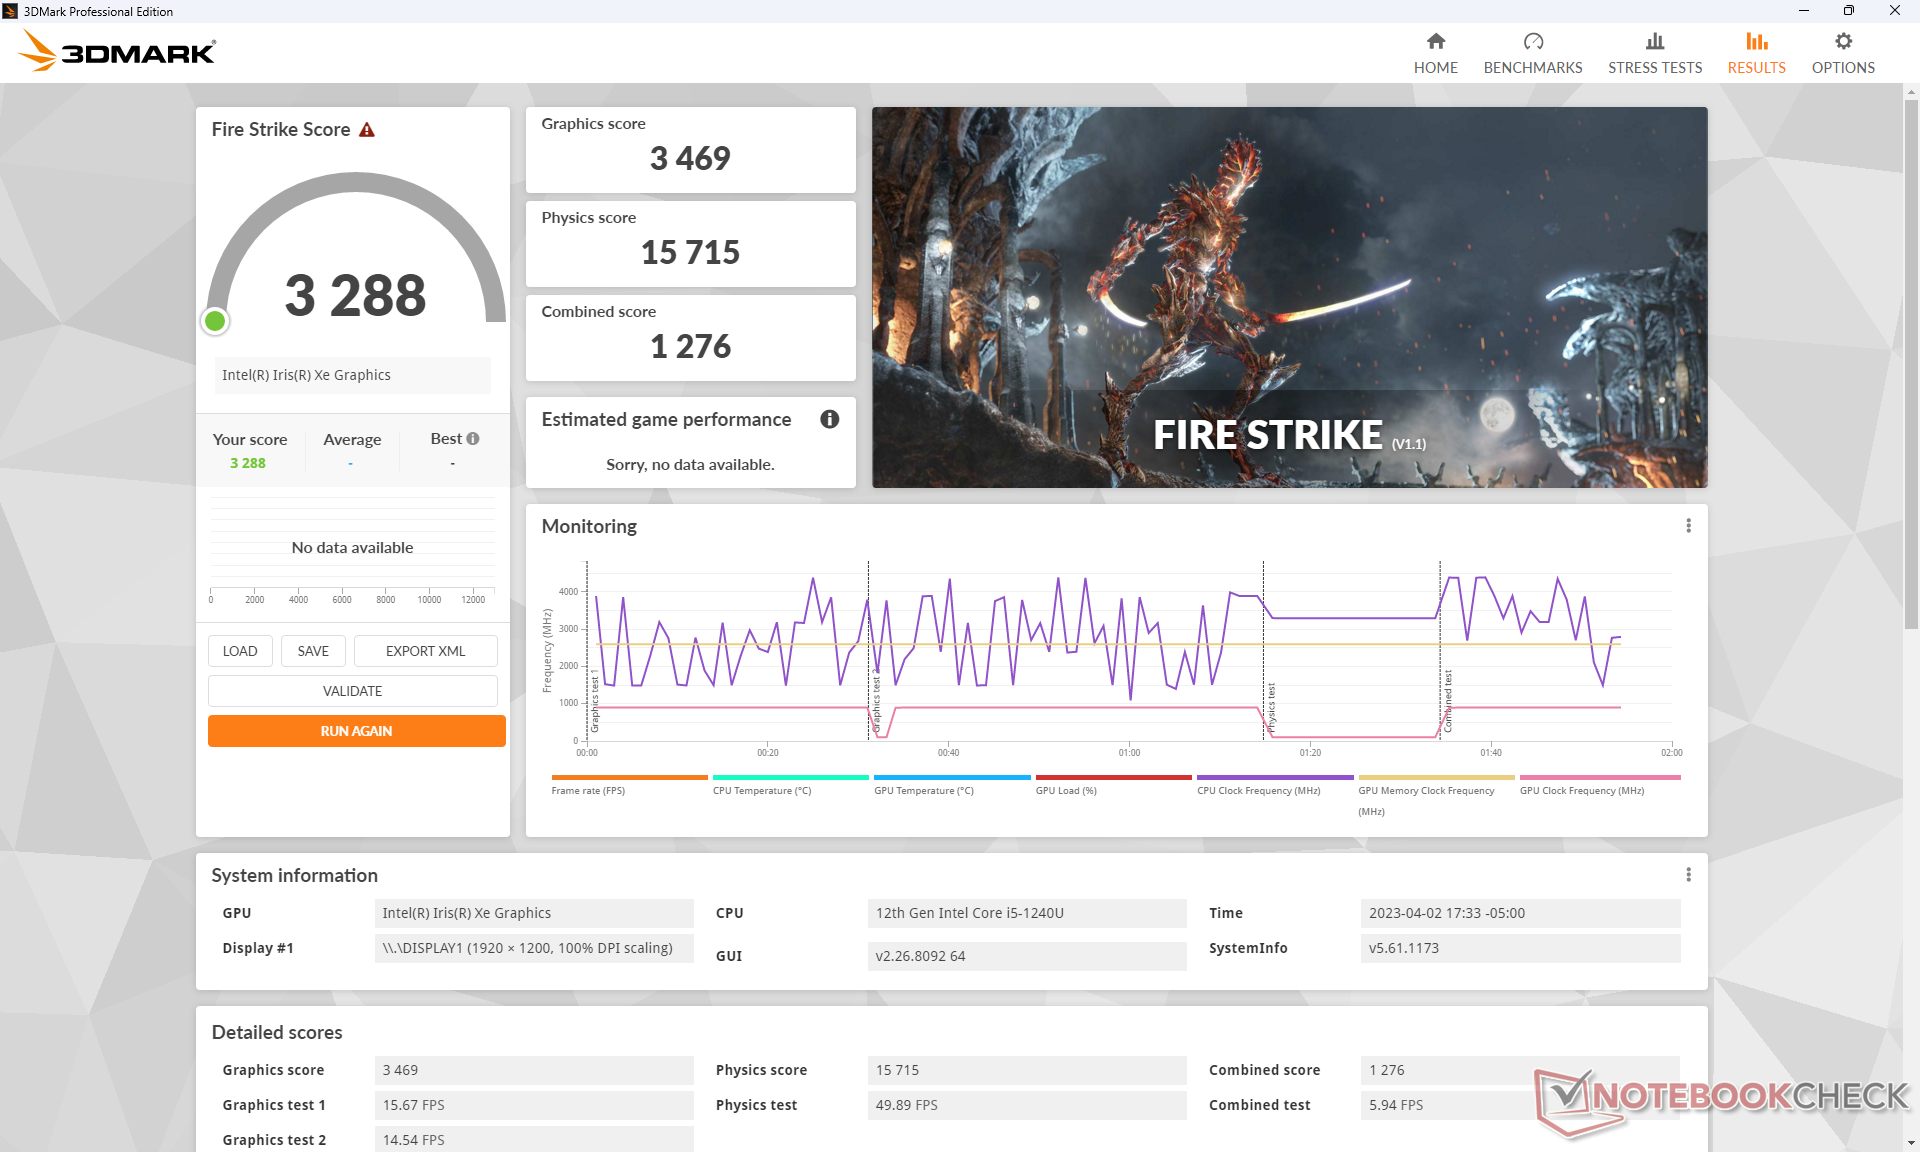
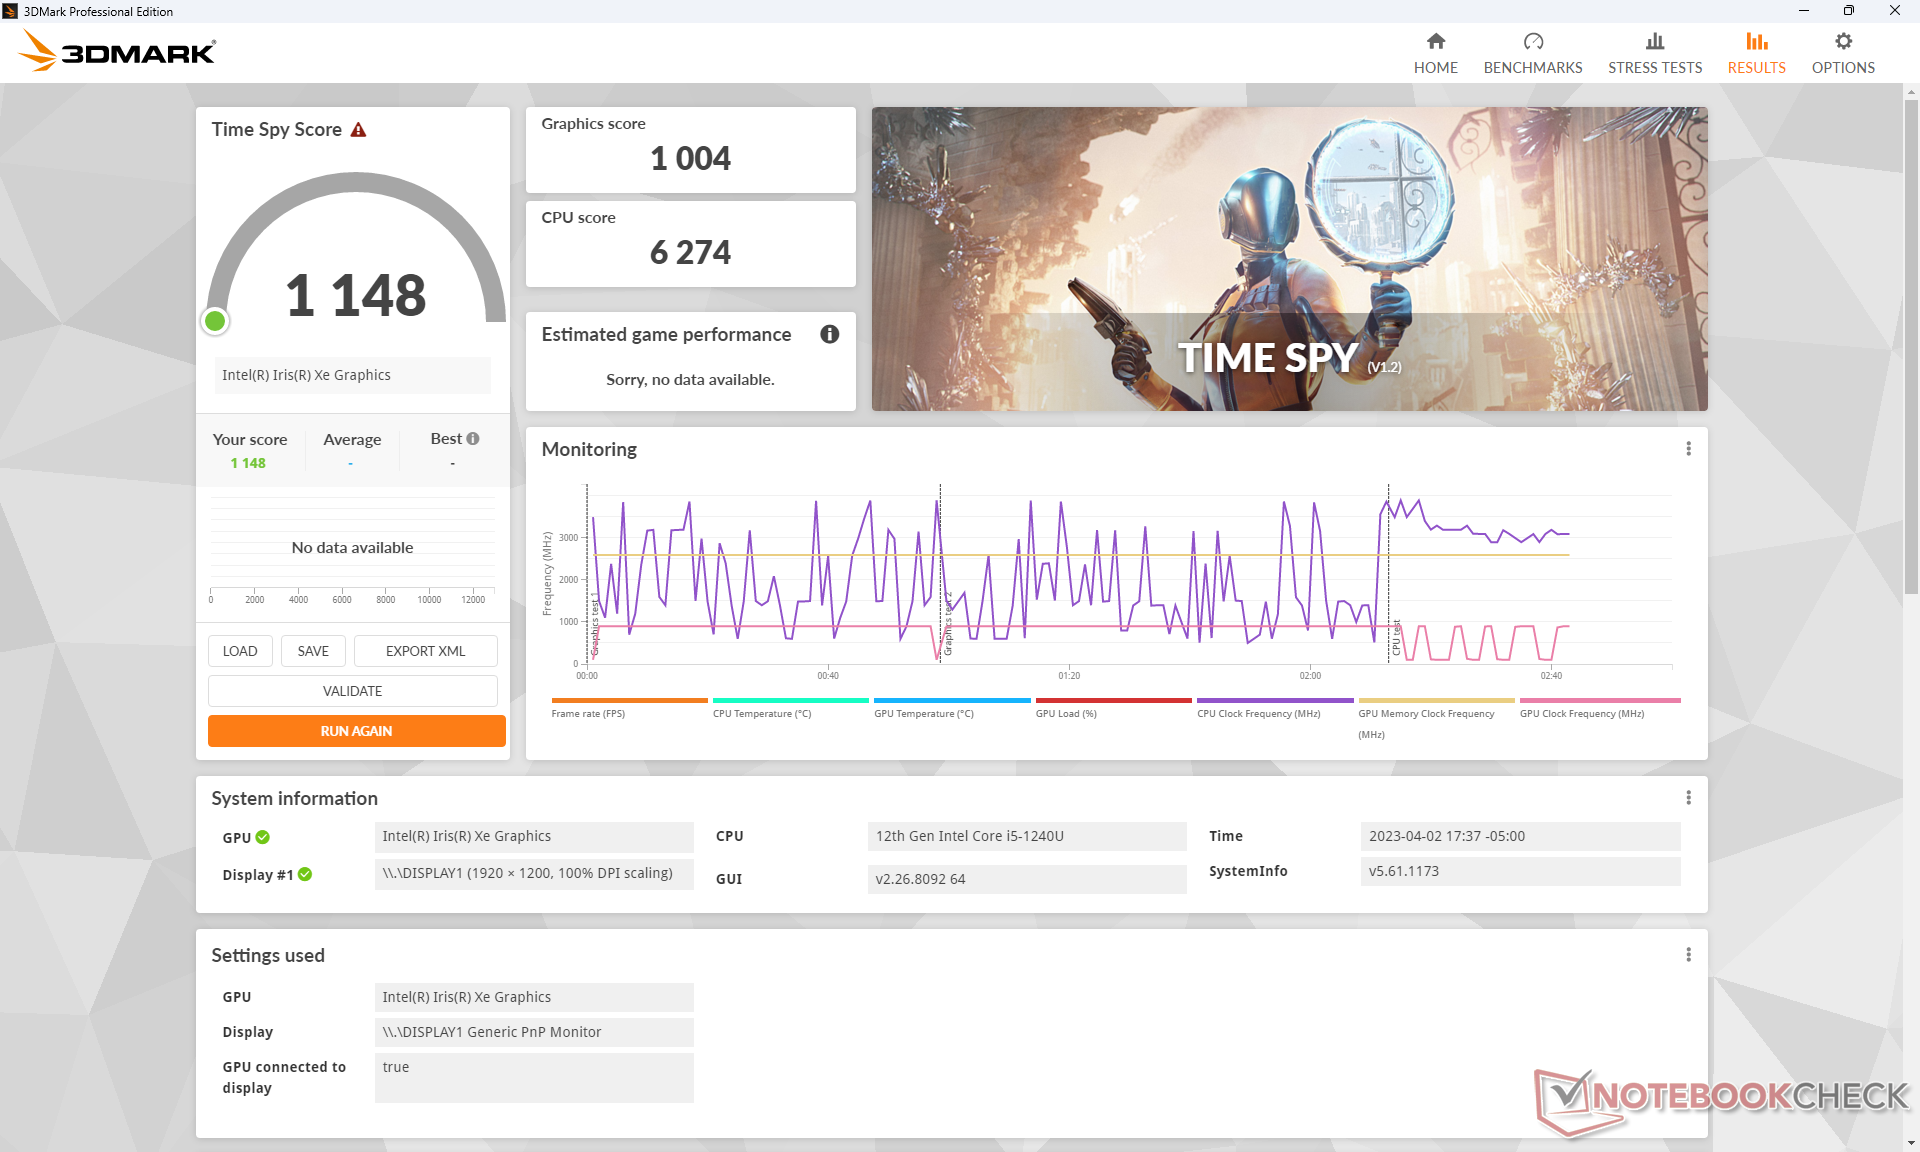
| 3DMark 11 Performance | 4527 points | |
| 3DMark Cloud Gate Standard Score | 16467 points | |
| 3DMark Fire Strike Score | 3288 points | |
| 3DMark Time Spy Score | 1148 points | |
Help | ||
| GTA V - 1920x1080 Highest AA:4xMSAA + FX AF:16x | |
| HP ZBook Firefly 14 G9-6B8A2EA | |
| Lenovo ThinkPad P14s G3 AMD 21J6S05000 | |
| Asus ExpertBook B5 Flip B5602FBN | |
| HP EliteBook 840 G9 | |
| Acer Enduro Urban N3 EUN314 | |
| Dell Latitude 7230 Rugged Extreme | |
| Strange Brigade - 1920x1080 ultra AA:ultra AF:16 | |
| Asus ExpertBook B5 Flip B5602FBN | |
| HP ZBook Firefly 14 G9-6B8A2EA | |
| Lenovo ThinkPad P14s G3 AMD 21J6S05000 | |
| HP EliteBook 840 G9 | |
| Acer Enduro Urban N3 EUN314 | |
| Dell Latitude 7230 Rugged Extreme | |
Witcher 3 FPS Chart
| low | med. | high | ultra | |
|---|---|---|---|---|
| GTA V (2015) | 103.3 | 93.3 | 18.5 | 7.79 |
| The Witcher 3 (2015) | 67.3 | 40.9 | 24.1 | 10.6 |
| Dota 2 Reborn (2015) | 98.9 | 77.8 | 50.7 | 45.7 |
| Final Fantasy XV Benchmark (2018) | 31 | 17.3 | 11.8 | |
| X-Plane 11.11 (2018) | 32.6 | 22.6 | 20.6 | |
| Strange Brigade (2018) | 60.2 | 27.4 | 21.4 | 17.9 |
Emissions — Quiet Until It's Loud
System Noise
Fan noise is quiet and essentially inaudible during low to low-medium loads. Running the first benchmark scene of 3DMark 06, for example, wouldn't induce any fan noise until the end of the benchmark.
The small diameter fan is unfortunately higher-pitched than on most laptops. If running very demanding applications akin to games or Prime95, fan noise can be as high as 43 dB(A) to be one of the loudest rugged tablets we've tested. You'd have to really push the tablet to its limits to reach such high noise levels, however.
Noise level
| Idle |
| 22.9 / 22.9 / 22.9 dB(A) |
| Load |
| 24.5 / 43.2 dB(A) |
 | ||
30 dB silent 40 dB(A) audible 50 dB(A) loud |
||
min: | ||
| Dell Latitude 7230 Rugged Extreme Iris Xe G7 80EUs, i5-1240U, WD PC SN740 512GB SDDPMQD-512G-1101 | Dell Latitude 7330 Rugged Extreme Iris Xe G7 96EUs, i7-1185G7 | Panasonic Toughbook 40 Iris Xe G7 96EUs, i7-1185G7, Samsung PM991 MZVLQ1T0HALB | Getac B360 UHD Graphics 620, i7-10710U, Lite-On CA5-8D512 | Acer Enduro Urban N3 EUN314 Iris Xe G7 96EUs, i7-1165G7, Samsung PM991 MZVLQ1T0HALB | Durabook S14I Iris Xe G7 96EUs, i7-1165G7, UDinfo M2P M2P80DE512GBAEP | |
|---|---|---|---|---|---|---|
| Noise | 2% | -13% | 0% | -3% | -18% | |
| off / environment * (dB) | 22.8 | 22.9 -0% | 22.8 -0% | 24.3 -7% | 23.8 -4% | 25.2 -11% |
| Idle Minimum * (dB) | 22.9 | 23.1 -1% | 26 -14% | 24.5 -7% | 24.1 -5% | 25.2 -10% |
| Idle Average * (dB) | 22.9 | 23.1 -1% | 26 -14% | 24.5 -7% | 24.1 -5% | 25.2 -10% |
| Idle Maximum * (dB) | 22.9 | 23.1 -1% | 26 -14% | 24.6 -7% | 24.1 -5% | 34.5 -51% |
| Load Average * (dB) | 24.5 | 28 -14% | 37.6 -53% | 29.8 -22% | 27.9 -14% | 34.5 -41% |
| Witcher 3 ultra * (dB) | 36 | 31.2 13% | 37.8 -5% | 27.3 24% | 35.7 1% | |
| Load Maximum * (dB) | 43.2 | 36.2 16% | 40.3 7% | 30.8 29% | 38.6 11% | 36.2 16% |
* ... smaller is better
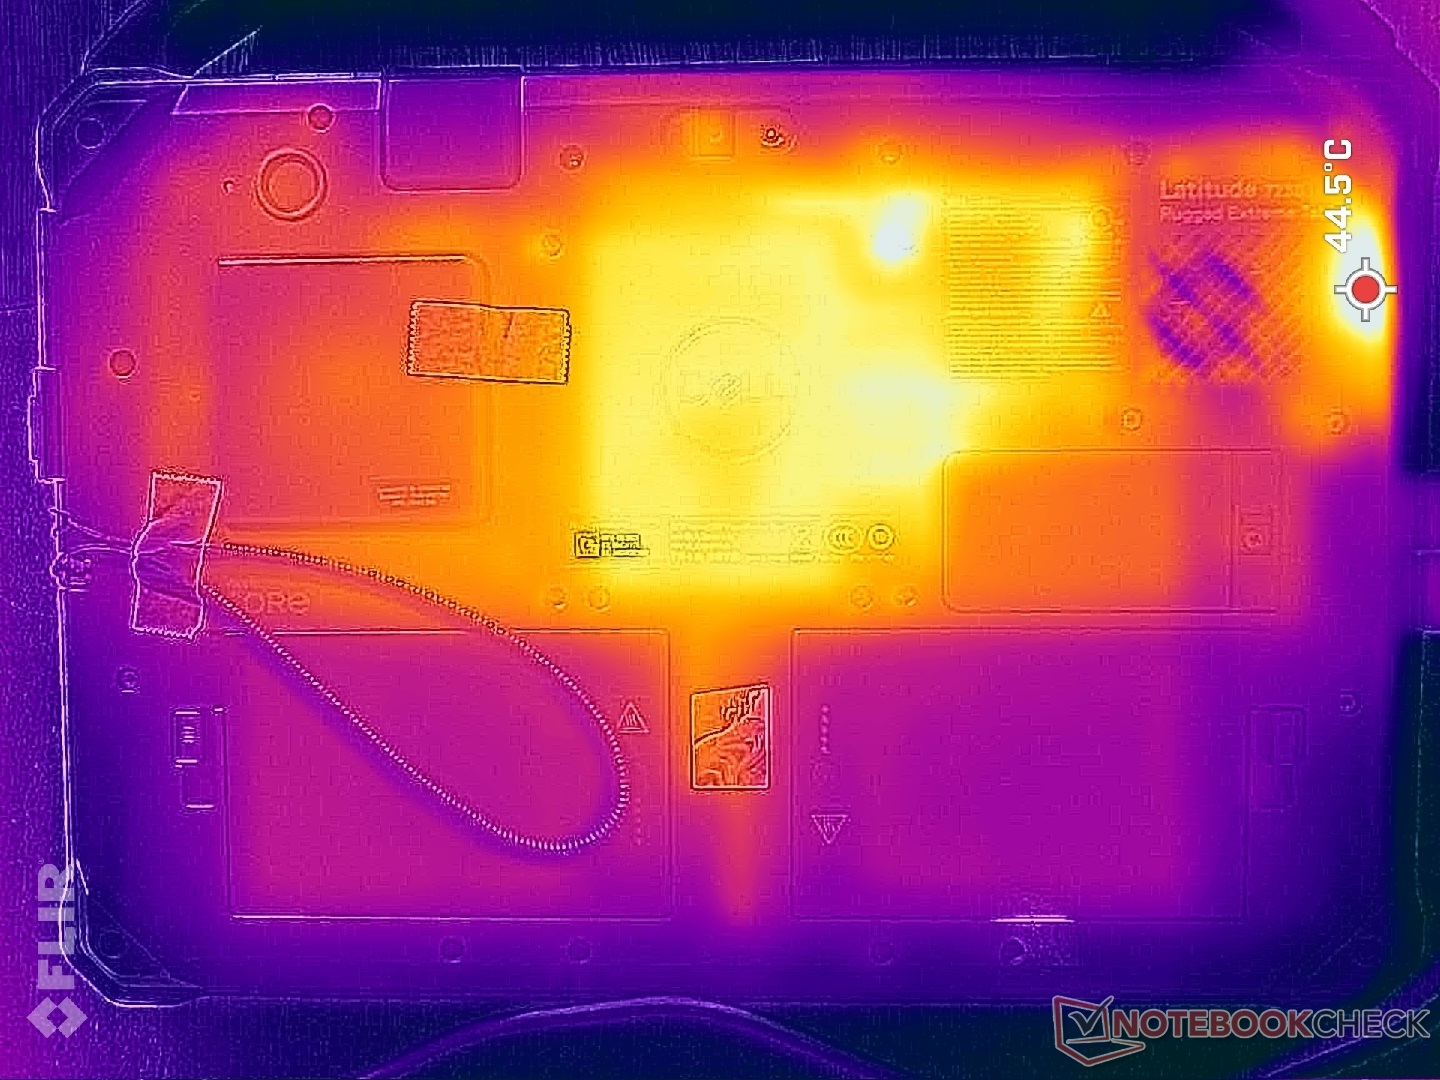
Temperature
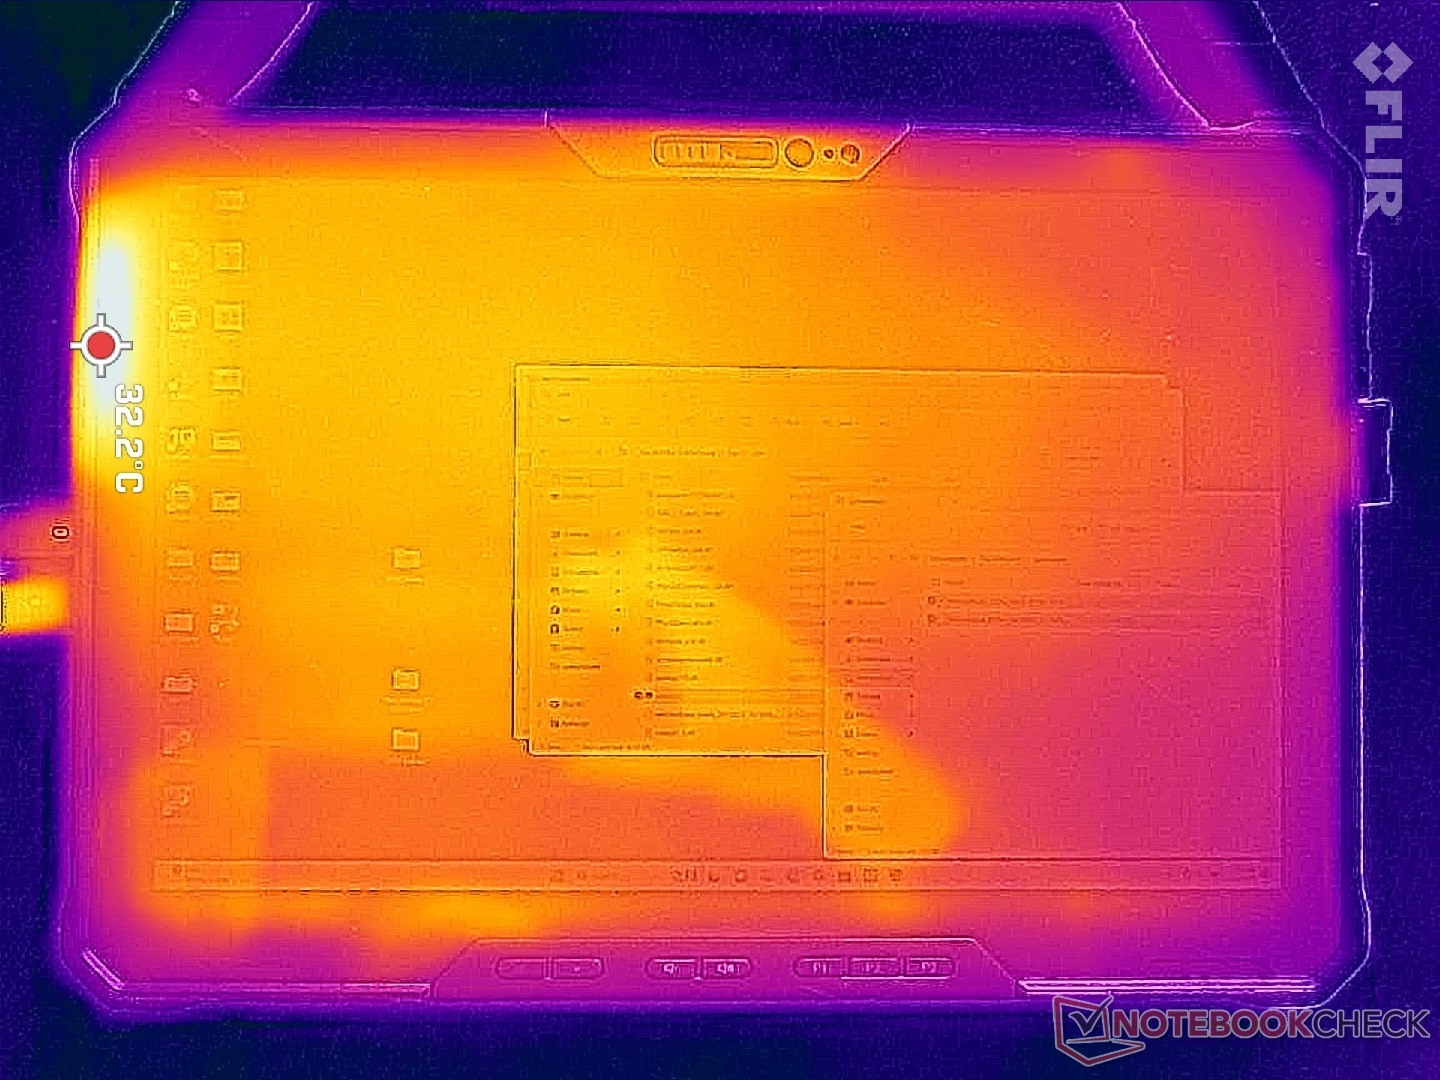
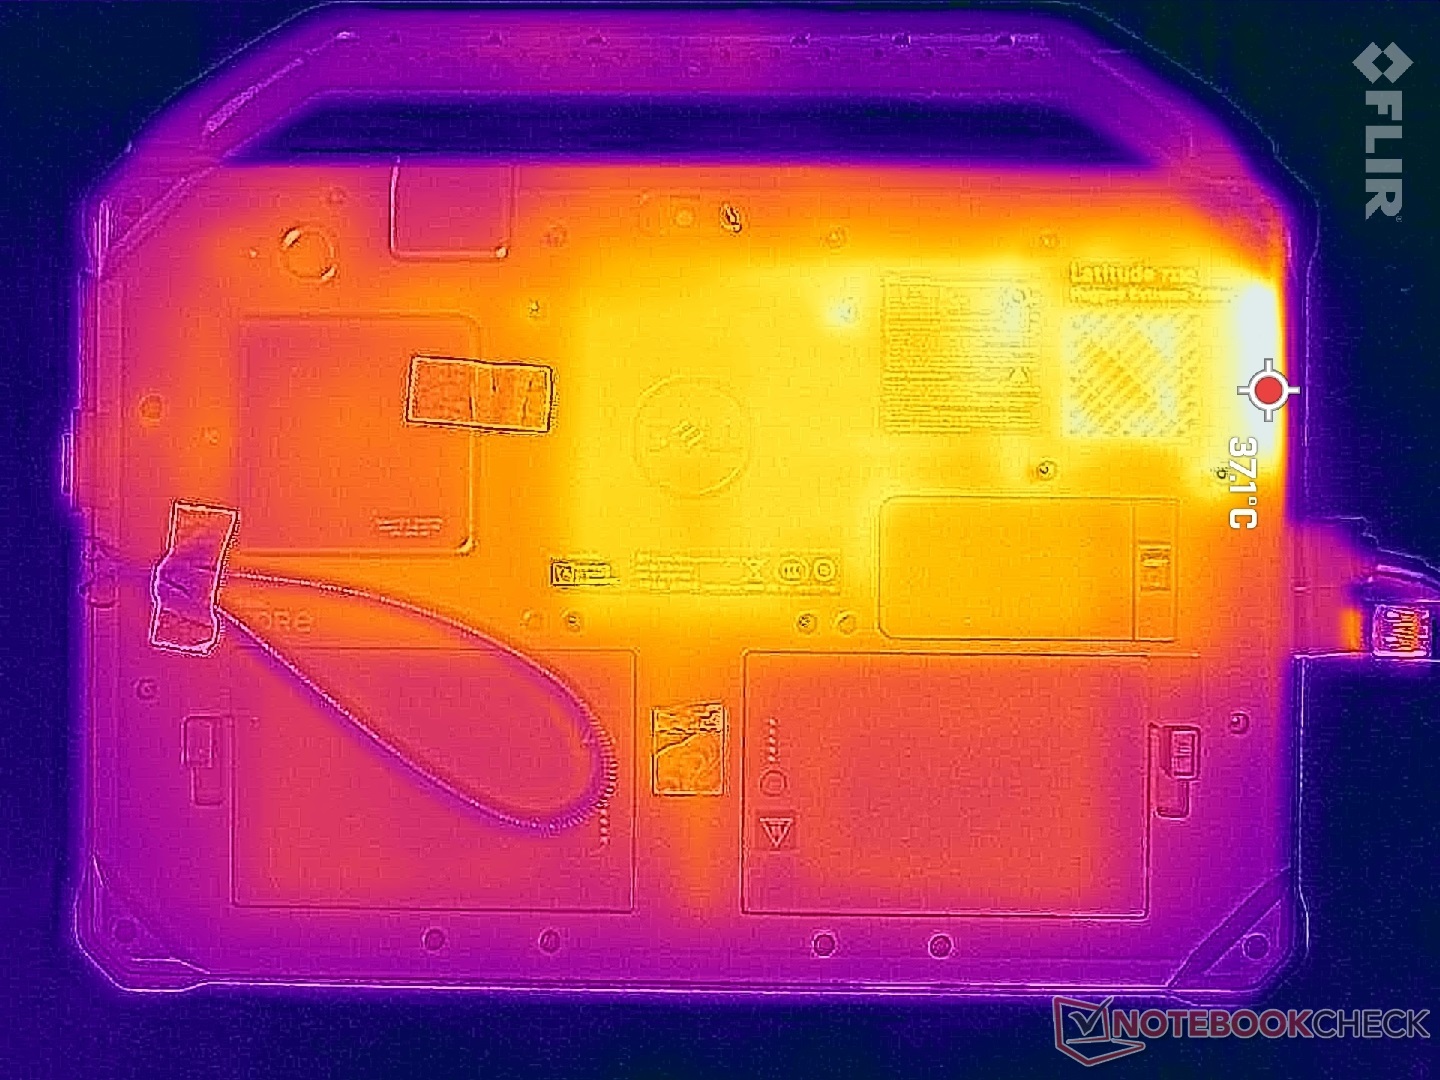
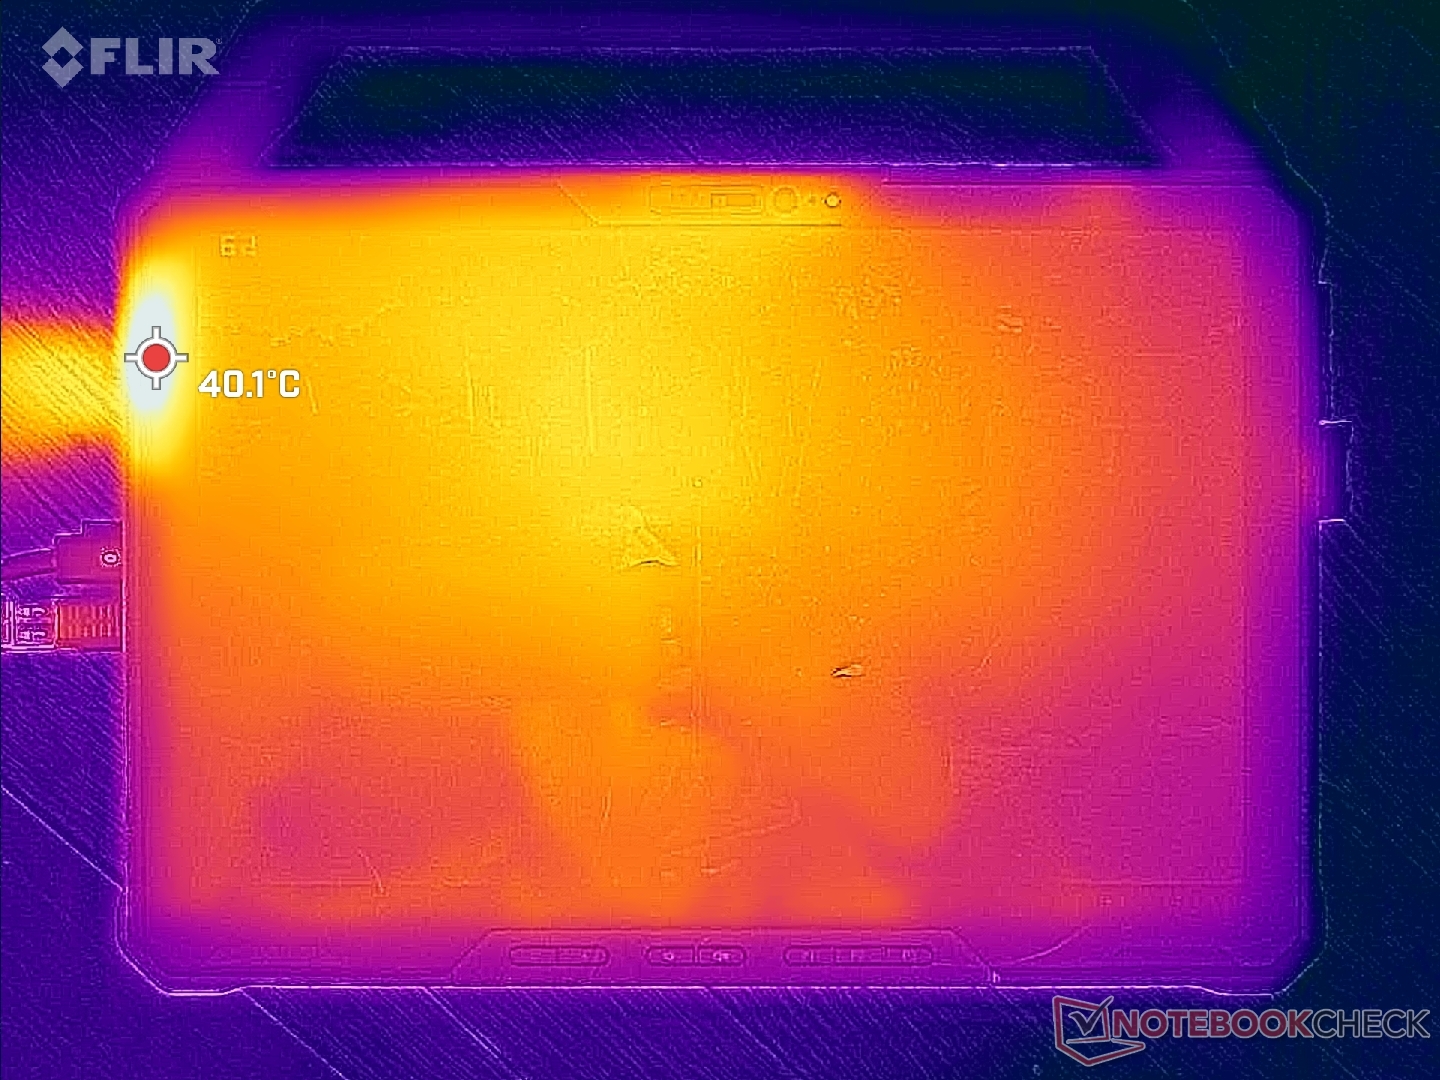
Surface temperatures are not an issue because of the thick rugged profile much like on most other rugged devices. At worst, we're able to record a high of 40 C along the very edge of the unit nearest the ventilation grilles when the CPU is at 100 percent utilization.
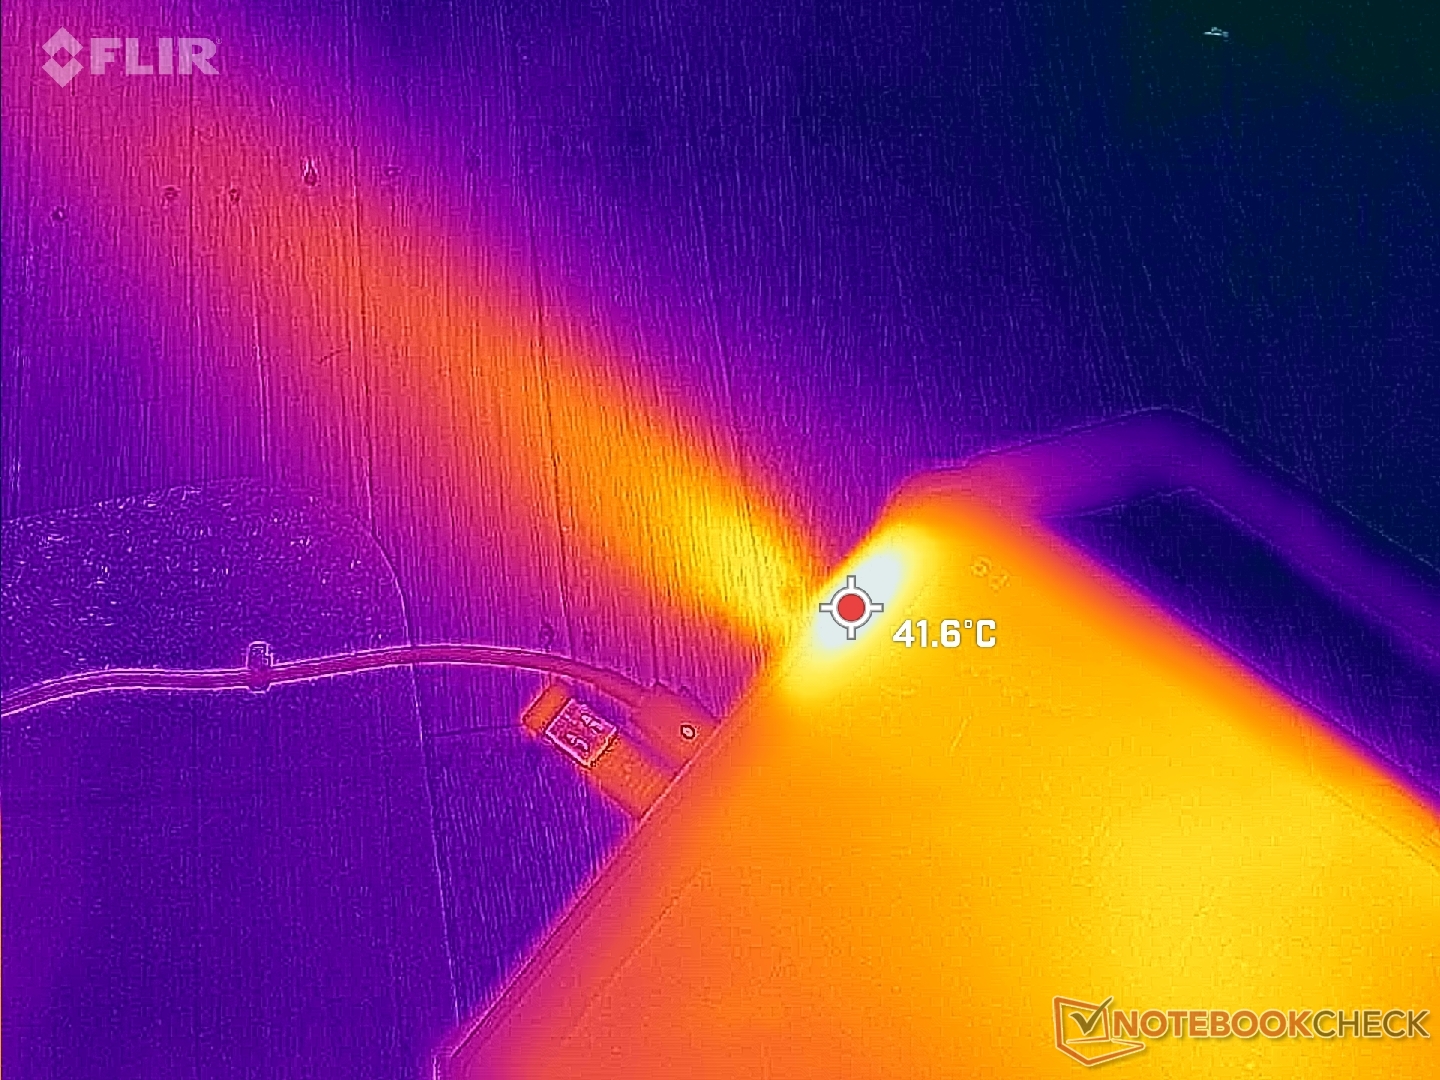
(+) The maximum temperature on the upper side is 32.6 °C / 91 F, compared to the average of 33.7 °C / 93 F, ranging from 20.7 to 53.2 °C for the class Tablet.
(±) The bottom heats up to a maximum of 40.2 °C / 104 F, compared to the average of 33.2 °C / 92 F
(+) In idle usage, the average temperature for the upper side is 29 °C / 84 F, compared to the device average of 30 °C / 86 F.
| Dell Latitude 7230 Rugged Extreme Intel Core i5-1240U, Intel Iris Xe Graphics G7 80EUs | Dell Latitude 7330 Rugged Extreme Intel Core i7-1185G7, Intel Iris Xe Graphics G7 96EUs | Panasonic Toughbook 40 Intel Core i7-1185G7, Intel Iris Xe Graphics G7 96EUs | Getac B360 Intel Core i7-10710U, Intel UHD Graphics 620 | Acer Enduro Urban N3 EUN314 Intel Core i7-1165G7, Intel Iris Xe Graphics G7 96EUs | Durabook S14I Intel Core i7-1165G7, Intel Iris Xe Graphics G7 96EUs | |
|---|---|---|---|---|---|---|
| Heat | 13% | 4% | 10% | -1% | -3% | |
| Maximum Upper Side * (°C) | 32.6 | 34.6 -6% | 35.6 -9% | 33.4 -2% | 37.8 -16% | 36.4 -12% |
| Maximum Bottom * (°C) | 40.2 | 36.6 9% | 40 -0% | 42.6 -6% | 45.8 -14% | 38.6 4% |
| Idle Upper Side * (°C) | 30.6 | 24.8 19% | 28.6 7% | 24.2 21% | 26.4 14% | 32.6 -7% |
| Idle Bottom * (°C) | 35 | 25.2 28% | 29.4 16% | 26.2 25% | 30.2 14% | 33.8 3% |
* ... smaller is better
Stress Test
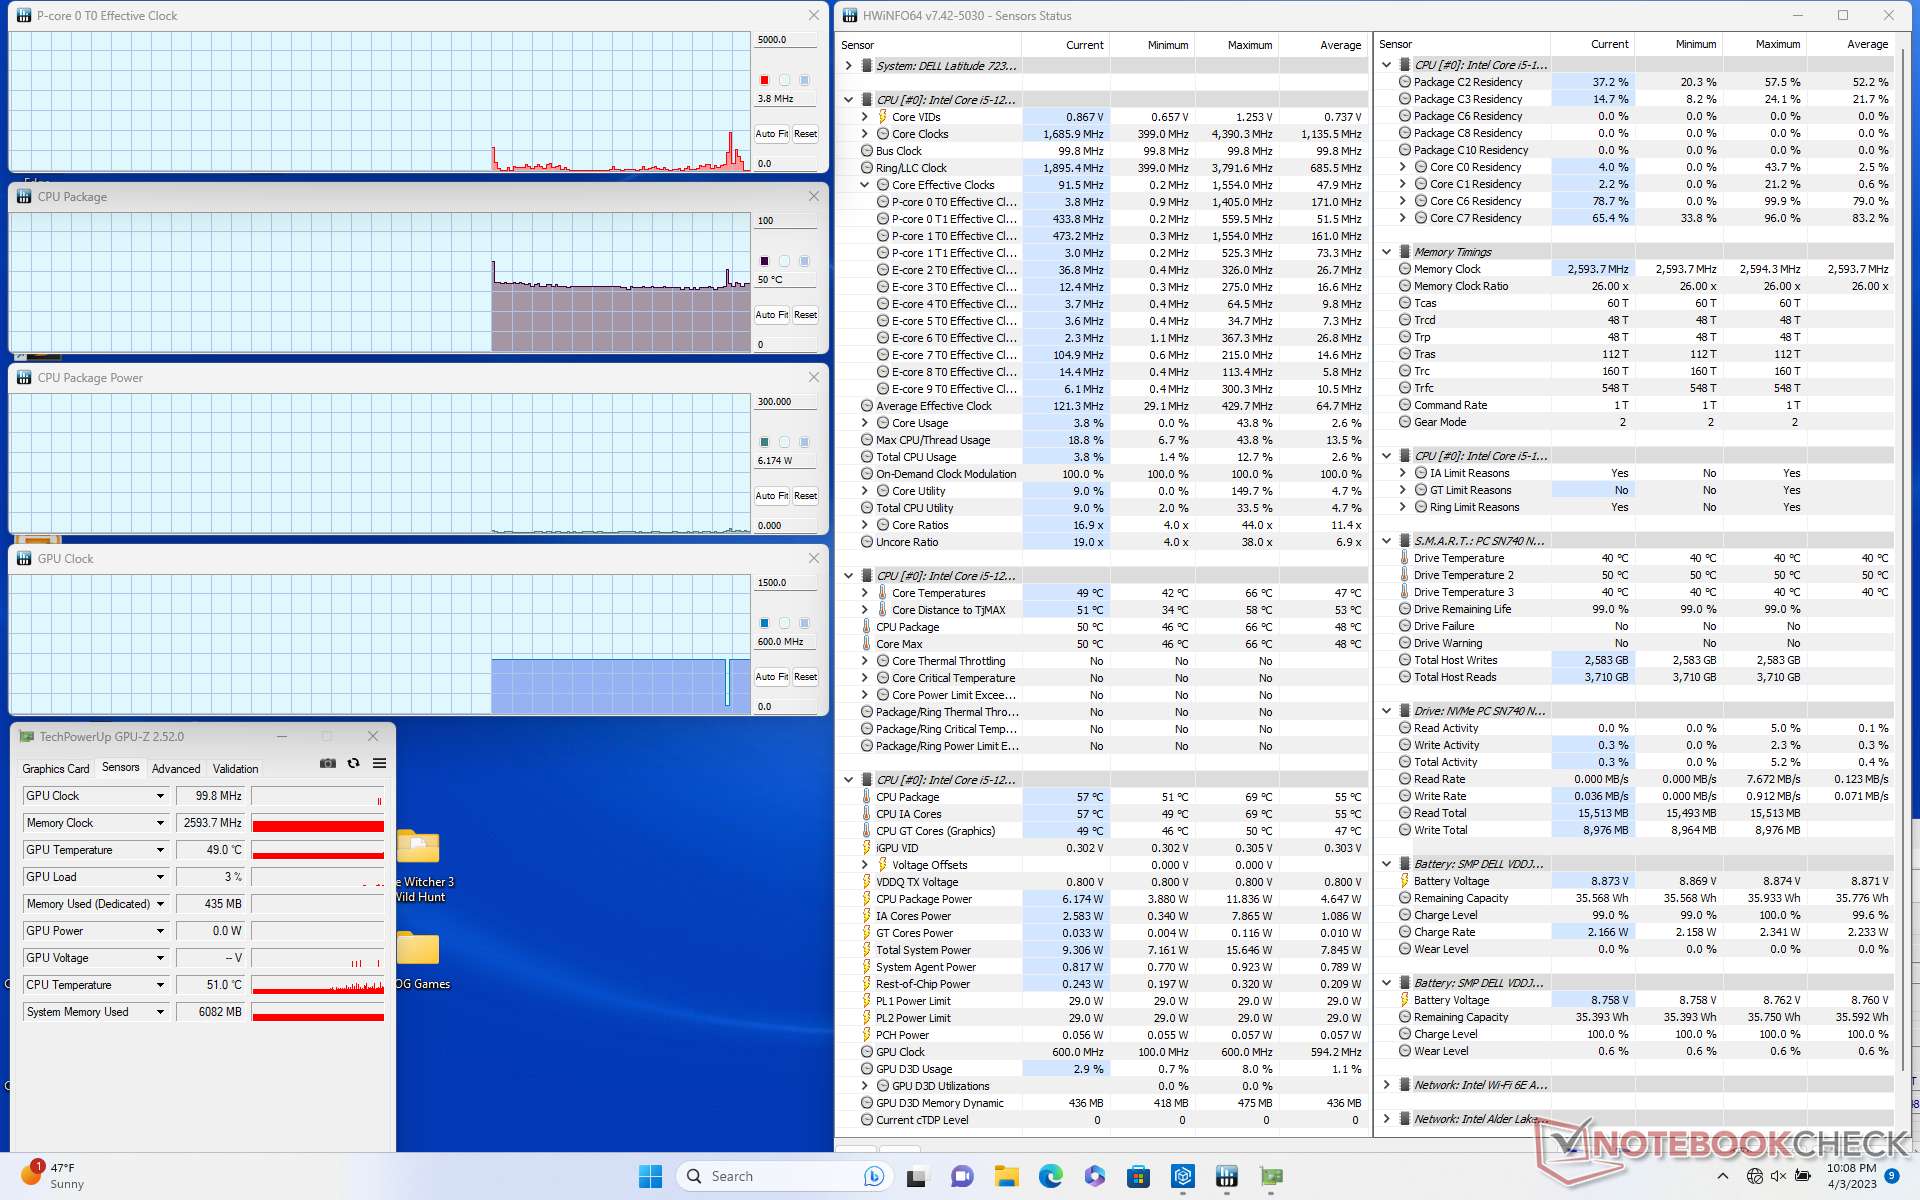
When running Prime95 to stress the CPU, clock rates and board power draw would boost to 2.6 GHz and 30 W, respectively, before falling slightly to 2.5 GHz and 26 W a few seconds later. Core temperature would stabilize at a very high 97 C which is warmer than we would like. Repeating this test on the larger Dell Latitude 7330 Rugged would result in a much cooler core temperature of just 68 C.
Running on battery power impacts CPU performance slightly. A 3DMark 11 test on batteries would return Physics and Graphics scores of 10743 and 4041 points, respectively, compared to 12765 and 4053 points when on mains.
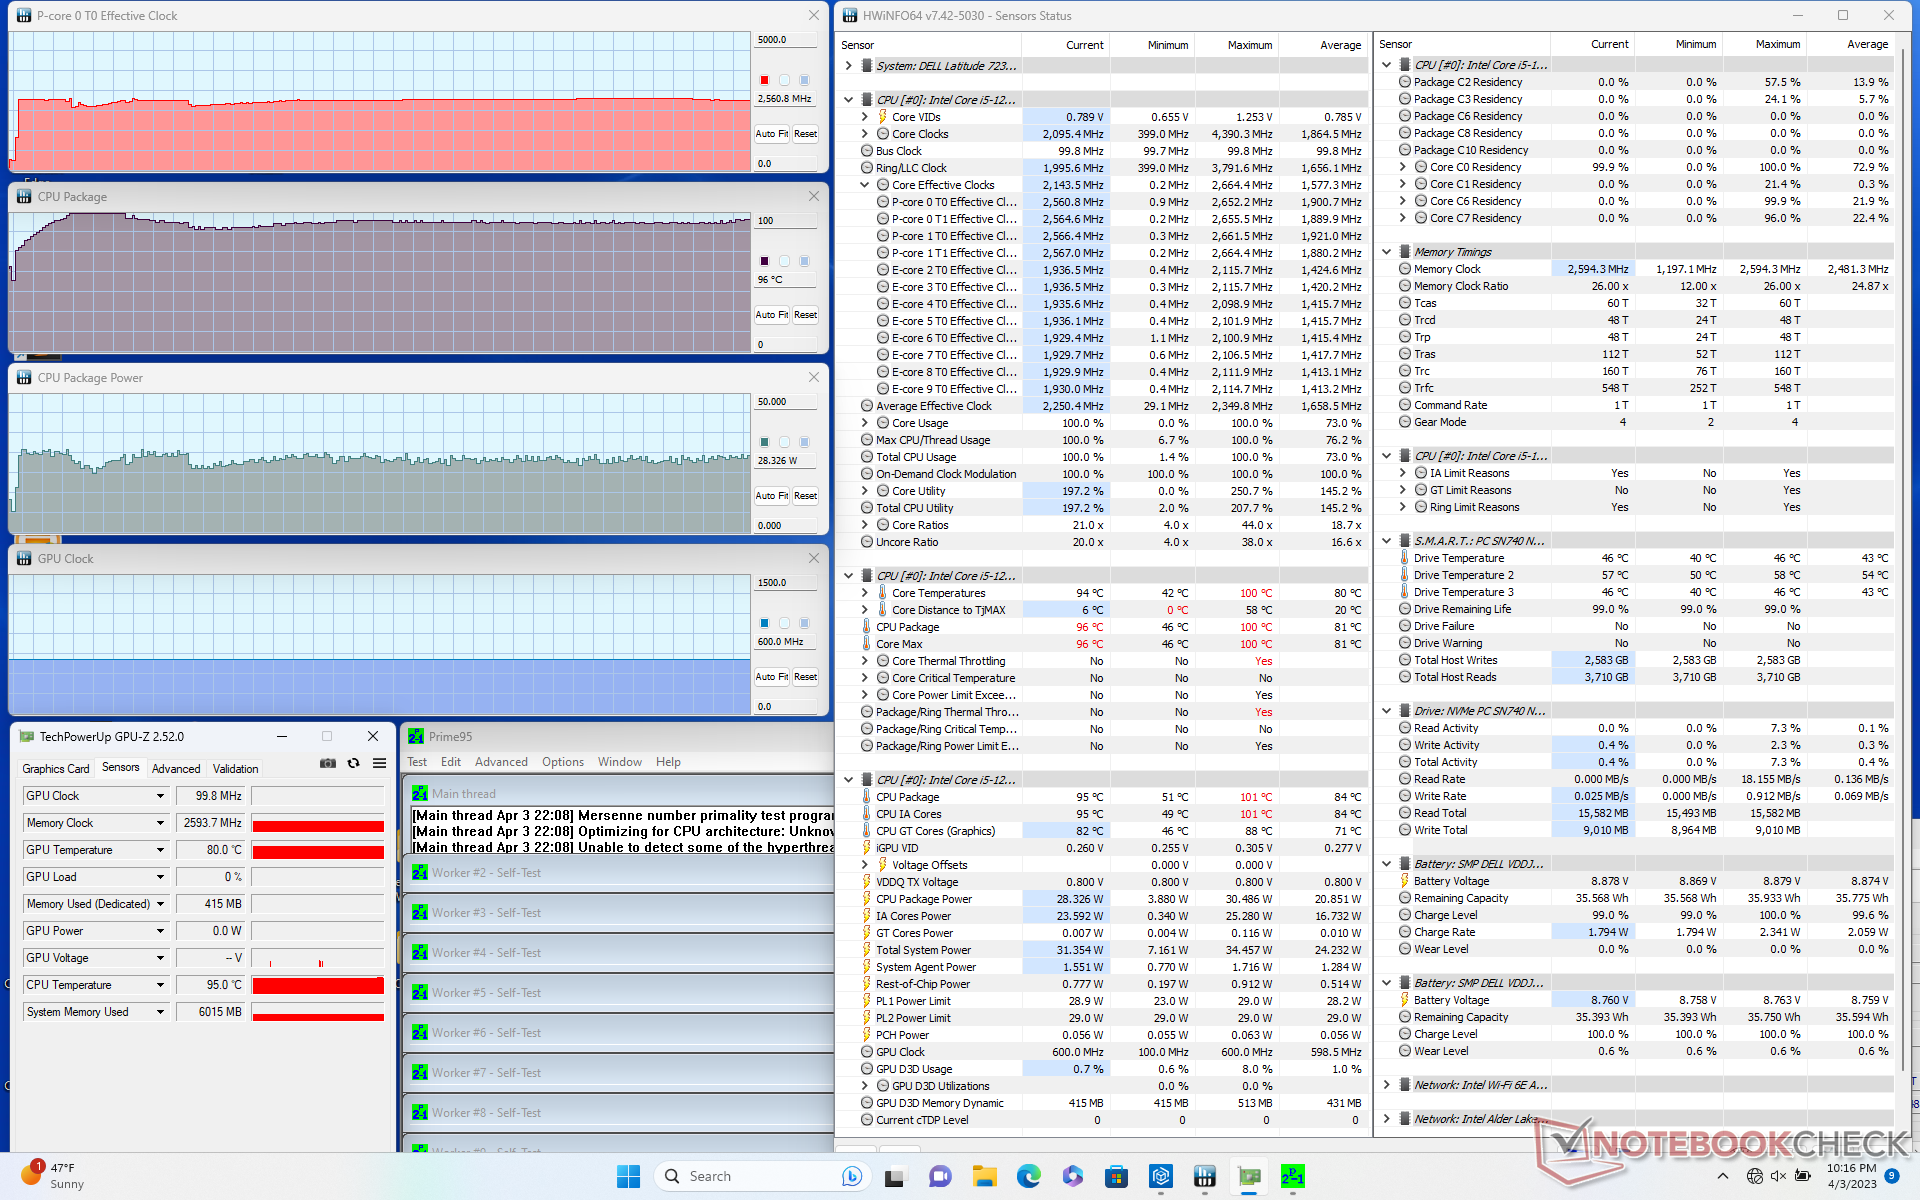
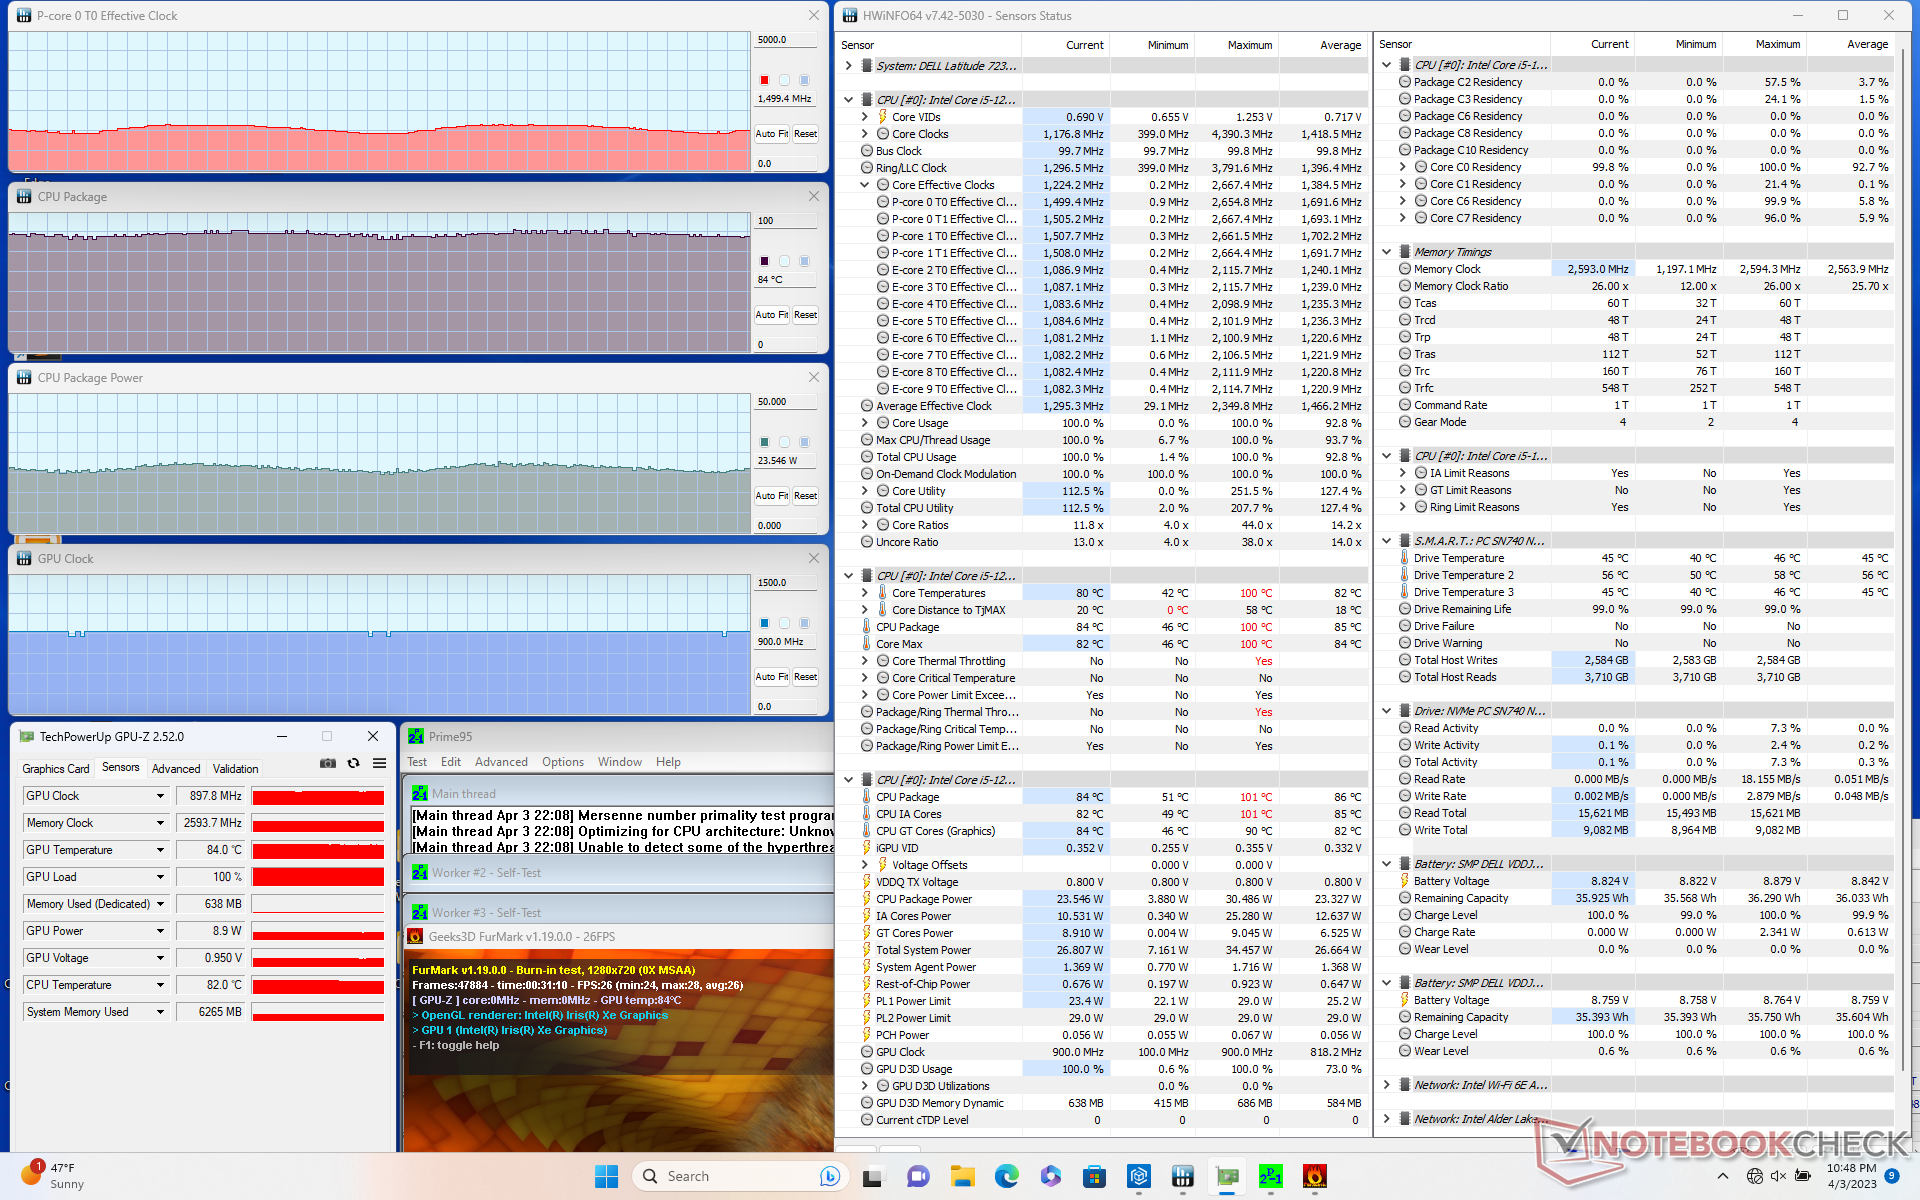
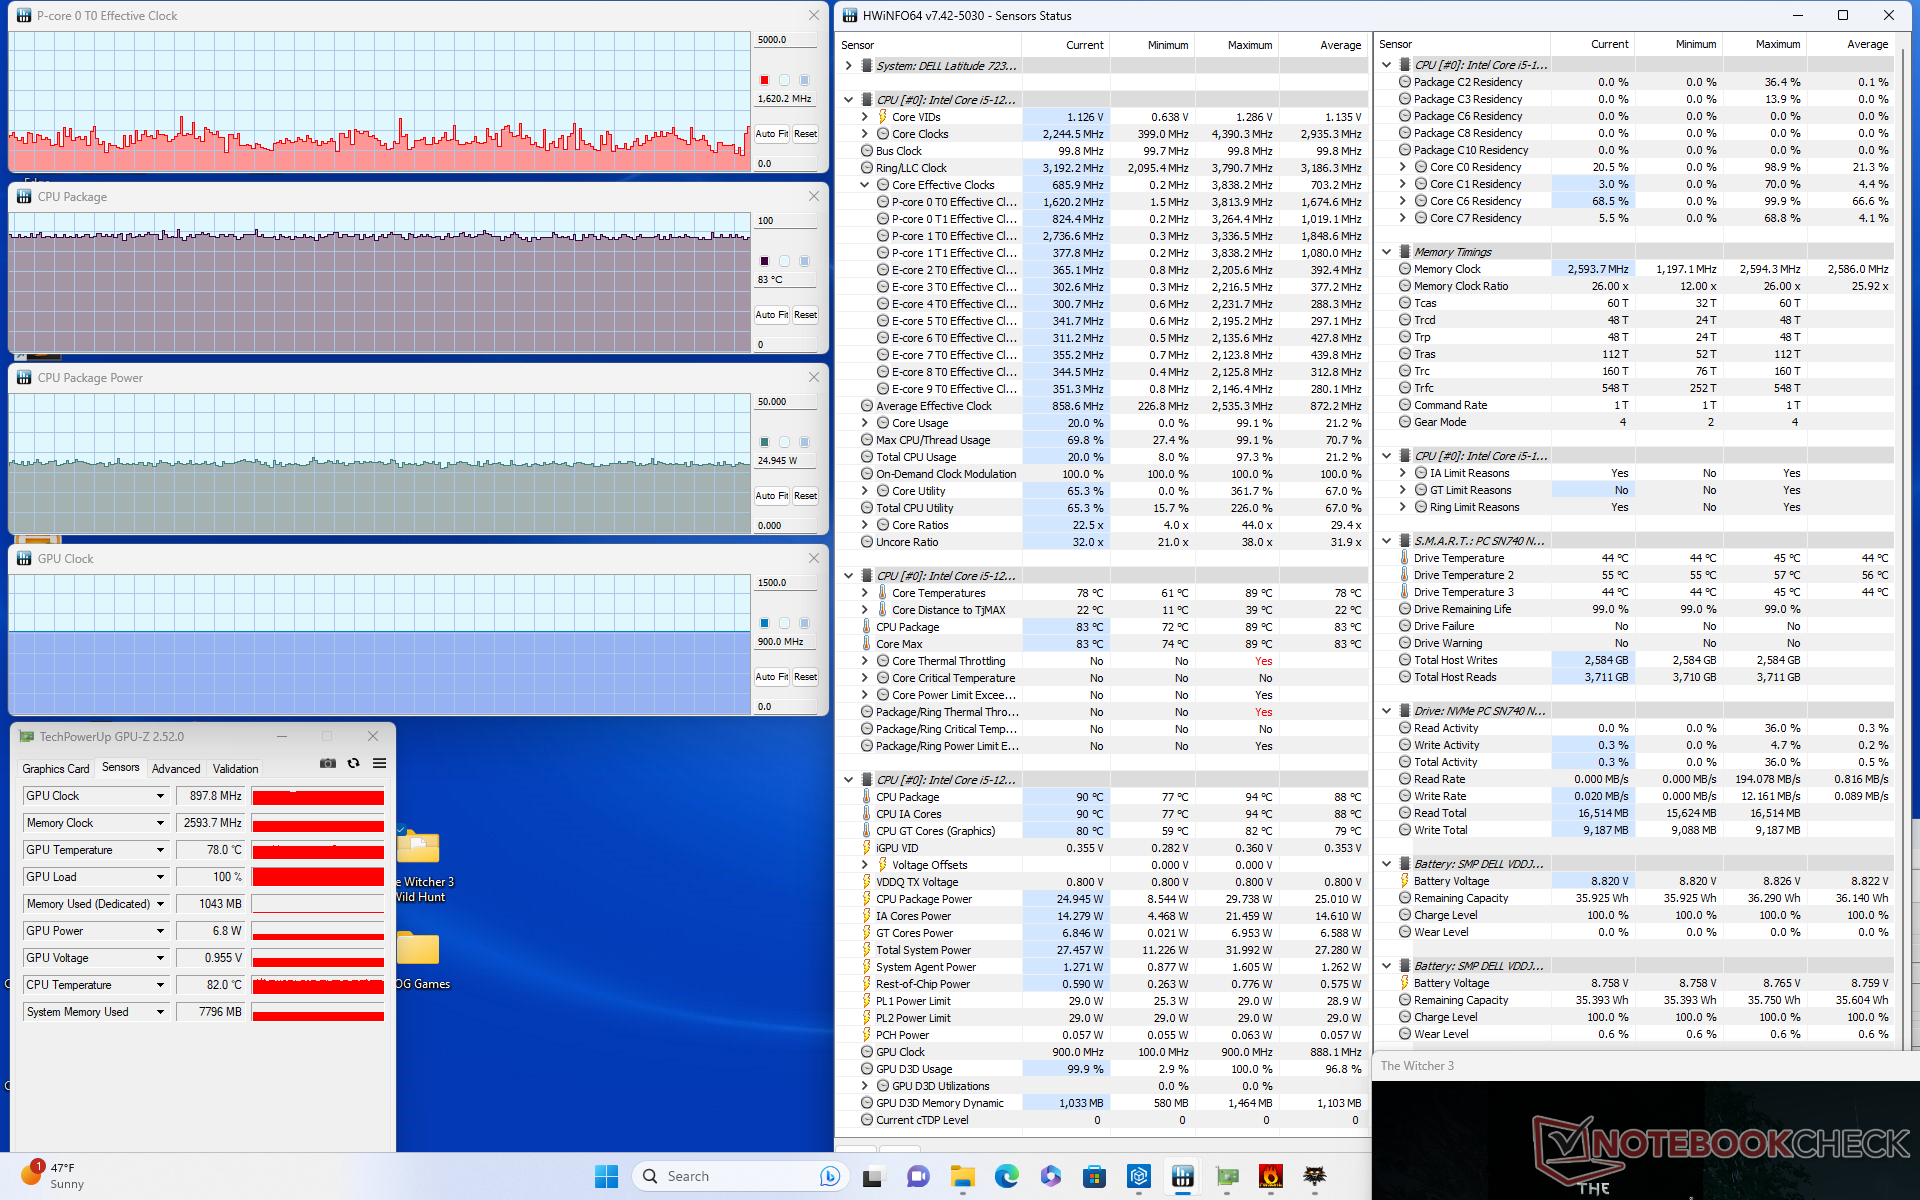

| CPU Clock (GHz) | GPU Clock (MHz) | Average CPU Temperature (°C) | |
| System Idle | -- | -- | 50 |
| Prime95 Stress | 2.6 | -- | 96 |
| Prime95 + FurMark Stress | 1.4 - 1.6 | 898 | 84 |
| Witcher 3 Stress (Ultra mode) | ~3.0 | 898 | 85 |
| Witcher 3 Stress (Optimized mode) | ~1.7 | 898 | 83 |
Speakers
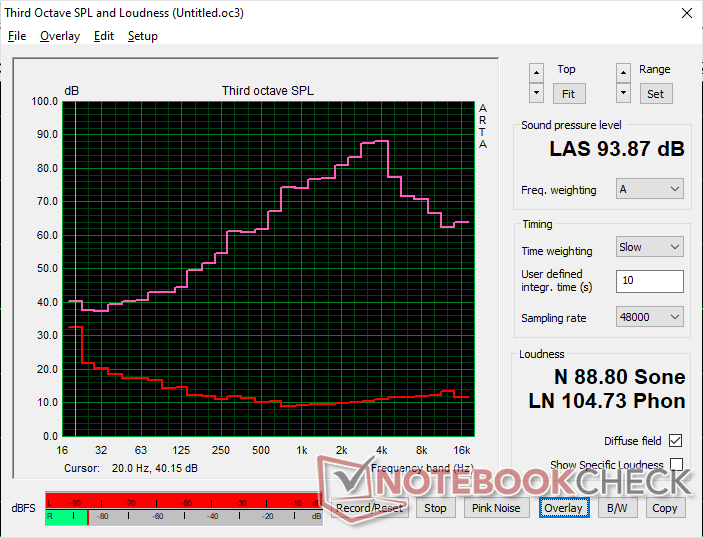
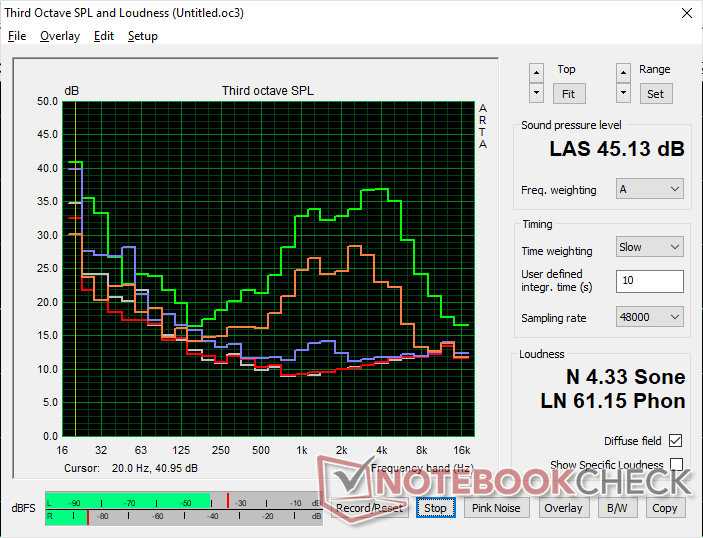
Dell Latitude 7230 Rugged Extreme audio analysis
(+) | speakers can play relatively loud (93.9 dB)
Bass 100 - 315 Hz
(-) | nearly no bass - on average 19.9% lower than median
(+) | bass is linear (5.2% delta to prev. frequency)
Mids 400 - 2000 Hz
(±) | higher mids - on average 6.5% higher than median
(+) | mids are linear (4.5% delta to prev. frequency)
Highs 2 - 16 kHz
(±) | higher highs - on average 8.4% higher than median
(±) | linearity of highs is average (7% delta to prev. frequency)
Overall 100 - 16.000 Hz
(±) | linearity of overall sound is average (19.4% difference to median)
Compared to same class
» 54% of all tested devices in this class were better, 7% similar, 39% worse
» The best had a delta of 7%, average was 20%, worst was 129%
Compared to all devices tested
» 48% of all tested devices were better, 7% similar, 45% worse
» The best had a delta of 4%, average was 23%, worst was 134%
Apple MacBook Pro 16 2021 M1 Pro audio analysis
(+) | speakers can play relatively loud (84.7 dB)
Bass 100 - 315 Hz
(+) | good bass - only 3.8% away from median
(+) | bass is linear (5.2% delta to prev. frequency)
Mids 400 - 2000 Hz
(+) | balanced mids - only 1.3% away from median
(+) | mids are linear (2.1% delta to prev. frequency)
Highs 2 - 16 kHz
(+) | balanced highs - only 1.9% away from median
(+) | highs are linear (2.7% delta to prev. frequency)
Overall 100 - 16.000 Hz
(+) | overall sound is linear (4.6% difference to median)
Compared to same class
» 0% of all tested devices in this class were better, 0% similar, 100% worse
» The best had a delta of 5%, average was 17%, worst was 45%
Compared to all devices tested
» 0% of all tested devices were better, 0% similar, 100% worse
» The best had a delta of 4%, average was 23%, worst was 134%
Energy Management
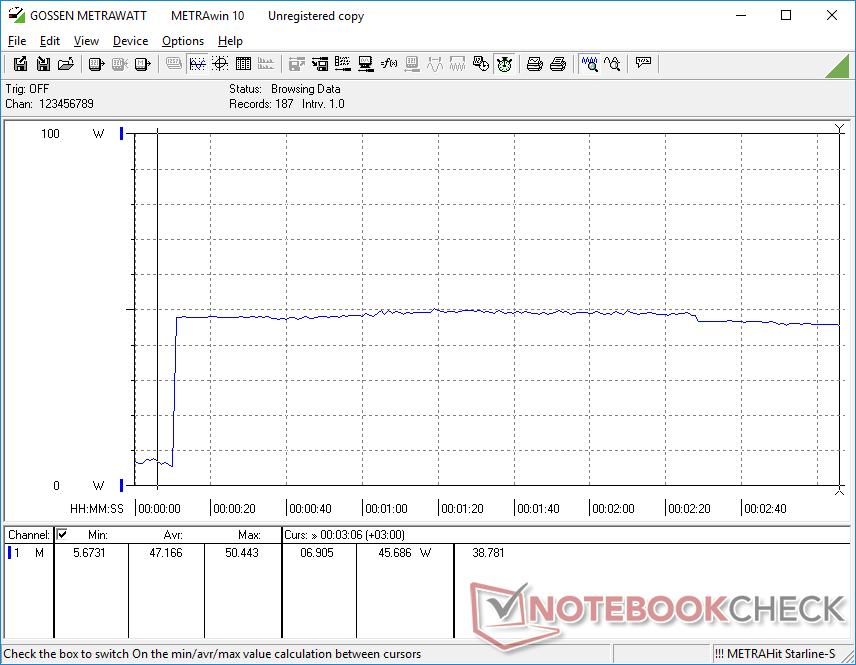
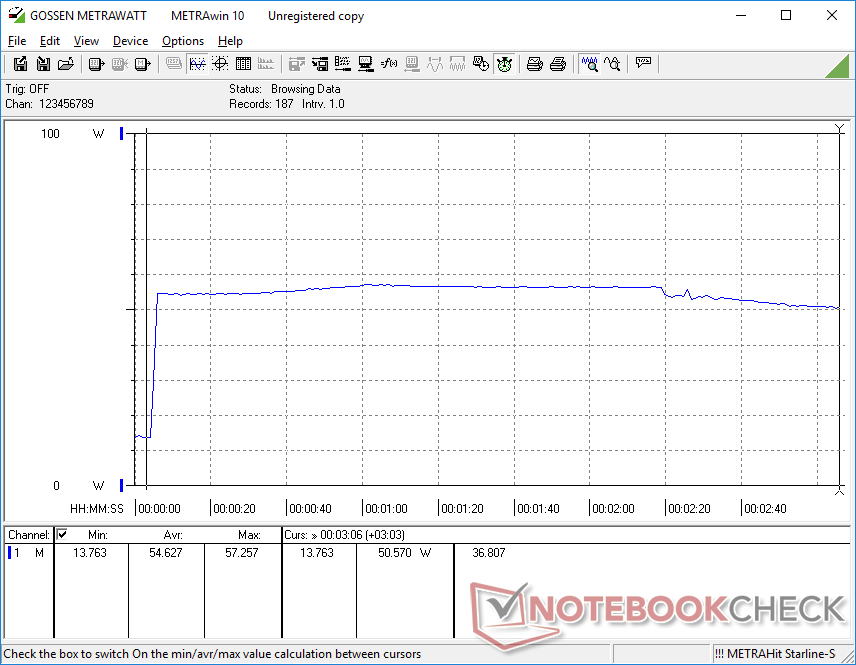
Power Consumption
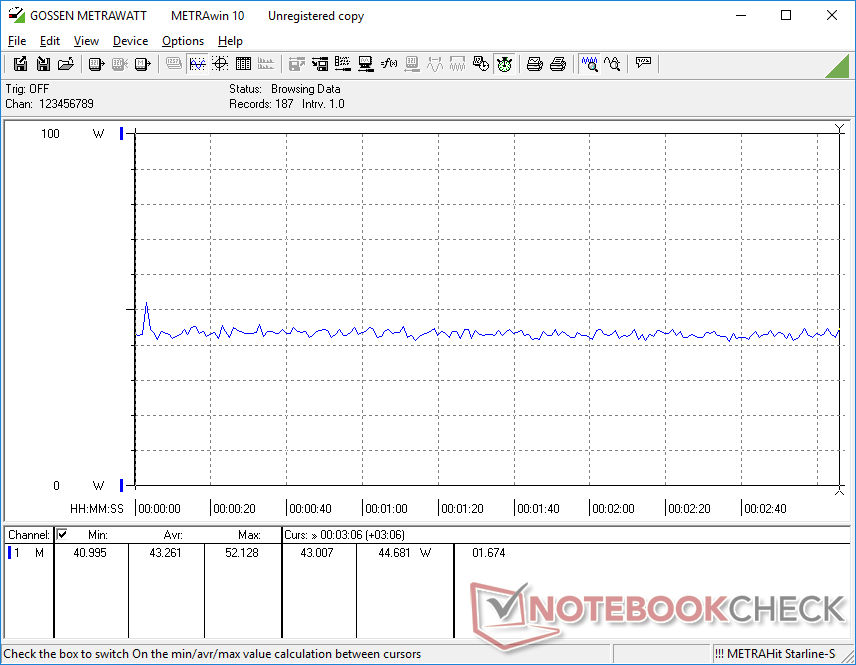
Power consumption is mostly similar to other rugged devices running on older 11th gen CPUs like the Dell Latitude 7330 Rugged Extreme or Panasonic Toughbook 40. Performance-per-watt, however, can be very different. More specifically, our Latitude 7230 Rugged can offer 40 to 50 percent faster processor performance than the Core i7-1185G7 in the Dell Latitude 7330 Rugged without needing to consume more power. On the other hand, GPU performance is 30 to 40 percent slower.
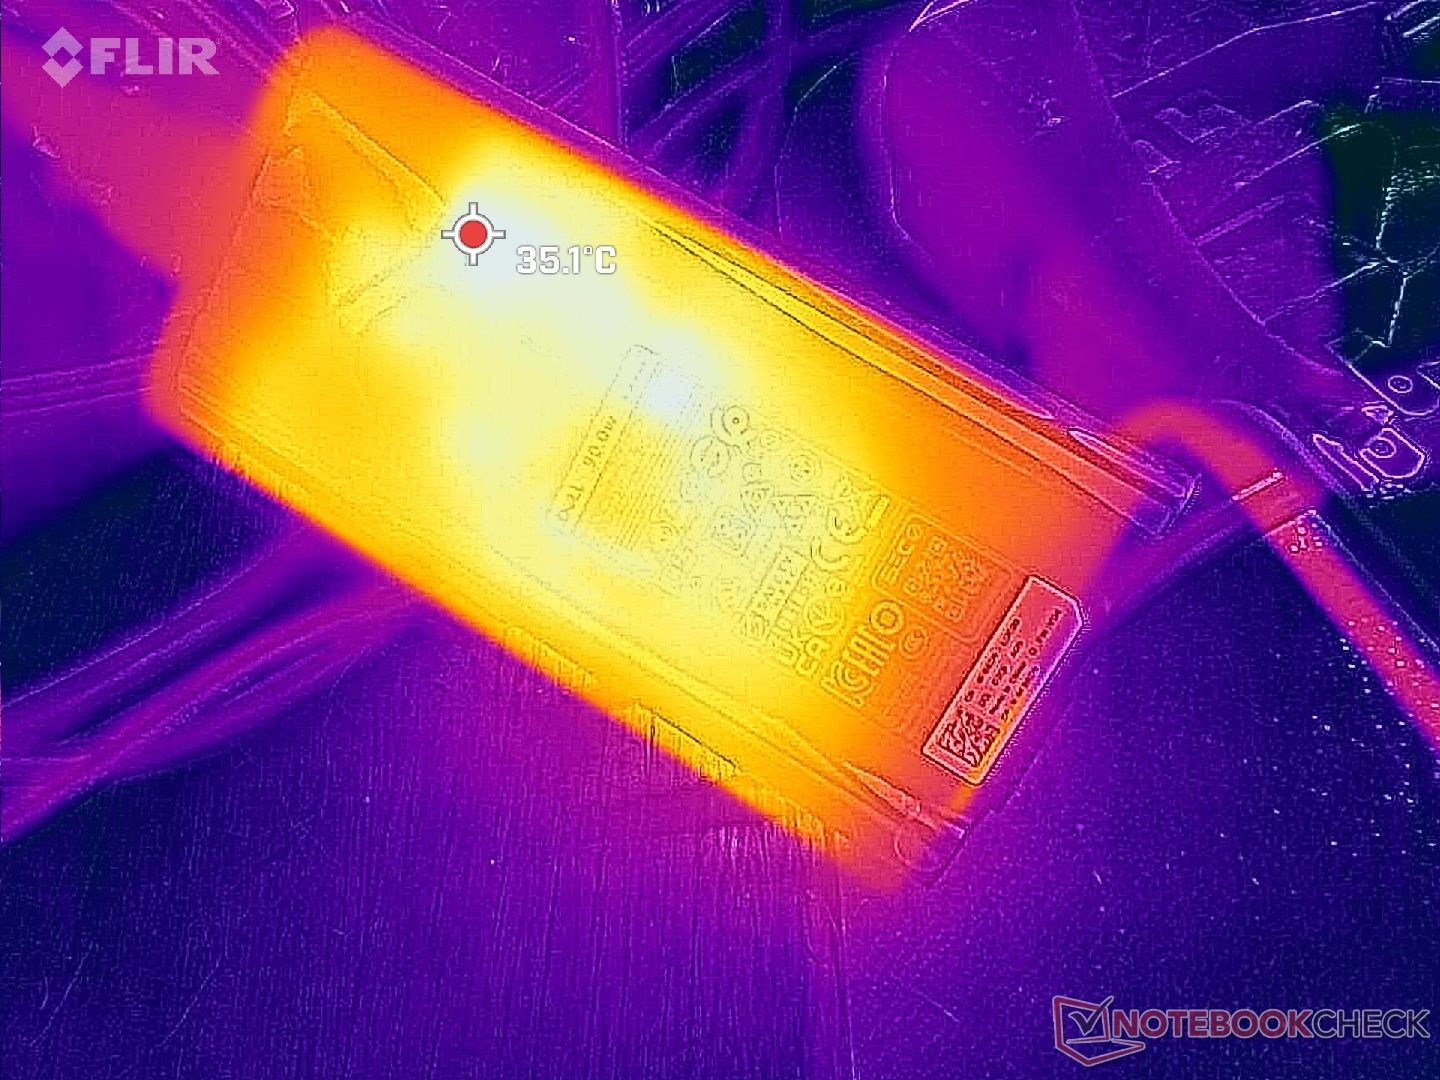
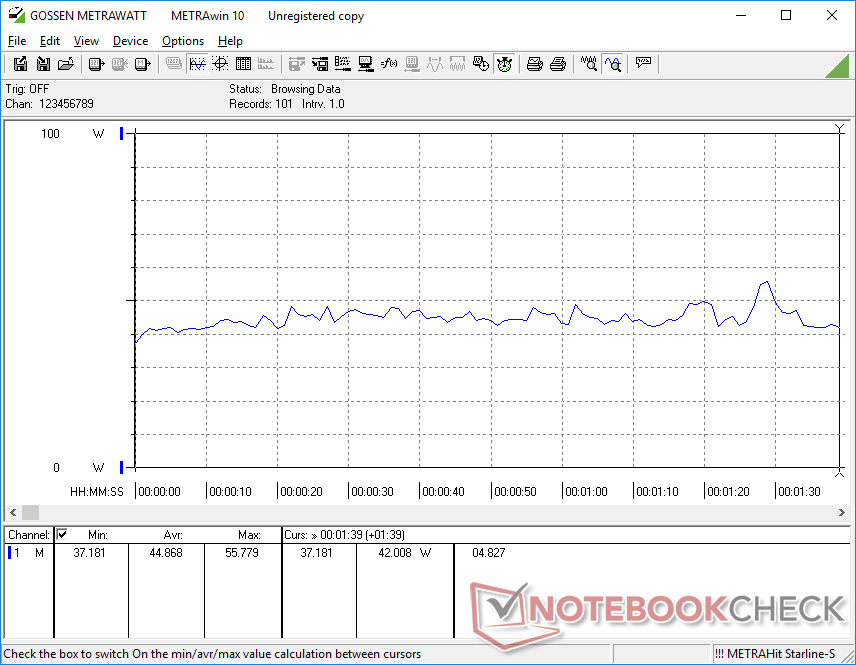
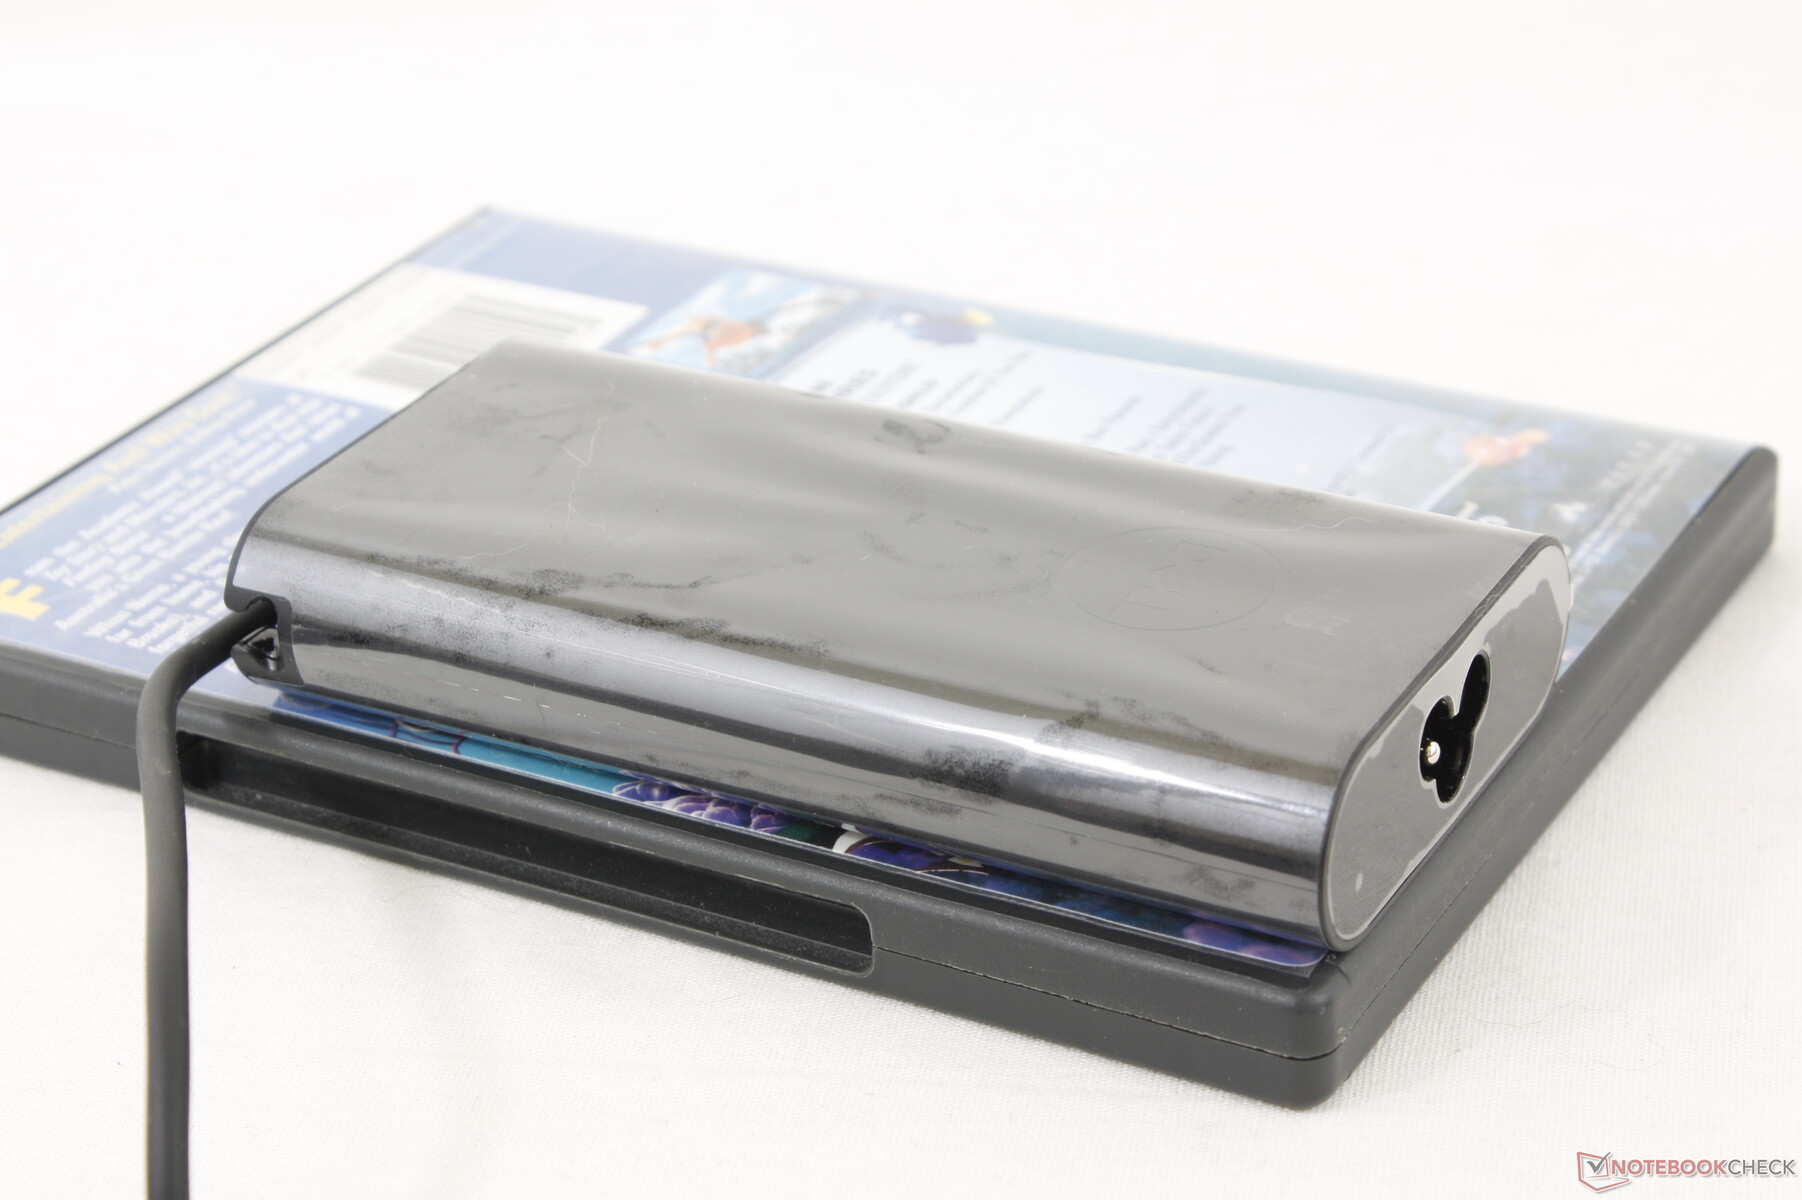
We're able to record a maximum draw of 55 W from the small-medium (~13 x 6.5 x 2.3 cm) 90 W USB-C AC adapter. This maximum reading is relatively low when compared to many Core i7 alternatives since our Core i5 has a lower Turbo Boost limit. Note that the model comes with the same AC adapter as found on certain XPS laptops.
| Off / Standby | |
| Idle | |
| Load |
|
Key:
min: | |
| Dell Latitude 7230 Rugged Extreme i5-1240U, Iris Xe G7 80EUs, WD PC SN740 512GB SDDPMQD-512G-1101, IPS, 1920x1200, 12" | Dell Latitude 7330 Rugged Extreme i7-1185G7, Iris Xe G7 96EUs, , IPS, 1920x1080, 13.3" | Panasonic Toughbook 40 i7-1185G7, Iris Xe G7 96EUs, Samsung PM991 MZVLQ1T0HALB, IPS, 1920x1080, 14" | Getac B360 i7-10710U, UHD Graphics 620, Lite-On CA5-8D512, IPS, 1920x1080, 13.3" | Acer Enduro Urban N3 EUN314 i7-1165G7, Iris Xe G7 96EUs, Samsung PM991 MZVLQ1T0HALB, IPS, 1920x1080, 14" | Durabook S14I i7-1165G7, Iris Xe G7 96EUs, UDinfo M2P M2P80DE512GBAEP, TN, 1920x1080, 14" | |
|---|---|---|---|---|---|---|
| Power Consumption | -9% | -15% | -5% | 25% | -25% | |
| Idle Minimum * (Watt) | 6.5 | 4.1 37% | 4.9 25% | 5.4 17% | 3.8 42% | 6.8 -5% |
| Idle Average * (Watt) | 8.9 | 11.7 -31% | 12.3 -38% | 12.2 -37% | 8 10% | 16.4 -84% |
| Idle Maximum * (Watt) | 14.3 | 11.8 17% | 14 2% | 12.6 12% | 8.7 39% | 16.9 -18% |
| Load Average * (Watt) | 44.9 | 48.5 -8% | 54 -20% | 39.1 13% | 34.6 23% | 39.2 13% |
| Witcher 3 ultra * (Watt) | 43.2 | 44.3 -3% | 46.3 -7% | 36.5 16% | 35.4 18% | |
| Load Maximum * (Watt) | 54.8 | 91 -66% | 83.6 -53% | 81.8 -49% | 45.4 17% | 73.1 -33% |
* ... smaller is better
Power Consumption Witcher 3 / Stresstest
Power Consumption external Monitor
Battery Life — 3.5 Hours Under Extreme Use
Up to two removable batteries are supported. WLAN runtime is almost 13 hours when both batteries (36 Wh x2) are installed. On the other hand, running demanding loads on the maximum brightness level should last for about 3.5 hours.
Charging both batteries from empty to full is unfortunately quite slow at 4 to 5 hours compared to 1.5 to 2 hours on most Ultrabooks.
| Dell Latitude 7230 Rugged Extreme i5-1240U, Iris Xe G7 80EUs, 72 Wh | Dell Latitude 7330 Rugged Extreme i7-1185G7, Iris Xe G7 96EUs, 107 Wh | Panasonic Toughbook 40 i7-1185G7, Iris Xe G7 96EUs, 136 Wh | Getac B360 i7-10710U, UHD Graphics 620, 46 Wh | Acer Enduro Urban N3 EUN314 i7-1165G7, Iris Xe G7 96EUs, 50.3 Wh | Durabook S14I i7-1165G7, Iris Xe G7 96EUs, 50 Wh | |
|---|---|---|---|---|---|---|
| Battery runtime | 38% | 46% | -38% | -51% | -58% | |
| WiFi v1.3 (h) | 13 | 18 38% | 19 46% | 8.1 -38% | 6.4 -51% | 5.5 -58% |
| Load (h) | 3.6 |
Pros
Cons
Verdict — Mostly A Home Run
The distinguishing features of the Latitude 7230 Rugged Extreme are its full sRGB coverage, fast CPU performance, and low weight relative to other rugged tablets. Most alternatives have poorer colors and thicker bezels in comparison.
We would like to see improvements to the port covers and front buttons which are too slippery and small, respectively. These become even harder to handle if you happen to be wearing gloves.
The excellent battery life, super bright display, and full sRGB coverage of the Latitude 7230 Rugged Extreme set the standard for future rugged tablets.
Potential buyers will want to keep in mind that the less expensive Core i5-1240U performs similarly to the Core i7-1260U when it comes to CPU performance. Thus, users should only select the latter if the faster graphics performance is needed. Expect fan noise to be louder than usual if you plan on running more demanding tasks on the model.
Price and Availability
Dell is now shipping the Latitude 7230 Rugged Extreme starting at $2700 USD for the base configuration to over $5000 if fully configured. Our review unit retails for around $3200.
Dell Latitude 7230 Rugged Extreme
- 04/07/2023 v7 (old)
Allen Ngo
Transparency
The selection of devices to be reviewed is made by our editorial team. The test sample was provided to the author as a loan by the manufacturer or retailer for the purpose of this review. The lender had no influence on this review, nor did the manufacturer receive a copy of this review before publication. There was no obligation to publish this review. As an independent media company, Notebookcheck is not subjected to the authority of manufacturers, retailers or publishers.
This is how Notebookcheck is testing
Every year, Notebookcheck independently reviews hundreds of laptops and smartphones using standardized procedures to ensure that all results are comparable. We have continuously developed our test methods for around 20 years and set industry standards in the process. In our test labs, high-quality measuring equipment is utilized by experienced technicians and editors. These tests involve a multi-stage validation process. Our complex rating system is based on hundreds of well-founded measurements and benchmarks, which maintains objectivity. Further information on our test methods can be found here.
Price comparison
